Article

Correlation between Destructive and Non-Destructive Measurements of Highbush Blueberry (Vaccinium corymbosum L.) Fruit during Maturation

1
Biotechnical Faculty, Department of Agronomy, Chair for Fruit Growing, Viticulture and Vegetable Growing, University of Ljubljana, Jamnikarjeva 101, SI-1000 Ljubljana, Slovenia
2
Biotechnical Faculty, Department of Agronomy, Chair of Genetics, Biotechnology, Statistics and Plant Breeding, University of Ljubljana, Jamnikarjeva 101, SI-1000 Ljubljana, Slovenia
*
Author to whom correspondence should be addressed.
Horticulturae 2023, 9(4), 501; https://doi.org/10.3390/horticulturae9040501
Submission received: 14 March 2023 / Revised: 12 April 2023 / Accepted: 15 April 2023 / Published: 17 April 2023
(This article belongs to the Section Fruit Production Systems)

Abstract

:
A relatively new, non-destructive, method for the assessment of optimal blueberry fruit maturity directly on the plant uses a DA-meter (delta absorbance) to measure chlorophyll absorbance (IAD). Here, ‘Aurora’ fruit quality parameters (peel color, fruit firmness), chemical composition (individual sugars, organic acids and phenolics) and the relative expression of anthocyanidin synthase (ANS) genes were examined at four different maturity stages (immature, light purple, darker purple, fully ripe). All observed parameters changed significantly during ripening and sometimes exhibited high correlation with IAD values, as R2 values ranged between 0.61 and 0.97. Peel lightness (L*), chroma (C*), fruit firmness and organic acids significantly decreased during ripening, while sugars, sugar/organic acid ratio, total phenolics and relative expression of ANS significantly increased. The current study is the first to determine IAD values during different maturity stages of ‘Aurora’ fruit using a DA-meter and to evaluate their correlation with the most commonly used quality parameters of ripe fruit, fruit chemical composition and relative expression of ANS.

1. Introduction

In the last 10 years, areas with highbush blueberry (Vaccinium corymbosum L.) plantations have expanded dramatically all over the world [1] due to the growing consumer demand for blueberry fruit. Blueberries have a favorable taste with a balanced sugar/organic acid ratio, while chemical compounds (phenolics, vitamin C, carotenoids and tocopherols) that predominate in the fruit peel have potentially beneficial effects on human health [2,3,4].
During ripening, various morphological and chemical changes take place in blueberry fruit [5,6]. Sugar content increases rapidly at the beginning and then stagnates until the end of ripening, while organic acids decrease throughout the ripening period. Therefore, a steady increase in sugar/organic acid ratio occurs, which affects fruit taste [7,8]. Among others, phenolics are one of the most represented and most important compounds, and provide blueberry fruit with health-promoting properties [3]. According to the results published by Castrejón et al. [5], the contents of individual groups of phenolics change differently during ripening. However, a certain decreasing trend was observed for hydroxycinnamic acids and flavonols, while an increasing trend was observed for anthocyanins from the green to the fully blue developmental stage in all observed cultivars. As far as fruit firmness is concerned, blueberry fruit gets softer during ripening through the enzymatic degradation of pectin, cellulose and hemicellulose, which are the main components of the cell wall [8]. All these changes are strongly affected by genetic factors (i.e., cultivar), location (nutrients and water availability in the substrate), climatic conditions (air temperature, duration and quantity of light), and ripening stage [5,9,10].
Ripening stage at harvest significantly determines fruit chemical composition and, therefore, taste, as well as postharvest shelf life. Harvest at optimal fruit maturity is therefore crucial for uninterrupted market supply with fresh and high-quality blueberry fruit [11]. Nowadays, visual estimation of blueberry peel color is the most important maturity index at harvest [12], since blueberries are known for their successive ripening [10]. The fruit is ripe once it has achieved a fully blue coloration [6], and this is the key quality parameter for visually attracting consumers.
According to recent studies, anthocyanins are the most represented group of phenolics found in blueberry fruit [13]. Their accumulation in blueberry peel contributes to both peel color (red, blue, purple) and fruit nutritional value [3,4,14], suggesting a positive correlation between ripening stage, anthocyanin content, peel color intensity, and fruit quality [5,15]. In general, genetic background (i.e., cultivar) defines which anthocyanins occur in blueberry fruit, while environmental factors determine their content [16].
Anthocyanin synthesis in different parts of plants is also regulated by, among other factors, genetic—specifically transcription—factors. The transcription factor family R2R3-MYB has been suggested to be key for secondary metabolite gene regulation, and members are therefore important regulators of anthocyanin synthesis in plants [17,18,19]. Among other factors, R2R3-MYBs regulate the expression of anthocyanidin synthase (ANS), which catalyzes the second to last step in anthocyanin synthesis, the transformation from colorless leucoanthocyanidins to colored anthocyanidins. In the last step, anthocyanidins are transformed to anthocyanins [17,20]. In blueberries, anthocyanins are accumulated only in the fruit peel, developmental regulation plays a crucial role in their synthesis. However, the mechanisms behind the ripening-regulated synthesis of anthocyanins are still poorly known [16].
During harvest, human mistakes can occur through the picking of unripe fruit due to uneven ripening and the difficulty of detecting different shades of blue with the human eye, resulting in high color variability in harvested fruit [21]. Consequently, intensive research has been carried out in recent years with the aim of developing non-destructive methods for the evaluation of fruit ripening [22,23], such as DA-meter (delta absorbance) measurements. The DA-meter is a relatively new measuring device that measures the absorbance of chlorophyll (IAD) in fruit by means of visible and near-infrared (vis/NIR) spectroscopy, thus making it possible to check the ripening progress of large amounts of fruit, directly on the plant, with high precision [24]. This portable device can precisely define the ripening stage [23,25] and provide us with DA values, denoting the index of absorbance difference (IAD). The IAD value represents the difference in absorption between the wavelengths 670 nm and 720 nm, which are close to the chlorophyll a peak [23]. So far, IAD measurements using a DA-meter have been found to be a useful tool for monitoring the ripening process in peaches [24,25], plums [22], grapevines [26,27], and apples [28,29,30], and predicting the harvest date in cherries [31]. As far as blueberry fruit is concerned, studies are scarce [12].
Blueberry fruit is harvested by visual estimation of peel color; however, mistakes such as the harvesting of under-ripe fruit can easily occur. Therefore, the aim of this study was to correlate maturity parameter measurements (peel color, fruit firmness), fruit chemical composition (phenolics, sugars, organic acids), and relative expression of ANS during four different ripening stages with chlorophyll absorbance (IAD) measurements performed using a DA-meter. On the basis of our results, we will precisely determine the IAD value denoting fully ripe ‘Aurora’ fruit, thus making it possible for growers to predict the harvest window and to pick fully ripe fruit.

2. Materials and Methods
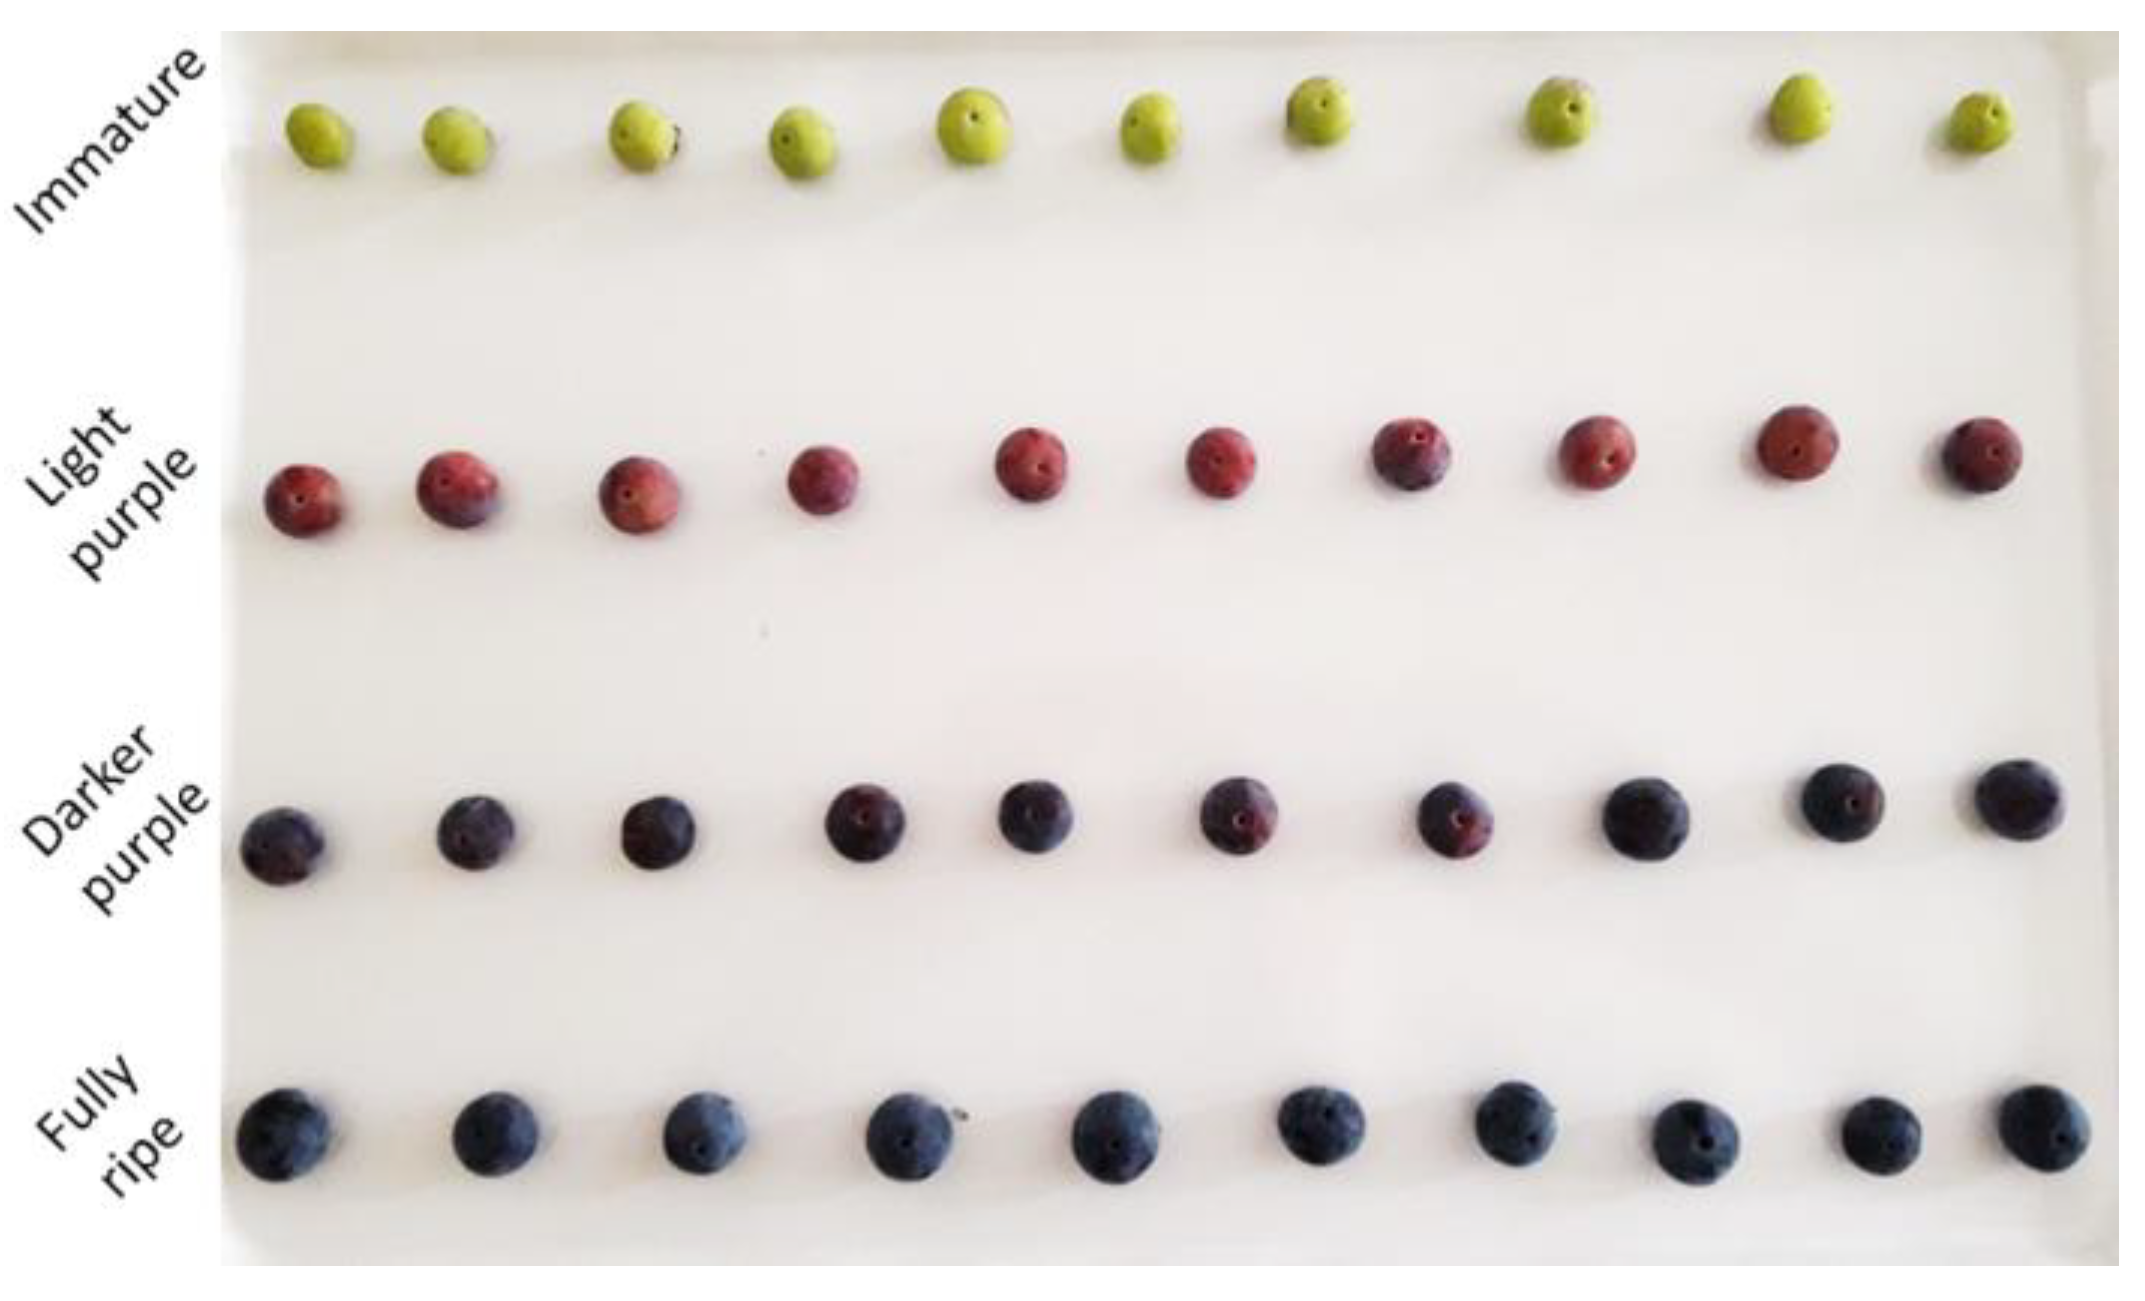
2.1. Fruit Material

Fruit samples were harvested in 2021 from fifteen 4-year-old ‘Aurora’ plants, located in the experimental field of the Biotechnical Faculty in Ljubljana, Slovenia (latitude: 46°05′ N, longitude: 14°47′ E, altitude: 295 m). Plants were grown under a hail net, in order to prevent hail damage and bird attacks. Randomly collected, immature to fully ripe fruit berries were transported to the laboratory and, on the basis of visual estimation as well as DA-meter measurements (Table 1), classified into four groups: immature, light purple, darker purple, and fully ripe (Figure 1). Blueberries undergo progressive ripening, and for that reason, it was possible to harvest all four maturity stages at once. From each group, 16 randomly chosen whole fruits were stored at −20 °C for metabolite extraction, while 15 fruits were selected for anthocyanidin synthase (ANS) gene expression measurements in the fruit peel. For ANS expression, three fruits were peeled at once directly into a mortar containing liquid nitrogen, and ground with a pestle. Fruit samples (0.1 g) were transferred into labeled 1.5 mL microcentrifuge tubes that had been previously cooled in liquid nitrogen. Each group of blueberry fruits was produced in five replicates (20 microcentrifuge tubes together). Samples were stored at −80 °C until analysis.

2.2. Chlorophyll Absorbance Measurements (IAD) Using DA-Meter

From each of the four blueberry groups, 10 fruits were randomly chosen (40 fruits altogether) for IAD measurements (DA-meter, T.R. Turoni Srl. Forli, Italy) and maturity measurements. First, dark calibration of the DA-meter was conducted, in order to obtain relevant results when taking the blueberry measurements. For each fruit, a certain value between 1.0 and 2.5 was measured on the basis of its absorbance properties, which represents the chlorophyll content (IAD) in the fruit. Measurements were made at the equator of the fruit.

2.3. Maturity Measurements

The same fruit were used for IAD measurements and evaluation of maturity parameters. Peel color was measured once on each fruit using a Konica Minolta portable colorimeter (CR-10 Chroma, Tokyo, Japan). The most common scale for determining fruit color was developed by the Commission Internationale d’Eclairage (CIELAB), where each color represents a specific point in a three-dimensional space. The parameters that describe fruit color are L*, C* and h°. The L* represents lightness on a scale from 0 (black) to 100 (white). The color intensity of the fruit is measured by the parameter C*, with higher values representing more intense color. The hue angle (h°) corresponds to the values from 0° to 360°, where 0° is red, 90° is yellow, 180° is green and 270° is blue.
Blueberry fruit firmness was measured on each fruit with a digital penetrometer (TR, Turin, Italy; N) with a 1 mm diameter tip.

2.4. Extraction of Sugars, Organic Acids and Phenolics

Sugars and organic acids were extracted from the whole fruit in four replicates, using an already-described method [14]. Fruits for extraction were sorted into individual maturity stages on the basis of their IAD values. Prior to extraction, fruits were thawed at room temperature for about 30 min. Fruits were finely chopped with a knife, allowing homogenous samples of blueberry peel and flesh to be obtained. Then, 1 g of sample was transferred into labeled, 10 mL test tubes and mixed with 5 mL of bi-distilled water. The extraction took place at room temperature for 30 min with constant stirring in a Unimax 1010 shaker (Heidolph, Schwabach, Germany), which was followed by centrifugation at 9000× g for 10 min at 4 °C (5810 R; Eppendorf, Hamburg, Germany). The supernatant was then transferred through cellulose filters (0.2 µm, Chromafil A-20/25, Macherey-Nagel, Düren, Germany) into the vials. The samples were stored at −20 °C until analysis by high-performance liquid chromatography (HPLC).
Extraction of fruit phenolics was performed using the same samples as those used for sugars and organic acids [14]. Fruits were cut into small pieces, and 2 g of homogenous sample was mixed with 4 mL of extraction solution, containing 70% methanol and 3% formic acid in bi-distilled water. After vortexing, the samples were left to extract for 1 h in cooled ultrasonic bath (0 °C) and then centrifuged (5810 R; Eppendorf, Hamburg, Germany) at 9000× g for 10 min at 4 °C. Finally, the supernatant was filtered through 0.2 µm polyamide filters (Chromafil AO-20/25, Macherey-Nagel, Düren, Germany) into labeled vials, and stored in a freezer at −20 °C until analysis.

2.5. Analytical Methods

Individual sugars were separated and analyzed using a Vanquish HPLC system (Thermo Scientific, Waltham, Massachusetts, USA) that was connected to an RI detector (RI plus, RefractoMax520, Thermo Scientific, Waltham, MA, USA). Separation of 20 µL of injected sample lasted for 15 min under a constant flow of 0.8 mL min−1. The column used was produced by Phenomenex (Rezex, RCM-Monosaccharide Ca+ 2%, 150 mm × 7.8 mm, Los Angeles, CA, USA) and was operated at 85 °C. The mobile phase used was bi-distilled water. Individual sugar concentration was identified by comparing the retention times with external standards and calculated on the basis of peak areas and standard curves equations. Contents were expressed as milligrams per gram of fresh weight (FW) [14].
Individual organic acids were analyzed using the Vanquish HPLC (Thermo Scientific, Waltham, Massachusetts, USA), on a Rezex ROA-Organic acid H+ 8% (150 mm × 7.8 mm) column, made by Phenomenex, CA, USA, operating at 65 °C. UV detection was set at 210 nm, and 20 µL of injected sample was analyzed for 15 min under a flow of 0.6 mL min−1. The mobile phase was 4 mM sulfuric acid in bi-distilled water [13]. Individual compounds were identified on the basis of comparison with corresponding external standard, quantified on the basis of peak area and standard curve equation, and expressed in milligrams per gram of FW.
Separation of individual phenolics took place on a Dionex Ultimate 3000 HPLC system (Thermo Scientific, Waltham, MA, USA) according to a previously established method [14]. Absorbance was monitored at 280 nm, 350 nm, and 530 nm. An injected sample with a volume of 20 µL was analyzed for 50 min, at a flow rate of 0.6 mL min−1, on the C18 column (Gemini, 150 × 4.6 mm, 3 mm, Phenomenex, Redwood City, CA, USA), which was operated at 25 °C. The autosampler temperature was maintained at 10 °C. The mobile phase A was 3% acetonitrile and 0.1% formic acid in bi-distilled water (v/v/v), and the mobile phase B was 3% bi-distilled water and 0.1% formic acid in acetonitrile (v/v/v). The gradient used was: 0–15 min, 5% B; 15–20 min, 5–20% B; 20–30 min, 20–30% B; from, 30–35 min, 30–90% B; 35–45 min, 90–100% B; and 45–50 min, 100–5% B.
Individual phenolics were identified by comparison with external standards, and additionally by scanning and fragmentation on an ion trap mass spectrometer (LTQ XL linear, Thermo Scientific, Waltham, MA, USA) according to their mass fragmentation patterns [14]. The mass spectrometer was operated in negative and positive ion mode, with electrospray ionization. The injection volume was 10 µL and the flow rate was 0.6 mL min−1. The capillary temperature was set at 250 °C, the sheath gas at 20 units, the auxiliary gas at 8 units, and source voltage at 4 kV, while m/z scanning was performed from 115 to 1600. The Phenolics contents were calculated on the basis of corresponding or similar external standard curves and expressed as milligrams per gram of FW.

2.6. RNA Extraction and Analysis

The RNA was extracted from previously prepared samples that were stored at −80 °C, according to Gudenschwager et al. [32] with minor modifications. Tests for each maturity stage were performed with five replicates. Samples were poured into 500 µL of extraction buffer that was prewarmed to 80 °C consisting of: 200 mM sodium borate decahydrate (Borax), pH 9.0, 30 mM ethylene glycol bis (β-aminoethyl ether)-N,N′- tetraacetic acid (EGTA), 1% (w/v) sodium dodecyl sulfate (SDS), 1% (w/v) sodium deoxycholate, 0.5% (v/v) Nonidet-40, 2% β-mercaptoethanol (added just before use) and polyvinylpyrolidone (360,000 MW). All solutions were prepared using nuclease-free water (IDT, Integrated DNA technologies, Redwood City, CA, USA). Samples were mixed by vortexing (Vortex genie 2, Roth, Karlsruhe, Germany) and then incubated for 1 h at 42 °C with constant stirring (ThermoMixer C, Eppendorf, Hamburg, Germany). After 1 h, 40 µL of 2 M potassium chloride was added to individual samples and cooled on ice for 30 min with frequent shaking by hand. Samples were then centrifuged at 12,000× g for 20 min at 4 °C (5810 R, Eppendorf, Hamburg, Germany). The obtained supernatants were transferred into clean tubes and an equal volume of 4 M lithium chloride was added. Homogenates were carefully mixed by inversion and stored at 4 °C overnight, in order to allow the RNA to precipitate. The next day, samples were centrifuged for 40 min at 20,000× g and at a temperature of 4 °C. Supernatants were removed from the tubes and pellets were dissolved in 500 µL nuclease-free water and 50 µL 3 M sodium acetate. Additionally, an equal volume of chloroform-isoamyl alcohol (1:1, v/v) was added to individual tubes. Samples were instantly mixed by vortexing for 1 min and centrifuged at maximum speed for 5 min at 4 °C in order to achieve sample separation into two phases. The upper phases were transferred into clean, 1.5 mL tubes, while the remaining organic phases were poured into 400 µL nuclease-free water. Samples were again immediately vortexed for 1 min and centrifuged at maximum speed for 5 min at 4 °C. The upper aqueous phases were joined with the first ones, while organic phases were discarded. The RNA was precipitated by adding an equal volume of isopropanol and 30 µL of 3 M sodium acetate. Samples were stored in ice for 1 h, followed by centrifugation at maximum speed for 40 min at 4 °C. The supernatants were removed and discarded, while pellets were washed with 400 µL of 80% ethanol, followed by air-drying for 5 min. The obtained pellets were dissolved in 30 µL nuclease-free water and stored at −80 °C.
The obtained samples were treated using the RNase-Free DNase Set (Qiagen, Hilden, Germany), according to the manufacturer’s instructions, in order to remove DNA and provide us with clean RNA samples.
The quality and concentrations of isolated RNA samples were estimated by measuring their absorbance at 230, 260 and 280 nm (NanoVue spectrophotometer, BioChrom, Uppsala, Sweden). Sample contamination by proteins and by polysaccharides/phenolics was measured as the A260/A280 ratio and the A260/A230 ratio, respectively.

2.7. Quantitative Reverse Transcription PCR (RT-qPCR)

First-strand cDNA synthesis was performed using the High-Capacity cDNA Reverse Transcription Kit (Applied Biosystems, Foster City, CA, USA) following the manufacturer’s instructions. Gene expression of ANS (VcANS), which is involved in the anthocyanin biosynthesis pathway, was analyzed by Quantitative RT-PCR using QuantStudio 5 (Applied biosystems, Thermo Fisher, Waltham, MA, USA) and Fast SYBR® Green technology (Thermo Fisher Scientific, Waltham, MA, USA. A specific primer for ANS (VcANS-F, 5′-cttcatcctccacaacatggt-3′; VcANS-R, 5′-gctcttgtacttcccattgctc-3′) (GenBank: JN654701.1) was obtained from Macrogen Europe BV (Amsterdam, Netherlands), as well for VcGAPDH (VcGAPDH-F, 5′-ggttatcaatgataggtttggca-3′; VcGAPDH-R, 5′-cagtccttgcttgatggacc-3′) (GenBank: AY123769.1), and this served as a reference gene [33]. The reaction was performed in a volume of 10 µL containing 5 µL Fast SYBR Green Master Mix, 10 ng of cDNA and 300 nM of each forward and reverse primer. We used the following amplification program: 20 s at 95 °C, 40 cycles for 3 s at 95 °C and 30 s at 60 °C, followed by a melt curve stage starting with an incubation of 1 min at 60 °C, with a gradual increase in temperature (1%) to 95 °C for 15 s, during which time changes in fluorescence were monitored to analyze primer specificity. The amplification efficiency of primers was calculated from 5-fold serial dilution in a range from 50 to 0.08 ng/µL with QuantStudio™ Design & Analysis Software v2.6.1 (Thermo Fisher Scientific, Waltham, MA, USA).

2.8. Statistics

Statistical analysis was performed in R commander i386 4.0.4. (Vienna, Austria) [34]. Statistically significant differences between maturity stages were determined by one-way analysis of variance (ANOVA), using the Duncan’s test (p < 0.05), and are presented by different letters. Linear regression was used in order to estimate correlation between individual maturity stage, i.e., IAD value as the independent variable, and fruit quality parameters as the dependent variables.

3. Results

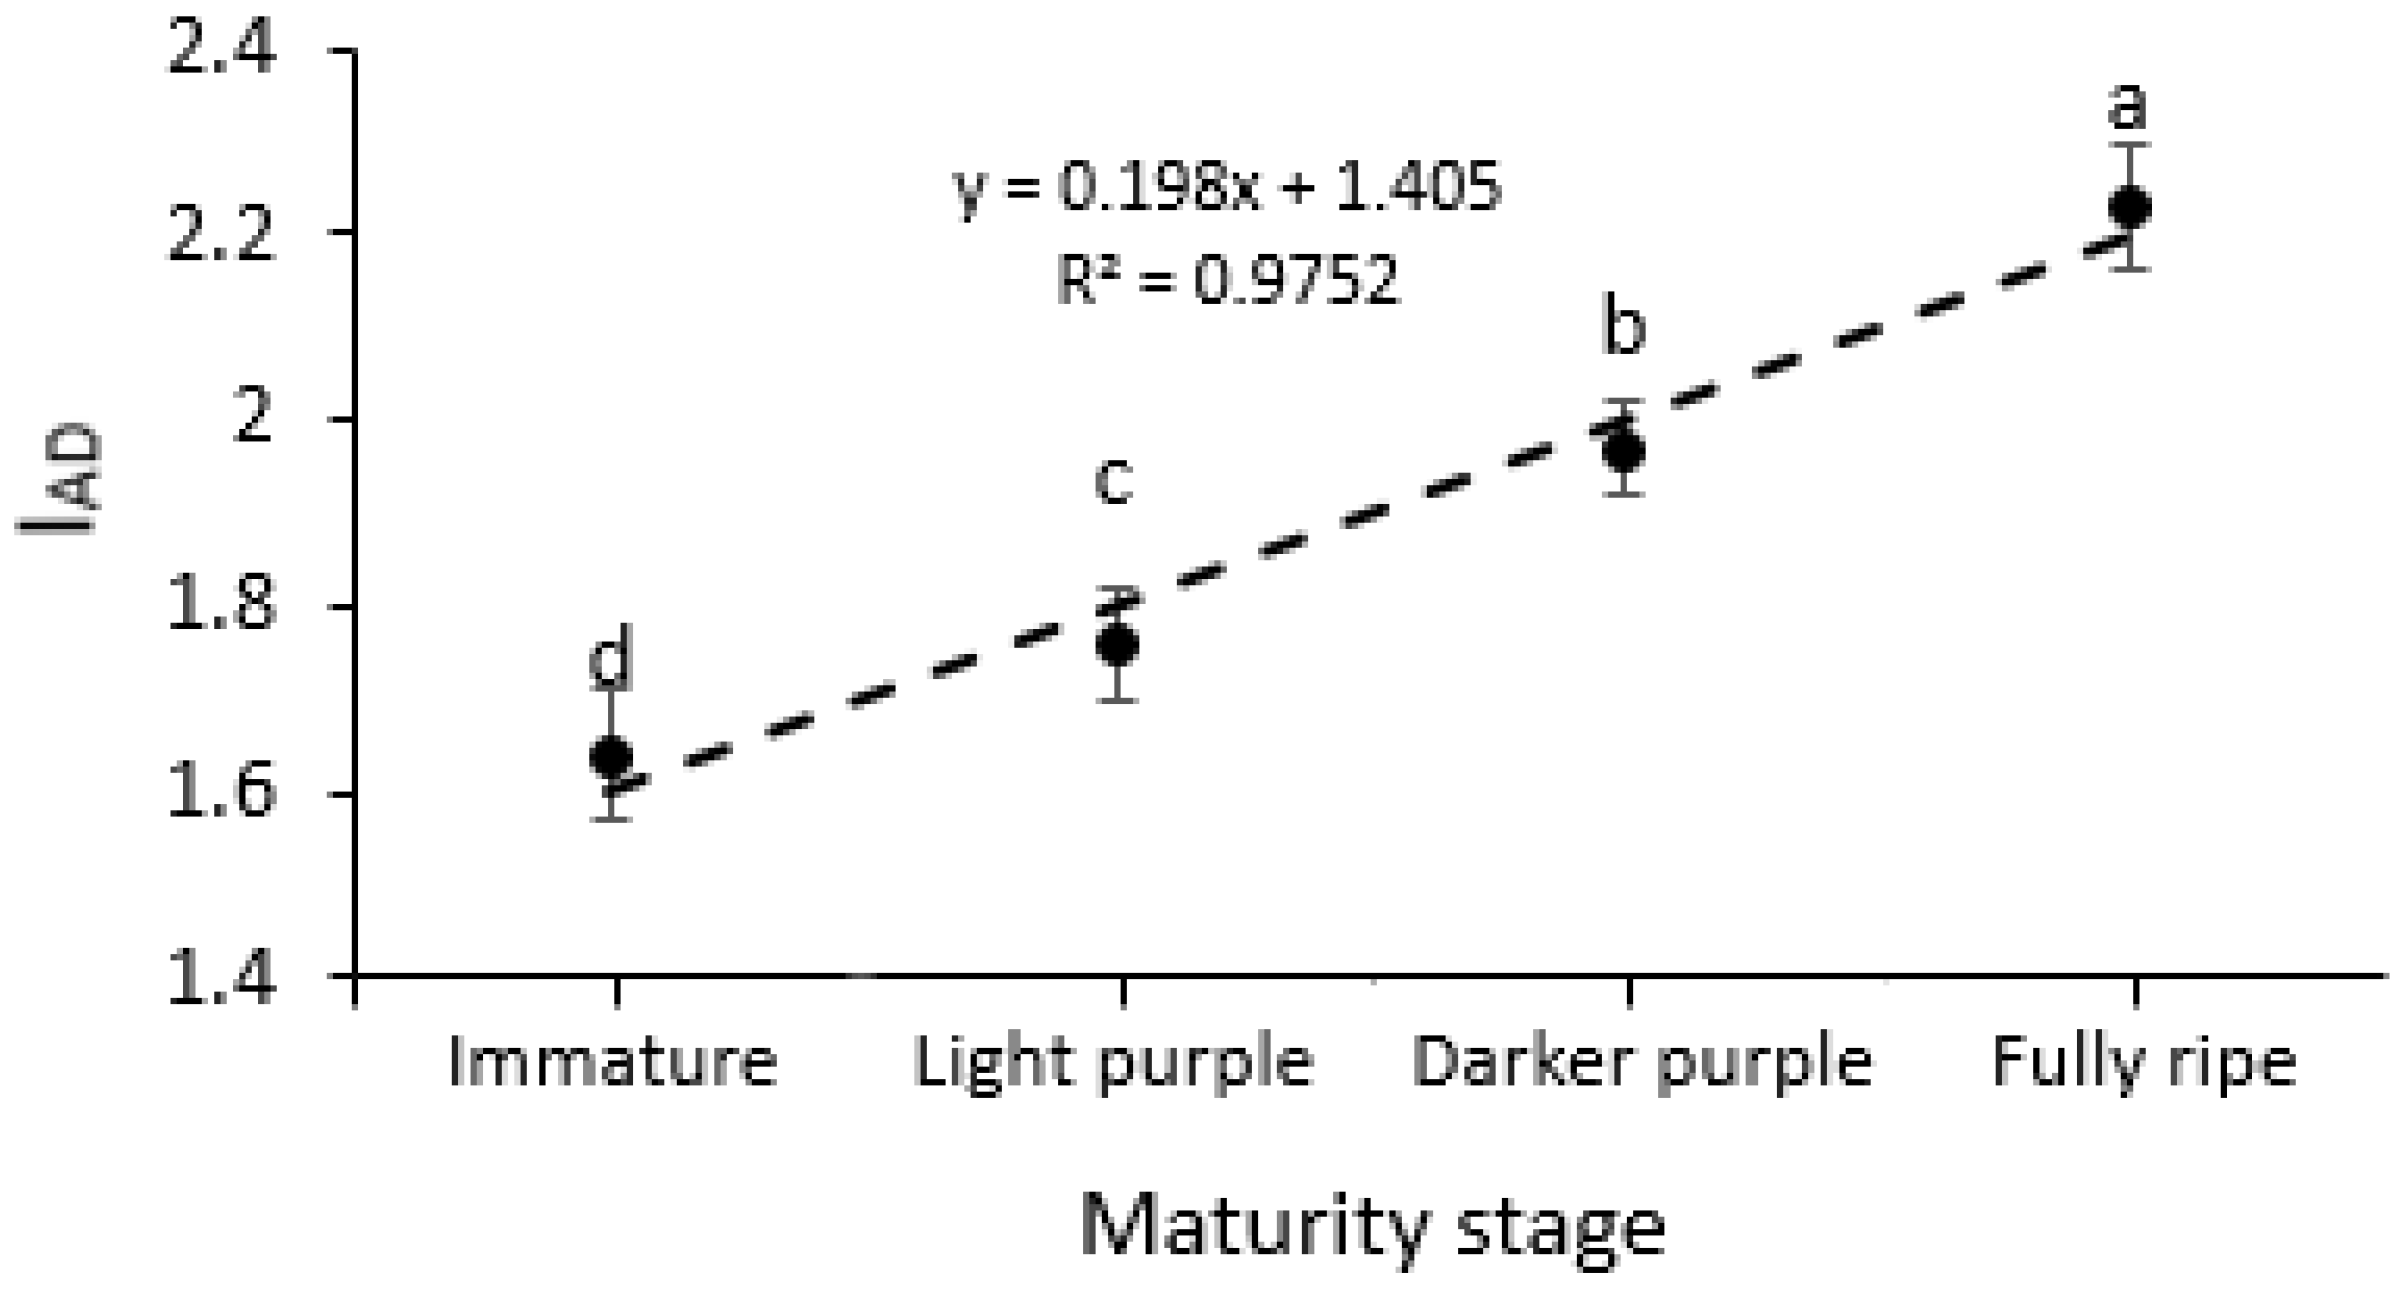
3.1. Chlorophyll Absorbance (IAD) Measurements

In the present study, we wanted to check whether blueberry fruits at different ripening stages differed with respect to their IAD measurements, as presented in Figure 2. Significant differences in IAD values were noticed between all four ripening stages, with the significantly highest values being observed in fully ripe fruit and the lowest in immature fruit. The IAD dependence on maturity stage is clearly shown by a linear model, with 97.5% of IAD variability being explained by maturity stage.

3.2. Peel Color and Fruit Firmness

The measured peel color parameters differed significantly among maturity stages (Table 2). The L* and C* values were significantly the highest in immature fruit and the lowest in fully ripe fruit. Linear regression analysis between those two parameters and IAD values (i.e., maturity stage) showed that 69% and 81% of the variability in L* and C* could be explained by maturity stage, respectively (Figure 3). Significant differences between fruits were also detected in the h° values.
Variations in fruit firmness between fruits with diverse IAD values are shown in Table 2. The same is true for fruit firmness as for L* and C* peel color parameters, where significant differences were detected between maturity stages, with values decreasing from immature to fully ripe fruit. No significance, however, was observed between light purple and darker purple fruit samples. According to the results obtained by linear regression analysis, presented in Figure 3, fruit firmness is 61% dependent on the degree of maturity.

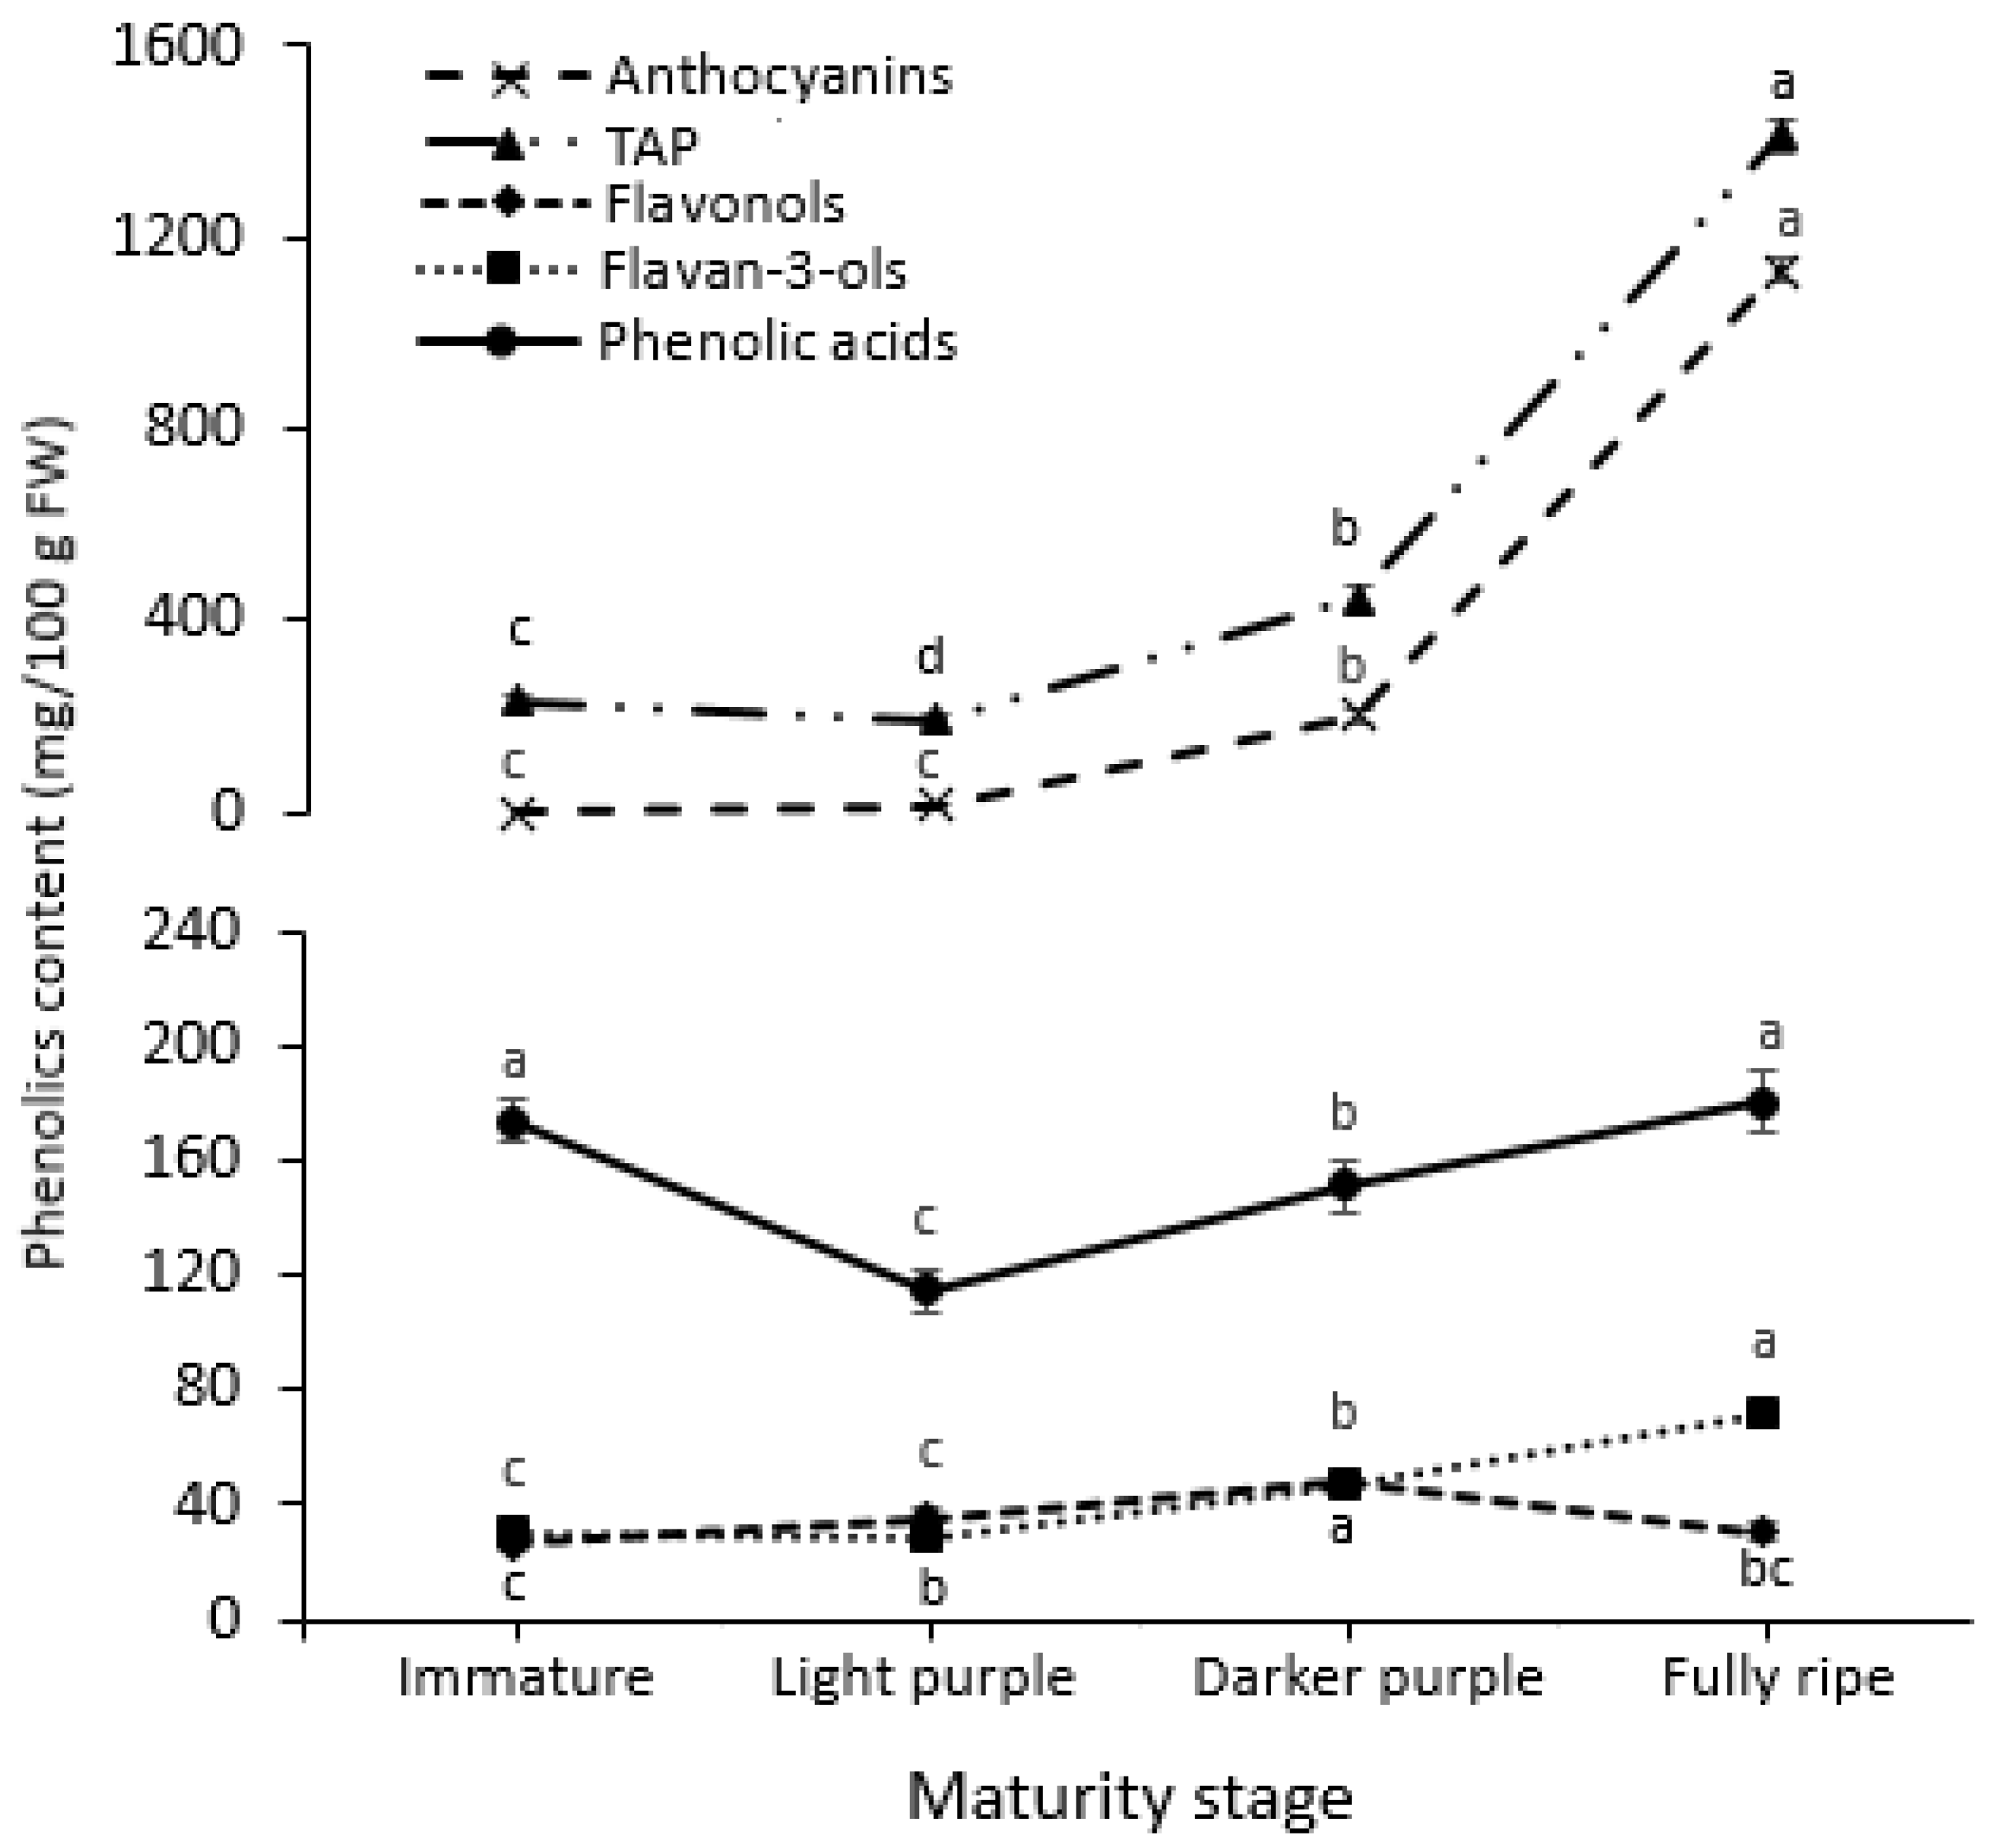
3.3. Fruit Chemical Composition

Total sugar content, presented in Figure 4, increased linearly with advancing maturity stage (R2 = 0.95), with immature fruit containing 32.68 mg/g of total sugars (FW) and fully ripe fruit containing 142.16 mg/g FW (Supplementary Materials Table S1). This is in accordance with individual sugar contents, as the lowest contents of glucose and fructose were measured in immature fruit, while the lowest content of sucrose was measured in immature and light purple fruit, with no significant differences. The highest contents of all three individual sugars were detected in fully ripe fruit.
Together with total sugars, Figure 4 represents the variation in total organic acid between different maturity stages. Those values significantly and constantly decreased from immature to fully ripe fruit, with significant differences being detected between all the observed maturity stages. These values correspond to citric and malic acid, while the darker purple fruit had the lowest content of tartaric acid. Shikimic acid did not significantly differ between maturity stages (Supplementary Materials Table S1). Sugar/organic acid ratio variation in fruit during ripening corresponds to total sugar fluctuations (Figure 4).
The variation in different groups of phenolics during blueberry ripening is presented in Figure 5, and the variation in individual phenolics is presented in Supplementary Material Table S1. Phenolic acids were the highest in immature and fully ripe fruit, with a significant drop between the first and second observed maturity stages. The highest contribution to these results was found for 5-caffeoylquinic acid, the content of which was the highest in immature fruit, before later decreasing, and ellagic acid derivative, together with caffeic acid derivative 2, the contents of which dramatically increased during maturation. Other compounds were represented to a lesser extent; however, their contents generally increased during fruit ripening.
Total and individual flavan-3-ol contents significantly increased from the immature to fully ripe stages, with the exception of epicatechin, the content of which remained statistically unchanged. On the other hand, a significant increase in total flavonol content was detected only until the darker purple stage, and by the end of ripening (fully ripe fruit), a significant decrease had occurred. The contents of quercetin-3-O-galactoside, quercetin-3-O-glucoside, and isorhamnetin-3-O-rutionoside, which are also the most represented among the individual flavonols, corresponded to those of total flavonols at individual maturity stages.
Significantly, the lowest anthocyanin content was detected in immature and light purple fruit and the highest in fully ripe fruit. This is in accordance with most of the individual anthocyanins. The exceptions were cyanidin-3-O-galactoside, cyanidin-3-O-arabinoside, and peonidin-pentose, whose contents were the lowest only in immature fruit and, at the same time were very low in fully ripe fruit when compared to other anthocyanins. Among individual compounds, fully ripe fruit contained the most malvidin derivatives. Total phenolics were significantly the lowest in light purple and the highest in fully ripe fruit.

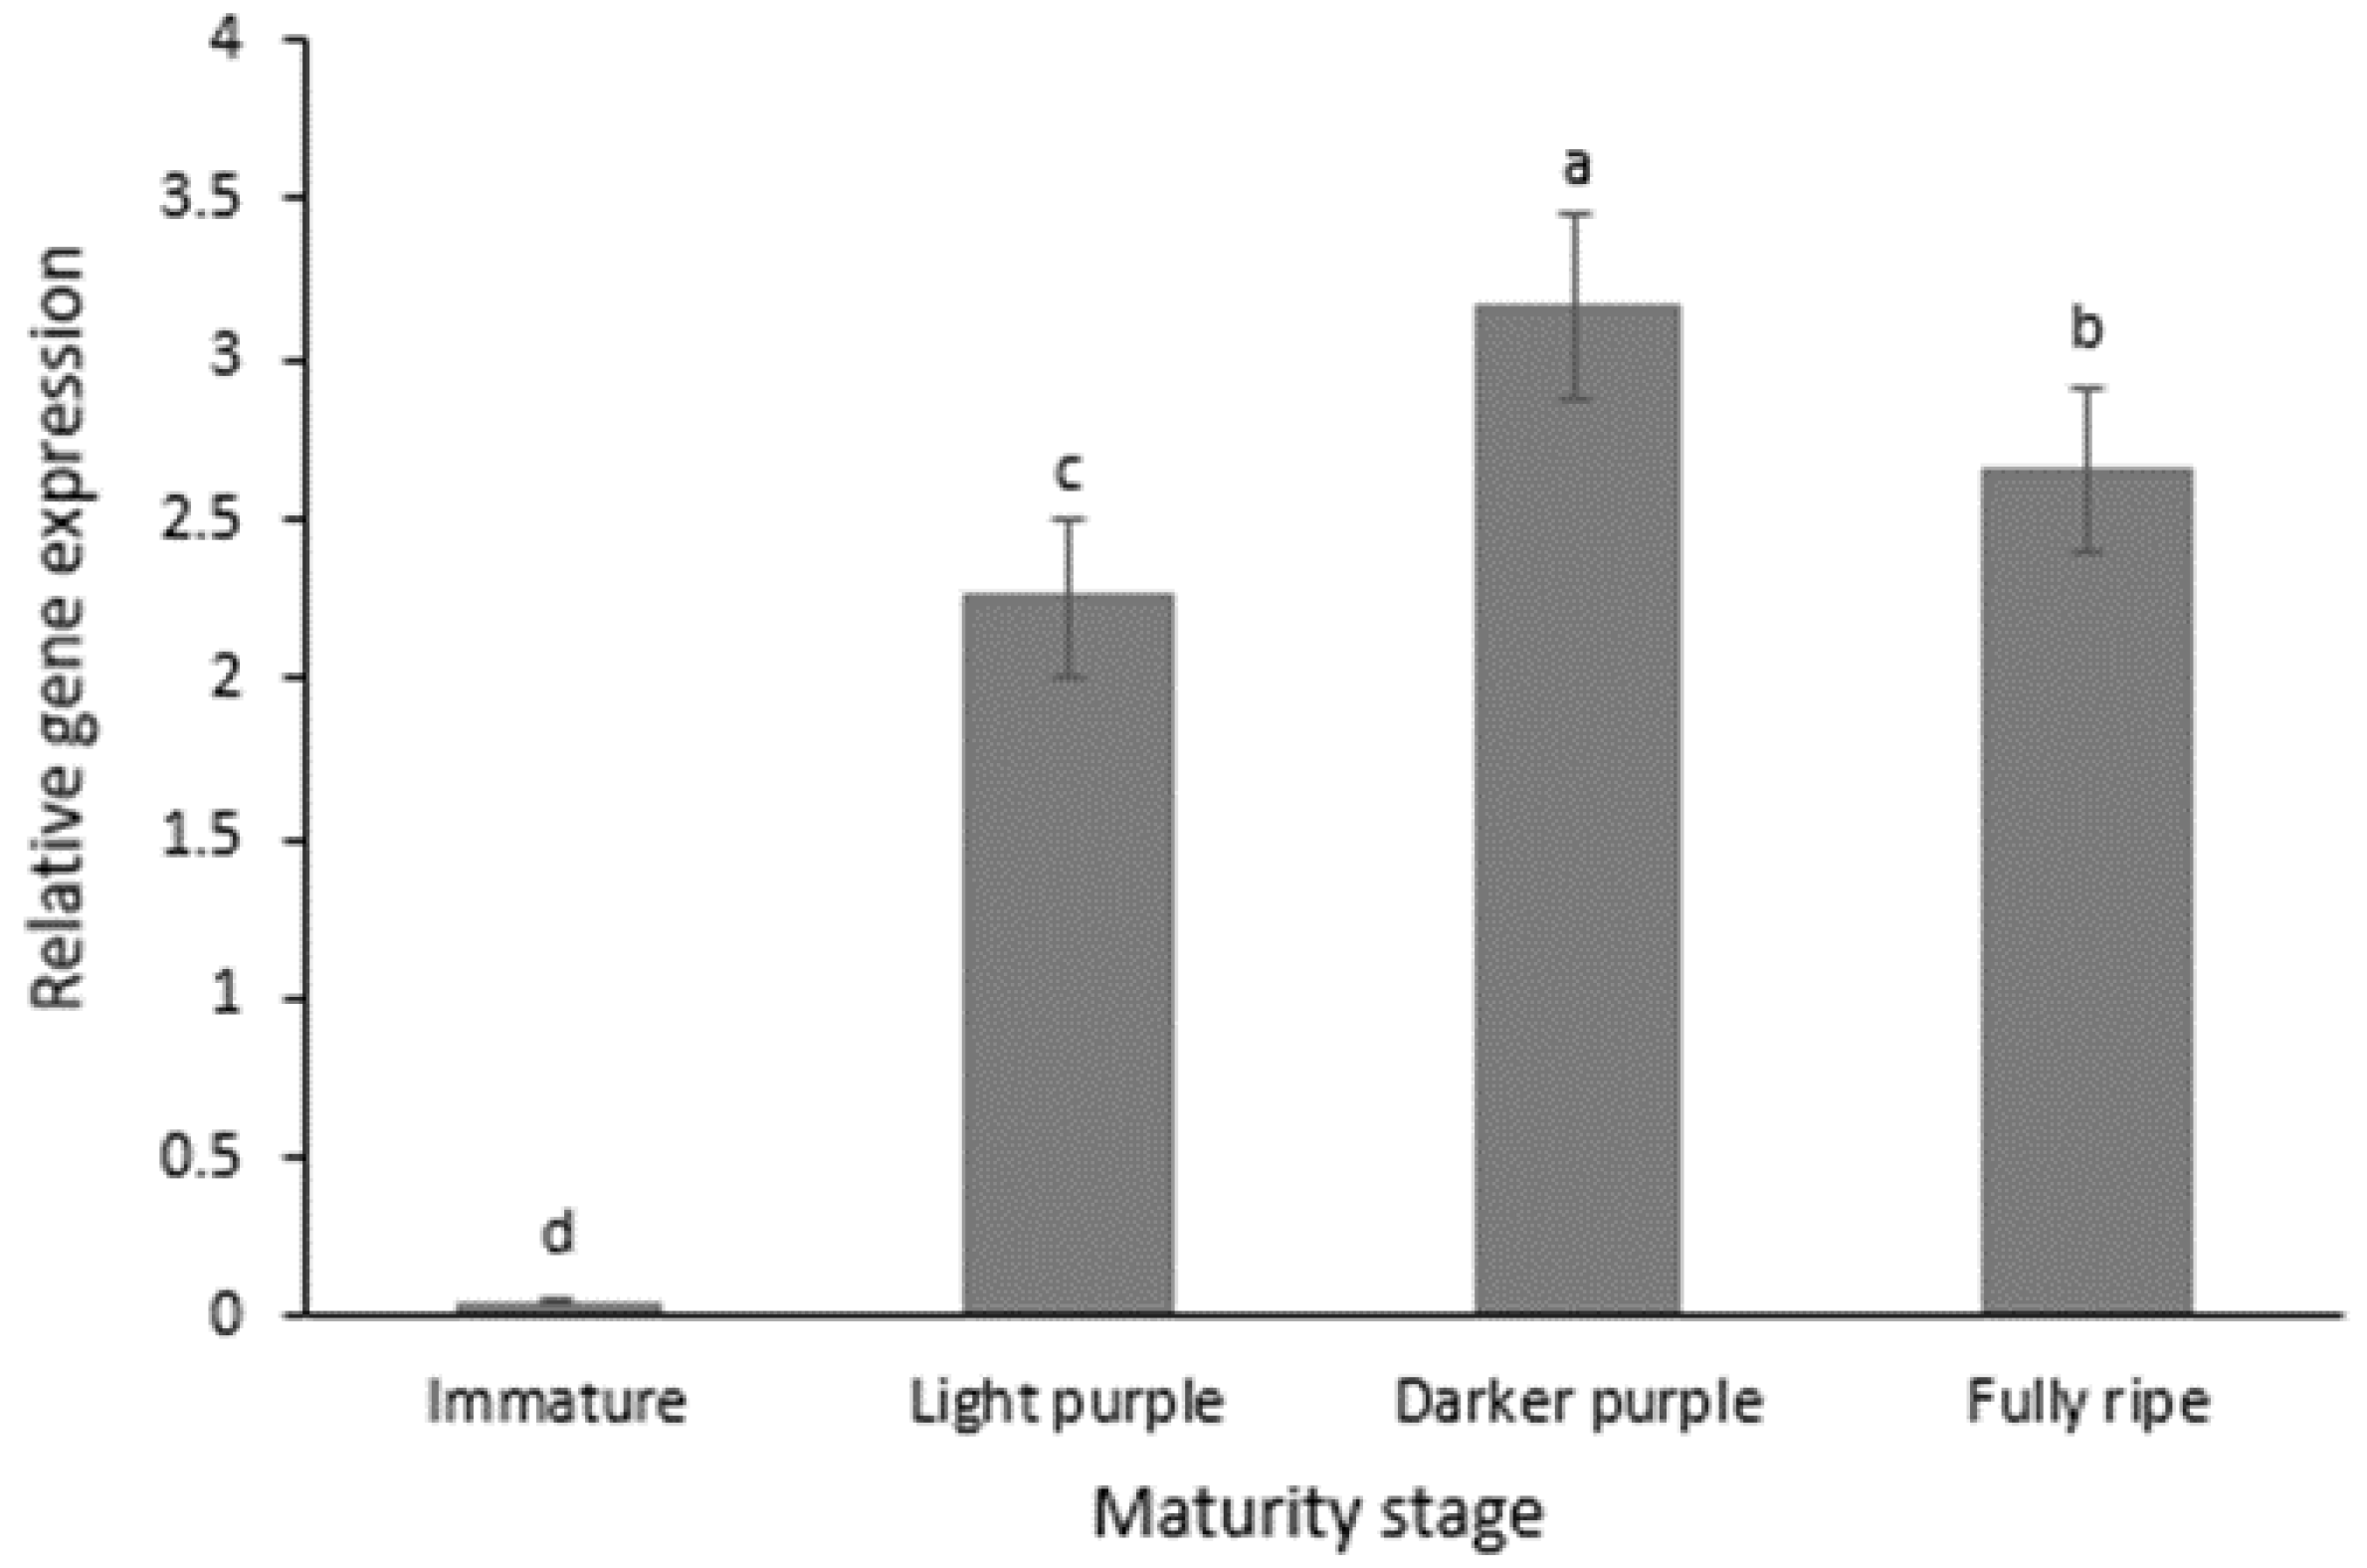
3.4. Relative Expression of Anthocyanidin Synthase (ANS)

Figure 6 shows the relative ANS expression in blueberry peel from different maturity stages. Significant differences were detected between all four maturity stages. The lowest value was measured in the peel of immature fruit, while the highest was in darker purple peel. The most pronounced difference was noticed between immature and light purple fruit, where 49-fold higher expression of ANS was noticed in light purple fruit compared to immature fruit.

4. Discussion

Blueberry fruit is mostly harvested on the basis of a visual estimation of peel color; therefore, mistakes in the form of picking under-ripe fruit can easily occur. Consequently, a new method for identifying fully ripe fruit directly on plants is highly desirable. Here, a portable device, called a DA-meter, which measures chlorophyll absorbance (IAD) in fruit peel, was used to determine IAD values at individual maturity stages of blueberry fruit. The main objective was to correlate IAD values with a number of quality parameters that are frequently used in assessing the optimal maturity of blueberry fruit. This is the first study in which the maturity of blueberry fruit has been estimated using a DA-meter, while some other studies have reported the use of a Cherry-meter [12]. This device, as opposed to the DA-meter, measures the absorbance of anthocyanins, with wavelengths close to their maximal absorbance (560 nm and 640 nm). However, the values are the same as for the DA-meter expressed as IAD.
Our results show highly significant correlations between IAD values and peel color parameters, fruit firmness, contents of sugar, organic acids and anthocyanins, and ANS relative expression (R2 ranging from 0.61 to 0.97), indicating the DA-meter to be an effective tool for precise estimation of fully ripe fruit at harvest. Along with progressive maturation of the berries from immature to fully ripe, IAD values also increased, with extremely low variability between samples (R2 = 0.98). High correlations between maturity stage and IAD value have also been reported by other studies on peaches [24], nectarines [25], sweet cherries [31], and grapes [27]. According to our measurements using the DA-meter, fully ripe ‘Aurora’ fruits possess IAD values between 2.11 and 2.3. However, Ribera-Fonseca et al. [12], who used a Cherry-meter, reported that IAD values for determining harvest time and performing fruit quality predictions were cultivar-dependent, because the highest IAD values for ‘Sharpblue’ were above 2.9, and those for ‘Misty’ were above 3.2.
The color of blueberry fruit turns from green to dark blue due to the accumulation of anthocyanin in the peel; however, it is not accumulated in the flesh [4]. Peel color is the most important fruit quality parameter for determining full maturity, and consequently optimal picking date, not only in blueberries [12], but also in other fruit species, and a large number of fruit species are harvested on the basis of an individual judgement of fruit color [30,31,35]. Our results show that fruit color parameters measured by portable colorimeter significantly change during ripening. The L* value is known to decrease as the color becomes darker [15]. This is in accordance with the current results, where a correlation with low variability was detected between L* and IAD values (R2 = 0.69). The same decreasing trend with progressing maturity stage and high correlation with IAD were observed for C* (R2 = 0.81), which is considered to be one of the most reliable parameters for fruit color estimation [31]. A negative correlation between IAD (advanced maturity stage) and C* was also described in a study conducted by Nagpala et al. [31] on sweet cherries, where a Cherry-meter was used to perform IAD measurements. These results indicate that the IAD values provided by a DA-meter or a Cherry-meter could be useful for harvest prediction in the intensive production of various fruit species [12,27,28,31,35]. Similar results in terms of C* measurements have been reported by Chung et al. [15] in ‘Bluecrop’, where the values decreased from 50.7 in green to 7.9 in dark purple fruit. Peel color modifications were also observed on the basis of h° monitoring, where the values correspond to color distribution in the 0° to 360° range. However, no correlation between h° and IAD was determined. Slightly deviating results reported by Chung et al. [15] indicate that blueberry peel color is, among other things, cultivar dependent.
It is generally known that fruit becomes softer during ripening [8,22] due to enzymatic degradation of cell wall components [7]. This was confirmed with the current study, where significantly the highest and the lowest fruit firmness were measured in immature and fully ripe fruit, respectively. At the same time, correlation with IAD values (R2 = 0.61) corresponds with some previous reports [12,27].
During ripening, significant changes occur in blueberry fruit with respect to the content of sugars and organic acids, together with the sugar/organic acid ratio [5], as a consequence of synthesis, degradation, or translocation [7]. Those processes are to a large extent influenced by maturation, while the final contents of those compounds in fully ripe fruit mainly depends on genetic background [9,14]. High sugar/organic acid ratio are the result of high sugar and/or low organic acid contents [14]. Here, a significant increase in total sugar content and consequently in sugar/organic acid ratio, together with significant organic acid degradation, was observed during ripening. At this point, it is worth mentioning that the optimal sugar/organic acid ratio for individual cultivars is of high importance for the fresh consummation and prolonged shelf-life of fruit [21,29]. All three of the parameters described above related to content of primary metabolites were in high correlation with IAD, because 94% to 97% of variability was explained by maturity stage. Focusing on individual sugars, the highest contributions to the total content were made by glucose and fructose, while citric acid represented 89% of the total organic acids found in the ‘Aurora’ fruit. With the content of primary metabolites at individual maturity stage, we once more confirmed the functionality of IAD provided by the DA-meter. This was previously confirmed by Bonora et al. [35] on nectarines using a DA-meter and by Ribera-Fonseca et al. [12] on blueberries using a Cherry-meter.
High contents of phenolics are highly desirable in ripe blueberry fruit, due to their health-promoting properties [36,37]. With the exception of anthocyanins, which were not detected in immature fruit, phenolic acids predominated over flavan-3-ols and flavonols during all maturity stages. Despite significant differences between immature, light purple and darker purple fruit in terms of content of phenolic acids, there was no difference in their content between immature and fully ripe fruit. This contradicts some previous studies [5,38] in which a significant decrease in phenolic acids was reported from green to dark blue fruit in five different blueberry cultivars. 5-caffeoylquinic acid, which was the most represented in our ‘Aurora’ fruit at all maturity stages, had a content in fully ripe fruit that was lower by almost half than that in the immature fruit. This is in accordance with the results published by [39]. However, a significant increase in ellagic acid derivative caused non-significant differences in total phenolic acids content between the first and the last observed maturity stages. Flavan-3-ols slowly increased from immature towards fully ripe fruit. They are supposed to accumulate at the beginning of maturation, presumably to protect the fruit from pathogen, pest, and animal attacks [16], before decreasing. However, this was not observed in this study. On the other hand, a significant drop occurred in total flavonols from darker purple to fully ripe fruit. Similar results were reported by Li et al. [38] in blueberries. These results are similar to reports by Castrejón et al. [5] in blueberries and by Carbone et al. [16] in strawberries. The latter simultaneously detected a decrease in the relative expression of flavonol synthase, which was consistent with total flavonol content. The total and individual anthocyanins that were not detected in immature fruit [5,16] significantly differed between light purple, darker purple and fully ripe fruit. An increasing trend was observed with advancing maturity stage, because intensive fruit color serves as a visual attractant to animals to feed on the fruit [16]. This was also reflected in total phenolics content, as anthocyanins represent a major part of the total phenolics in fully ripe blueberry fruit [13].
Anthocyanin accumulation is, in most plants, limited to specific tissues and developmental stages [40], and is the most important marker of ripening. Its synthesis is regulated by a large number of enzymes, including anthocyanidin synthase (ANS), and its activity is reflected in anthocyanin accumulation and consequent change in color [38,40]. As already mentioned above, total anthocyanin content significantly increases from light purple to fully ripe fruit, while none was detected in immature fruit [19,38,40]. According to our research, as well as some previous reports [16,40], the most pronounced difference in ANS expression was detected between immature and light purple fruit. This determined the most striking differences in blueberry fruit color, as could also be observed in the h° measurements. According to these measurements, the immature fruit was closer to yellow in color, while fruit at advanced stages of maturity was closer to red and blue. Consequently, a significant increase in ANS expression during the maturation of ‘Aurora’ fruit is not surprising. However, the highest relative expression of ANS was measured in fruit that was darker purple in color, while the highest anthocyanin content was detected in fully ripe fruit. This obvious discrepancy of the down-regulation of ANS in fully ripe fruit is in accordance with some other studies [19,38,40], and is probably a result of the time delay between the gene expression and anthocyanin accumulation. The ANS expression genes were up-regulated during the ripening period when anthocyanin content grew most rapidly. In fully ripe berries, anthocyanins reached their maximal values, and expression started to drop [40].

5. Conclusions

The most commonly used quality parameters for determining the optimal maturity of blueberry fruit, such as peel color and fruit firmness, together with fruit chemical composition (individual sugar, organic acid and phenolics contents), turned out to be highly correlated with the individual maturity stage and, at the same time, with the IAD values provided by the DA-meter. This suggests that the DA-meter could be a valuable tool for accurate and non-destructive assessment of optimal maturity stage in ‘Aurora’ fruit directly on plants. This would improve harvesting by making sure that only fully ripe fruit was picked (IAD 2.11–2.30) thus providing homogenous fruit and optimal fruit quality and thereby allowing prolonged storage and shelf life.
This is the first study where the DA-meter was used on blueberry fruit. Despite the promising data, further research is necessary in order to evaluate the method described above on multiple blueberry cultivars. At the same time, studies should be upgraded and expanded, therefore the researchers should increase sample size and conduct multiple fruit sampling in one growing season in order to provide repetition over time.

Supplementary Materials

The following supporting information can be downloaded at https://www.mdpi.com/article/10.3390/horticulturae9040501/s1. Table S1: Individual sugars, organic acids and phenolics in blueberry fruit from different maturity stages.

Author Contributions

Conceptualization, T.S., R.V. and J.J.; methodology, T.S., N.S, T.C. and J.J.; formal analysis, T.S. and T.C.; investigation, T.S. and T.C.; resources, N.S. and M.H.; data curation, T.S.; writing—original draft preparation, T.S.; writing—review and editing, N.S., T.C., R.V., M.H. and J.J.; visualization, T.S.; supervision, N.S., R.V. and J.J.; project administration, N.S., R.V. and J.J.; funding acquisition, N.S. and M.H. All authors have read and agreed to the published version of the manuscript.

Funding

The authors acknowledge the financial support of the Slovenian Research Agency within the research program Horticulture (P4-0013), the infrastructural centre IC RRC AG (10-0022-0481-001), and the research program Genetics and modern technologies of crops (P4-0077).

Data Availability Statement

Data sharing is not applicable to this article.

Conflicts of Interest

The authors declare no conflict of interest.

References

  1. Retamales, J.B.; Hancock, J.F. Blueberries, 2nd ed.; Cabi: Boston, MA, USA, 2018. [Google Scholar]
  2. Grace, M.H.; Xiong, J.; Esposito, D.; Ehlenfeldt, M.; Lila, M.A. Simultaneous LC-MS Quantification of Anthocyanins and Non-Anthocyanin Phenolics from Blueberries with Widely Divergent Profiles and Biological Activities. Food Chem. 2019, 277, 336–346. [Google Scholar] [CrossRef] [PubMed]
  3. Huang, W.Y.; Zhang, H.C.; Liu, W.X.; Li, C.Y. Survey of Antioxidant Capacity and Phenolic Composition of Blueberry, Blackberry, and Strawberry in Nanjing. J. Zhejiang Univ. Sci. B 2012, 13, 94–102. [Google Scholar] [CrossRef] [PubMed]
  4. Riihinen, K.; Jaakola, L.; Kärenlampi, S.; Hohtola, A. Organ-Specific Distribution of Phenolic Compounds in Bilberry (Vaccinium Myrtillus) and “northblue” Blueberry (Vaccinium Corymbosum x V. Angustifolium). Food Chem. 2008, 110, 156–160. [Google Scholar] [CrossRef]
  5. Castrejón, A.D.R.; Eichholz, I.; Rohn, S.; Kroh, L.W.; Huyskens-Keil, S. Phenolic Profile and Antioxidant Activity of Highbush Blueberry (Vaccinium Corymbosum L.) during Fruit Maturation and Ripening. Food Chem. 2008, 109, 564–572. [Google Scholar] [CrossRef]
  6. Milivojević, J.; Radivojević, D.; Nikolić, M.; Maksimović, J.D. Changes in Fruit Quality of Highbush Blueberries (Vaccinium Corymbosum) during the Ripening Season. Acta Hortic. 2016, 1139, 657–664. [Google Scholar] [CrossRef]
  7. Li, X.; Li, C.; Sun, J.; Jackson, A. Dynamic Changes of Enzymes Involved in Sugar and Organic Acid Level Modification during Blueberry Fruit Maturation. Food Chem. 2020, 309, 125617. [Google Scholar] [CrossRef]
  8. Woodruff, R.E. Chemical and physical changes of blueberry fruit associated with ripening and detrioration. 1960. Michigan State University of Agriculture and Applied Science. Department of Horticulture. Available online: https://scholar.google.com/scholar?hl=sl&as_sdt=0%2C5&q=chemical+and+physical+changes+of+blueberry+fruit&btnG= (accessed on 15 January 2022).
  9. Howard, L.R.; Clark, J.R.; Brownmiller, C. Antioxidant Capacity and Phenolic Content in Blueberries as Affected by Genotype and Growing Season. J. Sci. Food Agric. 2003, 83, 1238–1247. [Google Scholar] [CrossRef]
  10. Zorenc, Z.; Veberic, R.; Stampar, F.; Koron, D.; Mikulic-Petkovsek, M. Changes in Berry Quality of Northern Highbush Blueberry (Vaccinium Corymbosum L.) during the Harvest Season. Turkish J. Agric. For. 2016, 40, 855–864. [Google Scholar] [CrossRef]
  11. Infante, R. Harvest Maturity Indicators in the Stone Fruit Industry. Stewart Postharvest Rev. 2012, 8, 1–6. [Google Scholar] [CrossRef]
  12. Ribera-Fonseca, A.; Noferini, M.; Rombolá, A.D. Non-Destructive Assessment of Highbush Blueberry Fruit Maturity Parameters and Anthocyanins by Using a Visible/ near Infrared (Vis/NIR) Spectroscopy Device: A Preliminary Approach. J. Soil Sci. Plant Nutr. 2016, 16, 174–186. [Google Scholar] [CrossRef]
  13. Smrke, T.; Veberic, R.; Hudina, M.; Stamic, D.; Jakopic, J. Comparison of Highbush Blueberry (Vaccinium Corymbosum L.) under Ridge and Pot Production. Agriculture 2021, 11, 929. [Google Scholar] [CrossRef]
  14. Smrke, T.; Veberic, R.; Hudina, M.; Zitko, V.; Ferlan, M.; Jakopic, J. Fruit Quality and Yield of Three Highbush Blueberry (Vaccinium Corymbosum L.) Cultivars Grown in Two Planting Systems under Different Protected Environments. Horticulturae 2021, 7, 591. [Google Scholar] [CrossRef]
  15. Chung, S.W.; Yu, D.J.; Lee, H.J. Changes in Anthocyanidin and Anthocyanin Pigments in Highbush Blueberry (Vaccinium Corymbosum Cv. Bluecrop) Fruits during Ripening. Hortic. Environ. Biotechnol. 2016, 57, 424–430. [Google Scholar] [CrossRef]
  16. Carbone, F.; Preuss, A.; De Vos, R.C.H.; D’Amico, E.; Perrotta, G.; Bovy, A.G.; Martens, S.; Rosati, C. Developmental, Genetic and Environmental Factors Affect the Expression of Flavonoid Genes, Enzymes and Metabolites in Strawberry Fruits. Plant, Cell Environ. 2009, 32, 1117–1131. [Google Scholar] [CrossRef] [PubMed]
  17. Jaakola, L. New Insights into the Regulation of Anthocyanin Biosynthesis in Fruits. Trends Plant Sci. 2013, 18, 477–483. [Google Scholar] [CrossRef]
  18. Liu, J.; Osbourn, A.; Ma, P. MYB Transcription Factors as Regulators of Phenylpropanoid Metabolism in Plants. Mol. Plant 2015, 8, 689–708. [Google Scholar] [CrossRef]
  19. Yang, J.; Li, B.; Shi, W.; Gong, Z.; Chen, L.; Hou, Z. Transcriptional Activation of Anthocyanin Biosynthesis in Developing Fruit of Blueberries (Vaccinium Corymbosum L.) by Preharvest and Postharvest UV Irradiation. J. Agric. Food Chem. 2018, 66, 10931–10942. [Google Scholar] [CrossRef]
  20. Zorenc, Z.; Veberic, R.; Slatnar, A.; Koron, D.; Miosic, S.; Chen, M.H.; Haselmair-Gosch, C.; Halbwirth, H.; Mikulic-Petkovsek, M. A Wild ‘Albino’ Bilberry (Vaccinium Myrtillus L.) from Slovenia Shows Three Bottlenecks in the Anthocyanin Pathway and Significant Differences in the Expression of Several Regulatory Genes Compared to the Common Blue Berry Type. PLoS ONE 2017, 12, 1–14. [Google Scholar] [CrossRef]
  21. Leiva-Valenzuela, G.A.; Lu, R.; Aguilera, J.M. Prediction of Firmness and Soluble Solids Content of Blueberries Using Hyperspectral Reflectance Imaging. J. Food Eng. 2013, 115, 91–98. [Google Scholar] [CrossRef]
  22. Infante, R.; Contador, L.; Rubio, P.; Mesa, K.; Meneses, C. Non-Destructive Monitoring of Flesh Softening in the Black-Skinned Japanese Plums “Angeleno” and “Autumn Beaut” on-Tree and Postharvest. Postharvest Biol. Technol. 2011, 61, 35–40. [Google Scholar] [CrossRef]
  23. Ziosi, V.; Noferini, M.; Fiori, G.; Tadiello, A.; Trainotti, L.; Casadoro, G.; Costa, G. A New Index Based on Vis Spectroscopy to Characterize the Progression of Ripening in Peach Fruit. Postharvest Biol. Technol. 2008, 49, 319–329. [Google Scholar] [CrossRef]
  24. Bonora, E.; Noferini, M.; Vidoni, S.; Costa, G. Modeling Fruit Ripening for Improving Peach Homogeneity in Planta. Sci. Hortic. 2013, 159, 166–171. [Google Scholar] [CrossRef]
  25. Bonora, E.; Stefanelli, D.; Costa, G. Nectarine Fruit Ripening and Quality Assessed Using the Index of Absorbance Difference (IAD). Int. J. Agron. 2013, 2013. [Google Scholar] [CrossRef]
  26. Calzarano, F.; Di Marco, S. Further Evidence That Calcium, Magnesium and Seaweed Mixtures Reduce Grapevine Leaf Stripe Symptoms and Increase Grape Yields. Phytopathol. Mediterr. 2018, 57, 459–471. [Google Scholar] [CrossRef]
  27. Ribera-Fonseca, A.; Noferini, M.; Jorquera-Fontena, E.; Rombolà, A.D. Assessment of Technological Maturity Parameters and Anthocyanins in Berries of Cv. Sangiovese (Vitis Vinifera L.) by a Portable Vis/NIR Device. Sci. Hortic. 2016, 209, 229–235. [Google Scholar] [CrossRef]
  28. DeLong, J.; Prange, R.; Harrison, P.; Nichols, D.; Wright, H. Determination of Optimal Harvest Boundaries for HoneycrispTM Fruit Using a New Chlorophyll Meter. Can. J. Plant Sci. 2014, 94, 361–369. [Google Scholar] [CrossRef]
  29. Nyasordzi, J.; Friedman, H.; Schmilovitch, Z.; Ignat, T.; Weksler, A.; Rot, I.; Lurie, S. Utilizing the IAD Index to Determine Internal Quality Attributes of Apples at Harvest and after Storage. Postharvest Biol. Technol. 2013, 77, 80–86. [Google Scholar] [CrossRef]
  30. Peifer, L.; Ottnad, S.; Kunz, A.; Damerow, L.; Blanke, M. Effect of Non-Chemical Crop Load Regulation on Apple Fruit Quality, Assessed by the DA-Meter. Sci. Hortic. 2018, 233, 526–531. [Google Scholar] [CrossRef]
  31. Nagpala, E.G.L.; Noferini, M.; Farneti, B.; Piccinini, L.; Costa, G. Cherry-Meter: An Innovative Non-Destructive Device for Cherry Fruit Ripening and Quality Assessment. In Proceedings of the VII International Cherry Symposium, Plasencia, Spain, 23–27 June 2013; pp. 23–27. [Google Scholar]
  32. Gudenschwager, O.; González-Agüero, M.; Defilippi, B.G. A General Method for High-Quality RNA Isolation from Metabolite-Rich Fruits. S. Afr. J. Bot. 2012, 83, 186–192. [Google Scholar] [CrossRef]
  33. Harb, J.; Saleh, O.; Kittemann, D.; Neuwald, D.A.; Hoffmann, T.; Reski, R.; Schwab, W. Changes in Polyphenols and Expression Levels of Related Genes in “Duke” Blueberries Stored under High CO2 Levels. J. Agric. Food Chem. 2014, 62, 7460–7467. [Google Scholar] [CrossRef]
  34. R: A Language and Environment for Statistical Computing 2021. Available online: https://www.r-project.org (accessed on 15 January 2023).
  35. Bonora, E.; Noferini, M.; Stefanelli, D.; Costa, G. A New Simple Modeling Approach for the Early Prediction of Harvest Date and Yield in Nectarines. Sci. Hortic. 2014, 172, 1–9. [Google Scholar] [CrossRef]
  36. Curtis, P.J.; Van Der Velpen, V.; Berends, L.; Jennings, A.; Feelisch, M.; Umpleby, A.M.; Evans, M.; Fernandez, B.O.; Meiss, M.S.; Minnion, M.; et al. Blueberries Improve Biomarkers of Cardiometabolic Function in Participants with Metabolic Syndrome-Results from a 6-Month, Double-Blind, Randomized Controlled Trial. Am. J. Clin. Nutr. 2019, 109, 1535–1545. [Google Scholar] [CrossRef] [PubMed]
  37. Jennings, A.; Welch, A.A.; Spector, T.; Macgregor, A.; Cassidy, A. Intakes of Anthocyanins and Flavones Are Associated with Biomarkers of Insulin Resistance and Inflammation in Women. J. Nutr. 2014, 144, 202–208. [Google Scholar] [CrossRef]
  38. Li, X.; Jin, L.; Pan, X.; Yang, L.; Guo, W. Proteins Expression and Metabolite Profile Insight into Phenolic Biosynthesis during Highbush Blueberry Fruit Maturation. Food Chem. 2019, 290, 216–228. [Google Scholar] [CrossRef] [PubMed]
  39. Ribera, A.E.; Reyes-Díaz, M.; Alberdi, M.; Zuñiga, G.E.; Mora, M.L. Antioxidant Compounds in Skin and Pulp of Fruits Change among Genotypes and Maturity Stages in Highbush Blueberry (Vaccinium Corymbosum L.) Grown in Southern Chile. J. Soil Sci. Plant Nutr. 2010, 10, 509–536. [Google Scholar] [CrossRef]
  40. Jaakola, L.; Määttä, K.; Pirttilä, A.M.; Törrönen, R.; Kärenlampi, S.; Hohtola, A. Expression of Genes Involved in Anthocyanin Biosynthesis in Relation to Anthocyanin, Proanthocyanidin, and Flavonol Levels during Bilberry Fruit Development. Plant Physiol. 2002, 130, 729–739. [Google Scholar] [CrossRef]
Figure 1. Four maturity stages of blueberry fruit examined in this study.
Horticulturae 09 00501 g001
Figure 2. Chlorophyll absorbance (IAD) of blueberry fruit from different maturity stages. Data are means ± standard errors of 10 replicates. Data with different letters between maturity stages are significantly different (Duncan’s test; p < 0.05).
Horticulturae 09 00501 g002
Figure 3. Relationship between L*, C* and fruit firmness and IAD values. Dot line, linear regression line; dots, individual fruit; circles, fruit from individual maturity stage.
Horticulturae 09 00501 g003
Figure 4. Total sugar and organic acid contents and sugar/organic acid ratio in blueberry fruit at different maturity stages. Data are means ± standard errors of four replicates. Data with different letters between maturity stages are significantly different (Duncan’s test; p < 0.05). Dot line, linear regression line.
Horticulturae 09 00501 g004
Figure 5. Phenolic acids, flavan-3-ols, flavonols, anthocyanins, and total analyzed phenolics (TAP) in blueberry fruit at different maturity stages. Data are means ± standard errors of four replicates. Data with different letters between maturity stages are significantly different (Duncan’s test; α < 0.05).
Horticulturae 09 00501 g005
Figure 6. Relative expression of anthocyanidin synthase (ANS) in blueberry fruit at different maturity stages. Data are means ± standard errors of five replicates. Data with different letters between maturity stages are significantly different (Duncan’s test; α < 0.05).
Horticulturae 09 00501 g006
Table 1. Range of IAD values for individual maturity stages of ‘Aurora’ fruit.
Maturity StageIAD
Immature1.51–1.70
Light purple1.71–1.90
Darker purple1.91–2.10
Fully ripe2.11–2.30
Table 2. Peel color and fruit firmness of blueberry fruit at different maturity stages.
ImmatureLight PurpleDarker PurpleFully RipeSign.
L* (lightness)58.03 ± 1.52 a38.76 ± 1.44 b35.50 ± 1.23 c32.45 ± 0.98 d***
C* (chroma)34.10 ± 1.23 a16.03 ± 1.91 b6.73 ± 0.79 c3.49 ± 0.34 d***
h° (hue angle)94.94 ± 1.59 c14.31 ± 2.13 d350.5 ± 2.95 a262.1 ± 3.99 b***
Firmness (N)2.13 ± 0.26 a0.47 ± 0.09 b0.42 ± 0.07 b0.23 ± 0.04 c***
Data are means ± standard errors of 10 replicates. Data with different letters between maturity stages are significantly different (Duncan’s test; α< 0.05). *** p < 0.001.
Disclaimer/Publisher’s Note: The statements, opinions and data contained in all publications are solely those of the individual author(s) and contributor(s) and not of MDPI and/or the editor(s). MDPI and/or the editor(s) disclaim responsibility for any injury to people or property resulting from any ideas, methods, instructions or products referred to in the content.

