Article

Multivariate Assessment of Genetic Relationships between Two Streptocarpus Cultivars and Their F1 Progenies Using Morphological Characteristics and SCoT Molecular Markers

Department of Horticulture and Landscape, Faculty of Horticulture and Business in Rural Development, University of Agricultural Sciences and Veterinary Medicine, 3-5 Mănăştur Street, 400372 Cluj-Napoca, Romania
*
Authors to whom correspondence should be addressed.
Horticulturae 2023, 9(4), 497; https://doi.org/10.3390/horticulturae9040497
Submission received: 3 March 2023 / Revised: 12 April 2023 / Accepted: 13 April 2023 / Published: 15 April 2023

Abstract

:
Streptocarpus is a very popular houseplant with colorful flowers, and has thus piqued the curiosity of plant enthusiasts and breeders. In this study, “Natalie” and “Bristol’s Gum Drop” were artificially hybridized to study the influence of the parental reciprocal crosses (P1×P2 and P2×P1) on vegetative and generative morphological traits of F1 progeny. Mean comparisons for morphological characters of parents and F1 plants from both crosses revealed that F1 plants were able to express hybrid vigor for several valuable morphological characteristics. Pearson correlations showed both significant negative and positive correlations between morphological traits of F1 plants from P1×P2 cross, while in the case of P2×P1 no significant negative correlations were observed (p < 0.05). The Start Codon Targeted (SCoT) genetic profiles of the F1 plants with the identifiers P1×P2.19 and P1×P2.35 were remarkably similar, and they grouped with the maternal parent in a small group, supporting the findings of clustering based on morphological data. The parental combination P2×P1 revealed the presence of closely related progenies to the paternal parent, namely P2×P1.16 and P2×P1.5. Two F1 plants named P1×P2.33 and P2×P1.21 were selected based on their phenotypic characteristics and SCoT molecular fingerprinting. These selected genotypes will be tested in our future breeding programs with the aim to create and promote new valuable Streptocarpus cultivars.

1. Introduction

Ornamental plants play an essential role in environmental improvement and the enrichment of people’s spiritual lives [1]. The selection of new phenotypes in progeny from controlled intraspecific crosses or even in open-pollinated seedling populations has been, and still is, a successful approach in many ornamental crops. The majority of ornamental species have high levels of heterozygosity, which generates enough variation in F1 populations to allow for the selection of new valuable cultivars [2].
Streptocarpus, commonly known as Cape Primrose, belongs to the Gesneriaceae family, being a complex species of hybrid origin, which is extensively cultivated worldwide as an ornamental potted plant due to its beautiful flowers [3,4,5,6].
In the flower market, morphological features including flower color, fragrance, size, proportionality, and plant vigor are considered key factors when selecting high-quality and commercially valuable Streptocarpus plants [7,8].
In this context, plant breeders developed different breeding strategies to enhance the “beauty of Streptocarpus”. Among them, conventional crosses, including inter- and intraspecific hybridization, represent the main practical approach to develop new Streptocarpus varieties with distinct plant appearance and flower colors [9,10]. Historically, hybridization efforts in Streptocarpus have depended mostly on the technical knowledge of breeders that participated in breeding activities conducted by professional groups with the goal of promoting and sharing plant material [11]. The combination of traditional selection methods and biotechnological approaches are significant breeding strategies for Streptocarpus, to improve the probability of developing novel and valuable genotypes.
The diversity of their genetic backgrounds demonstrated that the majority of the cultivars were the products of extensive hybridization. As a result, even in the non-segregating F1 generation, the inheritance of parental morphological features to the progeny might lead to unanticipated outcomes. Thus, to create new Streptocarpus varieties, it is essential to choose suitable breeding parents, whereas the success of the selection will depend on their capacity to transmit desirable ornamental traits to the F1 progeny [8,12].
This study presents findings regarding the role of parental sex on the inheritance of analyzed morphological characteristics in Streptocarpus F1 progeny obtained from a reciprocal cross between “Natalie” and “Bristol’s Gum Drop” varieties. According to Gai and He (2013) [13], a reciprocal cross is a concept of crossing a pair of parents (P1 and P2) with the sexes reversed and results in two reciprocal crosses (P1×P2; P2×P1). The F1 progeny may reveal different morphological characteristics compared to the parents and other F1 individuals from both crosses [14].
In classical breeding programs, the ornamental value of Streptocarpus hybrids was mostly evaluated using morphological traits [15]. Applying innovative breeding strategies that combine morphological traits with molecular markers allows a more precise and efficient characterization of genitors and their F1 progeny [16]. Recent studies demonstrated that SCoT markers proved to be a trustworthy and affordable method for determining the genetic relationships of ornamental plants, compared with other PCR-based molecular markers [17,18,19,20].
Thus, the present study aimed to identify genetic variations between two genitors and their Streptocarpus F1 progenies from a reciprocal cross using both morphological characteristics and SCoT markers. Furthermore, the relationships between the aforementioned variables was evaluated using multivariate analysis. The application of these non-conventional breeding strategies will facilitate the selection of the initial breeding material to obtain new and valuable Streptocarpus varieties.

2. Materials and Methods

2.1. Plant Material

In this study, two Streptocarpus cultivars (”Natalie” and ”Bristol’s Gum Drop”) were used as genitors for artificial pollination using a reciprocal crossing design. The genitors were purchased from two certified nurseries from Naples, NY, USA, and North Wales, UK, respectively. ”Natalie” is a variety created by Rex and Lynne Dibley [15]. The pansy-shaped flower’s corolla has a pale violet color and features a creamy yellow throat on the lower flower lobes and deep indigo streaks radiating from the throat (Figure 1). Bristol’s Gum Drop is a very floriferous variety hybridized by Dr. Ralph Robinson [11]. The pansy-shaped flowers have a dark burgundy color and features two thin white bars from the throat of each flower as can be observed in Figure 2. It should be noted that before artificial pollination, the genitors were inbred by self-pollination for two generations to guarantee a high level of homozygosity.

2.2. Artificial Hybridization Methodology

Two reciprocal crosses, coded P1×P2 (♀“Natalie” × ♂“Bristol’s Gum Drop”) and P2×P1 (♀“Bristol’s Gum Drop” × ♂“Natalie”), were made in June 2020 in the Genetics and Plant Breeding Laboratory of the BIOCERA-Research Centre for Biotechnology in Agriculture from Institute of Life Sciences, University of Agriculture Sciences and Veterinary Medicine Cluj-Napoca, Romania.
Fresh pollen grains from anthers were collected at anthesis, dried, and stored at 4 °C before performing the germination test and hand pollination. The viability of pollen of reciprocal father’s genitors was tested according to the methodology described by Afkhami-Sarvestani et al. (2012) and Hârţa et al. (2020) [9,16]. Hereinafter, the flower buds of the maternal plants were emasculated at the early bud stage. Hand pollination was performed 3–5 days after emasculation when the stigmas had begun to excrete secretions.
Twelve flowers for each maternal plant were pollinated and were bagged immediately after pollination. In order to save all the seeds, shortly before maturity, the capsules were isolated using a paper bag and closed by clips. The twisted capsules were harvested after reaching full maturation (approx. two months after bloom). Two twisted capsules with seeds were obtained from each cross. The seeds (approx. 100 seeds/cross) were sown in November 2020 in polystyrene boxes with sowing substrates (peat and sand 1:1). The boxes were kept at 20 ± 2 °C with a high relative humidity (86–88%) in the greenhouse. After two months, the seedlings were transferred to Jiffy peat pellets (Ø = 3.0 cm, Fitomag, Cluj-Napoca, Romania) and after one month to plastic pots (Ø = 9.0 cm) filled with peat, vermiculite, and sand mixture (1:1:1). The seedlings that resulted from reciprocal crosses were grown as potted plants in a greenhouse under natural photoperiod conditions. The first blooms were observed during June–July 2021.

2.3. Morphological Characterization of Parents and F1 Plants

To perform the mean comparison between parents and F1 progeny from each reciprocal cross and to provide relevant results of the morphological dataset, the genitors and all F1 individuals (36 and 33, respectively) were propagated by leaf cuttings and grown under the aforementioned greenhouse conditions.
The following characteristics that highly define the ornamental value of Streptocarpus plants were analyzed: number of leaves/plant (NL); length of leaves/plant (LL) (cm); number of peduncles/plants (NP); number of flowers/peduncles (NFP); number of flowers/plant (NF), length of peduncle (LP) (cm); length of corolla tube (LCT) (cm); width of flower (WF) (cm) and flowering time (FT) (days). The width of flower was measured perpendicular to the plane of symmetry, at the widest part, according to Lázaro and Totland (2014) [21] for zygomorphic flower characterization. Flowering time was considered from the first flower occurrence until 50% of the flowers dropped or wilted (approx. 28 days, depending on the specific flowering characteristics of each parental variety).
Additionally, flower color (FC) was considered another important morphological trait that greatly defines the ornamental value of F1 plants. It is important to note that all plants selected for morphological analysis displayed a consistent bloom color pattern that matched the F1 individuals and served as the starting point for vegetative propagation.
Flower color was determined based on the Royal Horticultural Society (RHS) color chart [22] and the Universal Color Language (UCL) name [23]. The RHS color codes were then converted to hexRGB values [24] to generate the images showing the flower color variation in the F1 progeny [21] (Supplementary Table S1).

2.4. SCoT Molecular Analysis

To assess the genetic relationships between parents and F1 individuals from each reciprocal cross, SCoT molecular markers were used in this study.
Isolation of total genomic DNA was performed from young leaves of Streptocarpus from each parent plant and F1 individuals using the protocol published by Lodhi et al. (1994) [25] and improved by Pop et al. (2003) [26] and Bodea et al. (2016) [27]. DNA purity and concentration were determined with a NanoDrop-1000 spectrophotometer (Thermo Fisher Scientific, Waltham, USA). To perform the SCoT analysis, DNA samples were diluted to 50 ng/µL using double-distilled water.
Out of the 15 SCoT primers used in this study to amplify all 71 samples analyzed, only nine primers yielded clear and reproducible banding patterns with high levels of polymorphism. These nine primers were further used to establish the genetic relationships between parents and F1 plants at the DNA molecular level (Supplementary Table S2).
Reaction mixtures (total volume of 15 µL) consisted of 3 μL DNA, 2.5 μL MgCl2, 2.5 μL GoTaq Flexi Green buffer, 0.25 μL dNTP mix, 0.15 μL of GoTaq Flexi polymerase (Promega, Madison, Wisconsin, USA), 1 μL SCoT primer (GeneriBiotech, Hradec Králové, Czechia) and 5.6 μL distilled H2O for the PCR reactions (Sigma-Aldrich GmbH, Hamburg, Germany). PCR reactions were carried out in a gradient thermal cycler named SuperCycler Trinity (Kyratec, Queensland, Australia), using the PCR program as described by Collard and Mackill (2009) [28]. The PCR temperature cycling conditions were: (a) initial denaturation at 94 °C for 5 min, (b) 35 cycles of denaturation at 94 °C for 1 min, annealing at 50 °C for 1 min and elongation at 72 °C for 2 min, and (c) the final elongation step of 5 min at 72 °C. The separation of the amplified products was performed by electrophoresis on 1.6% agarose gels (Promega, Madison, WA, USA) stained with RedSafeTM Nucleic Acid staining solution (iNtRON Biotech, Seoul, Republic of Korea) in 1X TAE (Trisacetate-EDTA buffer), at 100 V and 176 mA for 2.5–3 h. The electrophoretic profiles were visualized in UVP Biospectrum AC Imaging System (UVP BioImaging Systems, Upland, CA, USA). PCR amplifications were repeated twice for each primer combination to ensure the reproducibility of results.

2.5. Data Processing and Analysis

The experiment was organized in a completed randomized block design (CRBD) with three replications. The parents and F1 cloned plants from two reciprocal crosses were distributed in six blocks and twelve groups. Observations were recorded June–July 2022. All analyzed characteristics were subsequently processed as mean values.
Morphological data analysis was carried out using XL-Real Statistics and XLSTAT Cloud in Excel. First, analysis of variance (ANOVA) was performed using the randomized complete block design option with Bonferroni alpha correction for contrasts and one missing value. When the null hypothesis was rejected, Tukey’s post hoc test was applied to determine statistically significant differences between the means (p < 0.05 significance level).
For molecular data analysis, SCoT gel images were analyzed using TotalLab TL120 software (Nonlinear Dynamics, Newcastle upon Tyne, UK). The bands of amplified fragments were scored as present (1) or absent (0) for each of the SCoT primers and transferred to a binary matrix using MS Excel. The total number of bands (TNB), number of polymorphic bands (NPB), and percentage of polymorphic bands (PPB) were counted. Polymorphism levels were estimated by dividing the NPB by the total number of scored bands (TNB), PPB = (NPB/TNB) × 100. To estimate the effectiveness of each SCoT marker, the polymorphic information content (PIC) was calculated using the following formula for dominant markers published by Serrote et al. (2020) [29]:
PIC = 1 − (p2 + q2), where p is the frequency of bands present and q is the frequency of bands absent, from the binary matrix generated by electrophoresis gels. Pearson correlations (simple, respectively phenotypic correlations between morphological parameters) were assessed for each reciprocal cross and graphically represented using PAST software (PAle-ontological STatistics (PAST) Version 4.11, Natural History Museum, University of Oslo, Oslo, Norway) [30]. The same software was used to perform a multivariate Unweighted Pair Group Method with Arithmetic mean (UPGMA) cluster analysis to establish the genetic relationships between parents and F1 plants from each reciprocal cross, based on the morphological and molecular data, using Euclidean distance indices. To standardize the morphological dataset, the PAST-Transform menu with the Row Normalize Length tool was used.

3. Results

3.1. Reciprocal Artificial Hybridization

The pollen viability test revealed that both varieties selected as genitors (”Natalie” and ”Bristol’s Gum Drop”) presented a relatively high germination capacity of pollen grains, with no considerable differences in pollen viability observed. The percentages for “Bristol’s Gum Drop” and “Natalie” were 69.5% and 65.5%, respectively. These results are in agreement with those reported in a previous study by Hârţa et al., 2020 [13], where the pollen viabilities of “Slumber Song” and “Snow White“ varieties were evaluated and further used as male genitors for intraspecific hybridization.
In greenhouse conditions, three months after sowing, a number of 84 F1 seedlings were obtained from the first reciprocal cross (P1×P2) and 52 seedlings from the second cross (P2×P1). However, the P1×P2 generated a number of 36 F1 individuals that initially bloomed, whereas the P2×P1 produced 33 F1 individuals that displayed first flowers.

3.2. Morphological Characterization of Parents and F1 Progeny from Reciprocal Crosses

The summary of variance analysis with regard to mean squares of morphological characteristics is presented in Table 1. By means of the F-test (p < 0.05), a significant difference was found between genotypes for all the morphological parameters evaluated, indicating the existence of genetic variability between Streptocarpus genotypes.
The comparisons between the Streptocarpus parents (P1-“Natalie”; P2-“Bristol’s Gum Drop”) and the F1 progeny from each reciprocal cross (represented by F1 cloned plants) were made based on the mean values recorded, as shown in Table 2.
The results of this study revealed that F1 plants obtained due to P1×P2 and P2×P1 crosses showed significantly higher mean values (10.95 ± 0.85; 11.34 ± 0.76) compared with the high-value parent P1 (10.53 ± 0.28) regarding the number of leaves/plant (NL). Despite the fact that the mean values for leaf length (LL) significantly differ in both reciprocal crosses (20.48 ± 1.2 and 22.54 ± 0.95), the values were within the high-value parent P1’s mean range, (25.19 ± 0.25) but not P2×P1 (Table 2).
Regarding the characteristics of flower peduncles, the highest mean value of length of peduncle (LP) was recorded in F1 plants obtained from P2×P1 (20.48 ± 0.71). This mean value was significantly higher compared to the mean value recorded in the high-value parent (P1). In the case of P1×P2, the average value of LP did not exceed the average-value of the parents, as shown in Table 2.
The recorded mean values of the F1 plants from both reciprocal crosses (8.99 ± 0.77 and 9.46 ± 0.46) showed statistically significant differences compared to the high-value parent P2 (8.59 ± 0.27) considering the average number of peduncles/plant (NP). The highest mean value in terms of the number of flowers/peduncle was recorded in F1 plants from the P1×P2 (4.06 ± 0.74) cross, but no statistical differences were recorded as compared to the high-value parent P2 (3.89 ± 0.13). The mean value recorded in P2×P1 plants (2.72 ± 0.23) did not exceed the mean-value of the parents (Table 2).
For the measurement of flower size, two biometric parameters were used in this study: length of corolla tube (LCT) and width of flower (WF). Thus, the highest mean values of LCT and WF were recorded in F1 plants from P1×P2 (3.23 ± 0.12 and 5.72 ± 0.31, respectively) with statistical differences compared with the mean value of the high-value parent P1 (3.07 ± 0.10) for LCT, but with non-statistical differences for WF (5.96 ± 0.07). It is worth mentioning that the mean value recorded in P2×P1 plants did not exceed the average-value of the parents for both LCT and WF (Table 2).
An important morphological parameter analyzed in this study was the number of flowers/plant (NF), a very good indicator of ornamental value. The F1 plants from the P1×P2 recorded a mean value (36.19 ± 5.70), which was significantly higher compared to the value of NF of high-value parent (P2), while the mean value recorded in P2×P1 plants (23.93 ± 2.93) did not exceed the mean-value of the parents, as shown in Table 2.
These results suggest that F1 plants from both parental reciprocal crosses were able to express hybrid vigor for several morphological characteristics that are important for their ornamental value, thus the selection of F1 individuals with valuable traits could be successfully achieved.
Regarding the flowering time (FT), P2×P1 plants exhibited their flowers for a longer period of time (in average 21 days) compared with P1×P2 plants (18 days). The best parent for this morphological parameter proved to be “Bristol’s Gum Drop“ (P2), with 27 days of flowering. Statistically, the mean values recorded from P1×P2 and P2×P1 plants did not exceed the mean value of the high-value parent (P2) and also the average-value of the parents.
The color of the flower (FC) is one of the most important morphological characteristics that improve the ornamental value of any Streptocarpus plant. In this study, flower color variation from each reciprocal cross was investigated and the results are presented in Supplementary Table S1. The data recorded due to visual observations classify the F1 plants in two main color groups according to RHS color charts and hexRGB color codes: violet-blue (group I) and red-purple (group II). Out of the 36 F1 plants from the P1×P2, 20 were included in the first group (I), with 16 in the second color group (II). From the P2×P1 cross, out of the 33 F1 plants analyzed, 21 were enlisted in the first color group, while 12 were included in the second color group.
It is worth mentioning that when “Bristol’s Gum Drop” was used as a paternal genitor, 50% of P1×P2 plants featured two thin white or yellow bars on the flower throat. Furthermore, when “Natalie” was used as a parental genitor, 60% of the individuals in the P2×P1 cross exhibited a creamy-yellow or yellow throat with intense colored streaks (in deep indigo or brown) on the lower flower lobe. The representative colors of Streptocarpus F1 flowering plants from both reciprocal crosses are shown in the Supplementary Files Figures S1 and S2.

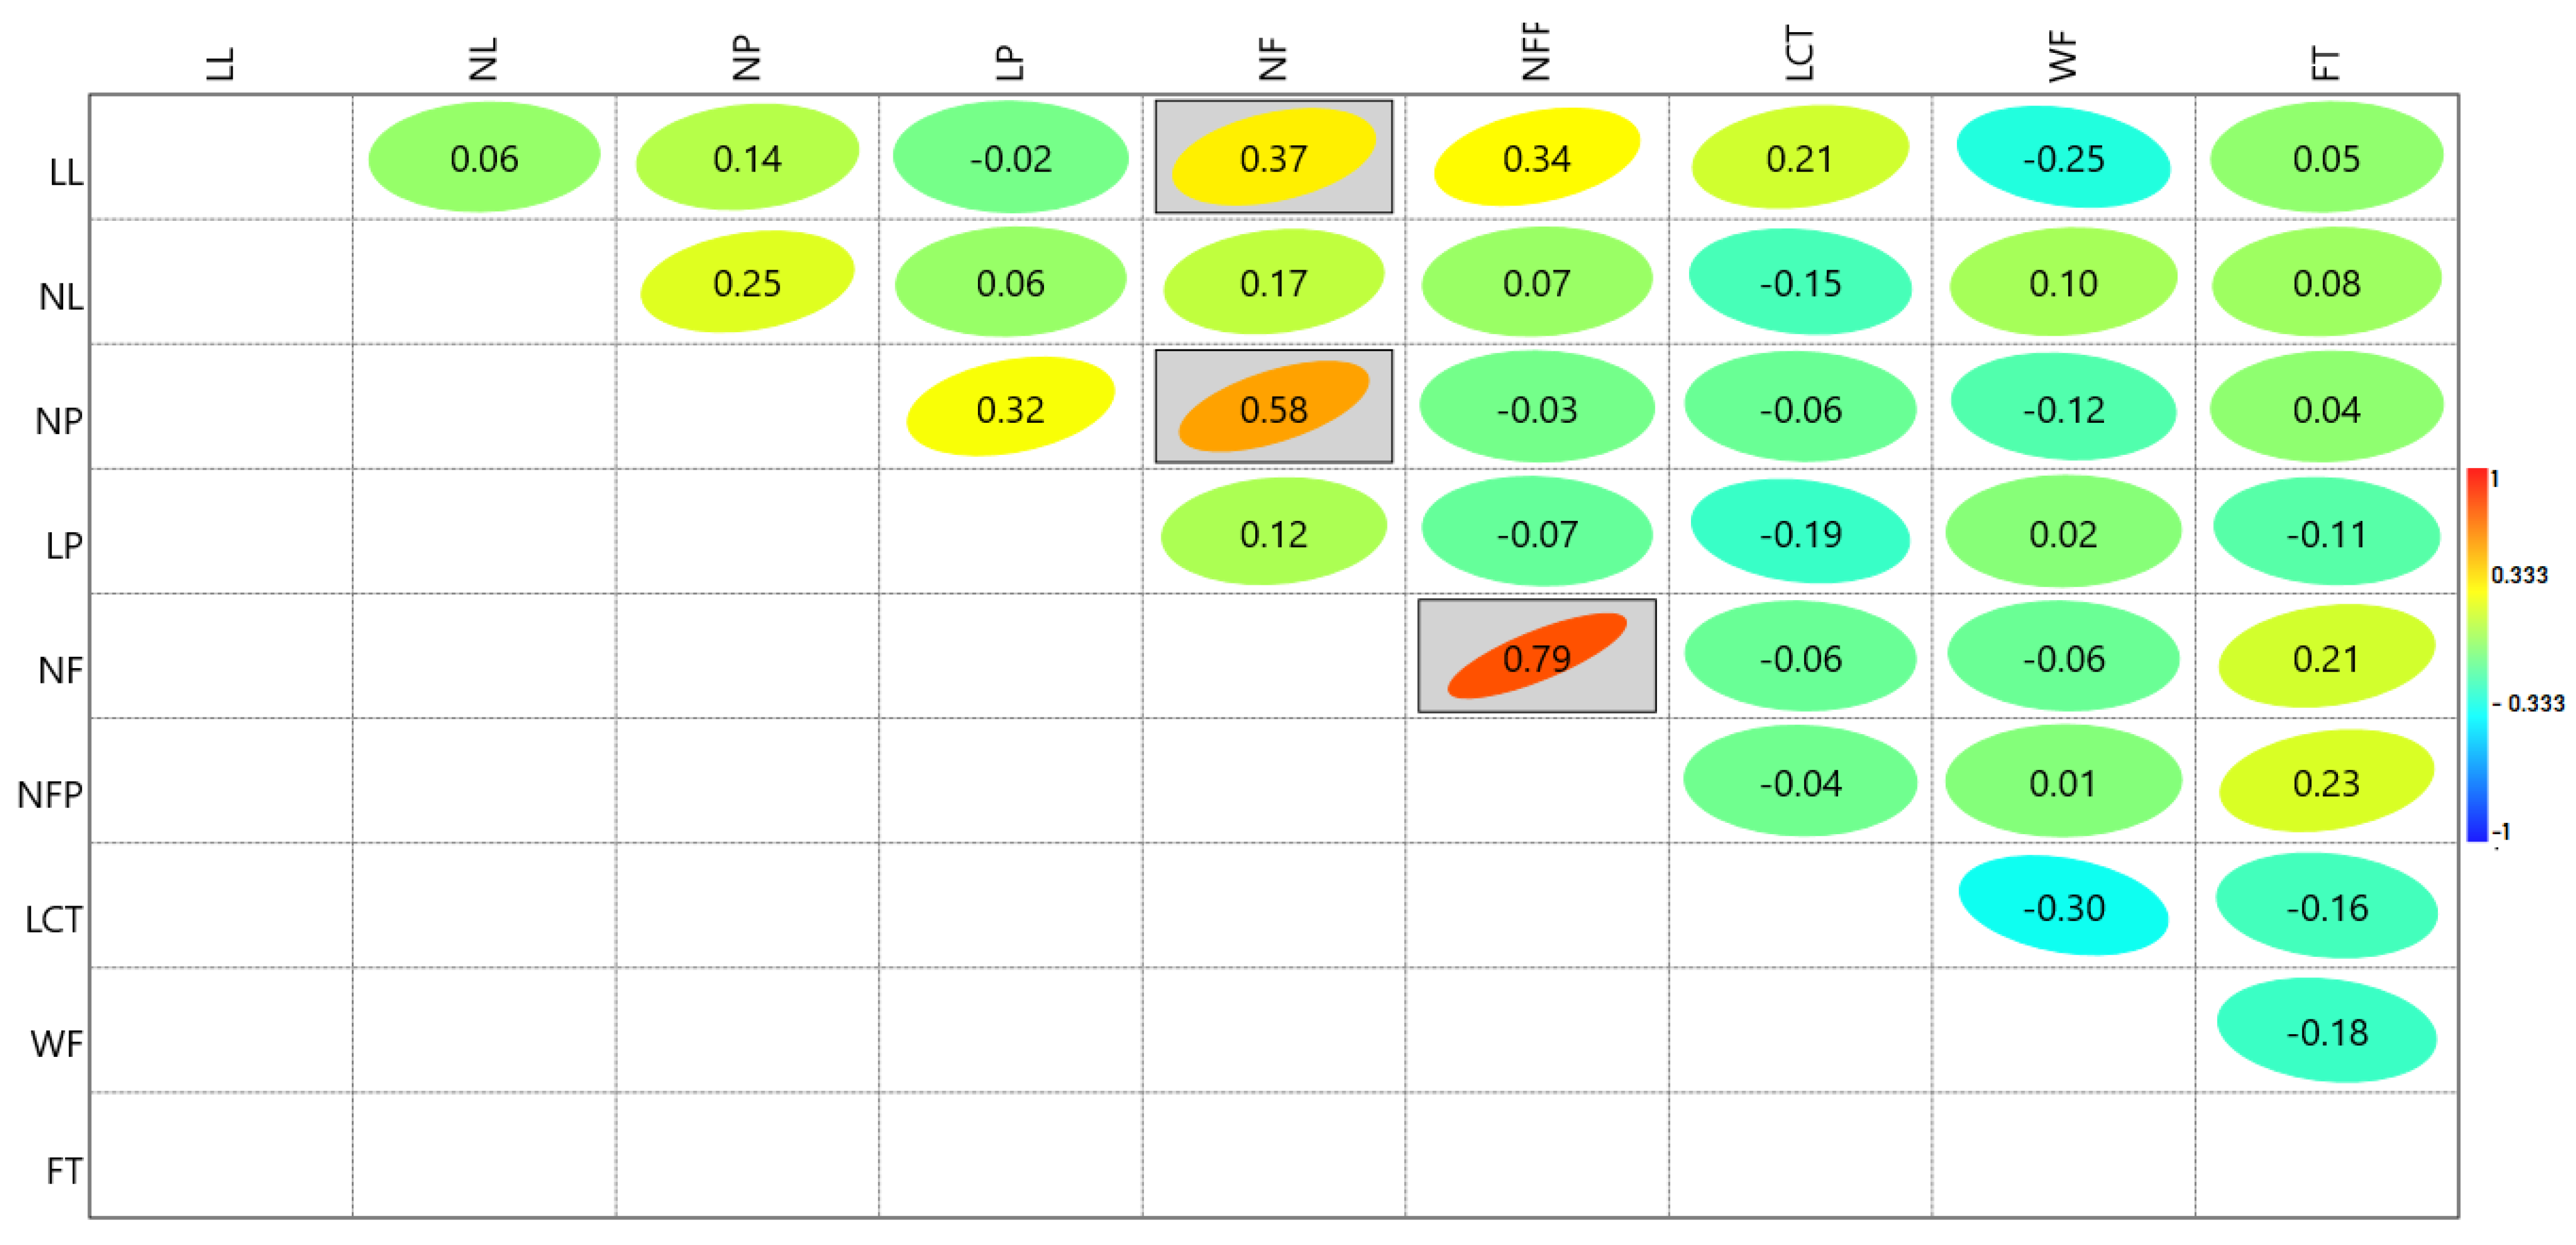
3.3. Correlations between Morphological Parameters of F1 Progeny from Reciprocal Crosses

The correlation between morphological parameters for each pair of Streptocarpus characters was assessed in this study for each parental combination, P1×P2 and P2×P1, respectively.
Pearson correlation coefficients indicate both positive and negative correlations of different intensity at a significance level of 5% (Figure 3 and Figure 4).
In the case of F1 progeny from P1×P2, significant negative correlations were observed between NP and NFP, and LP and LCT, respectively, while positive significant correlations were obtained between NFP and WF, and NF and WF (p < 0.05) (Figure 3).
In terms of the same morphological trait, different results were obtained for P2×P1 progenies (Figure 4) showing no negative correlations between NP and NF, and NF and NFP, respectively.
In the case of P2×P1 plants, a significant positive correlation (p < 0.05) between LL and NF revealed the existence of good correlations between vegetative and reproductive features. These findings are important and provide valuable and useful information for future breeding programs. Furthermore, the correlations between NL and NF were also positive, but not significant (p < 0.05) for both reciprocal crosses (r = 0.24 and r = 0.17), which suggest that the number of leaves positively influences the number of flower peduncles. The number of leaves was also positively correlated with the number of peduncles in Streptocarpus. When a higher number of leaves are developed, a higher number of flowers will be obtained since the induction of peduncles takes place upon the main vein of the leaf lamina.
As shown in Figure 3 and Figure 4, the strongest positive correlations were observed between the number of flowers/plant (NF) and the number of flowers/peduncle (NFP) for both reciprocal crosses (r = 0.89 and r = 0.79, p < 0.05).

3.4. Assessment of Genetic Relationships between Parents and F1 Plants

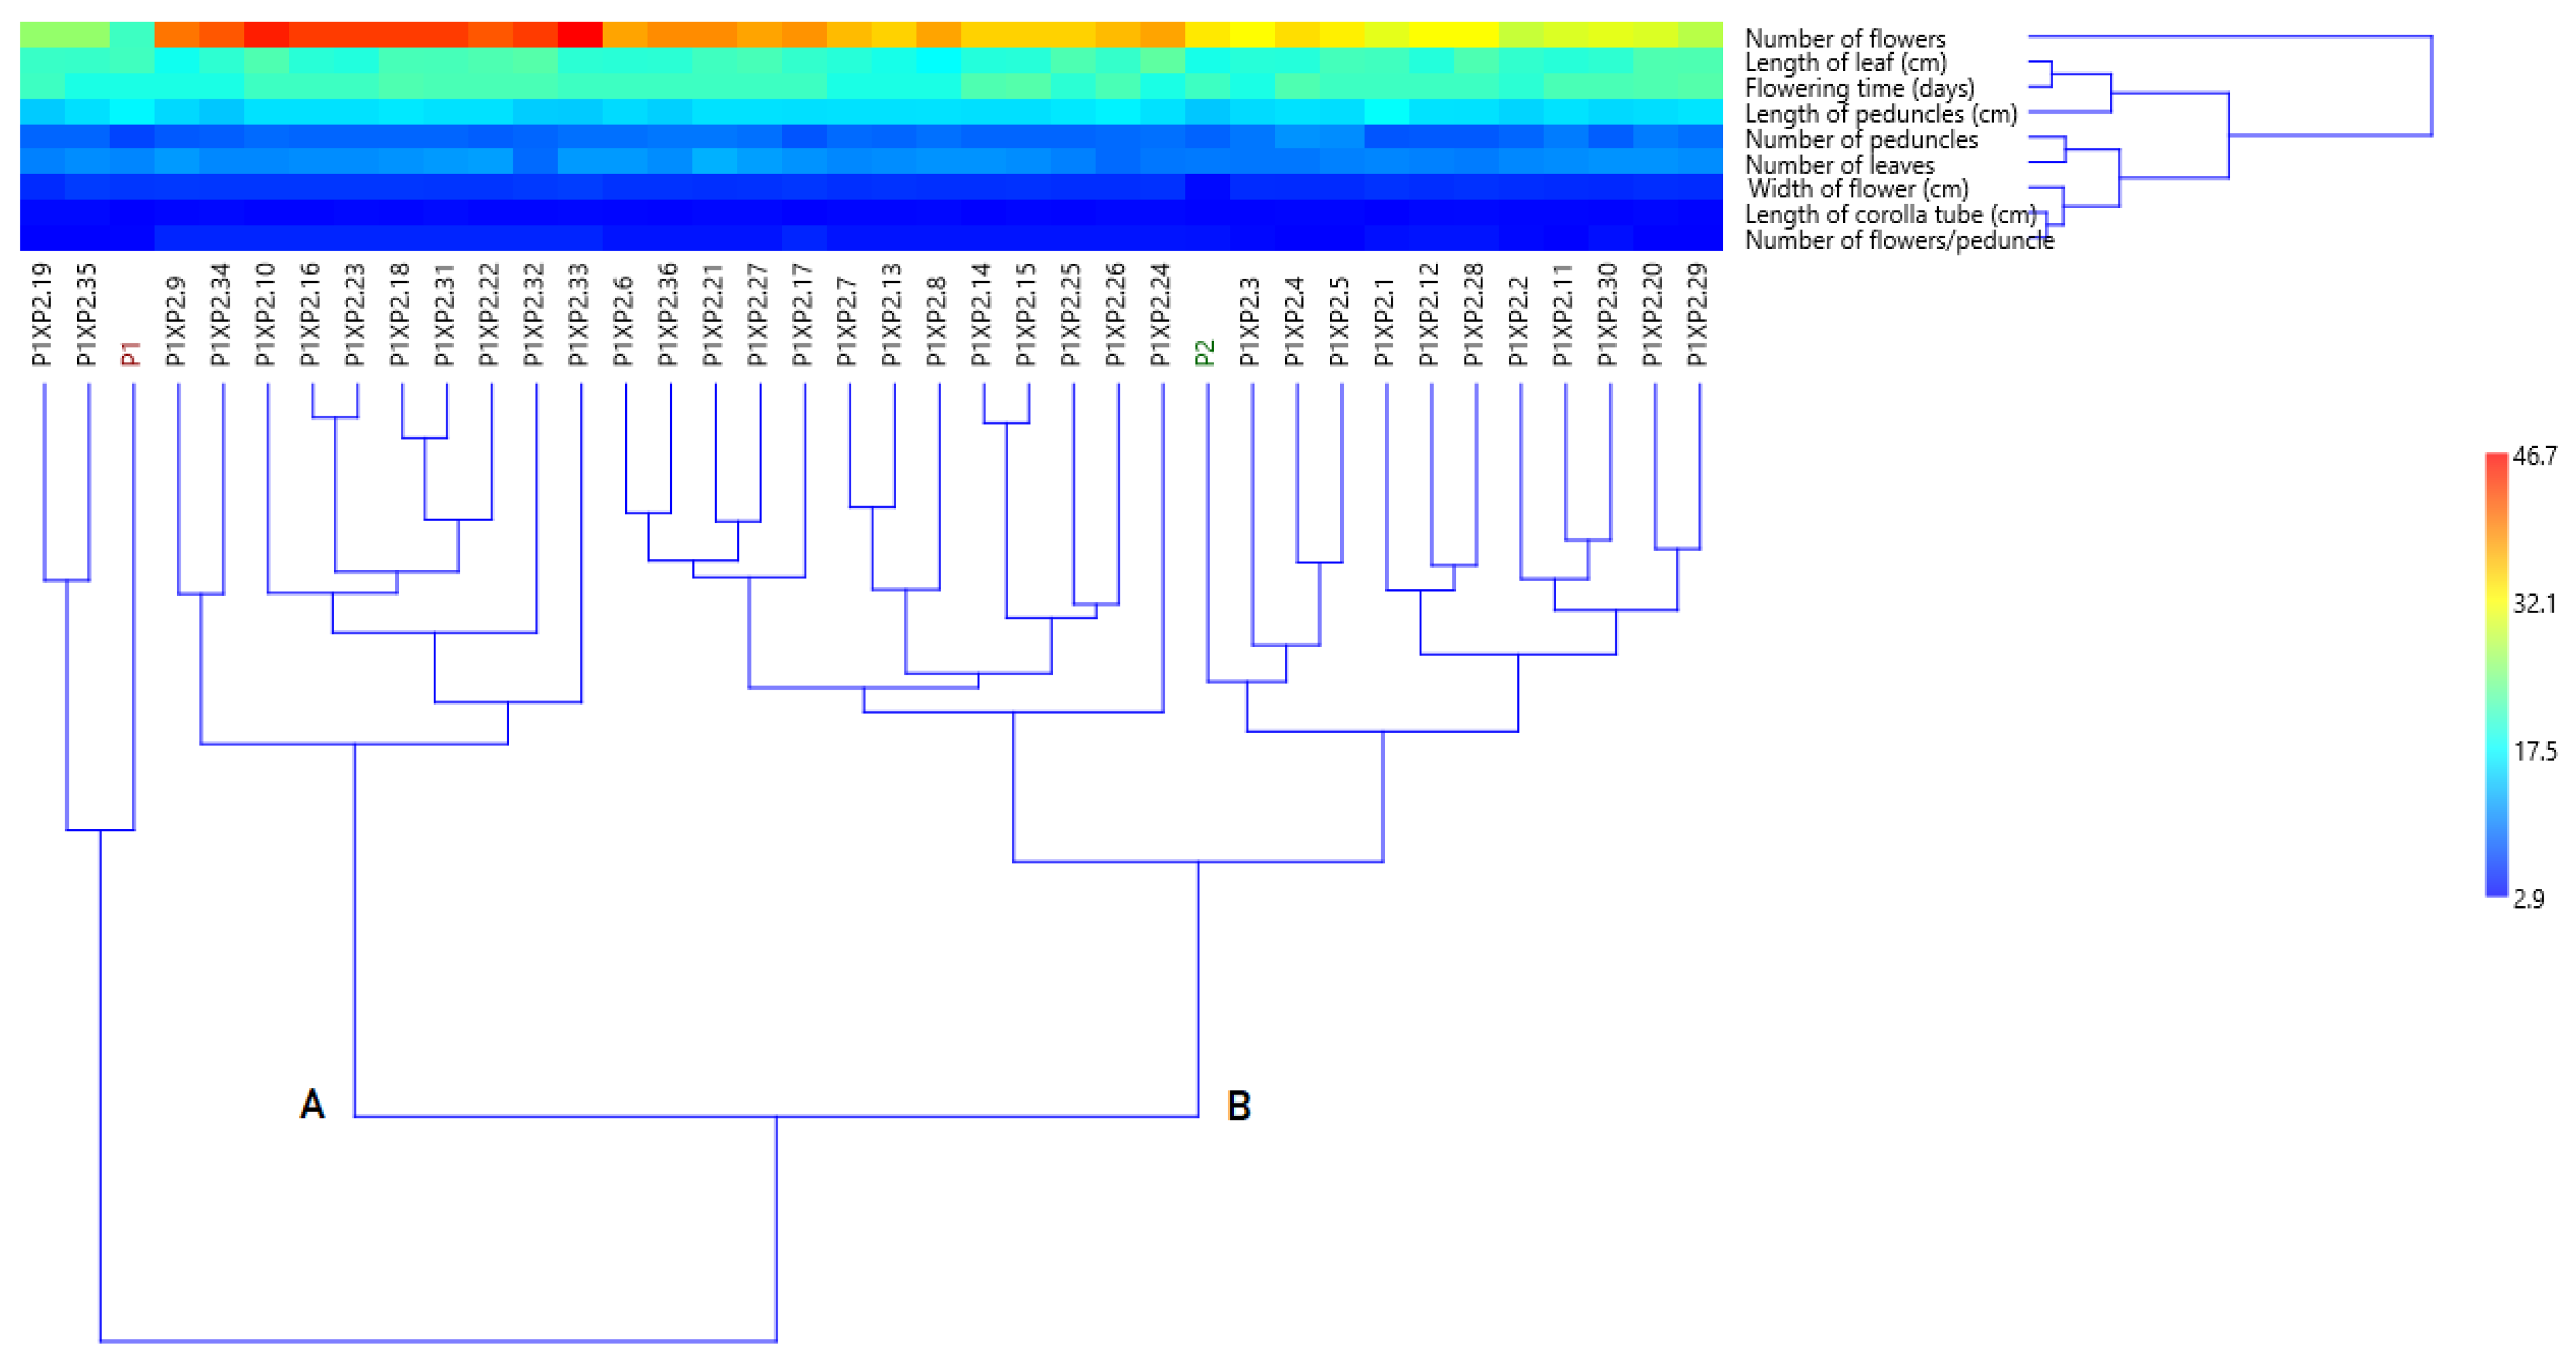
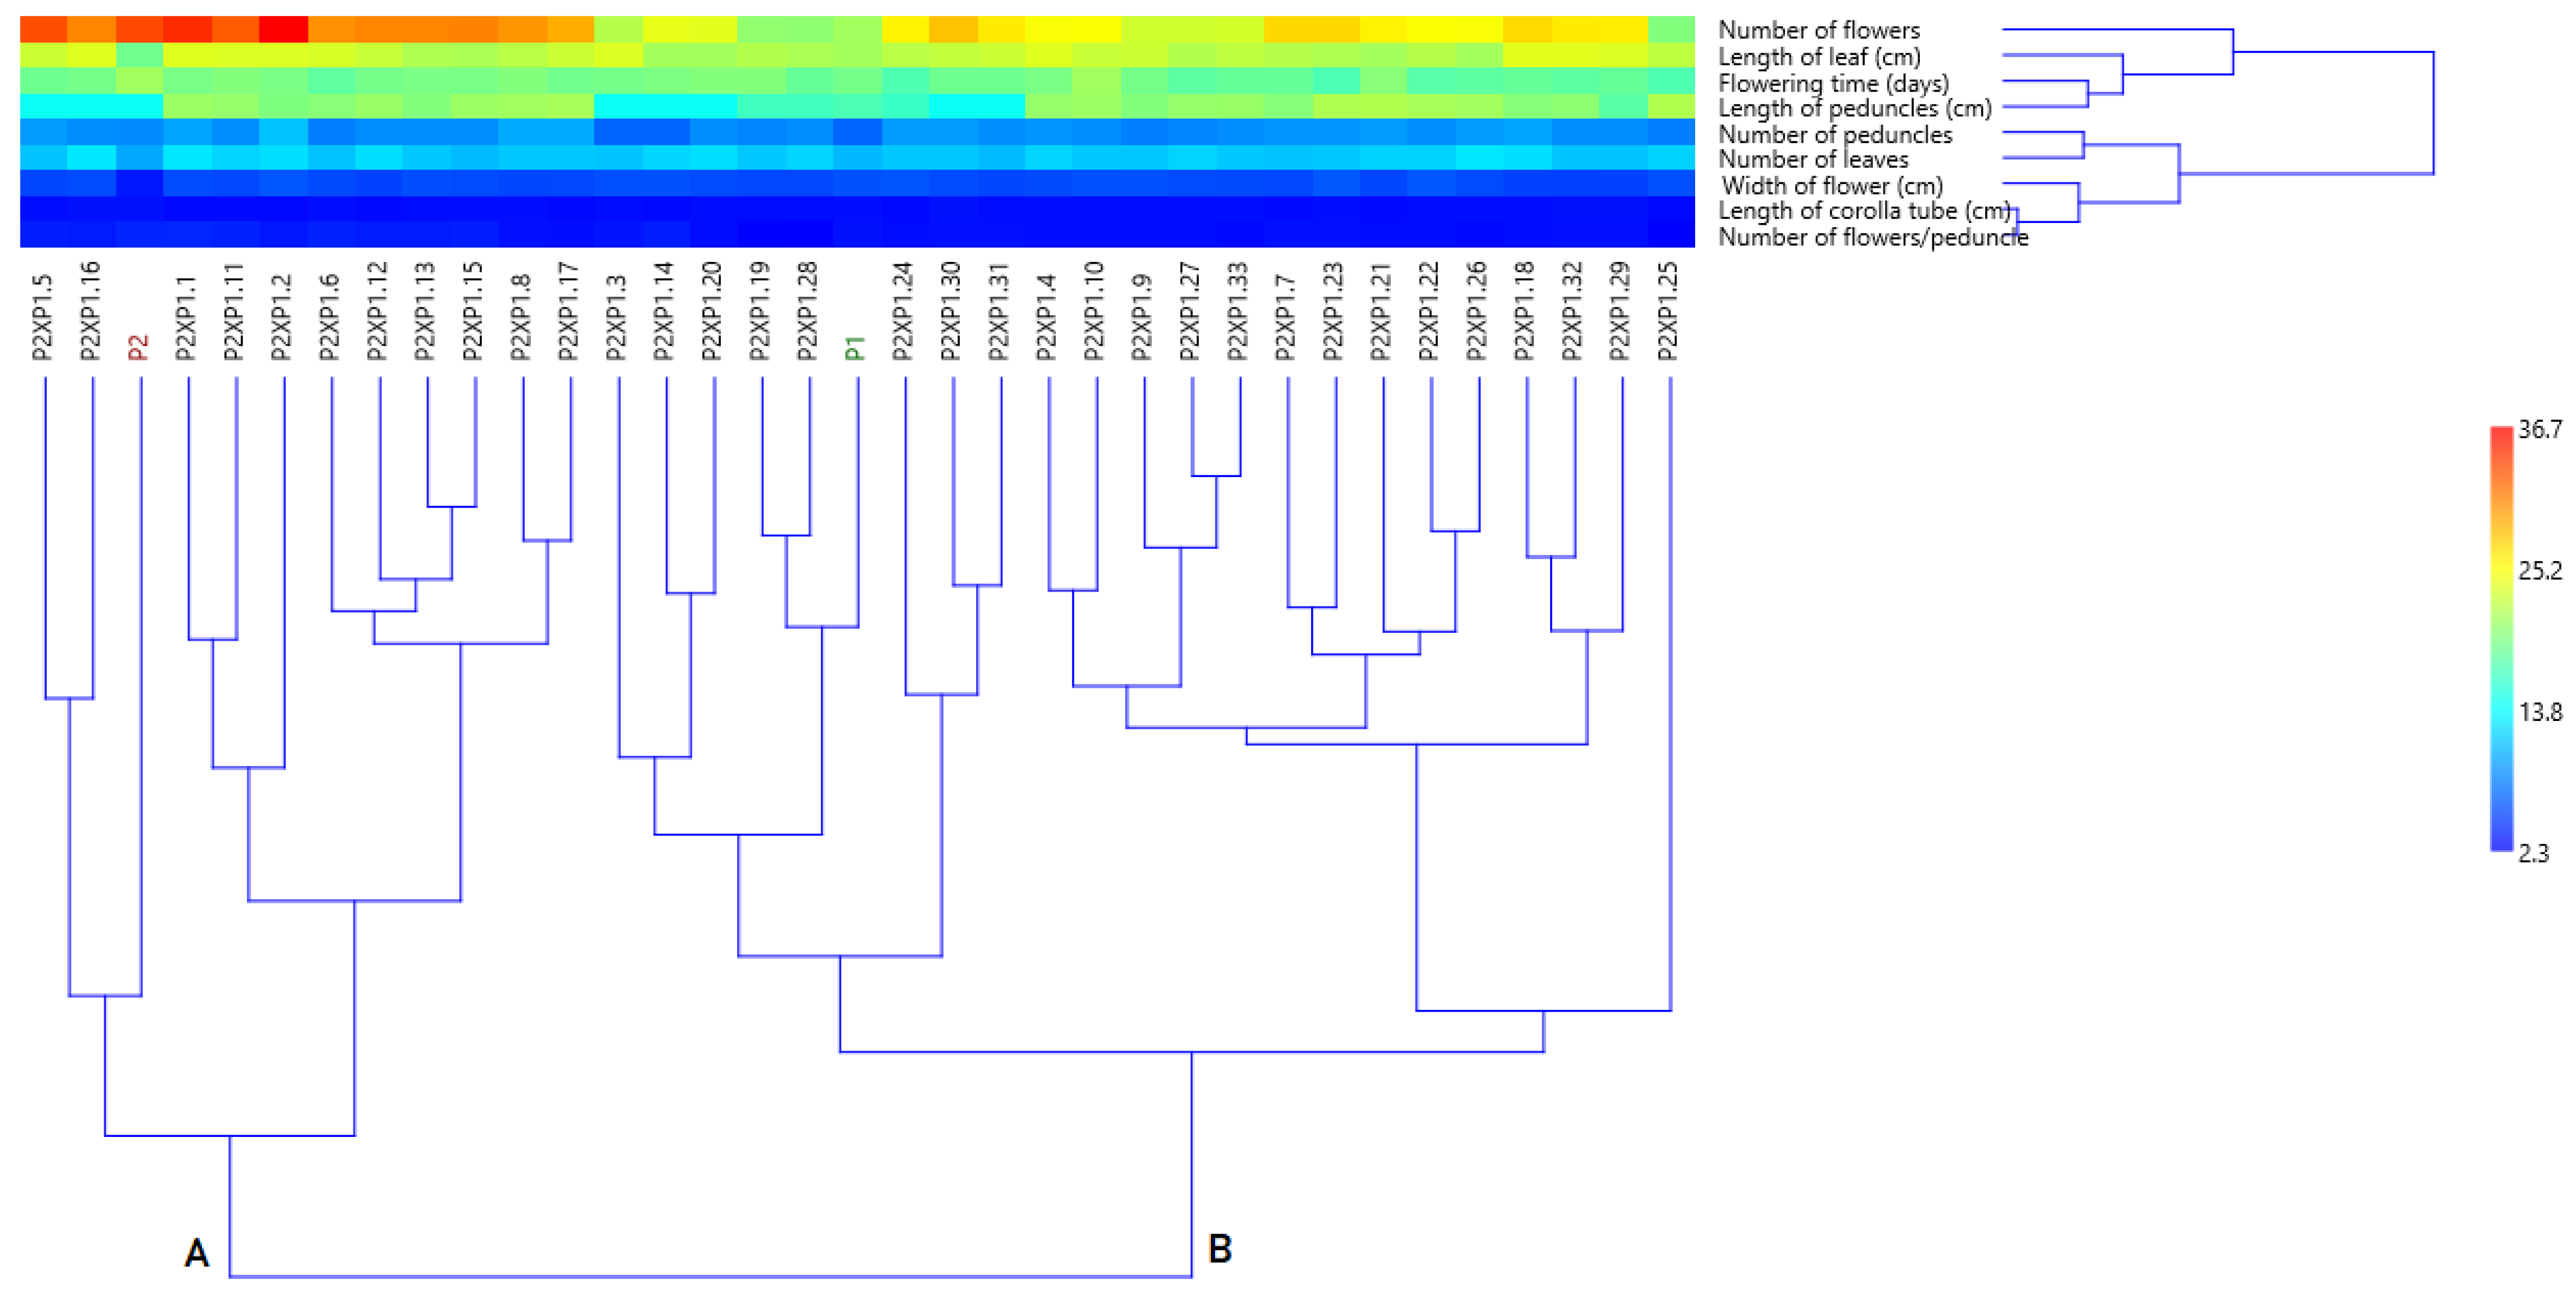
3.4.1. Cluster Analysis Based on Morphological Data

Multivariate analysis (hierarchical clustering using paired group UPGMA, Euclidean similarity index) performed with the mean values of all morphological parameters highlights the relationships both for the F1 plants and their parents (column dendrogram) and for the closeness or distance of the nine analyzed characteristics (row dendrogram), which is also reflected in the heatmap in Figure 5 and Figure 6.
Thus, the grouping pattern of the parents and their F1 progeny from the P1×P2 cross revealed two major clusters marked as A and B (Figure 5). The first cluster of two-way dendrograms grouped ten F1 plants that were characterized by the highest mean values recorded for NFP and NF as compared to the parents and all other F1 plants. In terms of plant appearance, these F1 plants revealed a number of 8–9 flower peduncles at the flowering stage with a length between 14.6 and 15.8 cm and showed the largest flowers recorded in P1×P2 (6.6–6.4 cm in diameter and 3.2–3.5 cm of LCT).
Regarding the flower color, nine F1 plants revealed a strong purplish-red flower color (RHS 60 C and 59D), while the coded P1×P2.33 plant showed a vivid-reddish purple (RHS 74B) color of the flowers. Moreover, this genotype was considered an “outlier” of this main cluster due to the valuable morphological traits revealed by the mean values recorded for NFP (5), WF (6.4 cm) and NF (46.7).
It is noteworthy to mention that the F1 plants coded P1×P2.19 and P1×P2.35 and their maternal parent (“Natalie”) were grouped in a small gap, and this clustering mode is a consequence of their morphological similarities for the analyzed parameters (except the NP, LP, WF, and NF). In terms of flower color, F1 plants (RHS 95D, light-purplish blue) revealed a slightly different color compared to the maternal parent (RHS 91B, light violet).
The second main cluster (B) was composed of two sub-groups: the first included 13 F1 plants (I) and the other (II) the paternal parent (“Bristol’s Gum Drop”) and 11 F1 plants. These sub-clusters presented differences in terms of NF (14.8–17.7), NFP (3.3–4.0), and WP (5.2–5.8). These F1 plants exhibited flower colors with shades that varied from light-violet and strong-purplish-blue (first sub-cluster) to moderate and strong purplish red (second sub-cluster).
As shown in the dendrogram, P1×P2. 24 revealed their “outlier” position on the first sub-cluster of cluster B due to its distinct morphological characteristics. Although this genotype recorded the highest mean value of leaf length (22.9 cm), the leaves were grouped in an uneven rosette with a disproportionate appearance. At flowering, the 35–37 flowers were grouped on 9–10 floral peduncles, each grouping four large flowers colored in light-purplish blue (95D RHS code).
Regarding the clustering pattern of the nine analyzed morphological parameters, the number of flowers/plants, a very good indicator of ornamental value, was clustered distinctly from all other analyzed morphological parameters, as shown in Figure 5.
In the case of the parental combination P2×P1, the grouping pattern of the parents and their F1 progeny also revealed two major clusters each with different secondary ramifications (Figure 6).
The first main cluster (A) included two sub-clusters: the first grouped the maternal parent (“Bristol’s Gum Drop”) with other two F1 plants, and the second included only nine F1 plants. The small group consisting of P2 and two F1 plants (P2×P1.19 and P2×P1.35) revealed their morphological similarities for the analyzed parameters except LL, NL, NP, WF, and flower color (RHS 67B vivid purplish-red for both F1 plants). Conversely, the nine F1 plants that clustered in the second sub-group were characterized by the highest mean values recorded for NP, NFP, and NFP compared to the parents and all other F1 plants. In terms of plant appearance, these F1 plants presented at the flowering stage, 9–10 flower peduncles, revealed large flowers (5.5–5.8 cm in diameter and 2.6–2.9 cm of LCT) and clustered 4–5 on tall flower peduncles (19.5–21.3 cm) in comparison with the length of peduncles (LP) of the P1 and P2 parents (17.1 and 14.3 cm). Regarding the flower color, these F1 plants revealed deep purplish pink color (RHS 68A) and light purplish pink (RHS 73C).
The second main cluster (B) was composed by two sub-groups. The first sub-cluster included eight F1 plants and the paternal parent (“Natalie”), while the other sub-cluster grouped 13 F1 plants. These two sub-groups differed from each other mainly by NP (6.8–9.7) and LP (14.3–21.7) and exhibited flower colors with shades that varied from light-violet (93D; 94D) to vivid-violet (88A) and, respectively, deep purplish pink (68A) to strong purplish red (59D).
It is worth highlighting the position of the P2×P1.25 F1 plant, considered an “outlier” of cluster B based on its morphological features and flowering time. Therefore, compared to its parents, this F1 plant revealed a high number of leaves (11.7), with an intermediate number of peduncles (8.0) and a low NFP (2.4), and NF (19.6). Although the light-violet flowers were wide (5.9 cm diameter), they presented a short corolla tube (2.6). Additionally, the registered flowering time was shorter due to the sensibility of flowers to dropping.
Regarding the clustering pattern of the nine analyzed morphological parameters, the number of flowers/plant, a very good indicator of ornamental value, was clustered distinctly from all other analyzed morphological parameters, as shown in Figure 6.
Concerning the analyzed morphological traits of P2×P1 plants, the two-way dendrogram revealed two main clusters. The upper one was represented by the length of leaf (cm), flowering time (days), length of peduncle (cm) and number of flowers/plant, which is strongly distanced from the others. The second main cluster grouped the evaluated traits into two sub-groups accordingly: the first sub-cluster grouped the number of peduncles and leaves, while the second grouped width of flower closely followed by the length of corolla flower and number of flowers/peduncle.

3.4.2. SCoT Markers Polymorphism

Our results showed that SCoT markers were suitable to assess the genetic relationships between parents and F1 plants from each reciprocal cross. Out of the fifteen primers screened for their ability to amplify the DNA samples from S. × hybridus V., nine revealed reproducible and consistent results. The levels of polymorphism detected with the nine selected SCoT primers are presented in Table 3.
The nine SCoT primers amplified 147 reproducible fragments ranging from 300 to 8200 bp, out of which 127 bands were polymorphic bands for the samples from P1×P2. In case of a P2×P1 cross, SCoT primers amplified 138 bands ranging from 300 to 8000 bp, out of which 121 bands were polymorphic bands.
The number of polymorphic bands for each primer ranged from 9 to 17. The highest number of polymorphic bands (17) was generated by SCoT 7 for samples from P1×P2. For P2×P1 samples, SCoT 7 and SCoT 15 amplified the highest number of polymorphic bands (19). The lowest number of amplified polymorphic bands (9) was obtained with the SCoT 1 primer for samples from both reciprocal crosses.
For P1×P2 samples, the percentage of polymorphism (no. of polymorphic bands/no. of total bands × 100) ranged from 81.81% (SCoT 1) to 88.88% (SCoT 6 and SCoT 14) with a mean value of 86.23 ± 0.78, while for P2×P1 samples the percentage of polymorphism ranged from 83.33% (SCoT 9 and SCoT 12) to 90.00% (SCoT 1) with a mean value of 87.21 ± 0.89.
In the present study, the PIC values for each primer ranged from 0.46 (SCoT 1 for P1×P2; SCoT 15 for P2×P1 samples) to 0.49 (SCoT 7, SCoT 9 and SCoT 12 for P1×P2 samples) with a mean value of 0.47 ± 0.01 and 0.48 ± 0.01, respectively, as shown in Table 3.
These results indicated that SCoT markers were able to identify a high degree of polymorphism between “Natalie” and “Bristol’s Gum Drop” varieties used as parents and F1 progenies resulted from reciprocal crosses. For dominant markers, such as SCoT markers, the PIC values ranged from 0 to 0.5, where 0 indicates the fixation of one allele and 0.5 means equal frequencies of alleles [26].

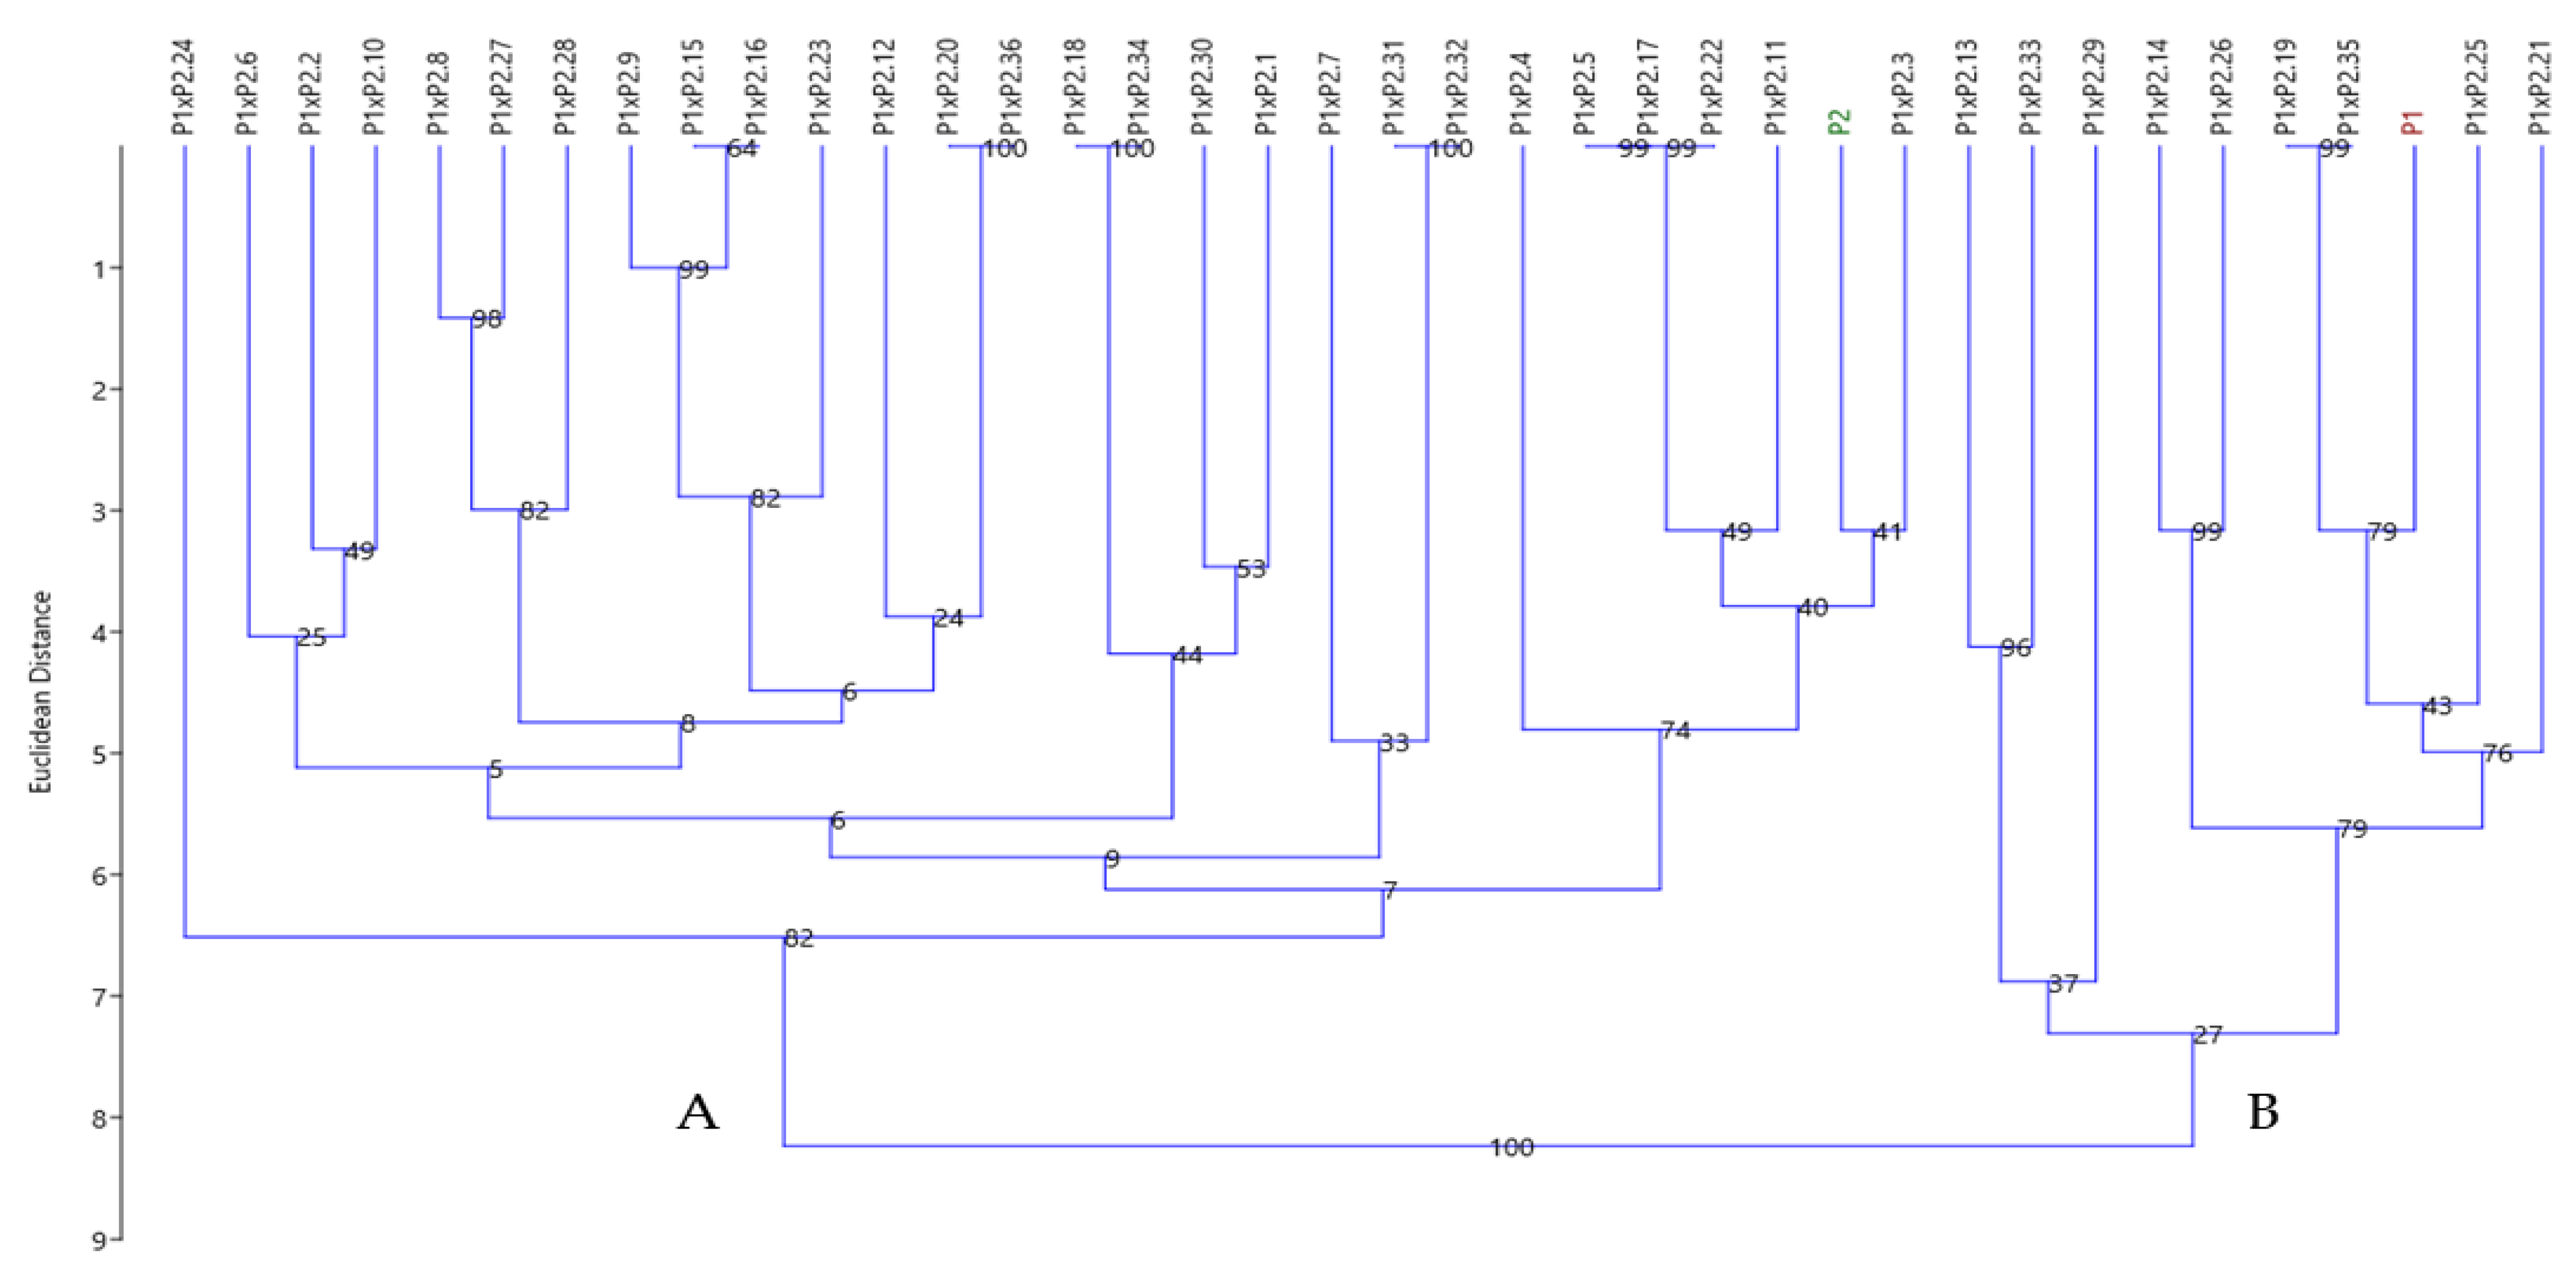
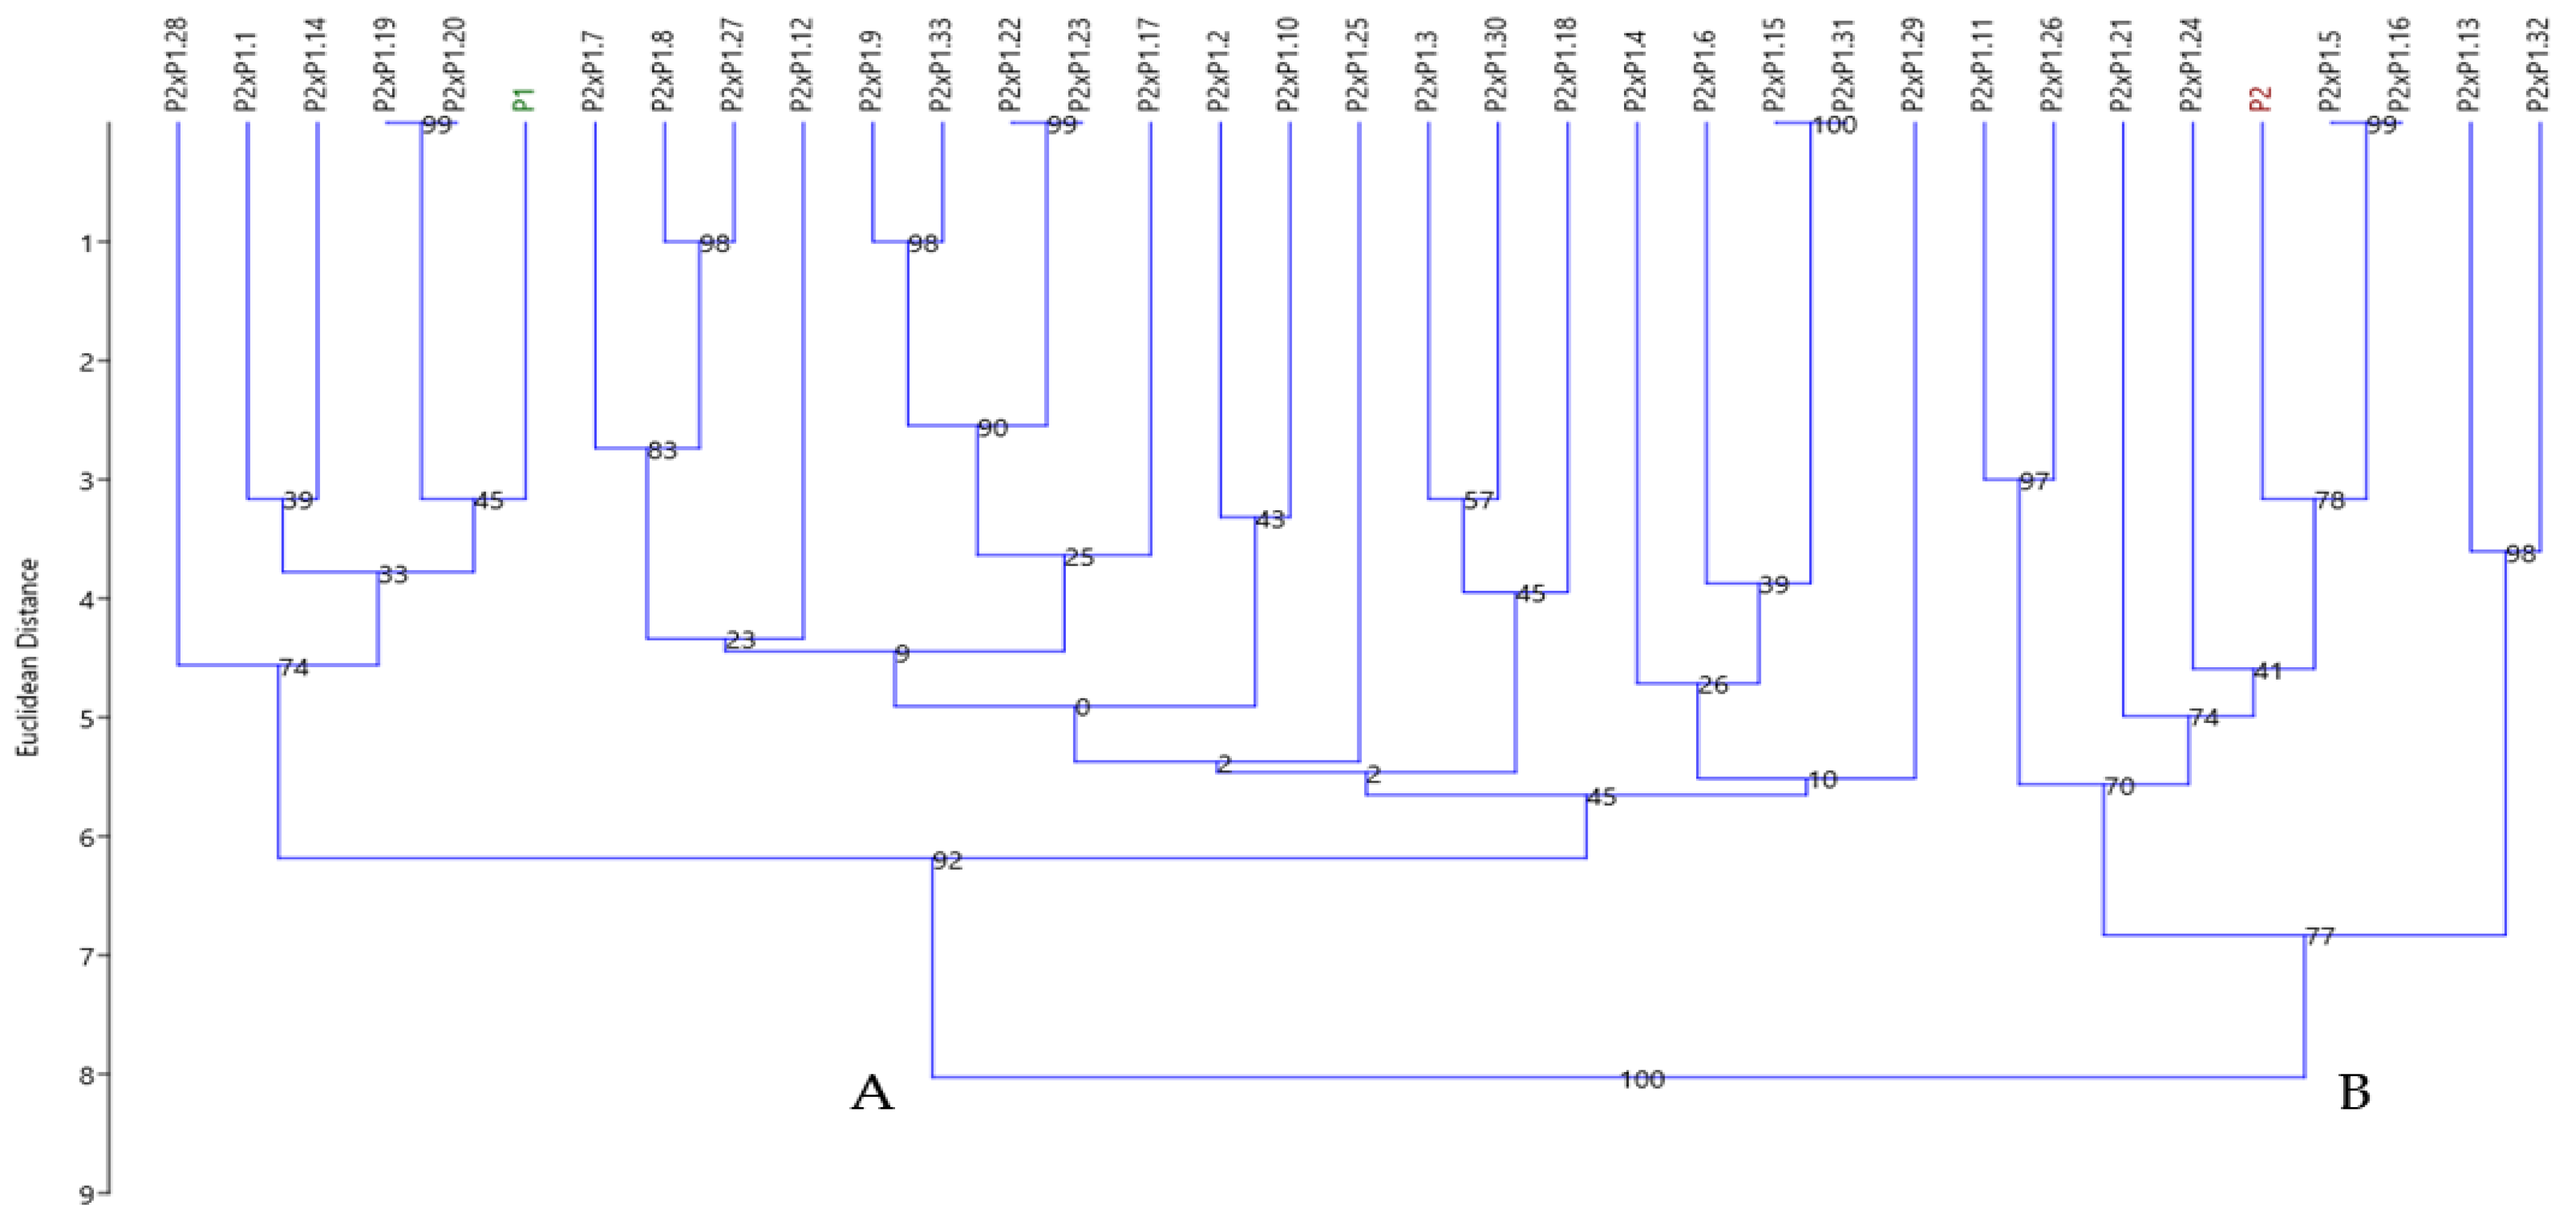
3.4.3. Cluster Analysis Based on SCoT Polymorphism

The data generated by SCoT molecular markers analysis were used to construct a dendrogram for each reciprocal cross based on the unweighted pair group method with an arithmetical average (UPGMA) algorithm (Figure 7 and Figure 8) and Euclidean’s distance index.
The UPGMA dendrograms grouped the Streptocarpus parents and F1 plants into two main clusters for both reciprocal crosses. In the case of the parental combination P1×P2, a high cophenetic correlation coefficient of 0.8795 between the Euclidean distance matrix and the cophenetic matrix was obtained, indicating a good fit between the generated dendrogram and the two matrices used.
The first main cluster (A) of the dendrogram included two sub-clusters: the first one, which grouped twenty F1 plants; and the second, which grouped the P2 (♂“Bristol’s Gum Drop”) with six F1 plants. The second main cluster (B) also included two sub-clusters, one that grouped 3 F1 plants and the other that included 6 F1 plants and the maternal patent “Natalie” (Figure 7).
The F1 plants coded P1×P2.19 and P1×P2.35 presented very similar SCoT genetic profiles and clustered with the maternal parent (“Natalie”) in a small group, confirming the results of clustering based on morphological data. The sample coded P1×P2.24 was considered an “outlier” of the first cluster (A) also at the DNA molecular level. This sample also revealed morphological differences compared to the P1 and P2 parents, as previously shown in Figure 5.
The constructed dendrogram based on the recorded SCoT data from the parental combination P2×P1 (♀“Bristol’s Gum Drop” × ♂“Natalie”) also indicated a good fit between the built dendrogram and the two matrices used, the cophenetic correlation coefficient value being 0.8742.
The first main cluster (A) included two sub-clusters that firstly grouped the father parent (P1) with five F1 plants, and secondly twenty F1 plants. The second main cluster (B) grouped the mother parent (P2) with another eight F1 plants, as shown in Figure 8. Interestingly, also at the DNA molecular level, the coded P2×P1.25 plant sample was considered an “outlier” of the sub-cluster that includes the father parent (P1) also revealed by morphological differences compared to the P1 and P2 parents as shown in the previous Figure 6.
Two F1 progenies named P1×P2.33 and P2×P1.21 were selected based on their phenotypic characteristics and the SCoT molecular fingerprinting. These genotypes are presented in the Supplementary Files Figure S3. These selected genotypes will be tested in our future breeding programs with the aim to create and promote new valuable Streptocarpus cultivars.

4. Discussion

4.1. Genetic Diversity of Streptocarpus Parents and Their F1 Progeny Based on Morphological Data

In order to assess the genetic quality of plant material used in breeding programs, morphological characterization is an important stage in plant breeding [31]. The selection of optimal and high-quality genotypes to be used in breeding programs requires knowledge of the variance in phenotypic traits, which reveals the amplitude in genetic variation of improved traits [32].
Based on the recorded mean values of the morphological characters obtained from both reciprocal crosses, it was possible to detect a high level of variability of F1 plants between P1×P2 and P2xP2 for valuable morphological traits, except the number of leaves/plant (NL) and width of flower (WF). Contrary to our results, Ecker et al. (1994) [33] reported no significant differences in mean values between F1 progeny from a reciprocal cross in lisianthus (Eustoma grandiflorum Shinn.), which were due to the absence of cytoplasmatic or maternal effects. Oehlkers (1964) [34] in his report claims that, in the Streptocarpus genus, many characters have been proven to be controlled by chromosomal genes and specific cytoplasmic components. Moreover, based on the mean values of the analyzed morphological parameters, our results reveal that at the level of the entire experiment, F1 plants from both parental reciprocal crosses were able to express hybrid vigor compared to their genitors. This finding was useful for the selection of F1 plants that will be tested in our future breeding programs.
In the present study, an important morphological trait proved to be the flowering time (FT). The present results suggest that the F1 plants from both reciprocal crosses revealed a short period of flowering time as compared to both their genitors. Therefore, the control of flowering are assured in plants by complex plant regulatory mechanisms [35] and the interaction between environmental conditions and the genetic background of plants influenced flowering time. The environmental conditions influenced flowering time and the number of flowers produced, but not the flower life on the plant on autumn camellias (Camellia spp.) as reported by Scariot and Gullino (2008) [36].
Flower color (FC) is one of the most important morphological characteristics that can improve the ornamental value of any Streptocarpus plant [16].
The heredity of color in several species has been studied previously in other ornamental plants such as anthurium [37], chrysanthemum [38], roses [39], alstroemeria [40], iris [41], lily [42] and narcissus [43]. The results of these reports suggest that flower color polymorphism is due to variations in floral pigments. Furthermore, metabolomic and transcriptomic analyses of flavonoid biosynthetic pathways reveal complex biochemical reactions involved in the accumulation of anthocyanins and other flavonoids in flowers [44].
In this study, significantly different results were obtained regarding the color of flowers from both reciprocal crosses. The F1 plants were included in two color groups: red-purple and violet-blue. Several F1 individuals showed flowers with a close color hue to the maternal or paternal genitors (deep-red and violet-blue with creamy-yellow), while other F1 plants showed an intermediate color between parents (purplish pink).
It is well-known that the composition and content of anthocyanins and carotenoids mainly affect the flower color hues of Streptocarpus [45]. In our breeding program, the simultaneous presence of both carotenoids and anthocyanins in the paternal genitor’s petals produced F1 progenies with extensive flower color segregation in P2×P1 (♀“Bristol’s Gum Drop” × ♂“Natalie”). In the case of P1×P2 (♀“Natalie” × ♂“Bristol’s Gum Drop”), the F1 progenies that were grouped in red-purple color group showed flower color segregation in purplish-red hues. Furthermore, when “Natalie” was used as the parental genitor, 60% of the individuals in the P2×P1 cross featured a creamy-yellow or yellow throat with intense colored streaks (e.g., deep indigo or brown) on the lower flower lobe. Therefore, these results are useful for Streptocarpus breeding programs and provide guidance on the selection of parents in cross-breeding practices.
To increase the efficiency of Streptocarpus breeding programs, in addition to extremely useful mean comparisons between reciprocal genitors and their F1 progeny, Pearson simple correlations and multivariate cluster analysis can be particularly useful.
The correlation between morphological traits is an indispensable parameter of univariate analysis used in plant breeding to estimate whether selection for one trait will have an influence on another [41,46]. In addition, the correlation coefficient can provide valuable information on the traits that are most important in evaluating F1 individuals [47,48].
In the present study, correlations between phenotypic traits of F1 plants from each reciprocal cross were analyzed. Noticeably, regarding the Pearson correlations of morphological traits of P2×P1 progenies, no significant (p < 0.05) negative correlations have been recorded and positive significant correlations (p < 0.05) were observed between vegetative and reproductive traits, such as the length of leaves and number of flowers/plants. This finding provides important data regarding the potential application of early selection in the non-segregating F1 generation for the selection of valuable plants in terms of appearance as well as intriguing flower color.
In our breeding program, genetic variability revealed by UPGMA cluster analysis highlighted a high genetic variability recorded between the parents and F1 progeny in both reciprocal crosses. The results of this study reveal that two F1 individuals (P1×P2.33 and P1×P2.24) from the cross of P1×P2 were separated completely and each placed in one of the two main clusters, indicating that F1 plants resulted from the same combination of parents were highly variable in their phenotypic attributes. One explanation is the source of parents used and their heterozygous status for some loci, although two inbred generations were applied. These findings are in agreement with those reported by Azimi et al. (2018) [48] on intra-varietal hybridization of Iris germanica.

4.2. Genetic Diversity of Streptocarpus Parents and Their F1 Progeny Based on Molecular Data

An important objective in crop improvement programs is to identify plants with superior and desirable characteristics. Several molecular markers have been developed in the last three to four decades as a consequence of the advancement of molecular biology and are currently worldwide employed in genetics and molecular breeding research [49].
In this context, SCoT molecular markers have been widely applied in many genetics studies, such as phylogenetic relationships assessment [50,51], species or varieties identification [52,53], sex determination [54,55] and genetic fidelity evaluation of tissue culture raised-plants [56,57]. Although SCoT markers are mainly limited to genetic diversity studies and have occasionally been used in molecular breeding-based studies [49], the present study showed their ability to identify the genetic relationships between genitors and F1 plants from each reciprocal cross. A relatively high mean percentage of polymorphic bands (86.23–87.21%) was detected, consistent with the proportion of polymorphism reported in other ornamental species, such as chrysanthemum [50], orchids [58] and cyclamen [59].
The assessment of genetic relationships between parents and F1 plants revealed that, at the molecular level, a number of eleven F1 individuals from P1×P2 cross and six from P2×P1 showed a high level of similarity. These findings provide valuable information for Streptocarpus breeders that can be useful in early plant selection activities. Depending on the objectives of the breeding program for these plants, negative or positive selection can be applied (e.g., uniformity for cut-flowers usage or valuable genotype identification in selection).
The results from UPGMA cluster analysis based on both morphological and molecular data revealed that the F1 plants that present similarities in terms of agro-morphological traits may have significantly different molecular characteristics, and vice versa. According to Cornea-Cipcigan et al., 2023 [59], discrepancies in genotypic and phenotypic data revealed in cluster analysis might be due to the effects of environment–genotype interaction, often noticed in quantitative inherited characteristics [60]. However, it can be stated that the analysis of genetic relationships between parents and their progenies, revealed at the molecular level can provide useful information to breeders involved in the selection activities of ornamental plants.

5. Conclusions

According to the results presented in this research, it can be stated that the varieties used as genitors demonstrated their hereditary ability to transmit valuable characteristics to the F1 progeny from each reciprocal cross. In the case of F1 progeny from P1×P2, significant negative correlations were observed between NP, NFP, LP and LCT, whereas positive correlations were obtained between NFP, WF, NF and WF. Conversely, regarding P2×P1, significant positive correlations were observed between NF and NFP. The SCoT genetic profiles of the F1 plants with the identifiers P1×P2.19 and P1×P2.35 were remarkably similar, and they grouped with the maternal parent in a small group, supporting the findings of clustering based on morphological data. The parental combination P2×P1 revealed the presence of closely related progenies to the paternal parent, namely P2×P1 1.16 and P2×P1 1.5. Two F1 progenies named P1×P2.33 and P2×P1.21 were selected based on their phenotypic characteristics and the SCoT molecular fingerprinting. These selected genotypes will be tested in our future breeding programs with the aim to create and promote new valuable Streptocarpus cultivars.

Supplementary Materials

The following supporting information can be downloaded at: https://www.mdpi.com/article/10.3390/horticulturae9040497/s1, Figure S1: The representative colors of Streptocarpus F1 plants from P1×P2 cross; Figure S2: The representative colors of Streptocarpus F1 plants from P2×P1 cross; Figure S3: The visual appearance and flower color of P1×P2.33 and P2×P1.21 Streptocarpus genotypes selected for future breeding programs. Table S1: Flower color characteristics of parents (P1and P2) and F1 plants from P1×P2 and P2×P1 crosses; Table S2: The nucleotide sequence of SCoT primers used to assess the genetic relationships between parents and F progeny.

Author Contributions

Conceptualization, M.H. and D.C.; methodology, M.H.; software, M.H. and M.C.-C.; validation, M.I.C. and R.P.; formal analysis, O.B.; investigation, O.B.; resources, M.H. and M.I.C.; data curation, M.C.-C.; writing—original draft preparation, M.H.; writing—review and editing, M.H.; O.B. and M.C.-C.; visualization, R.P and D.C.; supervision, M.H.; project administration, M.H.; funding acquisition, M.H. and M.I.C. All authors have read and agreed to the published version of the manuscript.

Funding

This research was funded by an internal grant of UASVMCN, number 21776/2021.

Data Availability Statement

All the data relevant to this work are available on request from the corresponding author.

Conflicts of Interest

The authors declare no conflict of interest.

References

  1. Aida, R.; Ohmiya, A.; Onozaki, T. Current researches in ornamental plant breeding. Breed. Sci. 2018, 68, 1. [Google Scholar] [CrossRef] [PubMed] [Green Version]
  2. Huylenbroeck, J.V.; Bhattarai, K. Ornamental plant breeding: Entering a new era? Ornam. Hortic. 2022, 28, 297–305. [Google Scholar] [CrossRef]
  3. Cantor, M.; Stana, D.; Ioana, P.O.P. Streptocarpus-flowering pot plant-propagation and culture. Not. Bot. Horti Agrobot. Cluj-Napoca 2004, 32, 15. [Google Scholar] [CrossRef]
  4. Wolff, D.W.; Veilleux, R.E. Evaluation of inbred and hybrid populations of Streptocarpus × hybridus. J. Am. Soc. Hortic. Sci. 1986, 111, 622–626. [Google Scholar] [CrossRef]
  5. Chaudhury, A.; Power, J.B.; Davey, M.R. High frequency direct plant regeneration from leaf and petals of Cape Primrose (Streptocarpus). J. Crop. Sci. Biotechnol. 2010, 13, 107112. [Google Scholar] [CrossRef]
  6. Tymoszuk, A.; Miler, N. Silver and gold nanoparticles impact on in vitro adventitious organogenesis in chrysanthemum, gerbera and Cape Primrose. Sci. Hortic. 2019, 257, 108766. [Google Scholar] [CrossRef]
  7. Lawrence, W.J.C.; Scott-Moncrieff, R.; Sturgess, V.C. Studies on Streptocarpus: I. Genetics and chemistry of flower colour in the Garden strains. J. Genet. 1939, 38, 299–306. [Google Scholar] [CrossRef]
  8. Dibley, R. Streptocarpus varieties. In Streptocarpus, 3rd ed.; Nurseries, D., Ed.; Dibley’s: Wales, UK, 2018; pp. 24–40. [Google Scholar]
  9. Afkhami-Sarvestani, R.; Serek, M.; Winkelmann, T. Interspecific crosses within the Streptocarpus subgenus Streptocarpella and intergeneric crosses between Streptocarpella and Saintpaulia ionantha genotypes. Sci. Hortic. 2012, 148, 215–222. [Google Scholar] [CrossRef]
  10. Hârţa, M.; Borsai, O.; Muntean, C.M.; Dina, N.E.; Fǎlǎmaş, A.; Olar, L.E.; Szabo, K.; Pamfil, D.; Ştefan, R. Assessment of Genetic Relationships between Streptocarpus × hybridus V. Parents and F1 Progenies Using SRAP Markers and FT-IR Spectroscopy. Plants 2020, 9, 160. [Google Scholar] [CrossRef] [Green Version]
  11. Davies, F. The British Streptocarpus Society. In Booklet Gesneriads; Shalit, P., Ed.; The Gesneriad Society, Inc.: Seattle, WA, USA, 2016; Volume 66. [Google Scholar]
  12. Marston, M.E. The morphology of a Streptocarpus hybrid and its regeneration from leaf cuttings. Sci. Hortic. 1964, 17, 114–120. [Google Scholar]
  13. Gai, J.; He, J. Reciprocal Cross. In Brenner's Encyclopedia of Genetics, 2nd ed.; Maloy, S., Hughes, K., Eds.; Academic Press: San Diego, CA, USA, 2013; pp. 66–67. [Google Scholar]
  14. Yates, F. Analysis of data from all possible reciprocal crosses between a set of parental lines. Heredity 1947, 1, 287–301. [Google Scholar] [CrossRef] [Green Version]
  15. Dibley, R. Streptocarpus varieties. In Streptocarpus, 2nd ed.; Nurseries, D., Ed.; Dibley’s: Wales, UK, 2008; pp. 12–20. [Google Scholar]
  16. Harta, M.; Pamfil, D.; Borsai, O.; Rodica, P.O.P.; Clapa, D.; Diaconeasa, Z.; Sisea, C.R. Molecular and phytochemical characterization of F1 Streptocarpus hybrids and antioxidant potential of their flower extracts. Not. Bot. Horti Agrobot. Cluj-Napoca 2020, 48, 1341–1356. [Google Scholar] [CrossRef]
  17. Xu, Y.-X.; Shen, S.-Y.; Chen, W.; Chen, L. Analysis of genetic diversity and development of a SCAR marker for green tea (Camellia sinensis) cultivars in Zhejiang Province: The most famous green tea-producing area in China. Biochem. Genet. 2019, 57, 555–570. [Google Scholar] [CrossRef]
  18. Kobeissi, B.; Saidi, A.; Kobeissi, A.; Shafie, M. Applicability of SCoT and SSR molecular markers for genetic diversity analysis in Chrysanthemum morifolium genotypes. Proc. Natl. Acad. Sci. India B Biol. Sci. 2019, 89, 1067–1077. [Google Scholar] [CrossRef]
  19. Rayan, W.A.; Osman, S.A. Phylogenetic relationships of some Egyptian soybean cultivars (Glycine max L.) using SCoT marker and protein pattern. Bull. Natl. Res. Cent. 2019, 43, 161. [Google Scholar] [CrossRef] [Green Version]
  20. Mostafavi, A.S.; Omidi, M.; Azizinezhad, R.; Etminan, A.; Badi, H.N. Genetic diversity analysis in a mini core collection of Damask rose (Rosa damascena Mill.) germplasm from Iran using URP and SCoT markers. J. Genet. Eng. Biotechnol. 2021, 19, 144. [Google Scholar] [CrossRef] [PubMed]
  21. Lázaro, A.; Totland, Ø. The influence of floral symmetry, dependence on pollinators and pollination generalization on flower size variation. Ann. Bot. 2014, 114, 157–165. [Google Scholar] [CrossRef] [Green Version]
  22. RHS & Flower Council of Holland. RHS Colour Chart, 3rd ed.; RHS & Flower Council of Holland: Leiden, The Netherlands, 1995. [Google Scholar]
  23. The Azalea Society of America, Royal Horticultural Society. UCL and RGB Colors, Gamma = 1.4. 2021. Available online: https://www.azaleas.org/color-systems/ (accessed on 19 April 2022).
  24. Color Mixer-The Best Free Online Color Mixing Tool. Available online: https://artincontext.org/color-mixer/ (accessed on 19 April 2022).
  25. Lodhi, M.A.; Ye, G.-N.; Weeden, N.F.; Reisch, B.I. A simple and efficient method for DNA extraction from grapevine cultivars and Vitis species. Plant Mol. Biol. Rep. 1994, 12, 6–13. [Google Scholar] [CrossRef]
  26. Pop, R.; Ardelean, M.; Pamfil, D.; Gaboreanu, I.M. The efficiency of different DNA isolation and purification in ten cultivars of Vitis vinifera. Bull. UASVM Anim. Sci. Biotechnol 2003, 59, 259–261. [Google Scholar]
  27. Bodea, M.; Pamfil, D.; Pop, R.; Sisea, R. DNA isolation from desiccated leaf material from plum tree (Prunus domestica L.) molecular analysis. Bull. UASVM Hortic. 2016, 1, 1–2. [Google Scholar] [CrossRef] [PubMed] [Green Version]
  28. Collard, B.C.Y.; Mackill, D.J. Start codon targeted (SCoT) polymorphism: A simple, novel DNA marker technique for generating gene-targeted markers in plants. Plant Mol. Biol Rep. 2009, 27, 86–93. [Google Scholar] [CrossRef]
  29. Serrote, C.M.L.; Reiniger, L.R.S.; Silva, K.B.; dos Santos Rabaiolli, S.M.; Stefanel, C.M. Determining the Polymorphism Information Content of a molecular marker. Gene 2020, 726, 144175. [Google Scholar] [CrossRef] [PubMed]
  30. Hammer, Ø.; Harper, D.A.T.; Ryan, P.D. Past: Paleontological statistics software package for education and data analysis. Palaeontol. Electron. 2001, 4, 9. [Google Scholar]
  31. Tucić, B.; Avramov, S. Maternal effects on early juvenile traits in Iris pumila (Iridaceae). Plant Syst. Evol. 1996, 201, 179–197. [Google Scholar] [CrossRef]
  32. Santos, E.A.; Souza, M.M.; Viana, A.P.; Almeida, A.A.F.; Freitas, J.C.O.; Lawinscky, P.R. Multivariate analysis of morphological characteristics of two species of passion flower with ornamental potential and of hybrids between them. Genet. Mol. Res. 2011, 10, 2457–2471. [Google Scholar] [CrossRef]
  33. Ecker, R.; Barzilay, A.; Osherenko, E. Population means and correlation analyses of growth parameters in lisianthus (Eustoma grandiflorum Shinn.). Euphytica 1994, 78, 193–197. [Google Scholar] [CrossRef]
  34. Oehlkers, F. Cytoplasmic inheritance in the genus Streptocarpus Lindley. Adv. Genet. 1964, 12, 329–370. [Google Scholar] [CrossRef]
  35. Jung, C.; Müller, A.E. Flowering time control and applications in plant breeding. Trends Plant Sci. 2009, 14, 563–573. [Google Scholar] [CrossRef]
  36. Scariot, V.; Gullino, P. Evaluation of flowering time and ornamental characteristics in autumn camellias. In I International Symposium on Woody Ornamentals of the Temperate Zone; International Society for Horticultural Science: Leuven, Belgium, 2008; pp. 319–324. [Google Scholar] [CrossRef]
  37. Kurniati, R.; Yuniarto, K.; Kartikaningrum, S. Morphological diversity of F1 population in Anthurium through conventional breeding. In IOP Conference Series: Earth and Environmental Science; IOP Publishing: Bristol, UK, 2019; p. 012100. [Google Scholar] [CrossRef]
  38. Lema-Rumińska, J.; Zalewska, M. Changes in flower colour among Lady Group of Chrysanthemum× grandiflorum/Ramat./Kitam. as a result of mutation breeding. Folia Hortic 2005, 17, 61–72. [Google Scholar]
  39. Gitonga, V.W.; Stolker, R.; Ribot, S.; Keizer, P.; Koning-Boucoiran, C.F.S.; Krens, F.A. Inheritance of determinants of flower colour in tetraploid roses. In XXIII International Eucarpia Symposium, Section Ornamentals: Colourful Breeding and Genetics; International Society for Horticultural Science: Leuven, Belgium, 2009; pp. 55–60. [Google Scholar] [CrossRef] [Green Version]
  40. Donoso, A.; Rivas, C.; Zamorano, A.; Peña, Á.; Handford, M.; Aros, D. Understanding Alstroemeria pallida flower colour: Links between phenotype, anthocyanins and gene expression. Plants 2020, 10, 55. [Google Scholar] [CrossRef]
  41. Fan, Z.; Gao, Y.; Guo, L.; Cao, Y.; Liu, R.; Zhang, Q. Phenotypic Variations and Heritability in Hybrid Populations of Bearded Iris. HortScience 2019, 54, 988–992. [Google Scholar] [CrossRef] [Green Version]
  42. Li, J.; Chen, J.; Zhang, Q.; Yu, P.; Zhou, Y.; Jia, G. The Composition of Anthocyanins and Carotenoids Influenced the Flower Color Heredity in Asiatic Hybrid Lilies. Horticulturae 2022, 8, 1206. [Google Scholar] [CrossRef]
  43. Li, X.; Lu, M.; Tang, D.; Shi, Y. Composition of carotenoids and flavonoids in narcissus cultivars and their relationship with flower color. PLoS ONE 2015, 10, e0142074. [Google Scholar] [CrossRef] [PubMed] [Green Version]
  44. Jeknić, Z.; Jeknić, S.; Jevremović, S.; Subotić, A.; Chen, T.H.H. Alteration of flower color in Iris germanica L. ‘Fire Bride’ through ectopic expression of phytoene synthase gene (crtB) from Pantoea agglomerans. Plant Cell Rep. 2014, 33, 1307–1321. [Google Scholar] [CrossRef] [PubMed]
  45. Forkmann, G.; Stotz, G. Selection and characterisation of flavanone 3-hydroxylase mutants of Dahlia, Streptocarpus, Verbena and Zinnia. Planta 1984, 161, 261–265. [Google Scholar] [CrossRef]
  46. Titirică, I.; Roman, I.A.; Nicola, C.; Sturzeanu, M.; Iurea, E.; Botu, M.; Sestras, R.E.; Pop, R.; Militaru, M.; Ercisli, S. The Main Morphological Characteristics and Chemical Components of Fruits and the Possibilities of Their Improvement in Raspberry Breeding. Horticulturae 2023, 9, 50. [Google Scholar] [CrossRef]
  47. Hayakawa, H.; Muroi, M.; Hamachi, H.; Yokoyama, J.; Fukuda, T. Correlation of variation between leaf and flower characters in Cymbidium goeringii (Rchb. f.) Rchb. f. (Orchidaceae). J. Jap. Bot. 2011, 86, 82–92. [Google Scholar]
  48. Azimi, M.H.; Karimi Alvijeh, M.; Zarei, A. Intervarietal hybridization and observation of heterosis in the new hybrids of Iris germanica. Int. J. Hortic. Sci. Technol 2018, 5, 65–79. [Google Scholar] [CrossRef]
  49. Rai, M.K. Start codon targeted (SCoT) polymorphism marker in plant genome analysis: Current status and prospects. Planta 2023, 257, 34. [Google Scholar] [CrossRef]
  50. Feng, S.-G.; He, R.-F.; Jiang, M.-Y.; Lu, J.-J.; Shen, X.-X.; Liu, J.-J.; Wang, Z.-A.; Wang, H.-Z. Genetic diversity and relationships of medicinal Chrysanthemum morifolium revealed by start codon targeted (SCoT) markers. Sci. Hortic. 2016, 201, 118–123. [Google Scholar] [CrossRef]
  51. El Khodary, Y.A.; Ayoub, I.M.; El-Ahmady, S.H.; Ibrahim, N. Molecular and phytochemical variability among genus Albizia: A phylogenetic prospect for future breeding. Mol. Biol. Rep. 2021, 48, 2619–2628. [Google Scholar] [CrossRef]
  52. Li, Q.; Mo, J.; Wu, W.; Yang, J.; Li, J.; Lai, T.; Ou, Z.; Qiu, Z.; Guan, S.; Liao, J. Genetic diversity, population structure and identification of Dendrobium cultivars with high polysaccharide contents using SCoT, SCAR and nested PCR markers. Genet. Resour. Crop. Evol. 2019, 66, 71–88. [Google Scholar] [CrossRef]
  53. Cai, Y.; Gao, Y.; Zhang, Z.; Liu, H.; Wang, Y.; Ma, Y.; Li, Y.; Feng, S.; Wang, H. Development and Application of a Cultivar-Specific Sequence-Characterized Amplified Region (SCAR) Marker for the Detection of Chrysanthemum morifolium Ramat. ‘Daboju’. Plants 2022, 11, 604. [Google Scholar] [CrossRef] [PubMed]
  54. Heikrujam, M.; Kumar, J.; Agrawal, V. Genetic diversity analysis among male and female Jojoba genotypes employing gene targeted molecular markers, start codon targeted (SCoT) polymorphism and CAAT box-derived polymorphism (CBDP) markers. Meta Gene 2015, 5, 90–97. [Google Scholar] [CrossRef] [PubMed]
  55. Heikrujam, M.; Sharma, K.; Prasad, M.; Agrawal, V. Review on different mechanisms of sex determination and sex-linked molecular markers in dioecious crops: A current update. Euphytica 2015, 201, 161–194. [Google Scholar] [CrossRef]
  56. Clapa, D.; Hârța, M. Establishment of an Efficient Micropropagation System for Humulus lupulus L. cv. Cascade and Confirmation of Genetic Uniformity of the Regenerated Plants through DNA Markers. Agronomy 2021, 11, 2268. [Google Scholar] [CrossRef]
  57. Arora, K.; Rai, M.K.; Sharma, A.K. Tissue culture mediated biotechnological interventions in medicinal trees: Recent progress. Plant Cell Tissue Organ Cult. 2022, 150, 267–287. [Google Scholar] [CrossRef]
  58. Zheng, K.; Cai, Y.; Chen, W.; Gao, Y.; Jin, J.; Wang, H.; Feng, S.; Lu, J. Development, identification, and application of a germplasm specific SCAR Marker for Dendrobium officinale Kimura et Migo. Front. Plant Sci. 2021, 12, 669458. [Google Scholar] [CrossRef]
  59. Cornea-Cipcigan, M.; Pamfil, D.; Sisea, C.R.; Margaoan, R. Characterization of Cyclamen genotypes using morphological descriptors and DNA molecular markers in a multivariate analysis. Front. Plant Sci. 2023, 14, 1100099. [Google Scholar] [CrossRef]
  60. Yesson, C.; Culham, A. Biogeography of Cyclamen: An application of phyloclimatic modelling. In Climate Change, Ecology and Systematics, Systematics; Association Special Volume Series; Hodkinson, T., Jones, M., Waldren, S., Parnell, J., Eds.; Cambridge University Press: Cambridge, UK, 2011; Volume 78, pp. 265–279. [Google Scholar] [CrossRef] [Green Version]
Figure 1. “Natalie” variety.
Horticulturae 09 00497 g001
Figure 2. “Bristol’s Gum Drop” variety.
Horticulturae 09 00497 g002
Figure 3. Pearson correlation coefficients (‘r’ value) between the mean values of the morphological parameters of F1 plants from P1×P2 cross. LL—length of leaf (cm); NL—number of leaves; NP—number of peduncle/plant; NF—number of flowers/plant; NFP—number of flowers/peduncle; LCT—length of corolla tube (cm); WF—width of flower (cm); FT—flowering time (days). The color intensity of the ellipses is directly correlated to the correlation coefficient value. The boxes with a grey border illustrate statistically assured values of “r” at a p-level below 0.05.
Horticulturae 09 00497 g003
Figure 4. Pearson correlation coefficients (‘r’ value) between the mean values of the morphological parameters of F1 plants from P2×P1 cross. LL—length of leaf (cm); NL—number of leaves; NP—number of peduncle/plant; NF—number of flowers/plant; NFP—number of flowers/peduncle; LCT—length of corolla tube (cm); WF—width of flower (cm); FT—flowering time (days). The color intensity of the ellipses is directly correlated to the correlation coefficient value. The boxes with a grey border illustrate statistically assured values of “r” at a p-level below 0.05.
Horticulturae 09 00497 g004
Figure 5. Two-way UPGMA dendrogram based on morphological traits, showing the relationships between parents (P1 and P2) and F1 plants from P1×P2 cross and based on Euclidean’s distance index. In dendrogram, the mother parent is marked with red color, while the father parent is marked with green color.
Horticulturae 09 00497 g005
Figure 6. Two-way UPGMA dendrogram based on morphological traits, showing the relationships between parents (P1 and P2) and F1 plants from P2×P1 cross and based on Euclidean’s distance index. In dendrogram, the mother parent is marked with red color, while the father parent is marked with green color.
Horticulturae 09 00497 g006
Figure 7. UPGMA dendrogram generated by SCoT markers, showing the relationships between parents (P1 and P2) and F1 plants from P1×P2 cross and based on Euclidean’s distance index. Numbers on the branches show bootstrap values, computed from 10,000 replications. In dendrogram, the mother parent is marked with red color, while the father parent is marked with green color.
Horticulturae 09 00497 g007
Figure 8. UPGMA dendrogram generated by SCoT markers, showing the relationships between parents (P1 and P2) and F1 plants from P2×P1 cross and based on Euclidean’s distance index. Numbers on the branches show bootstrap values, computed from 10,000 replications. In dendrogram, the mother parent is marked with red color, while the father parent is marked with green color.
Horticulturae 09 00497 g008
Table 1. The sources of variation and mean squares values of blocks and groups for nine morphological characteristics for ”Natalie” and ”Bristol’s Gum Drop” parents and their F1 progeny.
SVd.f Mean Square
LL (cm)NLLP (cm)NPNFPLCT (cm)WF (cm)NFFT (days)
Blocks56.7941.5637.1781.5466.9620.7040.33915.23624.611
F-value 2.4744.6562.8172.46019.47050.9382.6502.80014.210
p-value 0.0430.0010.0250.0440.0000.0000.0330.0250.000
Groups116.8490.69829.0851.2620.7350.0280.31398.0373.613
F-value 2.4942.07911.4142.0072.0541.9982.44718.0162.086
p-value 0.0130.0380.0000.0460.0400.0470.0150.0000.037
Error542.7460.3362.5480.6290.3580.0140.1285.4421.732
Total70
SV = source of variation; d.f. = degrees of freedom; LL = length of leaves; NL = number of leaves; LP = length of peduncle; NP = number of peduncle; NFP = number of flowers/peduncle; LCT = length of corolla tube; WF = width of flower; NF = number of flowers/plant; FT = flowering time.
Table 2. Mean comparisons for morphological characters of parents and F1 plants from two reciprocal crosses.
Morphological ParametersP1
Mean ± SD
P2
Mean ± SD
P1×P2
Mean ± SD
P2×P1
Mean ± SD
Length of leaves/plant (cm)25.19 ± 0.25 d16.85 ± 0.07 a20.48 ± 1.2 b22.54 ± 0.95 c **
Number of leaves/plant10.53 ± 0.28 b9.87 ± 0.11 a11.05 ± 0.85 c *11.34 ± 0.76 c *
Length of peduncle (cm)18.14 ± 0.26 c14.33 ± 0.11 a15.82 ± 0.33 b20.48 ± 0.71 d *
Number of peduncle/plant6.77 ± 0.29 a8.59 ± 0.27 b8.99 ± 0.77 bc *9.46 ± 0.46 c *
Number of flowers/peduncle3.11 ± 0.04 b3.89 ± 0.13 c4.06 ± 0.74 c *2.72 ± 0.23 a
Length of corolla tube (cm)3.07 ± 0.10 c2.91 ± 0.04 b3.23 ± 0.12 d *2.78 ± 0.06 a
Width of flower (cm)5.96 ± 0.07 b3.43 ± 0.06 a5.72 ± 0.31 b **5.67 ± 0.28 b **
Number of flowers/plant21.04 ± 0.93 a33.43 ± 1.88 b36.19 ± 5.70 bc *23.93 ± 2.93 a
Flowering time (days)21.20 ± 0.13 b27.70 ± 0.39 c17.95 ± 0.38 a21.05 ± 0.81 b
Note: * indicates that the obtained mean value in P1×P2 or P2×P1 exceeded the mean value recorded for the high-value parent; ** indicates that the obtained mean value in P1×P2 or P2×P1 exceeds the average -value of the parents. Means followed by the same letters are not statistically different, and means followed by different letters are statistically different by Tuckey’s test (p < 0.05).
Table 3. The level of polymorphism detected with SCoT primers in Streptocarpus parents and F1 progeny from reciprocal crosses.
Parental
Cross
Primer NameSize
of Bands (bp)
NPBNTBPPBPIC
P1×P2SCoT 1450–600091181.810.46
SCoT 3380–6500151788.230.47
SCoT 6350–6400161888.880.47
SCoT 7400–8200172085.000.49
SCoT 9300–6300121485.710.48
SCoT 12400–5000131586.660.48
SCoT 13450–5500131586.660.47
SCoT 14350–5500161888.880.47
SCoT 15350–4000161984.210.48
Total 127147
Mean 14.11 ± 0.8616.33 ± 0.9486.23 ± 0.780.47 ± 0.01
P2×P1SCoT 1400–600091090.000.48
SCoT 3350–6500151788.230.47
SCoT 6350–6500151788.230.48
SCoT 7400–8000171989.470.49
SCoT 9300–6000101283.330.49
SCoT 12500–5000121485.710.48
SCoT 13450–4000111384.610.48
SCoT 14300–5000151788.230.48
SCoT 15300–4000171989.470.46
Total 121138
Mean 13.44 ± 1.0115.33 ± 1.0687.21 ± 0.890.48 ± 0.01
Disclaimer/Publisher’s Note: The statements, opinions and data contained in all publications are solely those of the individual author(s) and contributor(s) and not of MDPI and/or the editor(s). MDPI and/or the editor(s) disclaim responsibility for any injury to people or property resulting from any ideas, methods, instructions or products referred to in the content.

