Article

Effects of Light-Emitting Diodes (LEDs) on Growth, Nitrates and Osmoprotectant Content in Microgreens of Aromatic and Medicinal Plants

1
OLMAN-BGPE, Faculté Pluridisciplinaire de Nador, Université Mohammed 1, B.P: 300, Selouane, Nador 62700, Morocco
2
Centre Régional de la Recherche Agronomique de Tanger, BP: 910, Tanger 90000, Morocco
3
Department of Agronomy, University of Almería, Carretera Sacramento, s/n, 04120 Almería, Spain
4
Faculty of Chemistry and Chemical Technology, University of Ljubljana, Večna pot 113, 1000 Ljubljana, Slovenia
5
Department of Chemistry, Faculty of Mathemathics and Natural Sciences, South West University, 2700 Blagoevgrad, Bulgaria
*
Author to whom correspondence should be addressed.
Horticulturae 2023, 9(4), 494; https://doi.org/10.3390/horticulturae9040494
Submission received: 6 March 2023 / Revised: 1 April 2023 / Accepted: 12 April 2023 / Published: 14 April 2023
(This article belongs to the Special Issue LED Lighting in Vegetable Crops)

Abstract

:
Microgreens are receiving increasing attention due to their high content of bioactive components and their importance to human health. These emerging food products can be obtained from the seeds of different plant species, including aromatic herbs. Aromatic microgreens are gaining popularity as new functional food products. In this study, we investigated the effects of different light-emitting diode (LED) lamp spectra on the growth, pigments, nitrates, and osmoprotectant content of microgreens of Ocimum basilicum L., Trigonella foenum-graecum, Anethum graveolens, and Anthriscus cerefolium plants. Three types of artificial LED lamps were used: T0 as artificial white light, T1 as a continuous light-emitting diode with a longer blue wavelength, and T2 as a continuous light-emitting diode with a longer red wavelength. The results obtained showed that the three types of LED light had significant effects on the different parameters studied. In relation to growth parameters, such as fresh weight (FW) and microgreen height (H), the T2 treatment was most effective for fenugreek, dill, and chervil. However, in basil plants, FW and H values were higher under T1 treatment. Regarding nitrate accumulation, both T1 and T2 treatments reduced the content of this nutrient in the different species studied here. Finally, levels of chlorophyll, carotenoid, glucose, proline, and proteins were all higher in plants cultivated under T1 and T2 treatments than in control plants.

1. Introduction

In recent years, consumers have sought new foods that both promote well-being and reduce the risk of chronic disease, thus promoting a healthy lifestyle in addition to meeting nutritional needs [1].
Microgreens, a novel form of leafy vegetables, are gaining popularity as a culinary ingredient. Xiao et al. [2] defined microgreens as “tender immature greens that are produced from the seeds of vegetables and herbs, having two fully developed cotyledonary leaves with or without the emergence of a rudimentary pair of first true leaves”. Microgreens have been reported to be moderate-to-good sources of proteins, dietary fibers, and essential elements, as well as excellent sources of ascorbic acid, vitamin E, and β-carotene [3]. Previously, Pinto et al. [4] reported that microgreens contain lower levels of nitrates and higher amounts of phytonutrients (ascorbic acid, β-carotene, phylloquinone, α-tocopherols) compared with mature-stage plants. Microgreens can be obtained from vegetables, herbaceous plants, aromatic herbs, and spontaneous species [5,6]. More recently, Ghoora et al. [3] reported that microgreens with good mineral content are obtained mostly from vegetables and aromatic species.
In recent years, interest in aromatic and medicinal plants (AMPs) has increased among collectors, producers, processing industries, public and/or private institutions, and consumers [7]. This is due to the aromatic, therapeutic, and preservative characteristics of these plants [8]. In addition, they are used in nutraceuticals, herbal medicine, and aromatherapy, among other applications. In this study, four species were considered based on their importance in the Mediterranean diet. These were basil Ocimum basilicum L., fenugreek Trigonella foenum-graecum L., dill Anethum graveolens L., and chervil Anthriscus cerefolium L. Hoffm. Basil produces an essential oil widely used in the food, perfumery, and medical industries. It is also considered a source of aromatic compounds and exhibits a range of biological activities and antioxidant properties [9]. Fenugreek is an aromatic annual legume of the Fabaceae family. It is considered one of the oldest medicinal plants. It is used both as a herb (fresh or dried leaves) and as a spice (seeds) [10]. Economically, this plant is important as a culinary ingredient and medicinal herb, and it continues to grow widely in its native area. Dill, a species of the Umbelliferae family, is an important essential-oil seed plant native to the Mediterranean and western Asian regions. Its medicinal and traditional uses are well documented. The chemical composition of dill seed essential oil reveals the presence of many volatile compounds; among these, carvone, limonene, α-phellandrene, β-phellandrene, and p-cymene are especially important and are found in almost all its aerial parts [11]. Chervil is a delicate and fragrant annual herb belonging to the Apiaceae family. It is used for culinary and medicinal purposes. Chervil is native to Europe and has finely divided pinnate leaves. The chemical constituents of chervil include flavonoids, such as luteolin 8.9. As a herb, chervil is characterized by a strong flavor and by its unique compounds, as well as important nutrients that can enrich the consumer’s diet [12].
Light conditions are highly influential on the morpho-physiology of microgreens and on the biosynthesis and accumulation of phytochemicals, especially in controlled growth environments [13]. Light-emitting diodes (LEDs) are one of the most promising lighting technologies for plants. The light intensity of LEDs can be controlled to influence the growth and phytochemical biosynthesis of the plant [14,15]. In horticulture, the development of LEDs is considered one of the most important recent advances in the field. LEDs can be used in different horticultural areas, particularly in controlled environmental research and as lighting for tissue cultures, as well as supplemental and photoperiod lighting for greenhouses [16,17]. LED lighting systems have significant advantages over traditional lighting due to their spectral composition, durability, wavelength specificity, low radiant heat, and energy efficiency [18].
The objective of this study was to evaluate the effect of light-emitting diodes (LEDs) on growth, nitrates, and osmoprotectant content in microgreens of four aromatic and medicinal plants, which are important in the Mediterranean area.

2. Materials and Methods
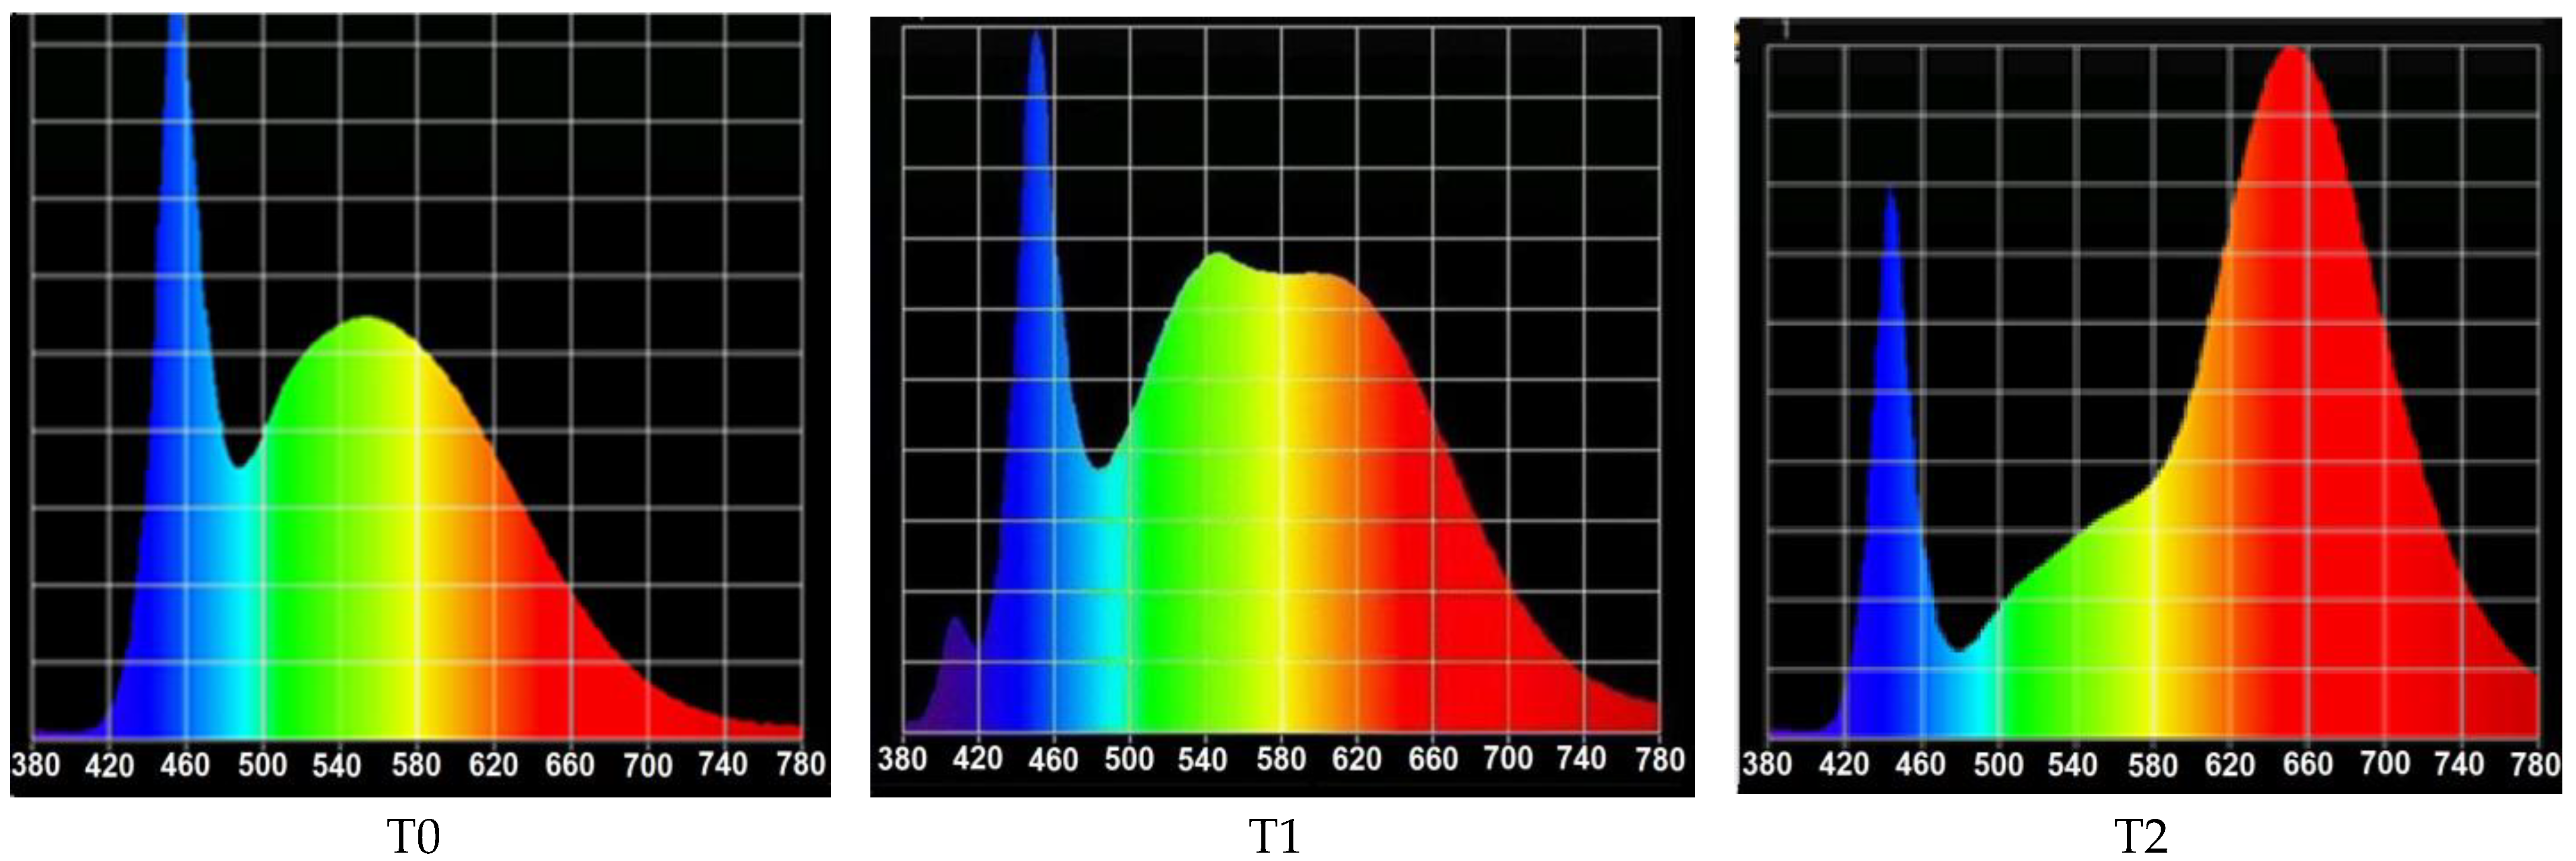
2.1. Light Devices

The experiments were conducted at the University of Almería (Spain) in a controlled growth chamber (10 m × 2.5 m) during 2018 and 2019. LED treatments were used to evaluate the quality of different species of aromatic and medicinal plants. Medicinal plants were exposed to different treatments with LED lamps: one linear spectrum lamp (T0); and two common continuous spectrum lamps, as follows: T1, with a photonic flow of 141 μmol m−2 s−1 and an illumination of light-emitting diodes of 5161 lx; and T2, with a photonic flow of 107 μmol m−2 s−1 and an illumination of light-emitting diodes of 3837 lx. White LED lamps L 18 T8 Roblan® (Toledo, Spain) were used as control (T0). For treatment T1, L 18 NS1 Valoya® (Helsinki, Finland) was used, i.e., continuous light-emitting diodes with a longer wavelength in blue, which is responsible for vegetative growth, but with less energy than red light. For treatment T2, L18 AP67 Valoya® (Helsinki, Finland) was used, i.e., continuous light-emitting diodes with a longer wavelength in red. The technical specifications are shown in Table 1.
To determine the spectral characteristics, six measurements were taken at a distance of 20 cm from the panel housing the LED tubes. An HD 2302.0 photo radiometer (Delta OHM®, Veneto, Italy) was used to measure quantitative light. LP 471 PAR and LP 471 PHOT probes were used to measure photosynthetic photon flux density (PPFD, μmol m−2 s−1) and illuminance (lux), respectively. The spectra of the treatments T0, T1, and T2 were recorded with the UPRtek MK350S spectrometer (Miaoli, Taiwan); these are shown in Figure 1. Throughout the experiment, the photoperiod was maintained at 16/8 h (day/night), the temperature was maintained at 25 °C, and relative humidity was maintained at 75–80%.

2.2. Plant Materials

Four species of aromatics and medicinal plants were studied: Ocimum basilicum L., Trigonella foenum-graecum L., Anethum graveolens L., and Anthriscus cerefolium L. All plants were fertilized with a standard nutrient solution at pH 5.8 and EC 2.2 dS m−1 [19] and collected at the microgreen stage of 0–1 pairs of real leaves. After harvesting, plants were stored in thermal bags and frozen at −24 °C. About 1.5 g of seeds for basil, dill, and chervil, and 2.5 g of fenugreek seeds, were used in single trays (40 cm × 25 cm) filled with rock wool, with six replicates for each species.

2.2.1. Fresh Weight and Height

The fresh weight (FW) of the first pair of true leaves (9 days after seeding) was measured using a precision balance.
Plant length (9 days after sowing) was measured using a graduated ruler.

2.2.2. Determination of Nitrate Content

The juice was extracted by grinding plants collected at the microgreen stage of 0–1 pairs of real leaves without adding any reagents, then stored in 2 mL microtubes at 20–22 °C. After analyses, adequate aliquots of juice were exposed to the device sensor. Nitrate content was measured using a LAQUA Twin NO3− device (HORIBA, Kyoto, Japan) with nine repetitions of each measurement.

2.2.3. Chlorophyll and Carotene Determination

A quantitative determination of chlorophyll pigments in leaves was obtained using a chlorophyll meter (SPAD-502 PLUS, Konica Minolta, Japan). The SPAD 502 Chlorophyll Meter instantly measures the amount of chlorophyll content, a key indicator of plant health. With a simple attachment of the meter over leafy tissue, a reading will index chlorophyll content (0–99.9) in less than 2 s. SPAD 502 Chlorophyll Meter also features an integrated data logger that allows the instant measurement and recording of chlorophyll content. This meter uses red (peak = ~650 nm) and near-infrared (peak = ~940 nm) reflection as calculation factors and measures within a range of 0–50 SPAD values at room temperature. The carotenoids were determined by the Lichtenthaler method [20].

2.2.4. Glucose and Proline Determination

For glucose and proline determination, we used 0.5 g of fresh microgreens according to the methods described by Irigoyen et al. [21] and by Paquin and Lechasseur [22].

2.2.5. Soluble-Protein Determination

Fresh microgreens (0.5 g) were used for soluble protein determination using Bradford G-250 reagent [23]. The results were expressed as mg bovine serum albumin g−1 of fresh weight.

2.2.6. Statistical Analyses

Statistical analyses were performed using Statgraphics Plus for Windows 4.1. All measurements were conducted in octuplicates (n = 8), and the values were averaged and reported along with the standard errors (±S.E.). All data were subjected to a three-way ANOVA (4 species × 3 light spectra × 8 replicates), and differences among means were determined by Fisher’s least significant difference (LSD) procedure at a p-value ≤ 0.05.

3. Results

3.1. Fresh Weight (FW) and Height (H)

Fresh biomass is an important growth parameter, particularly in microgreens, because consumers are interested in fresh biomass of many aromatic and medicinal species. In this study, significant differences in FW were observed among species and light treatments (Table 2).
The ANOVA showed that chervil accumulated the highest fresh biomass (613 g m−2) under red light and that dill had the lowest value (76.5 g m−2) under blue light. These differences can be attributed to the intrinsic development of each species. Moreover, the effects of different light types on overall fresh biomass also differed significantly. The results set out in Table 2 show that T2 treatment led to a better biomass accumulation in fenugreek, dill, and chervil, but T1 was the optimal light for growth development in basil. Comparable results were obtained concerning plant height for the four species studied.

3.2. Nitrate Content

The results set out in Table 3 show nitrate contents for the four species studied under the three light spectra. A significant variation in nitrate content was observed among different species and light treatments. The lowest nitrate value (220 mg 100 g−1 FW) was recorded in chervil under T2 treatment, while the highest value (505.7 mg 100 g−1 FW) was obtained in basil under the white-light treatment T0. Taking average values for all three light treatments, the highest nitrate concentration was recorded in basil (470.5 mg 100 g−1 FW), followed by fenugreek (355.7 mg 100 g−1 FW), dill (313.8 mg 100 g−1 FW) and, finally, chervil, which presented the lowest average value (254.8 mg 100 g−1 FW). The white light T0 was the best treatment for nitrate contents within all species.

3.3. Chlorophyll and Carotenoid Contents

Table 4 presents the contents of chlorophyll and carotenoid pigments in basil, fenugreek, dill, and chervil microgreens cultivated under different light-emitting diode lamp spectra. These results show that fenugreek was the species that accumulated the highest contents of both chlorophyll and carotenoid pigments. Chlorophyll content ranged from 1.1 mg g−1 FW for dill under white light (T0) to 3.8 mg g−1 FW for fenugreek under red light (T2). The ANOVA (Table 4) showed significant differences in chlorophyll contents between species. Fenugreek accumulated, on average, 3.45 mg g−1 of chlorophyll, which was higher than the concentrations in basil (2.76 mg g−1 FW), chervil (2.63 mg g−1 FW), and dill (1.20 mg g−1 FW). In terms of different light spectra, the differences in chlorophyll contents were not significant, although T2 and T1 treatments did induce a slight increase compared with the control (T0).
Regarding carotenoid pigments, the differences were statistically significant between species and also between light spectra. Fenugreek showed the highest accumulation of carotenoids (0.058 mg g−1 FW), while dill showed the lowest concentration (0.015 mg g−1 FW). The red light T2 led to the best chlorophyll and carotenoid contents for all species, with is very important for photosynthetic activity.

3.4. Glucose, Proline, and Proteins Contents

Glucose and proline contents in basil, fenugreek, dill, and chervil microgreens cultivated under different light-emitting diode lamp spectra are presented in Table 5. These results show that Fenugreek accumulated more glucose than the other species studied. However, dill and fenugreek accumulated more proline under the T2 treatment like the other species. Glucose contents ranged from 0.9 mg g−1 FW for dill under white light (T0) to 6.2 mg g−1 FW for fenugreek under red light (T2). The ANOVA showed significant differences in glucose concentration among species (Table 5). Fenugreek accumulated, on average, 6.2 mg g−1 FW of glucose, which was higher than the concentrations in chervil (5.7 mg g−1 FW), basil (5.2 mg g−1 FW), and dill (5.4 mg g−1 FW). However, the differences in glucose content among light spectra were not significant for fenugreek, although T2 and T1 treatments did induce a significant increase, compared with T0, in basil, dill, and chervil (Table 5). The T2 treatment led to the highest contents of both glucose and proline for all species.
In relation to protein levels (Table 6), we found the highest value in fenugreek under T2 treatment; for this species, the protein content was higher under T2, compared with T0 and T1, by 22 and 47%, respectively. Overall, the amounts of protein in different plant species under different light treatments ranged from 4.9 mg g−1 FW in dill to 22.5 mg g−1 FW in fenugreek, in both cases under red-light treatment (T2).
The ANOVA results (Table 6) showed significant differences in protein concentrations among species. However, the differences between light spectra were statistically significant only for dill. Although the T1 and T2 treatments induced slight increases in protein, compared to control, in basil, fenugreek, and chervil, both T1 and T2 treatments led to reduced protein concentrations in dill plants.

4. Discussion

4.1. Fresh Weight (FW) and Height (H)

Microgreens are crops with a short growth period, so the effect of light spectra on their yields might result more from all the phenomena induced by light, which modify the shape and color of plants, than from photosynthesis [17]. Pennisi et al. [24] have shown that the spectral composition of light not only alters biomass growth but also modifies stomatal functionality and overall water use in basil plants. The effects of lighting on vegetative growth observed in this study are in line with the findings of Ferrón-Carrillo et al. [25], who obtained similar results for three lettuce cultivars using the same continuous light-emitting diodes with longer red wavelength (T2), compared with control white LED lamps (T0). Contrarily, Nájera and Urrestarazu [26] studied the effects of LED light intensity and spectral quality on six vegetables and concluded that the use of Valoya’s wide-spectrum AP67 (T2 in our experiment) contributed to a significant increase in fresh weight, compared with control (T0, white Roblan), under low and high light intensities, except in the case of the radish cv. Redondo rojo, where the difference in fresh weight between wide-spectrum AP67 and T0 was not significant at low-intensity lighting. Chang and Chang [27] stated that a good combination of light wavebands could increase the efficiency of photosynthesis and promote growth development. We know from other studies that the effects of spectra on photosynthesis can vary between species and even among varieties [28].

4.2. Nitrate Content

Recently, there has been an increased interest in LED lighting systems, particularly for the cultivation of microgreens. This interest is due to their great potential for promoting plant growth, development, and metabolism control. Variation of nitrate content in plants is a multi-factorial process. Reports have indicated that nutritional, environmental, and physiological conditions are the main drivers of nitrate accumulation in plants [29]. Light has been identified as the major environmental factor determining nitrate content in vegetables [30]. Many studies have linked the quality and intensity of light with nitrate concentrations in plants [31,32]. The accumulation of nitrate in vegetables occurs most frequently under poor light conditions, for example, in greenhouses in winter; and in green leafy vegetables, such as lettuce and spinach [33,34]. The physiological explanation of the relationship between light intensity and nitrate content has been well described in recent decades. Nitrate reductase is activated by illumination and consequently decreases nitrate accumulation [33].
Regarding the light treatments in the current study, our results showed that T0 induced significant increases in nitrate concentration of 21%, compared with T1, and 13%, compared with T2. Similar results were reported in a previous study on microgreens and baby-leaf stages of lettuce using the same lighting spectra [25]. Ohashi et al. [35] found nitrate levels were 63–65% lower in leaf lettuce and 63% lower in spinach when these species were grown for 37 days after germination under red or blue fluorescent light, compared with plants cultivated under white light. However, no significant differences in nitrate content were found for Komatsuna plants grown under the same light treatments, indicating that plants’ response to light may also depend on the particular crops and cultivars involved [35].

4.3. Chlorophyll and Carotenoid Contents

It is recognized that chlorophyll and carotenoid pigments use light most efficiently in the red and blue wavelengths. Wang et al. [36] reported that blue light enhanced the expression of different enzymes, such as FeCH, GluTR, and MgCH, which regulate chlorophyll synthesis. In the case of dill, chlorophyll biosynthesis is greater under blue light. Red light is less conducive to chlorophyll biosynthesis because it reduces the tetrapyrrole precursor 5-aminolevulinic acid [37,38].
In our experiment, different light treatments induced significant differences in carotenoid contents. Red light (T2) produced an increase in carotenoid synthesis of 143%, compared with white light (T0), while blue light (T1) produced a corresponding increase of 68%. These results are consistent with recently published work by our team on lettuce [25], in which the authors reported an increase in carotenoids of 11.5% using the same T2 lamps compared with the control light. Previously, researchers have studied the effect of LEDs on the growth and yields of wheat Triticum aestivum [39,40], radish Raphanus sativus, lettuce, and spinach Spinacia oleracea [41,42,43]. These authors concluded that red light supplemented with blue produced the highest yield levels.

4.4. Glucose, Proline, and Proteins Contents

Our results for glucose were similar to those obtained by Li et al. [44], who found that soluble sugar content in Gossypium hirsutum L. was highest in seedlings grown under red LED light. Similar results were obtained for Chinese cabbage Brassica campestris L. by Li et al. [45] and for apple by Lekkham et al. [46]. Similarly, Bantis et al. [47] found that, in tomatoes, monochromatic red light increased the content of fructose and glucose. Contrarily, Viršilė et al. [48] reported that supplemental lighting had no noticeable effect on glucose and maltose contents in green-leaf lettuce; however, in red-leaf lettuce cultivated under supplemental orange light, a slight decrease in glucose content was observed. In relation to proline content, Makowski et al. [49] found that blue-red LED light did not change the levels of this osmoprotectant in Dionaea muscipula, but did increase such levels in Drosera peltata, compared with plants cultivated under fluorescent light of the same intensity (Table 7).
In the current study, dill showed the highest proline accumulation (111.3 mg g−1 FW), while chervil produced the lowest concentration (60.4 mg g−1 FW). Furthermore, different light treatments induced significant differences in proline contents. Compared with white light (T0), red light (T2) induced 24% higher proline synthesis, and blue light (T1) induced an increase of 10%.
Bantis et al. [47] reported that blue and red-blue lights increased the contents of soluble proteins, chlorophylls, and carotenoids. More recently, Gyugos et al. [50] found that blue, red, and far-red spectral components increased the proline content in wheat. Viršilė et al. [48] reported that supplemental light colors had no remarkable effect on total protein content. In addition, Chen et al. [51] reported that higher levels of soluble proteins were obtained using monochromatic blue light, compared with a combination of red and blue lights. Finally, Ouzounis et al. [28] reported that levels of soluble protein were significantly increased when blue light was supplemented with red light.

5. Conclusions

The response of plants to LED light treatments depends on the species and the studied parameters. In this study, vegetative growth (fresh weight and height) was improved by red-spectrum light (T2) in fenugreek, dill, and chervil but by blue light (T1) in basil. Regarding nitrate accumulation in microgreens, we found that using white-spectrum (T0) light resulted in significantly increased nitrate content in all species studied. Blue light led to decreased nitrate content in basil, fenugreek, and dill microgreens, and red light induced a considerable decrease in nitrate concentration in chervil microgreens. In addition, different types of light induced different effects on chlorophyll and protein contents, which also differed depending on the species. For instance, basil, fenugreek, and chervil accumulated more chlorophyll and protein under red light, while dill accumulated more chlorophyll under blue light and more protein under white light. Finally, the maximum synthesis of the carotenoids, glucose, and proline of the studied species was recorded under red light. This study concludes that producing micro-green under artificial LED lighting is a very important model to solve the problem of decreasing stocks of arable land per person due to the relentless trends of increasing population, urbanization, decreasing water supply, and climate change. Solutions to reduce the effect of dwindling land resources for agriculture (due to drought and salinity), the rapid growth of the world’s population, which is expected to reach around 9.7 billion in 2050, the increased energy, transport, and fertilizer prices related to future food production are illustrated by urban vertical farming under LED artificial light which involves greater use of technology and automation for the optimization of land use and which aims to dramatically increase productivity and reduce the environmental footprint within a framework of urban, indoor, and air-conditioned high-rise buildings, greenhouses, and growth chambers. This type of agricultural production can offer many potential benefits as a clean and green food source; biosecurity, freedom from pests, and a large labor market.

Author Contributions

Conceptualization, H.E.H.; Methodology, H.E.H., A.S., S.B., M.U. and M.B.; Investigation, H.E.H., M.A., A.M. and M.B.; Data curation, S.E.; Writing—original draft, H.E.H. and M.B.; Chemical analysis, M.K., J.I., P.P. and H.E.H. All authors have read and agreed to the published version of the manuscript.

Funding

This research received no external funding.

Data Availability Statement

The data supporting the findings of this study are available within the article.

Conflicts of Interest

The authors declare no conflict of interest.

References

  1. Kim, M.J.; Moon, Y.; Tou, J.C.; Mou, B.; Waterland, N.L. Nutritional Value, Bioactive Compounds and Health Benefits of Lettuce (Lactuca sativa L.). J. Food Compos. Anal. 2016, 49, 19–34. [Google Scholar] [CrossRef]
  2. Xiao, Z.; Lester, G.E.; Luo, Y.; Wang, Q. Assessment of Vitamin and Carotenoid Concentrations of Emerging Food Products: Edible Microgreens. J. Agric. Food Chem. 2012, 60, 7644–7651. [Google Scholar] [CrossRef]
  3. Ghoora, M.D.; Babu, D.R.; Srividya, N. Nutrient Composition, Oxalate Content and Nutritional Ranking of Ten Culinary Microgreens. J. Food Compos. Anal. 2020, 91, 103495. [Google Scholar] [CrossRef]
  4. Pinto, E.; Almeida, A.A.; Aguiar, A.A.; Ferreira, I.M.P.L.V.O. Comparison between the Mineral Profile and Nitrate Content of Microgreens and Mature Lettuces. J. Food Compos. Anal. 2015, 37, 38–43. [Google Scholar] [CrossRef]
  5. de la Fuente, B.; López-García, G.; Máñez, V.; Alegría, A.; Barberá, R.; Cilla, A. Evaluation of the Bioaccessibility of Antioxidant Bioactive Compounds and Minerals of Four Genotypes of Brassicaceae Microgreens. Foods 2019, 8, 250. [Google Scholar] [CrossRef] [Green Version]
  6. Kyriacou, M.C.; Rouphael, Y.; Di Gioia, F.; Kyratzis, A.; Serio, F.; Renna, M.; De Pascale, S.; Santamaria, P. Micro-Scale Vegetable Production and the Rise of Microgreens. Trends Food Sci. Technol. 2016, 57, 103–115. [Google Scholar] [CrossRef]
  7. Azizi, M. Study of Four Improved Cultivars of Matricaria chamomilla L. in Climatic Condition of Iran. Iran. J. Med. Aromat. Plants Res. 2007, 22, 386–396. [Google Scholar]
  8. Sangwan, R.S.; Chaurasiya, N.D.; Lal, P.; Misra, L.; Tuli, R.; Sangwan, N.S. Withanolide A Is Inherently de Novo Biosynthesized in Roots of the Medicinal Plant Ashwagandha (Withania Somnifera). Physiol. Plant. 2008, 133, 278–287. [Google Scholar] [CrossRef] [PubMed]
  9. Lee, S.-J.; Umano, K.; Shibamoto, T.; Lee, K.-G. Identification of Volatile Components in Basil (Ocimum basilicum L.) and Thyme Leaves (Thymus vulgaris L.) and Their Antioxidant Properties. Food Chem. 2005, 91, 131–137. [Google Scholar] [CrossRef]
  10. Zandi, P.; Basu, S.K.; Khatibani, L.B.; Balogun, M.O.; Aremu, M.O.; Sharma, M.; Kumar, A.; Sengupta, R.; Li, X.; Li, Y.; et al. Fenugreek (Trigonella foenum-graecum L.) Seed: A Review of Physiological and Biochemical Properties and Their Genetic Improvement. Acta Physiol. Plant. 2014, 37, 1714. [Google Scholar] [CrossRef]
  11. Kaur, V.; Kaur, R.; Bhardwaj, U. A Review on Dill Essential Oil and Its Chief Compounds as Natural Biocide. Flavour Fragr. J. 2021, 36, 412–431. [Google Scholar] [CrossRef]
  12. Hendawy, S.F.; Hussein, M.S.; El-Gohary, A.E.; Soliman, W.S. Chemical Constituents of Essential Oil in Chervil (Anthriscus cerefolium L. Hoffm.) Cultivated in Different Locations. J. Essent. Oil Bear. Plants 2019, 22, 264–272. [Google Scholar] [CrossRef]
  13. Delian, E.; Chira, A.; Bădulescu, L.; Chira, L. Insights into Microgreens Physiology. Sci. Pap.–Ser. B Hortic. 2015, 59, 447–454. [Google Scholar]
  14. Avercheva, O.V.; Berkovich, Y.A.; Erokhin, A.N.; Zhigalova, T.V.; Pogosyan, S.I.; Smolyanina, S.O. Growth and Photosynthesis of Chinese Cabbage Plants Grown under Light-Emitting Diode-Based Light Source. Russ. J. Plant Physiol. 2009, 56, 14–21. [Google Scholar] [CrossRef]
  15. Zhang, X.; Bian, Z.; Yuan, X.; Chen, X.; Lu, C. A Review on the Effects of Light-Emitting Diode (LED) Light on the Nutrients of Sprouts and Microgreens. Trends Food Sci. Technol. 2020, 99, 203–216. [Google Scholar] [CrossRef]
  16. Morrow, R.C. LED Lighting in Horticulture. HortScience 2008, 43, 1947–1950. [Google Scholar] [CrossRef] [Green Version]
  17. Ying, Q.; Kong, Y.; Jones-Baumgardt, C.; Zheng, Y. Responses of Yield and Appearance Quality of Four Brassicaceae Microgreens to Varied Blue Light Proportion in Red and Blue Light-Emitting Diodes Lighting. Sci. Hortic. 2020, 259, 108857. [Google Scholar] [CrossRef]
  18. Urrestarazu, M.; Nájera, C.; del Mar Gea, M. Effect of the Spectral Quality and Intensity of Light-Emitting Diodes on Several Horticultural Crops. HortScience 2016, 51, 268–271. [Google Scholar] [CrossRef] [Green Version]
  19. Sonneveld, C.; Straver, N. Voedingsoplossingen Voor Groenten en Bloemen Geteeld in Water of Substraten = Nutrient Solutions for Vegetables and Flowers Grown in Water or Substrates; No. 8; Proefstation voor Tuinbouw onder Glas: Naaldwijk, The Netherlands, 1994. [Google Scholar]
  20. Lichtenthaler, H.K. [34] Chlorophylls and Carotenoids: Pigments of Photosynthetic Biomembranes. In Methods in Enzymology; Plant Cell Membranes; Academic Press: Cambridge, MA, USA, 1987; Volume 148, pp. 350–382. [Google Scholar]
  21. Irigoyen, J.J.; Einerich, D.W.; Sánchez-Díaz, M. Water Stress Induced Changes in Concentrations of Proline and Total Soluble Sugars in Nodulated Alfalfa (Medicago sativa) Plants. Physiol. Plant. 1992, 84, 55–60. [Google Scholar] [CrossRef]
  22. Paquin, R.; Lechasseur, P. Observations Sur Une Méthode de Dosage de La Proline Libre Dans Les Extraits de Plantes. Can. J. Bot. 1979, 57, 1851–1854. [Google Scholar] [CrossRef]
  23. Bradford, M.M. A Rapid and Sensitive Method for the Quantitation of Microgram Quantities of Protein Utilizing the Principle of Protein-Dye Binding. Anal. Biochem. 1976, 72, 248–254. [Google Scholar] [CrossRef] [PubMed]
  24. Pennisi, G.; Blasioli, S.; Cellini, A.; Maia, L.; Crepaldi, A.; Braschi, I.; Spinelli, F.; Nicola, S.; Fernandez, J.A.; Stanghellini, C.; et al. Unraveling the Role of Red:Blue LED Lights on Resource Use Efficiency and Nutritional Properties of Indoor Grown Sweet Basil. Front. Plant Sci. 2019, 10, 305. [Google Scholar] [CrossRef] [PubMed] [Green Version]
  25. Ferrón-Carrillo, F.; Guil-Guerrero, J.L.; González-Fernández, M.J.; Lyashenko, S.; Battafarano, F.; da Cunha-Chiamolera, T.P.L.; Urrestarazu, M. LED Enhances Plant Performance and Both Carotenoids and Nitrates Profiles in Lettuce. Plant Foods Hum. Nutr. 2021, 76, 210–218. [Google Scholar] [CrossRef] [PubMed]
  26. Nájera, C.; Urrestarazu, M. Effect of the Intensity and Spectral Quality of LED Light on Yield and Nitrate Accumulation in Vegetables. HortScience 2019, 54, 1745–1750. [Google Scholar] [CrossRef] [Green Version]
  27. Chang, C.-L.; Chang, K.-P. The Growth Response of Leaf Lettuce at Different Stages to Multiple Wavelength-Band Light-Emitting Diode Lighting. Sci. Hortic. 2014, 179, 78–84. [Google Scholar] [CrossRef]
  28. Ouzounis, T.; Heuvelink, E.; Ji, Y.; Schouten, H.J.; Visser, R.G.F.; Marcelis, L.F.M. Blue and Red LED Lighting Effects on Plant Biomass, Stomatal Conductance, and Metabolite Content in Nine Tomato Geno-types. VIII International Symposium on Light in Horticulture 1134. 2016. Available online: https://www.ishs.org/ishs-article/1134_34 (accessed on 1 January 2023).
  29. Anjana, S.U.; Iqbal, M. Nitrate Accumulation in Plants, Factors Affecting the Process, and Human Health Implications. A Review. Agron. Sustain. Dev. 2007, 27, 45–57. [Google Scholar] [CrossRef]
  30. Gruda, N. Impact of Environmental Factors on Product Quality of Greenhouse Vegetables for Fresh Consumption. Crit. Rev. Plant Sci. 2005, 24, 227–247. [Google Scholar] [CrossRef]
  31. Cantliffe, D.J. Nitrate Accumulation in Spinach Grown Under Different Light Intensities1,2. J. Am. Soc. Hortic. Sci. 1972, 97, 152–154. [Google Scholar] [CrossRef]
  32. Aslam, M.; Oaks, A.; Huffaker, R.C. Effect of Light and Glucose on the Induction of Nitrate Reductase and on the Distribution of Nitrate in Etiolated Barley Leaves 1. Plant Physiol. 1976, 58, 588–591. [Google Scholar] [CrossRef] [Green Version]
  33. Blom-Zandstra, M.; Lampe, J.E.M.; Ammerlaan, F.H.M. C and N Utilization of Two Lettuce Genotypes during Growth under Non-Varying Light Conditions and after Changing the Light Intensity. Physiol. Plant. 1988, 74, 147–153. [Google Scholar] [CrossRef]
  34. Blom-Zandstra, M.; Lampe, J.E.M. The Role of Nitrate in the Osmoregulation of Lettuce (Lactuca sativa L.) Grown at Different Light Intensities. J. Exp. Bot. 1985, 36, 1043–1052. [Google Scholar] [CrossRef]
  35. Ohashi-Kaneko, K.; Takase, M.; Kon, N.; Fujiwara, K.; Kurata, K. Effect of Light Quality on Growth and Vegetable Quality in Leaf Lettuce, Spinach and Komatsuna. Environ. Control Biol. 2007, 45, 189–198. [Google Scholar] [CrossRef] [Green Version]
  36. Wang, H.; Gu, M.; Cui, J.; Shi, K.; Zhou, Y.; Yu, J. Effects of Light Quality on CO2 Assimilation, Chlorophyll-Fluorescence Quenching, Expression of Calvin Cycle Genes and Carbohydrate Accumulation in Cucumis Sativus. J. Photochem. Photobiol. B Biol. 2009, 96, 30–37. [Google Scholar] [CrossRef]
  37. Sood, S.; Gupta, V.; Tripathy, B.C. Photoregulation of the Greening Process of Wheat Seedlings Grown in Red Light*. Plant Mol. Biol. 2005, 59, 269–287. [Google Scholar] [CrossRef] [PubMed]
  38. Fan, X.-X.; Xu, Z.-G.; Liu, X.-Y.; Tang, C.-M.; Wang, L.-W.; Han, X. Effects of Light Intensity on the Growth and Leaf Development of Young Tomato Plants Grown under a Combination of Red and Blue Light. Sci. Hortic. 2013, 153, 50–55. [Google Scholar] [CrossRef]
  39. Goins, G.D.; Yorio, N.C.; Sanwo, M.M.; Brown, C.S. Photomorphogenesis, Photosynthesis, and Seed Yield of Wheat Plants Grown under Red Light-Emitting Diodes (LEDs) with and without Supplemental Blue Lighting. J. Exp. Bot. 1997, 48, 1407–1413. [Google Scholar] [CrossRef] [Green Version]
  40. Tripathy, B.C.; Brown, C.S. Root-Shoot Interaction in the Greening of Wheat Seedlings Grown under Red Light. Plant Physiol. 1995, 107, 407–411. [Google Scholar] [CrossRef] [PubMed] [Green Version]
  41. Yanagi, T.; Okamoto, K.; Takita, S. Effects of blue, red, and blue/red lights of two different PPF levels on growth and morphogenesis of lettuce plants. Acta Hortic. 1996, 117–122. [Google Scholar] [CrossRef] [PubMed]
  42. Yorio, N.C.; Goins, G.D.; Kagie, H.R.; Wheeler, R.M.; Sager, J.C. Improving Spinach, Radish, and Lettuce Growth under Red Light-Emitting Diodes (LEDs) with Blue Light Supplementation. HortScience 2001, 36, 380–383. [Google Scholar] [CrossRef] [Green Version]
  43. Yorio, N.C.; Wheeler, R.M.; Goins, G.D.; Sanwo-Lewandowski, M.M.; Mackowiak, C.L.; Brown, C.S.; Sager, J.C.; Stutte, G.W. Blue light requirements for crop plants used in bioregenerative life support systems. Life Support Biosph. Sci. 1998, 5, 119–128. [Google Scholar]
  44. Li, H.; Xu, Z.; Tang, C. Effect of Light-Emitting Diodes on Growth and Morphogenesis of Upland Cotton (Gossypium hirsutum L.) Plantlets in Vitro. Plant Cell Tiss. Organ. Cult. 2010, 103, 155–163. [Google Scholar] [CrossRef]
  45. Li, H.; Tang, C.; Xu, Z.; Liu, X.; Han, X. Effects of Different Light Sources on the Growth of Non-Heading Chinese Cabbage (Brassica campestris L.). JAS 2012, 4, 262. [Google Scholar] [CrossRef] [Green Version]
  46. Lekkham, P.; Srilaong, V.; Pongprasert, N.; Kondo, S. Anthocyanin Concentration and Antioxidant Activity in Light-Emitting Diode (LED)-Treated Apples in a Greenhouse Environmental Control System. Fruits 2016, 71, 269–274. [Google Scholar] [CrossRef] [Green Version]
  47. Bantis, F.; Smirnakou, S.; Ouzounis, T.; Koukounaras, A.; Ntagkas, N.; Radoglou, K. Current Status and Recent Achievements in the Field of Horticulture with the Use of Light-Emitting Diodes (LEDs). Sci. Hortic. 2018, 235, 437–451. [Google Scholar] [CrossRef]
  48. Viršilė, A.; Brazaitytė, A.; Vaštakaitė-Kairienė, V.; Miliauskienė, J.; Jankauskienė, J.; Novičkovas, A.; Laužikė, K.; Samuolienė, G. The Distinct Impact of Multi-Color LED Light on Nitrate, Amino Acid, Soluble Sugar and Organic Acid Contents in Red and Green Leaf Lettuce Cultivated in Controlled Environment. Food Chem. 2020, 310, 125799. [Google Scholar] [CrossRef]
  49. Makowski, W.; Tokarz, B.; Banasiuk, R.; Królicka, A.; Dziurka, M.; Wojciechowska, R.; Tokarz, K.M. Is a Blue–Red Light a Good Elicitor of Phenolic Compounds in the Family Droseraceae? A Comparative Study. J. Photochem. Photobiol. B Biol. 2019, 201, 111679. [Google Scholar] [CrossRef]
  50. Gyugos, M.; Ahres, M.; Gulyás, Z.; Szalai, G.; Darkó, É.; Mednyánszky, Z.; Dey, N.; Kar, R.K.; Simon-Sarkadi, L.; Kocsy, G. Light Spectrum Modifies the Drought-Induced Changes of Glutathione and Free Amino Acid Levels in Wheat. Acta Physiol. Plant. 2021, 43, 90. [Google Scholar] [CrossRef]
  51. Chen, L.; Wang, H.; Gong, X.; Zeng, Z.; Xue, X.; Hu, Y. Transcriptome Analysis Reveals Effects of Red and Blue Light-Emitting Diodes (LEDs) on the Growth, Chlorophyll Fluorescence and Endogenous Plant Hormones of Potato (Solanum tuberosum L.) Plantlets Cultured in Vitro. J. Integr. Agric. 2021, 20, 2914–2931. [Google Scholar] [CrossRef]
Figure 1. Distribution of photon flux in the spectrum from 380 to 780 nm for the three treatments [15]: T0: L18 T8 Roblan® (control); T1: L18 NS1 Valoya® (blue); and T2: L18 AP67 Valoya® (red).
Horticulturae 09 00494 g001
Table 1. Photosynthetic photon flux density (PPFD, μmol m−2 s−1) and illuminance (lux) of light emitting diode (LED) treatments.
TreatmentLamp LEDPPFDIlluminance
T0L18 T8 Roblan®150 ± 7 a6447 ± 186 a
T1L18 NS1 Valoya®141 ± 19 b5161 ± 229 b
T2L18 AP67 Valoya®107 ± 7 c3837 ± 358 c
Different letters indicate significant differences at p ≤ 0.05 by the Tukey test (n = 6).
Table 2. Fresh weight (g m−2) and height (cm) of basil, fenugreek, dill, and chervil microgreens cultivated under three light-emitting diode (LED) treatments. The best light treatment, for each plant species, is bold.
Fresh Weight (g m−2)Height (cm)
BasilFenugreekDillChervilBasilFenugreekDillChervil
T0231.3 ± 12 byBz150.4 ± 29 cC107.9 ± 23 bD258 ± 05 bA4.9 ± 0.4 bB4.5 ± 0.7 cB5.9 ± 0.5 cA5.5 ± 0.5 bA
T1390.7 ± 20 aA156.9 ± 20 bC076.5 ± 08 cD237 ± 06 bB6.0 ± 0.4 aA5.0 ± 0.3 bB5.2 ± 0.3 bB5.2 ± 0.3 bB
T2225 ± 16 bB235.4 ± 23 aB144.0 ± 20 aC613 ± 12 aA5.2 ± 0.2 bC6.2 ± 0.4 aB7.4 ± 0.6 aA7.3 ± 1.0 aA
y Different lowercase letters indicate significant differences among light treatments. Z Different uppercase letters indicate differences among plant species.
Table 3. Nitrate content (mg100 g−1 fresh weight (FW)) of basil, fenugreek, dill, and chervil microgreens cultivated under three light-emitting diode (LED) lamp spectra. The best light treatment, for each plant species, is bold.
TreatmentNitrate Content (mg 100 g−1 FW)
BasilFenugreekDillChervil
T0505.7 ± 43.5 ayAz407.1 ± 26.9 aB360 ± 13.1 aB304.3 ± 12.7 aD
T1447.1 ± 24.3 bA328.6 ± 12.2 bB225.7 ± 7.7 bD240 ± 8.2 bC
T2458.7 ± 11.3 bA331.2 ± 13.6 bC355.7 ± 45.4 aB220 ± 22.0 cD
y Different lowercase letters indicate significant differences among light treatments. Z Different uppercase letters indicate differences among plant species.
Table 4. Chlorophyll and carotenoid contents (mg g−1 FW) of basil, fenugreek, dill, and chervil microgreens cultivated under three light-emitting diode (LED) lamp spectra. The best light treatment, for each plant species, is bold.
Chlorophyll (mg g−1 FW)Carotenoid (mg g−1 FW)
BasilFenugreekDillChervilBasilFenugreekDillChervil
T02.6 ± 0.08 byBz3 ± 0.23 bA1.1 ± 0.03 bC2.5 ± 0.1 bB0.023 ± 0.007 cB0.029 ± 0.005 cA0.015 ± 0.003 cC0.016 ± 0.004 cC
T12.8 ± 0.07 aB3.6 ± 0.14 aA1.3 ± 0.07 aC2.6 ± 0.1 abB0.035 ± 0.007 bB0.046 ± 0.009 bA0.028 ± 0.006 bC0.031 ± 0.008 bBC
T22.9 ± 0.04 aB3.8 ± 0.15 aA1.2 ± 0.04 abC2.8 ± 0.07 aB0.052 ± 0.005 aAB0.058 ± 0.007 aA0.045 ± 0.01 aC0.046 ± 0.008 aBC
y Different lowercase letters indicate significant differences among light treatments. Z Different uppercase letters indicate differences among plant species.
Table 5. Glucose and proline contents (mg g−1 FW) of basil, fenugreek, dill, and chervil microgreens cultivated under three light-emitting diode (LED) lamp spectra. The best light treatment, for each plant species, is bold.
Glucose (mg g−1 FW)Proline (mg g−1 FW)
BasilFenugreekDillChervilBasilFenugreekDillChervil
T02.8 ± 0.06 byAz3.2 ± 0.05 cA0.9 ± 0.025 bC1.3 ± 0.014 cB84.6 ± 10.2 cB88.7 ± 12.6 bA72.7 ± 9.3 cC60.4 ± 5.78 cD
T13 ± 0.023 bB3.8 ± 0.03 bA1.16 ± 0.086 bD2.3 ± 0.043 b C90.4 ± 11 bA92.9 ± 11.8 bA89.6 ± 7.011 bA64.7 ± 8.45 bB
T25.6 ± 0.04 aB6.2 ± 0.033 aA5.4 ± 0.094 aB5.7 ± 0.026 aB95 ± 9.9 aC102.4 ± 14.3 aB111.3 ± 4.3 aA70.9 ± 6.05 aD
y Different lowercase letters indicate significant differences among light treatments. Z Different uppercase letters indicate differences among plant species.
Table 6. Protein content (mg g−1 FW) of basil, fenugreek, dill, and chervil microgreens cultivated under three light-emitting diode (LED) lamp spectra. The best light treatment, for each plant species, is bold.
TreatmentProtein Content (mg g−1 FW)
BasilFenugreekDillChervil
T012.6 ± 1.005 cyBz15.3 ± 1.63 cA9.4 ± 1.02 aC10.3 ± 0.94 bC
T116.3 ± 1.95 bB18.4 ± 1.86 bA7.8 ± 1.36 bD12.6 ± 1.57 aC
T218.6 ± 1.87 aB22.5 ± 2.07 aA4.9 ± 1.03 cD13.2 ± 1.05 aC
y Different lowercase letters indicate significant differences among light treatments. Z Different uppercase letters indicate differences among plant species.
Table 7. The increasing values of glucose, proline, and protein contents using white light, red light, and blue light in previous studies. The best light treatment, for each plant species, is bold.
ReferenceSpeciesLighting ConditionsGlucose (mg g−1 FW)Proteins (mg g−1 FW)Proline (mg g−1 FW)
This studyOcimum basilicum L.Artificial white light2.8 ± 0.06 byAz12.6 ± 1.005 cyBz84.6 ± 10.2 cB
Blue LED light3 ± 0.023 bB16.3 ± 1.95 bB90.4 ± 11 bA
Red LED light5.6 ± 0.04 aB18.6 ± 1.87 aB95 ± 9.9 aC
Trigonella foenum-graecumArtificial white light3.2 ± 0.05 cA15.3 ± 1.63 cA88.7 ± 12.6 bA
Blue LED light3.8 ± 0.03 bA18.4 ± 1.86 bA92.9 ± 11.8 bA
Red LED light6.2 ± 0.033 aA22.5 ± 2.07 aA102.4 ± 14.3 aB
Anethum graveolensArtificial white light0.9 ± 0.025 bC9.4 ± 1.02 aC72.7 ± 9.3 cC
Blue LED light1.16 ± 0.086 bD7.8 ± 1.36 bD89.6 ± 7.011 bA
Red LED light5.4 ± 0.094 aB4.9 ± 1.03 cD111.3 ± 4.3 aA
Anthriscus cerefoliumArtificial white light1.3 ± 0.014 cB10.3 ± 0.94 bC60.4 ± 5.78 cD
Blue LED light2.3 ± 0.043 b C12.6 ± 1.57 aC64.7 ± 8.45 bB
Red LED light5.7 ± 0.026 aB13.2 ± 1.05 aC70.9 ± 6.05 aD
[45]Brassica campestris L.Artificial white light13.3 c12.5 b
Blue LED light37.5 b8.6 bc
Red LED light56.7 a17.5 a
[46]Malus x domesticaArtificial white light20.2 b
Blue LED light24.4 ab
Red LED light30.8 a
[47]Solanum lycopersicumArtificial white light1.7 b
Blue LED light1.25 c
Red LED light1.8 a
y Different lowercase letters indicate significant differences among light treatments. Z Different uppercase letters indicate differences among plant species. Different letters indicate significant differences. These differences were determined by Fisher’s least significant difference (LSD) procedure at a p-value ≤ 0.05.
Disclaimer/Publisher’s Note: The statements, opinions and data contained in all publications are solely those of the individual author(s) and contributor(s) and not of MDPI and/or the editor(s). MDPI and/or the editor(s) disclaim responsibility for any injury to people or property resulting from any ideas, methods, instructions or products referred to in the content.

