
Comparative Analysis of Qualitative Attributes for Selection of Calabaza Genotypes in the Southeast United States
 , and
, and
Abstract
:1. Introduction
2. Materials and Methods
2.1. Calabaza Germplasm
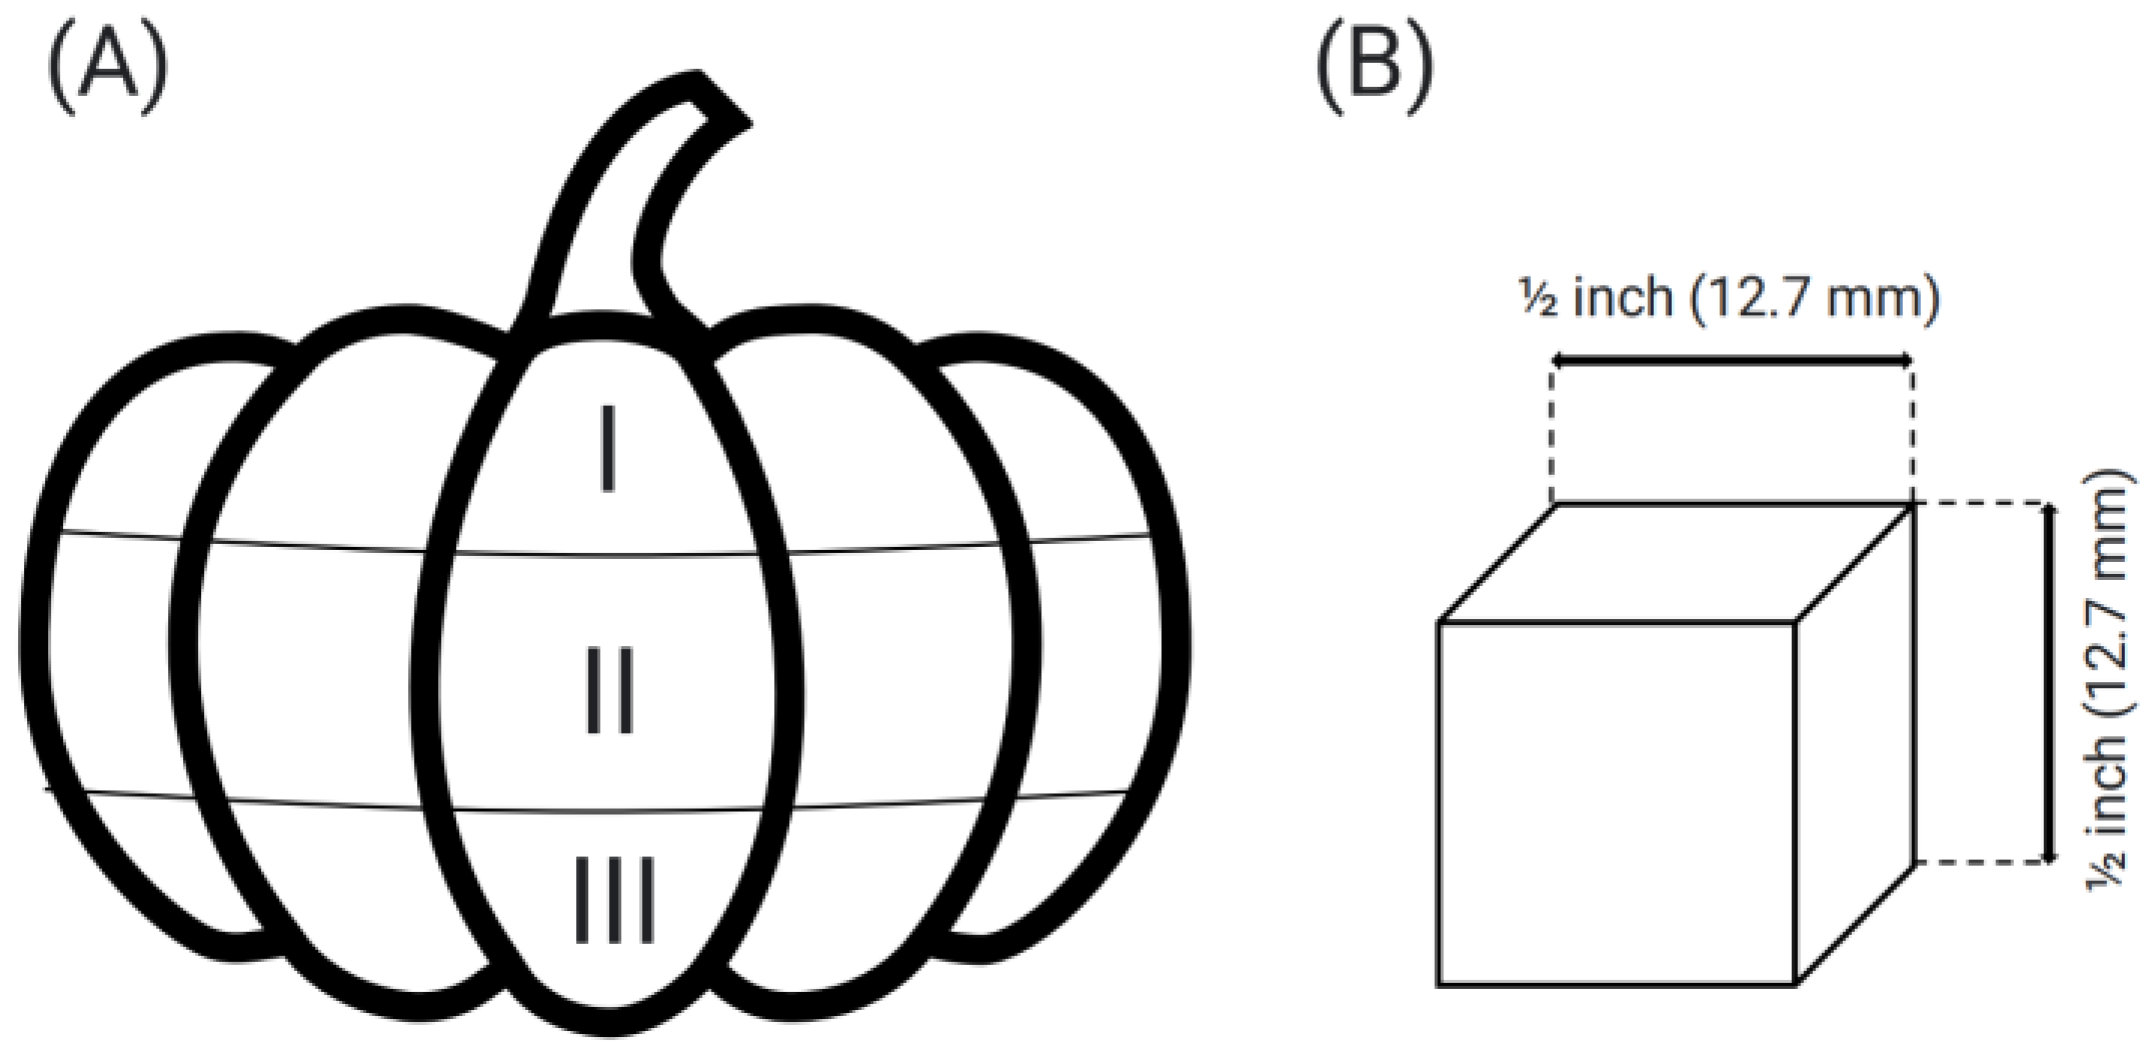
2.2. Crop Management and Harvest
2.3. Curing and Storage
2.4. Processing
2.5. Flesh Yield
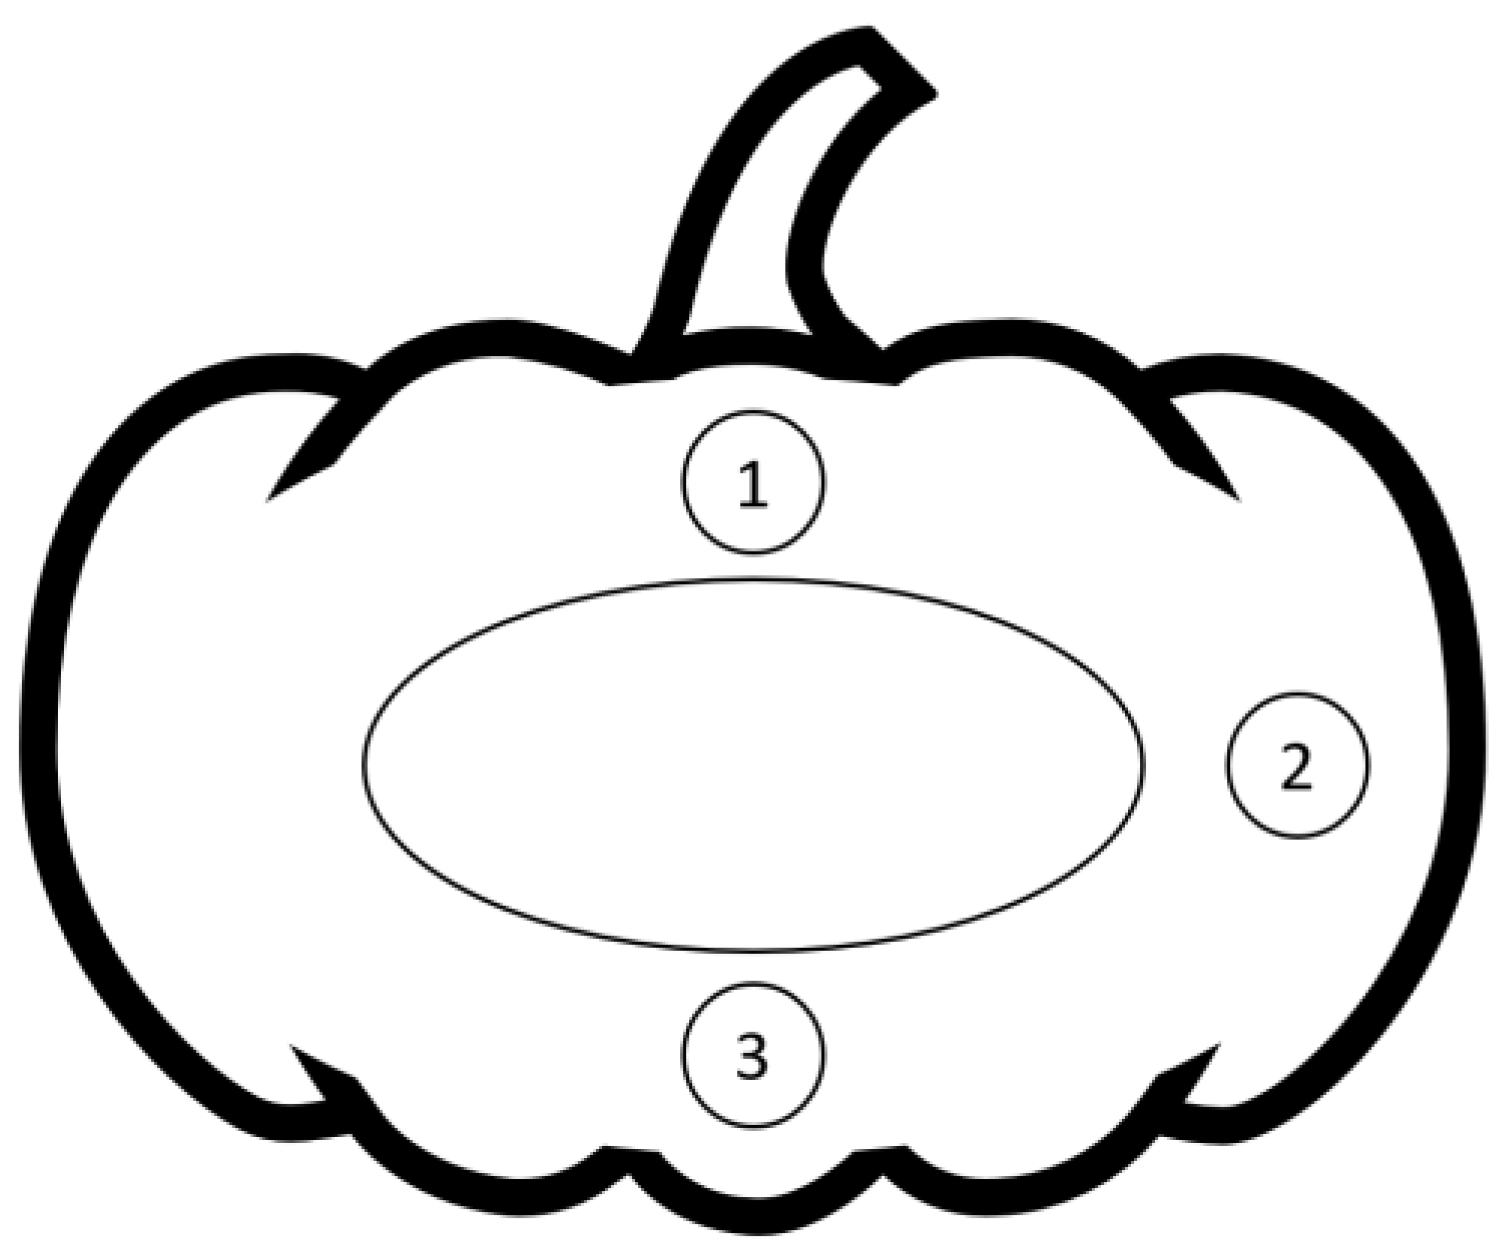
2.6. Color
2.7. Peroxidase (POD)
2.8. Texture (Double Compression)
2.9. Total Soluble Solids (oBrix)
2.10. Titratable Acidity (TA) and pH
2.11. Yeast Fermentable Extract (YFE)
2.12. Statistical Analysis
3. Results and Discussion
3.1. Flesh Yield
3.2. Fruit Shape, Growth Habit, and Flesh Color
3.3. Peroxidase Enzyme (POD)
3.4. oBrix
3.5. Titratable Acidity (Malic Acid), and pH
3.6. Yeast Fermentable Extract (YFE)
3.7. Texture Profile
4. Conclusions
Author Contributions
Funding
Institutional Review Board Statement
Informed Consent Statement
Data Availability Statement
Acknowledgments
Conflicts of Interest
References
- Robinson, R.W.; Decker-Walters, D.S. Cucurbits (Crop Production Science in Horticulture, No. 6), 1st ed.; CAB International: Wallingford, UK, 1997; Volume 6. [Google Scholar]
- Ferriol, M.; Picó, B. Pumpkin and Winter squash. Vegetables I. Handb. Plant Breed. 2008, 1, 317–349. [Google Scholar] [CrossRef]
- Loy, J.B. Breeding squash and pumpkins. In Genetics and Genomics and Breeding of Cucurbits; Wang, Y., Behera, T.K., Kole, C., Eds.; CRC Press: New York, NY, USA, 2012; pp. 106–107. [Google Scholar]
- Paris, H.S. Genetic Analysis and Breeding of Pumpkins and Squash for High Carotene Content. In Vegetables and Vegetable Products. Modern Methods of Plant Analysis; Linskens, H.F., Jackson, J.F., Eds.; Springer: Berlin/Heidelberg, Germany, 1994; Volume 16, pp. 93–104. [Google Scholar] [CrossRef]
- Carle, B.R.; Maynard, D.N.; Wessel-Beaver, L. Tropical Pumpkin Hybrid Development: Landraces to hybrid cultivars. Acta Hortic. 2000, 510, 95–100. [Google Scholar] [CrossRef]
- Maynard, D.N.; Elmstrom, G.W.; Talcott, S.T.; Carle, R.B. ‘El Dorado’ and ‘La estrella’: Compact Plant Tropical Pumpkin Hybrids. HortScience 2002, 37, 831–833. [Google Scholar] [CrossRef]
- Wessel-Beaver, L. Release of ‘Soler’ tropical pumpkin. J. Agric. Univ. Puerto Rico 2005, 89, 263–266. [Google Scholar] [CrossRef]
- Wessel-Beaver, L.; Román-Hernández, O.; Flores-López, L.E. Performance of new tropical pumpkin genotypes under varying cultural practices. J. Agric. Univ. Puerto Rico 2006, 90, 193–206. [Google Scholar] [CrossRef]
- Alamo, C.I. Hortalizas. In Situancion y Perspectivas: Empresas Agricolas de Purto Rico en 1987–1988; Antoni, M., Gonzales, G.M., Velez, S., Eds.; Estacion Experimental Africola, University of Puerto Rico: Mayaguez, Puerto Rico, 1990. [Google Scholar]
- Andres, T.C. Diversity in tropical pumpkin (Cucurbita moschata): Cultivar origin and history. In Progress in Cucurbit Genetics and Breeding Research, Proceedings of Cucurbitaceae 2004, the 8th EUCARPIA Meeting on Cucurbit Genetics and Breeding, Olomouc, Czech Republic, 12–17 June 2004; Lebeda, A., Paris, H.S., Eds.; Palacky University in Olomouc: Olomouc, Czech Republic, 2004. [Google Scholar]
- Maynard, D.N.; Elmstrom, G.W. Calabaza and its production in Florida. Proc. 1993 IFAS Vine Crops Inst. 1993, SSHOS-3, 38–48. [Google Scholar]
- USDA—Economic Research Service. Pumpkin: U.S Imports by Value; USDA: Washington, DC, USA, 2011.
- IRI. Innovation for a Post-Pandemic World; IRI: Chicago, IL, USA, 2021; Available online: https://www.iriworldwide.com/IRI/media/Library/IRI-TL-Demand-Pockets-Part-3-Innovation-2-17-2021-vF.pdf (accessed on 21 December 2022).
- USDA—ERS. Vegetables 2020 Summary. 2021. Available online: https://downloads.usda.library.cornell.edu/usda-esmis/files/02870v86p/j6731x86f/9306tr664/vegean21.pdf (accessed on 7 February 2022).
- Flores, A.; Lopez, M.H.; Krogstad, J.M. U.S. Hispanic Population Reached Newhigh in 2018, but Growth has Slowed. Pew Research Center. 2018. Available online: https://www.pewresearch.org/fact-tank/2019/07/08/u-s-hispanic-population-reached-new-high-in-2018-but-growth-has-slowed/ (accessed on 2 September 2021).
- U.S Census Bureau. Quick Facts (Florida). 2019. Available online: https://www.census.gov/quickfacts/fact/table/FL/RHI725218 (accessed on 4 September 2021).
- De Silva, M.; Sousa, P.H.; Figueiredo, R.W.; Gouveia, S.T.; Lima, J.S. Cooking effects on bioactive compounds and sensory acceptability in pumpkin (Cucurbita moschata CV. Leite). Rev. Cienc. Agron. 2019, 50, 394–401. [Google Scholar] [CrossRef]
- Mashiane, P.; Mashitoa, F.M.; Slabbert, R.M.; Sivakumar, D. Impact of household cooking techniques on colour, antioxidant and sensory properties of African pumpkin and pumpkin leaves. Int. J. Gastron. Food Sci. 2021, 23, 100307. [Google Scholar] [CrossRef]
- Dhiman, A.K.; Sharma, K.D.; Attri, S. Functional constituents and processing of pumpkin: A review. J. Food Sci. Technol. 2009, 46, 411–417. [Google Scholar]
- Koh, W.Y.; Utra, U.; Rosma, A.; Effarizah, M.E.; Rosli, W.I.; Park, Y.-H. Development of a novel fermented pumpkin-based beverage inoculated with water kefir grains: A response surface methodology approach. Food Sci. Biotechnol. 2017, 27, 525–535. [Google Scholar] [CrossRef]
- Rakcejeva, T.; Galoburda, R.; Cude, L.; Strautniece, E. Use of dried pumpkins in wheat bread production. Procedia Food Sci. 2011, 1, 441–447. [Google Scholar] [CrossRef] [Green Version]
- Damerow, G. The Perfect Pumpkin; Storey Communications: North Adams, MA, USA, 1997; pp. 150–189. ISBN 978-0-88266-993-9. [Google Scholar]
- Sharma, S.; Thakur, A.D.; Chauhan, P.K.; Nagraik, R.; Sharma, A.; Kumar, D.; Thakur, N. Studies on development of pumpkin based antioxidant rich table wine. Vegetos 2021, 34, 161–167. [Google Scholar] [CrossRef]
- Stern, L. Fermentation Dreams. Diary of a Detour; Duke University Press: New York, NY, USA, 2020; Volume 76, pp. 306–308. [Google Scholar] [CrossRef]
- Keum, J. Studies on Garlic and Pumpkin Vineger. Korean J. Food Nutr. 1999, 12, 518–522. [Google Scholar]
- Jacobo-Valenzuela, N.; de Zazueta-Morales, J.; Gallegos-Infante, J.A.; Aguilar-Gurierrez, F.; Camacho-Hernandez, I.L.; Rocha-Guzman, N.E.; Gonzalez-Laredo, R.F. Chemical and physicochemical characterization of winter squash (Cucurbita moschata D.). Not. Bot. Horti Agrobot. 2011, 39, 34. [Google Scholar] [CrossRef] [Green Version]
- Armesto, J.; Rocchetti, G.; Senizza, B.; Pateiro, M.; Barba, F.J.; Domínguez, R.; Lucini, L.; Lorenzo, J.M. Nutritional characterization of butternut squash (Cucurbita moschata D.): Effect of Variety (Ariel vs. pluto) and farming type (conventional vs. organic). Food Res. Int. 2020, 132, 109052. [Google Scholar] [CrossRef] [PubMed]
- Luz, L.N.; Vettorazzi, J.C.F.; Santa-Catarina, R.; Barros, F.R.; Barros, G.B.A.; Pereira, M.G.; Cardoso, D.L. Sensory acceptance and qualitative analysis of fruits in papaya hybrids. An. Acad. Bras. Cien. 2018, 90, 3693–3703. [Google Scholar] [CrossRef] [PubMed] [Green Version]
- Stephens, J.M. Calabaza—Cucurbita moschata Duch. Ex Lam; University of Florida Institute of Food and Agriculture Sciences EDIS: Gainesville, FL, USA, 2018; Available online: https://edis.ifas.ufl.edu/publication/MV039 (accessed on 28 December 2022).
- Lebeda, A.; Widrlechner, M.; Staub, J.; Ezura, H.; Zalapa, J.; Kristkova, E. Cucurbits (Cucurbitaceae; Cucumis spp., Cucurbita spp., Citrullus spp.). In Genetic Resources, Chromosome Engineering, and Crop Improvement; CRC Press: Boca Raton, FL, USA, 2006; pp. 271–376. [Google Scholar] [CrossRef] [Green Version]
- Dittmar, P.; Agehara, S.; Dufault, N.S. Vegetable Production Handbook of Florida; IFAS Extension, University of Florida: Gainesville, FL, USA, 2022; Volume 26, pp. 95–148. [Google Scholar]
- Gross, K.C.; Wang, C.Y.; Saltveit, M. The Commercial Storage of Fruits, Vegetables, and Florist and Nursery Stocks; USDA: Washington, DC, USA, 2016; Volume 66, pp. 514–517.
- Adeeko, A.; Yudelevich, F.; Raphael, G.; Avraham, L.; Alon, H.; Presman, M.Z.; Alkalai-Tuvia, S.; Paris, H.S.; Fallik, E.; Ziv, C. Quality and storability of trellised greenhouse-grown, winter-harvested, new sweet acorn squash hybrids. Agronomy 2020, 10, 1443. [Google Scholar] [CrossRef]
- Itle, R.A.; Kabelka, E.A. Correlation between L*A*B* color space values and carotenoid content in pumpkins and squash (Cucurbita spp.). HortScience 2009, 44, 633–637. [Google Scholar] [CrossRef] [Green Version]
- Pathare, P.B.; Opara, U.L.; Al-Said, F.A.J. Colour Measurement and Analysis in Fresh and Processed Foods: A Review. Food Bioprocess. Technol. 2013, 6, 36–60. [Google Scholar] [CrossRef]
- Lopez, A.; Pique, M.T.; Boatella, J.; Parcerisa, J.; Romero, A.; Ferra, A.; Garci, J. Influence of drying conditions on the hazelnut quality. III. browning. Dry. Technol. 1997, 15, 989–1002. [Google Scholar] [CrossRef]
- Sampedro, F.; Phillips, J.; Fan, X. Use of response surface methodology to study the combined effects of UV-C and thermal processing on vegetable oxidative enzymes. LWT Food Sci. Technol. 2014, 55, 189–196. [Google Scholar] [CrossRef]
- Zhou, C.L.; Mi, L.; Hu, X.Y.; Zhu, B.H. Evaluation of three pumpkin species: Correlation with physicochemical, antioxidant properties and classification using SPME-GC–MS and E-nose methods. J. Food Sci. Technol. 2017, 54, 3118–3131. [Google Scholar] [CrossRef] [PubMed]
- Marian, P.; Jacek, M.; Paweł, S.; Kazimierz, Z.; Grzegorz, Ł. Evaluation of the hardness of pumpkin pulp depending on the implemented heat treatment. Int. J. Food Eng. 2020, 16, 20180402. [Google Scholar] [CrossRef]
- USDA (United States Department of Agriculture). Technical Procedures Manual—Agricultural Marketing Service; USDA: Washington, DC, USA, 2020; pp. 17–56.
- Papanov, S.I.; Petkova, E.G.; Ivanov, I.G. Analysis of some chemical characteristics of pumpkins of the genus Cucurbita moschata and Cucurbita maxima and their dependence on soil indicators. Bulg. Chem. Commun. 2021, 53, 275–278. [Google Scholar]
- AOAC. Official Methods of Analysis, 17th ed.; Methods 947.05; The Association of Official Analytical Chemists: Gaithersburg, MD, USA, 2000. [Google Scholar]
- ASBC. Yeast fermentable extract. In ASBC Methods of Analysis; ASBC: St. Paul, MN, USA, 2011. [Google Scholar] [CrossRef]
- Gaspera, P.; Teruel, J.; Giardina, E.; Di-Benedetto, A. Physiological and technological consequences of benzyl adenine (BAP) application on butternut squash (Cucurbita moschata Duchesne ex poir.) productivity. Am. J. Exp. Agric. 2016, 13, 1–11. [Google Scholar] [CrossRef]
- Wetzel, J.; Stone, A. Yield response of winter squash to irrigation regime and planting density. HortScience 2019, 54, 1190–1198. [Google Scholar] [CrossRef] [Green Version]
- Almeida Costa, A.I. Chapter 3: Market opportunity identification: A consumer-oriented food classification system for Home Meal Replacement. In New Insights into Consumer-Oriented Food Product Design; Wageningen University: Wageningen, The Netherlands, 2003; pp. 58–84. [Google Scholar]
- Carbonell, M.E.; Wessel-Beaver, L.; Varela, F.; Luciano, B. Pumpkin (Cucurbita moschata) breeding priorities based on a survey among Puerto Rican consumers. J. Agric. Univ. Puerto Rico 1990, 74, 229–236. [Google Scholar] [CrossRef]
- Ferriol, M.; Belén Picó, M.; Nuez, F. Genetic diversity of some accessions of Cucurbita maxima from Spain using RAPD and SBAP markers. Genet. Resour. Crop Evol. 2003, 50, 227–238. [Google Scholar] [CrossRef]
- Men, X.; Choi, S.-I.; Han, X.; Kwon, H.-Y.; Jang, G.-W.; Choi, Y.-E.; Park, S.-M.; Lee, O.-H. Physicochemical, nutritional and functional properties of Cucurbita moschata. Food Sci. Biotechnol. 2020, 30, 171–183. [Google Scholar] [CrossRef]
- Provesi, J.G.; Dias, C.O.; de Mello Castanho Amboni, R.D.; Amante, E.R. Characterisation and stability of quality indices on storage of pumpkin (Cucurbita moschata and Cucurbita maxima) purees. Int. J. Food Sci. Technol. 2011, 47, 67–74. [Google Scholar] [CrossRef]
- Maynard, D.N.; Elmstrom, G.W.; Wessel-Beaver, L. Performance of Calabaza (Cucurbita moschata) hybrids. HortScience 1994, 29, 733f–733. [Google Scholar] [CrossRef]
- Trejo Araya, X.I.; Smale, N.; Zabaras, D.; Winley, E.; Forde, C.; Stewart, C.M.; Mawson, A.J. Sensory perception and quality attributes of high pressure processed carrots in comparison to Raw, sous-vide and cooked carrots. Innov. Food Sci. Emerg. Technol. 2009, 10, 420–433. [Google Scholar] [CrossRef]
- Helyes, L.; Dimény, J.; Pék, Z.; Lugasi, A. Effect of maturity stage on content, color and quality of tomato (Lycopersicon lycopersicum (L.) Karsten) fruit. Int. J. Hortic. Sci. 2006, 12, 41–44. [Google Scholar] [CrossRef]
- Valenta, K.; Bhramdat, H.D.; Calhoun, G.V.; Daegling, D.J.; Nevo, O. Variation in ripe fruit hardness: A mechanical constraint? Oikos 2022. [Google Scholar] [CrossRef]
- Ndiaye, C.; Xu, S.-Y.; Wang, Z. Steam blanching effect on polyphenoloxidase, peroxidase and colour of Mango (Mangifera indica L.) slices. Food Chem. 2009, 113, 92–95. [Google Scholar] [CrossRef]
- Jamali, S.N.; Kashaninejad, M.; Amirabadi, A.A.; Aalami, M.; Khomeiri, M. Kinetics of peroxidase inactivation, color and temperature changes during pumpkin (Cucurbita moschata) blanching using infrared heating. LWT 2018, 93, 456–462. [Google Scholar] [CrossRef]
- Jaiswal, N.; Singh, M.; Dubey, R.S.; Venkataramanappa, V.; Datta, D. Phytochemicals and antioxidative enzymes defence mechanism on occurrence of yellow vein mosaic disease of pumpkin (Cucurbita moschata). 3 Biotech 2012, 3, 287–295. [Google Scholar] [CrossRef] [Green Version]
- Sharma, S.; Ramana Rao, T.V. Nutritional quality characteristics of pumpkin fruit as revealed by its biochemical analysis. Int. Food Res. J. 2013, 20, 309–2316. [Google Scholar]
- Suo, G.; Zhou, C.; Su, W.; Hu, X. Effects of ultrasonic treatment on color, carotenoid content, enzyme activity, rheological properties, and microstructure of Pumpkin Juice during storage. Ultrason. Sonochem. 2022, 84, 105974. [Google Scholar] [CrossRef]
- Tomás-Barberán, F.A.; Espín, J.C. Phenolic compounds and related enzymes as determinants of quality in fruits and vegetables. J. Sci. Food Agric. 2001, 81, 853–876. [Google Scholar] [CrossRef]
- Toivonen PM, A.; Brummell, D.A. Biochemical bases of appearance and texture changes in fresh-cut fruit and vegetables. Postharvest Biol. Technol. 2008, 48, 1–14. [Google Scholar] [CrossRef]
- Hanusz, Z.; Ślaska-Grzywna, B.; Blicharz-Kania, A.; Klimek, K.; Andrejko, D.; Stoma, M. Multivariate analysis of textural properties of butternut squash during thermal treatment. J. Food Meas. Charact. 2018, 12, 2964–2970. [Google Scholar] [CrossRef] [Green Version]
- Corrigan, V.K.; Hedderley, D.I.; Hurst, P.L. Assessment of objective texture measurements for characterising and predicting the sensory quality of squash (Cucurbita maxima). New Zealand J. Crop Hortic. Sci. 2006, 34, 369–379. [Google Scholar] [CrossRef] [Green Version]
- Iacuzzo, F.; Dalla Costa, L. Yield performance, quality characteristics and fruit storability of winter squash cultivars in sub-humid areas. Sci. Hortic. 2009, 120, 330–335. [Google Scholar] [CrossRef]
- Abbas, H.M.; Huang, H.-X.; Huang, W.-J.; Xue, S.-D.; Yan, S.-J.; Wu, T.-Q.; Li, J.-X.; Zhong, Y.-J. Evaluation of metabolites and antioxidant activity in pumpkin species. Nat. Prod. Commun. 2020, 15, 1934578X20920983. [Google Scholar] [CrossRef]
- Harrill, R. Using a Refractometer to Test the Quality of Fruits and Vegetables; Pineknoll Publishing: Keedysville, MD, USA, 1998; pp. 8–27. [Google Scholar]
- Akter, S.; Rasul, M.G.; Islam, A.K.; Rahman, M.M. Genetic variability, correlation and path coefficient analysis of yield and quality traits in pumpkin (Cucurbita moschata Duch Ex Poir.). Bangladesh J. Plant Breed. Genet. 2013, 26, 25–33. [Google Scholar] [CrossRef]
- Alam, M.; Zimmerman, R. Subsurface Drip Irrigation and Plastic Mulch Effects on Yield and Brix Levels of Kabocha Squash, Cucurbita moschata; Department of Biological and Agricultural Engineering, Kansas State University: Manhattan, KS, USA, 2001; Available online: https://www.southwest.k-state.edu/documents/water-management/Kabocha_Study.pdf (accessed on 25 October 2006).
- Byrne, D.H.; Nikolic, A.N.; Burns, E.E. Variability in sugars, acids, firmness, and color characteristics of 12 peach genotypes. J. Am. Soc. Hortic. Sci. 1991, 116, 1004–1006. [Google Scholar] [CrossRef] [Green Version]
- Li, N.; Wang, J.; Wang, B.; Huang, S.; Hu, J.; Yang, T.; Asmutola, P.; Lan, H.; Qinghui, Y. Identification of the carbohydrate and organic acid metabolism genes responsible for Brix in tomato fruit by transcriptome and metabolome analysis. Front. Genet. 2021, 12, 714942. [Google Scholar] [CrossRef] [PubMed]
- Kuti, J.O. Growth and compositional changes during the development of prickly pear fruit. J. Hortic. Sci. 1992, 67, 861–868. [Google Scholar] [CrossRef]
- Nawirska-Olszańska, A.; Biesiada, A.; Sokół-Łętowska, A.; Kucharska, A.Z. Characteristics of organic acids in the fruit of different pumpkin species. Food Chem. 2014, 148, 415–419. [Google Scholar] [CrossRef]
- Pevicharova, G.; Velkov, N. Sensory, chemical and morphological characterization of Cucurbita maxima and Cucurbita moschata genotypes from different geographical origins. Genetika 2017, 49, 193–202. [Google Scholar] [CrossRef]
- Kim, M.Y.; Kim, E.J.; Kim, Y.-N.; Choi, C.; Lee, B.-H. Comparison of the chemical compositions and nutritive values of various pumpkin (Cucurbitaceae) species and parts. Nutr. Res. Pract. 2012, 6, 21. [Google Scholar] [CrossRef] [Green Version]
- Crisosto, C.H.; Crisosto, G.; Bowerman, E. Understanding consumer acceptance of peach, nectarine and plum cultivars. Acta Hortic. 2003, 604, 115–119. [Google Scholar] [CrossRef]
- Gliemmo, M.F.; Latorre, M.E.; Gerschenson, L.N.; Campos, C.A. Color stability of pumpkin (Cucurbita moschata, Duchesne ex poiret) puree during storage at room temperature: Effect of ph, potassium sorbate, ascorbic acid and packaging material. LWT Food Sci. Technol. 2009, 42, 196–201. [Google Scholar] [CrossRef]
- Gliemmo, M.F.; Latorre, M.E.; Narvaiz, P.; Campos, C.A.; Gerschenson, L.N. Effect of gamma irradiation and storage time on microbial growth and physicochemical characteristics of pumpkin (Cucurbita moschata Duchesne ex poiret) puree. Food Sci. Technol. Int. 2013, 20, 71–80. [Google Scholar] [CrossRef]
- Marsh, K.B.; Friel, E.N.; Gunson, A.; Lund, C.; MacRae, E. Perception of flavour in standardised fruit pulps with additions of acids or sugars. Food Qual. Prefer. 2006, 17, 376–386. [Google Scholar] [CrossRef]
- Zinash, A.; Workneh, T.S.; Woldetsadik, K. Effect of accessions on the chemical quality of fresh pumpkin. Afr. J. Biotechnol. 2013, 12, 7092–7098. [Google Scholar]
- Anthon, G.E.; LeStrange, M.; Barrett, D.M. Changes in ph, acids, sugars and other quality parameters during extended vine holding of ripe processing tomatoes. J. Sci. Food Agric. 2011, 91, 1175–1181. [Google Scholar] [CrossRef]
- Goldfein, K.R.; Slavin, J.L. Why sugar is added to Food: Food Science 101. Compr. Rev. Food Sci. Food Saf. 2015, 14, 644–656. [Google Scholar] [CrossRef] [Green Version]
- Maicas, S. The role of yeasts in fermentation processes. Microorganisms 2020, 8, 1142. [Google Scholar] [CrossRef]
- Moreno, S.R.; Curtis, S.J.; Sarkhosh, A.; Sarnoski, P.J.; Sims, C.A.; Dreyer, E.; Rudolph, A.B.; Thompson-Witrick, K.A.; MacIntosh, A.J. Considerations when brewing with fruit juices: A review and Case study using peaches. Fermentation 2022, 8, 567. [Google Scholar] [CrossRef]
- Parcunev, I.; Naydenova, V.; Kostov, G.; Yanakiev, Y.; Popova, Z.; Kaneva, M.; Ignatov, I. Modeling of Alcohol Fermentation in Brewing–Some Practical Approaches. In Proceedings of the 26th European Conference on Modelling and Simulation, Koblenz, Germany, 29 May–1 June 2012; pp. 434–440. [Google Scholar] [CrossRef] [Green Version]
- Ratnayake RM, S.; Hurst, P.L.; Melton, L.D. Influence of cultivar, storage and cooking on the mechanical properties of winter squash (Cucurbita maxima). J. Sci. Food Agric. 2004, 84, 433–440. [Google Scholar] [CrossRef]
- Chandra, M.V.; Shamasundar, B.A. Texture profile analysis and functional properties of gelatin from the skin of three species of fresh water fish. Int. J. Food Prop. 2014, 18, 572–584. [Google Scholar] [CrossRef]


| Entry | Pedigree | Parental Internode |
|---|---|---|
| Waltham Butternut | Open pollinated | Medium vine |
| UFTP 8 | E-5 x TP331 | long x short |
| UFTP 22 | TP331 x TP411 | short x short |
| UFTP 24 | G38-2-38 x JP5 | short x long |
| UFTP 38 | TP331 x Fairytale | short x long |
| UFTP 42 | Soler * x TP331 | long x short |
| Soler | Open pollinated | long |
| La Estrella | G38-2-38 x La Primera | short x long |
| Cultivar | Avg. Total Fruit Weight (kg) | Avg. Fruit Flesh (kg) | Flesh Yield (%) |
|---|---|---|---|
| Waltham Butternut | 0.72 ± 0.18 d | 0.54 ± 0.14 d | 75.17 ± 3.46 c |
| UFTP 8 | 1.62 ± 0.33 c | 1.24 ± 0.27 c | 76.55 ± 3.36 bc |
| UFTP 22 | 1.70 ± 0.35 c | 1.36 ± 0.29 c | 80.18 ± 2.28 a |
| UFTP 24 | 2.51 ± 1.03 b | 1.99 ± 0.90 b | 78. 36 ± 3.77 abc |
| UFTP 38 | 2.75 ± 0.75 b | 2.14 ± 0.63 b | 77.52 ± 3.51 abc |
| UFTP 42 | 2.58 ± 0.77 b | 2.11 ± 0.79 b | 79.88 ± 6.63 ab |
| Soler | 3.50 ± 0.75 a | 2.77 ± 0.64 a | 78.96 ± 3.02 ab |
| La Estrella | 1.82 ± 0.78 c | 1.38 ± 0.62 c | 75.21 ± 4.43 c |
| Cultivar | L* | a* | b* | Chroma | Hue Angle | Illustration (Fruit and Vine) |
|---|---|---|---|---|---|---|
| Waltham Butternut | 69.13 ± 2.02 bc | 22.37 ± 1.75 b | 70.21 ± 2.49 c | 73.93 ± 2.81 c | 72.41 ± 0.91 cd |   |
| UFTP 8 | 67.90 ± 3.03 cd | 25.23 ± 2.23 a | 77.40 ± 2.69 ab | 81.44 ± 2.52 a | 71.93 ± 1.70 d |   |
| UFTP 22 | 69.93 ± 2.55 ab | 22.72 ± 3.42 b | 74.79 ± 2.37 b | 78.21 ± 2.98 b | 73.15 ± 2.11 cd |   |
| UFTP 24 | 68.63 ± 2.15 bc | 20.10 ± 2.43 c | 77.93 ± 4.58 a | 80.52 ± 4.41 ab | 75.50 ± 1.96 b |   |
| UFTP 38 | 66.41 ± 1.84 d | 22.20 ± 3.19 b | 59.92 ± 4.04 e | 63.93 ± 4.64 e | 69.74 ± 2.01 e |   |
| UFTP 42 | 69.70 ± 2.75 abc | 20.66 ± 1.98 b | 70.21 ± 3.82 c | 73.20 ± 4.03 c | 73.62 ± 1.18 c |   |
| Soler | 71.18 ± 2.42 a | 14.85 ± 2.19 d | 67.51 ± 3.63 d | 69.14 ± 3.90 d | 77.63 ± 1.36 a |   |
| La Estrella | 71.17 ± 1.73 a | 19.00 ± 3.80 c | 76.06 ± 3.86 ab | 78.49 ± 3.70 b | 75.96 ± 2.91 b |   |
| Parameter | oBrix | pH | Malic Acid | SSC/ TA | YFE | L* | a* | b* | Chro. | Hue | Hard. | Adhes. | Spring | Cohesiv. | Gum. | Chew. | Resilien. | POD |
|---|---|---|---|---|---|---|---|---|---|---|---|---|---|---|---|---|---|---|
| oBrix | 1.00 | −0.43 | 0.77 | −0.35 | 0.23 | 0.02 | 0.62 | 0.73 | 0.80 | −0.17 | 0.88 | 0.01 | 0.06 | 0.68 | 0.83 | 0.87 | 0.75 | 0.21 |
| pH | −0.43 | 1.00 | −0.73 | 0.63 | 0.49 | −0.27 | 0.11 | −0.10 | −0.08 | −0.13 | −0.11 | −0.04 | −0.09 | 0.16 | 0.04 | −0.01 | 0.11 | −0.28 |
| Malic Acid | 0.77 | −0.73 | 1.00 | −0.84 | −0.09 | 0.36 | 0.24 | 0.38 | 0.41 | 0.01 | 0.49 | 0.00 | 0.17 | 0.10 | 0.32 | 0.40 | 0.18 | 0.34 |
| SSC/TA | −0.35 | 0.63 | −0.84 | 1.00 | 0.18 | −0.71 | 0.25 | −0.16 | −0.12 | −0.36 | −0.11 | 0.01 | −0.14 | 0.33 | 0.10 | 0.04 | 0.24 | −0.51 |
| YFE | 0.23 | 0.49 | −0.09 | 0.18 | 1.00 | −0.18 | 0.25 | 0.41 | 0.44 | 0.02 | 0.55 | −0.42 | −0.57 | 0.39 | 0.56 | 0.40 | 0.44 | 0.32 |
| L* | 0.02 | −0.27 | 0.36 | −0.71 | −0.18 | 1.00 | −0.67 | 0.34 | 0.24 | 0.84 | 0.04 | 0.06 | 0.00 | −0.25 | −0.15 | −0.15 | −0.19 | 0.73 |
| a* | 0.62 | 0.11 | 0.24 | 0.25 | 0.25 | −0.67 | 1.00 | 0.19 | 0.33 | −0.83 | 0.50 | 0.11 | 0.26 | 0.61 | 0.62 | 0.70 | 0.60 | −0.51 |
| b* | 0.73 | −0.10 | 0.38 | −0.16 | 0.41 | 0.34 | 0.19 | 1.00 | 0.99 | 0.39 | 0.89 | 0.06 | −0.15 | 0.74 | 0.84 | 0.81 | 0.81 | 0.57 |
| Chroma | 0.80 | −0.08 | 0.41 | −0.12 | 0.44 | 0.24 | 0.33 | 0.99 | 1.00 | 0.25 | 0.93 | 0.07 | −0.12 | 0.80 | 0.90 | 0.88 | 0.87 | 0.48 |
| Hue | −0.17 | −0.13 | 0.01 | −0.36 | 0.02 | 0.84 | −0.83 | 0.39 | 0.25 | 1.00 | 0.03 | −0.04 | −0.31 | −0.18 | −0.12 | −0.20 | −0.13 | 0.81 |
| Hard | 0.88 | −0.11 | 0.49 | −0.11 | 0.55 | 0.04 | 0.50 | 0.89 | 0.93 | 0.03 | 1.00 | −0.19 | −0.27 | 0.83 | 0.97 | 0.91 | 0.89 | 0.39 |
| Adhes. | 0.01 | −0.04 | 0.00 | 0.01 | −0.42 | 0.06 | 0.11 | 0.06 | 0.07 | −0.04 | −0.19 | 1.00 | 0.85 | 0.01 | −0.12 | 0.11 | −0.01 | −0.29 |
| Spring. | 0.06 | −0.09 | 0.17 | −0.14 | −0.57 | 0.00 | 0.26 | −0.15 | −0.12 | −0.31 | −0.27 | 0.85 | 1.00 | −0.03 | −0.19 | 0.09 | −0.07 | −0.55 |
| Cohes. | 0.68 | 0.16 | 0.10 | 0.33 | 0.39 | −0.25 | 0.61 | 0.74 | 0.80 | −0.18 | 0.83 | 0.01 | −0.03 | 1.00 | 0.93 | 0.93 | 0.99 | −0.06 |
| Gum. | 0.83 | 0.04 | 0.32 | 0.37 | 0.56 | −0.15 | 0.62 | 0.84 | 0.90 | −0.12 | 0.97 | −0.12 | −0.19 | 0.93 | 1.00 | 0.96 | 0.96 | 0.19 |
| Chewi. | 0.87 | −0.01 | 0.40 | 0.52 | 0.40 | −0.15 | 0.70 | 0.81 | 0.88 | −0.20 | 0.91 | 0.11 | 0.09 | 0.93 | 0.96 | 1.00 | 0.96 | 0.05 |
| Resilien. | 0.75 | 0.11 | 0.18 | 0.24 | 0.44 | −0.19 | 0.60 | 0.81 | 0.87 | −0.13 | 0.89 | −0.01 | −0.07 | 0.99 | 0.96 | 0.96 | 1.00 | 0.04 |
| POD | 0.21 | −0.28 | 0.34 | −0.51 | 0.32 | 0.73 | −0.51 | 0.57 | 0.48 | 0.81 | 0.39 | −0.29 | −0.55 | −0.06 | 0.19 | 0.05 | 0.04 | 1.00 |
| Cultivar | Malic Acid (mg/100 g) | pH | oBrix (g/100 g) | SSC/TA | POD (Abs/Min) | YFE % |
|---|---|---|---|---|---|---|
| Waltham Butternut | 0.17 ± 0.01 a | 5.98 ± 0.01 f | 11.9 ± 0.12 b | 66.43 ± 1.58 e | 1.71 ± 0.09 a | 66.19 ± 0.65 bc |
| UFTP 8 | 0.09 ± 0.01 d | 6.58 ± 0.01 a | 11.6 ± 0.12 c | 127.83 ± 7.56 bc | 1.59 ± 0.11 a | 78.47 ± 0.67 a |
| UFTP 22 | 0.15 ± 0.01 b | 6.12 ± 0.02 e | 12.2 ± 0.15 a | 76.66 ± 0.72 de | 1.49 ± 0.17 ab | 60.80 ± 0.06 d |
| UFTP 24 | 0.08 ± 0.01 e | 6.16 ± 0.02 d | 10.7 ± 0.15 e | 134.29 ± 7.10 ab | 1.70 ± 0.16 a | 67.19 ± 0.27 b |
| UFTP 38 | 0.05 ± 0.01 g | 6.34 ± 0.01 c | 7.3 ± 0.01 g | 141.46 ± 12.8 a | 1.26 ± 0.03 b | 62.19 ± 0.19 d |
| UFTP 42 | 0.06 ± 0.01 f | 6.40 ± 0.01 b | 8.2 ± 0.06 f | 122.91 ± 4.22 c | 1.55 ± 0.10 a | 60.53 ± 0.04 d |
| Soler | 0.07 ± 0.01 f | 6.36 ± 0.01 c | 6.2 ± 0.06 h | 87.34 ± 1.65 d | 1.76 ± 0.09 a | 67.81 ± 2.41 b |
| La Estrella | 0.13 ± 0.01 c | 6.17 ± 0.02 d | 11.2 ± 0.15 d | 81.78 ± 3.71 d | 1.76 ± 0.27 a | 64.72 ± 0.51 c |
| Cultivar | Firmness/ Hardness (g) | Adhesiveness (g/Sec) | Springiness | Cohesiveness | Gumminess | Chewiness | Resilience |
|---|---|---|---|---|---|---|---|
| Waltham Butternut | 33,009 ± 16,040 bc | −47.74 ± 56.6 bc | 0.52 ± 0.18 cd | 0.21 ± 0.018 d | 9237 ± 10,579 bcd | 4885 ± 5837 bc | 0.11 ± 0.11 bc |
| UFTP 8 | 40,323 ± 6993 a | −47.99 ± 25.2 a | 0.51 ± 0.12 d | 0.38 ± 0.012 a | 15,792 ± 6661 a | 8154 ± 3701 a | 0.20 ± 0.07 a |
| UFTP 22 | 32,841 ± 5455 bc | −16.58 ± 17.2 a | 0.65 ± 0.09 a | 0.32 ± 0.09 abc | 10,730 ± 4405 bc | 7104 ± 3189 ab | 0.16 ± 0.05 ab |
| UFTP 24 | 35,974 ± 5061 ab | −37.71 ± 36.4 abc | 0.50 ± 0.09 d | 0.35 ± 0.09 ab | 12,725 ± 4782 ab | 6420 ± 2629 ab | 0.18 ± 0.05 a |
| UFTP 38 | 22,027 ± 5103 d | −47.99 ± 19.0 bc | 0.55 ± 0.09 bc | 0.24 ± 0.09 cd | 5628 ± 3168 de | 3207 ± 2123 cd | 0.11 ± 0.04 bc |
| UFTP 42 | 26,515 ± 6910 cd | −25.38 ± 29.8 ab | 0.58 ± 0.12 b | 0.25 ± 0.12 bcd | 7234 ± 5435 cde | 4360 ± 3630 bcd | 0.12 ± 0.06 bc |
| Soler | 22,541 ± 3943 d | −41.81 ± 12.35 abc | 0.52 ± 0.05 cd | 0.16 ± 0.05 d | 3665 ± 1436 e | 1859 ± 646.6 d | 0.07 ± 0.02 c |
| La Estrella | 36,432 ± 4524 ab | −61.81 ± 21.3 c | 0.49 ± 0.11 d | 0.32 ± 0.011 abc | 11,595 ± 4685 abc | 5793 ± 2570 abc | 0.16 ± 0.07 ab |
Disclaimer/Publisher’s Note: The statements, opinions and data contained in all publications are solely those of the individual author(s) and contributor(s) and not of MDPI and/or the editor(s). MDPI and/or the editor(s) disclaim responsibility for any injury to people or property resulting from any ideas, methods, instructions or products referred to in the content. |
© 2023 by the authors. Licensee MDPI, Basel, Switzerland. This article is an open access article distributed under the terms and conditions of the Creative Commons Attribution (CC BY) license (https://creativecommons.org/licenses/by/4.0/).
Share and Cite
Moreno, S.R.; Yazdanpanah, M.; Huang, T.; Sims, C.A.; Chase, C.A.; Meru, G.; Simonne, A.; MacIntosh, A.J. Comparative Analysis of Qualitative Attributes for Selection of Calabaza Genotypes in the Southeast United States. Horticulturae 2023, 9, 409. https://doi.org/10.3390/horticulturae9030409
Moreno SR, Yazdanpanah M, Huang T, Sims CA, Chase CA, Meru G, Simonne A, MacIntosh AJ. Comparative Analysis of Qualitative Attributes for Selection of Calabaza Genotypes in the Southeast United States. Horticulturae. 2023; 9(3):409. https://doi.org/10.3390/horticulturae9030409
Chicago/Turabian StyleMoreno, Skylar R., Masoud Yazdanpanah, Tianyi Huang, Charles A. Sims, Carlene A. Chase, Geoffrey Meru, Amarat Simonne, and Andrew J. MacIntosh. 2023. "Comparative Analysis of Qualitative Attributes for Selection of Calabaza Genotypes in the Southeast United States" Horticulturae 9, no. 3: 409. https://doi.org/10.3390/horticulturae9030409