Article

Effects of Applying Nitrogen and Potassium on Lilium lancifolium Growth and Accumulation of Secondary Metabolites in Bulbs

School of Agriculture, Ningxia University, Yinchuan 750021, China
*
Authors to whom correspondence should be addressed.
These authors contributed equally to this work.
Horticulturae 2023, 9(3), 396; https://doi.org/10.3390/horticulturae9030396
Submission received: 21 February 2023 / Revised: 15 March 2023 / Accepted: 16 March 2023 / Published: 18 March 2023

Abstract

:
Lilium lancifolium is a plant resource used as both medicine and food because it is enriched with polysaccharides, polyphenol compounds, and saponins. Increasing the quality of Lilium species is based largely on improvement using methods such as selective breeding and proper fertilization. In this study, we investigated the different responses of L. lancifolium bulbs to treatment with nitrogen (N) and potassium (K) in Hoagland solution. A pot experiment was conducted with four N rates and five K rates under a completely random design. The agronomic traits, N and K contents, and concentrations of active compounds were determined in bulbs, including total phenols, flavonoids, polysaccharides, and saponins. L. lancifolium treated with N and K exhibited increases in the plant height, leaf number, and chlorophyll content compared with the control (N0 + K0). The bulb circumference increased by 17.41% under N2 (609.80 mg L−1) + K2 (523.34 mg L−1) compared with N0 + K0. Individual or combined application of N and K increased the total phenol, flavonoid, and saponin contents, especially under N2 + K3, with the highest increases of 1.87–2.93 times compared with N0 + K0. However, the individual application of N decreased the polysaccharide contents by 2.78–42.04%. Hoagland solution containing 443.24–572.87 mg L−1 N and 573.61–759.16 mg L−1 K is recommended to improve the active contents of bulb components based on regression analysis. Our results demonstrate that the combined application of N and K is important for obtaining high-quality L. lancifolium bulbs.

1. Introduction

Lilium lancifolium Thunb. is a perennial herb that belongs to the family Liliaceae, which originated in China where the richest germplasm resources are found for Lilium. Sichuan, Yunnan, and Shaanxi provinces have the largest distributions of Lilium species [1]. The bulbs of L. lancifolium are popular as a quality health food with medicinal and edible uses. Studies have shown that the underground bulbs are rich in various bioactive substances, such as total phenols, total flavonoids, polysaccharides, and saponins [2,3], which contribute to the quality and nutritional value. These compounds are known to have anti-tumor [4,5], anti-oxidation [6,7], hypoglycemic [8], and anti-inflammatory functions [9,10]. The bulb is an important vegetative reproductive organ for triploid L. lancifolium. However, the abundance and quality of this species have declined as the cultivated area expanded, and the plant’s edible and medicinal properties have been affected by limited accumulation of the active ingredients. Therefore, increasing the contents of the active ingredients of the bulb is an important approach for improving its edible and medicinal properties. Potassium (K) is an important element for plant metabolism and promoting the synthesis of carbohydrates [11]. It is well known that K has a role in increasing the chlorophyll content and photosynthesis, as well as in carbohydrate metabolism, thereby affecting the biosynthesis of carbon-based secondary metabolites, such as total phenols and flavonoids [12,13]. Nitrogen (N) is an essential element throughout plant growth and development because it is a constituent of proteins, enzymes, chlorophyll, auxin, and cytokinins [14,15]. The effects of different N concentrations and forms on plant growth are often primarily mediated through effects on protein concentrations [16]. Plant nutrition directly affects the effective synthesis, distribution, and accumulation of components of plants, thereby resulting in variations in quality under different cultivation conditions [17,18]. Rational fertilization increases the yield and quality as well as increasing the N and K use efficiency [19,20,21,22]. However, applying excessively high or low amounts of fertilizer will inhibit the absorption of nutrients, which is not conducive to growth. Guillén-Román et al. [23] showed that adding N significantly increased the accumulation of flavonoids in Moringa oleifera, but led to a decrease in the polysaccharide concentration in Lycium barbarum [24]. These studies suggest that fertilization may be a potential strategy for improving the medicinal and food functions of L. lancifolium.
Few studies have investigated the impacts of fertilization on the active substances in L. lancifolium, and most focused on the nutrient contents, whereas the main active substances comprising total phenols, saponins, and polysaccharides were not studied comprehensively. N and K are macronutrients with important roles in plant growth and the accumulation of active substances. However, the effects of different N and K application rates on the active components in L. lancifolium still require elucidation. Thus, it is important to determine the effects of applying different N and K concentrations and their interactions on the bulb quality in L. lancifolium.
In order to improve the quality, this study investigated the effects of incorporating N and K (five potassium and four nitrogen concentrations were set) into Hoagland nutrient solution on growth and the accumulation of bioactive substance in L. lancifolium bulbs. The experimental results obtained in this study will help to improve the medicinal and edible quality of L. lancifolium and contribute to the standardized cultivation of other bulbous plants. Our findings also provide a theoretical basis for research and development into specific fertilizers suitable for edible lilies.

2. Materials and Methods

2.1. Experimental Site

The field used for pot experiments was located in Yinchuan, which is the capital of Ningxia province in northwest China (38°30′16″ N, 106°7′38″ E). The trial was conducted from March to October 2020 at the Agricultural Training Base of Ningxia University. The bulbs were grown in an environmentally controlled greenhouse with day/night temperatures of 25 °C/15 °C ± 2 °C and relative humidity levels of 70–80%, and the daily average number of sunshine hours was more than 11 h.

2.2. Plant Materials and Treatments

L. lancifolium bulbs were planted in plastic pots (diameter of 180 mm and depth of 160 mm) filled with 3 kg of substrate (peat:perlite = 2:1) for lily planting on 15 March 2020, and each pot contained a single bulb. The experiment had a completely randomized design with a factorial arrangement and three replicates, with a total of 60 pots. Control and experimental groups were provided with deionized water (200 mL) every 3–5 days.
A two-factor, completely randomized design was used to set the phosphorus contents in the Hoagland nutrient solution, where the N and K treatments were prepared according to the N and K concentrations in the Hoagland solution. Five potassium and four nitrogen concentrations were set as follows: K0, nutrient solution containing no K+; K1, 0.5× Hoagland nutrient solution; K2, standard Hoagland nutrient solution; K3, 1.5× Hoagland nutrient solution; K4, 2× Hoagland nutrient solution; N0, nutrient solution containing no N+; N1, 0.5× Hoagland nutrient solution; N2, standard Hoagland nutrient solution; and N3, 1.5× Hoagland nutrient solution. The amounts of N (609.80 mg L−1) and K (523.34 mg L−1) in the Hoagland solution were at the standard level. The other N and K treatments were prepared by adding appropriate proportions of ammonium bicarbonate (N) and potassium sulfate (K) to obtain N0, N1, N2, N3, K0, K1, K2, K3, and K4. The Hoagland solution without N and K ions was used as the control. The standard formula of the Hoagland nutrient solution was calcium nitrate 945 mg L−1, potassium nitrate 607 mg L−1, and ammonium phosphate 115 mg L−1. The N in formulation of the Hoagland solution comes from more than two substances, so ammonium bicarbonate (N), potassium sulfate (K), and sodium dihydrogen phosphate (P) were used in this test to obtain ion balance in the Hoagland nutrient solution. The concentrations after determining the ion balance are ammonium bicarbonate 609.80 mg L−1, potassium sulfate 523.34 mg L−1, and sodium dihydrogen phosphate 88.40 mg L−1. The different concentration gradient of N and K after ion balance was shown in Table 1. A nutrient solution without N and K was used to compare with the experimental group (N0 + K0). On April 18, L. lancifolium seedlings were irrigated with N and K nutrient solution at different concentrations, where each pot received 400 mL of nutrient solution in two separate irrigations of 200 mL each, each 8 h apart. On 23 August 2020 (blooming stage), the plant height, stem diameter, leaf number, and chlorophyll content were measured with a tape measure, vernier caliper, and chlorophyll meter. Bulbs under different treatments were sampled to measure their circumference on 20 October 2020 (wilting stage). The bulbs were washed, placed in paper bags, dried in a hood at 50 °C, crushed, and passed through a 0.25 mm sieve. No insects, pests, or diseases were observed during the whole season.

2.3. Determination of Nutrient Contents

2.3.1. Sample Digestion

A sample of dried powdered bulb (0.1 g) was weighed in a digestion tube and wetted with a little deionized water, before adding 5 mL of sulfuric acid and shaking to mix well. A curved-neck funnel was placed in the mouth of the digestion tube, before heating in a digesting furnace. When the solution became brown and black, after cooling slightly, 10 drops of hydrogen peroxide (30%) were added to the tube, before digesting again for about 10 min. This method was repeated 2–3 times until the solution was colorless, before cooling down to room temperature. The solvent was transferred to a volumetric flask and diluted to 100 mL with deionized water [25].

2.3.2. Determination of N and K Contents

The N content was analyzed by using the Kjeldhal method (KDN–04B, Shanghai Lichen Bangxi Instrument Scientific and Technology Limited Company, Shanghai, China) [25]. Digestion solution (10 mL) was added to a semi-micro distillation system and 5 mL of boric acid at a concentration of 2% was added to a 150 mL triangular flask for distillation. The process was terminated when the volume of the liquid under steam distillation reached about 50–60 mL. The distilled liquid was then titrated with an acid standard solution until it turned blue-green to purple-red, and the amount of acid solution used was recorded.
N , ( %   DW ) = ( V 1 V 0 ) × c × 14 × ts × 10 3 × 100 m
V1: the volume of the acid standard solution used when titrating the reagent, mL.
V0: the volume of the acid standard solution used when titrating the blank, mL.
c: concentration of acid standard solution, mol L−1.
14: molar mass of nitrogen atom, g mol−1.
ts: dividing multiple, constant volume of digestive juice/the volume of the liquid to be measured.
m: dry sample mass, g.
The K content was analyzed by Gallenkamp flame photometry [26]. The digestion solution (5 mL) was added to a volumetric flask and diluted to 50 mL with deionized water. The samples were measured with a flame photometer (FP6410, Shanghai Precision Scientific Instrument Limited Company, Shanghai, China).
K , ( %   DW ) = ρ V ts m × 10 4
ρ: Check the mass concentration of chromogenic solution phosphorus from the standard curve, ug mL−1.
V: the volume of the chromogenic solution, mL.
ts: dividing multiple, constant volume of cooking liquid/volume of absorbing cooking liquid.
m: dry sample mass, g.

2.4. Determination of Active Component Contents

Representative samples of dry crushed bulbs (1.0 g) were extracted with 10 mL of methanol by ultrasonic extraction for 30 min and then centrifuged at 8000 r min−1 and 4 °C. This procedure was repeated twice, before pooling the extracts and storing in the dark [3].
The polysaccharide content was measured using the sulfuric acid–phenol method [27]. An aliquot of sample solution (0.1 mL) was mixed with 1.9 mL methanol in a test tube and 1 mL of phenol (5%) was added. After mixing, 5 mL of concentrated sulfuric acid was added quickly. The test tube was placed in a boiling water bath after heating for 15 min. After 10 min, 2 mL of distilled water was added and the absorbance was measured at 490 nm using a UV–visible spectrophotometer (UV-3000 PC, Mapada Crop, Shanghai, China). The mass concentration of glucose standard solution was 0, 100, 200, 300, 400, 500 mg L−1, respectively. The standard equation was y = 0.0197x − 0.0004, R2 = 0.9976 (x and y values represent absorbance and concentration, respectively).
The total phenol content was measured using the Folin–Ciocalteu method [28]. Briefly, 7.9 mL distilled water, 0.1 mL of Lilium bulb extract, and 0.5 mL of Folin–Ciocalteu reagent were added in order to a test tube. After reacting for 5 min, 1.5 mL of 20% sodium carbonate solution was added. The mixture was allowed to react at room temperature in the dark for 2 h and the absorbance was then measured at 765 nm. The mass concentrations of gallic acid standard solution were 0, 50, 100, 200, 400, 600, 800 mg L−1, respectively. The standard equation was y = 0.0976x + 0.0014, R2 = 0.9993 (x and y represent the absorbance and concentration, respectively).
The total flavonoid content was determined as described by Sarker and Oba [29]. Briefly, an aliquot of sample solution (1 mL) in a centrifuge tube was mixed in order with 4 mL of methanol solution, 0.3 mL of sodium nitrite (0.5 M), and 0.3 mL of aluminum chloride (0.3 M). After 5 min, 4 mL of sodium hydroxide (1 M) was added to the reaction system and the absorbance was measured at 510 nm. The mass concentration of rutin standard solution was 0, 50, 100, 200, 400, and 800 mg L−1, respectively. The standard equation was y = 0.1054x − 0.002, R2 = 0.9930 (x and y values represent absorbance and concentration, respectively).
The saponin content was determined by using the vanillin–perchloric acid method [30]. An aliquot of sample solution (0.1 mL) in a test tube was dried under a warm air flow. Next, after evaporating off the methanol, 0.2 mL vanillin–glacial acetic acid solution (5%) and 0.8 mL perchloric acid were added to the test tube. After mixing, the tube was placed in a constant temperature water bath at 60 °C to allow the color reaction to occur for 15 min. The tube was removed and cooled immediately for 5 min, before adding 5 mL of glacial acetic acid. After 10 min, the absorbance was measured at 544 nm. The mass concentration of dioscin standard solution was 0.25, 0.50, 0.75, 1.0, 1.25, and 1.50 mg L−1, respectively. The standard equation was y = 7.5657x − 0.046, R2 = 0.9963 (x and y represent the absorbance and concentration, respectively). The calculation formula of active component contents as follows:
  Active   component   contents ,   ( mg   g - 1   DW ) = y × V × ts V 0
y: standard sample mass concentration, mg g−1.
V: amount of extracting solvent, L.
ts: dilution multiple.
V0: amount of extracting solution, L.

2.5. Statistical Analysis

The effects of the main factors (N and K) and their interactions on different variables were analyzed by two-way analysis of variance (ANOVA) using SPSS (version 23). Significant differences were accepted at p < 0.05. Duncan’s multiple range test was used to compare means. Nonlinear relationships were found between the active ingredient contents and the amounts of N and K applied, and the relationships between these variables were determined by using polynomial regression models. In each model, one factor was fixed by the dimension reduction method, i.e., the effect of a single factor on the polysaccharide, total phenol, flavonoid, and saponin contents.

3. Results

3.1. Effects of N and K on Agronomic Traits

Table 2 shows that compared with N0 + K0, the applied N and K concentrations affected the plant height, chlorophyll content, and bulb circumference, and these variables were strongly enhanced by the K application. When N was applied at N0–N2 level, the plant height increased initially and then decreased with the K application amount, and the maximum height occurred under at K3, but it was not different from that under K4. The maximum stem diameter also occurred under K4 (7.92 mm) and it was 10.31% higher compared with that under K0. The leaf number and chlorophyll content of the leaves increased with the K application amount by 3.03–15.67% and 4.20–25.07%, respectively. The N application rates over 609.80 mg L−1 and the K application rates over 785.01 mg L−1 negatively affected the agronomic traits, especially N3, which most clearly decreased the traits. Furthermore, the circumference of the bulb comprising the edible part of L. lancifolium is an important index that determines the yield. The bulb circumference responded weakly to the N application, where the highest bulb circumference (14.23 cm) was obtained under N2 + K2 (N 609.8 mg L−1, K 523.34 mg L−1) and it was significantly higher than those under other treatments, i.e., 17.41% higher compared with CK (N0 + K0). N and K had significant interactive effects (Table 3), especially on the plant height and bulb circumference (p < 0.05). The correlations between the N and K levels and agronomic traits were analyzed based on the different indexes analyzed for L. lancifolium. The results showed that the factors were correlated at p < 0.05, and the correlation coefficients ranged between −0.07 and 0.78 (Table 4). The N application was significantly positively correlated with the plant height and leaf number, with correlation coefficients of 0.50 and 0.47, respectively. The bulb circumference was positively correlated with the K application (correlation coefficient of 0.56).

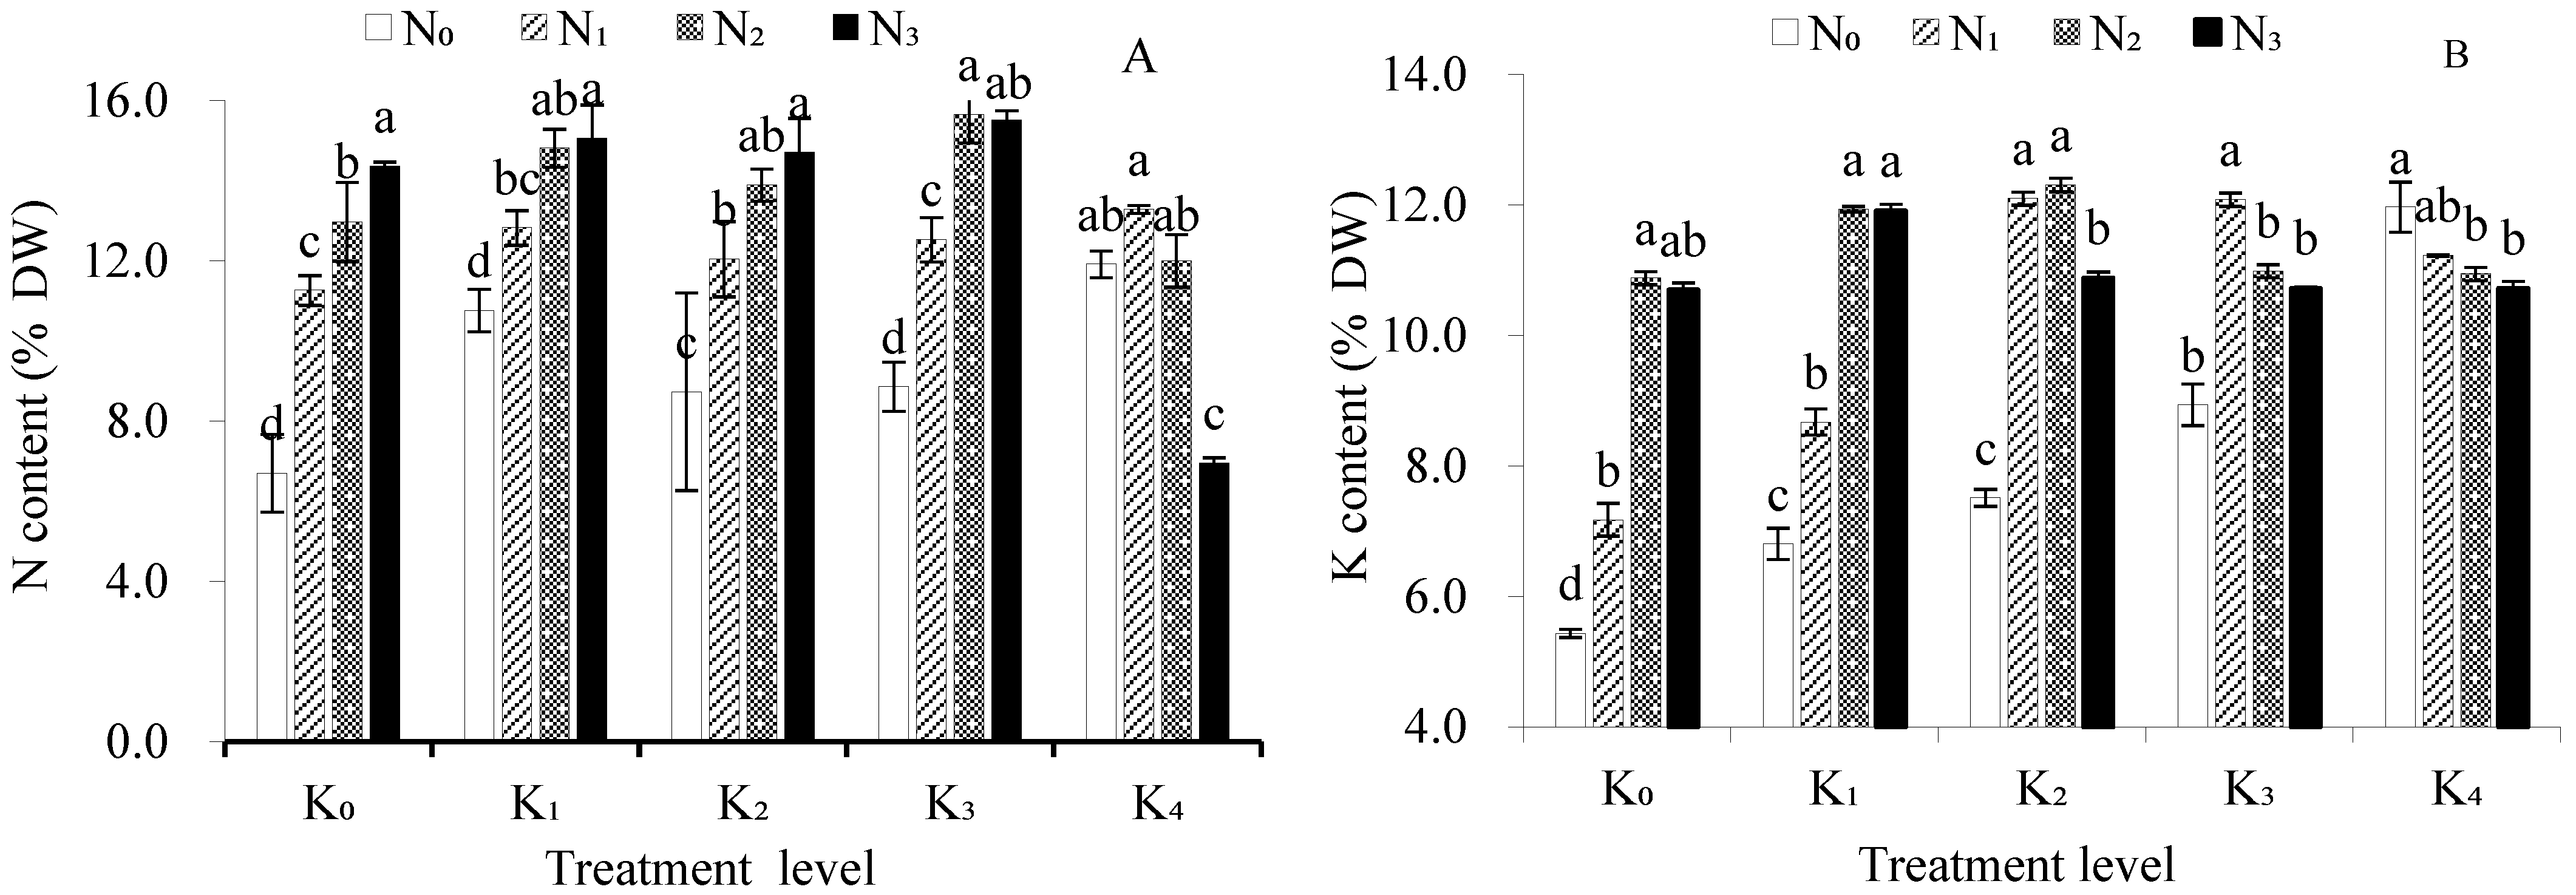
3.2. Effects of Nitrogen (N) and Potassium (K) on Total N and K Contents of Bulbs

The N and K contents of the bulbs differed significantly under the N and K treatments (Figure 1A,B). Positive interactive effects were found at 0–2 times the standard level, where the N and K contents increased with the N and K application amounts. Figure 1A shows that the N and K contents of the bulbs differed significantly under the different N and K treatments, with a positive interactive effect. The highest N content was found under N2 + K3, which was 134.43% higher compared with that under N0 + K0. The N application had a significant positive correlation with the N content (correlation coefficient of 0.53) (Table 5). Treatment with N3 (914.70 mg L−1) K4 (1046.68 mg L−1) had a significant negative effect, thereby indicating that high N and K concentrations inhibited the accumulation of N. The highest K content was obtained under N2 + K2 and it was 2.27 times that under N0 + K0 (Figure 1B). The K content was lower under N3 than N2 but significantly higher than 1.that under N0. The K application amount and K content had a significant positive correlation (correlation coefficient of 0.55).

3.3. Effects of N and K on Active Components of Bulbs

Regression analysis was conducted with the binary quadratic polynomial: Y = b0 + b1X1 + b2X2 + b3X12 + b4X22 + b5X1X2, and the associations between active components and fertilizer application were examined using the method. Regression models were obtained among the total phenols (Y1), flavonoids (Y2), polysaccharides (Y3), and saponins (Y4), and N (X1) and K (X2) contents.
The coefficients of determination (R2 values) for the equations were 0.809, 0.672, 0.661, and 0.735, respectively, thereby indicating that the models established based on the experimental factors and results obtained good fits for the relationships between N and K and the active components of bulbs. The relationships between N and K with the active ingredients were coded and replaced in the binary quadratic regression equations, so the coefficients of the absolute values directly reflected the significance level of the influence of each factor on the active ingredients.

3.3.1. Effects of Individual Factors

The dimensionality reduction method was used to fix factors in the regression equation models for Y1, Y2, Y3, and Y4 in order to obtain an equation representing the effect of a single factor on the total phenol content:
Y1(X1) = 2.932 + 0.031X1 − 0.006X12
Y1(X2) = 2.932 + 0.006X2 − 0.005X22
Similarly, the equations for Y2, Y3, and Y4 were obtained by fixing each other factor.
Y2(X1) = 1.504 + 0.011X1 − 0.008X12
Y2(X2) = 1.504 + 0.008X2 − 0.005X22
Y3(X1) = 20.11 + 0.057X1 − 0.006X12
Y3(X2) = 20.11 + 0.038X2 − 0.002X22
Y4(X1) = 1.021 + 0.002X1 − 0.002X12
Y4(X2) = 1.021 + 0.019X2 − 0.002X22
The first order term in the regression equation between the amounts of N and K applied and the total phenol contents showed that the regression coefficients for X1 were 0.031 and 0.006, respectively, and thus the effect of K fertilizer on the total phenol contents was more significant than that of N fertilizer under the conditions in this experiment. Similarly, the effects of K fertilizer on the total flavonoids and polysaccharides were more significant than those of N fertilizer, whereas the effect of N fertilizer on saponins was more significant than that of K fertilizer.
The total phenol, flavonoid, polysaccharide, and saponin contents of the bulbs increased initially and then decreased as the N and K levels increased (Figure 2). Figure 2A shows that the total phenol content increased with the N application amount and the maximum occurred under N2, which was 15.70% higher compared with that under N0. In addition, the highest total phenol content occurred under K3 (6.20 mg g−1) and it was 30.53% higher than that under K0, thereby indicating that adding an appropriate amount of K fertilizer could increase the total phenol content. The flavonoid contents increased with the amounts of N and K applied at 0–2 times the standard level (Figure 2B). K3 had a significant effect on the total flavonoid content (p < 0.05), which was 46.32% higher compared with that under K0. The highest polysaccharide and saponin contents were obtained under N1 (Figure 2C,D) and they were significantly lower under N3, i.e., 42.04% and 32.07% lower, respectively. These findings indicate that the accumulation of polysaccharides and saponins demanded little N, and the application of high amounts of N could inhibit their accumulation. Compared with K0, the polysaccharide and saponin contents were significantly higher under K, i.e., 31.23% and 49.03% higher, respectively.

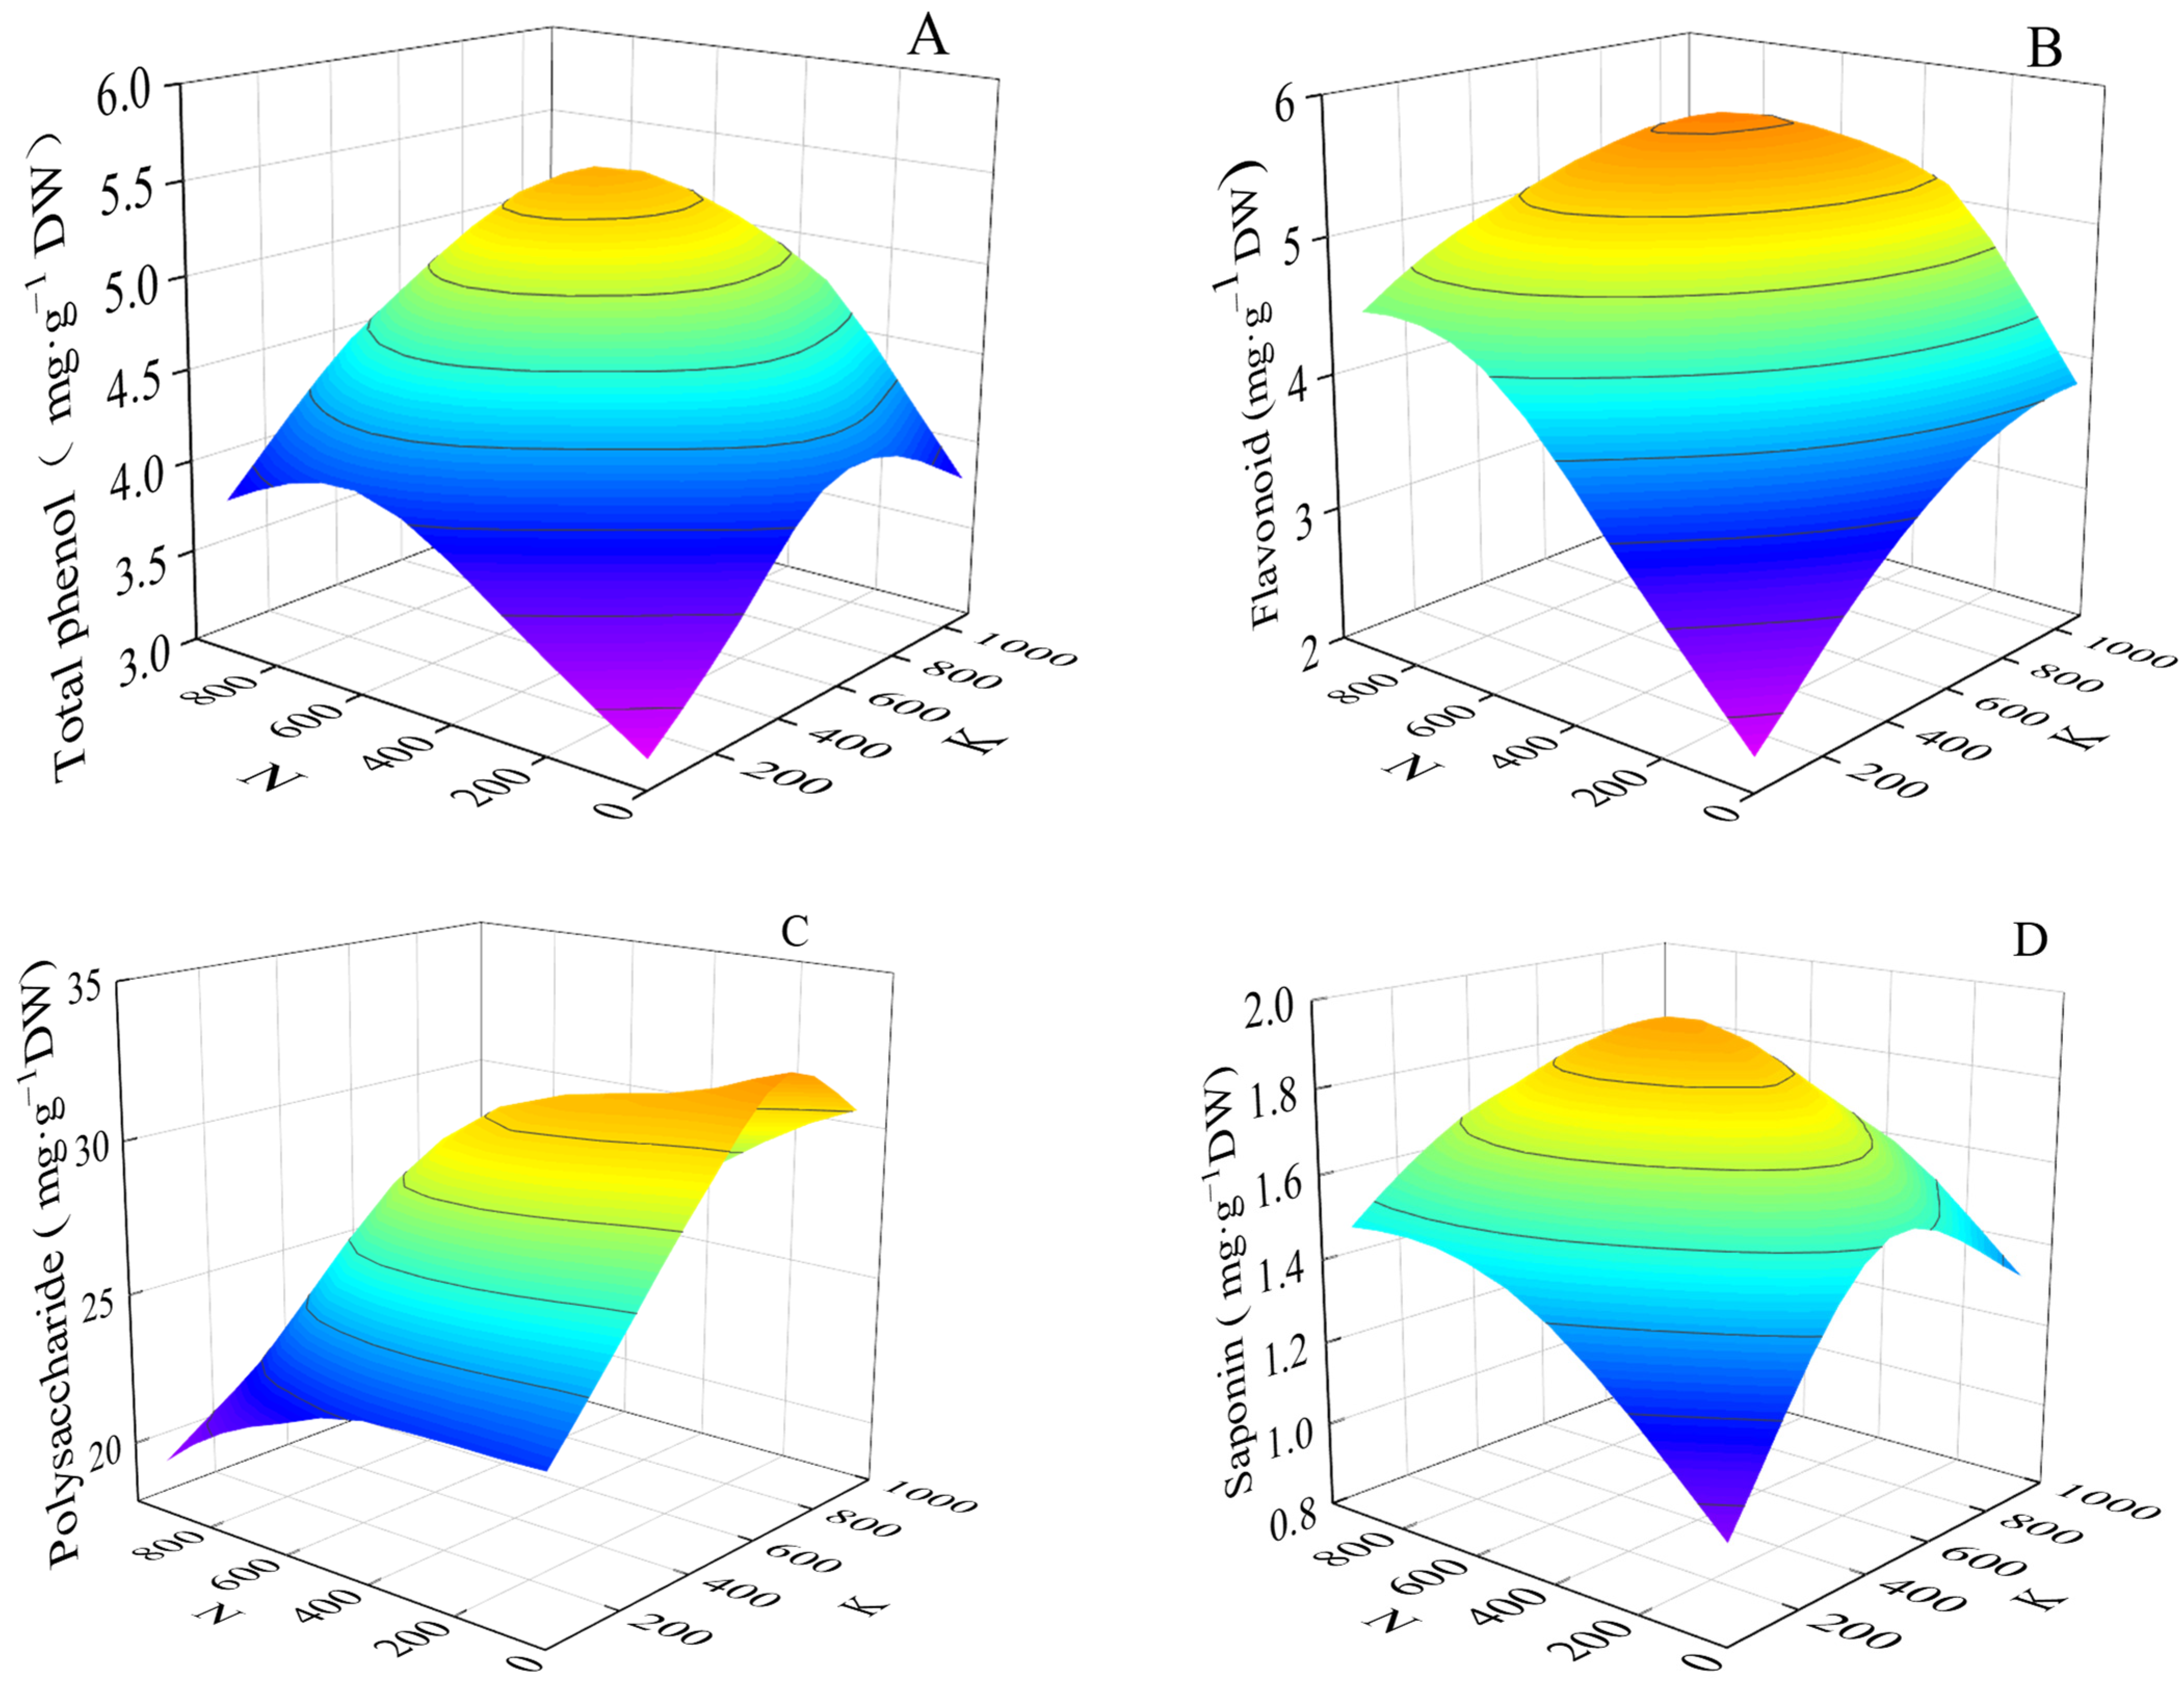
3.3.2. Effects of Two Factors

The total phenol and flavonoid contents of L. lancifolium bulbs increased under the application of N at 0–304.9 mg L−1 and K at 0–523.34 mg L−1 (Figure 3A,B), and there was a significant positive interaction between N and K according to the coefficients of the interaction for Equations (1) and (2) (p < 0.05). Increasing the application of N from 609.80 to 914.70 mg L−1 and K from 785.01 to 1046.68 mg L−1 significantly decreased the total phenol and flavonoid contents. Figure 3C shows that the polysaccharide content increased under the K application when N ranged between 0 and 304.90 mg L−1. The highest polysaccharide content was obtained under the N application at 304.90 mg L−1 and the K application at 523.34 mg L−1, and the content was significantly lower under the N application at 609.80 mg L−1, thereby indicating that applying an excessive amount of N was detrimental to polysaccharide accumulation and thus less N fertilizer should be applied in the later stage of L. lancifolium growth. The independent effect of N on the saponin content (Figure 3D) was greater than that of K. However, excessive N application might have a negative effect on the accumulation of saponins.

3.3.3. Optimized Combination of Factors

An interactive effect was found between N and K, and thus it was important to determine the optimal combination by analyzing the independent and interactive effects. Thus, the optimal combination of the desired amounts of fertilizer was obtained by solving the regression equation. The partial derivative functions were obtained for (N) X1, (K) X2 from the regression equation (Y1):
y X 1 = 0 . 031 + 0 . 012 X 1 + 0 . 009 X 2
y X 1 = 0 . 006 + 0 . 010 X 2 + 0 . 009 X 1
After solving the group of equations, we obtained X1 = 475.00 and X2 = 602.77, and thus the amounts of N and K applied would be 475.00 and 602.77 mg L−1, respectively, to produce the highest total phenol content in the bulbs.
Similarly, after determining the partial derivative functions for X1 (N) and X2 (K) from Y2, Y3, and Y4, the highest flavonoid, polysaccharide, and saponin contents would be obtained under the N application rates of 548.26, 443.81, and 596.54 mg L−1, respectively, and the K application rates of 655.79, 750.47, and 514.81 mg L−1.
Therefore, regression analysis showed that the highest active component contents in the bulbs would be obtained under N at 443.81 to 596.54 mg L−1 and K at 514.81 to 750.47 mg L−1 in the Hoagland nutrient solution. These findings are significant for research and the development of specific fertilizer for edible lilies.

4. Discussion

The present study of the effects of N and K application on the agronomic traits of L. lancifolium showed that applying appropriate amounts of N and K promoted growth and development. The positive effects of N fertilization can probably be explained by the fact that N is a constituent of the chlorophyll molecule, and applying N combined with K significantly increased the chlorophyll content (Table 2), which is essential for photosynthesis [11]. Under N3 (914.70 mg L−1), the stem diameter, leaf number, and chlorophyll content decreased with the K application, thereby indicating the unfavorable effect of excessive N application on the development of L. lancifolium, where top growth was inhibited [31,32]. El-Magd et al. [33] reported that the K application improved the plant length, leaf number, and bulb dimensions in sweet fennel. Our study showed that the changes in the agronomic traits varied as the N and K application rates increased. However, increasing the N rate does not always increase plant growth, and the availability of excessive amounts of nutrients can inhibit plant growth [34]. For example, the N and K application rates had an interactive effect on the growth of sweet fennel [11]. In the present study, N and K had significant interactive effects on the plant height and bulb circumference (Table 3). The agronomic traits were significantly enhanced under N2 + K2, where the positive effect on the bulb circumference was more obvious, i.e., 17.41% larger compared with N0 + K0. Correlation analysis demonstrated that the plant height and leaf number were positively correlated with the N application, and the bulb circumference was positively correlated with the K application (Table 4). Thus, N had a greater effect on top growth in L. lancifolium, probably because it is essential for cell division and elongation [35], and K was crucial for bulb enlargement. An appropriate combination of N and K fertilizers could be an efficient strategy to improve the growth traits and tuber yield in L. lancifolium [36].
The N and K contents can effectively reflect the absorption and utilization of nutrients by plants, which is crucial for improving fertilizer utilization rates [37]. Improved crop performance must be accompanied by an increase in the nitrogen use efficiency in order to limit the external N inputs and avoid the N surpluses associated with environmental and health problems [38]. Fu et al. [39] showed that the K utilization rate in plants was improved by adding N fertilizer, and K also helped to improve the N use efficiency in spring wheat in another study [20]. These results are consistent with those reported by El-Magd et al. who found that increasing the application rate of K fertilizer increased the N and K contents of sweet fennel bulbs [33]. In the present study, the N content clearly decreased when the K application was 1046.68 mg L−1 because the ability of plants to absorb N depends greatly on the intensity of photosynthesis, and a high concentration of K fertilizer will inhibit the effectiveness of photosynthesis, thereby hindering the absorption of N by plants [40]. When the N application rate was 914.7 mg L−1, the K content decreased significantly by 1.60–11.58% because excessive N affected the activities of photosynthetic enzymes and inhibited photosynthesis to reduce the absorption of K in bulbs [41]. Excessive K application reduces the K use efficiency rather than maintaining higher utilization rates [42]. Similar results have been reported for N where excessive fertilization decreased the fertilizer use efficiency [43]. In addition, we found that the K application rate was positively related to the N content (Table 5), which is consistent with the results obtained by Barzegar et al. [44] in sweet fennel.
The effect of K fertilizer on the total phenol content was more significant than that of N fertilizer under the conditions in the present study according to regression Equations (4) and (5). Similarly, the effect of K fertilizer on the total flavonoid and polysaccharide contents was more significant than that of N fertilizer. Our experimental results agree with those obtained in a previous study [42], which showed that N fertilizer had a greater effect on saponins than K fertilizer. Chung et al. [24] also obtained a higher concentration of polysaccharides under low N fertilization, which is consistent with our results. An adequate supply of nutrients is critical for the normal growth and development of medicinal plants. Nutrient elements such as N and K affect the synthesis of primary metabolites, but they also play important roles in the synthesis and accumulation of bioactive ingredients [11]. In the present study, increasing the application of N from 609.80 to 914.70 mg L−1 and K from 785.01 to 1046.68 mg L−1 significantly decreased the total phenol and flavonoid contents, and thus the excessive application of N and K had inhibitory effects on the biosynthesis of total phenols and flavonoids [18]. Potassium is the major cation in the phloem sap that affects sugar loading and long-distance transport through the phloem into sink organs, and increasing the polysaccharide content of the bulb may depend on greater sugar import and accumulation [44]. However, the excessive application of N might have a negative effect on saponin accumulation by decreasing the root activity, which is not conducive to the absorption of nutrients, thereby resulting in a decrease in active components [45]. N fertilizer increases the available N content to enhance N metabolism, increase the accumulation of amino acids, and significantly promote the production of secondary metabolites [18]. K fertilizer can coordinate the synthesis, transportation, and transformation of photosynthetic products, which is beneficial for the synthesis and accumulation of active substances in plants [46]. Many plant physiological functions depend on K, including energy metabolism, enzymatic activation, osmotic adjustment, and carbohydrate synthesis [47,48]. Thus, the excessive or insufficient application of fertilizer could limit the accumulation of active ingredients and result in the production of poor quality bulbs, and other medicinal plants also have specific fertilizer requirements [40,43,45].

5. Conclusions

Agronomic traits comprising the plant height, stem diameter, leaf number, and chlorophyll content, as well as the N and K contents of L. lancifolium bulbs, differed significantly under various N and K treatments (p < 0.05). The bulb circumference is regarded as a measure of the yield, and it was maximized under N at 609.80 mg L−1 and K at 523.34 mg L−1 in the Hoagland nutrient solution. Compared with N0 + K0, the experimental treatments increased the active component contents of the bulbs by 38.74–193.25%, especially under N2 + K3. The N and K application rates had significant interactive effects on the total phenolics, flavonoid, and saponin contents. According to regression analysis, the highest total phenol, flavonoid, polysaccharide, and saponin contents were obtained in bulbs under N applied at 443.2–572.87 mg L−1 and K at 573.61–759.16 mg L−1. The results obtained in this study contribute to our understanding of the responses of L. lancifolium bulbs to different fertilizer application levels, thereby helping to improve its medicinal and edible characteristics.

Author Contributions

Conceptualization, Y.W. and L.J.; methodology, Y.W. and H.W.; data curation, H.B. and H.W.; writing—original draft preparation, Y.W., H.B. and P.Z.; writing—review and editing, Y.W., H.B. and L.J.; supervision, P.Z. and L.J. All authors have read and agreed to the published version of the manuscript.

Funding

The present work was financially supported by the Chunhui Project of the Ministry of Education of China (Z2016028), Key Research and Development Projects of Ningxia Hui Autonomous Region (2021BBF02025), and First-class Construction Discipline in Western China (Horticulture-NXYLXK2017B03).

Institutional Review Board Statement

Not applicable.

Data Availability Statement

Not applicable.

Conflicts of Interest

The authors declare no conflict of interest.

References

  1. Rong, L.; Lei, J.; Wang, C. Collection and evaluation of the genus Lilium resources in Northeast China. Genet. Resour. Crop Evol. 2011, 58, 115–123. [Google Scholar] [CrossRef]
  2. Luo, J.; Li, L.; Kong, L. Preparative separation of phenylpropenoid glycerides from the bulbs of Lilium lancifolium by high-speed counter-current chromatography and evaluation of their antioxidant activities. Food Chem. 2012, 131, 1056–1062. [Google Scholar] [CrossRef]
  3. Jin, L.; Zhang, Y.; Yan, L.; Guo, Y.; Niu, L. Phenolic compounds and antioxidant activity of bulb extracts of six Lilium species native to China. Molecules 2012, 17, 9361–9378. [Google Scholar] [CrossRef]
  4. Li, W.; Wang, Y.; Wei, H.; Zhang, Y.; Guo, Z.; Qiu, Y.; Wen, L.; Xie, Z. Structural characterization of Lanzhou lily (Lilium davidii var. unicolor) polysaccharides and determination of their associated antioxidant activity. J. Sci. Food Agric. 2020, 100, 5603–5616. [Google Scholar]
  5. Wang, T.; Huang, H.; Zhang, Y.; Li, X.; Li, H.; Jiang, Q.; Gao, W. Role of Effective Composition on Antioxidant, Anti-inflammatory, Sedative-Hypnotic Capacities of 6 Common Edible Lilium Varieties. J. Food Sci. 2015, 80, H857–H868. [Google Scholar] [CrossRef] [PubMed]
  6. Sim, W.S.; Choi, S.I.; Jung, T.D.; Cho, B.Y.; Choi, S.H.; Park, S.M.; Lee, O.H. Antioxidant and anti-inflammatory effects of Lilium lancifolium bulbs extract. J. Food Biochem. 2020, 44, e13176. [Google Scholar] [CrossRef] [PubMed]
  7. Zhang, Y.-Y.; Luo, L.-M.; Wang, Y.-X.; Zhu, N.; Zhao, T.-J.; Qin, L. Total saponins from Lilium lancifolium: A promising alternative to inhibit the growth of gastric carcinoma cells. J. Cancer 2020, 11, 4261. [Google Scholar] [CrossRef]
  8. Wang, X.; Yang, L.; Liu, J.; Wang, R.; Zhang, Q.; Shan, Y.; Ding, S. Comparison of the biochemical properties and thermal inactivation of polyphenol oxidase from three lily bulb cultivars. J. Food Biochem. 2020, 44, e13431. [Google Scholar] [CrossRef]
  9. Chau, C.-F.; Wu, S.-H. The development of regulations of Chinese herbal medicines for both medicinal and food uses. Trends Food Sci. Technol. 2006, 17, 313–323. [Google Scholar] [CrossRef]
  10. You, X.; Xie, C.; Liu, K.; Gu, Z. Isolation of non-starch polysaccharides from bulb of tiger lily (Lilium lancifolium Thunb.) with fermentation of Saccharomyces cerevisiae. Carbohydr. Polym. 2010, 81, 35–40. [Google Scholar] [CrossRef]
  11. Barzegar, T.; Mohammadi, S.; Ghahremani, Z. Effect of nitrogen and potassium fertilizer on growth, yield and chemical composition of sweet fennel. J. Plant Nutr. 2020, 43, 1189–1204. [Google Scholar] [CrossRef]
  12. Martin, M. The Mineral Nutrition of Higher Plants; Academic Press: Cambridge, MA, USA, 1988; p. 1250. [Google Scholar]
  13. Haukioja, E.; Ossipov, V.; Koricheva, J.; Honkanen, T.; Larsson, S.; Lempa, K. Biosynthetic origin of carbon-based secondary compounds: Cause of variable responses of woody plants to fertilization? Chemoecology 1998, 8, 133–139. [Google Scholar] [CrossRef]
  14. Raven, J.A.; Handley, L.L.; Andrews, M. Global aspects of C/N interactions determining plant–environment interactions. J. Exp. Bot. 2004, 55, 11–25. [Google Scholar] [CrossRef]
  15. Hawkesford, M.; Horst, W.; Kichey, T.; Lambers, H.; Schjoerring, J.; Møller, I.S.; White, P. Functions of macronutrients. In Marschner’s Mineral Nutrition of Higher Plants; Elsevier: Amsterdam, The Netherlands, 2012; pp. 135–189. [Google Scholar]
  16. Andrews, M.; Raven, J.; Lea, P. Do plants need nitrate? The mechanisms by which nitrogen form affects plants. Ann. Appl. Biol. 2013, 163, 174–199. [Google Scholar] [CrossRef]
  17. Jacobson, T.K.B.; da Cunha Bustamante, M.M. Effects of nutrient addition on polyphenol and nutrient concentrations in leaves of woody species of a savanna woodland in Central Brazil. J. Trop. Ecol. 2019, 35, 288–296. [Google Scholar] [CrossRef]
  18. Coria-Cayupán, Y.S.; Sánchez de Pinto, M.I.; Nazareno, M.A. Variations in bioactive substance contents and crop yields of lettuce (Lactuca sativa L.) cultivated in soils with different fertilization treatments. J. Agric. Food Chem. 2009, 57, 10122–10129. [Google Scholar] [CrossRef]
  19. Tavallali, V.; Esmaili, S.; Karimi, S. Nitrogen and potassium requirements of tomato plants for the optimization of fruit quality and antioxidative capacity during storage. J. Food Meas. Charact. 2018, 12, 755–762. [Google Scholar] [CrossRef]
  20. Walsh, O.S. Nitrogen and potassium fertilization for improved dryland spring wheat grain yield and quality. Crops Soils 2019, 52, 10–16. [Google Scholar] [CrossRef]
  21. Ma, L.; Yang, X.; Shi, Y.; Yi, X.; Ji, L.; Cheng, Y.; Ni, K.; Ruan, J. Response of tea yield, quality and soil bacterial characteristics to long-term nitrogen fertilization in an eleven-year field experiment. Appl. Soil Ecol. 2021, 166, 103976. [Google Scholar] [CrossRef]
  22. Schlegel, A.J.; Havlin, J.L. Irrigated grain sorghum response to 55 years of nitrogen, phosphorus, and potassium fertilization. Agron. J. 2021, 113, 464–477. [Google Scholar] [CrossRef]
  23. Guillén-Román, C.J.; Guevara-González, R.G.; Rocha-Guzmán, N.E.; Mercado-Luna, A.; Perez-Perez, M.C.I. Effect of nitrogen privation on the phenolics contents, antioxidant and antibacterial activities in Moringa oleifera leaves. Ind. Crops Prod. 2018, 114, 45–51. [Google Scholar] [CrossRef]
  24. Chung, R.-S.; Chen, C.-C.; Ng, L.-T. Nitrogen fertilization affects the growth performance, betaine and polysaccharide concentrations of Lycium barbarum. Ind. Crops Prod. 2010, 32, 650–655. [Google Scholar] [CrossRef]
  25. Jackson, M. Soil Chemical Analysis; Wisconsin Prentice Hall of India Pvt. Ltd: New Delhi, India, 1967; p. 46. [Google Scholar]
  26. Black, C. Methods of Soil Analysis; Part 2, Series 9; American Society of Agronomy institute publications: Madison, WI, USA, 1965; pp. 894–1372. [Google Scholar]
  27. Chen, F.; Huang, G. Antioxidant activity of polysaccharides from different sources of ginseng. Int. J. Biol. Macromol. 2019, 125, 906–908. [Google Scholar] [CrossRef]
  28. Xu, Y.; Fan, M.; Ran, J.; Zhang, T.; Sun, H.; Dong, M.; Zhang, Z.; Zheng, H. Variation in phenolic compounds and antioxidant activity in apple seeds of seven cultivars. Saudi J. Biol. Sci. 2016, 23, 379–388. [Google Scholar] [CrossRef] [PubMed] [Green Version]
  29. Sarker, U.; Oba, S. Augmentation of leaf color parameters, pigments, vitamins, phenolic acids, flavonoids and antioxidant activity in selected Amaranthus tricolor under salinity stress. Sci. Rep. 2018, 8, 12349. [Google Scholar] [CrossRef] [PubMed] [Green Version]
  30. Hui, R.-H.; Hou, D.-Y.; Li, T.-C.; Liu, X.-Y. Simultaneous determination of total flavone and total saponin in Gynostemma pentaphyllum by signal multiplier spectrophotometry. Spectrosc Spect Anal. 2006, 26, 1753–1756. [Google Scholar]
  31. Zhang, Y.; Chen, Y.; Lu, H.; Kong, X.; Dai, J.; Li, Z.; Dong, H. Growth, lint yield and changes in physiological attributes of cotton under temporal waterlogging. Field Crops Res. 2016, 194, 83–93. [Google Scholar] [CrossRef]
  32. Xia, Y.; Jiang, C.; Wang, X.; Chen, F. Studies on potassium uptake and use efficiency of different cotton (Gossypium hirsutum L.) genotypes by grafting. J. Food Agric. Environ. 2013, 11, 472–476. [Google Scholar]
  33. Abou El-Magd, M.; Zaki, M.; Eldewiny, C. Effect of planting dates and different levels of potassium fertilizer on growth, yield and chemical composition of sweet fennel cultivars under newly reclaimed sandy soil conditions. J. Am. Sci. 2010, 6, 89–105. [Google Scholar]
  34. Salvagiotti, F.; Miralles, D.J. Radiation interception, biomass production and grain yield as affected by the interaction of nitrogen and sulfur fertilization in wheat. Eur. J. Agron. 2008, 28, 282–290. [Google Scholar] [CrossRef]
  35. Guo, X.; Zhu, G.; Jiao, X.; Zhou, G. Effects of nitrogen application and planting density on growth and yield of Sesbania pea grown in saline soil. Curr. Sci. 2019, 116, 113891. [Google Scholar] [CrossRef]
  36. Hamdi, W.; Rihab, B.; Quertatani, S.; Gharbi, A. Effect of nitrogen and potassium levels on the potatoes growth in the Chott Mariem region of Tunisia. Aust. J. Exp. Agric. 2018, 28, 1–9. [Google Scholar] [CrossRef]
  37. Li, J.; Lin, W. Effects of nitrogen fertilizer rates on the growth and nutrient utilization of calla lily intercropped with rubber trees. Soil Tillage Res. 2021, 211, 105031. [Google Scholar] [CrossRef]
  38. Di Mola, I.; Cozzolino, E.; Ottaiano, L.; Nocerino, S.; Rouphael, Y.; Colla, G.; El-Nakhel, C.; Mori, M. Nitrogen use and uptake efficiency and crop performance of baby spinach (Spinacia oleracea L.) and Lamb’s Lettuce (Valerianella locusta L.) grown under variable sub-optimal N regimes combined with plant-based biostimulant application. Agronomy 2020, 10, 278. [Google Scholar] [CrossRef] [Green Version]
  39. Fu, W.; Wang, Y.; Ye, Y.; Zhen, S.; Zhou, B.; Wang, Y.; Hu, Y.; Zhao, Y.; Huang, Y. Grain yields and nitrogen use efficiencies in different types of stay-green maize in response to nitrogen fertilizer. Plants 2020, 9, 474. [Google Scholar] [CrossRef] [PubMed]
  40. Sui, N.; Wang, L.; Sun, J.; Wu, J.; Chen, M.; Zhang, S.; Yuan, Q.; Kai, G. Estimating Fritillaria thunbergii Miq. yield, quality, and potassium use efficiency in response to potassium application rate. Ind. Crops Prod. 2021, 164, 113409. [Google Scholar] [CrossRef]
  41. Hu, A.; Tang, T.; Liu, Q. Nitrogen use efficiency in different rice-based rotations in southern China. Nutr. Cycl. Agroecosyst. 2018, 112, 75–86. [Google Scholar] [CrossRef]
  42. Olde Venterink, H. Legumes have a higher root phosphatase activity than other forbs, particularly under low inorganic P and N supply. Plant Soil 2011, 347, 137–146. [Google Scholar] [CrossRef]
  43. Pelinganga, O.; Mphosi, M. Optimum NPK fertilizer requirement for Amaranthus hybridus leafy vegetable under greenhouse conditions. Res. Crops 2019, 20, 353–356. [Google Scholar]
  44. Cakmak, I. The role of potassium in alleviating detrimental effects of abiotic stresses in plants. J. Plant Nutr. Soil Sci. 2005, 168, 521–530. [Google Scholar] [CrossRef]
  45. Alhasan, A.S.; Abbas, M.K.; Al-Ameri, M.; Al-Ameri, D.T. Growth and Yield Response of Basil (Ocimum basilicum L.) to Different Rates of Urea Fertilizer under Field Conditions; IOP Publishing: Bristol, UK, 2020; p. 12044. [Google Scholar]
  46. Hu, W.; Ren, T.; Meng, F.; Cong, R.; Li, X.; White, P.J.; Lu, J. Leaf photosynthetic capacity is regulated by the interaction of nitrogen and potassium through coordination of CO2 diffusion and carboxylation. Physiol. Plant. 2019, 167, 418–432. [Google Scholar] [CrossRef] [PubMed]
  47. Römheld, V.; Kirkby, E.A. Research on potassium in agriculture: Needs and prospects. Plant Soil 2010, 335, 155–180. [Google Scholar] [CrossRef]
  48. Wakeel, A. Potassium–sodium interactions in soil and plant under saline-sodic conditions. J. Plant Nutr. Soil Sci. 2013, 176, 344–354. [Google Scholar] [CrossRef]
Figure 1. N and K contents of L. lancifolium in bulbs under treatment with different N and K levels. Values within the same K level followed by different lowercase letters differed significantly (p < 0.05). Analyses of all indicators were replicated three times.
Horticulturae 09 00396 g001
Figure 2. Effects of N and K application amounts on contents of active components of L. lancifolium bulbs. (AD) show the change trend of total phenol, flavonoid, polysaccharide, and saponin in bulbs under a single factor, respectively. All experiments were repeated three times and the results were expressed as the mean± standard deviation. Values within the same K level followed by different lowercase letters differed significantly (p < 0.05).
Horticulturae 09 00396 g002
Figure 3. Interactive effects of N and K on the active components in L. lancifolium bulbs. (AD) show the change trend of total phenol, flavonoid, polysaccharide, and saponin in bulbs under the two factors, respectively. Analyses of all indicators were replicated three times.
Horticulturae 09 00396 g003
Table 1. Experimental factor levels and coding (mg L−1).
FactorsConstant IntervalLevels
01234
N304.90304.90609.80914.70
K261.670261.67523.34785.011046.68
Table 2. Effects of N and K application on growth and development of L. lancifolium.
NKPlant Height
(cm)
Stem Diameter
(mm)
Leaf Number
(No.)
Total Chlorophyll
(mg g−1)
Bulb Circumference
(cm)
00127.78 ± 1.52 gh6.43 ± 0.67 def107.17 ± 2.46 d46.50 ± 2.07 h12.12 ± 0.58 de
1128.47 ± 2.46 fgh6.86 ± 0.30 bcdef109.83 ± 2.37 cd46.00 ± 3.14 h12.97 ± 0.84 bcd
2132.45 ± 1.16 cdefg7.08 ± 0.73 abcdef112.50 ± 2.29 bcd51.85 ± 3.44 g12.88 ± 0.82 bcd
3135.57 ± 1.92 bcde6.74 ± 0.81 bcdef 114.67 ± 1.59 abcd52.98 ± 2.34 fg12.90 ± 1.14 bcd
4133.45 ± 1.97 cdef6.31 ± 0.60 f120.83 ± 0.97 ab58.16 ± 3.49 ab12.87 ± 0.42 bcd
10132.17 ± 1.28 defgh6.77 ± 0.48 bcdef117.33 ± 1.85 abc55.43 ± 2.85 cde11.95 ± 0.40 de
1134.60 ± 1.56 cdef6.81 ± 0.32 bcdef118.67 ± 1.77 abc56.25 ± 3.40 abcd12.43 ± 0.72 cde
2133.55 ± 1.00 cdefg7.30 ± 0.42 abcd117.00 ± 2.16 abc56.61 ± 3.45 abcd12.98 ± 0.42 bcd
3135.68 ± 2.10 bcde7.05 ± 0.35 bcdef114.00 ± 0.89 abcd55.97 ± 3.13 bcde13.78 ± 0.94 ab
4132.50 ± 2.13 cdefg7.11 ± 0.60 abcdef114.67 ± 1.28 abcd57.76 ± 3.80 abc12.92 ± 0.30 bcd
20134.53 ± 0.99 cdef7.18 ± 0.36 abcdef119.17 ± 1.05 ab53.94 ± 2.76 efg12.55 ± 1.02 bcd
1136.78 ± 1.68 bcd7.25 ± 0.51 abcde122.17 ± 1.60 a56.57 ± 2.91 abcd13.05 ± 0.85 bcd
2138.78 ± 1.92 abc7.35 ± 0.91 abc118.33 ± 1.34 abc58.35 ± 3.34 a14.23 ± 0.68 a
3143.17 ± 3.17 a7.26 ± 0.44 abcde117.33 ± 3.03 abc52.56 ± 2.37 g13.60 ± 0.32 abc
4141.55 ± 2.23 ab7.92 ± 0.81 a112.50 ± 1.28 bcd53.19 ± 4.18 fg13.48 ± 1.02 abc
30129.00 ± 2.14 efgh7.44 ± 0.62 ab121.33 ± 2.63 ab56.87 ± 2.26 abcd11.37 ± 0.57 e
1130.83 ± 1.61 defg7.32 ± 0.34 abc118.00 ± 3.08 abc56.78 ± 3.01 abcd12.87 ± 0.72 bcd
2128.17 ± 2.86 fgh6.74 ± 0.27 bcde117.00 ± 2.87 abc54.89 ± 2.57 def13.75 ± 0.56 ab
3126.50 ± 2.83 h6.49 ± 0.45 cdef117.67 ± 1.52 abc52.58 ± 2.12 g13.43 ± 0.29 abc
4126.67 ± 1.98 h6.40 ± 0.31 ef114.17 ± 1.66 abcd53.18 ± 3.66 fg12.70 ± 0.42 bcd
Values within the same columns followed by different lowercase letters differ significantly at p < 0.05. Analyses of all indicators were replicated three times. All data are expressed as the mean ± standard error.
Table 3. F-values obtained by two-way ANOVA showing significant effects of N and K on trait performance in L. lancifolium.
TraitsPlant HeightStem DiameterLeaf NumberTotal ChlorophyllBulb Circumference
FactorsFPFPFPFPFP
N1.790.073.77 *0.042.470.073.12 *0.041.790.14
K3.25 *0.031.610.120.960.384.29 *0.032.97 *0.04
N * K3.47 *0.030.720.180.540.361.030.042.91 *0.04
* Significant treatment effects within a main category at 0.01 < p ≤ 0.05.
Table 4. Correlations between N and K levels and agronomic characters in L. lancifolium.
NKPlant HeightStem DiameterLeaf NumberTotal ChlorophyllBulb Circumference
N1
K0.001
Plant Height0.50 *0.311
Stem Diameter0.27−0.070.62 **1
Leaf Number0.47 *−0.100.59 **0.171
Chlorophyll0.330.200.52 *0.280.78 **1
Bulb Circumference0.140.56 *0.430.08−0.050.131
* Significant at p < 0.05; ** significant at p < 0.01 (n = 3).
Table 5. Correlations between N, K concentrations and N, K contents of L. lancifolium in bulbs.
NKN ContentK Content
N1
K0.001
N content0.53 *0.55 *1
K content0.440.55 *0.421
* Significant at p < 0.05; (n = 3).
Disclaimer/Publisher’s Note: The statements, opinions and data contained in all publications are solely those of the individual author(s) and contributor(s) and not of MDPI and/or the editor(s). MDPI and/or the editor(s) disclaim responsibility for any injury to people or property resulting from any ideas, methods, instructions or products referred to in the content.

