Article

Fruit Quality of Satsuma Mandarins from Neretva Valley and Their Flavonoid and Carotenoid Content

by
Luna Maslov Bandić
*,
Kristina Vlahoviček-Kahlina
,
Marija Sigurnjak Bureš
,
Katarina Sopko Stracenski
,
Nenad Jalšenjak
,
Goran Fruk
,
Ana Marija Antolković
and
Slaven Jurić
Faculty of Agriculture, University of Zagreb, Svetošimunska 25, 10 000 Zagreb, Croatia
*
Author to whom correspondence should be addressed.
Horticulturae 2023, 9(3), 383; https://doi.org/10.3390/horticulturae9030383
Submission received: 6 February 2023 / Revised: 9 March 2023 / Accepted: 13 March 2023 / Published: 15 March 2023
(This article belongs to the Section Fruit Production Systems)

Abstract

:
Mandarins are the second most farmed citrus. Consumers demand a mandarin fruit that is both tasty and excellent in quality. The fruit quality, flavonoid profile, antioxidant capacity and total carotenoid content of five varieties (‘Zorica’, ‘Chahara’, ‘Kawano Wase’, ‘Owari’ and ‘Saigon’) of Satsuma mandarins grown in Neretva valley (Croatia) were determined. In this research, the distribution of bioactive compounds was different for mandarin juice, dry pulp residue and dry peels. Dry peels showed higher levels of polyphenolic compounds and antioxidant activity. Total carotenoids were found to be in a greater concentration in dry pulp residue than in the dry peel. The highest levels of total carotenoids (543 μg β-carotene/g) were found in the dry pulp residue of ‘Owari’ and ‘Saigon’, while the lowest levels were in ‘Chahara’ (227.87 μg β-carotene/g). In dry mandarin peels, the highest levels of total carotenoids were in ‘Kawano Wase’ (227.58 μg β-carotene/g), and the lowest levels were in ‘Chahara’ (52.24 μg β-carotene/g). The most abundant component of polymethoxyflavones (PMFs) in mandarin dry peel was nobiletin, ranging from 0.204 mg/g (‘Chahara’) to 0.608 mg/g (‘Saigon’), followed by tangeretin, ranging from 0.133 mg/g (‘Chahara’) to 0.251 mg/g (‘Saigon’), and sinesestin (‘Zorica’), ranging from 0.091 mg/g to 0.353 mg/g (‘Saigon’).

Graphical Abstract

1. Introduction

The world fresh citrus fruit market has seen significant growth over the last decade. This especially refers to seedless fruits such as mandarins that are easy to peel and have good orange-colored skin. Annual mandarin production in the world is approximately 40 million tons [1]. The majority of information on citrus fruit quality traits has come from research on primary products for the citrus juice manufacturing industry, namely, oranges. However, little is known about the particular fruit quality characteristics of mandarins [2]. Mandarins are the second most farmed citrus group after sweet oranges, representing approximately 25% of global citrus production [3].
Consumers demand a mandarin fruit that is both tasty and excellent in quality. Mandarins show a high value of health-promoting nutrients and taste good, which makes them an important part of a daily diet. Mandarin fruits are rich in antioxidant compounds such as flavonoids, which are present in appreciable amounts and are mainly accumulated in the peel and pulp [4]. This makes them the main source of flavonoids in the Mediterranean diet, considering that they are mostly consumed during the winter period.
Flavonoids have a 15-carbon skeleton (C6-C3-C6) which is made of two six-carbon phenyl rings bonded by a heterocyclic ring with inserted oxygen [5]. Mandarin fruits have a large number of flavanone-7-O-glycosides (such as naringin, hesperidin and narirutin), polymethoxylated flavones (PMFs) (such as nobiletin, tangeretin and sinensetin) and flavonols (quercetin, rutin and kaempferol). PMFs are a unique family of bioactive flavonoids with several methoxyl (-OCH3) groups on their chemical skeletons that are common in citrus fruits. PMFs have received significant attention in recent years due to their anti-inflammatory, anti-atherosclerosis, anti-obesity and anti-cancer properties [6]. Citrus fruit peel and pulp are orange–red due to the presence of carotenoids and apocarotenoids. It is considered that mandarins are a good source of provitamin A, since the carotenoid β-cryptoxanthin is the most represented in them [7].
Satsuma mandarin is Croatia’s main export fruit crop. It is sold to neighboring nations with strong consumer cultures. The annual production exceeds 40,000 tons. When compared to other citrus-producing nations in the Mediterranean region, the key benefits of Croatian Satsumas are early maturation and high fruit quality [8]. The main production location in Croatia is the Neretva valley.
In the presented research, the fruit quality and profile of flavonoids of Satsuma mandarins (Figure 1) from the Neretva valley were examined.

2. Materials and Methods

2.1. Chemicals and Reagents

All standards of phenolic compounds and organic acids, ortho-phosphoric acid, 2,2-diphenyl-1-picrylhydrazyl (DPPH), 2,2’-azino-bis(3-ethylbenzothiazoline-6-sulfonic acid) (ABTS) and Folin Ciocaulteu reagent were purchased from Sigma-Aldrich (St. Louis, MO, USA). Methanol, acetonitrile and dimethylsulfoxide were purchased from J.T. Baker (Deventer, Netherlands). Sodium carbonate anhydrous, sodium nitrite, aluminum chloride hexahydrate, acetone and hexane were obtained from Kemika (Zagreb, Croatia).

2.2. Plant Material

In this study, a total of five mandarin (Citrus unshiu) fruit cultivars were harvested at optimal maturity and processed at the day of harvest from the orchards Mandarinko d.o.o. located at Opuzen, Neretva Valley, Croatia (Latitude: 43.0176, Longitude: 17.5623; 43°1′3″ N, 17°33′44″ E) on the following dates: 12 October 2021 for ‘Zorica’ and ‘Chahara’, 15 November 2021 for ‘Kawano Wase’, 18 November 2021 for ‘Owari’ and 30 November 2021 for ‘Saigon’. Total of 30 fruits for each cultivar were collected from different trees and split into tree samples consisting of 10 fruits each. After weighing, the mandarins were peeled carefully, and the fruit was blended using FOSS 2094 (Hillerød, Denmark). A volume of 50 mL of puree was centrifuged for 10 min at 9000 rpm and 4 °C. The supernatant obtained by filtration through Whatman No. 4 filter paper was collected and used for further analysis. The pulp residues and peel (flavedo and albedo) were dried at 40 °C in a food lab dehydrator for 36 h. A homogenizer was used for grounding dried pulp residue into a fine powder, which was sieved through a 0.45 mm metal sieve. The obtained powder consisted of standard size particles, and it was stored at −20 °C until analyzed. The juice was diluted when necessary. The mandarin fruit (juice, dry pulp residue and dry peel) was analyzed in triplicate. Physicochemical properties were determined for another 30 harvested fruits for each cultivar.

2.3. Physicochemical Properties

The total soluble solids (TSS) (°Brix) of mandarin juice were measured with a digital refractometer (Atago, Tokyo, Japan) at room temperature. Titratable acidity (TA) was determined using a digital burette by titrating 10 mL of mandarin juice with 0.1 mol /L NaOH and phenolphthalein as an indicator. It was expressed as g/L citric acid. The pH in mandarin juice was determined using a pH meter (FiveEasy™ Plus; Mettler Toledo, Schwerzenbach, Switzerland). Firmness was measured using the largest force required to penetrate the entire mandarin fruit. A texture analyzer (FTA Fruit Texture Analyzer, GÜSS Manufacturing (Pty) Ltd., Strand, South Africa) with a cylindrical probe of a 5 mm diameter was used, under the following conditions [9]: a pre-test speed of 3.0 mm s−1, a test speed of 1.0 mm s−1, a post-test speed of 3.0 mm s−1 and a penetration distance of 3 mm. The mandarin fruit color variables were measured according to the CIE L*a*b*, using a colorimeter (ColorTec PCM; ColorTec Associates Inc., Clinton, NJ, USA) [10].

2.4. Preparation of Dry Pulp Residue and Dry Peel Extracts of Mandarin Fruit

For the preparation of the extract, 0.1 g of dried peel/pulp residue [11] was vortexed with 1 mL of methanol/DMSO (1:1, v/v) in Eppendorf tubes. After sonication (10 min at 50 °C), the samples were centrifuged at 5000 rpm for 10 min at 4 °C. The procedure was repeated two more times with a precipitate. Supernatants were collected in a 5 mL flask, and the volume was made up with MeOH/DMSO. The sample solution was filtered through a 0.45 μm PTFE membrane filter before use. For HPLC analysis, an extract of mandarin juice [12] was prepared by mixing 0.6 mL of juice (previously centrifuged and filtered through 0.45 um PTFE membrane filter) and 0.6 mL of methanol/DMSO (1:1, v/v) in Eppendorf tubes. After sonication (15 min at 50 °C), the samples were centrifuged at 5000 rpm for 15 min at 4 °C. The supernatant was collected in the vial for HPLC analysis.

2.5. Determination of Total Polyphenolic Content, Total Flavonoids, Total Carotenoids and Antioxidant Activity

Total polyphenolic content (TPC) was measured according to the modified Folin Ciocalteu’s method [13]. A volume of 7.9 mL of distilled water and 0.5 mL of Folin Ciocalteu’s reagent (diluted with distilled water in a 1:2 ratio) was added to 0.1 mL mandarin juice or extract. The reaction was started by adding 1.5 mL of 20 % (w/v) sodium carbonate. The reaction mixture was vortexed, and absorbance at 765 nm was measured after 2 h. The results were expressed as mg of gallic acid equivalents.
The assay for the total flavonoid (TF) was preformed using the spectrophotometric method of Ivanova et al. [14], with some modifications. A total of 1 mL of mandarin juice or extract was mixed with 4 mL of distilled water. After adding 0.3 mL of 0.5 g L−1 NaNO2, the mixture was left for 5 min to react. Then, 0.3 mL of 1 g L−1 AlCl3 solution was added, and after 6 min, 2 mL of 1 mol L−1 NaOH was added. The solution volume was increased up to 10 mL with the addition of distilled water. TF was calculated from the calibration curve, with quercetin as a standard, measuring absorbance at 360 nm.
The antioxidant potential of mandarin juice was determined using 2,2-diphenyl-1-picrylhydrazyl (DPPH) and 2,2′-azino-bis (3-ethylbenzothiazoline-6-sulfonic acid) (ABTS) reagents, according to the known procedures [15,16], respectively. Trolox was selected as a standard compound.

2.6. Total Carotenoids

The total carotenoids content in the juice was determined using a modified spectrophotometric method, according to Lee et al. [17]. A 5 mL aliquot of juice was vortexed with 10 mL of hexane (1 min) and centrifuged for 10 min at 6500 rpm at 4 °C. The top layer of hexane containing the color was recovered and transferred to a 10 mL volumetric flask. Absorbance was measured at 450 nm and calculated as μg β-carotene equivalents per L of juice. For each sample, extraction and measurements were made in triplicate.
The beta-carotene content in the dry pulp residue and dry peels was measured by following the procedure [18]. For each sample, the tests were performed in triplicate. A mass of 0.1 g of dry peel/dry pulp residue powder was weighted and mixed with 10 mL of acetone–hexane (ratio 2:3; v/v) in a dark flask. After vigorous shaking for 1 min, the mixture was filtered through the Whatman No. 4 filter paper, and the final volume of the filtrate was set to 10 mL with the addition of the extraction solvent. The readings were performed at 453 nm, 505 nm and 663 nm, and the β-carotene equivalent contents were calculated using the following formula [18]:
β-carotene (mg/100 mL) = (0.216 × A663) − (0.304 × A505) + (0.452 × A453)
The data are expressed as μg of beta-carotene equivalent per g of mandarin powder dry weight.

2.7. HPLC Analysis

Individual phenolic compounds were determined by the HPLC method. The separation, identification and quantification of individual polyphenolic compounds in the mandarin juice, dry pulp residue and dry peel were performed on an Agilent 1260 Infinity II Series system (Agilent, Palo Alto, USA), equipped with a DAD detector. Extract samples of dry pulp residue and dry peel were filtered through 0.45 um PTFE membrane filters, diluted with water (1:1, v/v), injected (20 uL) on a reversed-phase column Poroshell 120 SB C18 (150 × 4.6 mm, 4 μm, Agilent, Palo Alto, CA, USA) and thermostated at 40 °C from 0 to 10 min and from 11 min at 50 °C. The solvents were water/phosphoric acid (99.5:0.5, v/v, solvent A) and methanol (solvent B), and the flow rate was 0.8 mL min−1. The elution program started with an elution of 70% A and continued with a linear gradient to 55% A in 55 min and to 70% A for a further 15 min. The chromatograms were recorded at 280, 330 and 360 nm by a diode array detector. UV–Vis spectra were recorded in the range from 200 nm to 800 nm. The identification of phenolic compounds was based on a comparison of the peak retention time and DAD spectrum with those of the authentic standard. The external standard method was used for the quantification of individual phenolic components.

2.8. Statistical Analysis

The obtained dataset was analyzed using IBM SPSS Statistics 22. The one-way analysis of variance (ANOVA) was performed to see if the means of the samples differed significantly from one another. The significance (p < 0.05) was established using the post hoc t-tests with Bonferroni adjustment. All of the data are expressed as the mean ± SD of the values. The measured fruit quality parameters were analyzed using variance analysis (ANOVA) in the statistical package SAS 9.4.

3. Results and Discussion

3.1. Physicochemical Properties

The physicochemical properties of Satsuma mandarins are presented in Table 1. These physicochemical properties are one of the most essential factors in determining citrus quality. Additionally, they contribute to providing the consumers with a first impression of the food quality. The fruit size and shape crucially influence consumers’ attention and appreciation. From investigated Satsuma mandarins, on average, the largest fruit was found to be ‘Owari’ (124.49 g), while the smallest was ‘Zorica’ (84.93 g). The weight of mandarin varieties in Neretva valley varied and was further compared to the fruits from the area of Montenegro. Fruits from Neretva valley were found to be heavier, with the recorded average weight of the ‘Kawano Wase’ variety from Neretva valley being 112.68 g, while the average weight of the mandarin fruit ‘Kawano Wase’ from the territory of Montenegro was determined previously by Radulović et al., to be 69.98 g [19]. Similar results for Owari were reported by [20]. Firmness is an important sensory characteristic of citrus fruits because the flesh influences the mouthfeel of the fruit [21]. The highest firmness was found in the ‘Zorica’ and ‘Chahara’ varieties. ‘Zorica’ and ‘Chahara’ are early-maturing, ‘Kawano Wase’ are medium-maturing and ‘Owari’ and ‘Saigon’ are late-maturing cultivars.
The amount of sugar and acid in the juice, as well as their relative ratio, define the taste of mandarins. The predominant sugars in mandarin dry pulp residue are glucose, fructose and sucrose. Similarly, for the other citrus species, the major acid is citric acid, which represents about 85–90% of the total organic acid content, with the rest being mostly malic and succinic acids. The majority of the TSS in mandarin juice relates to sugars. The sugar-to-acid ratio is also known as the total-soluble-solids-to-titratable-acidity ratio (TSS/TA) or fruit-ripening ratio, and it is frequently employed as an indicator of fruit maturity by producers and trade companies. The TSS/TA ratios in mandarins from Neretva valley ranged from 5.62 (‘Zorica’) to 15.73 (‘Saigon’). When compared to other studies, the mandarins from Neretva valley had a lower sugar–acid ratio. Lee et al. [22] reported a TSS/TA ratio from 15.42 to 18.20. According to Goldberg et al. [2], the most highly preferred mandarin fruit, when combining the biochemical and sensory evaluations, respectively, contains an average TSS/TA ratio of ~13. Lado et al. [23] also reported an optimal maturity TSS/TA ratio for mandarins at a level of 7–8. Our results in ‘Zorica’ and ‘Chahara’ showed lower levels of the TSS/TA ratio. Neretva River valley is at the northern border of agroecological conditions for growing mandarins. Thus, mandarins have less sun and a shorter time of favorable growing temperatures during ripening. For that reason, mandarins grown in Neretva River have a higher acidity and lower TSS/TA ratio at the harvest stage. The cultivars ‘Zorica’ and ‘Chahara’ are early cultivars that have higher acidity than other studied cultivars. Consumers in Croatia demands higher levels of acidity and, thus, lower TSS/TA ratios in mandarins, especially in early cultivar fruit at the beginning of a season. For later cultivars, this TSS/TA ratio needs to be higher for mandarins to be acceptable for consumers in Croatia. Only late-ripening cultivars reach a TSS/TA ratio above 11–12.
The color of mandarin fruit is one of the characteristics evaluated for commercial acceptance of the product. Color is generally taken as an index of freshness, peel-ability and nutritional value by consumers [24]. Between mandarins, there is a great difference among varieties in peel color, which can range from yellow to deep orange. The color of the mandarin peel is defined by the content of carotenoid pigments. Goldberg et al. [2] state that the main carotenoids in the mandarin peel are β-cryptoxanthin, violaxanthin and luteoxanthin. It can be seen in Table 2 that there were significant differences in the L *, a * and b * values, citrus number (CN) and citrus color index (CCI) between different varieties of Satsuma mandarins from Neretva valley. Late-harvested mandarin varieties (‘Owari’ and ‘Saigon’) have a higher citrus color index (CCI) value than early-harvested varieties (‘Zorica’ and ‘Chahara’). The reason for the differences in these values is the higher temperature amplitudes between day and night temperatures during the ripening of the late-harvested varieties. ‘Owari’ and ‘Saigon’ have a longer period for ripening than other varieties that were studied because of their long period of fruit maturation on the tree, in which they can obtain more beneficial factors for fruit growth such as more sunlight and cool temperatures during the night. The color values of mandarin peel are different and not comparable with the values of carotenoid pigments because all bioactive compounds (including carotenoids) are determined on dry mandarin peel and dry pulp residues.

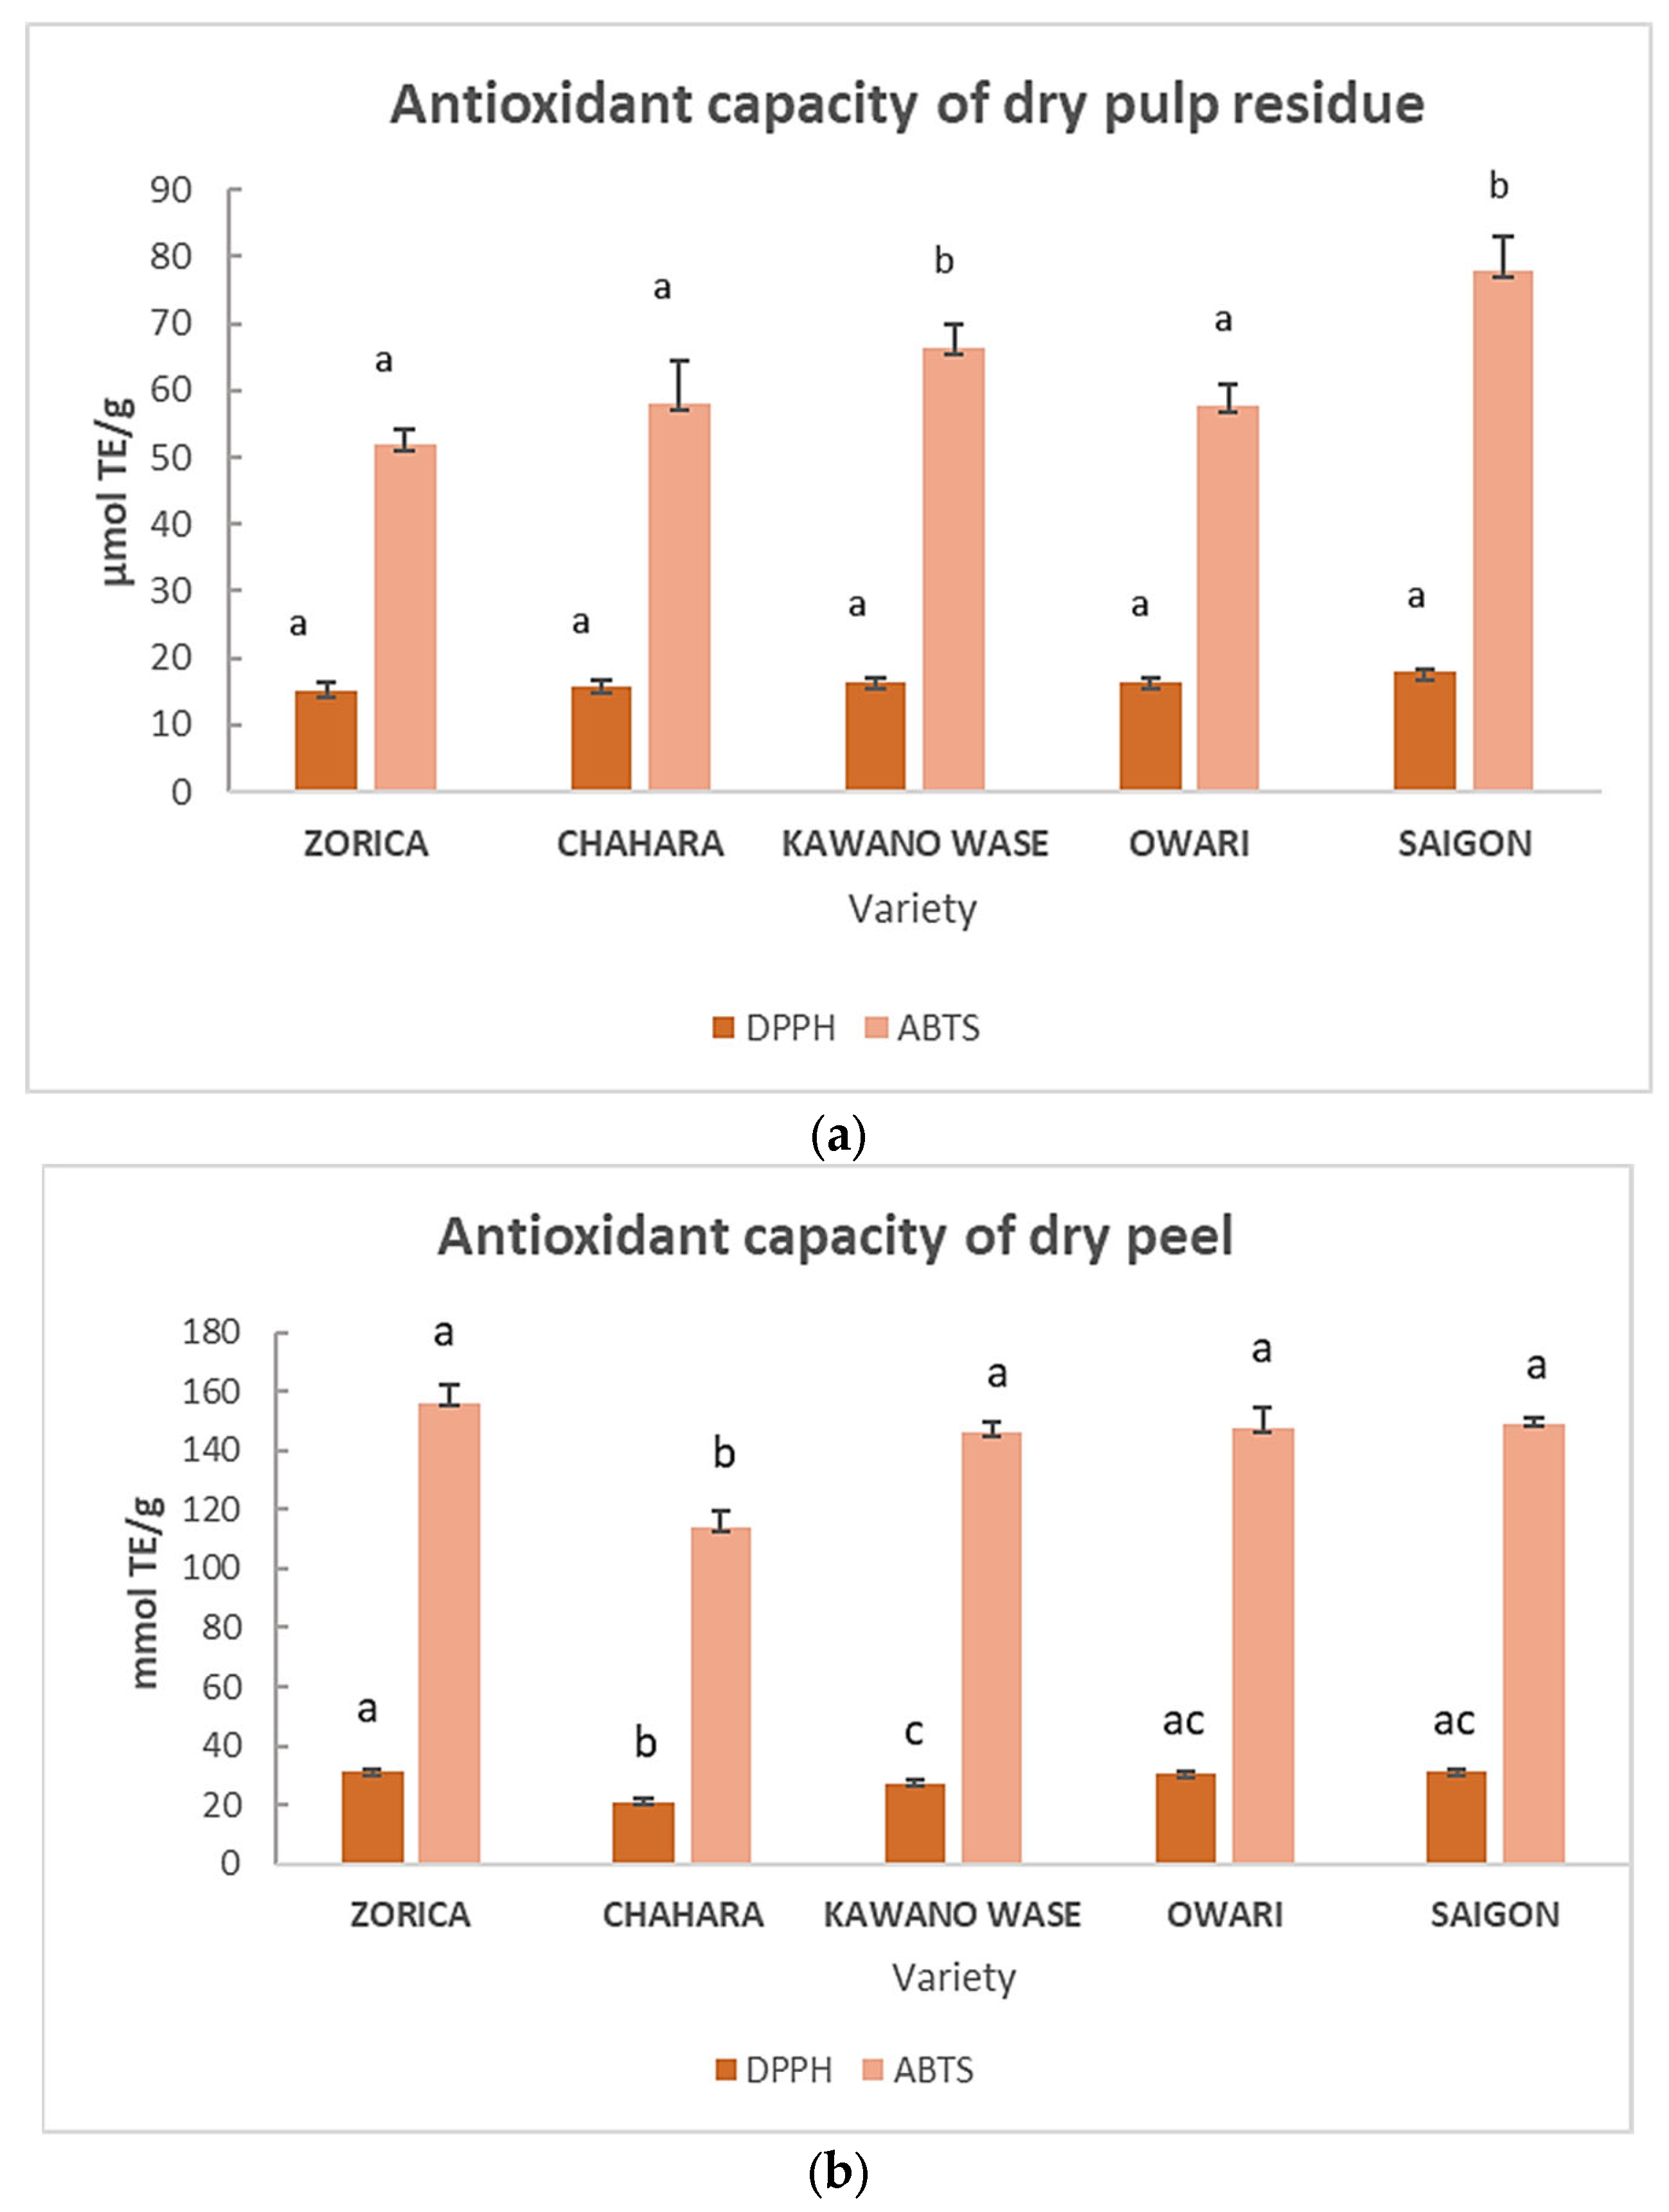
3.2. Bioactive Compounds and Antioxidant Activity

In Table 3, the results of bioactive compounds for mandarin juice are presented. The total phenolic content of five different varieties of Neretva valley mandarin juice ranged from 703.48 mg GAE/L (‘Owari’) to 1110.57 mg GAE/L (‘Zorica’). The results were comparable to those of Kelebek and Selli [25], who found 750.3 mg GAE/L in Satsuma mandarin juice. Pyo et al. [26] reported a higher content of TPC, 2110 mg GAE/L in Citrus unshiu juice. Furthermore, Anticona et al. [27] determined TPC in mandarin-like hybrids in a range from 870 mg GAE/L to 1270 mg GAE/L.
In Figure 2, the results of the bioactive compounds in the dry pulp residue and dry peel of the investigated Satsuma mandarins are presented. The total phenolic compounds of the mandarin dry pulp residue ranged from 11.56 mg GAE/g (‘Zorica’) to 15.09 mg GAE/g (‘Saigon’). The results are lower when compared to a prior report [28], where the total phenolic contents varied widely among mandarin genotypes, ranging from 15.98 to 22.26 mg/g dry weight (DW) (reported as gallic acid equivalents). The mandarin dry peel ranged from 22.24 mg GAE/g (‘Chahara’) to 28.77 mg GAE/g (‘Zorica’). Zhang et al. [29] reported the total phenolic content in different citrus genotypes of Citrus reticulata Blanco in a range from 22.80 to 32.76 mg GAE/g DW for freeze-dried mandarin peels, which is comparable to our results. Higher results (from 29.38 to 51.14 mg/g DW) of the total phenolic content in mandarin peel were reported by [30].
The total flavonoids in mandarin juice differed according to the variety and were found to be in correlation with the total polyphenolic compounds (r(tf/tpc) = 0.992). The total flavonoids in mandarin juice ranged from 575.54 mg QE/L (‘Owari’) to 846.68 mg QE/L (‘Zorica’). The total flavonoid contents of mandarin dry pulp residue ranged from 10.32 mg QE/g (‘Zorica’) to 15.84 mg QE/g (‘Saigon’), and for mandarin dry peel, they ranged from 25.87 mg QE/g (‘Chahara’) to 35.90 mg QE/g (‘Zorica’). Due to the various methods for determining total flavonoids, comparing total flavonoid results is challenging.
Carotenoids are the main pigments accumulated in the peel and pulp of citrus fruit, and besides providing coloration, they also exert different functions related to energy capture and dissipation during photosynthesis and are precursors of the plant hormones ABA and strigolactones. They provide nutritional and health-related properties through their antioxidant capacity and pro-vitamin A content [31]. The total carotenoids in the mandarin juice of the varieties ‘Zorica’ and ‘Chahara’ (200.57 μg β-carotene/L) significantly differed compared to other varieties (Table 3). The total carotenoid levels in mandarin juices of varieties from Neretva Valley were lower compared with other reports, respectively [2,32]. Such differences might be due to different ecological growing conditions, such as soil and environmental conditions, compared to those previously reported. Additionally, this lower carotenoid content is most probably due to salinity stress, which complies with studies previous reported by several authors [33,34,35]. For many years now, Neretva river valley has been well known for the problem of soil salinity. The total carotenoids in the dry pulp residue and dry peel of mandarins from Neretva valley are presented in Figure 2. The highest levels of total carotenoids (543 μg β-carotene/g) were found in the dry pulp residue of ‘Owari’ and ‘Saigon’. In mandarin dry peel, the total carotenoids ranged from 58.67 μg β-carotene/g (‘Zorica’) to 227.18 μg β-carotene/g (‘Saigon’). The content of total carotenoids in the dry pulp residue of Satsuma mandarins from Neretva valley was found to be greater than that in the dry peel. Since carotenoids are very temperature-sensitive molecules, some of the carotenoids in mandarin peel and pulp residues might have been slightly degraded during air drying at 40 °C. Costanzo et al. [36] found higher total carotenoids in the fresh peel than in other parts of the fruit, such as the pulp.
The DPPH assay and ABTS method were employed for the determination of the antioxidant activity of mandarin juice, dry pulp residue and dry peel. The highest values of antioxidant capacity (2.77 mmmol TE/L by DPPH and 3.80 mmol TE/L by ABTS) were in the mandarin juice of ‘Zorica’, which is in correlation (r(dpph/tpc) = 0.842; r(abts/tpc) = 0.877) with the total phenolic content (Table 3). The lowest values were obtained for ‘Saigon’: 2.04 mmol TE/L by DPPH and 3.38 mmol TE/L by ABTS. In mandarin dry pulp residue, the highest values were obtained for ‘Saigon’ (17.81 μmol TE/g by DPPH, and 77.78 μmol TE/g by ABTS), which is in correlation with the obtained total phenolic content (Figure 3). In mandarin dry peel, the lowest value for antioxidant activity was obtained for ‘Chahara’ (21.04 mmol TE/g by DPPH, and 113.82 mmol TE/g by ABTS), while other varieties were in a similar range. For DPPH and ABTS values, the order of antioxidant capacity was: dry peel > dry pulp residue > juice. In Figure 3, it can be seen that the antioxidant capacity detected by the ABTS method was higher than that detected by the DPPH method. The phenomenon is caused by different reaction mechanisms, mainly because the ABTS radical can react with both hydrophilic and lipophilic antioxidants, while the DPPH radical reacts only with lipophilic antioxidants [29].

3.3. Individual Flavonoid Compounds

The validated HPLC method was used to determine the flavonoids in mandarin juice, dry pulp residue and dry peel extract. Mandarin juice and dry pulp residue/dry peel powder were extracted in an ultrasonic water bath. The measurement of specific flavonoid compounds was performed using high-performance liquid chromatography (HPLC) with a diode array detector. Mandarin juice and dry pulp residue/dry peel powder were extracted in an ultrasonic water bath. Phenolic compound quantification was carried out with high-performance liquid chromatography (HPLC) equipped with a diode array detector. Rapid methods for extracting and quantifying phenolic compounds were developed by comparing extraction solvent combinations (80:20 v/v methanol:H2O; 50:50 v/v methanol:dimethyl sulfoxide (DMSO); 40:10:50 v/v methanol:H2O:DMSO; 70:29:1 v/v/v methanol:H2O:HCl; and 35:14.5:0.5:50 v/v methanol:H2O:HCl:DMSO) for effectiveness. The highest yield of flavanone glycosides and polymethoxylated flavones was observed in the samples extracted using DMSO:methanol (1:1 v/v). The same obtained results of extraction were also reported [37].
In Table 4, the individual flavonoids in mandarin juice are presented. Mandarin fruits, in general, have a specific flavanone profile dominated by hesperidin and narirutin [38]. In the mandarin juices of five varieties from Neretva valley, narirutin was the major flavanone, in the range from 117.13 mg/L to 278.74 mg/L, followed by hesperidin, ranging from 67.89 to 107.81 mg/L, and naringin, ranging from 4.56 mg/L to 6.66 mg/L, respectively. The obtained results agree with [39], where the levels of narirutin were higher compared to those of hesperidin. The individual flavanones in the dry pulp residue and dry peel of mandarin fruit are presented in Table 5 and Table 6. In the pulp and peel of mandarin fruits, the main flavanone was hesperidin. In dry pulp residue, hesperidin ranged from 15.89 mg/g (‘Owari’) to 24.76 mg/g (‘Kawano Wase’), and in the dry peel, it ranged from 50.018 mg/g (‘Owari’) to 73.809 mg/g (‘Zorica’). Naringin was presented in the dry peel but not in the dry pulp residue. According to Levaj et al. [40], hesperidin, narirutin, and naringin were found in both the fresh pulp and peel of Satsuma mandarins from Neretva valley, with hesperidin being the most abundant, followed by narirutin and naringin. The reason for this could be the sample preparation but also the climatic conditions, the stage of ripeness and the types of varieties. Polymetoxyflavanones (PMFs) were presented in the dry peels of all five varieties of Satsuma mandarins (Table 6). The most abundant component of PMFs was nobiletin, in a range from 0.204 mg/g (‘Chahara’) to 0.608 mg/g (‘Saigon’), followed by tangeretin, ranging from 0.133 mg/g (‘Chahara’) to 0.251 mg/g (‘Saigon’). Sinensetin was not detected in the dry peels from ‘Chahara’. Sung et al. [41] reported even higher levels of PMFs content in mandarin peel. Nobiletin and tangeretin were reported in the presence of 4.7 mg/g, and 1.55 mg/g, respectively. Xing et al. [42] reported the content of 13 PMFs in different Citrus peels, as determined by UPLCQ-TOF-MS. In seven different varieties of Citrus reticulata, nobiletin was in the range from 1.576 mg/g to 6.453 mg/g, followed by tangeretin, in the range from 1.053 mg/g to 3.116 mg/g, and sinensetin, in the range from 0.121 mg/g to 0.984 mg/g of the dry mandarin peel. In mandarin dry peels from Neretva valley, nobiletin, tangeritin and sinensetin were presented at lower levels than the results of [42]. PMFs are a highly potent group of citrus flavonoids with several nutraceutical effects including anti-cancer, anti-inflammatory and anti-cardiovascular disease properties [43]. In this study, PMFs were significantly higher in ‘Saigon’ than in the other four varieties.
Polyphenolic compounds and carotenoids are not equally distributed in the different parts of citrus fruit. The distribution of bioactive compounds in mandarin juice, dry pulp residue and dry peels was shown to be distinct in this study. Dry peels showed higher levels of polyphenolic compounds and antioxidant activity. Interestingly, total carotenoids were found to be in a greater concentration in the dry pulp residue compared to in the dry peel, relative to the dry matter. Similar results were reported by [44], where they compared the content of carotenoids in the citrus byproduct, peel, pulp and juice and found significantly higher amounts in the dry pulp relative to the dry peel. This can have a significant industrial impact on using Satsuma mandarin pulp waste after the potential production of mandarin juices. Agro-industrial mandarin residues can be further utilized in the production of functional compounds or the production of functional foods. Our future studies of mandarins from Neretva valley will include individual carotenoids and volatiles compound detection and identification using high-performance liquid chromatography and gas chromatography–olfactometry.

4. Conclusions

Fruit quality, total polyphenols, total carotenoids, flavonoid composition and antioxidant capacities of different fruit parts of five mandarin varieties from Neretva valley are reported for the first time. The compositions of bioactive compounds were differently distributed in different parts of the mandarin fruit: juice, pulp and peel. Additionally, there was a significant difference between varieties in terms of fruit quality and bioactive compound composition. These findings provide novel insights into the impacts of climate and specific geographical origin on the different varieties of Satsuma mandarins from Neretva Valley, along with the nutritional values, providing consumers and industry with important data. Since significant amounts of valuable compounds are found in the agro-industrial residues of mandarin fruits (peels and pulp) from Neretva valley, the extraction, isolation and utilization of these compounds could potentially have a great economic and environmental impact on the region.

Author Contributions

Conceptualization, L.M.B.; methodology, M.S.B. and K.V.-K.; formal analysis, A.M.A. and K.S.S.; data curation, S.J. and G.F.; writing—original draft preparation, L.M.B.; writing—review and editing, N.J. and S.J. All authors have read and agreed to the published version of the manuscript.

Funding

This research was financed by the Croatian Science Foundation through a project entitled Mandarins from Neretva valley—Chemical characterization and Innovative postharvest TREAtments (CITREA) (UIP-2020-02-7496).

Data Availability Statement

The data presented in this study are available on request from the corresponding author.

Conflicts of Interest

The authors declare no conflict of interest.

References

  1. FAO (Food and Agriculture Organization of the United Nations); FAOSTAT. FAOSTAT Statistical Database. 2021. Available online: http://www.fao.org/faostat (accessed on 24 February 2023).
  2. Goldenberg, L.; Yaniv, Y.; Porat, R.; Carmi, N. Mandarin fruit quality: A review. J. Sci. Food Agric. 2018, 98, 18–26. [Google Scholar] [CrossRef]
  3. Usman, M.; Fatima, B. Mandarin (Citrus reticulata Blanco) Breeding. In Advances in Plant Breeding Strategies: Fruits, 1st ed.; Al-Khayri, J.M., Jain, S.M., Johnson, D.V., Eds.; Springer: Cham, Switzerland, 2018; pp. 465–533. [Google Scholar]
  4. Kato, M. Citrus and health. In The Genus Citrus, 1st ed.; Talon, M., Caruso, M., Gmitter, F., Eds.; Elsevier: Amsterdam, The Netherlands, 2020; pp. 495–511. [Google Scholar]
  5. Kopustinskiene, D.M.; Jakstas, V.; Savickas, A.; Bernatoniene, J. Flavonoids as anticancer agents. Nutrients 2020, 12, 457. [Google Scholar] [CrossRef] [PubMed] [Green Version]
  6. Saini, R.K.; Ranjit, A.; Sharma, K.; Prasad, P.; Shang, X.; Gowda, K.G.M.; Keum, Y.S. Bioactive Compounds of Citrus Fruits: A Review of Composition and Health Benefits of Carotenoids, Flavonoids, Limonoids, and Terpenes. Antioxidants 2022, 11, 239. [Google Scholar] [CrossRef]
  7. Bureš, M.S.; Maslov Bandić, L.; Vlahoviček-Kahlina, K. Determination of Bioactive Components in Mandarin Fruits: A Review. Crit. Rev. Anal. Chem. 2022, 1–26. [Google Scholar] [CrossRef]
  8. Jemrić, T.; Romic, M.; Romic, D.; Ondrasek, G. Fruit quality of Satsuma mandarin in Croatia-problems and perspectives Reduction of greenhouse gas emissions through urban and agricultural waste utilization in plant production. Contemp. Agric. 2012, 61, 230–236. [Google Scholar]
  9. Won, M.Y.; Min, S.C. Coating Satsuma mandarin using grapefruit seed extract–incorporated carnauba wax for its preservation. Food Sci. Biotechnol. 2018, 27, 1649–1658. [Google Scholar] [CrossRef] [PubMed]
  10. Jatoi, M.A.; Jurić, S.; Vidrih, R.; Vinceković, M.; Vuković, M.; Jemrić, T. The effects of postharvest application of lecithin to improve storage potential and quality of fresh goji (Lycium barbarum L.) berries. Food Chem. 2017, 230, 241–249. [Google Scholar] [CrossRef]
  11. Wang, Y.C.; Chuang, Y.C.; Hsu, H.W. The flavonoid, carotenoid and pectin content in peels of citrus cultivated in Taiwan. Food Chem. 2008, 106, 277–284. [Google Scholar] [CrossRef]
  12. Stuetz, W.; Prapamontol, T.; Hongsibsong, S.; Biesalski, H.K. Polymethoxylated flavones, flavanone glycosides, carotenoids, and antioxidants in different cultivation types of tangerines (Citrus reticulata blanco cv. sainampueng) from Northern Thailand. J. Agric. Food Chem. 2010, 58, 6069–6074. [Google Scholar] [CrossRef]
  13. Singleton, V.L.; Orthofer, R.; Lamuela-Raventós, R.M. Analysis of total phenols and other oxidation substrates and antioxidants by means of folin-ciocalteu reagent. Methods Enzymol. 1999, 299, 152–178. [Google Scholar]
  14. Ivanova, V.; Stefova, M.; Chinnici, F. Determination of the polyphenol contents in Macedonian grapes and wines by standardized spectrophotometric methods. J. Serb. Chem. Soc. 2010, 75, 45–59. [Google Scholar] [CrossRef]
  15. Brand-Williams, W.; Cuvelier, M.E.; Berset, C. Use of a free radical method to evaluate antioxidant activity. LWT-Food Sci. Technol. 1995, 28, 25–30. [Google Scholar] [CrossRef]
  16. Re, R.; Pellegrini, N.; Proteggente, A.; Pannala, A.; Yang, M.; Rice-Evans, C. Antioxidant activity applying an improved ABTS radical cation decolorization assay. Free Radic. Biol. Med. 1999, 26, 1231–1237. [Google Scholar] [CrossRef] [PubMed]
  17. Lee, H.S. Characterization of Carotenoids in Juice of Red Navel Orange (Cara Cara). J. Agric. Food Chem. 2001, 49, 2563–2568. [Google Scholar] [CrossRef]
  18. Barros, L.; Cruz, T.; Baptista, P.; Estevinho, L.M.; Ferreira, I.C.F.R. Wild and commercial mushrooms as source of nutrients and nutraceuticals. Food Chem. Toxicol. 2008, 46, 2742–2747. [Google Scholar] [CrossRef]
  19. Radulović, M.; Đukić, M.; Radulović, D. Influence of variety and location on unshiu citrus fruit weight (Citrus unshiu March.). Agric. For. 2014, 60, 291–298. [Google Scholar]
  20. Özkaya, O.; Yabaci Karaoğlan, S.; İncesu, M.; Yeşiloğlu, T. The general and volatile properties and the quality of two newly selected satsuma clones (11/1 İzmir and 30/İzmir) grown under mediterranean ecological conditions. Food Sci. Technol. 2019, 39, 451–457. [Google Scholar] [CrossRef] [Green Version]
  21. Muramatsu, N.; Takahara, T.; Ogata, T.; Kojima, K. Changes in rind firmness and cell wall polysaccharides during citrus fruit development and maturation. HortScience. 1999, 34, 79–81. [Google Scholar] [CrossRef] [Green Version]
  22. Li, Z.; Jin, R.; Yang, Z.; Wang, X.; You, G.; Guo, J.; Zhang, Y.; Liu, F.; Pan, S. Comparative study on physicochemical, nutritional and enzymatic properties of two Satsuma mandarin (Citrus unshiu Marc.) varieties from different regions. J. Food Compos. Anal. 2021, 95, 103614. [Google Scholar] [CrossRef]
  23. Lado, J.; Rodrigo, M.J.; Zacarias, L. Maturity indicators and citrus quality. Stewart Postharvest Rev. 2014, 2, 1–6. [Google Scholar]
  24. Haisman, D.R.; Clarke, M.W. The interfacial factor in the heat-induced conversion of chlorophyll to pheophytin in green leaves. J. Sci. Food Agric. 1975, 26, 1111–1126. [Google Scholar] [CrossRef]
  25. Kelebek, H.; Selli, S. Identification of phenolic compositions and the antioxidant capacity of mandarin juices and wines. J. Food Sci. Technol. 2014, 51, 1094–1101. [Google Scholar] [CrossRef] [PubMed] [Green Version]
  26. Pyo, Y.H.; Jin, Y.J.; Hwang, J.Y. Comparison of the effects of blending and juicing on the phytochemical contents and antioxidant capacity of typical Korean kernel fruit juices. Prev. Nutr. Food Sci. 2014, 19, 108–114. [Google Scholar] [CrossRef] [PubMed] [Green Version]
  27. Anticona, M.; Fayos, M.C.; Esteve, M.J.; Frigola, A.; Blesa, J.; Lopez-Malo, D. Differentiation of juice of mandarin-like hybrids based on physicochemical characteristics, bioactive compounds, and antioxidant capacity. Eur. Food Res. Technol. 2022, 248, 2253–2262. [Google Scholar] [CrossRef]
  28. Xi, W.; Zhang, Y.; Sun, Y.; Shen, Y.; Ye, X.; Zhou, Z. Phenolic composition of Chinese wild mandarin (Citrus reticulata Balnco.) pulps and their antioxidant properties. Ind. Crops Prod. 2014, 52, 466–474. [Google Scholar] [CrossRef]
  29. Zhang, H.; Yang, Y.F.; Zhou, Z.Q. Phenolic and flavonoid contents of mandarin (Citrus reticulata Blanco) fruit tissues and their antioxidant capacity as evaluated by DPPH and ABTS methods. J. Integr. Agric. 2018, 17, 256–263. [Google Scholar] [CrossRef]
  30. Zhang, Y.; Sun, Y.; Xi, W.; Shen, Y.; Qiao, L.; Zhong, L.; Ye, X.; Zhou, Z. Phenolic compositions and antioxidant capacities of Chinese wild mandarin (Citrus reticulata Blanco) fruits. Food Chem. 2014, 145, 674–680. [Google Scholar] [CrossRef]
  31. Rodriguez-Concepcion, M.; Avalos, J.; Bonet, M.L.; Boronat, A.; Gomez-Gomez, L.; Hornero-Mendez, D.; Limon, M.C.; Melendez-Martinez, A.J.; Olmedilla-Alonso, B.; Palou, A.; et al. A global perspective on carotenoids: Metabolism, biotechnology, and benefits for nutrition and health. Prog. Lipid Res. 2018, 70, 62–93. [Google Scholar] [CrossRef] [Green Version]
  32. Cheng, C.X.; Jia, M.; Gui, Y.; Ma, Y. Comparison of the effects of novel processing technologies and conventional thermal pasteurisation on the nutritional quality and aroma of Mandarin (Citrus unshiu) juice. Innov. Food Sci. Emerg. Technol. 2020, 64, 102425. [Google Scholar] [CrossRef]
  33. Panda, D.; Ghosh, D.C.; Kar, M. Effect of Salt Stress on the Pigment Content and Yield of Different Rice (Oryza sativa L.) Genotypes. Int. J. Bio-Resour. Stress Manag. 2013, 4, 431–434. [Google Scholar]
  34. Yarsi, G.; Sivaci, A.; Yildiz Dasgan, H.; Altuntas, O.; Binzet, R.; Akhoundnejad, Y. Effects of salinity stress on chlorophyll and carotenoid contents and stomata size of grafted and ungrafted galia c8 melon cultivar. Pak. J. Bot. 2017, 49, 421–426. [Google Scholar]
  35. Akcin, A.; Yalcin, E. Effect of salinity stress on chlorophyll, carotenoid content, and proline in Salicornia prostrata Pall. and Suaeda prostrata Pall. subsp prostrata (Amaranthaceae). Rev. Bras. Bot. 2016, 39, 101–106. [Google Scholar] [CrossRef]
  36. Costanzo, G.; Vitale, E.; Iesce, M.R.; Naviglio, D.; Amoresano, A.; Fontanarosa, C.; Spinelli, M.; Ciaravolo, M.; Arena, C. Antioxidant Properties of Pulp, Peel and Seeds of Phlegrean Mandarin (Citrus reticulata Blanco) at Different Stages of Fruit Ripening. Antioxidants 2022, 11, 187. [Google Scholar] [CrossRef]
  37. Magwaza, L.S.; Opara, U.L.; Cronje, P.J.R.; Landahl, S.; Ortiz, J.O.; Terry, L.A. Rapid methods for extracting and quantifying phenolic compounds in citrus rinds. Food Sci. Nutr. 2016, 4, 4–10. [Google Scholar] [CrossRef] [PubMed]
  38. Peterson, J.J.; Dwyer, J.T.; Beecher, G.R.; Bhagwat, S.A.; Gebhardt, S.E.; Haytowitz, D.B.; Holden, J.M. Flavanones in oranges, tangerines (mandarins), tangors, and tangelos: A compilation and review of the data from the analytical literature. J. Food Compos. Anal. 2006, 19, S66–S73. [Google Scholar] [CrossRef]
  39. Graca Miguel, M.; Duarte, A.; Nunes, S.; Sustelo, V.; Martins, D.; Anahi Dandlen, S. Ascorbic acid and flavanone glycosides in citrus: Relationship with antioxidant activity. J. Food Agric. Environ. 2009, 7, 222–227. [Google Scholar]
  40. Levaj, B.; Dargović-Uzelac, V.; Kovačević, D.B.; Krasnići, N. Determination of flavonoids in pulp and peel of mandarin fruits. Agric. Conspec. Sci. 2009, 74, 221–225. [Google Scholar]
  41. Sung, J.; Suh, J.H.; Wang, Y. Effects of heat treatment of mandarin peel on flavonoid profiles and lipid accumulation in 3T3-L1 adipocytes. J. Food Drug Anal. 2019, 27, 729–735. [Google Scholar] [CrossRef] [PubMed] [Green Version]
  42. Xing, T.T.; Zhao, X.J.; Zhang, Y.D.; Li, Y.F. Fast separation and sensitive quantitation of polymethoxylated flavonoids in the peels of Citrus using UPLC-Q-TOF-MS. J. Agric. Food Chem. 2017, 65, 2615–2627. [Google Scholar] [CrossRef]
  43. Xi, W.; Zhang, G.; Jiang, D.; Zhou, Z. International Journal of Food Sciences and Nutrition Phenolic compositions and antioxidant activities of grapefruit (Citrus paradisi Macfadyen) varieties cultivated in China Phenolic compositions and antioxidant activities of grapefruit (Citrus paradisi Macfadyen) varieties cultivated in China. Int. J. Food Sci. Nutr. 2015, 66, 858. [Google Scholar]
  44. Sharma, K.; Mahato, N.; Cho, M.H.; Lee, Y.R. Converting citrus wastes into value-added products: Economic and environmently friendly approaches. Nutrition 2017, 34, 29–46. [Google Scholar] [CrossRef] [PubMed]
Figure 1. Sample of Satsuma mandarin (Chahara) from the experiment.
Horticulturae 09 00383 g001
Figure 2. Bioactive compounds as (a) total polyphenolic compounds (TPC), (b) total flavonoids (TF) and (c) total carotenoids (TC) in dry pulp residue and dry peel of different mandarin varieties from Neretva valley (Croatia). Results are expressed per g of dry weight mandarin dry pulp residue/peel. The same letters above the same-colored bars are not significantly different according to the post hoc t-test with Bonferroni adjustment (p < 0.05).
Horticulturae 09 00383 g002aHorticulturae 09 00383 g002b
Figure 3. Antioxidant capacity in (a) dry pulp residue and (b) dry peel, as determined by two methods (DPPH and ABTS), in different varieties of mandarins from Neretva valley (Croatia). Results are expressed per g of dry weight mandarin pulp/peel. The same letters above the same-colored bars are not significantly different according to the post hoc t-test with Bonferroni adjustment (p < 0.05).
Horticulturae 09 00383 g003
Table 1. Physicochemical properties in different varieties of mandarin fruits from Neretva valley.
VarietyMass
(g)
Firmness (kg cm−2)TSS
(%)
TA
(%)
TSS/TA
pH
‘Zorica’84.93 ± 18.14 c3.98 ± 0.82 a13.02 ± 1.39 a2.38 ± 0.50 a5.62 ± 0.94 d3.11 ± 0.03 c
‘Chahara’98.89 ± 19.15 bc4.28 ± 0.58 a12.43 ± 1.06 b2.06 ± 0.45 b6.25 ± 1.32 d3.14 ± 0.07 c
‘Kawano Wase’112.68 ± 13.45 ab2.09 ± 1.09 c11.68 ± 0.70 c1.30 ± 0.23 c9.20 ± 1.42 c3.52 ± 0.12 b
‘Owari’124.49 ± 34.69 a2.02 ± 0.34 c11.76 ± 0.76 c1.04 ±0.23 d11.47 ± 1.38 b3.58 ± 0.18 b
‘Saigon’116.47 ± 42.54 ab2.78 ± 0.46 b10.95 ± 1.57 d0.74 ± 0.18 e15.73 ± 4.63 a3.77 ± 0.44 a
Values superscripted with the same letter within a column are not significantly different according to the LSD test, with p ≤ 0.
Table 2. Color parameters of mandarin fruit, citrus number (CN) and citrus color index (CCI).
VarietyL *a *b *C *H *CN *CCI *
‘Zorica’65.43 ± 2.9119.83 ± 3.4963.04 ± 3.3266.18 ± 3.3272.54 ± 3.0850.68 ± 1.494.85 ± 1.03
‘Chahara’67.58 ± 2.3614.95 ± 4.4063.40 ± 3.7665.28 ± 3.8576.77 ± 3.8248.58 ± 1.793.52 ± 1.13
‘Kawano Wase’65.71 ± 2.0421.01 ± 3.0461.07 ± 3.1464.66 ± 3.1671.02 ± 2.7150.85 ± 1.355.27 ± 0.91
‘Owari’62.48 ± 8.8621.59 ± 3.6559.36 ± 7.4463.27 ± 7.3669.84 ± 3.6651.59 ± 2.136.49 ± 4.41
‘Saigon’64.70 ± 2.1524.66 ± 1.3859.02 ± 3.7564.00 ± 3.3167,25 ± 1.9852.25 ± 0.756.51 ± 0.77
F test*******˂0.1185 ns *********
ns, *, **, ***—no statistically significant difference and statistically significantly different with p ≤ 0.05, p ≤ 0.01 and p ≤ 0.00, respectively.
Table 3. Bioactive compounds in mandarin juice as total polyphenolic compounds (TPC), total flavonoids (TF), total carotenoids (TC) and antioxidant capacity, as determined with two methods (DPPH and ABTS) in different varieties of mandarins from Neretva valley (Croatia). Results are expressed per L of mandarin juice.
Bioactive CompoundsAntioxidant Capacity
VarietyTPC (mg GAE/L)TF (mg QE/L)TC (μg β-carotene/L)DPPH (mmol TE/L)ABTS (mmol TE/L)
‘Zorica’1110.67 ± 59.14 a846.68 ± 17.69 a200.57 ± 3.69 a2.77 ± 0.07 a3.80 ± 0.21 a
‘Chahara’901.41 ± 57.88 b737.74 ± 34.76 b200.57 ± 13.30 a2.71 ± 0.06 a3.77 ± 0.14 a
‘Kawano Wase’844.00 ± 42.07 bc686.93 ± 29.67 bc93.64 ± 3.69 b2.15 ± 0.02 b3.50 ± 0.08 ab
‘Owari’703.26 ± 26.96 d575.54 ± 19.55 d72.77 ± 6.39 b2.14 ± 0.07 b3.40 ± 0.08 b
‘Saigon’775.48 ± 51.88 cd627.98 ± 32.15 cd104.07 ± 6.39 b2.04 ± 0.08 b3.38 ± 0.24 ab
Values superscripted with the same letter within a column are not significantly different according to the post hoc t-test with Bonferroni adjustment (p < 0.05).
Table 4. Flavonoid content in different varieties of mandarin juice from Neretva valley (Croatia). Results are expressed as mg of compound per L (mg/L) of mandarin juice.
VarietyHesperidinNarirutinNaringin
‘Zorica’98.51 ± 2.59 a278.74 ± 28.01 a6.53 ± 0.09 a
‘Chahara’107.81 ± 4.96 a248.77 ± 19.36 ab6.32 ± 0.04 a
‘Kawano Wase’86.87 ± 3.78 b218.06 ± 11.09 b6.66 ± 0.11 a
‘Owari’67.89 ± 16.11 bc117.13 ± 19.55 c4.56 ± 0.29 b
‘Saigon’91.36 ± 17.09 ac165.91 ± 24.1 c5.28 ± 0.14 b
Values superscripted with the same letter within a column are not significantly different according to the post hoc t-test with Bonferroni adjustment (p < 0.05).
Table 5. Flavonoid content in the dry mandarin pulp residue. Results are expressed per g of dry weight mandarin pulp (mg/g DW).
VarietyNarirutinHesperidin
‘Zorica’6.00 ± 0.38 a16.74 ± 1.03 a
‘Chahara’7.38 ± 0.01 b16.56 ± 0.36 a
‘Kawano Wase’7.10 ± 0.02 c24.76 ± 0.18 b
‘Owari’4.89 ± 0.07 d15.89 ± 0.21 a
‘Saigon’9.18 ± 0.09 e22.80 ± 0.20 c
Values superscripted with the same letter within a column are not significantly different according to the post hoc t-test with Bonferroni adjustment (p < 0.05).
Table 6. Bioactive compounds in dry mandarin peel of different varieties of mandarins from Neretva valley (Croatia). Results are expressed per g of dry mandarin peel weight (mg/g DW).
Compound (mg/g)‘Zorica’‘Chahara’‘Kawano Wase’‘Owari’‘Saigon’
Narirutin19.849± 0.090 a15.010 ± 0.001 b12.581 ± 0.008 c8.094 ± 0.009 d11.922 ± 0.030 e
Hesperidin73.809 ± 0.549 a50.012 ± 0.001 b62.028 ± 0.667 c50.018 ± 0.270 b51.942 ± 0.091 d
Naringin0.346 ± 0.003 a0.349 ± 0.000 b0.339 ± 0.001 a0.405 ± 0.007 c0.387 ± 0.002 d
Quercetinn.d.*n.d.*n.d.*0.017 ± 0.008 an.d.*
Sinensetin0.091 ± 0.091 an.d.*0.246 ± 0.008 b0.232 ± 0.003 bc0.353 ± 0.008 c
Nobiletin0.276 ± 0.001 a0.204 ± 0.000 b0.455 ± 0.002 c0.419 ± 0.006 d0.608 ± 0.001 e
Tangeretin0.162 ± 0.001 a0.133 ± 0.000 b0.235 ± 0.000 c0.200 ± 0.002 d0.251 ± 0.000 e
Values superscripted with the same letter within a row are not significantly different according to the post hoc t-test with Bonferroni adjustment (p < 0.05), n.d.*—not determined.
Disclaimer/Publisher’s Note: The statements, opinions and data contained in all publications are solely those of the individual author(s) and contributor(s) and not of MDPI and/or the editor(s). MDPI and/or the editor(s) disclaim responsibility for any injury to people or property resulting from any ideas, methods, instructions or products referred to in the content.

