
The Stability of Important Fruit Traits in Strawberry in Queensland
Department of Agriculture and Fisheries, SCMC, P.O. Box 5083, Nambour, QLD 4560, Australia
Horticulturae 2023, 9(3), 296; https://doi.org/10.3390/horticulturae9030296
Submission received: 30 January 2023
/
Revised: 15 February 2023
/
Accepted: 17 February 2023
/
Published: 22 February 2023
(This article belongs to the Collection New Challenges in Productivity of Berry Fruits)
Abstract
:Information was collected on yield and fruit quality in ‘Festival’, ‘Fortuna’, ‘Red Rhapsody’, ‘Fronteras’, ‘Grenada’ and ‘Petaluma’ strawberry (Fragaria × ananassa Duch.) in southern Queensland, Australia. Marketable yield was similar in the cultivars and ranged from 352 to 416 g/plant. Fruit were smaller in ‘Festival’ and ‘Grenada’ (21.3 or 23.7 g), intermediate in ‘Fortuna’ and ‘Red Rhapsody’ (25.0 or 24.7 g), and larger in ‘Fronteras’ and ‘Petaluma’ (27.6 or 27.8 g). Fruit soluble solids content (SSC) was lower in ‘Fronteras’, ‘Grenada’ and ‘Petaluma’ (6.9% to 7.2%) than in the other cultivars (7.4% to 8.3%). Fruit titratable acidity (TA) was lower in ‘Fortuna’ and ‘Fronteras’ (0.55% to 0.58%) than in the other cultivars (0.63% to 0.69%). The cultivars had similar estimates of stability for fruit weight (0.74 to 1.27) using the method of Finlay and Wilkinson (1963), where a cultivar with a value of one has average stability in a group. This suggests that the cultivars behaved similarly to changes in conditions over the season. The estimates of stability for SSC were lower than one or higher than one in some cultivars (0.45 to 1.75). The estimates of stability for TA were lower than one for some cultivars (0.33 to 1.33). None of the cultivars had high values of fruit quality and stable values of fruit quality for all the three traits. ‘Festival’ would be an acceptable parent in a breeding programme used to increase fruit SSC. In contrast, the other cultivars would be acceptable parents to increase fruit size. Efforts need to be made to develop cultivars with high and stable values of quality and that are suitable for production under global warming.
1. Introduction
Strawberry (Fragaria × ananassa Duch.) is the most popular berry fruit in the Rosaceae family and is grown in many locations around the globe [1,2,3,4]. Total production is about 14 million tonnes each year [5]. The crop is most important in China, the United States and Europe [3]. The plants are adapted to a wide range of environmental conditions, with production in areas with a temperate, subtropical or Mediterranean climate [6,7,8]. Commercial cultivation is based on different cultivars in the various regions [5]. Plants are grown in the field or in protected culture using plastic tunnels or glasshouses. Plants under protected culture are typically grown on benches using soil-less technology [1,2].
Fruit quality in strawberry is affected by several factors, including the cultivar, weather and growing conditions [9]. Dong et al. [10] examined the performance of six day-neutral cultivars under protected cropping in Maryland. They found that cultivar was the most important factor influencing fruit quality. For instance, soluble solids content (SSC) under a clear greenhouse film ranged from 6.1% to 9.9%. Fruit weight, SSC, titratable acidity (TA) and firmness increase with increasing solar radiation and decrease with increasing temperatures [11,12,13]. Watering, fertilizing and mulching also affect fruit quality [9]. Ariza et al. [14] demonstrated that irrigation influenced several flavour components in six cultivars in Huelva, Spain. Low rates of water application increased the total phenolic content and total flavonoid content compared with high rates of water application. Information collated across numerous studies indicate that cultivars with stable quality are preferred over those with variable quality [12,13,14,15,16,17,18,19,20,21,22,23,24,25,26,27].
In many crops, a stable yield or product quality is as important as a high mean yield or product quality. Various approaches have been used to estimate the stability of yield or quality [28,29,30,31,32,33,34,35,36]. The regression method expanded by Finlay and Wilkinson [28] in barley in Australia has been adopted in numerous studies. In this work, a linear regression of yield for each cultivar on the mean yield of all cultivars for each site and season was calculated to measure the adaptation of each cultivar. Cultivars with a slope from the regression of one had average stability. Cultivars with a slope of two were less stable than average, while cultivars with a slope of 0.1 were more stable than average. Cultivars with a slope higher than one are responsive to high-performing environments (e.g., cool weather for strawberry), while those with a slope lower than one are responsive to low-performing environments (e.g., warm weather for strawberry) [35].
Hasing et al. [16] studied the changes in SSC in strawberry in Florida. The typical harvest extends from November to March and is characterized by a range in the weather. Hasing and colleagues [16] found that SSC ranged from 5.1% to 9.9% in the first season and from 6.5% to 10.6% in the second. Approximately 90% of the genotypes had average stability, while the remaining 10% were unstable or stable. There were a few genotypes with a high mean value and stable values of SSC. Chandler et al. [18] evaluated the stability of yield across five cultivars in the same area. None of the cultivars had consistent high yields. ‘Selva’ was stable, but low yielding, while ‘Pajaro’ was both unstable and low yielding. The cultivars from Florida had higher yields than those from California and were unstable.
Cervantes et al. [25] investigated the growth of five cultivars over four seasons in Spain. In most of the cultivars, organoleptic parameters (phenolic and flavonoid content, etc.) were more stable across years than across harvests in a season. The reverse was true for functional parameters (SSC, TA, firmness, etc.). ‘Splendor’ had greater year-on stability for organoleptic parameters, and ‘Sabrina’ and ‘Candonga’ had greater inter- and intra-annual stability for functional parameters, respectively. Sone et al. [20] examined the performance of 43 cultivars in Japan over two years. Cultivars with excellent eating had a higher sugar content, total sugar/total acid ratio, and sucrose/total acid ratio, and a lower total organic acid content than those with poor eating. Cultivars which retained eating quality over the harvests had a lower co-efficient of variation (c.v.) for total sugar content, sucrose/total sugar ratio, glucose/total sugar ratio, and citric/total organic acid ratio than those with variable quality.
There is no information on the stability of fruit quality in strawberry cultivars in Queensland, Australia. This area has a similar climate to Florida. Fruit are harvested over several weeks during winter and spring, with a range in temperature and light conditions over the harvests. This paper reports on the stability of fruit weight, SSC and TA in six cultivars in south-east Queensland. The regression method expanded by Finlay and Wilkinson [28] was used to determine the performance of the cultivars.
2. Materials and Methods
2.1. Experimental Design and Growing Conditions
Bare-rooted transplants of six cultivars (‘Festival’, ‘Fortuna’, ‘Red Rhapsody’, ‘Fronteras’, ‘Grenada’ and ‘Petaluma’) were obtained from Toolangi in Victoria, Australia (latitude 37.3° S, longitude 145.3° E, and elevation 595 m) and planted in Nambour in south-east Queensland (latitude 26.6° S, longitude 152.9° E, and elevation 29 m) on 20 April 2022.
‘Festival’ (‘Strawberry Festival’) and ‘Fortuna’ (‘Florida Radiance’) were developed in Florida and have early production and small to intermediate fruit [37,38]. ‘Red Rhapsody’ was developed in Queensland and has early production and intermediate to large fruit [39]. ‘Fronteras’, ‘Grenada’ and ‘Petaluma’ were developed in California for early production and have intermediate to large fruit [40].
The cultivars were planted in a Latin-square design, with six replicate blocks per cultivar. The transplants were planted through plastic, in double-row beds 70 cm wide and 130 cm apart from the centres and grown at 30 cm between the rows and 30 cm within the rows. This planting gave a density of 51,282 plants/ha. Irrigation was provided through drip-tape under the plastic when the soil water potential at a 25 cm depth fell below −10 kPa. The plants received a total of 117 kg/ha of N, 24 kg/ha of P, 165 kg/ha of K, 7 kg/ha of Ca and 13 kg/ha of Mg through the irrigation.
2.2. Data Collection
Mature fruit were harvested weekly to assess marketable yield and quality from 3 August to 19 October. Marketable fruit weighed at least 12 g fresh weight and were not affected by rain or grey mould or were misshapen or had other defects. Data were collected on total soluble solids content (SSC), and titratable acidity (TA) as citric acid measured at 21 °C weekly, giving 12 harvests [25,41]. Sixty-gram subsamples of each strawberry lot were gently melted separately in a microwave oven in one litre beakers for two periods of 2 min and 45 s and shaken intermittently. The thawed fruit were crushed manually using a potato masher after which the temperature of the mash was 18 °C to 21 °C. After centrifugation at 21 °C for 10 min, the juice was filtered through a cheesecloth. The filtrated juice was titrated with 0.1 M NaOH to the end point pH 8.1, the third pK value of citric acid (AOAC 22.058) and total acidity calculated as citric acid. The pH was determined at room temperature with a portable pH meter. Soluble solids were determined by an Atago Brix-refractometer (Atago, Tokyo, Japan). There were six replicates per cultivar for each sampling.
Daily maximum and minimum temperatures, monthly rainfall and daily solar radiation data were collected at the site from the Bureau of Meteorology (www.bom.gov.au) accessed on 30 November 2022.
2.3. Data Analysis
There were 22 plants/plot for each cultivar and harvest. Data on yield and average seasonal fruit weight, SSC and TA were analysed by Latin-square analysis of variance (ANOVA, six cultivars × six rows × six columns) using GenStat (Version 21; VSN International, Hemel Hempstead, UK). Treatment means were separated by calculating least significant differences (LSDs) from the ANOVAs.
The stability of fruit weight, SSC and TA was analysed by regression using the protocol of Finlay and Wilkinson [28]. A linear regression of fruit weight, etc. for each cultivar on the mean fruit weight of all the cultivars for each harvest was calculated to measure their adaptation. The data were transformed to a logarithmic scale before analysis by regression as proposed by Finlay and Wilkinson [28].
The relationship between fruit weight and the average daily mean temperature and solar radiation in the seven weeks before the fruit were harvested was analysed by regression and fitted using the graphical software program SigmaPlot (Version 15; Systat, Chicago, IL, USA). This follows earlier research where this interval was better at estimating fruit weight than other intervals [42]. A similar analysis was conducted with SCC and TA, using data from the eight days before the fruit were harvested, following the recommendation of MacKenzie et al. [12] in Florida.
3. Results
3.1. Weather and the Relationship between Temperature and Solar Radiation
The average monthly daily maximum temperature ranged from 19.9 °C to 25.9 °C, while the minimum ranged from 10.0 °C to 17.6 °C (Table 1). Solar radiation ranged from 10.4 to 16.8 MJ/m2 and the total rainfall ranged from 14 to 586 mm. The days were close to long-term conditions, whereas the nights were 3 °C warmer. Radiation was slightly lower in 2022. It was drier in June compared with the long-term data and wetter in May, July, September and October.
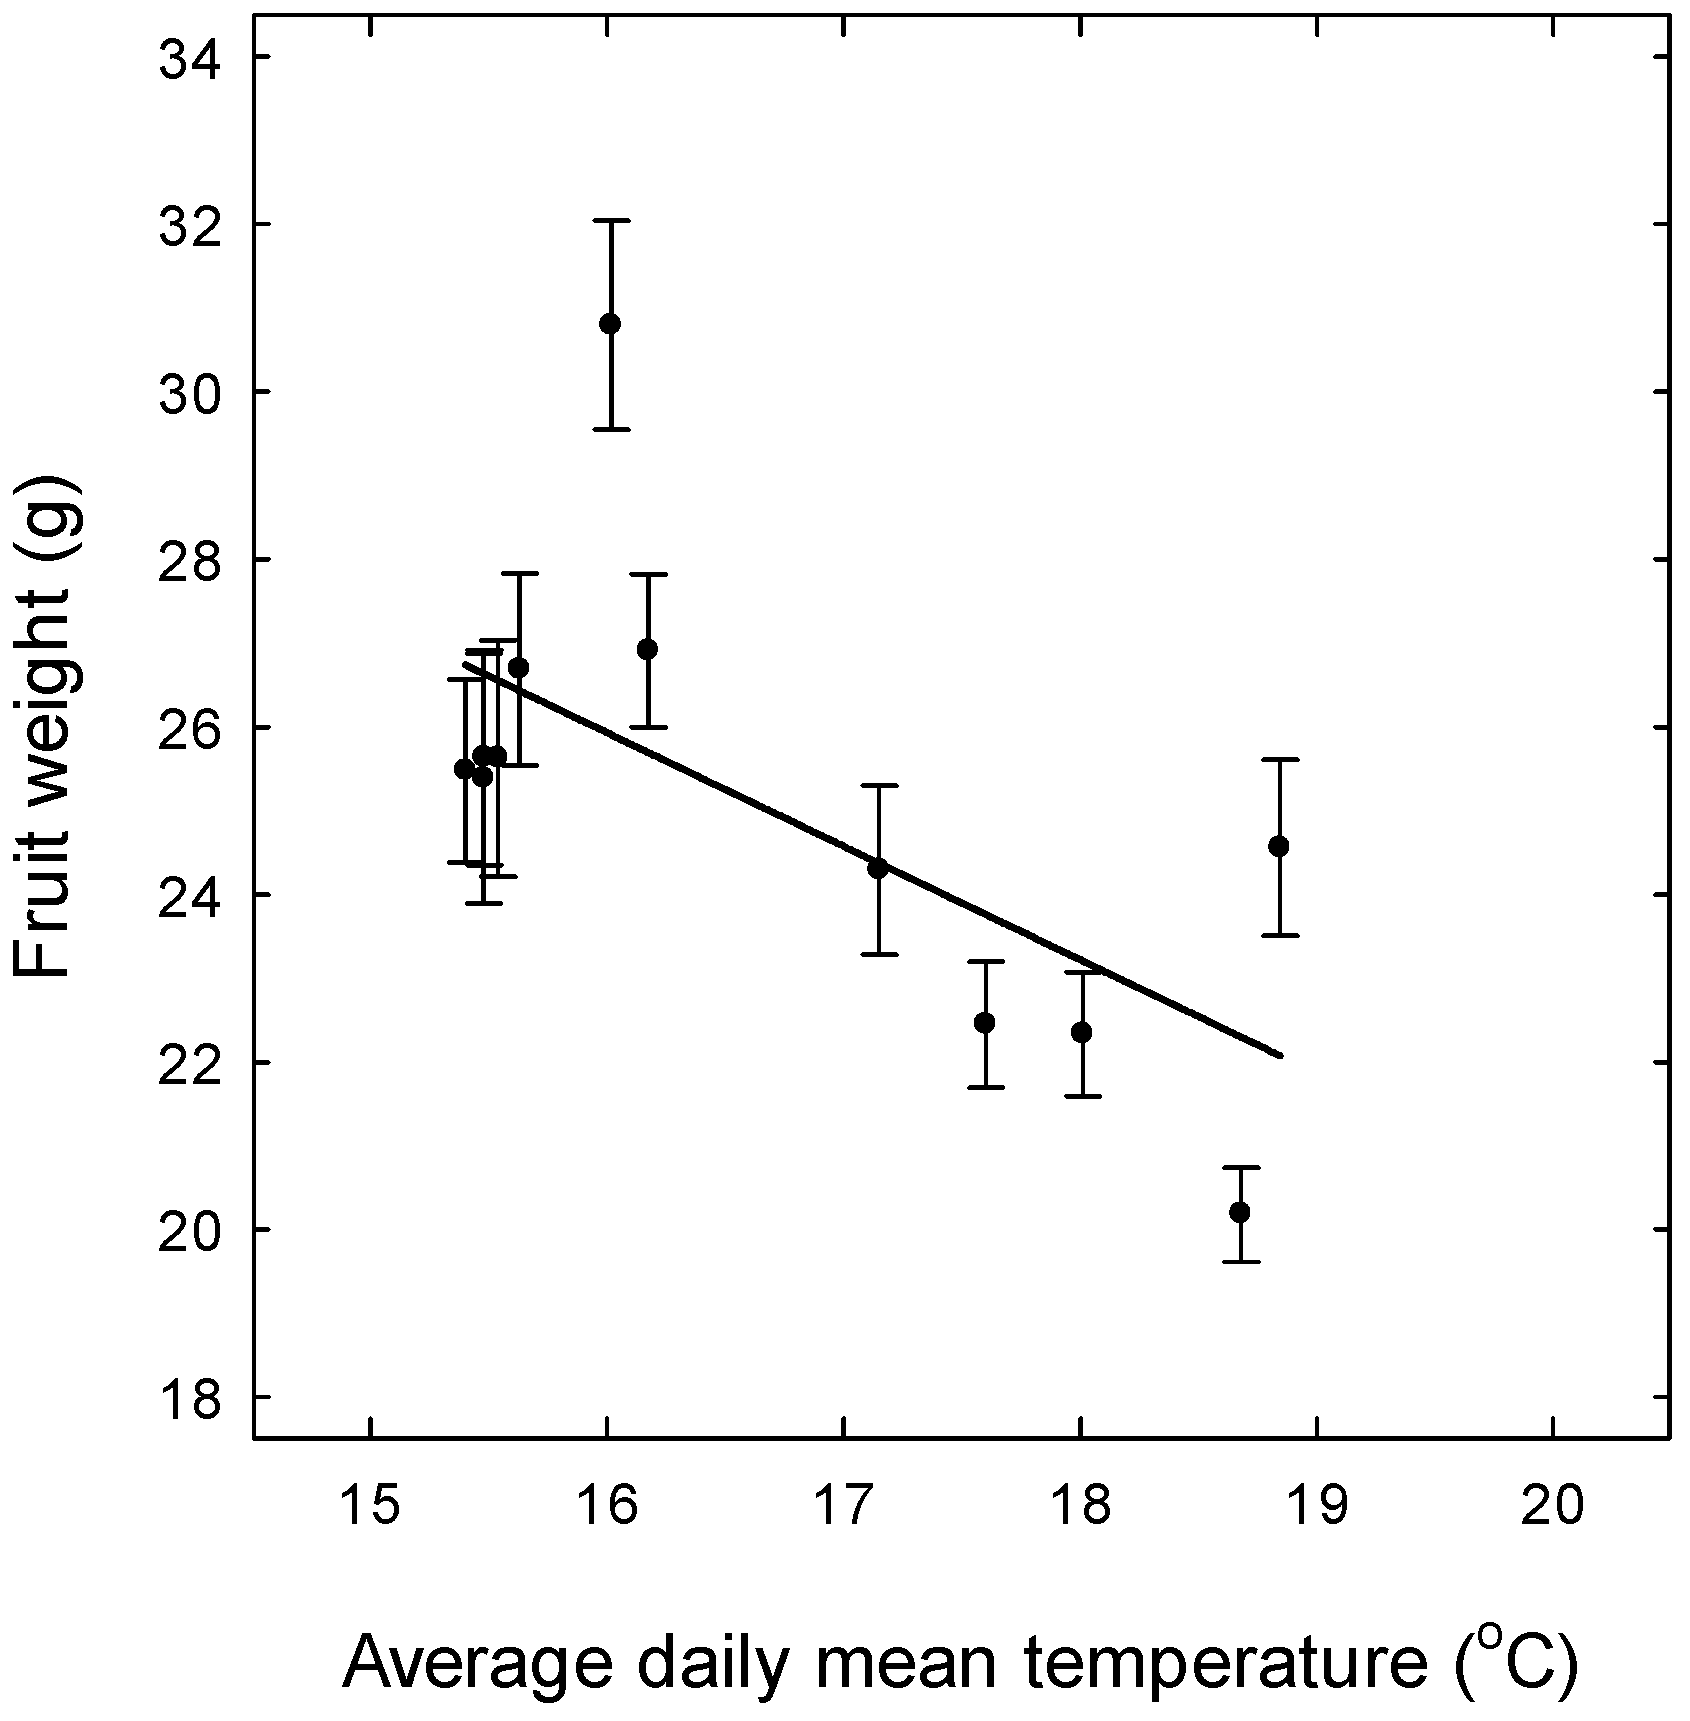
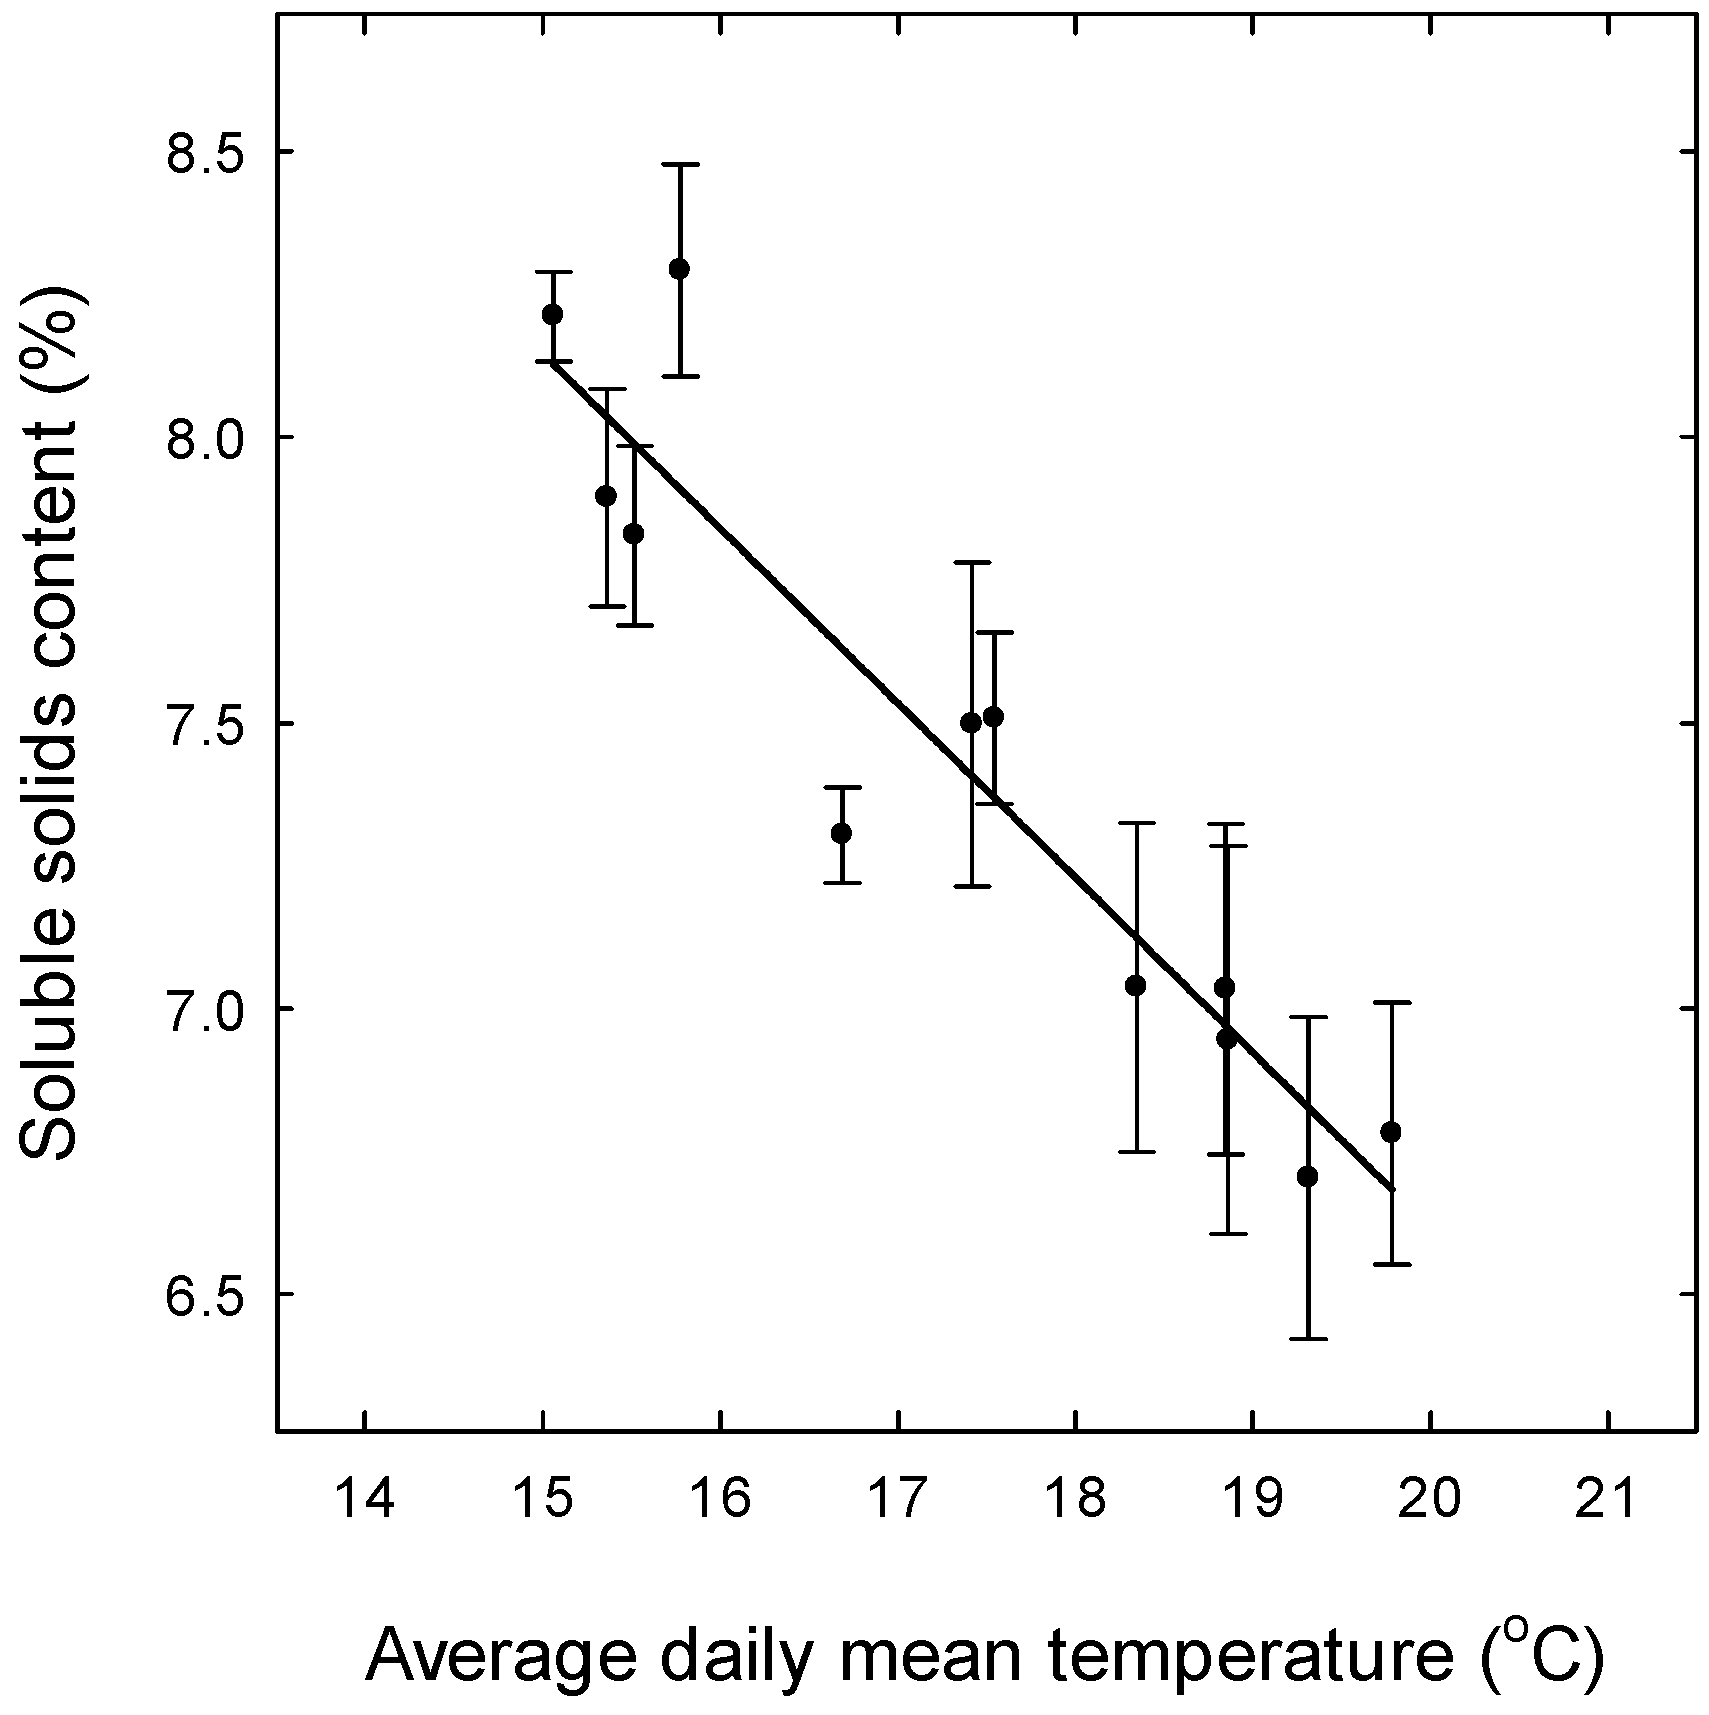
There was a strong positive linear relationship between the mean temperature and radiation in the seven weeks before harvest (p < 0.001, R2 = 0.81), where the data were used to predict fruit weight (see Figure 1). In contrast, there was no relationship between these two variables over the eight days before harvest, where the data were used to predict SSC and TA (p = 0.102, R2 = 0.17) (see Figure 2). The mean temperature in the seven weeks before the fruit were harvested ranged from 15.4 °C to 18.8 °C and radiation ranged from 12.3 to 19.4 MJ/m2. The mean temperature in the eight days before the fruit were harvested ranged from 15.1 °C to 19.8 °C and radiation ranged from 13.7 to 19.4 MJ/m2.
3.2. Effect of Cultivar on Yield and Fruit Quality
Marketable yield was similar in the cultivars and ranged from 352 to 416 g/plant (Table 2). Fruit were smaller in ‘Festival’ and ‘Grenada’, intermediate in ‘Fortuna’ and ‘Red Rhapsody’ and larger in ‘Fronteras’ and ‘Petaluma’ (Table 2). Average SSC was lower in ‘Fronteras’, ‘Grenada’ and ‘Petaluma’ than in the other cultivars, while average TA was lower in ‘Fortuna’ and ‘Fronteras’ (Table 2).
3.3. Stability of Fruit Quality
Estimates of the stability for the three fruit traits were calculated using the analysis promoted by Finlay and Wilkinson [28] (Figures S1–S3 in the Supplementary Material) (Table 3, Table 4 and Table 5). All the cultivars had similar estimates of stability for fruit weight (0.74 to 1.27). Estimates of stability for SSC and TA varied with the cultivar. The stability of SSC was 0.53 for ‘Festival’ and 0.45 for ‘Fortuna’ (more stable than average), 0.84 for ‘Red Rhapsody’ and 0.88 for ‘Petaluma’ (average stability) and 1.69 for ‘Fronteras’ and 1.75 for ‘Grenada’ (less stable than average). The stability of TA was 0.33 for ‘Fortuna’ and 0.60 ‘Fronteras’ (more stable than average) and 1.11 for ‘Petaluma’, 1.16 for ‘Festival’, 1.29 for ‘Grenada’ and 1.33 for ‘Red Rhapsody (average stability).
3.4. Relationship between Fruit Quality and the Weather
There was a strong negative linear relationship between fruit weight and the temperature in the seven weeks before the fruit were harvested (p = 0.018, R2 = 0.39, n = 12; Figure 1). Fruit weight decreased from 27 g to 22 g as the temperature increased from 15.4 °C to 18.8 °C. In contrast, there was no relationship between fruit growth and solar radiation (p = 0.158). There was a strong negative linear relationship between SSC and temperature in the eight days before the fruit were harvested (p < 0.001, R2 = 0.87, n = 12; Figure 2). Soluble solids content decreased from 8.1% to 6.7% as the temperature increased from 15.1 °C to 19.8 °C. There was no relationship between SSC and radiation (p = 0.146) or between TA and the two weather variables (p = 0.814 or 0.102).
4. Discussion
The quality of the fruit varied with the cultivar and the time of harvest in Queensland. All the cultivars had a stability index close to one for fruit weight, suggesting that they behaved similarly to changes in the weather over the season. In contrast, some cultivars had a stability index lower or higher than one for soluble solids content (SSC) or titratable acidity (TA) suggesting a range in the response to the weather for these two traits. The protocol expanded by Finlay and Wilkinson [28] and used in the current study can be explored to assess new cultivars in other environments and other growing systems (e.g., remontant cultivars, cultivars with short-growing seasons, and plants growing under protected cropping, etc.). Fruit weight and SSC were sensitive to environmental conditions and decreased as the temperature increased. None of the cultivars had high values of fruit quality and stable values of fruit quality for all the three traits. Efforts need to be made to develop cultivars with high mean and stable values of quality and suited to production under global warming.
4.1. Yield
The cultivars had similar productivity. The yields were relatively low, probably because the transplants were small and were planted late. Herrington et al. [43] provided an economic analysis in Queensland and used an average yield of 702 g/plant. In later work, data were presented on the yields of several cultivars in the same area [39]. ‘Festival’ produced 467 g/plant, ‘Fortuna’ produced 652 g/plant and ‘Red Rhapsody’ produced 715 g/plant. These two studies presented productivity as total yield. Marketable yield would be about 75% of total yield in this location.
4.2. Effect of Cultivar and the Time of Harvest on Fruit Quality
Cultivar and the time of harvest affected quality. The fruit were smaller in ‘Festival’ and ‘Grenada’ than in the other cultivars and all the cultivars produced smaller fruit as the season progressed. Fruit growth increases with increases in solar radiation and decreases with increases in temperature [44]. In the current study, fruit weight decreased with increases in temperature. In contrast, there was no relationship between fruit growth and radiation. Whitaker et al. [45] examined variations in fruit growth in populations of strawberry in Florida. Mean (±s.d. or standard deviation) fruit weight was 20.2 ± 4.3 g at Balm and 21.8 ± 5.1 g at Dover. In related work, Mathey et al. [46] investigated the performance of genotypes in California, Michigan, New Hampshire and Oregon. Fruit weight pooled over the cultivars ranged from 4.3 to 15.2 g across the four locations.
Weather affects SSC and TA, which are higher under low temperatures and high radiation [15,44]. There was a strong negative linear relationship between SSC and the temperature in the eight days before the fruit were harvested. There was no relationship between SSC and radiation or between TA and the two environmental variables.
Cervantes et al. [25] investigated the changes in fruit quality in five cultivars in Spain. The average SSC ranged from 6.9% to 8.3%, while the average TA ranged from 0.65% to 0.79%. Hopf et al. [15] collected data on fruit quality for ‘Fortuna’ (‘Florida Radiance’) and ‘Florida Brilliance’ in Florida. They found that SSC ranged from 5.4% to 8.4%, with a mean of 6.7%. Fruit TA ranged from 0.63% to 0.80%, with a mean of 0.71%. There were strong correlations between SSC and TA, and the temperature during fruit development (p < 0.001, r = −0.94; p < 0.001, r = −0.77). Crespo et al. [47] indicated that total sugar content (33.7 to 52.0 mg/g fresh weight) and total acidity (4.8 to 8.4 mg/g fresh weight) varied across four cultivars and two sites at 480 and 1060 m above sea level in Switzerland.
4.3. The Stability of Fruit Quality
The stability of fruit quality varied with the cultivar and the specific trait. All the cultivars had a stability index for fruit weight close to one, suggesting that they had average stability. In contrast, the stability of SSC was lower than one or higher than one (more or less stable than average). The stability of TA was lower than one for some cultivars (more stable than average). Overall, cultivars with high mean and stable values of fruit quality are preferred over those with high mean but unstable values [12].
In the current experiment, ‘Fronteras’ and ‘Petaluma’ had large fruit and average stability for fruit weight (1.10 or 1.27). ‘Festival’ had high SSC and high stability for SSC (0.53). ‘Festival’, ‘Red Rhapsody’ and ‘Grenada’ had high TA and average stability for TA (1.16, 1.33 or 1.29). None of the cultivars had both high quality and stable values of quality for all the three traits (Table 3, Table 4 and Table 5). Chandler et al. [37] provided information on the quality of ‘Festival’ over three seasons in Florida. The average fruit weight was 17.6 g in 1997, 15.9 g in 1998, and 18.0 g in 1999, indicating variation across seasons. In a later study over two seasons in the same area, Chandler et al. [38] found that fruit weight ranged from 18.5 to 20.6 g in ‘Festival’ and from 21.2 to 22.4 g in ‘Fortuna, suggesting greater stability in the latter cultivar.
The flavour of strawberry is a complex mixture of various attributes, including sweetness, acidity and aroma [48,49,50,51]. Guan et al. [52] indicated that First Grade fruit in the United States must have an SSC of at least 7%. In the present study, the cultivars varied in the number of occasions when they failed to meet this standard. ‘Festival’ and ‘Fortuna’ passed on all harvests, ‘Red Rhapsody’ and ‘Petaluma’ passed on eight or nine harvests, while the other two cultivars passed on six or seven harvests.
In Queensland, ‘Festival’ had a higher SSC than the other cultivars, but smaller fruit. ‘Festival’ would be an acceptable parent in a breeding programme used to increase fruit SSC. In contrast, the other cultivars would be acceptable parents to increase fruit size.
5. Conclusions
The quality of the strawberries varied with the cultivar and the time of harvest in Queensland. ‘Festival’ and ‘Grenada’ had smaller fruit. ‘Fronteras’, ‘Grenada’ and ‘Petaluma’ had lower SSC and ‘Fortuna’ and ‘Fronteras’ had lower TA. The cultivars had a stability index close to one for fruit weight, suggesting that they responded similarly to changes in the weather. Some cultivars had a stability index for SSC or TA lower than one or higher than one, suggesting that they were more stable or less stable than average. Both fruit weight and SCC decreased with increasing temperatures. None of the cultivars had high values of fruit quality and stable values of fruit quality for all the three traits. ‘Festival’ had a higher SSC than the other cultivars, but smaller fruit. ‘Festival’ would be an acceptable parent in a breeding programme used to increase fruit SSC. In contrast, the other cultivars would be acceptable parents to increase fruit size. Efforts need to be made to develop cultivars with high mean and stable values of quality suitable for production under global warming.
Supplementary Materials
The following supporting information can be downloaded at: https://www.mdpi.com/article/10.3390/horticulturae9030296/s1, Figure S1: Regression analysis used to estimate the stability of fruit weight in six strawberry cultivars in Queensland; Figure S2: Regression analysis used to estimate the stability of fruit soluble solids content (SSC) in six strawberry cultivars in Queensland; Figure S3: Regression analysis used to estimate the stability of fruit titratable acidity (TA) in six strawberry cultivars in Queensland.
Funding
The Queensland Government funded this research through the Department of Agriculture and Fisheries. The research received funds from the Florida Strawberry Growers’ Association (FSGA) to support the project “Strawberry Production in Queensland and Florida under a Warming Climate”.
Data Availability Statement
The data presented in this study are available on request from the author.
Acknowledgments
Many thanks to Gary Hopewell, Jodi Hufer and Anton Zbonak (DAF) and to Tiffany Dale and Kenneth Parker (FSGA). Special thanks to Pat Abbott and Zalee Bates from the DAF library for supplying much of the literature.
Conflicts of Interest
The author declares no conflict of interest.
References
- Husaini, A.M.; Zaki, F.A. Strawberries: A General Account. In Strawberry: Growth, Development and Diseases; Husaini, A.M., Neri, D., Eds.; CABI: Wallingford, UK, 2016; pp. 1–9. [Google Scholar]
- Hancock, J.F. Strawberries; CABI: Wallingford, UK, 2020; p. 237. [Google Scholar]
- Scott, S.; Rye, J.F. Praised, prized, yet penalised: A critical examination of low-wage hiring queues in the global strawberry industry. J. Rural Stud. 2021, 89, 473–481. [Google Scholar] [CrossRef]
- Yuan, B.-Z.; Sun, J. Bibliometric analysis of strawberry (Fragaria × ananassa Duch.) research publications from horticulture category based on web of science. J. Berry Res. 2021, 11, 721–738. [Google Scholar] [CrossRef]
- Hummer, K.E.; Bassil, N.V.; Zurn, J.D.; Amyotte, B. Phenotypic characterization of a strawberry (Fragaria ×ananassa Duchesne ex Rosier) diversity collection. Plants People Planet 2022. [Google Scholar] [CrossRef]
- Sonsteby, A.; Sadojevic, M.; Heide, O.M. Production methods for high yielding plants of everbearing strawberry in the Nordic climate. Horticulturae 2022, 8, 249. [Google Scholar] [CrossRef]
- Brym, M.; Fu, Y.; Frade, N.; Baldwin, E.; Chambers, A.H. Strawberry cultivar trials for yield and fruit quality in subtropical southern Florida. HortTechnology 2022, 32, 388–390. [Google Scholar] [CrossRef]
- Saridaş, M.A. Seasonal variation of strawberry fruit quality in widely grown cultivars under Mediterranean climate condition. J. Food Compos. Anal. 2021, 97, 103733. [Google Scholar] [CrossRef]
- Di Vittori, L.; Mazzoni, L.; Battino, M.; Mezzetti, B. Pre-harvest factors influencing the quality of berries. Sci. Hortic. 2018, 233, 310–322. [Google Scholar] [CrossRef]
- Dong, W.; Lu, Y.; Yang, T.; Trouth, F.; Lewers, K.S.; Daughtry, C.S.T.; Cheng, Z.-M. Effect of genotype and plastic film type on strawberry fruit quality and post-harvest shelf life. Int. J. Fruit Sci. 2020, 20, 750–767. [Google Scholar] [CrossRef]
- Le Mière, P.; Hadley, P.; Darby, J.; Battey, N.H. The effect of thermal environment, planting date and crown size on growth, development and yield of Fragaria × ananassa Duch. cv. Elsanta. J. Hortic. Sci. Biotechnol. 1998, 73, 786–795. [Google Scholar] [CrossRef]
- MacKenzie, S.J.; Chandler, C.K.; Hasing, T.; Whitaker, V.M. The role of temperature in the late-season decline in soluble solids content of strawberry fruit in a subtropical production system. HortScience 2011, 46, 1562–1566. [Google Scholar] [CrossRef]
- Pyrotis, S.; Abayomi, L.; Rees, D.; Orchard, J. Effect of temperature and humidity on strawberry firmness at two different sites in the Huelva region of Spain. Acta Hortic. 2012, 926, 567–570. [Google Scholar] [CrossRef]
- Ariza, M.T.; Miranda, L.; Gómez-Mora, J.A.; Medina, J.J.; Lozano, D.; Gavilán, P.; Soria, C.; Martínez-Ferri, E. Yield and fruit quality of strawberry cultivars under different irrigation regimes. Agronomy 2021, 11, 261. [Google Scholar] [CrossRef]
- Hopf, A.; Boote, K.J.; Plotto, A.; Asseng, S.; Zhao, X.; Shelia, V.; Hoogenboom, G. Dynamic prediction of preharvest strawberry quality traits as a function of environmental factors. HortScience 2022, 57, 1336–1355. [Google Scholar] [CrossRef]
- Hasing, T.N.; Osorio, L.F.; Whitaker, V.M. Within-season stability of strawberry soluble solids content. J. Am. Soc. Hortic. Sci. 2013, 138, 190–197. [Google Scholar] [CrossRef] [Green Version]
- Gooding, H.J.; Jennings, D.L.; Topham, P.B. A genotype-environment experiment on strawberries in Scotland. Heredity 1975, 34, 105–115. [Google Scholar] [CrossRef] [Green Version]
- Chandler, C.K.; Stoffella, P.J.; Albregts, E.E.; Howard, C.M. Stability of strawberry genotypes in annual hill cultural system. HortScience 1991, 26, 1409–1411. [Google Scholar] [CrossRef] [Green Version]
- Sone, K.; Mochizuki, T.; Noguchi, Y. Variations in ascorbic acid content among strawberry cultivars and their harvest times. J. Jpn. Soc. Hortic. Sci. 1999, 68, 1007–1014. [Google Scholar] [CrossRef]
- Sone, K.; Mochizuki, T.; Noguchi, Y. Relationship between stability of eating quality of strawberry cultivars and their sugar and organic acid content. J. Jpn. Soc. Hortic. Sci. 2000, 69, 736–743. [Google Scholar] [CrossRef]
- Pelayo-Zaldívar, C.; Ebeler, S.E.; Kader, A.A. Cultivar and harvest date effects on flavor and other quality attributes of California strawberries. J. Food Qual. 2005, 28, 78–97. [Google Scholar] [CrossRef]
- Costa, A.F.; Leal, N.R.; Ventura, J.A.; Conçalves, L.S.A.; do Amaral, A.T., Jr.; Costa, H. Adaptability and stability of strawberry cultivars using a mixed model. Acta Sci. 2015, 37, 435–440. [Google Scholar] [CrossRef] [Green Version]
- Gabriel, A.; Resende, J.T.V.; Zeist, A.R.; Resende, L.V.; Resende, N.C.V.; Galvão, A.G.; Zeist, R.A.; de Lima Filho, R.B.; Corrêa, J.V.W.; Camargo, C.K. Phenotypic stability of strawberry cultivars assessed in three environments. Genetics Mol. Res. 2018, 17, gmr18041. [Google Scholar] [CrossRef]
- Gabriel, A.; de Resende, J.T.V.; Zeist, A.R.; Resende, L.V.; Resende, N.C.V.; Zeist, R.A. Phenotypic stability of strawberry cultivars based on physiochemical traits of fruits. Hortic. Bras. 2019, 37, 75–81. [Google Scholar] [CrossRef]
- Cervantes, L.; Ariza, M.T.; Miranda, L.; Lozano, D.; Medina, J.J.; Soria, C.; Martínez-Ferri, E. Stability of fruit quality traits of different strawberry varieties under variable environmental conditions. Agronomy 2020, 10, 1242. [Google Scholar] [CrossRef]
- Mazzoni, L.; Di Vittori, L.; Balducci, F.; Forbes-Hernández, T.Y.; Giampieri, F.; Battino, M.; Mezzetti, B.; Capocasa, F. Sensorial and nutritional quality of inter and intra-specific strawberry genotypes selected in resilient conditions. Sci. Hortic. 2020, 261, 108945. [Google Scholar] [CrossRef]
- Guevara-Terán, M.; Gonzalez-Paramás, A.M.; Beltrán-Noboa, A.; Giampieri, F.; Battino, M.; Tejera, E.; Alvarez-Suarez, J.M. Influence of altitude on the physiochemical composition and antioxidant capacity of strawberry: A preliminary systematic review and meta-analysis. Phytochem. Rev. 2022. [Google Scholar] [CrossRef]
- Finlay, K.W.; Wilkinson, G.N. The analysis of adaptation in a plant-breeding programme. Aust. J. Agric. Res. 1963, 14, 742–754. [Google Scholar] [CrossRef] [Green Version]
- Eberhart, S.A.; Russell, W.A. Stability parameters for comparing varieties. Crop Sci. 1966, 6, 36–40. [Google Scholar] [CrossRef] [Green Version]
- Sullivan, J.A.; Privé, J.P. Yield stability indices of primocane-fruiting red raspberry (Rubus idaeus L.). Can. J. Plant Sci. 2001, 81, 297–301. [Google Scholar] [CrossRef]
- De Souza, M.H.; Pereira, J.D., Jr.; de Marco Steckling, S.; Mencalha, J.; dos Santos Dias, F.; do Amaral Santos de Carvalho Rocha, J.R.; Carneiro, P.C.S.; de Souza Carneiro, J.E. Adaptability and stability analyses of plants using random regression models. PLoS ONE 2020, 15, e0233200. [Google Scholar] [CrossRef]
- Reckling, M.; Ahrends, H.; Chen, T.-W.; Eugster, W.; Hadasch, S.; Knapp, S.; Laidig, F.; Lindstädter, A.; Macholdt, J.; Piepho, H.-P.; et al. Methods of yield stability analysis in long-term field experiments. A review. Agron. Sustain. Develop. 2021, 41, 27. [Google Scholar] [CrossRef]
- Smutná, P.; Mylonas, I.; Tokatlidis, I.S. The use of stability statistics to analyze genotype x environment interaction in rainfed wheat under diverse agroecosystems. Int. J. Plant Prod. 2021, 15, 261–271. [Google Scholar] [CrossRef]
- Kyratzis, A.; Pallides, A.; Katsiotis, A. Investigating stability parameters for agronomic and quality traits of durum wheat grown under Mediterranean conditions. Agronomy 2022, 12, 1774. [Google Scholar] [CrossRef]
- Pour-Aboughadareh, A.; Khalili, M.; Poczai, P.; Olivoto, T. Stability indices to deciphering the genotype-by-environment interaction (GEI) effect: An applicable review for use in plant breeding programs. Plants 2022, 11, 414. [Google Scholar] [CrossRef]
- Zaid, I.U.; Zahra, N.; Habib, M.; Naeem, M.K.; Asghar, U.; Uzair, M.; Latif, A.; Rehman, A.; Ali, G.M.; Khan, M.R. Estimation of genetic variance and stability components of yield-related traits of green super rice at multi-environmental conditions in Pakistan. Agronomy 2022, 12, 1157. [Google Scholar] [CrossRef]
- Chandler, C.K.; Legard, D.E.; Dunigan, D.D.; Crocker, T.E.; Sims, C.A. ‘Strawberry Festival’ strawberry. HortScience 2000, 35, 1366–1367. [Google Scholar] [CrossRef] [Green Version]
- Chandler, C.K.; Santos, B.M.; Peres, N.A.; Jouquand, C.; Plotto, A.; Sims, C.A. ‘Florida Radiance’ strawberry. HortScience 2009, 44, 1769–1770. [Google Scholar] [CrossRef] [Green Version]
- Herrington, M.; Neal, J.; Woolcock, L.; Paynter, M.; Gomez, A.; De Faveri, J. ‘Red Rhapsody’ strawberry. HortScience 2019, 54, 1641–1643. [Google Scholar] [CrossRef] [Green Version]
- Samtani, J.B.; Rom, C.R.; Friedrich, H.; Fennimore, S.A.; Finn, C.E.; Petran, A.; Wallace, R.W.; Pritts, M.P.; Fernandez, G.; Chase, C.A.; et al. The status and future of the strawberry industry in the United States. HortTechnology 2019, 29, 11–24. [Google Scholar] [CrossRef] [Green Version]
- Kallio, H.; Hakala, M.; Pelkkikangas, A.; Lapveteläinen, A. Sugars and acids of strawberry varieties. Eur. Food Res. Technol. 2000, 212, 81–85. [Google Scholar] [CrossRef]
- Menzel, C.M. Higher temperatures decrease fruit size in strawberry growing in the subtropics. Horticulturae 2021, 7, 34. [Google Scholar] [CrossRef]
- Herrington, M.E.; Hardner, C.; Wegener, M.; Woolcock, L.; Dieters, M.J. Estimating an aggregate economic genotype to facilitate breeding and selection of strawberry genotypes in southeast Queensland. J. Amer. Soc. Hortic. Sci. 2014, 139, 253–260. [Google Scholar] [CrossRef] [Green Version]
- Agüero, J.J.; Salazar, S.M.; Kirschbaum, D.S.; Jerez, E.F. Factors affecting fruit quality in strawberries grown in a subtropical environment. Int. J. Fruit Sci. 2015, 15, 223–234. [Google Scholar] [CrossRef]
- Whitaker, V.M.; Osorio, L.F.; Hasing, T.; Gezan, S. Estimation of genetic parameters for 12 fruit and vegetative traits in the University of Florida strawberry breeding population. J. Amer. Soc. Hortic. Sci. 2012, 137, 316–324. [Google Scholar] [CrossRef] [Green Version]
- Mathey, M.M.; Mookerjee, S.; Mahoney, L.L.; Gündüz, K.; Rosyara, U.; Hancock, J.F.; Stewart, P.J.; Whitaker, V.M.; Bassil, N.V.; Davis, T.M.; et al. Genotype by environment interactions and combining ability for strawberry families grown in diverse environments. Euphytica 2017, 213, 112. [Google Scholar] [CrossRef]
- Crespo, P.; Bordonaba, J.G.; Terry, L.A.; Carlen, C. Characterisation of major taste and health-related compounds of four strawberry genotypes grown at different Swiss production sites. Food Chem. 2010, 122, 16–24. [Google Scholar] [CrossRef]
- Basson, C.E.; Groenewald, J.-H.; Kossmann, J.; Cronjé, C.; Bauer, R. Sugar and acid-related quality attributes and enzyme activities in strawberry fruits: Invertase is the main sucrose hydrolysing enzyme. Food Chem. 2010, 121, 1156–1162. [Google Scholar] [CrossRef]
- Sheng, L.; Ni, Y.; Wang, J.; Chen, Y.; Gao, H. Characteristic-aroma-component-based evaluation and classification of strawberry varieties by aroma type. Molecules 2021, 26, 6219. [Google Scholar] [CrossRef]
- Rey-Serra, P.; Mnejja, M.; Monfort, A. Inheritance of esters and other volatile compounds responsible for the fruity aroma in strawberry. Front. Plant Sci. 2022, 13, 959155. [Google Scholar] [CrossRef]
- Topcu, H.; Degirmenci, I.; Sonmez, D.A.; Paizila, A.; Karci, H.; Kafkas, S.; Kafkas, E.; Ercisli, S.; Alatawi, A. Sugar, invertase enzyme activities and invertase gene expression in different developmental stages of strawberry fruits. Plants 2022, 11, 509. [Google Scholar] [CrossRef]
- Guan, W.; Haseman, D.; Ingwell, L.; Egel, D.S. Strawberry cultivar evaluation for fall-planted high tunnel system. HortTechnology 2022, 32, 542–551. [Google Scholar] [CrossRef]
Figure 1.
Relationship between fruit weight and daily mean temperature in strawberry in Queensland. The temperature data were averaged over the seven weeks before the fruit were harvested. Data are the means (±s.e. or standard error) of six cultivars. Fruit weight (g) = Intercept − 1.35 × Temperature (p = 0.018, R2 = 0.39, n = 12).

Figure 2.
Relationship between fruit soluble solids content (SSC) and daily mean temperature in strawberry in Queensland. The temperature data were averaged over the eight days before the fruit were harvested. Data are the means (±s.e. or standard error) of six cultivars. SSC (%) = Intercept − 0.31 × Temperature (p < 0.001, R2 = 0.87, n = 12).


Table 1.
Daily temperatures and solar radiation and total monthly rainfall at Nambour in 2022. Long-term average temperatures (1965 to 1990), radiation (2004 to 2019) and rainfall (2007 to 2019) are also presented.
Table 1.
Daily temperatures and solar radiation and total monthly rainfall at Nambour in 2022. Long-term average temperatures (1965 to 1990), radiation (2004 to 2019) and rainfall (2007 to 2019) are also presented.
| Period | April | May | June | July | August | September | October |
|---|---|---|---|---|---|---|---|
| 2022 | |||||||
| Mean daily maximum temperature (°C) | 25.9 | 25.8 | 21.7 | 19.9 | 21.7 | 24.0 | 24.5 |
| Mean daily minimum temperature (°C) | 17.6 | 17.3 | 10.1 | 10.3 | 10.0 | 13.4 | 16.0 |
| Mean daily solar radiation (MJ/m2) | 15.6 | 10.4 | 13.4 | 12.0 | 14.8 | 16.8 | 16.8 |
| Total monthly rainfall (mm) | 124 | 586 | 12 | 238 | 28 | 120 | 171 |
| Long-term average | |||||||
| Mean daily maximum temperature (°C) | 26.1 | 23.5 | 21.3 | 20.8 | 22.3 | 24.6 | 26.5 |
| Mean daily minimum temperature (°C) | 15.0 | 11.7 | 8.5 | 7.0 | 7.4 | 9.8 | 13.2 |
| Mean daily solar radiation (MJ/m2) | 16.2 | 13.7 | 11.7 | 13.1 | 16.1 | 18.9 | 20.9 |
| Total monthly rainfall (mm) | 160 | 109 | 110 | 57 | 45 | 48 | 128 |
Table 2.
Variations in marketable yield, and average seasonal fruit weight, fruit soluble solids content (SSC) and fruit titratable acidity (TA) in six strawberry cultivars in Queensland. Data are the means (±s.e. or standard error) of six replicates per cultivar. Means in a column followed by a common letter were not significantly different by the Fisher’s least significant test at a 5% level of significance.
| Cultivar | Marketable Yield (g/plant) | Fruit Weight (g) | Soluble Solids Content (%) | Titratable Acidity (%) |
|---|---|---|---|---|
| Festival | 379 ± 8 a | 21.3 ± 0.2 a | 8.3 ± 0.1 d | 0.66 ± 0.02 bc |
| Fortuna | 363 ± 14 a | 25.0 ± 0.4 c | 7.5 ± 0.1 c | 0.58 ± 0.003 a |
| Red Rhapsody | 352 ± 27 a | 24.7 ± 0.4 c | 7.4 ± 0.05 c | 0.67 ± 0.01 c |
| Fronteras | 416 ± 21 a | 27.6 ± 0.4 d | 7.1 ± 0.1 b | 0.55 ± 0.01 a |
| Grenada | 362 ± 20 a | 23.7 ± 0.2 b | 6.9 ± 0.1 a | 0.69 ± 0.01 c |
| Petaluma | 353 ± 8 a | 27.8 ± 0.5 d | 7.2 ± 0.1 b | 0.63 ± 0.01 b |
Table 3.
The stability of fruit weight in six strawberry cultivars in Queensland. A linear regression of fruit weight for each cultivar on the mean fruit weight of all the cultivars for each harvest was calculated to measure the adaptation of each cultivar (Figure S1). The stability index (±s.e. or standard error) is the slope from this regression.
| Cultivar | Range in Fruit Weight (g) | p Value from the Regression | R2 Value from the Regression | Stability Index (±s.e.) |
|---|---|---|---|---|
| Festival | 18.3 to 27.5 | <0.001 | 0.67 | 0.84 ± 0.17 |
| Fortuna | 22.1 to 29.7 | 0.004 | 0.54 | 0.74 ± 0.20 |
| Red Rhapsody | 20.3 to 28.7 | <0.001 | 0.74 | 0.80 ± 0.14 |
| Fronteras | 21.4 to 33.6 | <0.001 | 0.86 | 1.10 ± 0.13 |
| Grenada | 18.5 to 29.1 | <0.001 | 0.78 | 1.19 ± 0.19 |
| Petaluma | 20.4 to 36.1 | <0.001 | 0.90 | 1.27 ± 0.13 |
Table 4.
The stability of fruit soluble solids content (SSC) in six strawberry cultivars in Queensland. A linear regression of SSC for each cultivar on the mean SSC of all the cultivars for each harvest was calculated to measure the adaptation of each cultivar (Figure S2). The stability index (±s.e. or standard error) is the slope from this regression.
| Cultivar | Range in Soluble Solids Content (%) | p Value from the Regression | R2 Value from the Regression | Stability Index (±s.e.) |
|---|---|---|---|---|
| Festival | 7.5 to 9.1 | 0.011 | 0.44 | 0.53 ± 0.17 |
| Fortuna | 7.2 to 8.2 | 0.006 | 0.50 | 0.45 ± 0.13 |
| Red Rhapsody | 6.8 to 8.3 | <0.001 | 0.89 | 0.84 ± 0.09 |
| Fronteras | 5.8 to 8.4 | <0.001 | 0.91 | 1.69 ± 0.16 |
| Grenada | 5.8 to 8.5 | <0.001 | 0.89 | 1.75 ± 0.18 |
| Petaluma | 6.6 to 8.2 | <0.001 | 0.90 | 0.88 ± 0.09 |
Table 5.
The stability of fruit titratable acidity (TA) in six strawberry cultivars in Queensland. A linear regression of TA for each cultivar on the mean TA of all the cultivars for each harvest was calculated to measure the adaptation of each cultivar (Figure S3). The stability index (±s.e. or standard error) is the slope from this regression.
| Cultivar | Range in Titratable Acidity (%) | p Value from the Regression | R2 Value from the Regression | Stability Index (±s.e.) |
|---|---|---|---|---|
| Festival | 0.56 to 0.92 | <0.001 | 0.64 | 1.16 ± 0.15 |
| Fortuna | 0.53 to 0.62 | 0.037 | 0.30 | 0.33 ± 0.14 |
| Red Rhapsody | 0.52 to 0.91 | <0.001 | 0.90 | 1.33 ± 0.13 |
| Fronteras | 0.47 to 0.62 | <0.001 | 0.71 | 0.60 ± 0.11 |
| Grenada | 0.54 to 0.86 | <0.001 | 0.87 | 1.29 ± 0.15 |
| Petaluma | 0.51 to 0.80 | <0.001 | 0.78 | 1.11 ± 0.18 |
Disclaimer/Publisher’s Note: The statements, opinions and data contained in all publications are solely those of the individual author(s) and contributor(s) and not of MDPI and/or the editor(s). MDPI and/or the editor(s) disclaim responsibility for any injury to people or property resulting from any ideas, methods, instructions or products referred to in the content. |
© 2023 by the author. Licensee MDPI, Basel, Switzerland. This article is an open access article distributed under the terms and conditions of the Creative Commons Attribution (CC BY) license (https://creativecommons.org/licenses/by/4.0/).
Share and Cite
MDPI and ACS Style
Menzel, C.M. The Stability of Important Fruit Traits in Strawberry in Queensland. Horticulturae 2023, 9, 296. https://doi.org/10.3390/horticulturae9030296
AMA Style
Menzel CM. The Stability of Important Fruit Traits in Strawberry in Queensland. Horticulturae. 2023; 9(3):296. https://doi.org/10.3390/horticulturae9030296
Chicago/Turabian StyleMenzel, Christopher Michael. 2023. "The Stability of Important Fruit Traits in Strawberry in Queensland" Horticulturae 9, no. 3: 296. https://doi.org/10.3390/horticulturae9030296
Note that from the first issue of 2016, this journal uses article numbers instead of page numbers. See further details here.