
The Effects of Shading and Nutrient Management on Yield Quality of Vegetable Fern
Abstract
:1. Introduction
2. Materials and Methods
2.1. Experimental Site and Soil Characteristics
2.2. Plant Materials and Experimental Design
2.3. Data Collection and Analysis
2.3.1. Soil Chemical Properties
2.3.2. Plant Growth and Yield
2.3.3. Total Chlorophyll Content
2.3.4. Vitamin C Content
2.3.5. Nitrate Accumulation
2.4. Statistical Analysis
3. Results
3.1. Soil Chemical Properties
3.2. Plant Growth and Yield
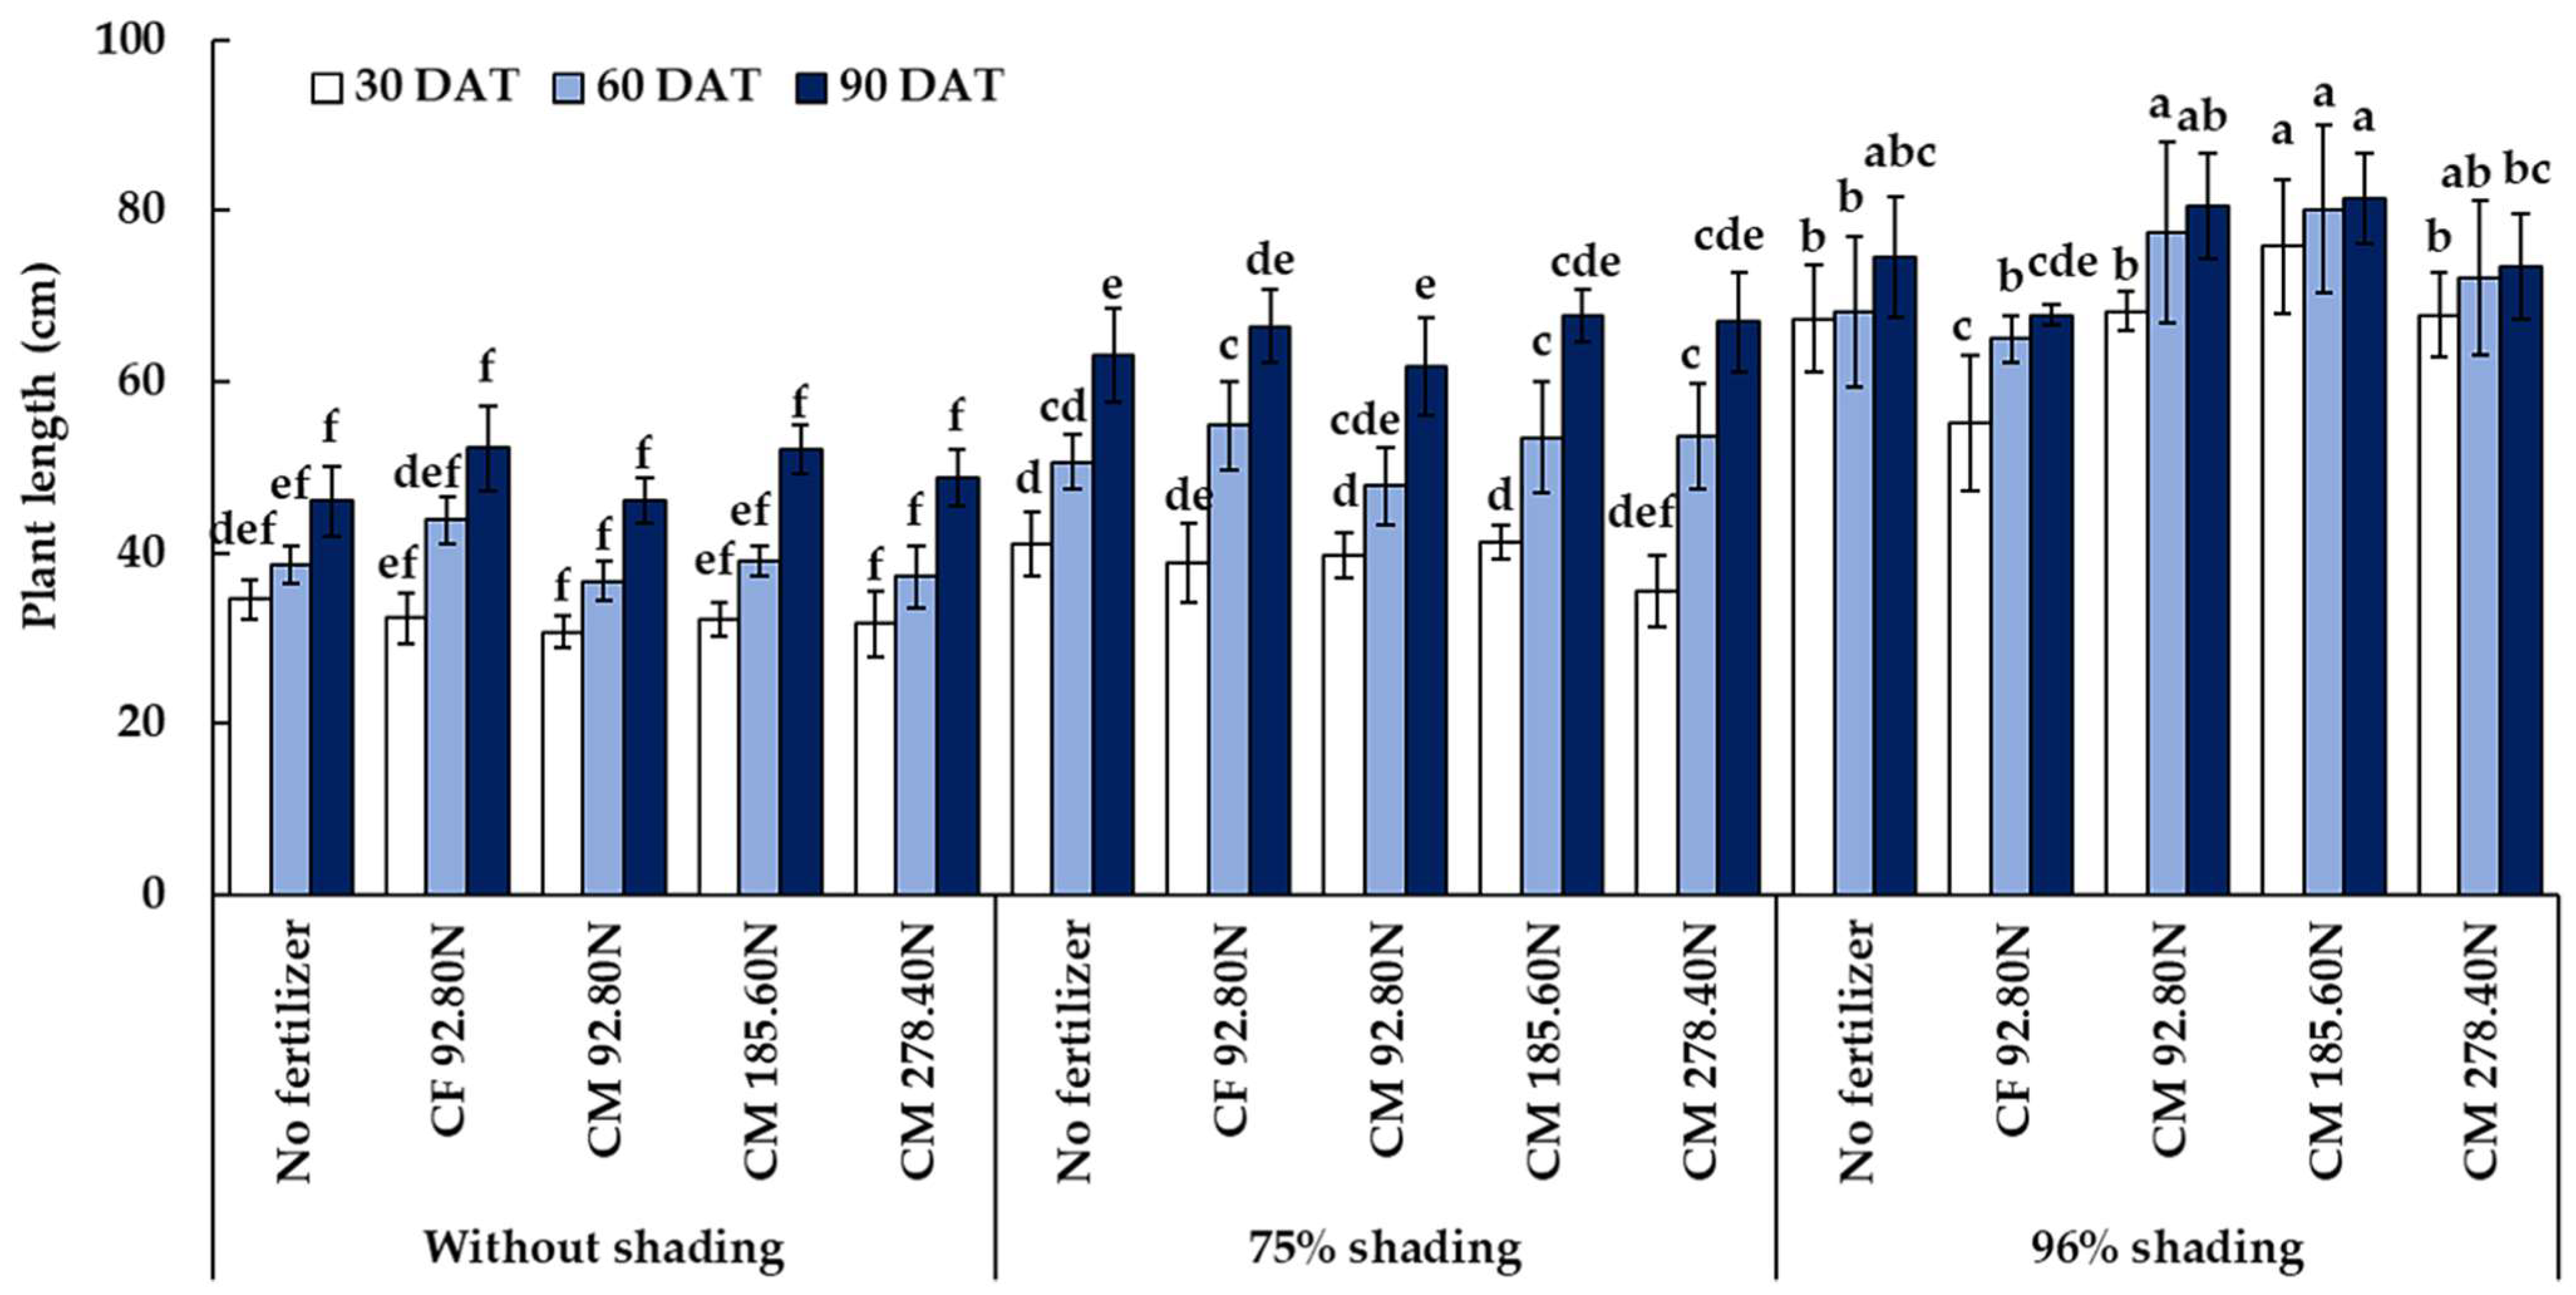
3.2.1. Plant Length
3.2.2. Plant Width
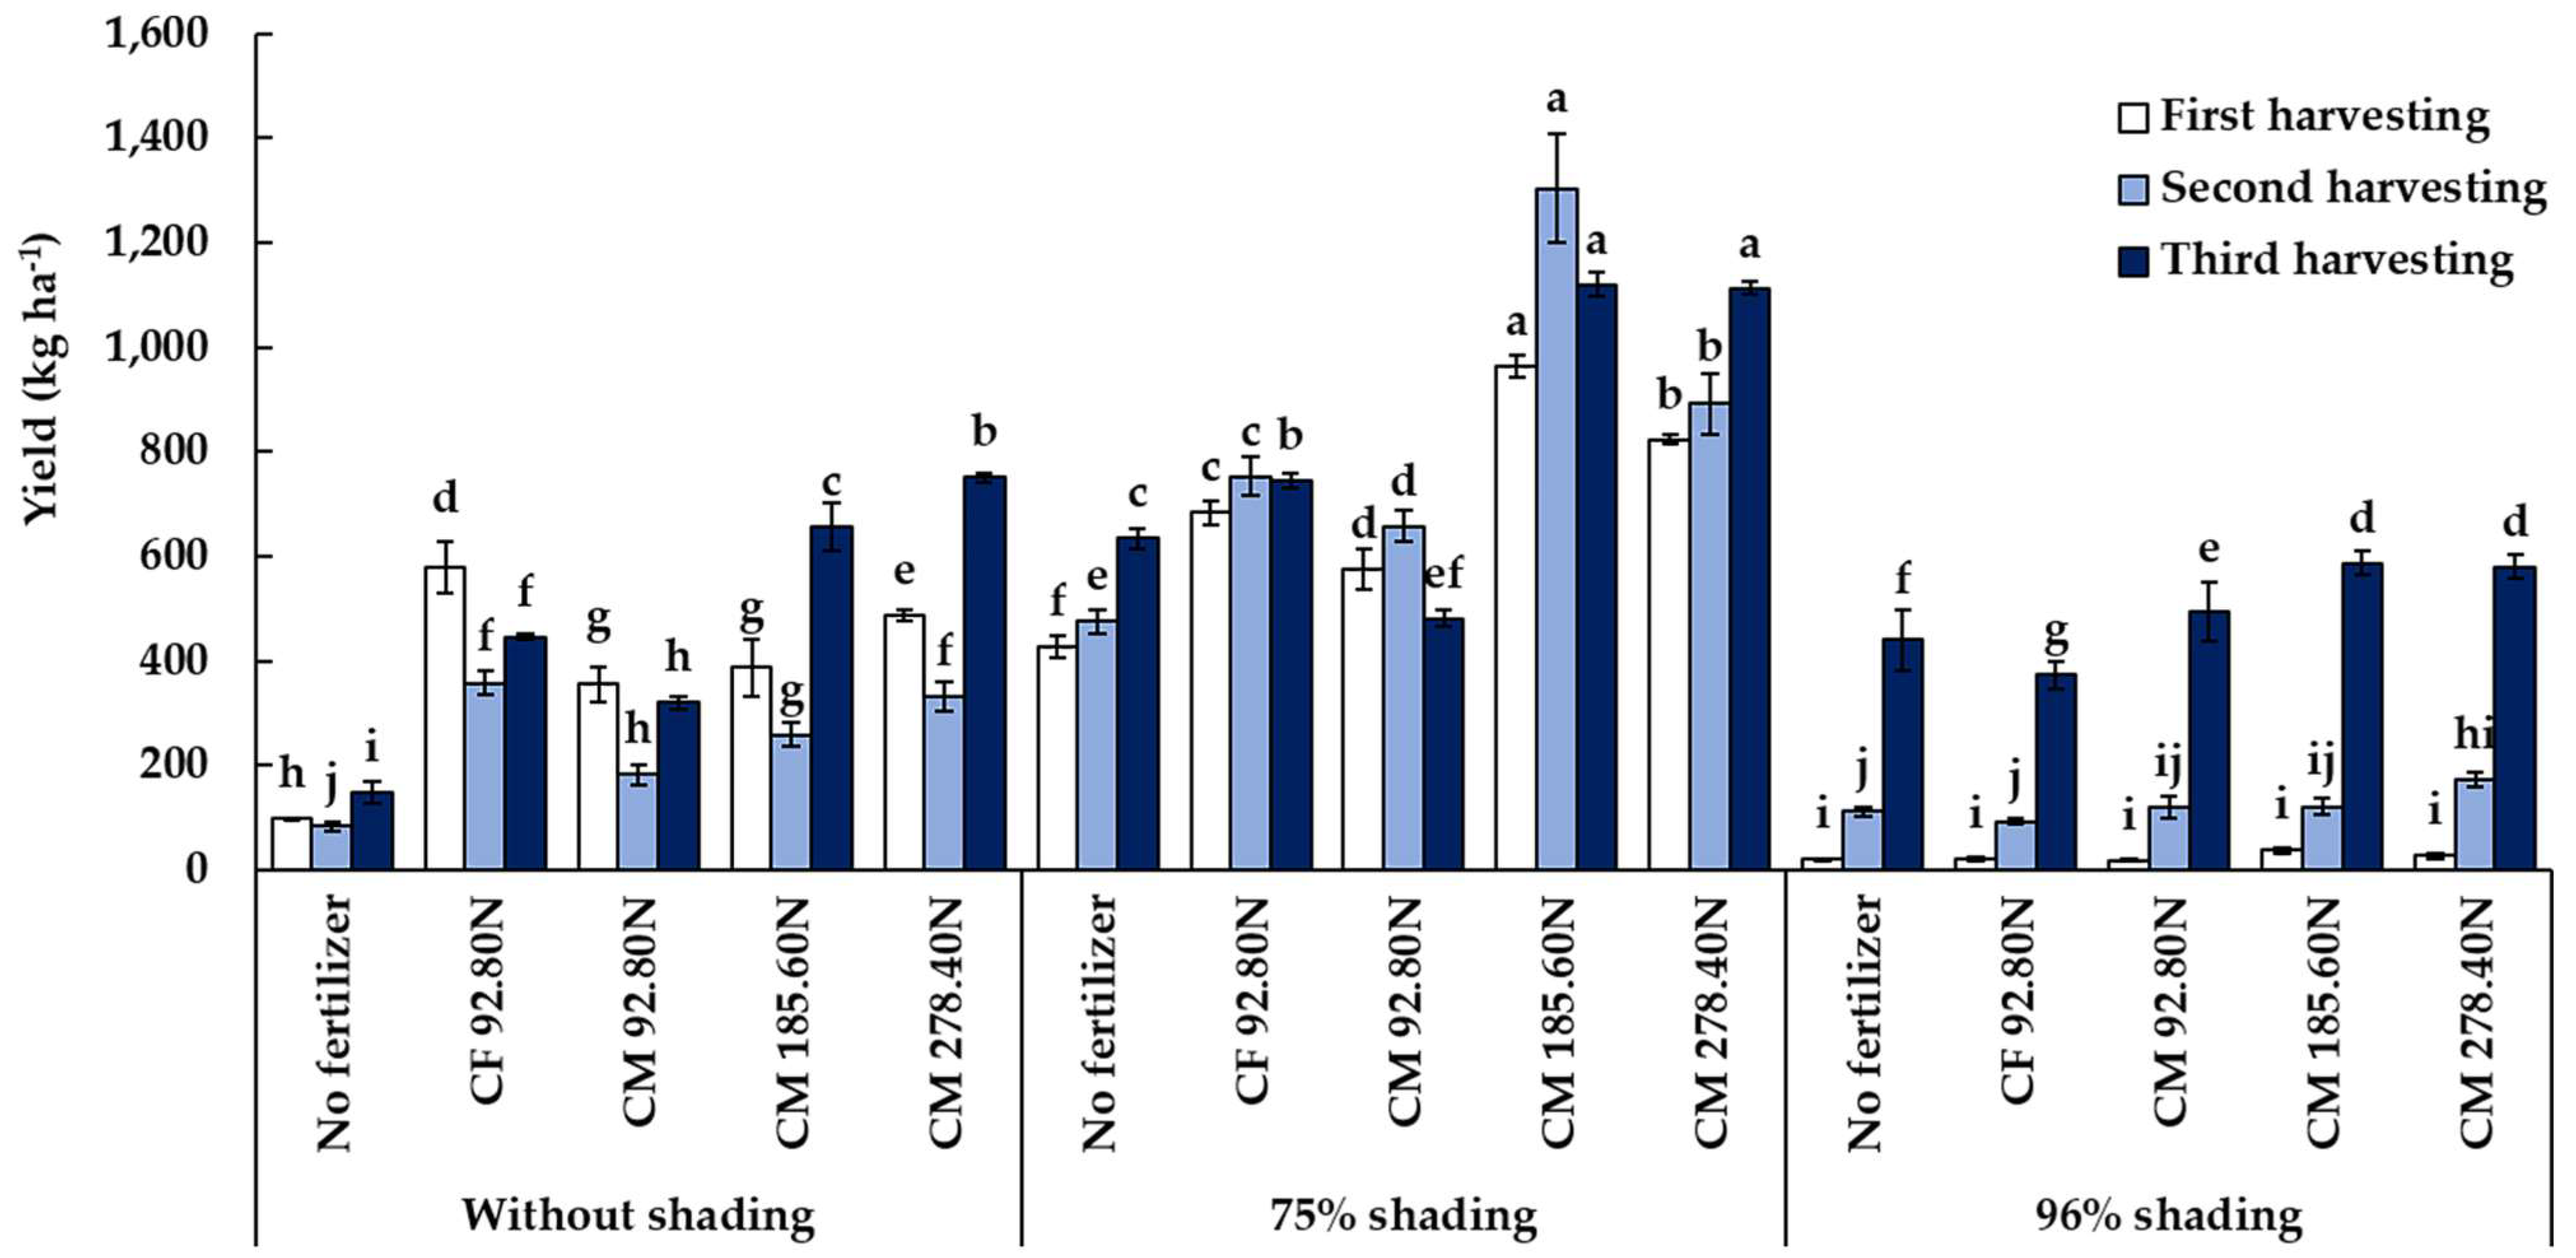
3.2.3. Total Biomass Yield
3.3. Yield of Biomass Quality
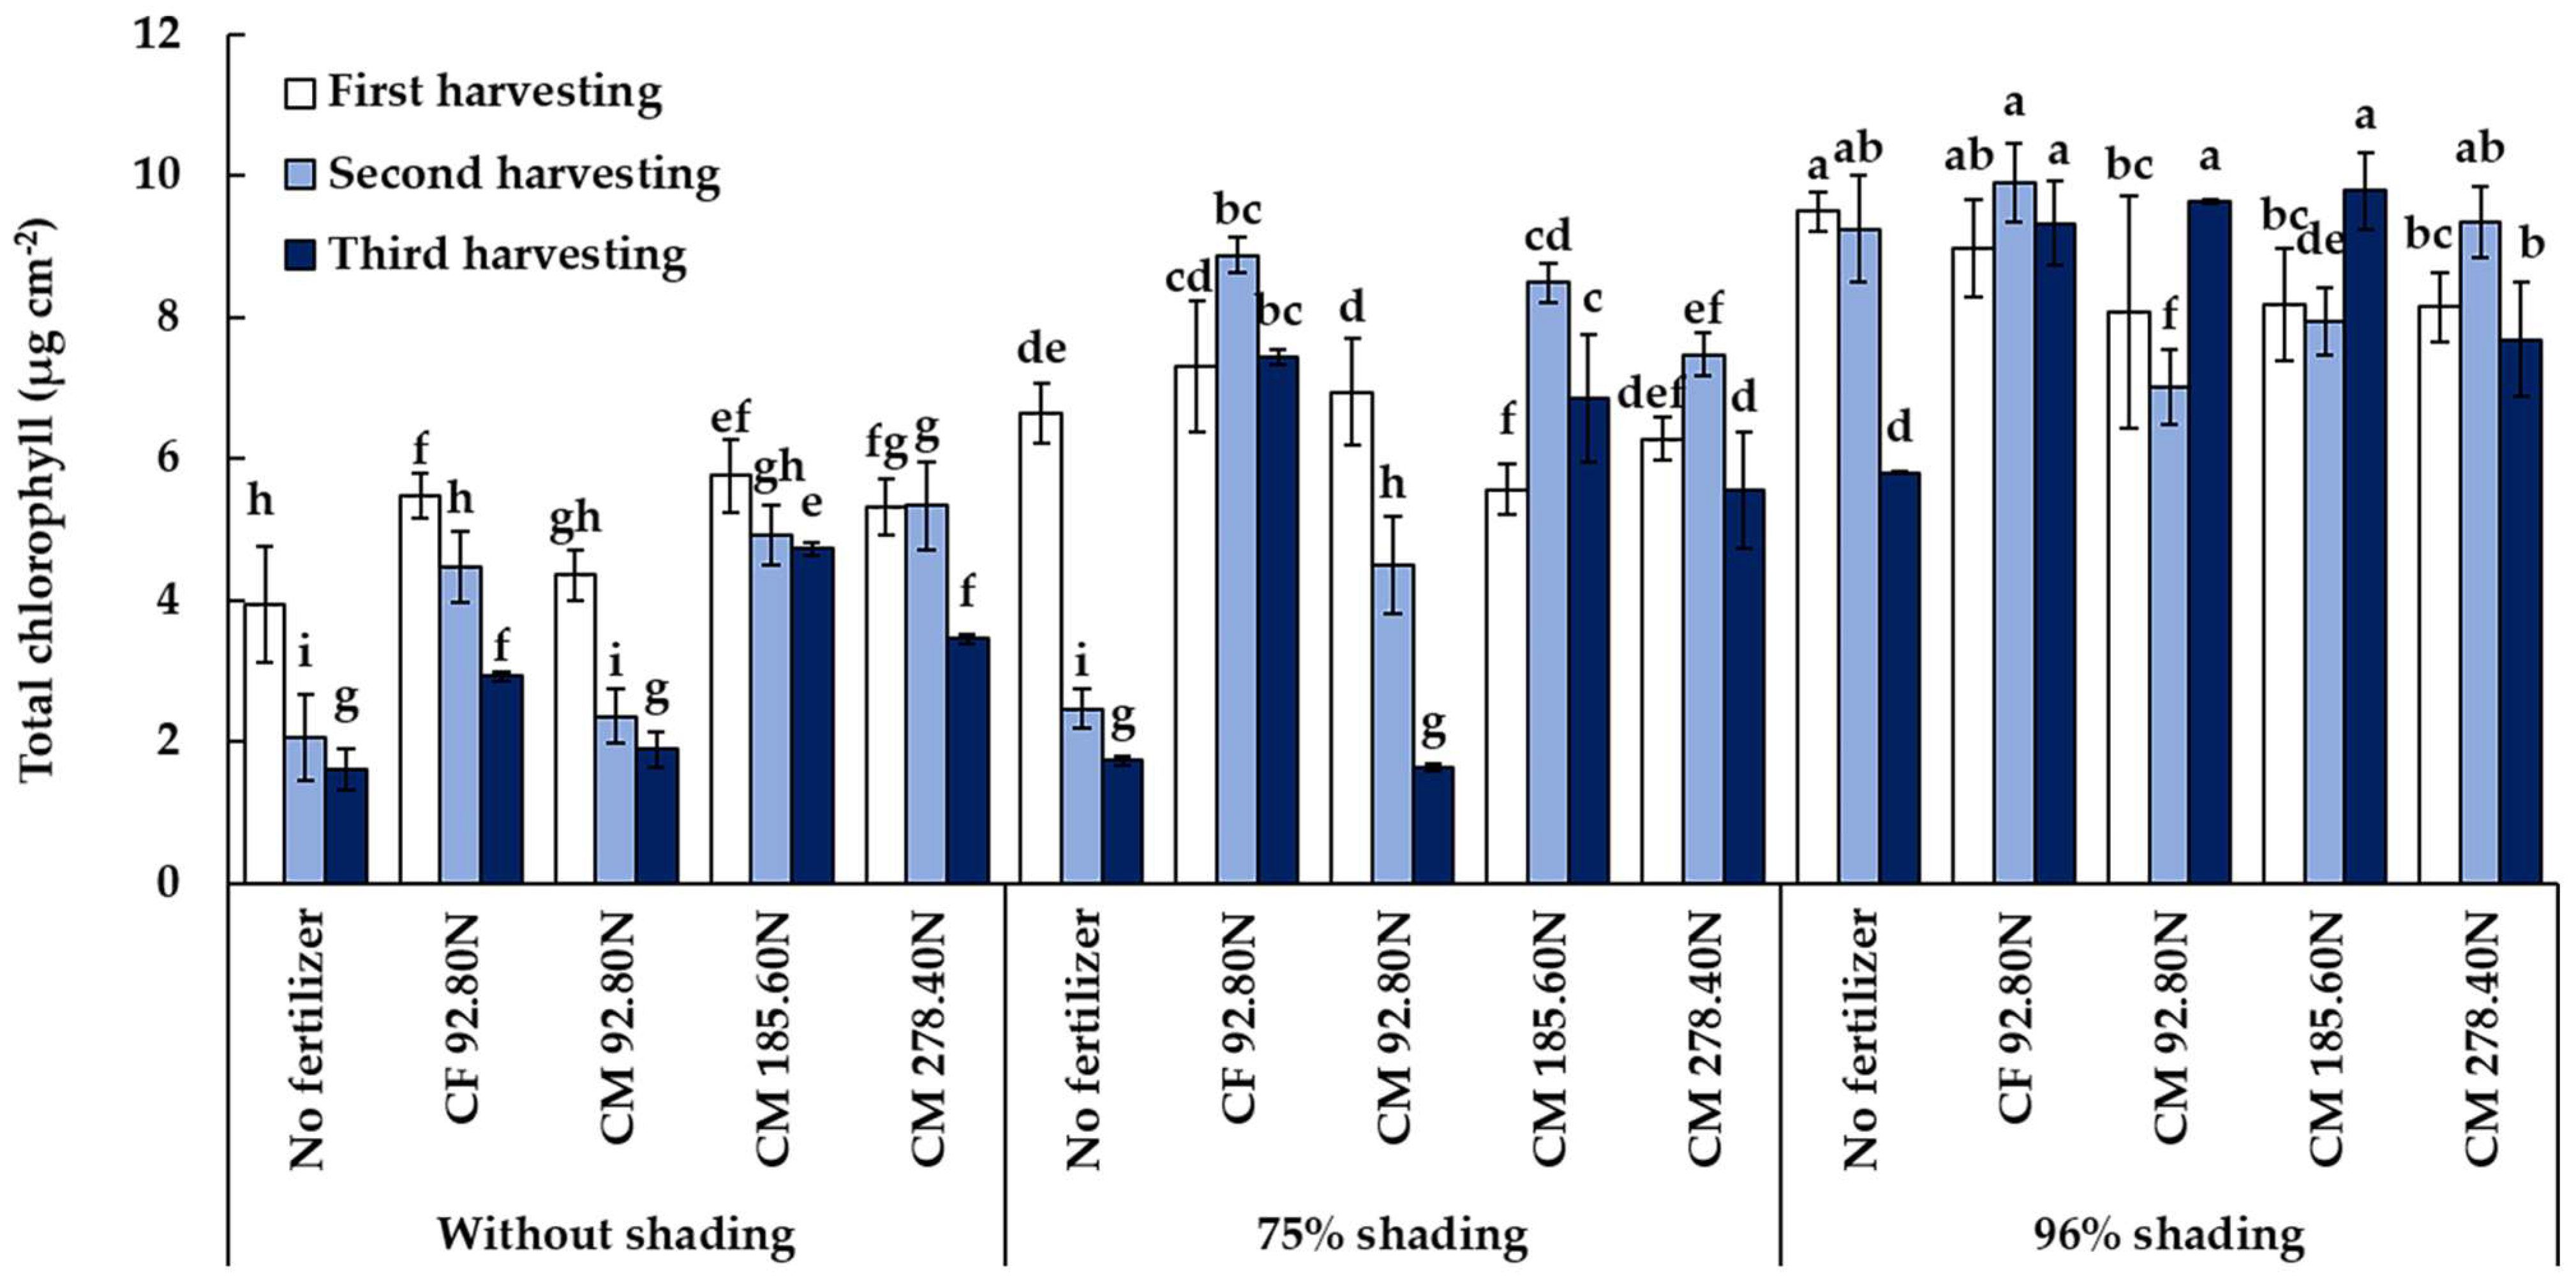
3.3.1. Total Chlorophyll Content
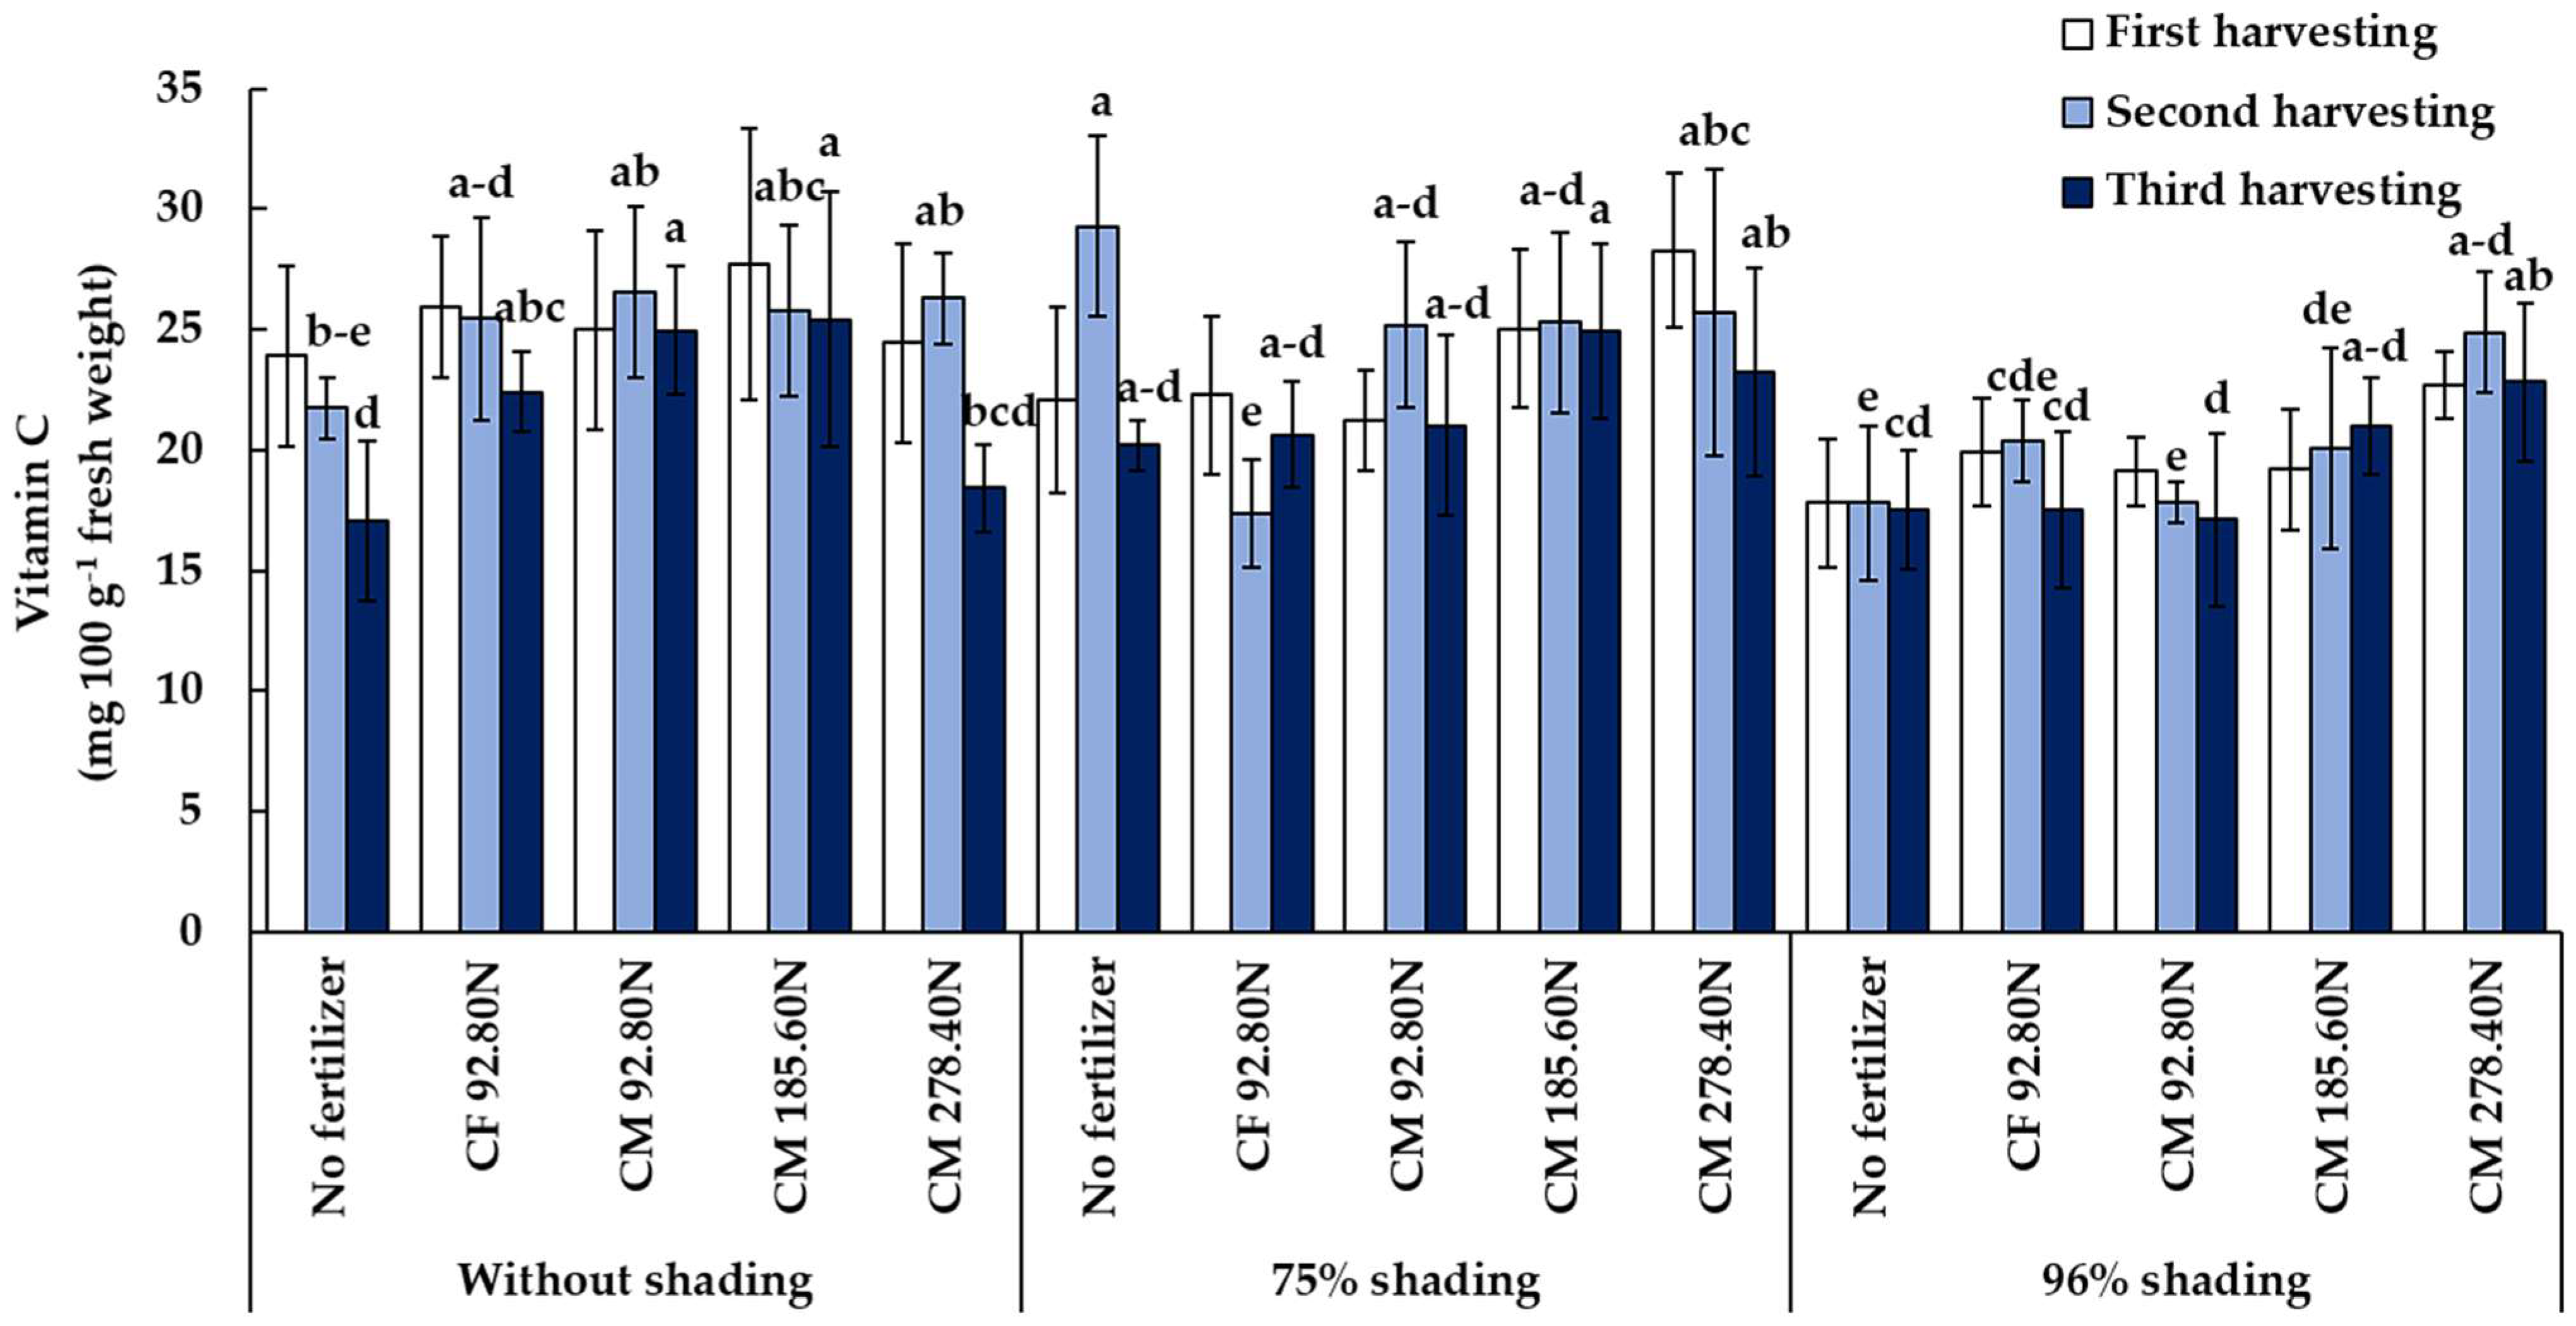
3.3.2. Vitamin C Content
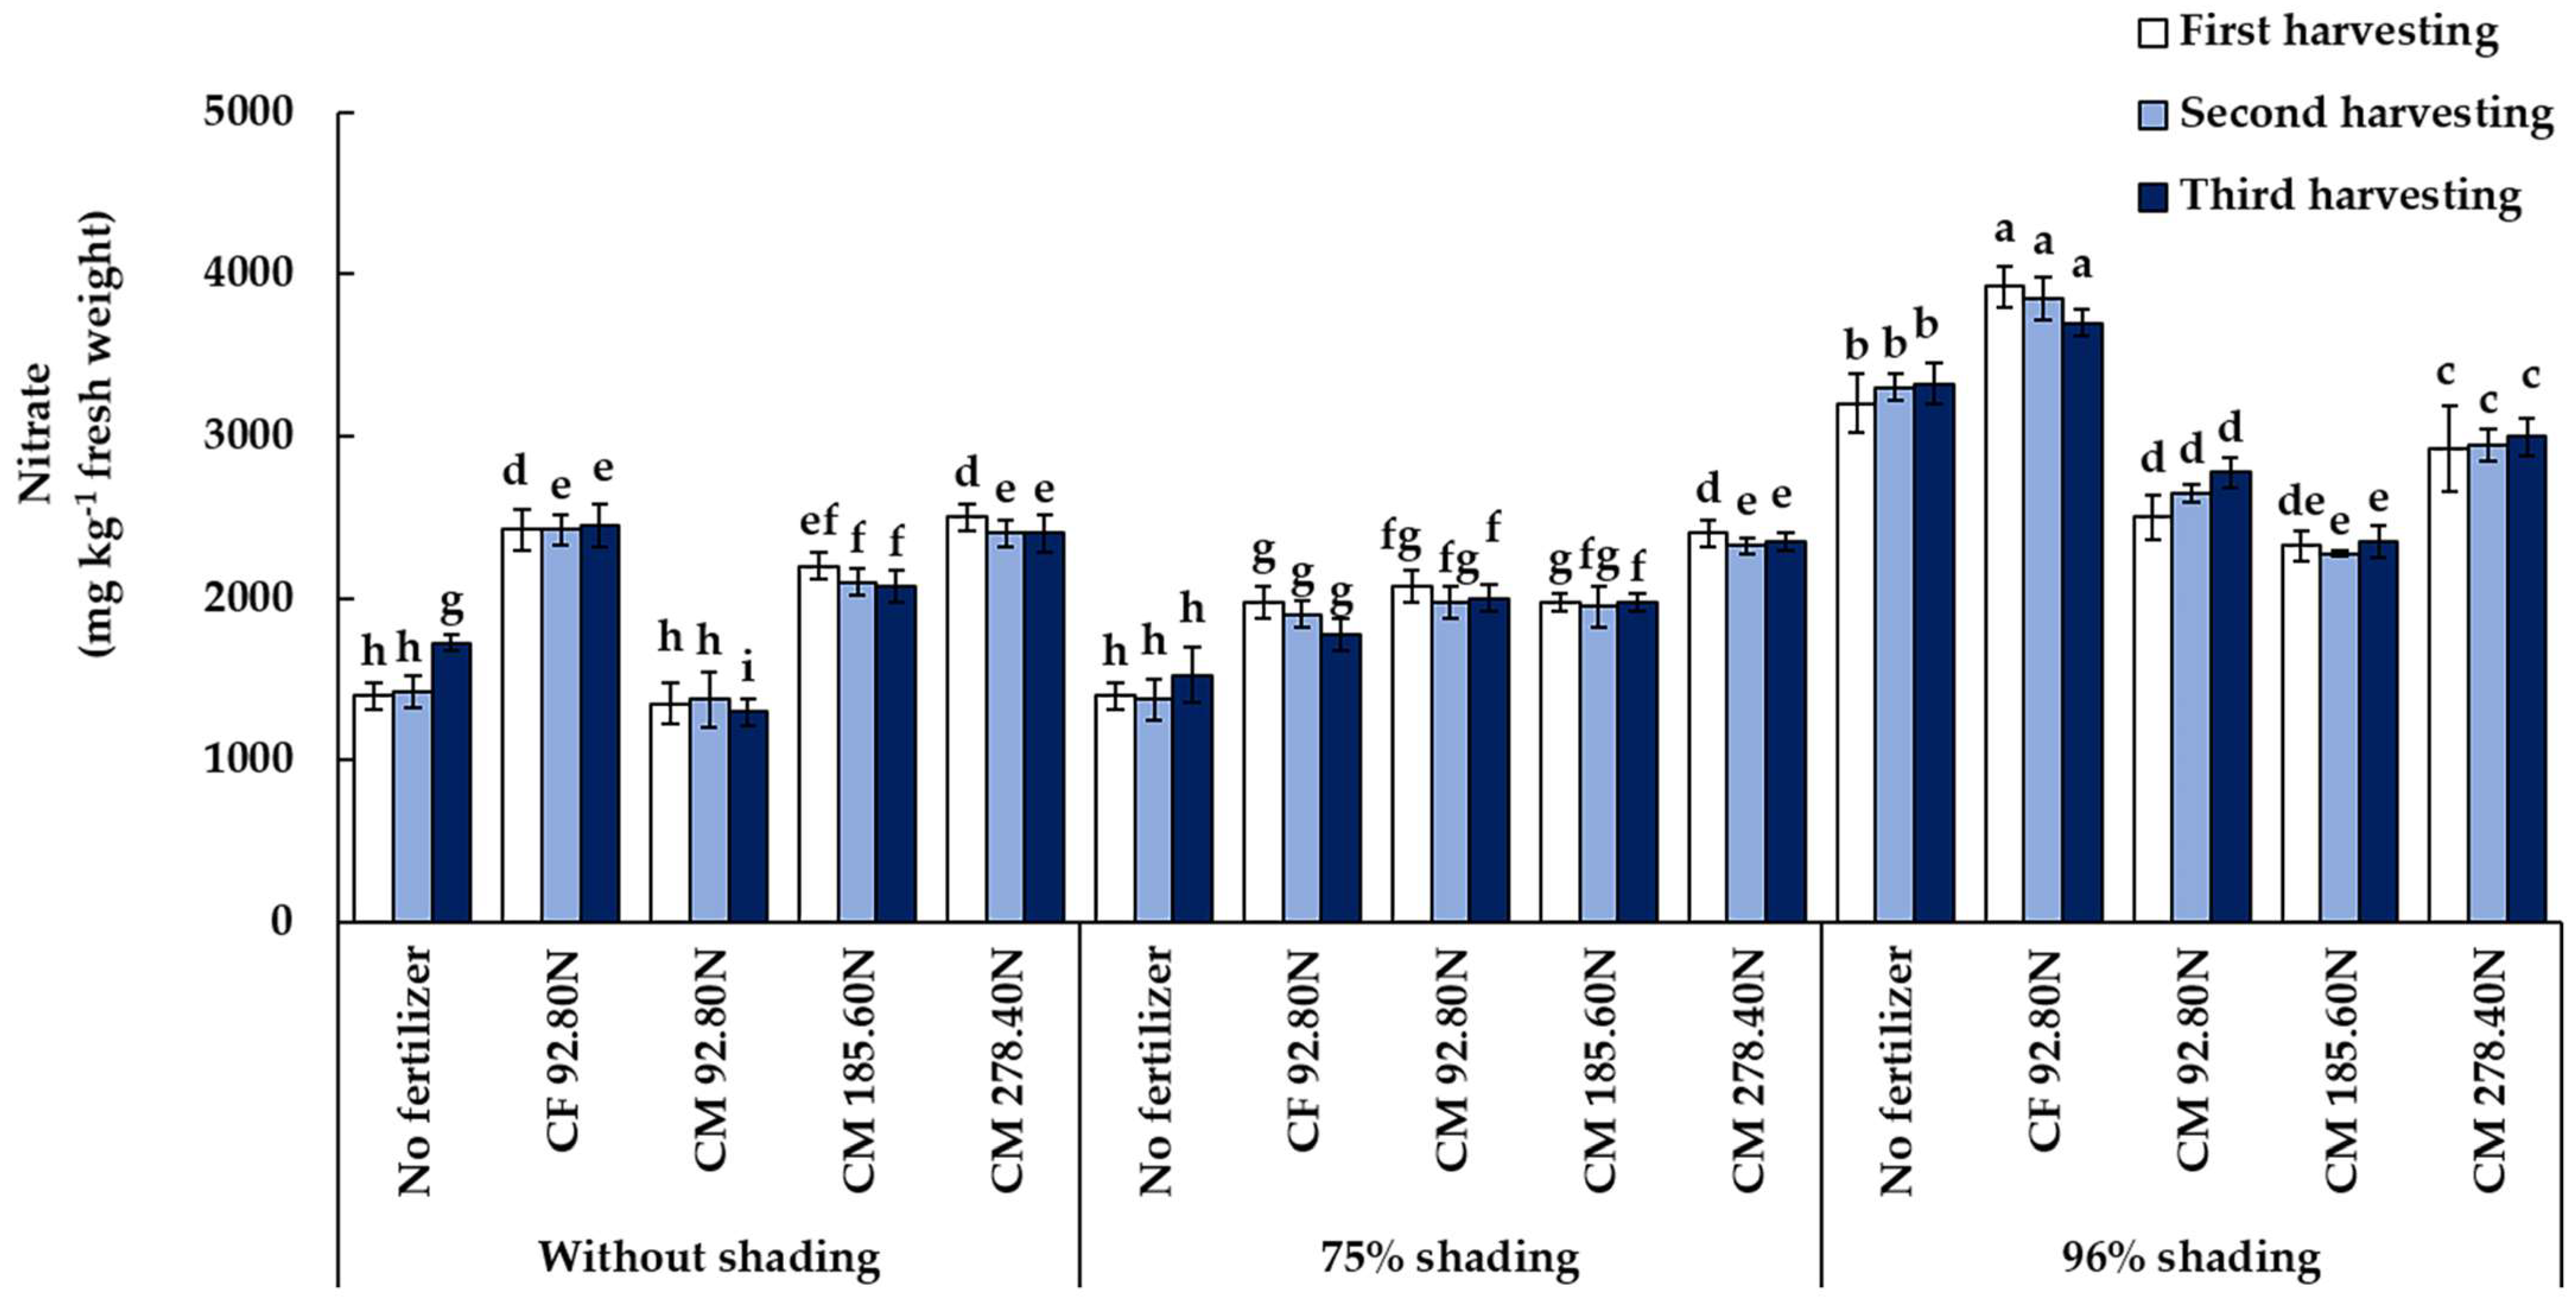
3.3.3. Nitrate Accumulation
4. Discussion
4.1. Soil Chemical Properties
4.2. Plant Growth and Yield
4.3. Yield Quality
5. Conclusions
Supplementary Materials
Author Contributions
Funding
Data Availability Statement
Acknowledgments
Conflicts of Interest
References
- Duncan, K.; Chompoothong, N.; Burnette, R. Vegetable production throughout the rainy season. ECHO Asia Notes 2012, 13, 1–14. [Google Scholar]
- Archana, G.N.; Pradeesh, S.; Chinmayee, M.D.; Mini, I.; Swapna, T.S. Diplazium esculentum: A wild nutrient-rich leafy vegetable from Western Ghats. In Prospects in Bioscience: Addressing the Issues; Sabu, A., Agustine, A., Eds.; Springer: New Delhi, India, 2012; pp. 293–301. [Google Scholar]
- Junejo, J.A.; Ghoshal, A.; Mondal, P.; Nainwal, L.; Zaman, K.; Singh, K.D.; Chakraborty, T. In-vivo toxicity evaluation and phytochemical, physiochemical analysis of Diplazium esculentum (Retz.) Sw. leaves a traditionally used North-Eastern Indian vegetable. Adv. Biores. 2015, 6, 175–181. [Google Scholar]
- Akter, S.; Hossain, M.; Ara, I.; Akhtar, P. Investigation of in vitro antioxidant, antimicrobial and cytotoxic activity of Diplazium esculentum (Retz). Sw. Int. J. Adv. Pharm. Biol. Chem. 2014, 3, 723–733. [Google Scholar]
- Amit, S.; Singh, F.M. In-vitro anthelmintic activity of Diplazium esculentum (Retz.) Swiss rhizome extract. J. Pharmacogn. Phytochem. 2012, 14, 84–87. [Google Scholar]
- Amit, S.; Sunil, K.; Bhatt, S.P.; Arvind, N. Antibacterial activity of Diplazium esculentum (retz.) Sw. Pharmacogn. J. 2011, 3, 77–79. [Google Scholar] [CrossRef]
- Chai, T.T.; Yeoh, L.Y.; Ismail, N.I.M.; Ong, H.C.; Manan, F.A.; Wong, F.C. Evaluation of glucosidase inhibitory and cytotoxic potential of five selected edible and medicinal ferns. Trop. J. Pharm. Res. 2015, 14, 449–454. [Google Scholar] [CrossRef] [Green Version]
- Buakliklay, A.; Sornjai, N.; Yeeding, A. Guidelines for Production of Vegetable Fern in Strongly Acid Sulfate Soil Areas; The Royal-Initiated Coastal Resources Rehabilitation Project Pikulthong, Office of the Royal Development Projects Board: Bangkok, Thailand, 2018; pp. 1–11. [Google Scholar]
- Duangsa, W.; Tanpanich, S.; Chindachia, R.; Kaewduang, M. The effect of planting materials on the growth and yield of vegetable fern. Songklanakarin J. Plant Sci. 2016, 3, 30–35. [Google Scholar]
- Wang, Y.; Gao, S.; He, X.; Li, Y.; Zhang, Y.; Chen, W. Response of total phenols, flavonoids, minerals, and amino acids of four edible fern species to four shading treatments. PeerJ 2020, 8, e8354. [Google Scholar] [CrossRef]
- Sirichuaychu, W.; Trisuwarn, N.; Bunpradup, S.; Pinjongsakuldit, A.; Srapet, A. Miracle of Soil: Soil Series for Economic Plant Cultivation in Thailand; Office of Soil Survey and Land Use Planning, Land Development Department, Ministry of Agriculture and Cooperatives: Bangkok, Thailand, 2005; pp. 106–107. [Google Scholar]
- Walkley, A.; Black, I.A. An examination of Degtjareff method for determining organic carbon in soils: Effect of variations in digestion conditions and of inorganic soil constituents. Soil Sci. 1934, 63, 251–263. [Google Scholar] [CrossRef]
- Burt, R. Soil Survey Laboratory Methods Manual; Soil Survey Investigations Report, No. 42, Version 4.0; Natural Resources Conservation Service Soils: Washington, DC, USA, 2004. [Google Scholar]
- Mackinney, G. Absorption of light by chlorophyll solutions. J. Biol. Chem. 1941, 140, 315–322. [Google Scholar] [CrossRef]
- Babashahi-Kouhanestani, M.; Salehi, M.; Mazloomi, S.M.; Almasi-Hashyani, A. Quantitative evaluation of vitamin C in industrial lemon juice by titration method. J. Biol. Today’s World 2014, 3, 139–141. [Google Scholar] [CrossRef]
- Youngvises, N.; Rithichai, P. Effects of shading and nitrogen fertilization on plant growth and nitrate accumulation of culantro (Eryngium foetidum L.) and design green analytical technique for nitrate analysis. Khon Kaen Agric. J. 2008, 4, 81–94. [Google Scholar]
- Cruz, P.; Sierra, J.; Wilson, J.R.; Dulormne, M.; Tournebize, R. Effects of shade on the growth and mineral nutrition of tropical grasses in silvopastoral systems. Ann. Arid Zone 1999, 38, 335–361. [Google Scholar]
- Shang, L.; Wan, L.; Zhou, X.; Li, S.; Li, X. Effects of organic fertilizer on soil nutrient status, enzyme activity, and bacterial community diversity in Leymus chinensis steppe in Inner Mongolia, China. PLoS ONE 2020, 15, e0240559. [Google Scholar] [CrossRef]
- Le, V.H.; Truong, C.T.; Le, A.H.; Nguyen, B.T. A combination of shade trees and soil characteristics may determine robusta coffee (Coffea canephora) yield in a tropical monsoon environment. Agronomy 2023, 13, 65. [Google Scholar] [CrossRef]
- Citak, S.; Sonmez, S. Effects of chemical fertilizer and different organic manures application on soil pH, EC and organic matter content. J. Food Agric. Environ. 2011, 9, 739–741. [Google Scholar]
- Wan, S.; Luo, Y. Substrate regulation of soil respiration in a tallgrass prairie: Results of a clipping and shading experiment. Glob. Biogeochem. Cycles 2003, 17, 1054. [Google Scholar] [CrossRef] [Green Version]
- Kahi, C.H.; Ngugi, R.K.; Mureithi, S.M.; Ng’ethe, J.C. The canopy effects of Prosopis juliflora (DC.) and Acacia tortilis (Hayne) trees on herbaceous plants species and soil physico-chemical properties in Njemps flats, Kenya. Trop. Subtrop. Agroecosyst. 2009, 10, 441–449. [Google Scholar]
- Handreck, K.A. Growth of ferns in soil-less media, as affected by pH, iron and calcium/magnesium ratio. Sci. Hortic. 1992, 50, 115–126. [Google Scholar] [CrossRef]
- Ambrósio, S.T.; Melo, N.F. Interaction between sucrose and pH during in vitro culture of Nephrolepis biserrata (Sw.) Schott (Pteridophyta). Acta Bot. Bras. 2004, 18, 809–813. [Google Scholar] [CrossRef] [Green Version]
- Soti, P.G.; Jayachandran, K.; Koptur, S.; Volin, J.C. Effect of soil pH on growth, nutrient uptake, and mycorrhizal colonization in exotic invasive Lygodium microphyllum. Plant Ecol. 2015, 216, 989–998. [Google Scholar] [CrossRef]
- What Types of Ferns Prefer Acidic Soil? Available online: https://homeguides.sfgate.com/types-ferns-preferacidic-soil-51940.html (accessed on 28 May 2021).
- HEAR Species Information Index Puunene, Hawaii, USA: Hawaii Ecosystems at Risk Project. Available online: http://www.hear.org/species/ (accessed on 12 November 2022).
- Thepsilvisut, O.; Chutimanukul, P.; Sae-Tan, S.; Ehara, H. Effect of chicken manure and chemical fertilizer on the yield and qualities of white mugwort at dissimilar harvesting times. PLoS ONE 2022, 17, e0266190. [Google Scholar] [CrossRef] [PubMed]
- Dodd, M.B.; McGowan, A.W.; Power, I.L.; Thorrold, B.S. Effects of variation in shade level, shade duration and light quality on perennial pastures. N. Z. J. Agric. Res. 2005, 48, 531–543. [Google Scholar] [CrossRef]
- Ofori-Frimpong, K.; Afrifa, A.A.; Acquaye, S. Impact of shade and cocoa plant densities on soil organic carbon sequestration rates in a cocoa growing soil of Ghana. Afr. J. Environ. Sci. Technol. 2010, 4, 621–624. [Google Scholar]
- Ntalo, M.; Ravhuhali, K.E.; Moyo, B.; Mmbi, N.E.; Mokoboki, K.H. Physical and chemical properties of the soils in selected communal property associations of South Africa. PeerJ 2022, 10, e13960. [Google Scholar] [CrossRef]
- Andersson, H.; Bergström, L.; Djodjic, F.; Ulén, B.; Kirchmann, H. Topsoil and subsoil properties influence phosphorus leaching from four agricultural soils. J. Environ. Qual. 2013, 42, 455–463. [Google Scholar] [CrossRef] [Green Version]
- Payne, T.; Norton, D.A. Influence of shade on soil and foliage water in a depleted short tussock grassland, Mackenzie Basin. N. Z. Nat. Sci. 2011, 36, 21–31. [Google Scholar]
- Blaser, W.J.; Oppong, J.; Yeboah, E.; Six, J. Shade trees have limited benefits for soil fertility in cocoa agroforests. Agric. Ecosyst. Environ. 2017, 243, 83–91. [Google Scholar] [CrossRef] [Green Version]
- Zhang, S.; Sun, L.; Wang, Y.; Fan, K.; Xu, Q.; Li, Y.; Ma, Q.; Wang, J.; Ren, W.; Ding, Z. Cow manure application effectively regulates the soil bacterial community in tea plantation. BMC Microbiol. 2020, 20, 190. [Google Scholar] [CrossRef]
- Li, S.; Liu, Z.; Li, J.; Liu, Z.; Gu, X.; Shi, L. Cow manure compost promotes maize growth and ameliorates soil quality in saline-alkali soil: Role of fertilizer addition rate and application depth. Sustainability 2022, 14, 10088. [Google Scholar] [CrossRef]
- D’Hose, T.; Debode, J.; De Tender, C.; Ruysschaert, G.; Vandecasteele, B. Has compost with biochar applied during the process added value over biochar or compost for increasing soil quality in an arable cropping system? Appl. Soil Ecol. 2020, 156, 103706. [Google Scholar] [CrossRef]
- Koutika, L.S.; Mareschal, L. Acacia and eucalypt change P, N and C concentrations in POM of Arenosols in the Congolese coastal plains. Geoderma Reg. 2017, 11, 37–43. [Google Scholar] [CrossRef]
- Sauvadet, M.; Meersche, K.V.D.; Allinne, C.; Gay, F.; Filho, E.D.M.V.; Chauvat, M.; Becquer, T.; Tixier, P.; Harmand, J.M. Shade trees have higher impact on soil nutrient availability and food web in organic than conventional coffee agroforestry. Sci. Total Environ. 2019, 649, 1065–1074. [Google Scholar] [CrossRef]
- Whitehead, M.; Isaac, M.E. Effects of shade on nitrogen and phosphorus acquisition in cereal-legume intercropping systems. Agriculture 2012, 2, 12–24. [Google Scholar] [CrossRef] [Green Version]
- Trail, P.; Danmalidoi, Y.; Bicksler, A.; Burnette, R. Production of vegetable fern (Diplazium esculentum Reytz.) under varying levels of shade. ECHO Asia Notes 2021, 45, 1–7. [Google Scholar]
- Rungruksatham, P.; Khurnpoon, L. Effect of shade net and fertilizer application on growth and quality in muskmelon (Cucumis melo. L. var. reticulatus) after harvest. Int. J. Agric. Technol. 2016, 12, 1407–1417. [Google Scholar]
- Tang, W.; Guo, H.; Baskin, C.C.; Xiong, W.; Yang, C.; Li, Z.; Song, H.; Wang, T.; Yin, J.; Wu, X.; et al. Effect of light intensity on morphology, photosynthesis and carbon metabolism of alfalfa (Medicago sativa) seedlings. Plants 2022, 11, 1688. [Google Scholar] [CrossRef]
- Hitz, T.; Hartung, J.; Graeff-Honninger, S.; Munz, S. Morphological response of soybean (Glycine max (L.) Merr.) cultivars to light intensity and red to far-red ratio. Agronomy 2019, 9, 428. [Google Scholar] [CrossRef] [Green Version]
- Ueda, Y.; Nishihara, S.; Tomita, H.; Oda, Y. Photosynthetic response of Japanese rose species Rosa bracteata and Rosa rugosa to temperature and light. Sci. Hortic. 2000, 84, 365–371. [Google Scholar] [CrossRef]
- Dufour, L.; Guérin, V. Low light intensity promotes growth, photosynthesis and yield of Anthurium andreanum Lind. in tropical conditions. Adv. Hortic. Sci. 2003, 17, 9–14. [Google Scholar]
- Gardner, F.P.; Pearce, R.B.; Mitchell, R.L. Physiology of Crop Plants; Iowa State University Press: Ames, IA, USA, 1985; pp. 31–36. [Google Scholar]
- Shim, M.S.; Kim, Y.J.; Lee, D.S.; Kwon, H.Y.; Kim, S.S.; Kang, U. Growth responses of various ferns on shading and fertilizer application. J. Bio-Environ. Control 2011, 20, 109–115. [Google Scholar]
- Hanudin, E.; Wismarini, H.; Hertiani, T.; Sunarminto, B.H. Effect of shading, nitrogen and magnesium fertilizer on phyllanthin and total flavonoid yield of Phyllanthus niruri in Indonesia soil. J. Med. Plant Res. 2012, 6, 4586–4592. [Google Scholar] [CrossRef]
- Sutulienė, R.; Laužikė, K.; Pukas, T.; Samuolienė, G. Effect of light intensity on the growth and antioxidant activity of sweet basil and lettuce. Plants 2022, 11, 1709. [Google Scholar] [CrossRef] [PubMed]
- Thepsilvisut, O.; Iad-ak, R.; Chutimanukol, P. Optimization of shading levels and fertilizer application on commercial production of vegetable fern (Diplazium esculentum). Khon Kaen Agric. J. 2022, 50, 1301–1316. [Google Scholar]
- Yumkham, S.D.; Chakpram, L.; Salam, S.; Bhattacharya, M.K.; Singh, P.K. Edible ferns and fern allies of North East India: A study on potential wild vegetables. Genet. Resour. Crop Evol. 2016, 64, 467–477. [Google Scholar] [CrossRef]
- Yue, C.; Wang, Z.; Yang, P. Review: The effect of light on the key pigment compounds of photosensitive etiolated tea plant. Bot. Stud. 2021, 62, 21. [Google Scholar] [CrossRef]
- Feng, W.; JiaRong, Y.; Yu, C.X.; Hao, J.C.; Da, M.S.; Feng, L.Y.; Tao, X.; Fang, Q.M.; Lai, L.T. Light regulation of chlorophyll biosynthesis in plants. Acta Hortic. Sin. 2019, 46, 975–994. [Google Scholar]
- Singh, P.; Dubey, R.K.; Kushal, S. Effect of shade levels on growth and frond production in Boston fern [Nephrolepis exaltata (L.) Schott]. Asian J. Hortic. 2014, 9, 377–381. [Google Scholar] [CrossRef]
- Ren, B.; Cui, H.; Camberato, J.J.; Dong, S.; Liu, P.; Zhao, B.; Zhang, J. Effects of shading on the photosynthetic characteristics and mesophyll cell ultrastructure of summer maize. Sci. Nat. 2016, 103, 67. [Google Scholar] [CrossRef]
- Rezai, S.; Etemadi, N.; Nikbakht, A.; Yousefi, M.; Majidi, M.M. Effect of light intensity on leaf morphology, photosynthetic capacity, and chlorophyll content in sage (Salvia officinalis L.). Hortic. Sci. Technol. 2018, 36, 46–57. [Google Scholar]
- Özer, H. Effect of shading and organic fertilizers on tomato yield and quality. Pak. J. Bot. 2017, 49, 1849–1855. [Google Scholar]
- Prsa, I.; Stampar, F.; Vodnik, D.; Veberic, R. Influence of nitrogen on leaf chlorophyll content and photosynthesis of ’Golden Delicious’ apple. Acta Agric. Scand. B Soil Plant Sci. 2007, 57, 283–289. [Google Scholar] [CrossRef]
- Wang, N.; Fu, F.; Wang, H.; Wang, P.; He, S.; Shao, H.; Ni, Z.; Zhang, X. Effects of irrigation and nitrogen on chlorophyll content, dry matter and nitrogen accumulation in sugar beet (Beta vulgaris L.). Sci. Rep. 2021, 11, 16651. [Google Scholar] [CrossRef]
- Vanlalhruaii, R.; Sharma, B.P.; Gupta, Y.C. Green farming of Boston fern (Nephrolepis exaltata (L.) Schott) under polyhouse condition. Pharma Innov. 2022, 11, 1458–1461. [Google Scholar]
- Putri, D.P.; Widyastuti, Y.; Dewi, W.S.; Yunus, A. The effect of shade and vermicompost application on yield and flavonoid levels of Tempuyung (Sonchus arvensis). IOP Conf. Ser. Earth Environ. Sci. 2018, 142, 012055. [Google Scholar] [CrossRef]
- Hernández, V.; Hellín, P.; Fenoll, J.; Flores, P. Interaction of nitrogen and shading on tomato yield and quality. Sci. Hortic. 2019, 255, 255–259. [Google Scholar] [CrossRef]
- Aydin, M.; Saglam, N.; Gebologlu, N.; Sahin, S.; Yilmaz, E.; Yucel, H.; Karaman, M.R. The role of shading on growth, yield and biochemical composition of crisp lettuce in soilless culture. Soil-Water J. 2013, 2, 1449–1454. [Google Scholar]
- Musa, A.; Ogbadoyi, E.O. Effect of nitrogen fertilizer on the levels of some nutrients, anti-nutrients and toxic substances in Hibiscus sabdariffa. Asian J. Crop Sci. 2012, 4, 103–112. [Google Scholar] [CrossRef] [Green Version]
- Hall, M.K.D.; Jobling, J.J.; Rogers, G.S. Effect of nitrogen supply and storage temperature on vitamin C in two species of baby leaf rocket, and the potential of these crops for a nutrient claim in Australia. J. Plant Nutr. 2015, 38, 246–259. [Google Scholar] [CrossRef]
- Muller, K.; Hippe, J. Influence of differences in nutrition on important quality characteristics of some agricultural crops. Plant Soil 1987, 100, 35–45. [Google Scholar] [CrossRef]
- Lee, S.K.; Kader, A.A. Preharvest and postharvest factors influencing vitamin C content of horticultural crops. Postharvest Biol. Technol. 2000, 20, 207–220. [Google Scholar] [CrossRef] [Green Version]
- Nuñez de González, M.T.; Osburn, W.N.; Hardin, M.D.; Longnecker, M.; Garg, H.K.; Bryan, N.S.; Keeton, J.T. A survey of nitrate and nitrite concentrations in conventional and organic-labeled raw vegetables at retail. J. Food Sci. 2015, 80, C942–C949. [Google Scholar] [CrossRef] [PubMed]
- Hassan, S.A.; Mijin, S.; Yusoff, U.K.; Ding, P.; Wahab, P.E.M. Nitrate, ascorbic acid, mineral and antioxidant activities of Cosmos caudatus in response to organic and mineral-based fertilizer rates. Molecules 2012, 17, 7843–7853. [Google Scholar] [CrossRef] [PubMed]


| Fertilizer Treatment | Application Rates (t ha−1) | The Proportion of Primary Elements in Fertilizer Applied for Each Treatment | ||
|---|---|---|---|---|
| N (kg ha−1) | P (kg ha−1) | K (kg ha−1) | ||
| Control (no fertilizer) | - | - | - | - |
| Chemical fertilizer 92.80 kg N ha−1 (15-15-15187.50 kg ha−1 + 46-0-0140.60 kg ha−1) | 0.33 | 92.80 | 175.78 | 175.78 |
| Cow manure 92.80 kg N ha−1 | 4.38 | 92.80 | 38.50 | 154.88 |
| Cow manure 185.60 kg N ha−1 | 8.75 | 185.60 | 77.00 | 309.75 |
| Cow manure 278.40 kg N ha−1 | 13.13 | 278.40 | 115.50 | 464.63 |
| Shading (S) | Fertilizer (F) | pH (1:1 H2O) | EC (1:5 H2O) (dS m−1) | Organic Matter (%) | Total N (mg g−1) | Available P (mg kg−1) | Available K (mg kg−1) |
|---|---|---|---|---|---|---|---|
| Before experiment | 4.63 | 0.04 | 1.67 | 0.90 | 19.00 | 52.00 | |
| After experiment (180 days after planting) | |||||||
| 0% | Control | 4.73 c–f | 1.46 fg | 0.87 efg | 0.43 de | 11.00 d | 77.00 k |
| CF 92.80N | 4.97 a | 3.22 de | 0.68 fg | 0.33 e | 11.67 d | 94.67 f | |
| CM 92.80N | 4.60 f | 4.69 c | 0.83 efg | 0.43 de | 14.00 bc | 66.00 n | |
| CM 185.60N | 4.87 a–d | 7.58 ab | 1.09 de | 0.57 bcd | 8.00 ef | 91.33 g | |
| CM 278.40N | 4.93 ab | 7.39 ab | 0.96 def | 0.50 cd | 14.67 b | 119.33 a | |
| 75% | Control | 4.90 abc | 0.74 g | 0.65 g | 0.33 e | 12.33 cd | 75.00 l |
| CF 92.80N | 4.87 a–d | 3.93 cd | 1.06 de | 0.57 bcd | 6.00 f | 70.33 m | |
| CM 92.80N | 4.73 c–f | 3.99 cd | 1.21 bcd | 0.60 bc | 8.00 ef | 77.33 j | |
| CM 185.60N | 4.70 def | 4.25 cd | 1.41 abc | 0.70 ab | 10.67 d | 95.67 e | |
| CM 278.40N | 4.83 a–e | 3.45 cd | 1.01 de | 0.53 cd | 18.33 a | 112.33 b | |
| 96% | Control | 4.77 b–f | 1.70 fg | 1.51 ab | 0.77 a | 8.33 e | 63.67 o |
| CF 92.80N | 4.67 ef | 2.07 ef | 1.54 a | 0.77 a | 11.33 d | 78.33 i | |
| CM 92.80N | 4.83 a–e | 6.85 b | 1.23 abc | 0.60 bc | 6.67 ef | 87.33 h | |
| CM 185.60N | 4.77 b–f | 8.26 a | 1.24 a–d | 0.63 abc | 11.33 d | 97.33 d | |
| CM 278.40N | 4.63 f | 8.08 ab | 1.14 cde | 0.53 cd | 11.00 d | 106.00 c | |
| Significance S × F | ** | ** | ** | ** | ** | ** | |
| Mean for shading | 0% | 4.82 a | 4.87 a | 0.89 c | 0.45 c | 11.87 a | 89.67 |
| 75% | 4.81 a | 3.27 b | 1.07 b | 0.55 b | 11.07 a | 86.13 | |
| 96% | 4.73 b | 5.39 a | 1.33 a | 0.66 a | 9.73 b | 86.53 | |
| Significance S | * | ** | * | ** | ** | ns | |
| Mean for fertilizer | Control | 4.80 | 1.30 d | 1.01 b | 0.51 b | 10.56 b | 71.89 d |
| CF 92.80N | 4.83 | 3.07 c | 1.09 ab | 0.56 b | 9.67 b | 81.11 c | |
| CM 92.80N | 4.72 | 5.18 b | 1.09 ab | 0.54 b | 9.56 b | 76.89 cd | |
| CM 185.60N | 4.78 | 6.70 a | 1.25 a | 0.63 a | 10.00 b | 97.67 b | |
| CM 278.40N | 4.80 | 6.31 a | 1.10 ab | 0.52 b | 14.67 a | 109.67 a | |
| Significance F | ns | ** | ** | * | ** | ** | |
| Mean | 4.79 | 4.51 | 1.10 | 0.55 | 10.89 | 87.44 | |
| C.V. (%) | 1.94 | 16.28 | 14.92 | 13.74 | 10.60 | 6.45 | |
| Treatment | Plant Height (cm) | Plant Width (cm) | Yield (kg ha−1) | ||||||
|---|---|---|---|---|---|---|---|---|---|
| 30 DAT | 60 DAT | 90 DAT | 30 DAT | 60 DAT | 90 DAT | 1st Harvest | 2nd Harvest | 3rd Harvest | |
| Shading (S) | |||||||||
| 0% | 32.34 c | 39.08 c | 49.04 c | 27.22 c | 39.47 c | 47.11 c | 380.83 b | 242.73 b | 463.56 c |
| 75% | 39.28 b | 52.07 b | 65.24 b | 34.81 b | 53.60 b | 65.52 b | 694.09 a | 815.79 a | 818.12 a |
| 96% | 66.89 a | 72.60 a | 75.56 a | 43.68 a | 69.81 a | 79.86 a | 24.61 c | 123.42 c | 494.54 b |
| Fertilizer (F) | |||||||||
| Control | 47.68 ab | 52.46 | 61.25 b | 34.22 b | 54.79 b | 63.27 ab | 181.85 d | 222.65 e | 407.01 e |
| CF 92.80N | 42.15 c | 54.58 | 62.17 b | 33.07 b | 53.22 b | 64.90 ab | 427.54 b | 400.77 c | 520.98 c |
| CM 92.80N | 46.25 ab | 53.98 | 62.84 b | 35.58 ab | 52.15 b | 61.17 b | 315.67 c | 320.13 d | 431.21 d |
| CM 185.60N | 49.77 a | 57.58 | 67.04 a | 39.03 a | 59.38 a | 67.73 a | 461.98 a | 560.99 a | 787.18 b |
| CM 278.40N | 45.00 bc | 54.32 | 63.08 b | 34.28 b | 51.92 b | 63.74 ab | 445.50 ab | 465.36 b | 813.98 a |
| Significance | |||||||||
| S | ** | ** | ** | ** | ** | ** | ** | ** | ** |
| F | ** | ns | * | * | ** | * | ** | ** | ** |
| S × F | ** | * | * | ns | ** | ** | ** | ** | ** |
| CV (%) | 9.54 | 10.05 | 10.28 | 13.36 | 8.12 | 7.81 | 6.69 | 9.70 | 4.56 |
| Treatment | Total Chlorophyll (µg cm−2) | Vitamin C (mg 100 g−1 Fresh Weight) | Nitrate (mg kg−1 Fresh Weight) | ||||||
|---|---|---|---|---|---|---|---|---|---|
| 1st Harvest | 2nd Harvest | 3rd Harvest | 1st Harvest | 2nd Harvest | 3rd Harvest | 1st Harvest | 2nd Harvest | 3rd Harvest | |
| Shading (S) | |||||||||
| 0% | 4.98 c | 3.83 c | 2.93 c | 25.39 a | 25.18 a | 21.66 a | 1975.0 b | 1375.0 b | 1990.0 b |
| 75% | 6.56 b | 6.37 b | 4.65 b | 23.79 a | 24.58 a | 22.03 a | 1965.0 b | 1905.0 b | 1925.0 b |
| 96% | 8.37 a | 8.66 a | 8.20 a | 19.76 b | 20.21 b | 19.21 b | 2975.0 a | 3005.0 a | 3030.0 a |
| Fertilizer (F) | |||||||||
| Control | 6.70 | 4.58 c | 3.06 d | 21.27 | 22.96 ab | 18.27 c | 2000.0 d | 2033.3 cd | 2191.7 b |
| CF 92.80N | 7.26 | 7.75 a | 6.54 a | 22.71 | 21.07 b | 20.21 bc | 2775.0 a | 2725.0 a | 2641.7 a |
| CM 92.80N | 6.46 | 4.63 c | 4.39 c | 21.78 | 23.19 ab | 21.05 abc | 1975.0 d | 2000.0 d | 2025.0 c |
| CM 185.60N | 6.34 | 7.18 b | 6.87 a | 23.99 | 23.72 ab | 23.80 a | 2166.7 c | 2108.3 c | 2133.3 b |
| CM 278.40N | 6.41 | 7.27 b | 5.43 b | 25.14 | 25.66 a | 21.50 ab | 2608.3 b | 2558.3 b | 2583.3 a |
| Significance | |||||||||
| S | ** | ** | ** | ** | ** | ** | ** | ** | ** |
| F | ns | ** | ** | ns | * | ** | ** | ** | ** |
| S × F | ** | ** | ** | ns | ** | * | ** | ** | ** |
| CV (%) | 13.45 | 8.69 | 12.83 | 15.60 | 14.85 | 15.52 | 5.79 | 4.75 | 4.47 |
Disclaimer/Publisher’s Note: The statements, opinions and data contained in all publications are solely those of the individual author(s) and contributor(s) and not of MDPI and/or the editor(s). MDPI and/or the editor(s) disclaim responsibility for any injury to people or property resulting from any ideas, methods, instructions or products referred to in the content. |
© 2023 by the authors. Licensee MDPI, Basel, Switzerland. This article is an open access article distributed under the terms and conditions of the Creative Commons Attribution (CC BY) license (https://creativecommons.org/licenses/by/4.0/).
Share and Cite
Thepsilvisut, O.; Iad-ak, R.; Chutimanukul, P. The Effects of Shading and Nutrient Management on Yield Quality of Vegetable Fern. Horticulturae 2023, 9, 259. https://doi.org/10.3390/horticulturae9020259
Thepsilvisut O, Iad-ak R, Chutimanukul P. The Effects of Shading and Nutrient Management on Yield Quality of Vegetable Fern. Horticulturae. 2023; 9(2):259. https://doi.org/10.3390/horticulturae9020259
Chicago/Turabian StyleThepsilvisut, Ornprapa, Rantiya Iad-ak, and Preuk Chutimanukul. 2023. "The Effects of Shading and Nutrient Management on Yield Quality of Vegetable Fern" Horticulturae 9, no. 2: 259. https://doi.org/10.3390/horticulturae9020259