Article

Comparative Transcriptome Analysis Reveals Potential Genes Conferring Resistance or Susceptibility to Bacterial Canker in Tomato

Department of Vegetable Science, College of Horticulture, China Agricultural University, Beijing 100193, China
*
Author to whom correspondence should be addressed.
Horticulturae 2023, 9(2), 242; https://doi.org/10.3390/horticulturae9020242
Submission received: 27 December 2022 / Revised: 1 February 2023 / Accepted: 6 February 2023 / Published: 10 February 2023
(This article belongs to the Special Issue Genes, Genetics and Breeding of Tomato)

Abstract

:
Bacterial canker of tomato is a systemic disease caused by Clavibacter michiganensis (Cm), which poses a grave threat to tomato production worldwide. Towards the identification of genes underlying resistance to Cm infection, the transcriptome of the resistant inbred backcross line IBL2353 carrying the Rcm2.0 locus derived from Solanum habrochaites LA407 and the susceptible Solanum lycopersicum line Ohio88119 was comparatively analyzed after Cm inoculation, and the analysis focused on the genes with different expression patterns between resistant and susceptible lines. Gene ontology (GO) analysis revealed that top terms of differentially expressed genes comprised ubiquitin protein ligases, transcription factors, and receptor kinases. Then we screened out some genes which are potentially associated with the defense response against Cm infection in IBL2353 including the wall-associated receptor kinase-like 20 (WAKL20), and virus-induced gene silencing showed it contributes resistance to Cm infection. In addition to Cm-induced genes related to resistance, the expression of eight homologs from six susceptibility (S) gene families was analyzed. These putative resistance and susceptibility genes are valuable resources for molecular resistance breeding and contribute to the development of new control methods in tomato.

1. Introduction

Bacterial canker in tomato is one of the most damaging diseases which is caused by the Gram-positive bacterium Clavibacter michiganensis (Cm) [1,2,3]. Since its first occurrence in Michigan, USA in 1909 [4], this disease has been found in almost all tomato production areas in more than 80 countries in Asia, Europe, Africa, America, and Oceania [2,5]. It causes severe economic losses varying from 10% to 100%. However, there is an absence of powerful methods for controlling bacterial canker in tomato [3,6].
Bacterial canker of tomato is a systemic vascular disease which can emerge at all growth stages of tomatoes, and the pathogen can invade tomato plants through natural entries and wounds such as hydathodes, stomata, and trichomes [7]. The typical symptoms are cankers on stems, the unilateral wilting of leaves, and the appearance of bird-eye spots in infected fruits [8,9,10,11]. Because the pathogen of this disease mainly spreads and propagates in the host’s interior vascular bundles, it is difficult to control through chemical or integrated management. Although, people have identified some wild resistant accessions to bacterial canker, and have still not cloned the resistant genes and transferred the resistance into cultivars [3,8,12]. So far, S. habrochaites LA407 and S. arcanum LA2157 are two of the most studied Cm-resistant accessions, and several QTLs have been identified in them, respectively [3].
Genome-wide transcriptome analysis is a powerful way to find out the host molecular responses to pathogen infection. Herein, we have performed a comparative transcriptome analysis using RNA-seq to disclose the important Cm resistance molecular players in the tomato. Revealing molecular basis of the Cm infection response in tomato largely counts on the transcriptomic discrepancies between the susceptible and resistant genotypes, preliminary to and after bacterial pathogen inoculation. Formerly, thousands of differentially expressed genes (DEGs) were identified in transcriptome analysis between susceptible cultivars and resistant wild S. arcanum LA2157 [13,14,15]. Of interest, 122 receptor-like kinases participated in pattern-triggered immunity (PTI) and 46 transcription factors in susceptible tomato cultivars [13]. The proteome-level analysis of Cm-inoculated tomatoes disclosed a series of differentially expressed PR proteins [16]. In spite of such understanding on host–pathogen interactions in tomato, the understanding of the defense mechanism was still incomprehensible, since there were too many DEGs to analyze related to the complicated pathophysiology interaction. Therefore, we envisaged that a comparative transcriptome with less background difference between two lines may bridge the prevalent weakness and broaden our current knowledge of the complicated interaction and impact on the outcome of infection.
In the past several decades, researchers have focused on developing the dominant resistance (R) genes from resistant accessions, whose products mediate the specific pathogen strains’ recognition and protection [17]. Nevertheless, resistance mediated by the dominant R gene is readily broken by the escape or mutations of effectors in pathogens for survival evolution. Susceptibility (S) genes are, in contrast, highly resistant to evolutionary change as these are typically recessive, hence the gradual change in focus on S gene research in recent studies. The inactivation of S genes is more likely to create durable and broad-spectrum resistance in crops [18], and S genes are usually conserved among plant species [19]. In the present study, we analyzed 28 S gene orthologs [18,19] potentially controlling the susceptibility of bacterial canker and provided insights that may contribute to the strategies controlling bacterial canker of tomato.
Based on the above background, we utilized one inbred backcross line IBL2353 which stemmed from S. habrochaites LA407 as the resistant object in comparative analysis. IBL2353 was identified as that maintaining resistance sources in a genetic background with lower than 4.2% of the LA407 genome, which overcame the low mapping percentages and large genetic variation between cultivars and wild materials [20]. Quantitative reverse transcription PCR (RT-qPCR) and transient gene-silencing experiments were designed to identify and correlate some specifically induced genes to the defense response after Cm infection in two tomato lines. Our results present a series of potential defense-related candidate genes in tomato–Cm interaction, which will contribute to better understanding the molecular basis of resistance against bacterial canker and the next resistant gene utilization in tomato breeding.

2. Results

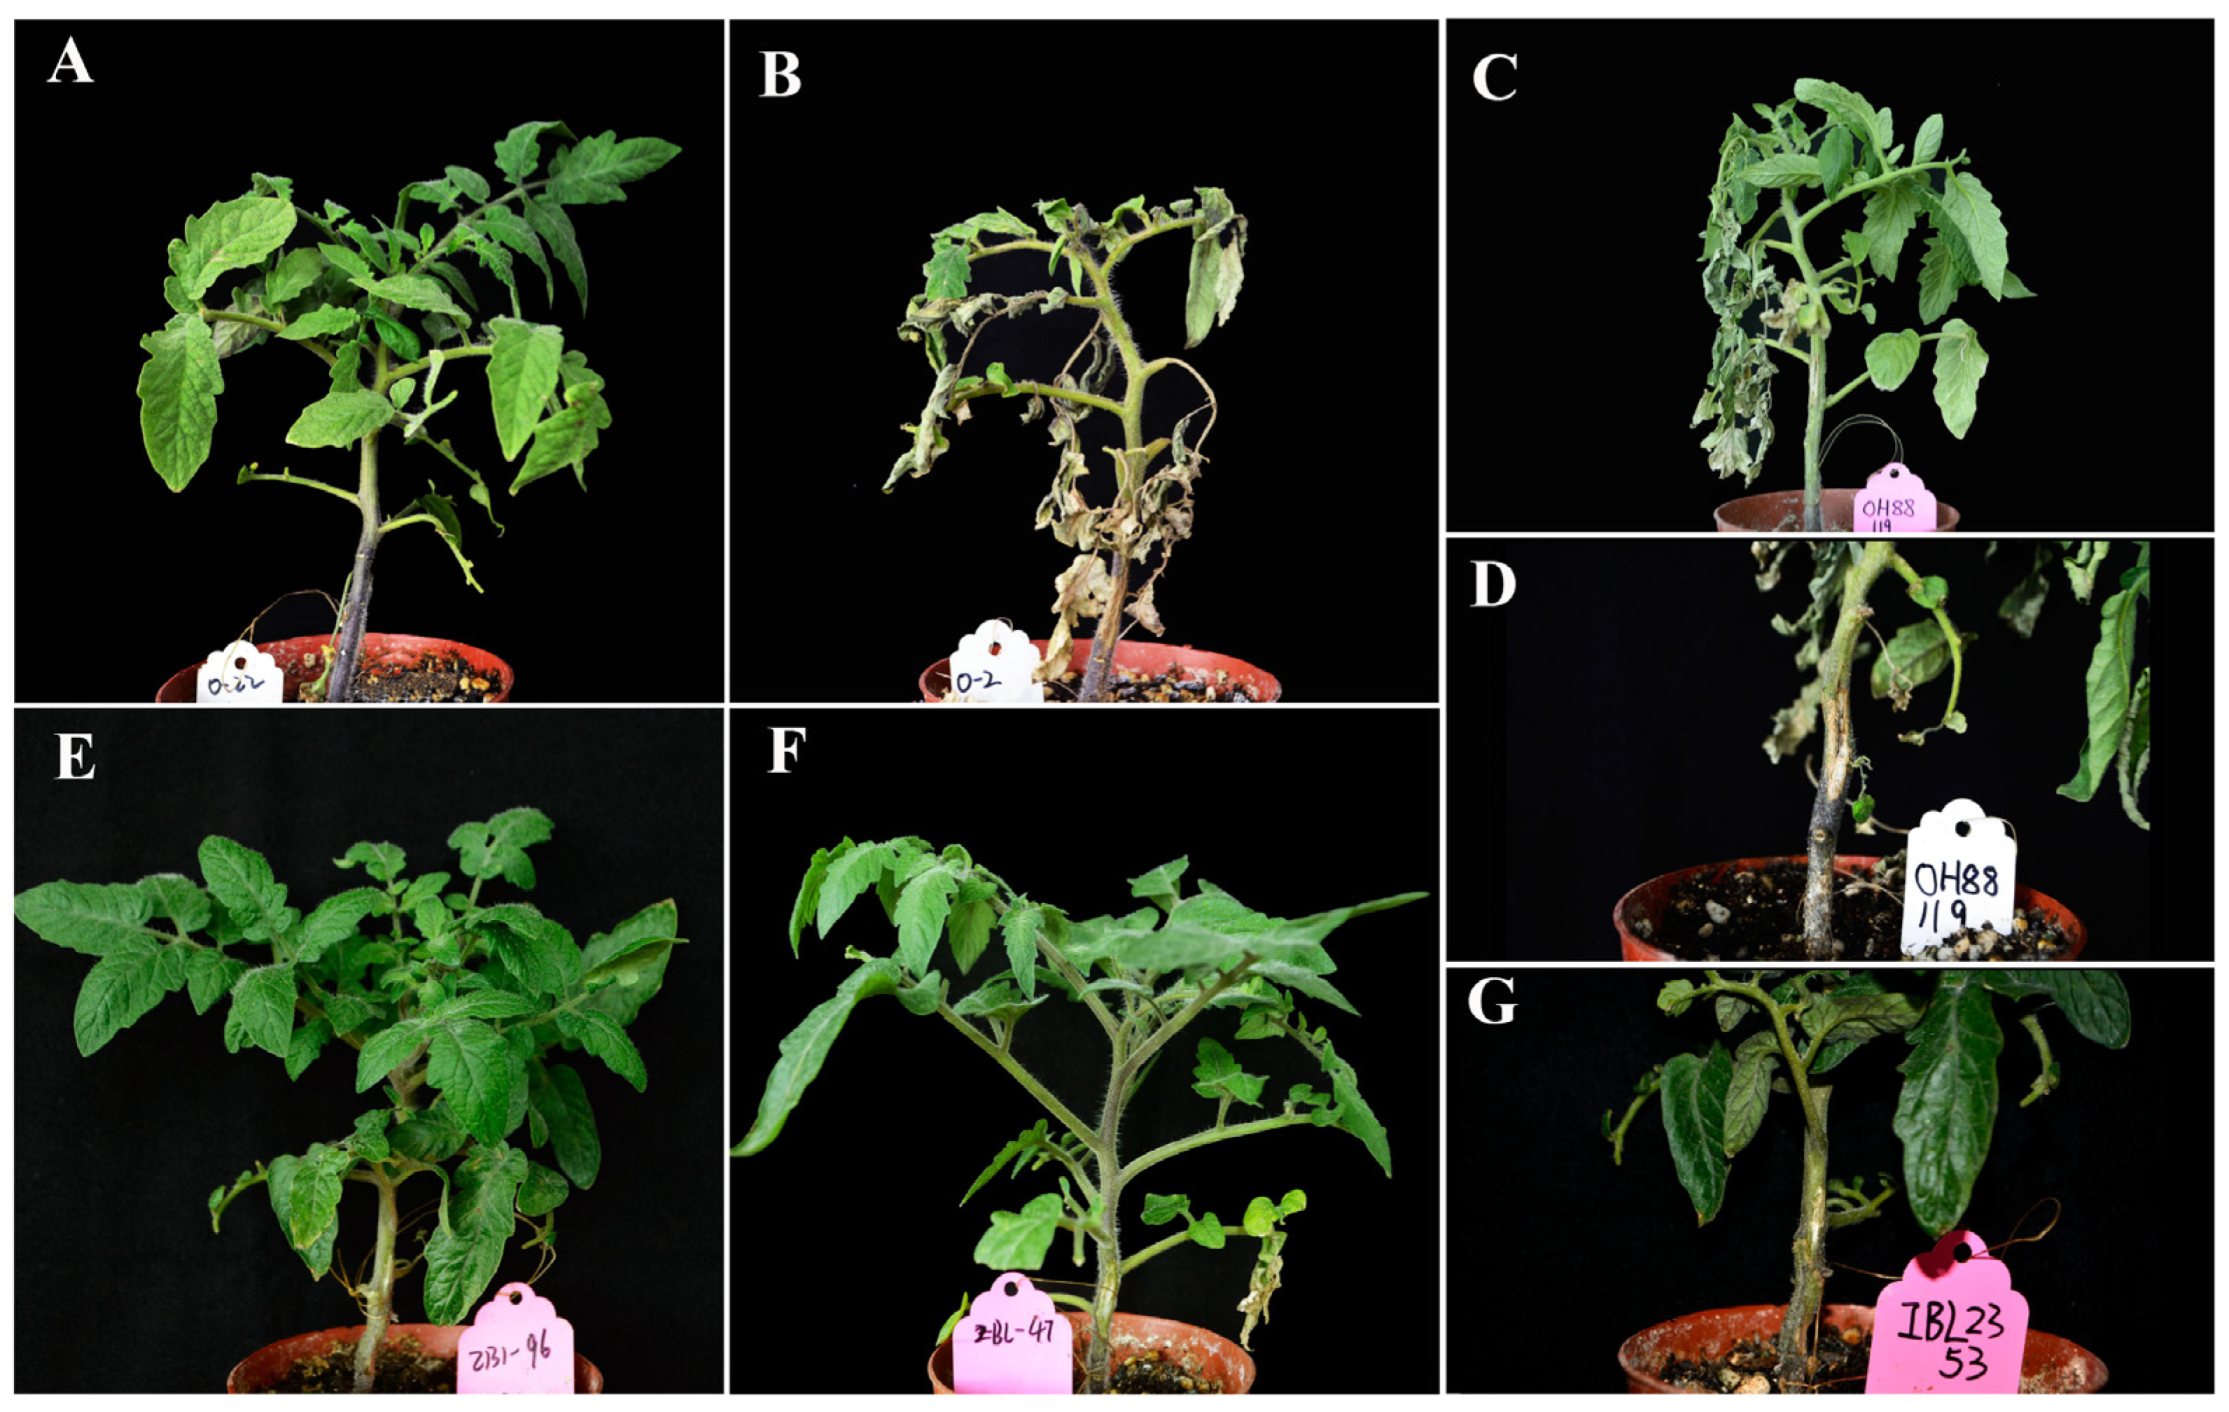
2.1. Phenotype Response of IBL2353 and Ohio88119 to Cm Infection

Healthy plants with 5–6 true leaves were inoculated with Cm bacterial suspension as treated samples and with MgSO4 solution as mock samples. Ohio88119 mock-inoculated plants were free of symptoms at 30 days post-inoculation (dpi) (Figure 1A). Ohio88119 infected plants showed symptoms as early as 15 dpi including necrotic lesions at the leaves’ edges and the wilting of mature leaves. Upon continued incubation at 25–30 dpi, the typical canker symptoms appeared. The symptoms included the unilateral wilting of compound leaves and unilateral plants wilting finally; long and cracking injection sites of the stems; and the dying of whole plants at 30 dpi (Figure 1B–D). In contrast, IBL2353 infected plants remained symptom-free at 30 dpi and showed no apparent differences to the mock-inoculated plants (Figure 1E,F). Some of the IBL2353 infected plants just displayed small and mild canker wounds located in the inoculation site and occasionally wilting leaves at 30 dpi (Figure 1F,G). Therefore, the phenotype of inbreeding line IBL 2353 was very similar to the control plants after Cm infection and confirmed the resistance to the Cm pathogen. In conclusion, both tomato lines appeared the expected phenotype difference upon Cm infection.

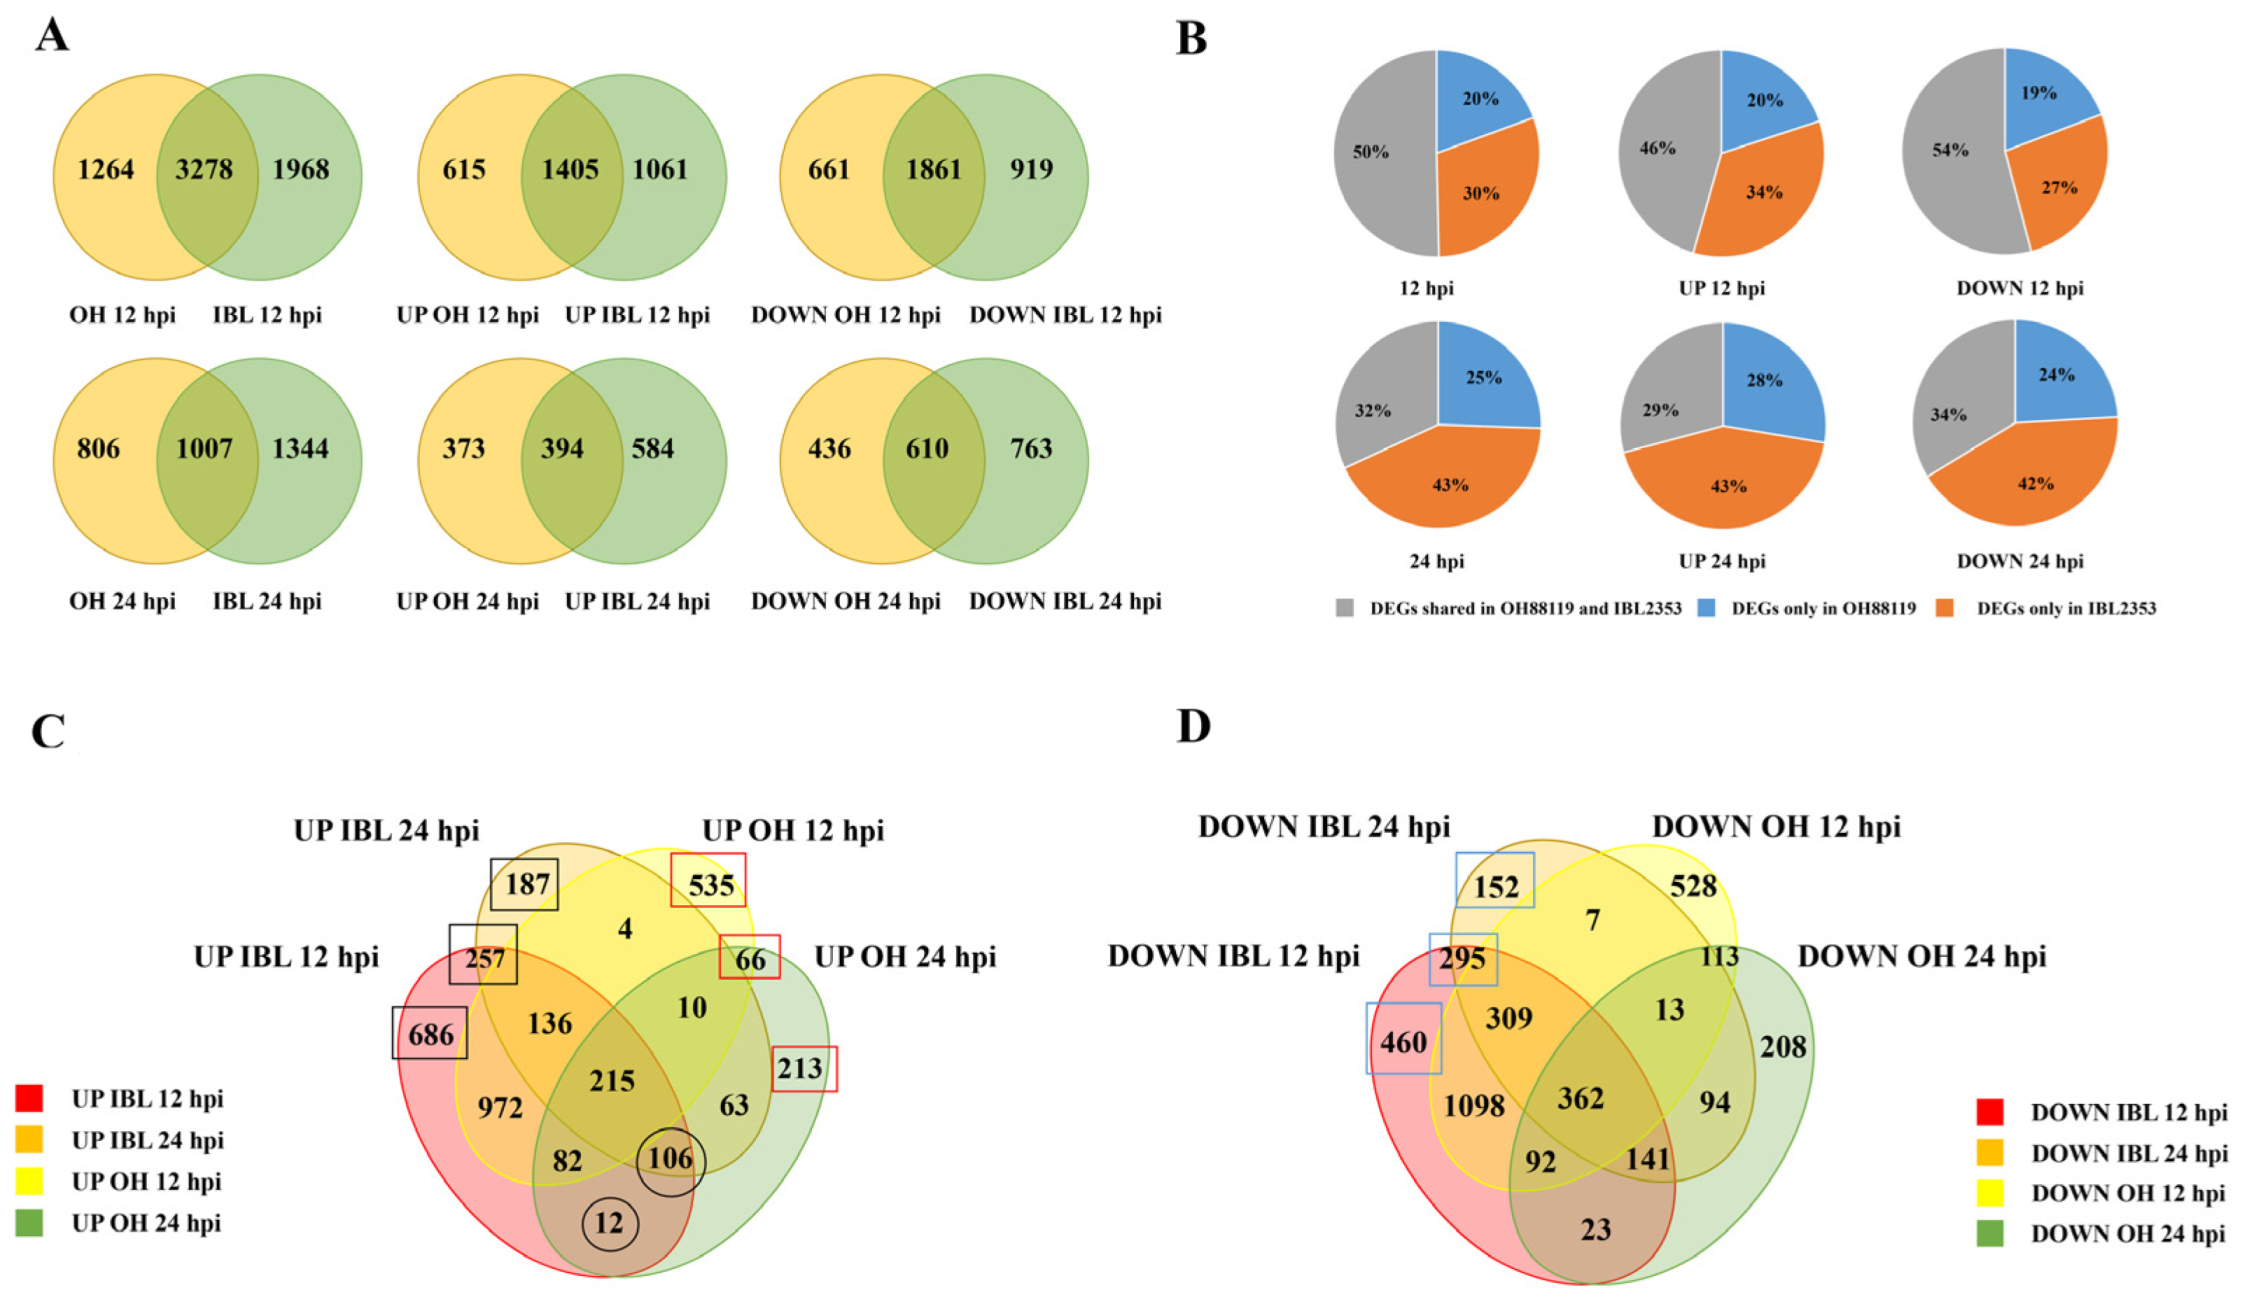
2.2. Cm-Induced Differentially Expressed Genes

Transcriptome profiling was conducted with both resistant (IBL2353) and susceptible (Ohio88119) genotypes at 0, 12, and 24 h after Cm infection. All RNA samples showed high Q30 quality scores (Table S1). The average of mapping percentages in IBL2353 at three time-points was 95.0%, while the average in Ohio88119 was 96.0% (Table S2). DESeq statistical analyses identified differentially expressed transcripts with a fold-change >2.0 and false discovery rate (FDR) ≤ 0.05. The overlap in DEGs at two time-points is shown in Supplementary Figure S1. Of the up-regulated DEGs identified, about 50% of the 12 h samples and about 32% of the 24 h samples were in common in the IBL2353 and Ohio88119 (Figure 2A). The down-regulated DEGs were 54% in common from the 12 h samples (Figure 2B).
Excluding the overlapped DEGs in the resistant line and the susceptible line, we concentrated on those DEGs with different expression patterns between two lines after Cm infection. Then, 1130 up-regulated DEGs were screened out in the resistant IBL2353 (the sum of black rectangles in Figure 2C), and another 118 genes appeared delayed up-regulation in Ohio88119 at 24 hpi (the sum of the black circles in Figure 2C). In IBL2353, 907 genes, marked with three blue rectangles, were specifically down-regulated (Figure 2D) and 814 genes, marked with three red rectangles in Figure 2C, were up-regulated uniquely in the susceptible line without a change in the resistant line.

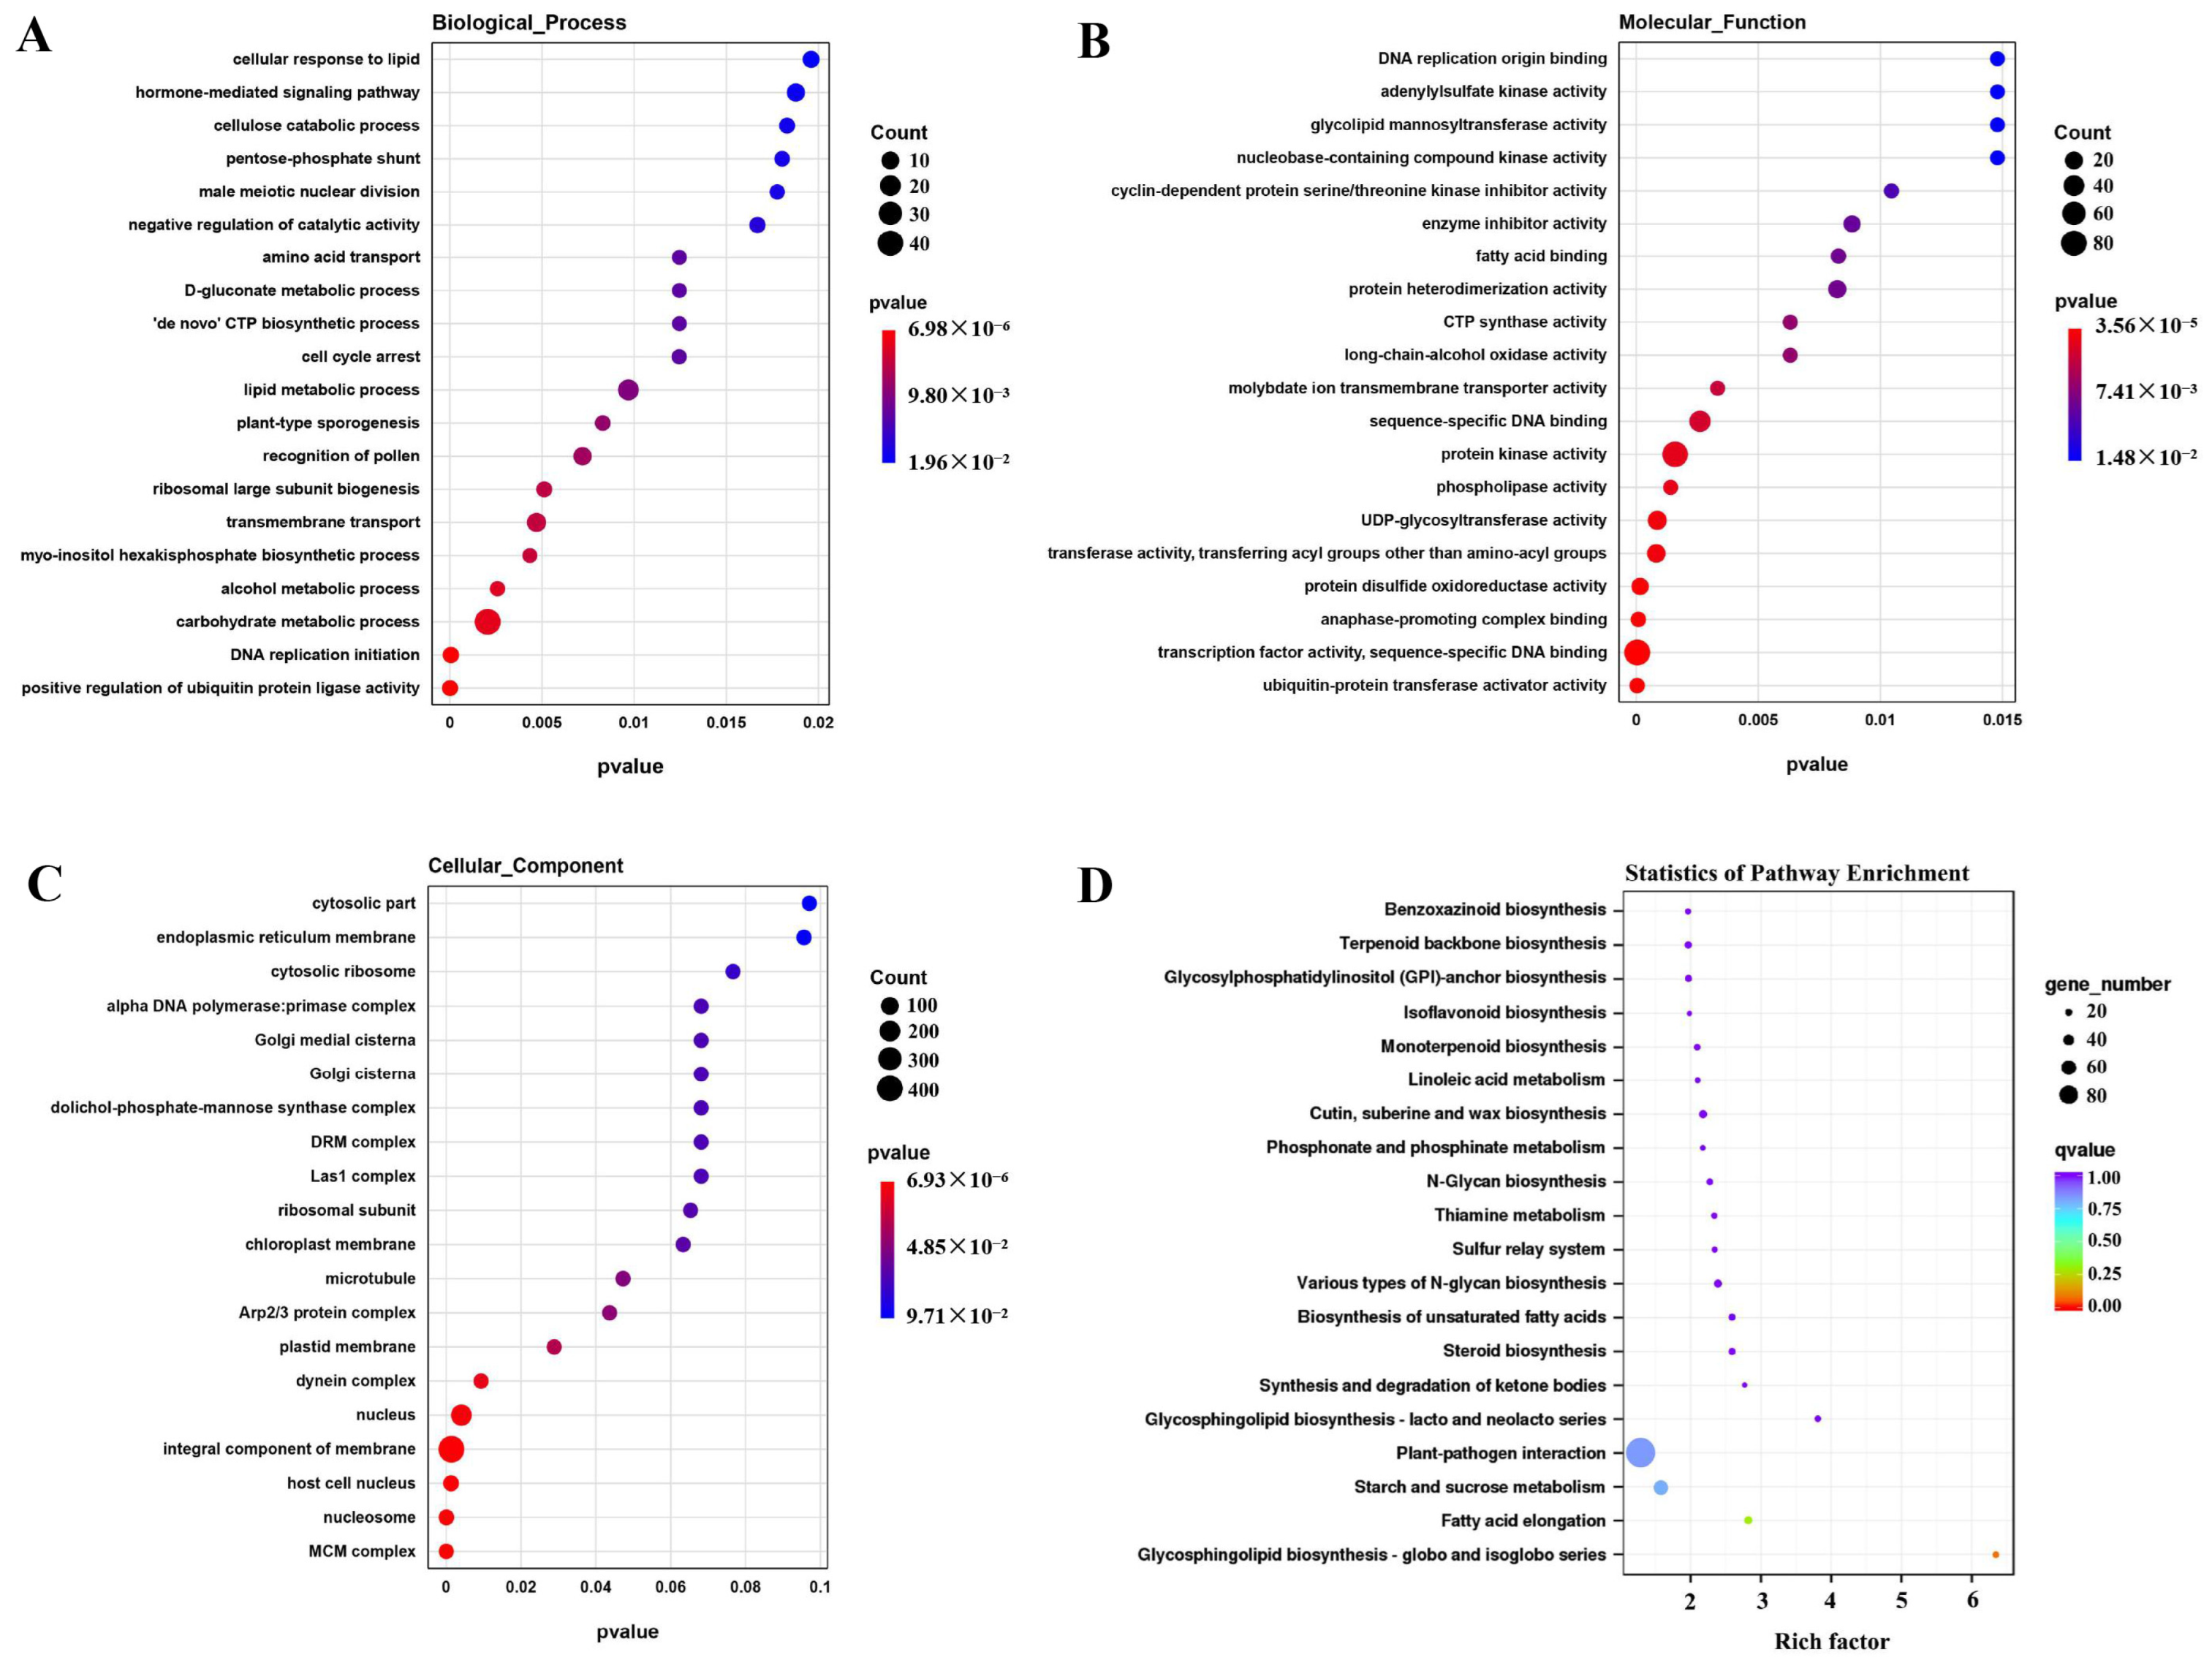
2.3. GO Term Enrichment and KEGG Pathway Analysis

The DEGs with different expression patterns between two lines (Figure 2C,D) were used for gene ontology (GO) terms and KEGG analysis. Tables S3–S5 shows the enriched GO categories: biological process (BP), molecular function (MF) and cellular component (CC). The top 20 enriched GO terms are listed as shown in Figure 3A–C. The BP category contains genes related to the positive regulation of ubiquitin protein ligase activity, DNA replication initiation, the carbohydrate metabolic process, and the alcohol metabolic process, which have higher enrichment than other processes. Ubiquitin-protein transferase activator activity, transcription factor activity (sequence-specific DNA binding), anaphase-promoting complex binding, and protein disulfide oxidoreductase activity were the top four MFs in the degree of enrichment. Moreover, the transcription factor activity (sequence-specific DNA binding) had the highest number of genes in IBL2353 during the 24 h after Cm infection. In CC terms, MCM complex, nucleosome, host cell nucleus, and integral component of membrane were top four terms.
The identified DEGs were mapped to the KEGG database to obtain an insight into the major metabolic pathways operating in response to Cm infection. The pathway enrichment analysis assigned a KEGG number to 2155 DEGs and mapped them into 123 pathways in the resistant IBL2353 (Table S6). The top 20 pathways in connection with these DEGs are shown in Figure 3D. Among them, the biosynthesis of globo and isoglobo series glycosphingolipid was the most enriched pathway. Overall, the GO and KEGG analyses were in line with the putative role of the identified DEGs in the immune responses of tomato against Cm pathogen infection.

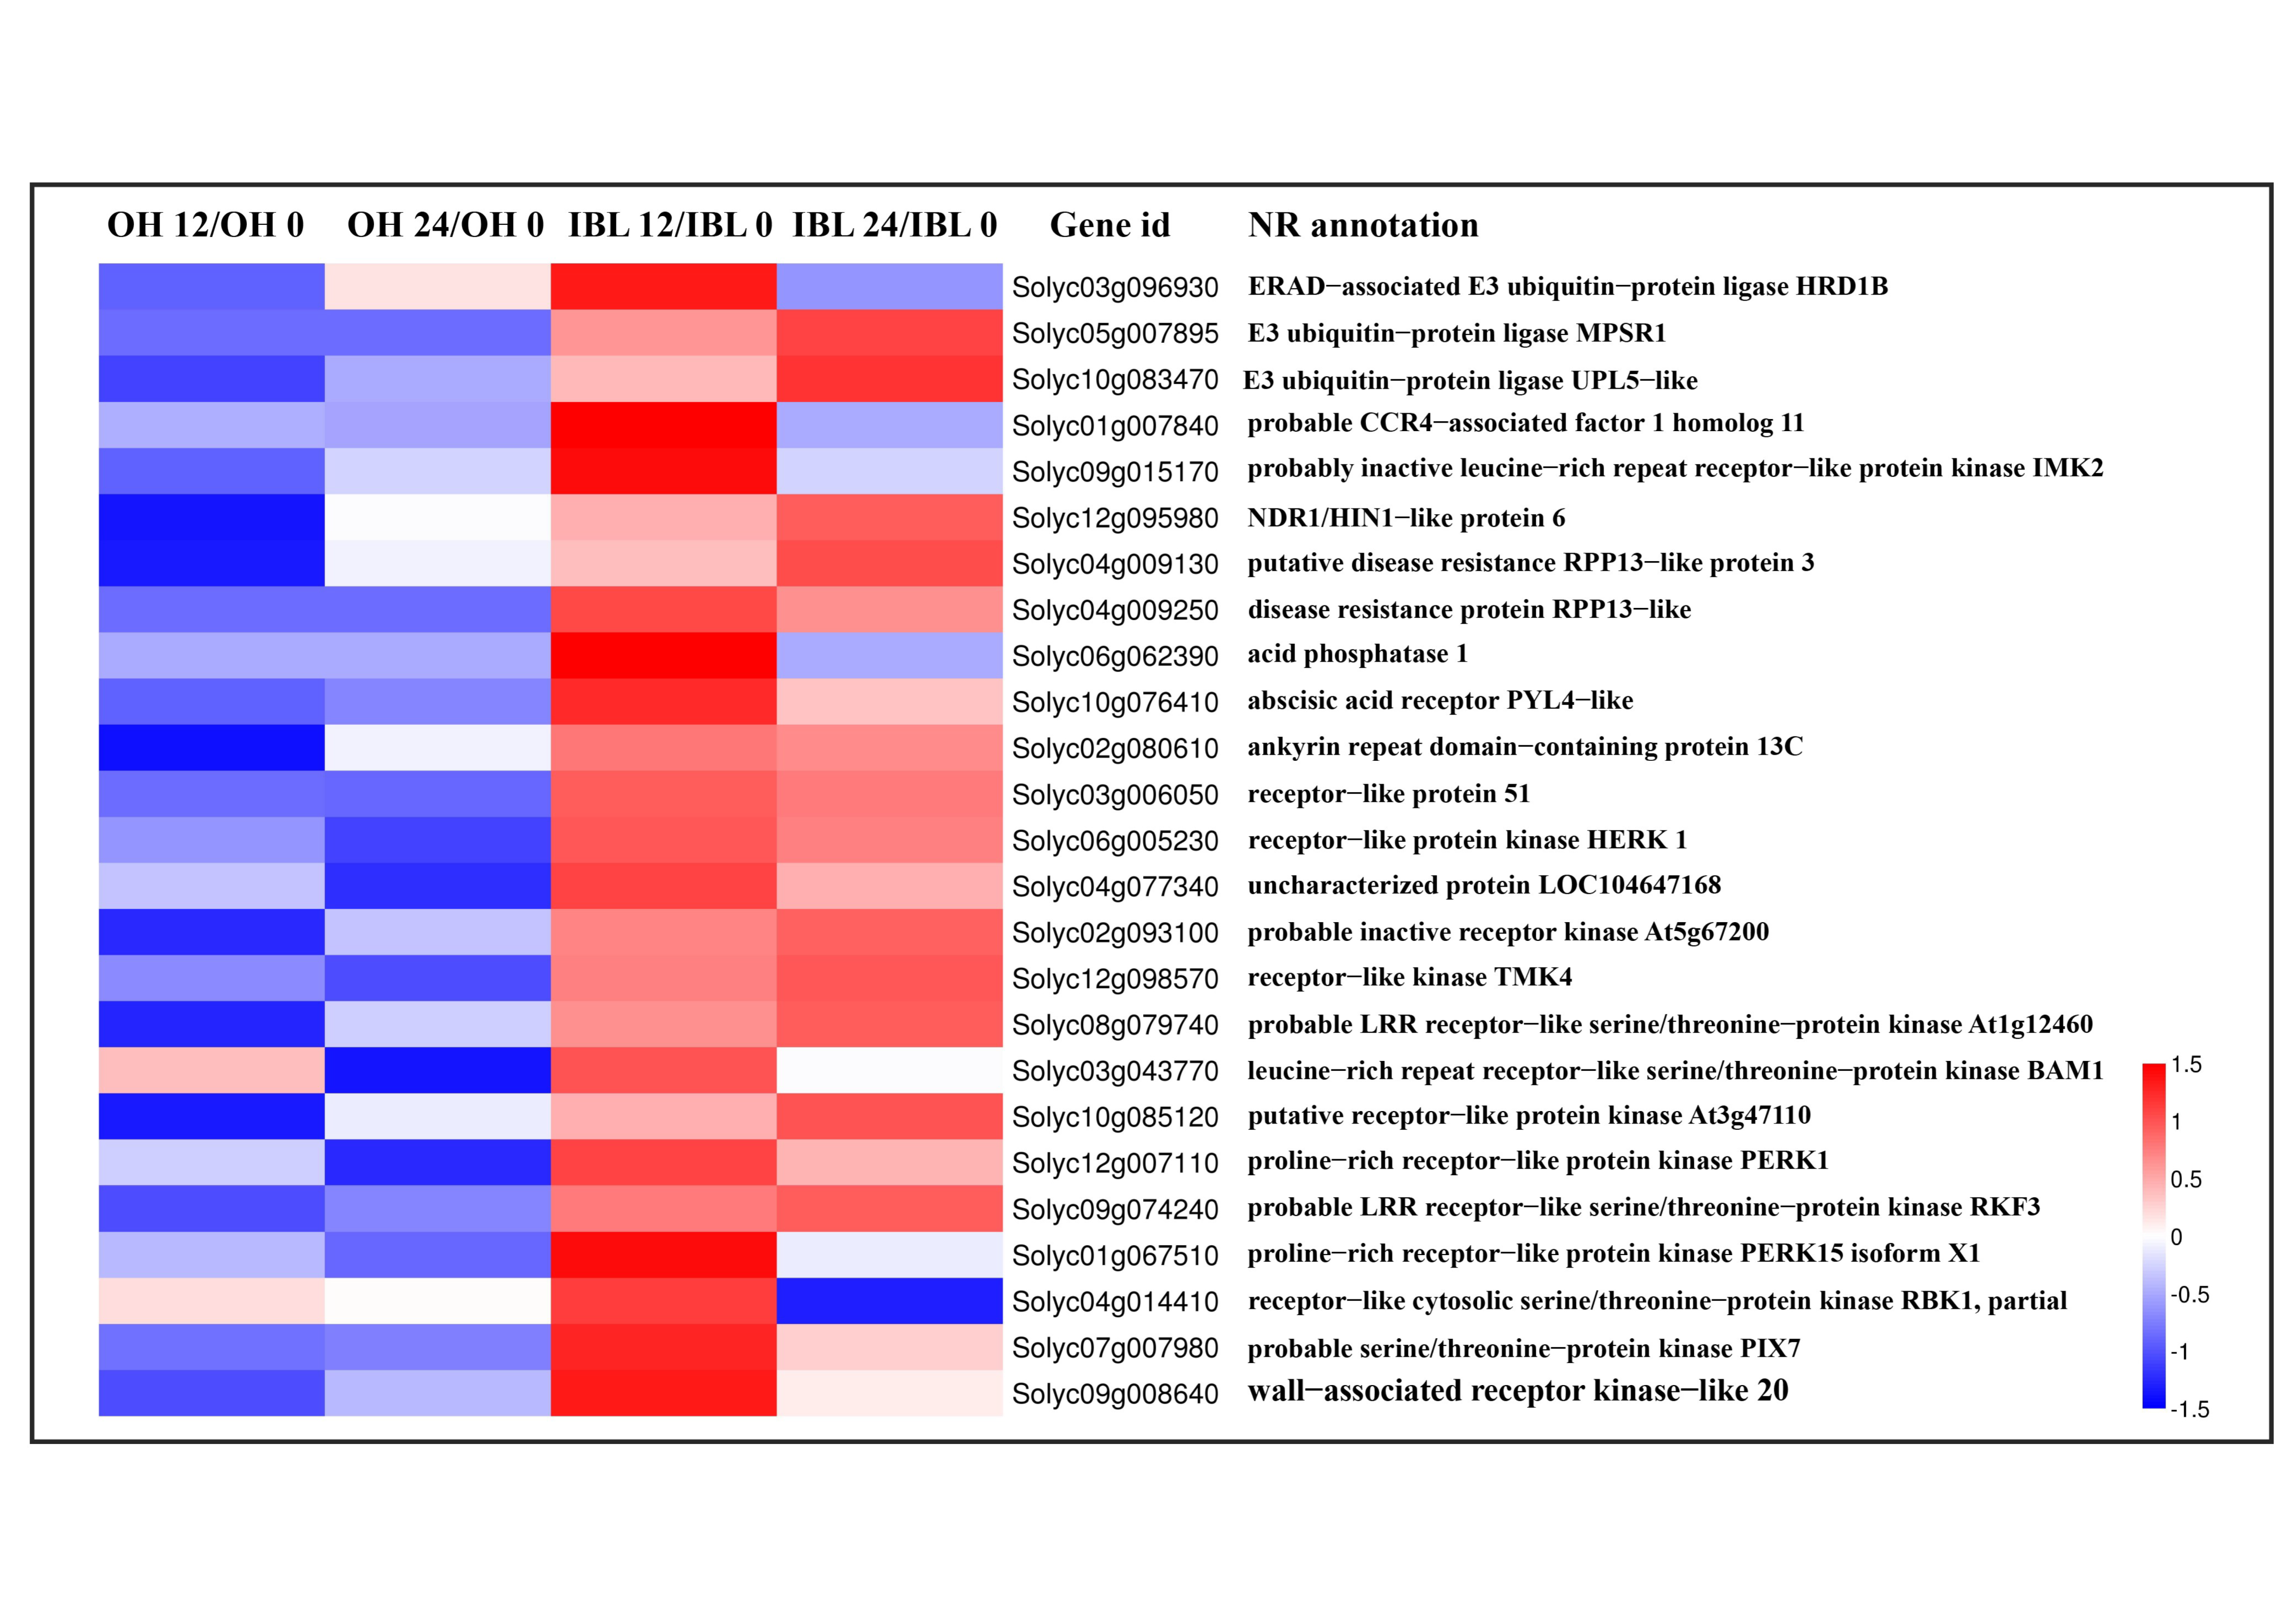
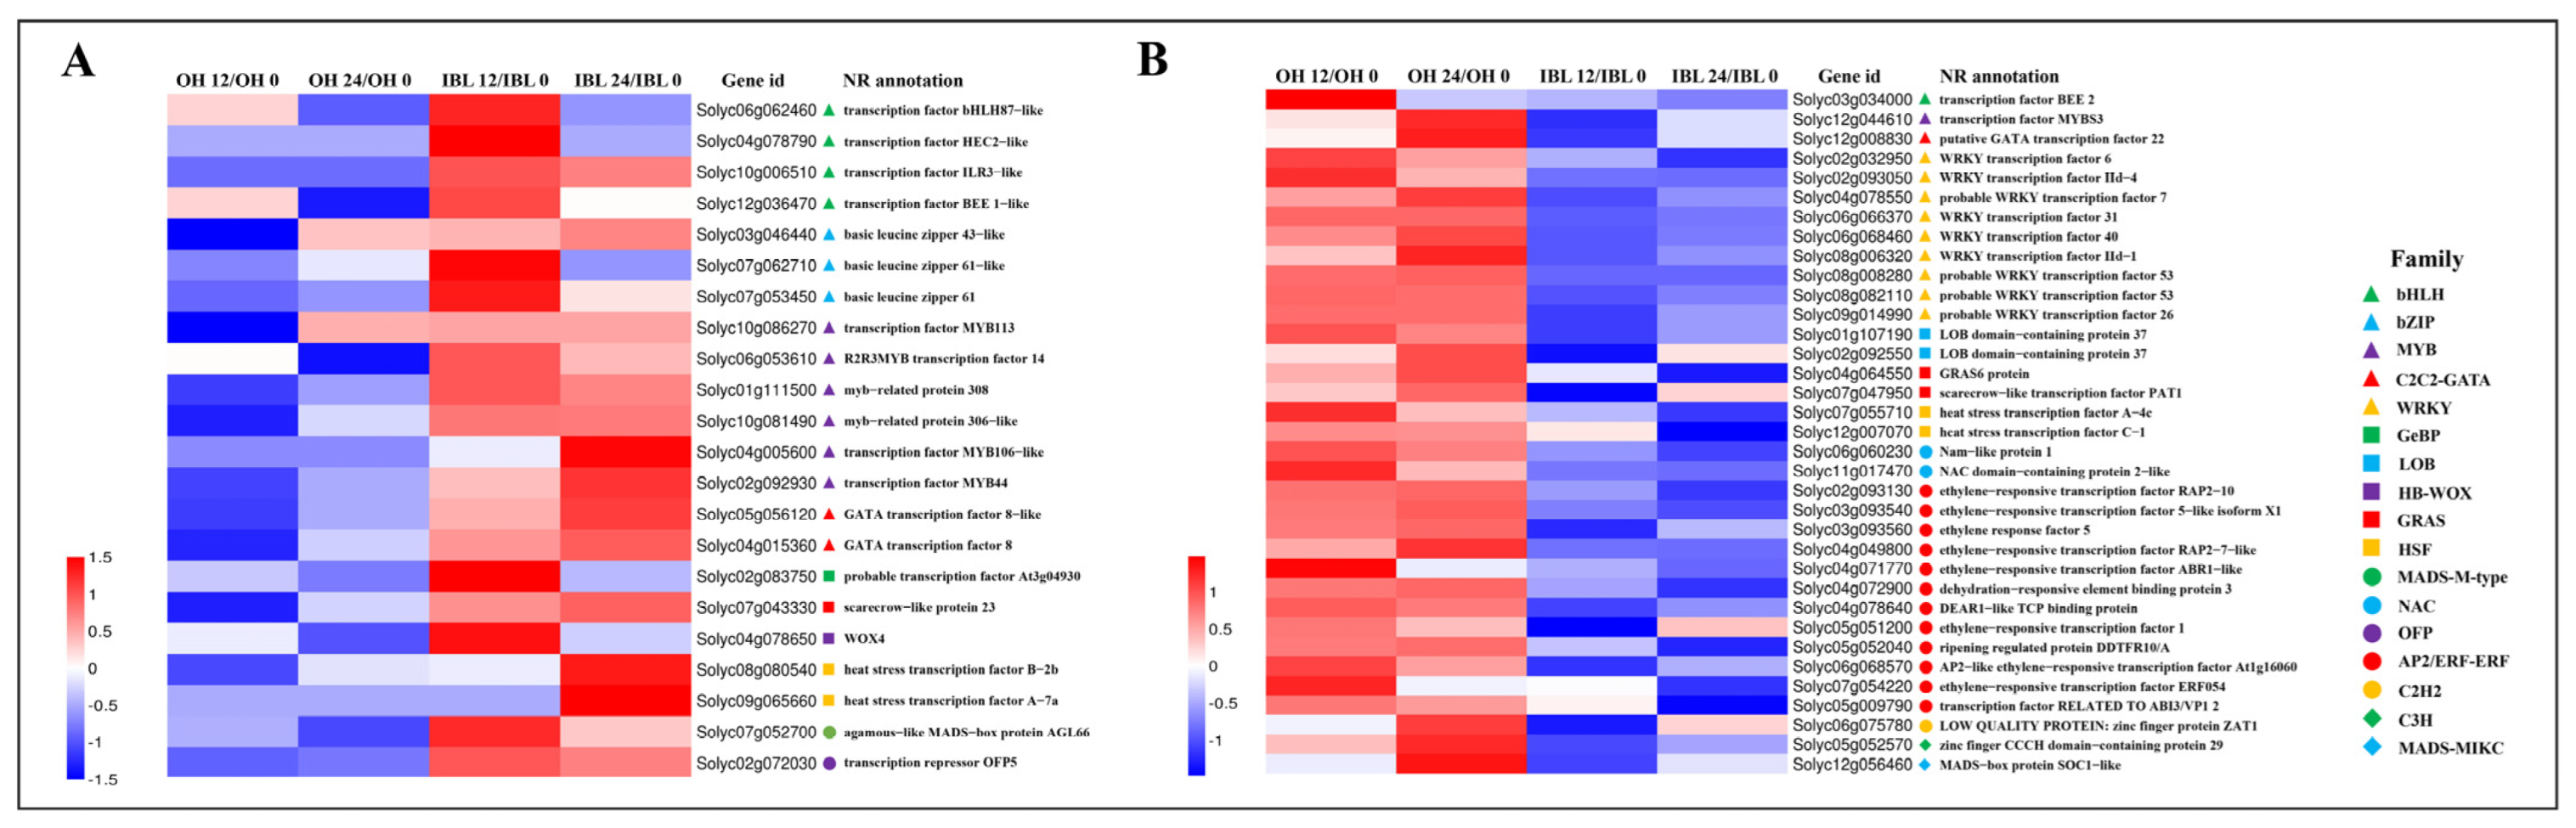
2.4. Genes Associated with the Defense Response against Cm Infection

Combining the DEGs values (log fold change (FC) ≥ 1) with the GO term and KEGG pathway enrichment analyses and the gene functional annotation associated with resistance, 25 genes were selected for further analysis. To compare the differences in these 25 genes between the resistant and susceptible genotypes, a heat map exhibiting the expression profiles was generated (Figure 4). It shows that 11 genes were highly induced at 12 dpi and then dropped back to the 0 h expression level at 24 hpi. This cluster includes the genes coding for an ERAD-associated E3 ubiquitin-protein ligase HRD1B (Solyc03g096930), a probable CCR4-associated factor 1 (CAF1) homolog 11 (Solyc01g007840), several receptors, and receptor-like protein kinases (RLKs). Another 12 genes were up-regulated continuously during the 12 and 24 h after infection in IBL2353. This cluster includes the genes coding for two E3 ubiquitin-protein ligase (MPSR1 Solyc05g007895 and UPL5-like Solyc10g083470), two LRR receptor-like protein kinases, a wall-associated receptor kinase-like 20 (Solyc09g008640), a disease resistance protein RPP13-like, and six RLKs. There were also two genes expressed most highly at 24 hpi in IBL2353, which were a NDR1/HIN1-like (NHL) protein 6 (Solyc12g095980) and a putative disease resistance RPP13-like protein 3 (Solyc04g009130), respectively. In sum, 14 RLKs were induced to be up-regulated in resistant IBL2353 and probably triggered a PTI response against the Cm pathogen.
Besides the above genes, another DEGs category associated with the defense response to the Cm pathogen were transcription factors (TFs). Candidate TFs were found to belong to 17 families including 57 TFs (Figure 5). There were 22 TFs up-regulated specifically in IBL2353 at both time-points, belong to 9 different TF classes (Figure 5A), while 35 genes were significantly down-regulated in IBL2353 at both 12 and 24 hpi (Figure 5B), mostly belonging to the two TF families WRKY and AP2/ERF-ERF. Since these TFs specially changed in the resistant line, we speculated that they were involved in the response to Cm infection.

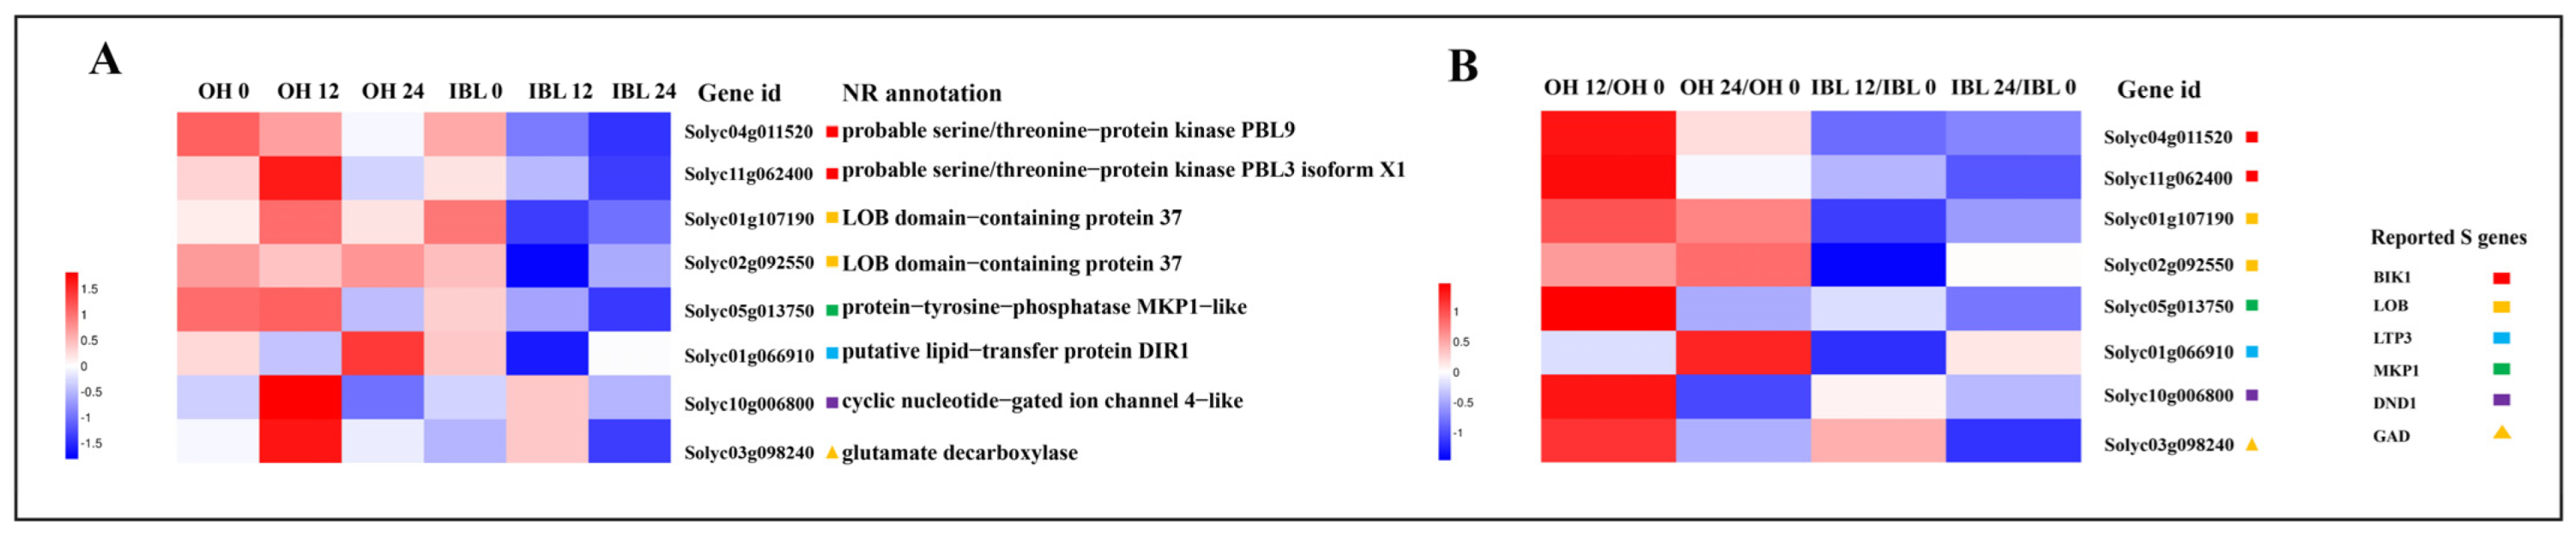
2.5. Candidate Susceptibility Genes

To screen for putative S genes in response to Cm infection, genes were compared to previously reported 28 S genes (Table S7). Based on the Log2 FC value, eight S gene homologs were retained for analysis (Figure 6A). These homologs belonged to six different S gene families, and were all induced significant up-regulation in the susceptible line (Figure 6B), including two serine/threonine-protein kinase PBL9 and PBL3 isoform X1 of BIK1 homologs, two LOB domain-containing protein 37 of LOB homologs, a protein-tyrosine-phosphatase MKP1-like of MKP1 homolog, a cyclic nucleotide-gated ion channel 4-like of DND1 homolog, and a glutamate decarboxylase of the GAD homolog. In addition, one putative lipid-transfer protein DIR1 of LTP3 homolog was significantly up-regulated at 24 hpi in the Ohio88119. The GAD homolog (Solyc03g098240) was also up-regulated in the IBL2353 but not to a significant level (Log2 FC ≥ 1).

2.6. Validation of RNA-Seq by RT-qPCR

Quantitative RT-PCR was carried out to verify the expression patterns of some candidate genes as identified through the RNA-Seq transcriptome analysis. Ten DEGs of potential interest, showing different expression patterns between the resistant and susceptible lines, were selected for validation. Eight of them were potentially related to resistance against Cm in the resistant line, which included four transcript factors bHLHs (Solyc12g036470 and Solyc06g062460), bZIP (Solyc07g062710), MYB (Solyc01g111500) and two RLKs (Solyc09g008640 and Solyc08g079740), a putative disease resistance RPP13-like protein 3 (Solyc04g009130), and an abscisic acid receptor PYL4-like (Solyc10g076410). Another two DEGs were S genes LOB domain-containing 37 (Solyc01g107190 and Solyc02g092250) induced in the susceptible line. Although there was a minor difference in the fold change of expression compared to RNA-seq, the RT-qPCR results exhibited high consistency with the RNA-Seq data and set up the reliability of transcriptome sequencing conducted in this study (Figure 7).

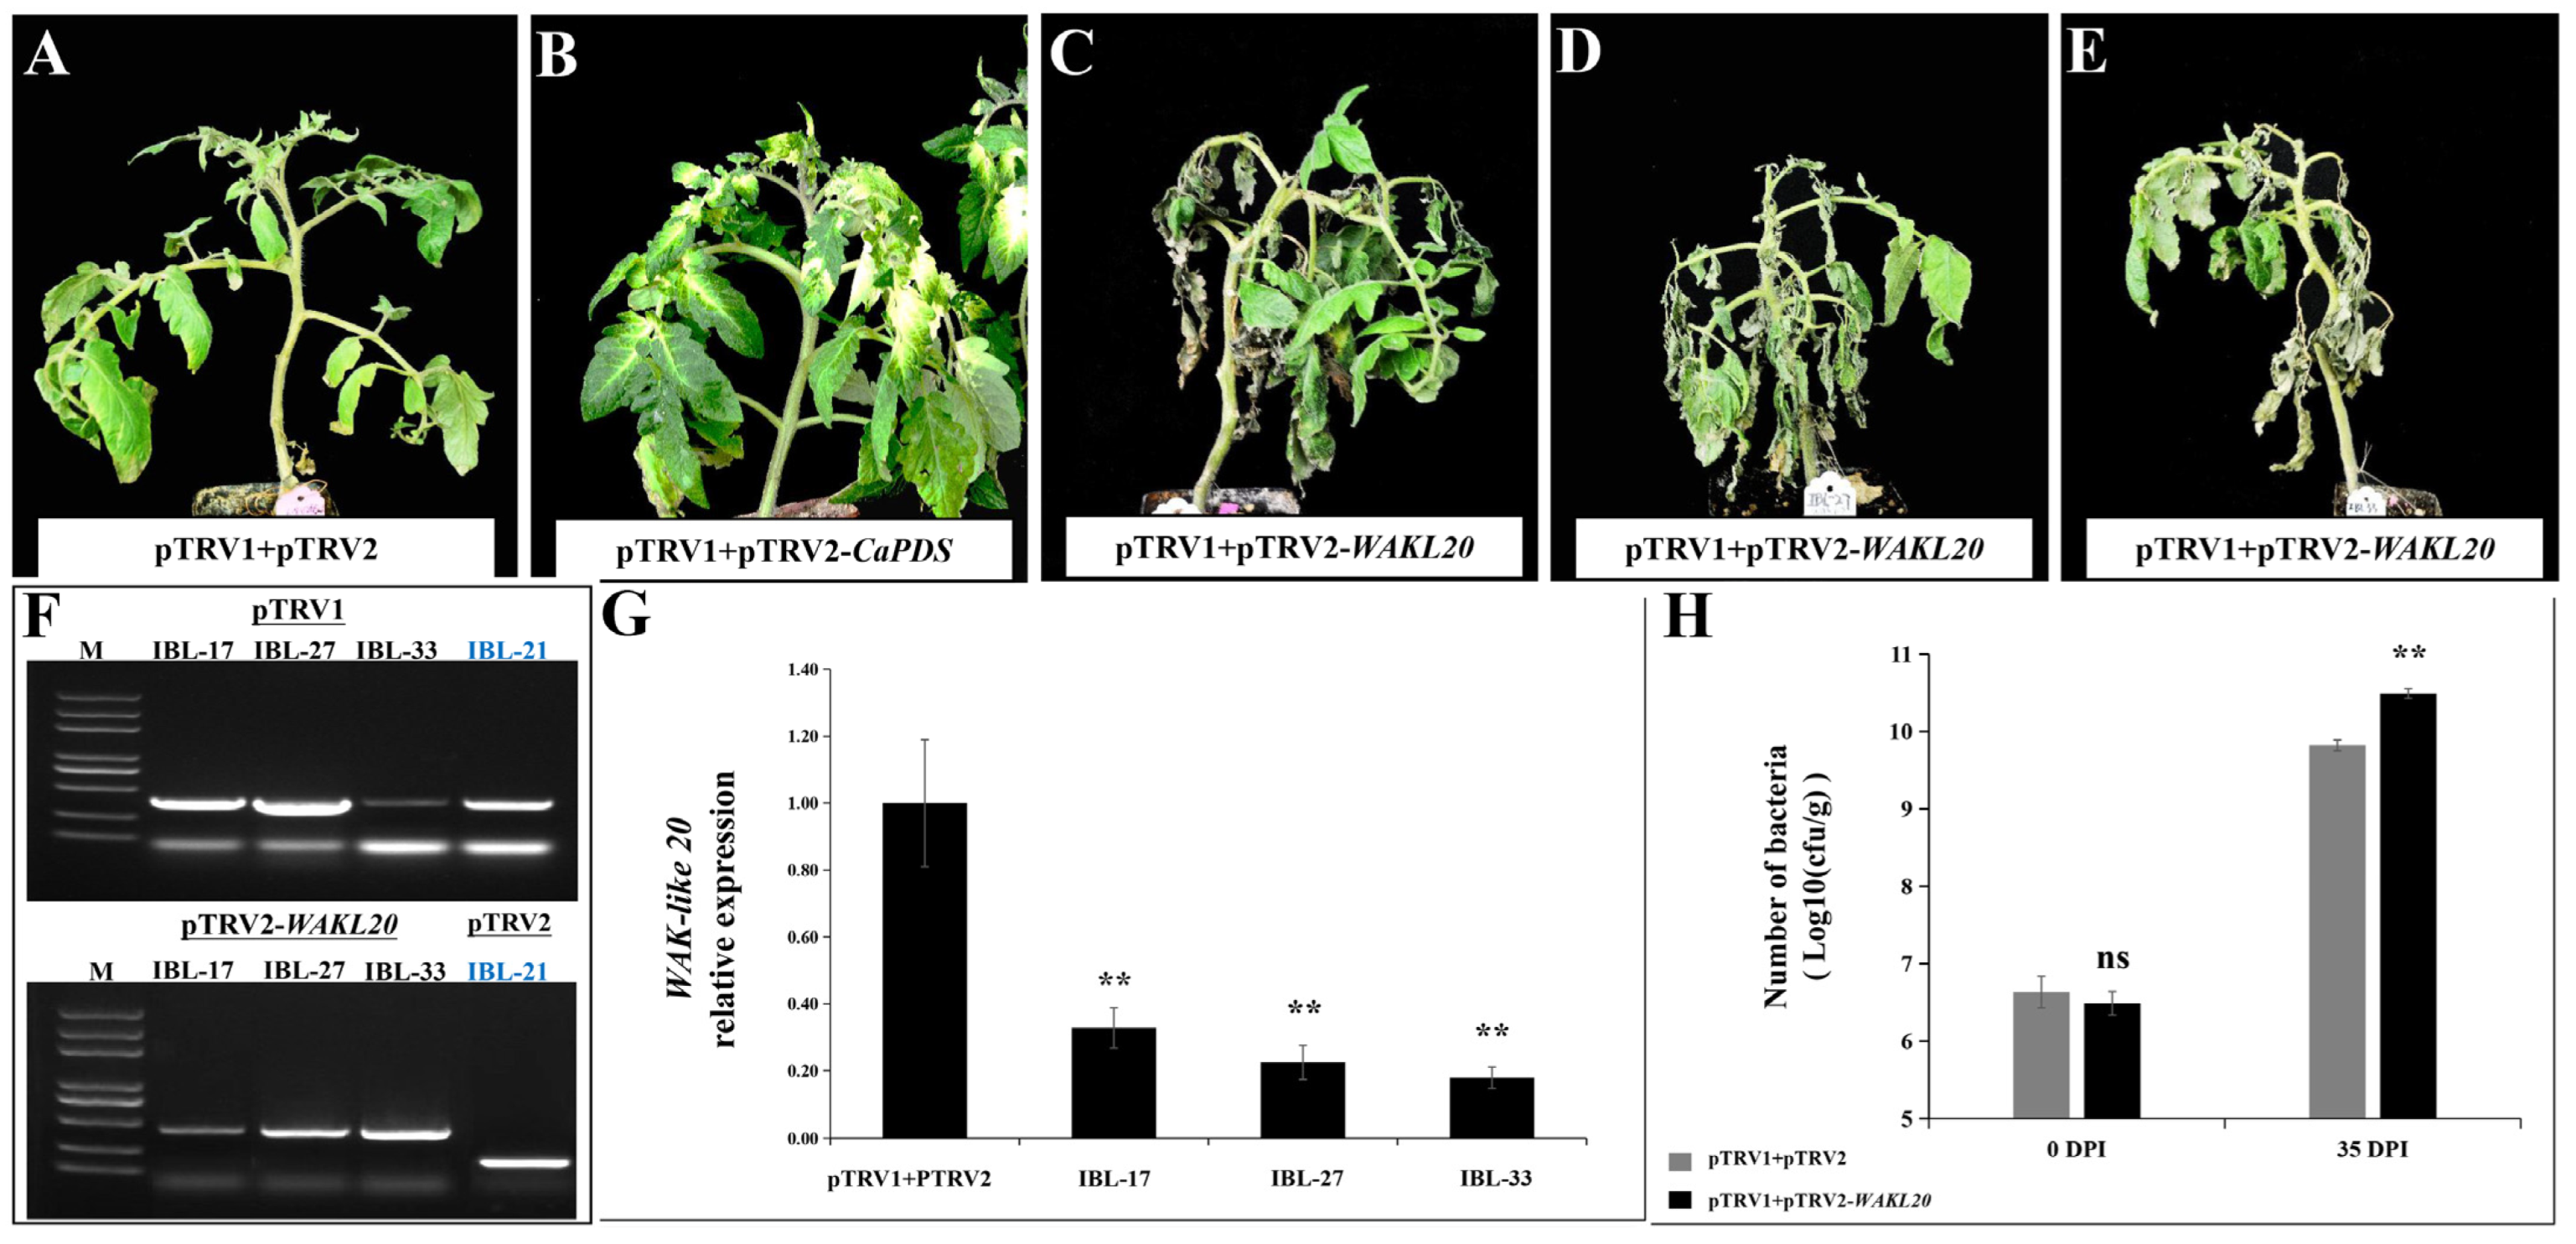
2.7. Silencing of WAKL20 Enhanced Susceptibility to Cm

Of the 25 genes associated with the defense response identified above (Figure 4), WAKL20 (Solyc09g008640) was selected for analysis because it belongs to the WAKS subfamily that plays a critical role in innate resistance to multiple pathogens in different crops [21,22,23]. RNA sequencing and RT-qPCR data show this gene is significantly up-regulated in IBL2353, but hardly changed in the susceptible line (Figure 4 and Figure 7). WAKL20 was the only member of the WAKs subfamily that was significantly induced and the expression changed in IBL2353 (Figure S2). To further explore whether WAKL20 plays a positive role in resistance to Cm infection, we performed virus-induced gene silencing (VIGS) experiments in IBL2353. The leaves of positive control CaPDS-silenced plants bleached rapidly whereas the empty vector plants stayed green (Figure 8A,B). In addition, the WAKL20-silenced plants withered upon further incubation (Figure 8C–E). As shown in Figure 8F, the bands of pTRV1 and pTRV2 can be detected in the control plant and the three silenced plants. The expression level of WAKL20 in the control plants (pTRV2) and silenced plants (pTRV1 + pTRV2-WAKL20) was identified using RT-qPCR, which showed the silence efficiency of three representative plants was 67.2%, 77.5%, and 82.1%, respectively (Figure 8G). The enhanced susceptibility to Cm of the WAKL20-silenced plants was also revealed by counting interior bacterial population in the stem, as shown by the significant increase in the Cm bacteria number compared to the control plants (Figure 8H). These results showed the silencing of WAKL20 in IBL2353 resulted in the disease susceptibility to the Cm infection.

3. Discussion

It has been more than 110 years since bacterial canker in tomato was first reported [4]. There is, as yet, no commercial variety with considerable resistance against the pathogen [3,8,12]. Up to now, S. habrochaites LA407 and S. arcanum LA2157 have been two of the most studied Cm-resistant wild accessions; the resistance-related characteristics of them have been reported [6,20,24,25,26]. The interaction of the Cm pathogen with tomato hosts was carried out with systemic infection through the vascular system, and the infection characteristics were the necrosis and cankers on the stems, unilateral or whole-plant wilting, and the petioles of the susceptible plants (Figure 1). These results suggest that there is an effective and complex immune response after Cm pathogen invasion in the resistant tomato. Thus, RNA-Seq transcriptome profiling was performed to unravel the molecular elements of this interaction. In tomato, three RNA-seq analyses detected the DEGs after Cm infection [13,14,15]. One study only used the susceptible cultivar as the sequencing object [13], and another two both used a comparative analysis between the cultivar and the wild LA2157 [14,15]. Because of a lack of a good reference genome sequence for wild LA2157, the average mapping percentages of LA2157 libraries were relatively poor: 85–90% and 77.3%, respectively [14,15]. In addition, the greater genetic background difference between the wild species and cultivars induced genetic background noise. In this study, we used one inbred backcross line, IBL2353, as the target of comparative analysis, which improved the mapping percentages (high to 95.0%) and large genetic variation with cultivars based on the high DEGs shared ratio (Figure 2). The same DEGs in the two present materials accounts for a large proportion of the total DEGs, achieving 50% and 32% at 12 hpi and 24 hpi, respectively (Figure 2C,D); therefore, the analysis and screen range of candidate genes were narrowed to a smaller gene amount.
This paper focuses on those unshared DEGs between the resistant and susceptible line. In this study, three E3 Ubiquitin-protein ligase genes (Figure 4) and two ubiquitin-protein transferase activator genes (Solyc06g072830 and Solyc08g005420) were only up-regulated in resistant IBL2353 after Cm infection (Tables S3 and S4). It is known that the Ubiquitin-26S proteasome system (UPS) is one of the critical pathways in plants controlling plant immunity [27] and regulating the accumulation of intracellular nucleotide-binding leucine-rich repeat (NB-LRR) immune receptors [28,29]. Many studies have indicated that E3 Ubiquitin Ligases play crucial roles during plant–pathogen interactions, such as thickening the cell wall, promoting the accumulation of H2O2 at the infected site [30], degrading the virulence factors of pathogens to protect host plants [31], and participating in pathogen-associated molecular PTI [32]. Additionally, in tomato, a U-box E3 ligase protein 24 (SlPUB24) has been reported as a positive regulator of bacterial spot resistance by influencing SA content, PR1 and NPR1 expression, and cell wall reinforcement to prevent bacterial migration [33]. Future research should focus on functional validation experiments to verify whether the ubiquitylation was also involved the resistant response to Cm infection in tomato.
Plants have another natural immunity system which can be termed as effector-triggered immunity (ETI). In the ETI system, the defense response is triggered via the recognition of pathogen-derived effectors by the resistant R gene products [34]. Several reported R genes or resistant-related genes were also up-regulated significantly in the resistant line, such as genes coding a probable CAF1 homolog 11 and NHL protein 6, two putative disease resistance RPP13-like protein 3, and an abscisic acid receptor PYL4-like (Figure 4). CAF1 in Solanaceae plants was positively related to pathogen resistance; for example, the overexpression of the CAF1 protein in tomato plants contributed to enhanced resistance to the pathogen Phytophthora infestans, and VIGS of CaCAF1 in pepper plants led to an enhanced susceptibility to the pepper bacterial spot pathogen Xanthomonas axonopodis pv. vesicatoria [35]. CsCAF1 deadenylase activity was also reported to contribute to citrus canker resistance, possibly by regulating the transcription or stability of susceptibility genes CsLOB1 [36]. StPOTHR1, a member of the NHL gene family, was specifically up-regulated in inoculation sites and promoted resistance against Phytophthora infestans in potato by inhibiting the rapid proliferation of pathogens [37]. RPP13 is a known resistance (R) gene, conferring resistance to wheat powdery mildew and Arabidopsis downy mildew [38,39]. The PYL4 gene is an essential upstream regulator in the ABA signaling pathway and the silencing of VvPYL4 reduced the expression of ABA and JA signaling pathway related genes and grapevine resistance to downy mildew [40]. These results provide indications that the above R genes probably play roles in the defense response to Cm infection in tomato.
TFs that directly regulate the defense-associated gene expression play an important part in plant immunity, including in tomato [6,13,41]. Here, 57 TFs specially involved in the resistance response to Cm infection and up-regulated TFs mainly belong to three categories (Figure 5A), including the R2R3-MYB, bHLH, and bZIPs. The top up-regulated type was R2R3-MYB TFs. They control a wide variety of processes, including phenylpropanoid metabolism and secondary cell wall formation [42]. MYB44 was reported to promote resistance to eggplant bacterial wilt via facilitating the expression of spermidine synthase [43], and, herein, the MYB44 (Solyc02g092930) expression increased in IBL2353 after Cm infection. Some bHLH proteins have been shown to confer resistance against various pathogens in various crops, such as improving resistance against Phytophthora sojae in Glycine max [44], improving resistance against Xanthomonas oryzae pv. oryzae in rice [45], and improving powdery mildew resistance in tobacco [46]. In citrus canker, CsbZIP40 plays a positive role in pathogen response and tolerance along with the SA signal pathway [47]. The overexpression of CabZIP1 and CabZIP2, respectively, in the transgenic Arabidopsis plants confer enhanced resistance to Pseudomonas syringae pv. tomato DC3000, and CabZIP2-silenced pepper plants are susceptible to infection by the virulent strain of X. campestris pv. Vesicatoria [48,49]. The tomato orthologues of the above-mentioned three TF families were induced by Cm infection, suggesting that the functions of these TFs in disease response are highly conserved in a wide range of plants.
TFs may also act as transcriptional repressors. WRKY and AP2/ERF-ERF were top two types of the significantly down-regulated TFs (Figure 5B). WRKYs are one of the largest families of transcriptional regulators in plants, and most WRKYs are negative regulators of plant immunity [50,51,52]. In chili pepper leaves, VIGS of CaWRKY1 resulted in the reduced growth of Xanthomonas axonopodis pv. vesicatoria race 1, whereas overexpressing transgenic plants displayed accelerated hypersensitive cell death responding to Pseudomonas syringe pv. Tabaci and tobacco mosaic virus [53]. CaWRKY40b in pepper plays a negative role in response to Ralstonia solanacearum by directly regulating defense genes [54]. Another of the top down-regulated types, AP2/ERF-ERF, is also one major TF category involved in defense pathways with critical roles in immune responses in plants [55]. In tomato, a pathogen inoculation assay revealed that SlERF84 negatively regulates the plant defense response to Pseudomonas syringae pv. tomato DC3000 [56]. Earlier studies showed that ethylene-insensitive Nr plants and ethylene synthesis mutants inoculated with Cm pathogen showed a delayed onset of disease symptoms (by several days) and less serious wilting, compared with wild-type plants in tomato [57]. These results suggested that ethylene is a major hormone signal in the response to Cm infection and regulates disease progression in the tomato hosts.
The studies on susceptibility genes were gradually increased because the inactivation of S genes could lead to obtaining durable and broad-spectrum resistance compared with the R genes in crops, and S genes are usually conserved among plant species [18,19]. In this analysis, we screened eight S gene homologs from 28 reported S genes specially regulated in the susceptible line (Figure 6, Table S7). BIK1 and LOB genes accounts for half of them. BIK1 was proposed to cause rice leaf blight disease susceptibility by interacting with the effector XopR of the Xanthomonas oryzae pv. oryzae [58]. LOB has been also verified to function in Arabidopsis Fusarium wilt susceptibility [59] and citrus bacterial canker disease susceptibility [60,61] with the involvement of JA signaling. We have been performing transient silencing experiments of LOB in the susceptible line, and found that the Ohio88119-silenced plants show less susceptibility symptoms and bacterial population in stems compared to the control plants (Y.W. unpublished data). The function of these eight S gene homologs in response to Cm infection needs to be verified by further silencing or knockout experiments in susceptible cultivars in the future.
RLKs play a critical part in PTI against diverse pathogens in plants [6,9]. Our data showed more RLKs in the resistant line induced by Cm infection than in the susceptible line, and among them, the WAK(L)s are a subfamily with a cell-wall-associated galacturonan-binding domain, which are the only known proteins to act as a direct link between the plasma membrane and the cell wall [62]. The WAK(L)s play a critical part in innate resistance to multiple pathogens through increasing cellulose and phytoalexin synthesis to bolster cell wall integrity and up-regulating specific pathogen defense genes in different crops [22,23,24]. In tomato, SlWak1 has been discovered to be essential for apoplastic immune responses to Pseudomonas syringae pv. tomato through the cooperation with Fls2/Fls3, accompanied by the regulation of callose deposition [22]. Moreover, CsWAKL08 has also been characterized to make a contribution to the resistance against bacterial canker by mediating ROS homeostasis and activating JA signaling in citrus [23]. The overexpression of the OsWAK25 gene in rice promoted resistance to the hemi-biotrophic pathogens Xanthomonas oryzae pv. oryzae (Xoo) and Magnaporthe oryzae [24]. The expression level of WAKL20 was significantly increased at 12 hpi in IBL2353 (Figure 4 and Figure 7) when combining the data of RNA-seq and RT-qPCR, and this result was consistent with the up-regulated expression of WAKL20 in the resistant line LA2157 at 8 hpi after Cm infection in a previous study [15]. In contrast, the weaker induction of WAKL20 in the susceptible line led to the compromised manifestation of the sensitive reaction. Moreover, the transient silencing of the WAKL20 gene in IBL2353 plants exhibited increased susceptibility to Cm infection (Figure 8). These results indicated that WAKL20 plays an important role against the attack of Cm in tomato and may participate in the PTI response. In future, stable genetic transformation via the knocking out or a complementary assay of WAKL20 is needed to verify further the resistant function and illuminate its resistance mechanism related to cell wall signal response.

4. Materials and Methods

4.1. Plant Materials and Pathogenic Cm Strain

The resistant line IBL2353 and the susceptible processing tomato Ohio88119 were selected for the present study. IBL2353 is a tomato line bearing the Rcm2.0 locus derived from an inbred backcross breeding program to introgress the partial resistance from LA407. The seeds were kindly provided by Dr. David M. Francis in the Department of Horticulture and Crop Science at Ohio State University. Clavibacter michiganesis pathogenic strain GS12102, an isolate collected from the Gansu Province of China, was kindly provided by Prof. Laixin Luo in the Department of Plant Pathology at China Agricultural University. It was identified as a highly pathogenic and toxic strain with toxicity testing.

4.2. Growth Conditions and Inoculation Treatments

All seeds were surface-sterilized with 75% alcohol for 1 min and 4% NaClO for 8 min, and then were sown in pots and kept under a 16 h/8 h photoperiod and 25 ± 1 °C in a growth chamber in the College of Horticulture, China Agricultural University. Bacteria of GS12102 strain stored at −80 °C were prepared in an LB agar plate to expand propagation for 48–72 h at 28 °C. Bacterial cells were gathered and the inoculum was prepared with sterile water containing 10 mM MgSO4·7H2O. The tomato seedlings grew to 5–6 true leaf stages, and were inoculated with the bacterial suspensions (3 × 10⁸ CFU/mL, OD600 = 0.5) at the stem base with a cotyledonary node, with 10 mM MgSO4·7H2O as the mock inoculation. According to our pre-experiment data and previous research results [15,63], we chose 12 h and 24 h as the time-points. The plants were sampled (true leaves adjoining the inoculation site) at 0, 12, and 24 hpi, immediately immersed in liquid nitrogen, and stored at −80 °C until RNA isolation. The plants were maintained until finishing the investigation of disease symptoms.

4.3. RNA Extraction and Library Preparation for Illumina Sequencing

Total RNA was extracted from the leaf samples in the inoculated plants with a DP432-RNAprep pure plant kit (TIANGEN, Beijing, China) in accordance with the manufacturer’s direction. The concentration and purity of RNA for sequencing were measured with NanoDrop 2000 (Thermo Fisher Scientific, Wilmington, DE, USA) and the integrity was assessed with the RNA Nano 6000 Assay Kit of the Agilent Bioanalyzer 2100 system (Agilent Technologies, Santa Clara, CA, USA). The 18 samples (9 samples of each tomato line) were sent to Biomarker Technologies Co., Ltd. in Beijing for sequencing library construction. The libraries were generated with NEBNext UltraTM RNA Library Prep Kit for Illumina (NEB, Ipswich, MA, USA) according to the manufacturer’s direction; meanwhile, index codes were augmented to attribute sequences to each sample. Different libraries were pooled according to the target amount of offline data. High-throughput sequencing was carried out using the Illumina NovaSeq 6000 platform, with 150 bp paired-end reads.

4.4. Transcriptome Data Processing

The raw reads were processed by using a bioinformatic pipeline tool, BMK Cloud (www.biocloud.net, accessed on 6 December 2022) online platform. First of all, raw reads in the fastq format were filtered to attain clean reads. Then, clean reads were mapped to the S. lycopersicum reference genome ITAG4.0 with the HISAT2 soft version 2.0.4 (http://ccb.jhu.edu/software/hisat2/index.shtml, accessed on 8 March 2022) [64], and the assembly of the transcriptome was performed with StringTie version 2.2.1 (https://ccb.jhu.edu/software/stringtie/index.shtml, accessed on 10 March 2022) [65]. Gene function annotation was on the basis of KO (KEGG Ortholog database), Nr (NCBI non-redundant protein sequences), and GO (Gene Ontology). DEGs analysis was processed through the DESeq2 program package version 1.30.1 (http://www.bioconductor.org/packages/release/bioc/html/DESeq.html, accessed on 6 December 2022). Fragments per kilobase per million (FPKM) was applied to represent the normalized expression value and is displayed in Table S8. The p values were adjusted with the Benjamini and Hochberg approach for controlling the false discovery rate. The gene expression profiles at 0 hpi were used as the baselines; genes with an FDR < 0.01 and a fold change ≥2 were considered as differentially expressed. GO enrichment analysis of the DEGs was performed using the topGO version 2.48.0 based on Wallenius noncentral hypergeometric distribution [66]. Additionally, the KOBAS software (version 2.0) was used for DEGs enrichment in the KEGG pathways [67,68]. TF prediction was performed using the software iTAK version 1.0 [69]. The heat maps were obtained with the use of the pheatmap version 1.0.12, and the raw expression data were normalized separately based on the Z-score formula: (x-mean(x))/sd(x) in the heat maps.

4.5. Gene Expression Validation with RT-qPCR Analysis

The preparation of total RNA was same as the procedure in 4.3. First-strand cDNA was synthesized with 1 μg of total RNA using HiScript® II Q RT SuperMix for qPCR kit (Vazyme Biotech Co., Ltd., Nanjing, China) in accordance with the manufacturer’s directions. Quantitative RT-PCR was performed in a 15 μL reaction with ChamQ SYBR qPCR Master Mix (Vazyme Biotech Co., Ltd.) according to the instructions. The primers are listed in Table S9. RT-qPCR was performed in 384-well plates on the 7500 real-time PCR system (Applied Biosystems, Foster City, CA, USA), with an initial denaturation step set at 95 °C for 30 s, followed by 40 cycles of denaturation and annealing at 95 °C for 10 s and 60 °C for 30 s, respectively. Relative expression values were calculated using the comparative Ct method (2−ΔΔCt) with EF-1α (Solyc06g0050600) as the reference [70].

4.6. Virus-Induced Gene Silencing (VIGS)

A VIGS system based on the tobacco rattle virus (TRV) was applied to identify the gene function [71]. The CDS fragments of WAKL20 (300 bp) and CaPDS (452 bp) were PCR-amplified with tomato cDNA and cloned into the pTRV2 vector to construct the plasmids pTRV2-WAKL20 and pTRV2-CaPDS, respectively. pTRV1, pTRV2-WAKL20, pTRV2, and pTRV2-CaPDS were then mobilized into the Agrobacterium tumefaciens strain GV3101 via electroporation. Agrobacterium tumefaciens strains containing pTRV1 were mixed with that containing pTRV2-WAKL20, pTRV,2 and pTRV2-CaPDS in equal amounts, respectively. The resuspension of mixed bacterial strains was infiltrated into the cotyledons and one true leaf in two-leaf stage seedlings via syringe infiltration. Plants infiltrated with pTRV1 + pTRV2-CaPDS and pTRV1 + pTRV2 were utilized as the positive and negative control, respectively [72]. The infiltrated plants were grown at 22 °C in 16/8 h light/dark in a culture room. When light bleaching occurred in the CaPDS-silenced plants (usually 2 weeks after inoculation), RT-PCR was performed to detect pTRV1 and pTRV2. Seedlings at the 5–6 true leaf stages were inoculated with the Cm (OD600 = 0.5), and then were maintained until 6 weeks to investigate the disease symptoms. The bacterial populations in the inoculated plants were determined using the dilution plate method [73]. The stem transection of WAKL20-silenced plants and control plants was used for testing the bacterial population at 35 dpi. The data were analyzed using the SPSS 23 software. At least 100 plants were infiltrated with pTRV1 + pTRV2-WAKL20 and at least 30 plants were injected with plasmid mixtures of each control, respectively. The whole experiment was repeated twice. The primers used here are displayed in Supplementary Table S10.

5. Conclusions

In this study, high-throughput RNA sequencing was conducted to identify C. michiganensis-responsive genes in Cm-resistant and Cm-susceptible tomato lines. Upon Cm inoculation at 12 hpi and 24 hpi, special genes with different expression patterns between the resistant and susceptible lines were identified and annotated through GO terms and KEGG pathway analysis. From these DEGs, ten defense-responsive genes were selected and further validated for their different expression changes via RT-qPCR. Meanwhile, we also screened out eight S gene homologs specially induced in the susceptible line. In the end, WAKL20 was identified to be specifically up-regulated in IBL2353 and validated as essential for the resistance response to Cm infection. Further research on other candidate genes is envisioned to expand the arsenal of candidate resistance and susceptibility genes in response to bacterial canker of tomato.

Supplementary Materials

The following supporting information can be downloaded at: https://www.mdpi.com/article/10.3390/horticulturae9020242/s1, Figure S1: Identification of DEGs in breeding line IBL2353 and S. lycopersicum cv. Ohio88119 following infection with Cm; Figure S2: Expression profiles of WAKs subfamily genes in two lines after Cm infection; Table S1: Statistics data from Illumina sequencing on two lines; Table S2: Total reads mapped to the S. lycopersicum reference genome ITAG4.0; Table S3: Enriched functional groups in biological process ontology (BP) in genes with different expression patterns between resistant and susceptible lines; Table S4: Enriched functional groups in molecular function ontology (MF) in genes with different expression patterns between resistant and susceptible lines; Table S5: Enriched functional groups in cellular component ontology (CC) in genes with different expression patterns between resistant and susceptible lines; Table S6: Enriched KEGG pathways in genes with different expression patterns between resistant and susceptible lines; Table S7: Reported susceptibility genes in different plant species; Table S8: The fragments per kilobase per million (FPKM) values for each unigene; Table S9: Primers for RT-qPCR; Table S10: Primers for VIGS vector construction and detection. References [74,75,76,77,78,79,80,81,82,83,84,85,86,87,88,89,90,91,92,93,94,95,96,97] are cited in the supplementary materials.

Author Contributions

Conceptualization, Y.W. and W.Y.; validation, S.D. and Z.L.; formal analysis, S.D.; investigation, S.D., Z.L. and X.L.; resources, Y.W.; writing—original draft preparation, S.D.; writing—review and editing, S.D. and Y.W.; supervision, Y.W.; funding acquisition, Y.W. All authors have read and agreed to the published version of the manuscript.

Funding

This research was funded by the National Natural Science Foundation of China, grant number 31501753.

Data Availability Statement

Raw and processed data are available from National Center for Biotechnology Information (NCBI) under the accession PRJNA 929084.

Acknowledgments

The authors are truly grateful to David M. Francis in the Department of Horticulture and Crop Science at Ohio State University for providing the seeds, and appreciate Laixin Luo in the Department of Plant Pathology at China Agricultural University for providing the bacterial pathogen strain GS12102.

Conflicts of Interest

The authors declare no conflict of interest.

References

  1. Li, X.; Tambong, J.; Yuan, K.X.; Chen, W.; Xu, H.; Lévesque, C.A.; De Boer, S.H. Re-classification of Clavibacter michiganensis subspecies on the basis of whole-genome and multi-locus sequence analyses. Int. J. Syst. Evol. Micr. 2018, 68, 234–240. [Google Scholar] [CrossRef] [PubMed]
  2. Peritore-Galve, F.C.; Tancos, M.A.; Smart, C.D. Bacterial canker of tomato: Revisiting a global and economically damaging seedborne pathogen. Plant Dis. 2021, 105, 1581–1595. [Google Scholar] [CrossRef] [PubMed]
  3. Wang, Y.; Deng, S.; Li, Z.; Yang, W. Advances in the characterization of the mechanism underlying bacterial canker development and tomato plant resistance. Horticulturae 2022, 8, 209. [Google Scholar] [CrossRef]
  4. Smith, E.F. A new tomato disease of economic importance. Science 1910, 31, 794–796. [Google Scholar]
  5. EPPO. Distribution of Clavibacter michiganesis subsp. michiganesis. 2016. Available online: https://gd.eppo.int/taxon/CORBMI/distribution (accessed on 11 October 2022).
  6. Wang, Y.; Zhang, Y.; Gao, Z.; Yang, W. Breeding for resistance to tomato bacterial diseases in China: Challenges and prospects. Hortic. Plant J. 2018, 4, 193–207. [Google Scholar] [CrossRef]
  7. Chalupowicz, L.; Zellermann, E.M.; Fluegel, M.; Dror, O.; Eichenlaub, R.; Gartemann, K.H.; Savidor, A.; Sessa, G.; Iraki, N.; Barash, I.; et al. Colonization and movement of GFP-labeled Clavibacter michiganensis subsp. michiganensis during tomato infection. Phytopathology 2012, 102, 23–31. [Google Scholar] [CrossRef]
  8. Sen, Y.; Feng, Z.; Vandenbroucke, H.; van der Wolf, J.; Visser, R.G.F.; van Heusden, A.W. Screening for new sources of resistance to Clavibacter michiganensis subsp. michiganensis (Cmm) in tomato. Euphytica 2013, 190, 309–317. [Google Scholar] [CrossRef]
  9. Carlton, W.M.; Braun, E.J.; Gleason, M.L. Ingress of Clavibacter michiganensis subsp. michiganensis into tomato leaves through hydathodes. Phytopathology 1998, 88, 525–529. [Google Scholar] [CrossRef]
  10. Xu, X.; Rajashekara, G.; Paul, P.A.; Miller, S.A. Colonization of tomato seedlings by bioluminescent Clavibacter michiganensis subsp. michiganensis under different humidity regimes. Phytopathology 2012, 102, 177–184. [Google Scholar] [CrossRef]
  11. Medina-Mora, C.M.; Hausbeck, M.K.; Fulbright, D.W. Bird‘s eye lesions of tomato fruit produced by aerosol and direct application of Clavibacter michiganensis subsp. michiganensis. Plant Dis. 2001, 85, 88–91. [Google Scholar] [CrossRef]
  12. Francis, D.M.; Kabelka, E.; Bell, J.; Franchino, B.; St, C.D. Resistance to bacterial canker in tomato (Lycopersicon hirsutum LA407) and its Progeny Derived from Crosses to L. esculentum. Plant Dis. 2001, 85, 1171–1176. [Google Scholar] [CrossRef] [PubMed] [Green Version]
  13. Yokotani, N.; Hasegawa, Y.; Sato, M.; Hirakawa, H.; Kouzai, Y.; Nishizawa, Y.; Yamamoto, E.; Naito, Y.; Isobe, S. Transcriptome analysis of Clavibacter michiganensis subsp. michiganensis-infected tomatoes: A role of salicylic acid in the host response. BMC Plant Biol. 2021, 21, 476. [Google Scholar] [CrossRef] [PubMed]
  14. Basim, H.; Basim, E.; Tombuloglu, H.; Unver, T. Comparative transcriptome analysis of resistant and cultivated tomato lines in response to Clavibacter michiganensis subsp. michiganensis. Genomics 2021, 113, 2455–2467. [Google Scholar] [CrossRef] [PubMed]
  15. Pereyra-Bistraín, L.I.; Ovando-Vázquez, C.; Rougon-Cardoso, A.; Alpuche-Solís, Á.G. Comparative RNA-Seq analysis reveals potentially resistance-related genes in response to bacterial canker of tomato. Genes 2021, 12, 1745. [Google Scholar] [CrossRef] [PubMed]
  16. Savidor, A.; Teper, D.; Gartemann, K.; Eichenlaub, R.; Chalupowicz, L.; Manulis-Sasson, S.; Barash, I.; Tews, H.; Mayer, K.; Giannone, R.J.; et al. The Clavibacter michiganensis subsp. michiganensis-tomato interactome reveals the perception of pathogen by the host and suggests mechanisms of infection. J. Proteome Res. 2012, 11, 736–750. [Google Scholar] [CrossRef] [PubMed]
  17. Kourelis, J.; van der Hoorn, R.A.L. Defended to the Nines: 25 Years of resistance gene cloning identifies nine mechanisms for R protein function. Plant Cell 2018, 30, 285–299. [Google Scholar] [CrossRef]
  18. Pavan, S.; Jacobsen, E.; Visser, R.G.F.; Bai, Y. Loss of susceptibility as a novel breeding strategy for durable and broad-spectrum resistance. Mol. Breed. 2010, 25, 1–12. [Google Scholar] [CrossRef]
  19. Koseoglou, E.; van der Wolf, J.M.; Visser, R.G.F.; Bai, Y. Susceptibility reversed: Modified plant susceptibility genes for resistance to bacteria. Trends Plant Sci. 2022, 27, 69–79. [Google Scholar] [CrossRef]
  20. Kabelka, E.; Franchino, B.; Francis, D.M. Two Loci from Lycopersicon hirsutum LA407 confer resistance to strains of Clavibacter michiganensis subsp. michiganensis. Phytopathology 2002, 92, 504–510. [Google Scholar] [CrossRef]
  21. Zhang, N.; Pombo, M.A.; Rosli, H.G.; Martin, G.B. Tomato wall-Associated kinase SlWak1 depends on Fls2/Fls3 to promote apoplastic immune responses to Pseudomonas syringae. Plant Physiol. 2020, 183, 1869–1882. [Google Scholar] [CrossRef]
  22. Li, Q.; Hu, A.; Qi, J.; Dou, W.; Qin, X.; Zou, X.; Xu, L.; Chen, S.; He, Y. CsWAKL08, a pathogen-induced wall-associated receptor-like kinase in sweet orange, confers resistance to citrus bacterial canker via ROS control and JA signaling. Hortic. Res. 2020, 7, 42. [Google Scholar] [CrossRef] [PubMed] [Green Version]
  23. Harkenrider, M.; Sharma, R.; De Vleesschauwer, D.; Tsao, L.; Zhang, X.; Chern, M.; Canlas, P.; Zuo, S.; Ronald, P.C. Overexpression of rice wall-associated kinase 25 (OsWAK25) alters resistance to bacterial and fungal pathogens. PLoS ONE 2016, 11, e147310. [Google Scholar] [CrossRef] [PubMed]
  24. Sen, Y.; van der Wolf, J.; Visser, R.G.F.; van Heusden, S. Bacterial canker of tomato: Current knowledge of detection, management, resistance, and interactions. Plant Dis. 2015, 99, 4–13. [Google Scholar] [CrossRef] [PubMed]
  25. Coaker, G.L.; Francis, D.M. Mapping, genetic effects, and epistatic interaction of two bacterial canker resistance QTLs from Lycopersicon hirsutum. Theor. Appl. Genet. 2004, 108, 1047–1055. [Google Scholar] [CrossRef]
  26. Heusden, A.W.V.; Koornneef, M.; Voorrips, R.E.; Bruggemann, W.; Pet, G.; Vrielink-van Ginkel, R.; Chen, X.; Lindhout, P. Three QTLs from Lycopersicon peruvianum confer a high level of resistance to Clavibacter michiganensis ssp. michiganensis. Theor. Appl. Genet. 1999, 99, 1068–1074. [Google Scholar] [CrossRef]
  27. Ramachandran, P.; Joshi, B.J.; Maupin-Furlow, J.A.; Uthandi, S. Bacterial effectors mimicking ubiquitin-proteasome pathway tweak plant immunity. Microbiol. Res. 2021, 250, 126810. [Google Scholar] [CrossRef]
  28. Furlan, G.; Klinkenberg, J.; Trujillo, M. Regulation of plant immune receptors by ubiquitination. Front. Plant Sci. 2012, 3, 238. [Google Scholar] [CrossRef]
  29. Guerra, D.D.; Callis, J. Ubiquitin on the move: The ubiquitin modification system plays diverse roles in the regulation of endoplasmic reticulum- and plasma membrane-localized proteins. Plant Physiol. 2012, 160, 56–64. [Google Scholar] [CrossRef]
  30. Li, W.; Zhong, S.; Li, G.; Li, Q.; Mao, B.; Deng, Y.; Zhang, H.; Zeng, L.; Song, F.; He, Z. Rice RING protein OsBBI1 with E3 ligase activity confers broad-spectrum resistance against Magnaporthe oryzae by modifying the cell wall defense. Cell Res. 2011, 21, 835–848. [Google Scholar] [CrossRef]
  31. Liu, L.; Jin, L.; Huang, X.; Geng, Y.; Li, F.; Qin, Q.; Wang, R.; Ji, S.; Zhao, S.; Xie, Q.I.; et al. OsRFPH2-10, a RING-H2 Finger E3 Ubiquitin Ligase, is involved in rice antiviral defense in the early stages of rice dwarf virus infection. Mol. Plant 2014, 7, 1057–1060. [Google Scholar]
  32. Ishikawa, K.; Yamaguchi, K.; Sakamoto, K.; Yoshimura, S.; Inoue, K.; Tsuge, S.; Kojima, C.; Kawasaki, T. Bacterial effector modulation of host E3 ligase activity suppresses PAMP-triggered immunity in rice. Nat. Commun. 2014, 5, 5430. [Google Scholar] [CrossRef] [PubMed]
  33. Liu, X.; Meng, G.; Wang, M.; Qian, Z.; Zhang, Y.; Yang, W. Tomato SlPUB24 enhances resistance to Xanthomonas euvesicatoria pv. perforans race T3. Hortic. Res. 2021, 8, 30. [Google Scholar] [CrossRef]
  34. Schwessinger, B.; Ronald, P.C. Plant innate immunity: Perception of conserved microbial signatures. Annu. Rev. Plant Biol. 2012, 63, 451–482. [Google Scholar] [CrossRef] [PubMed]
  35. Sarowar, S.; Oh, H.W.; Cho, H.S.; Baek, K.; Seong, E.S.; Joung, Y.H.; Choi, G.J.; Lee, S.; Choi, D. Capsicum annuum CCR4-associated factor CaCAF1 is necessary for plant development and defence response. Plant J. 2007, 51, 792–802. [Google Scholar] [CrossRef] [PubMed]
  36. Shimo, H.M.; Terassi, C.; Lima Silva, C.C.; Zanella, J.D.L.; Mercaldi, G.F.; Rocco, S.A.; Benedetti, C.E. Role of the Citrus sinensis RNA deadenylase CsCAF1 in citrus canker resistance. Mol. Plant Pathol. 2019, 20, 1105–1118. [Google Scholar] [CrossRef]
  37. Chen, Q.; Tian, Z.; Jiang, R.; Zheng, X.; Xie, C.; Liu, J. StPOTHR1, a NDR1/HIN1-like gene in Solanum tuberosum, enhances resistance against Phytophthora infestans. Biochem. Biophys. Res. Commun. 2018, 496, 1155–1161. [Google Scholar] [CrossRef]
  38. Liu, X.; Zhang, C.; Zhang, L.; Huang, J.; Dang, C.; Xie, C.; Wang, Z. TaRPP13-3, a CC-NBS-LRR-like gene located on chr 7D, promotes disease resistance to wheat powdery mildew in Brock. J. Phytopathol. 2020, 168, 688–699. [Google Scholar] [CrossRef]
  39. Bittner-Eddy, P.D.; Crute, I.R.; Holub, E.B.; Beynon, J.L. RPP13 is a simple locus in Arabidopsis thaliana for alleles that specify downy mildew resistance to different avirulence determinants in Peronospora parasitica. Plant J. 2000, 21, 177–188. [Google Scholar] [CrossRef]
  40. Liu, L.; Liu, C.; Wang, H.; Yu, S.; Guan, T.; Huang, Y.; Li, R. The abscisic acid receptor gene VvPYL4 positively regulates grapevine resistance to Plasmopara viticola. Plant Cell Tissue Organ Culture 2020, 142, 483–492. [Google Scholar] [CrossRef]
  41. Campos, M.D.; Félix, M.D.R.; Patanita, M.; Materatski, P.; Albuquerque, A.; Ribeiro, J.A.; Varanda, C. Defense strategies: The role of transcription factors in tomato–pathogen interaction. Biology 2022, 11, 235. [Google Scholar] [CrossRef]
  42. Soler, M.; Camargo, E.L.; Carocha, V.; Cassan-Wang, H.; San, C.H.; Savelli, B.; Hefer, C.A.; Paiva, J.A.; Myburg, A.A.; Grima-Pettenati, J. The Eucalyptus grandis R2R3-MYB transcription factor family: Evidence for woody growth-related evolution and function. New Phytol 2015, 206, 1364–1377. [Google Scholar] [CrossRef] [PubMed]
  43. Qiu, Z.; Yan, S.; Xia, B.; Jiang, J.; Yu, B.; Lei, J.; Chen, C.; Chen, L.; Yang, Y.; Wang, Y.; et al. The eggplant transcription factor MYB44 enhances resistance to bacterial wilt by activating the expression of spermidine synthase. J. Exp. Bot. 2019, 70, 5343–5354. [Google Scholar] [CrossRef] [PubMed]
  44. Cheng, Q.; Dong, L.; Gao, T.; Liu, T.; Li, N.; Wang, L.; Chang, X.; Wu, J.; Xu, P.; Zhang, S. The bHLH transcription factor GmPIB1 facilitates resistance to Phytophthora sojae in Glycine max. J. Exp. Bot. 2018, 69, 2527–2541. [Google Scholar] [CrossRef]
  45. Onohata, T.; Gomi, K. Overexpression of jasmonate-responsive OsbHLH034 in rice results in the induction of bacterial blight resistance via an increase in lignin biosynthesis. Plant Cell Rep. 2020, 39, 1175–1184. [Google Scholar] [CrossRef] [PubMed]
  46. Guo, W.; Chen, B.; Guo, Y.; Chen, X.; Li, Q.; Yang, H.; Li, X.; Zhou, J.; Wang, G. Expression of pumpkin CmbHLH87 gene improves powdery mildew resistance in Tobacco. Front. Plant Sci. 2020, 11, 163. [Google Scholar] [CrossRef]
  47. Li, Q.; Jia, R.; Dou, W.; Qi, J.; Qin, X.; Fu, Y.; He, Y.; Chen, S. CsBZIP40, a BZIP transcription factor in sweet orange, plays a positive regulatory role in citrus bacterial canker response and tolerance. PLoS ONE 2019, 14, e223498. [Google Scholar] [CrossRef]
  48. Lim, C.W.; Baek, W.; Lim, S.; Han, S.; Lee, S.C. Expression and functional roles of the pepper pathogen–induced bZIP transcription factor CabZIP2 in enhanced disease resistance to bacterial pathogen infection. Mol. Plant Microbe Interact. 2015, 28, 825–833. [Google Scholar] [CrossRef]
  49. Lee, S.C.; Choi, H.W.; Hwang, I.S.; Choi, D.S.; Hwang, B.K. Functional roles of the pepper pathogen-induced bZIP transcription factor, CAbZIP1, in enhanced resistance to pathogen infection and environmental stresses. Planta 2006, 224, 1209–1225. [Google Scholar] [CrossRef] [PubMed]
  50. Kim, K.; Lai, Z.; Fan, B.; Chen, Z. Arabidopsis WRKY38 and WRKY62 transcription factors interact with histone deacetylase 19 in basal defense. Plant Cell 2008, 20, 2357–2371. [Google Scholar] [CrossRef] [PubMed]
  51. Xing, D.; Lai, Z.; Zheng, Z.; Vinod, K.M.; Fan, B.; Chen, Z. Stress- and pathogen-induced Arabidopsis WRKY48 is a transcriptional activator that represses plant basal defense. Mol. Plant 2008, 1, 459–470. [Google Scholar] [CrossRef]
  52. Wani, S.H.; Anand, S.; Singh, B.; Bohra, A.; Joshi, R. WRKY transcription factors and plant defense responses: Latest discoveries and future prospects. Plant Cell Rep. 2021, 40, 1071–1085. [Google Scholar] [CrossRef] [PubMed]
  53. Oh, S.K.; Baek, K.H.; Park, J.M.; Yi, S.Y.; Yu, S.H.; Kamoun, S.; Choi, D. Capsicum annuum WRKY protein CaWRKY1 is a negative regulator of pathogen defense. New Phytol. 2008, 177, 977–989. [Google Scholar] [CrossRef] [PubMed]
  54. Ifnan Khan, M.; Zhang, Y.; Liu, Z.; Hu, J.; Liu, C.; Yang, S.; Hussain, A.; Furqan Ashraf, M.; Noman, A.; Shen, L.; et al. CaWRKY40b in pepper acts as a negative regulator in response to Ralstonia solanacearum by directly modulating defense genes including CaWRKY40. Int. J. Mol. Sci. 2018, 19, 1403. [Google Scholar] [CrossRef]
  55. Gu, C.; Guo, Z.; Hao, P.; Wang, G.; Jin, Z.; Zhang, S. Multiple regulatory roles of AP2/ERF transcription factor in angiosperm. Bot. Stud. 2017, 58, 6. [Google Scholar] [CrossRef] [PubMed]
  56. Li, Z.; Tian, Y.; Xu, J.; Fu, X.; Gao, J.; Wang, B.; Han, H.; Wang, L.; Peng, R.; Yao, Q. A tomato ERF transcription factor, SlERF84, confers enhanced tolerance to drought and salt stress but negatively regulates immunity against Pseudomonas syringae pv. tomato DC3000. Plant Physiol. Biochem. 2018, 132, 683–695. [Google Scholar] [CrossRef]
  57. Balaji, V.; Mayrose, M.; Sherf, O.; Jacob-Hirsch, J.; Eichenlaub, R.; Iraki, N.; Manulis-Sasson, S.; Rechavi, G.; Barash, I.; Sessa, G. Tomato transcriptional changes in response to Clavibacter michiganensis subsp. michiganensis reveal a role for ethylene in disease development. Plant Physiol. 2008, 146, 1797–1809. [Google Scholar] [CrossRef]
  58. Wang, S.; Sun, J.; Fan, F.; Tan, Z.; Zou, Y.; Lu, D. A Xanthomonas oryzae pv. oryzae effector, XopR, associates with receptor-like cytoplasmic kinases and suppresses PAMP-triggered stomatal closure. Sci. China Life Sci. 2016, 59, 897–905. [Google Scholar] [CrossRef]
  59. Thatcher, L.F.; Powell, J.J.; Aitken, E.A.B.; Kazan, K.; Manners, J.M. The Lateral organ boundaries domain transcription factor LBD20 functions in fusarium wilt susceptibility and jasmonate signaling in Arabidopsis. Plant Physiol. 2012, 160, 407–418. [Google Scholar] [CrossRef]
  60. Hu, Y.; Zhang, J.; Jia, H.; Sosso, D.; Li, T.; Frommer, W.B.; Yang, B.; White, F.F.; Wang, N.; Jones, J.B. Lateral organ boundaries 1 is a disease susceptibility gene for citrus bacterial canker disease. Proc. Natl. Acad. Sci. USA 2014, 111, 521–529. [Google Scholar] [CrossRef]
  61. Jia, H.; Zhang, Y.; Orbović, V.; Xu, J.; White, F.F.; Jones, J.B.; Wang, N. Genome editing of the disease susceptibility gene CsLOB1 in citrus confers resistance to citrus canker. Plant Biotechnol. J. 2017, 15, 817–823. [Google Scholar] [CrossRef]
  62. Kanneganti, V.; Gupta, A.K. Wall associated kinases from plants—An overview. Physiol. Mol. Biol. Plants 2008, 14, 109–118. [Google Scholar] [CrossRef]
  63. Coaker, G.L.; Willard, B.; Kinter, M.; Stockinger, E.J.; Francis, D.M. Proteomic analysis of resistance mediated by Rcm 2.0 and Rcm 5.1, two Loci controlling resistance to bacterial canker of tomato. Mol. Plant Microbe Interact. 2004, 17, 1019–1028. [Google Scholar] [CrossRef] [PubMed] [Green Version]
  64. Kim, D.; Langmead, B.; Salzberg, S.L. HISAT: A fast spliced aligner with low memory requirements. Nat. Methods 2015, 12, 357–360. [Google Scholar] [CrossRef] [PubMed]
  65. Pertea, M.; Pertea, G.M.; Antonescu, C.M.; Chang, T.; Mendell, J.T.; Salzberg, S.L. String Tie enables improved reconstruction of a transcriptome from RNA-seq reads. Nat. Biotechnol. 2015, 33, 290–295. [Google Scholar] [CrossRef] [PubMed]
  66. Young, M.D.; Wakefield, M.J.; Smyth, G.K.; Oshlack, A. Gene ontology analysis for RNA-seq: Accounting for selection bias. Genome Biol. 2010, 11, R14. [Google Scholar] [CrossRef] [PubMed]
  67. Mao, X.; Cai, T.; Olyarchuk, J.G.; Wei, L. Automated genome annotation and pathway identification using the KEGG Orthology (KO) as a controlled vocabulary. Bioinformatics 2005, 21, 3787–3793. [Google Scholar] [CrossRef]
  68. Kanehisa, M.; Araki, M.; Goto, S.; Hattori, M.; Hirakawa, M.; Itoh, M.; Katayama, T.; Kawashima, S.; Okuda, S.; Tokimatsu, T.; et al. KEGG for linking genomes to life and the environment. Nucleic Acids Res. 2007, 36, 480–484. [Google Scholar] [CrossRef]
  69. Zheng, Y.; Jiao, C.; Sun, H.; Rosli, H.G.; Pombo, M.A.; Zhang, P.; Banf, M.; Dai, X.; Martin, G.B.; Giovannoni, J.J.; et al. iTAK: A program for genome-wide prediction and classification of plant transcription factors, transcriptional regulators, and protein kinases. Mol. Plant 2016, 9, 1667–1670. [Google Scholar] [CrossRef]
  70. Pfaffl, M.W. A new mathematical model for relative quantification in real-time RT-PCR. Nucleic Acids Res. 2001, 29, e45. [Google Scholar] [CrossRef]
  71. Liu, Y.; Schiff, M.; Dinesh-Kumar, S.P. Virus-induced gene silencing in tomato. Plant J. 2002, 31, 777–786. [Google Scholar] [CrossRef]
  72. Guo, J.; Liu, C.; Wang, P.; Cheng, Q.; Sun, L.; Yang, W.; Shen, H. The Aborted Microspores (AMS)-Like gene is required for anther and microspore development in pepper (Capsicum annuum L.). Int. J. Mol. Sci. 2018, 19, 1341. [Google Scholar] [CrossRef] [PubMed]
  73. Yang, W.; Sacks, E.J.; Lewis Ivey, M.L.; Miller, S.A.; Francis, D.M. Resistance in Lycopersicon esculentum intraspecific crosses to race T1 strains of Xanthomonas campestris pv. vesicatoria causing bacterial spot of tomato. Phytopathology 2005, 95, 519–527. [Google Scholar] [CrossRef] [PubMed] [Green Version]
  74. Pathuri, I.P.; Reitberger, I.E.; Huckelhoven, R.; Proels, R.K. Alcohol dehydrogenase 1 of barley modulates susceptibility to the parasitic fungus Blumeria graminis f.sp. hordei. J. Exp. Bot. 2011, 62, 3449–3457. [Google Scholar] [CrossRef] [PubMed]
  75. Ma, C.; Liu, Y.; Bai, B.; Han, Z.; Tang, J.; Zhang, H.; Yaghmaiean, H.; Zhang, Y.; Chai, J. Structural basis for BIR1-mediated negative regulation of plant immunity. Cell Res. 2017, 27, 1521–1524. [Google Scholar] [CrossRef] [PubMed]
  76. Chang, Y.; Bai, Y.; Wei, Y.; Shi, H. CAMTA3 negatively regulates disease resistance through modulating immune response and extensive transcriptional reprogramming in cassava. Tree Physiol. 2020, 40, 1520–1533. [Google Scholar] [CrossRef] [PubMed]
  77. Thomazella, D.P.D.T.; Seong, K.; Mackelprang, R.; Dahlbeck, D.; Geng, Y.; Gill, U.S.; Qi, T.; Pham, J.; Giuseppe, P.; Lee, C.Y.; et al. Loss of function of a DMR6 ortholog in tomato confers broad-spectrum disease resistance. Proc. Natl. Acad. Sci. USA 2021, 118, e2026152118. [Google Scholar] [CrossRef]
  78. Sun, K.; Wolters, A.A.; Loonen, A.E.H.M.; Huibers, R.P.; van der Vlugt, R.; Goverse, A.; Jacobsen, E.; Visser, R.G.F.; Bai, Y. Down-regulation of Arabidopsis DND1 orthologs in potato and tomato leads to broad-spectrum resistance to late blight and powdery mildew. Transgenic Res. 2016, 25, 123–138. [Google Scholar] [CrossRef]
  79. Zhang, Y.; Bai, Y.; Wu, G.; Zou, S.; Chen, Y.; Gao, C.; Tang, D. Simultaneous modification of three homoeologs of TaEDR1 by genome editing enhances powdery mildew resistance in wheat. Plant J. 2017, 91, 714–724. [Google Scholar] [CrossRef]
  80. Chen, H.; Xue, L.; Chintamanani, S.; Germain, H.; Lin, H.; Cui, H.; Cai, R.; Zuo, J.; Tang, X.; Li, X.; et al. ETHYLENE INSENSITIVE3 and ETHYLENE INSENSITIVE3-LIKE1 repress SALICYLIC ACID INDUCTION DEFICIENT2 expression to negatively regulate plant innate immunity in Arabidopsis. Plant Cell 2009, 21, 2527–2540. [Google Scholar] [CrossRef]
  81. Anderson, J.C.; Wan, Y.; Kim, Y.; Pasa-Tolic, L.; Metz, T.O.; Peck, S.C. Decreased abundance of type III secretion system-inducing signals in Arabidopsis mkp1 enhances resistance against Pseudomonas syringae. Proc. Natl. Acad. Sci. USA 2014, 111, 6846–6851. [Google Scholar] [CrossRef]
  82. La Camera, S.; Geoffroy, P.; Samaha, H.; Ndiaye, A.; Rahim, G.; Legrand, M.; Heitz, T. A pathogen-inducible patatin-like lipid acyl hydrolase facilitates fungal and bacterial host colonization in Arabidopsis. Plant J. 2005, 44, 810–825. [Google Scholar] [CrossRef] [PubMed]
  83. Vogel, J.P.; Raab, T.K.; Somerville, C.R.; Somerville, S.C. Mutations in PMR5 result in powdery mildew resistance and altered cell wall composition. Plant J. 2004, 40, 968–978. [Google Scholar] [CrossRef] [PubMed]
  84. Huibers, R.P.; Loonen, A.E.; Gao, D.; Van den Ackerveken, G.; Visser, R.G.; Bai, Y. Powdery mildew resistance in tomato by impairment of SlPMR4 and SlDMR1. PLoS ONE 2013, 8, e67467. [Google Scholar] [CrossRef]
  85. Curtis, R.H.C.; Pankaj; Powers, S.J.; Napier, J.; Matthes, M.C. The Arabidopsis F-box/Kelch-repeat protein At2g44130 Is upregulated in giant cells and promotes nematode susceptibility. Mol. Plant Microbe Interact. 2013, 26, 36–43. [Google Scholar] [CrossRef] [PubMed]
  86. Peng, Z.; Hu, Y.; Zhang, J.; Huguet-Tapia, J.C.; Block, A.K.; Park, S.; Sapkota, S.; Liu, Z.; Liu, S.; White, F.F. Xanthomonas translucens commandeers the host rate-limiting step in ABA biosynthesis for disease susceptibility. Proc. Natl. Acad. Sci. USA 2019, 116, 20938–20946. [Google Scholar] [CrossRef]
  87. Liu, L.; Wang, Y.; Cui, F.; Fang, A.; Wang, S.; Wang, J.; Wei, C.; Li, S.; Sun, W. The type III effector AvrXccB in Xanthomonas campestris pv. campestris targets putative methyltransferases and suppresses innate immunity in Arabidopsis. Mol. Plant Pathol. 2017, 18, 768–782. [Google Scholar] [CrossRef]
  88. Campa, M.; Piazza, S.; Righetti, L.; Oh, C.; Conterno, L.; Borejsza-Wysocka, E.; Nagamangala, K.C.; Beer, S.V.; Aldwinckle, H.S.; Malnoy, M. HIPM is a susceptibility gene of Malus spp.: Reduced expression reduces susceptibility to Erwinia amylovora. Mol. Plant Microbe Interact. 2019, 32, 167–175. [Google Scholar] [CrossRef]
  89. Cohn, M.; Bart, R.S.; Shybut, M.; Dahlbeck, D.; Gomez, M.; Morbitzer, R.; Hou, B.; Frommer, W.B.; Lahaye, T.; Staskawicz, B.J. Xanthomonas axonopodis Virulence is promoted by a transcription activator-like effector-mediated induction of a SWEET sugar transporter in Cassava. Mol. Plant Microbe Interact. 2014, 27, 1186–1198. [Google Scholar] [CrossRef]
  90. Li, P.; Zhang, L.; Mo, X.; Ji, H.; Bian, H.; Hu, Y.; Majid, T.; Long, J.; Pang, H.; Tao, Y.; et al. Rice aquaporin PIP1;3 and harpin Hpa1 of bacterial blight pathogen cooperate in a type III effector translocation. J. Exp. Bot. 2019, 70, 3057–3073. [Google Scholar] [CrossRef]
  91. Hui, S.; Shi, Y.; Tian, J.; Wang, L.; Li, Y.; Wang, S.; Yuan, M. TALE-carrying bacterial pathogens trap host nuclear import receptors for facilitation of infection of rice. Mol. Plant Pathol. 2019, 20, 519–532. [Google Scholar] [CrossRef]
  92. Zhang, D.; Tian, C.; Yin, K.; Wang, W.; Qiu, J. Postinvasive bacterial resistance conferred by open stomata in Rice. Mol. Plant Microbe Interact. 2019, 32, 255–266. [Google Scholar] [CrossRef] [PubMed]
  93. Gao, S.; Guo, W.; Feng, W.; Liu, L.; Song, X.; Chen, J.; Hou, W.; Zhu, H.; Tang, S.; Hu, J. LTP3 contributes to disease susceptibility in Arabidopsis by enhancing abscisic acid (ABA) biosynthesis. Mol. Plant Pathol. 2016, 17, 412–426. [Google Scholar] [CrossRef] [PubMed] [Green Version]
  94. Tang, Y.; Zhang, Z.; Lei, Y.; Hu, G.; Liu, J.; Hao, M.; Chen, A.; Peng, Q.; Wu, J. Cotton WATs Modulate SA biosynthesis and local lignin deposition participating in plant resistance against Verticillium dahliae. Front. Plant Sci. 2019, 10, 526. [Google Scholar] [CrossRef]
  95. Kay, S.; Hahn, S.; Marois, E.; Hause, G.; Bonas, U. A bacterial effector acts as a plant transcription factor and induces a cell size regulator. Science 2007, 318, 648–651. [Google Scholar] [CrossRef] [PubMed]
  96. Yang, S.; Shi, Y.; Zou, L.; Huang, J.; Shen, L.; Wang, Y.; Guan, D.; He, S. Pepper CaMLO6 negatively regulates ralstonia solanacearum resistance and positively regulates high temperature and high humidity responses. Plant Cell Physiol. 2020, 61, 1223–1238. [Google Scholar] [CrossRef]
  97. Xian, L.; Yu, G.; Wei, Y.; Rufian, J.S.; Li, Y.; Zhuang, H.; Xue, H.; Morcillo, R.J.L.; Macho, A.P. A Bacterial effector protein hijacks plant metabolism to support pathogen nutrition. Cell Host Microbe 2020, 28, 548–557. [Google Scholar] [CrossRef]
Figure 1. Symptoms of bacterial canker in resistant inbreeding line IBL2353 and susceptible S. lycopersicum Ohio88119 infected with the Cm GS12102 strain. (A) Ohio88119 plant at 30 days after mock inoculation. (B) Ohio88119 plant showed the wilting of whole plant at 30 days after Cm inoculation. (C) Unilateral wilting of the whole plant in Ohio88119 at 25 days after Cm inoculation. (D) Long and cracking canker on the injection sites of susceptible line at 30 days after Cm inoculation. (E) IBL2353 plant at 30 days after mock inoculation. (F) IBL2353 plant with mild leaflet wilting at 30 days after Cm inoculation. (G) Small and mild canker wound on the injection sites of resistant line at 30 days after Cm inoculation.
Horticulturae 09 00242 g001
Figure 2. Venn diagrams showing DEG contrasts between resistant IBL2353 and susceptible Ohio88119. (A) Venn diagram representation of overlapping DEGs quantity between two tomato lines. (B) The pie chart representation of the proportion of DEGs shared in Ohio88119 and IBL2353. (C) Comparison of up-regulated DEGs between IBL2353 and Ohio88119 at 12 and 24 hpi. (D) Comparison of down-regulated DEGs between IBL2353 and Ohio88119 at 12 and 24 hpi. UP and DOWN herein are the abbreviation of up-regulated and down-regulated, and IBL and OH herein are the abbreviation of IBL2353 and Ohio88119.
Horticulturae 09 00242 g002
Figure 3. GO enrichment and KEGG pathway analysis of genes with different change patterns in two lines. (A) shows the top 20 enriched GO terms on Biological Process. (B) shows the top 20 enriched GO terms on Molecular Function. (C) shows the top 20 enriched GO terms on Cellular Component. The size of the circles represents the number of DEGs annotated in this pathway, and the color of the circles represents the p value. A lower p value indicates greater enrichment intensity. (D) Scatterplot of KEGG pathways shows the top 20 enriched pathway terms in genes with different change patterns in two lines. The sizes of the circles indicate the number of genes. The Rich factor is the ratio of the number of DEGs annotated in a given pathway to the number of all genes annotated in this pathway. The q value is the corrected p value and ranges from 0 to 1, with a lower q value indicating greater intensity.
Horticulturae 09 00242 g003
Figure 4. Heat maps exhibiting the expression profiles of potentially resistance-related genes. Data were the Log2 value of gene expression fold changes and were normalized based on Z-score formula. The blue color means the value was lower than the mean of 4 Log2 values from two lines at two time-points, and not the down-regulation. The red color means the value was higher than the mean of 4 Log2 values from two lines at two time-points, but not up-regulation. The darker color represents the higher deviation from the average. OH 12/OH 0 and OH 24/OH 0 represent the ratio of gene expression value at 12 hpi and 24 hpi compared to value at 0 hpi in Ohio88119, respectively; IBL 12/IBL 0 and IBL 24/IBL 0 represent the ratio of gene expression value at 12 hpi and 24 hpi compared to value at 0 hpi in IBL2353, respectively.
Horticulturae 09 00242 g004
Figure 5. Heat maps exhibiting the expression profiles of resistance-related differentially expressedtranscription factor genes. (A) TFs up-regulated in IBL2353. (B) TFs down-regulated in IBL2353. Data were the Log2 value of gene expression fold changes and were normalized based on Z-score formula. The blue color means the value was lower than the mean of 4 Log2 values from two lines at two time-points, and not the down-regulation. The red color means the value was higher than the mean of 4 Log2 values from two lines at two time-points, but not up-regulation. The darker color represents the higher deviation from the average. OH 12/OH 0 and OH 24/OH 0 represent the ratio of gene expression value at 12 hpi and 24 hpi compared to value at 0 hpi in Ohio88119, respectively; IBL 12/IBL 0 and IBL 24/IBL 0 represent the ratio of gene expression value at 12 hpi and 24 hpi compared to value at 0 hpi in IBL2353, respectively.
Horticulturae 09 00242 g005
Figure 6. Heat map profiles of S gene homologs. (A) The quantitative analysis of gene expression at three time-points in two lines. OH 0, OH 12, and OH 24 represent the normalized expression values at 0 hpi, 12 hpi, and 24 hpi in Ohio88119; IBL 0, IBL 12, and IBL 24 represent the normalized expression values at 0 hpi, 12 hpi, and 24 hpi in IBL2353. (B) The contrasts of gene expression pattern in two lines. Data were the Log2 value of gene expression fold changes and were normalized based on Z-score formula. The blue color means the value was lower than the mean of the same row of four values from two lines at different time-points, and not the down-regulation. The red color represented the value was higher than the mean of the same row of four values from two lines at different time-points, but not up-regulation. The darker color represents the higher deviation from the average. OH 12/OH 0 and OH 24/OH 0 represent the ratio of gene expression value at 12 hpi and 24 hpi compared to at 0 hpi in Ohio88119, respectively; IBL 12/IBL 0 and IBL 24/IBL 0 represent the ratio of gene expression value at 12 hpi and 24 hpi compared to value at 0 hpi in IBL2353, respectively.
Horticulturae 09 00242 g006
Figure 7. RT-qPCR analysis of 10 selected DEGs. (AJ) display the relative expression values of 10 selected genes in Cm-susceptible and Cm-resistant tomato lines at two time-points, respectively. The transcript expression level of each gene at 0 hpi was set as 1.0. ** denotes very significant differences compared to 0 hpi based on independent-samples t-test (p < 0.01), ns denotes no significant differences compared to 0 hpi (p > 0.05). The table displays the fold change comparison between the RNA-Seq analysis and RT-qPCR validation.
Horticulturae 09 00242 g007
Figure 8. Silencing of WAKL20 in tomato plants led to disease susceptibility to the Cm infection. (A) Phenotype of the empty vector plant (IBL-21) at 35 dpi. (B) The positive control CaPDS-silenced plants were light-bleached in leaves after 30 days. (CE) The disease symptoms of three WAKL20-silenced plants at 35 dpi (IBL-17, IBL-27, and IBL-33). (F) PCR-based detection of pTRV1 and pTRV2-WAKL20 plasmids in three silenced plants and negative control pTRV2 plant. (G) Relative expression of WAKL20 in leaves collected from injected plants with pTRV1 + pTRV2 and pTRV1 + pTRV2-WAKL20 (IBL-17, IBL-27, and IBL-33), respectively. Significant differences were determined using independent-samples t-test (p < 0.01). ** denotes very significant differences compared to the control plants based on independent-samples t-test (p < 0.01). (H) Bacterial growth in WAKL20-silenced plants at 35 dpi. ** denotes very significant differences between the control and WAKL20-silenced plants using independent-samples t-test (p < 0.01), ns denotes no significant differences between the control and WAKL20-silenced plants (p > 0.05).
Horticulturae 09 00242 g008
Disclaimer/Publisher’s Note: The statements, opinions and data contained in all publications are solely those of the individual author(s) and contributor(s) and not of MDPI and/or the editor(s). MDPI and/or the editor(s) disclaim responsibility for any injury to people or property resulting from any ideas, methods, instructions or products referred to in the content.

