
Mutual Effects of Zinc Concentration and Ratio of Red-Blue Light on Growth and Nutritional Quality of Flowering Chinese Cabbage Sprouts

 ,
,  ,
,  and
and
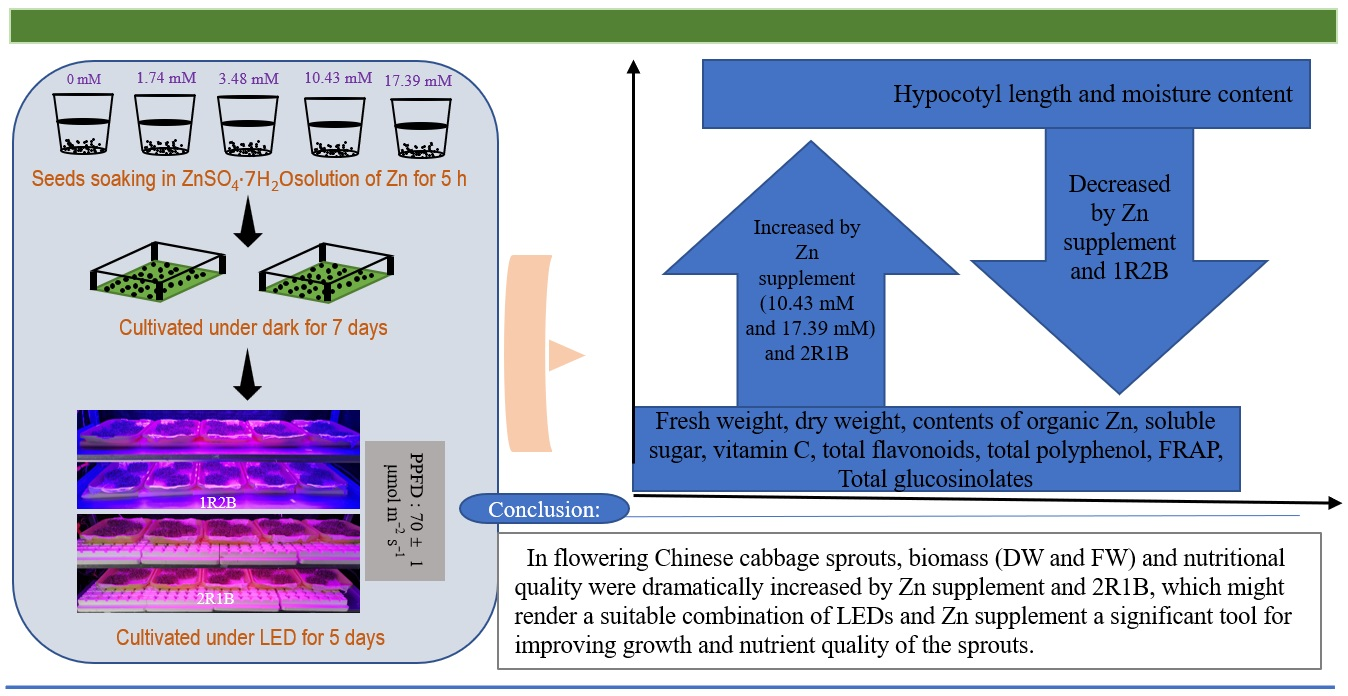
Abstract
:
1. Introduction
2. Materials and Methods
2.1. Plant Materials and Cultivation Conditions
2.2. Biometric Measurements
2.3. Pigment Content Determination
- Chlorophyll a (Chl a) (µg L−1) = 13.36 × A665 − 5.19 × A649
- Chlorophyll b (Chl b) (µg L−1) = 27.43 × A649 − 8.12 × A665
- Total Chlorophyll (Chl) (µg L−1) = 5.24 × A665 + 22.24 × A649
- Carotenoids (Car) (µg L−1) = (1000 × A470 − 2.13 × Chl a − 97.64 × Chl b) / 209
- Photosynthetic pigment (mg g−1) = Photosynthetic pigment (µg L−1) × 8 mL × 10−3/0.2 g
2.4. Phytochemical Determination
2.5. Statistical Analysis
3. Results
3.1. Sprouts Growth
3.2. The Mineral Element Content
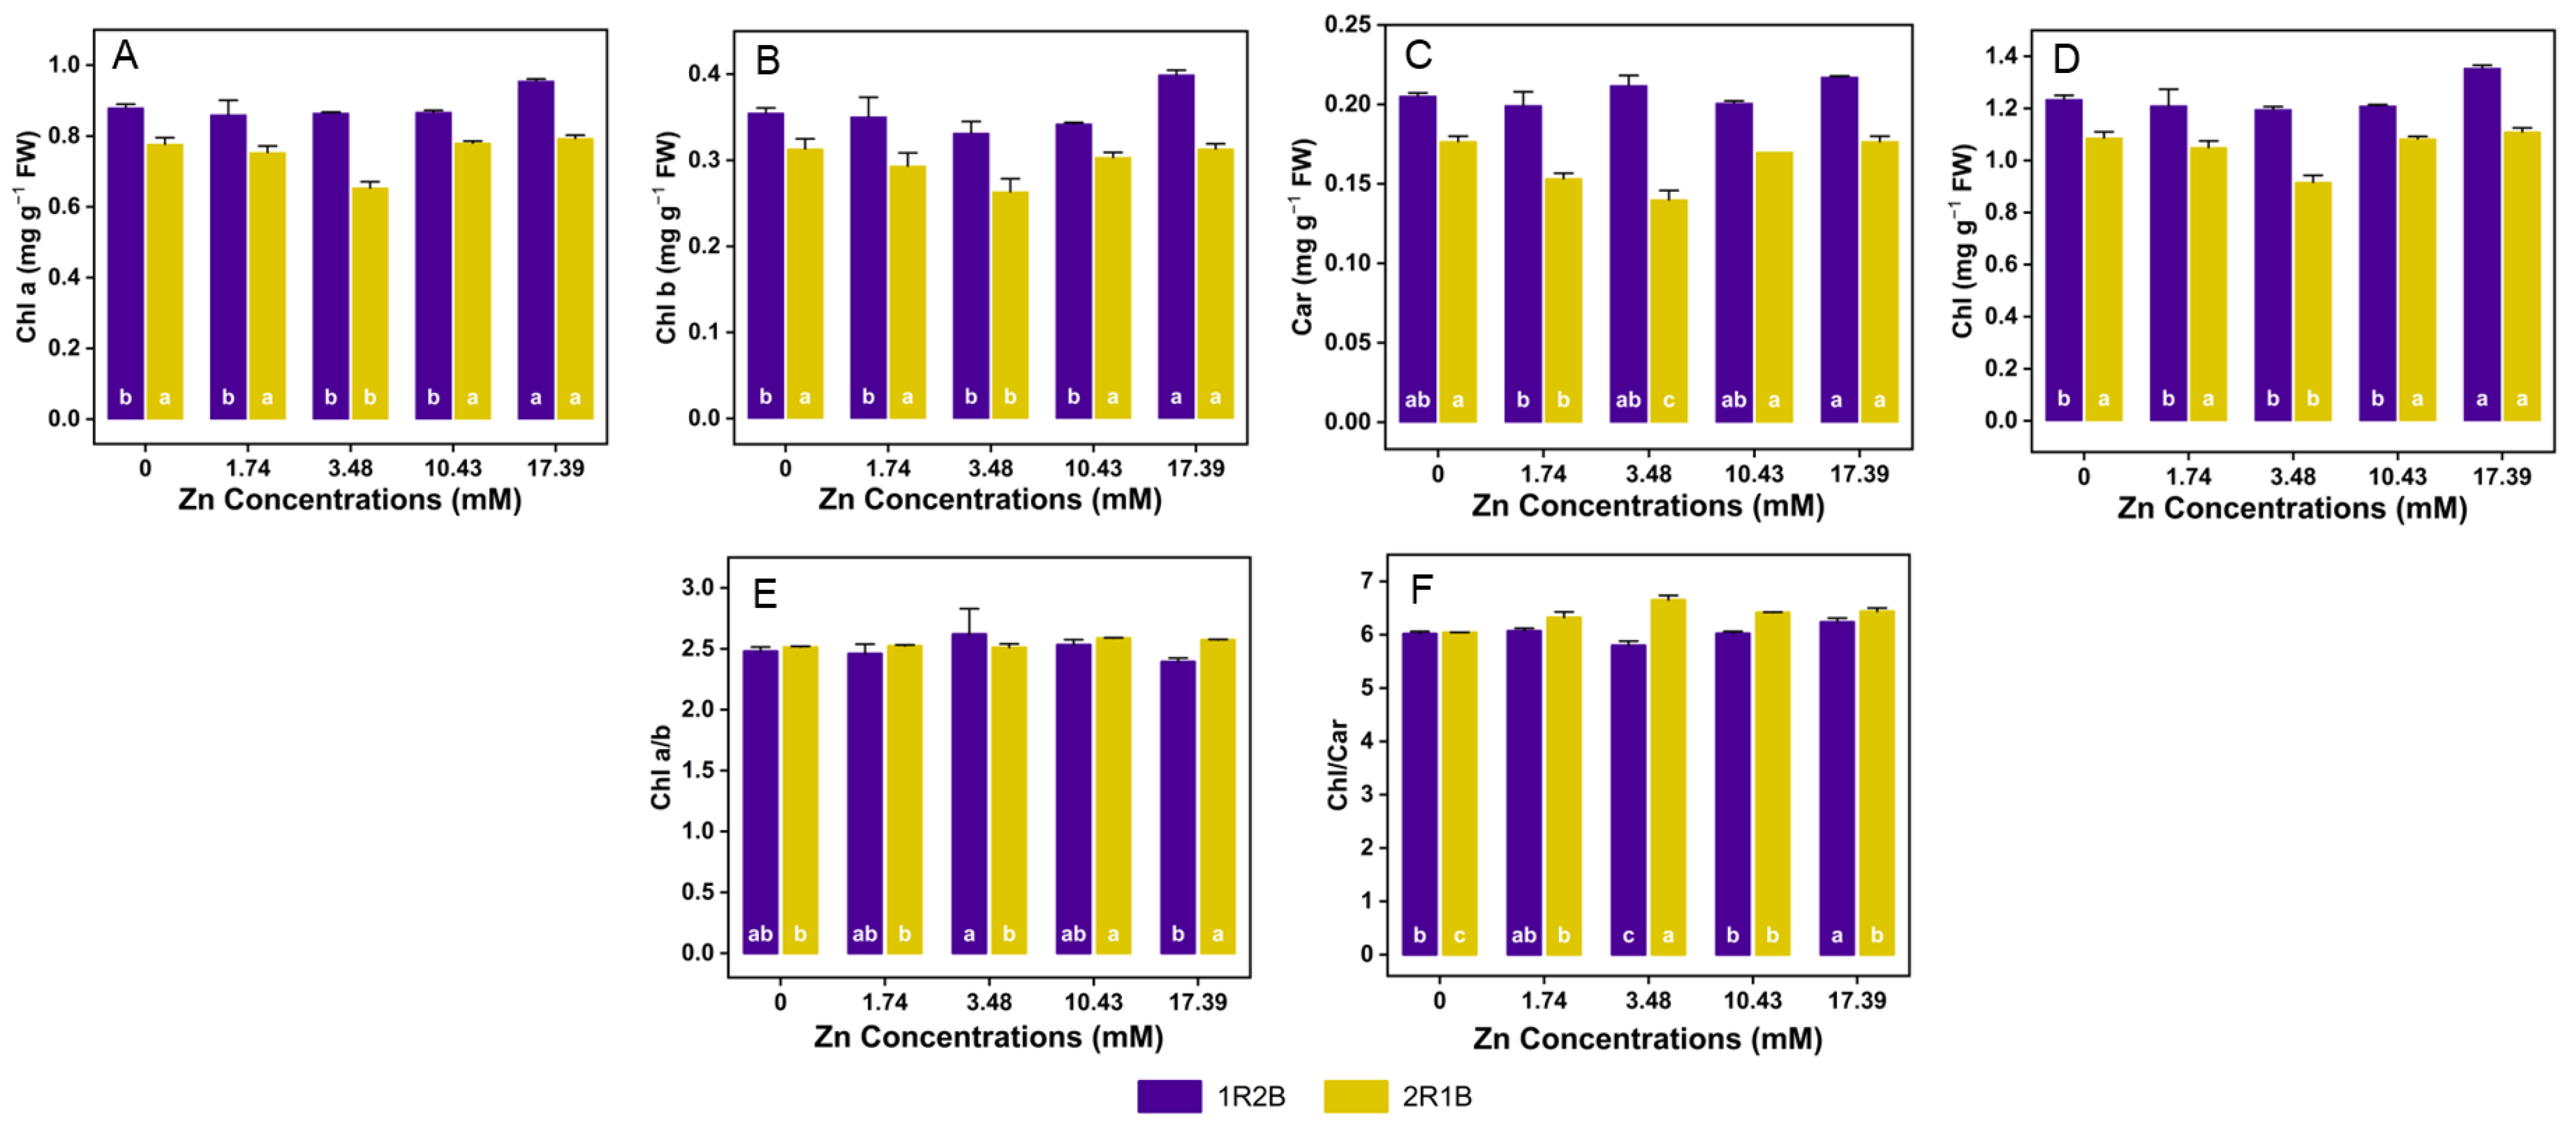
3.3. Pigment Content
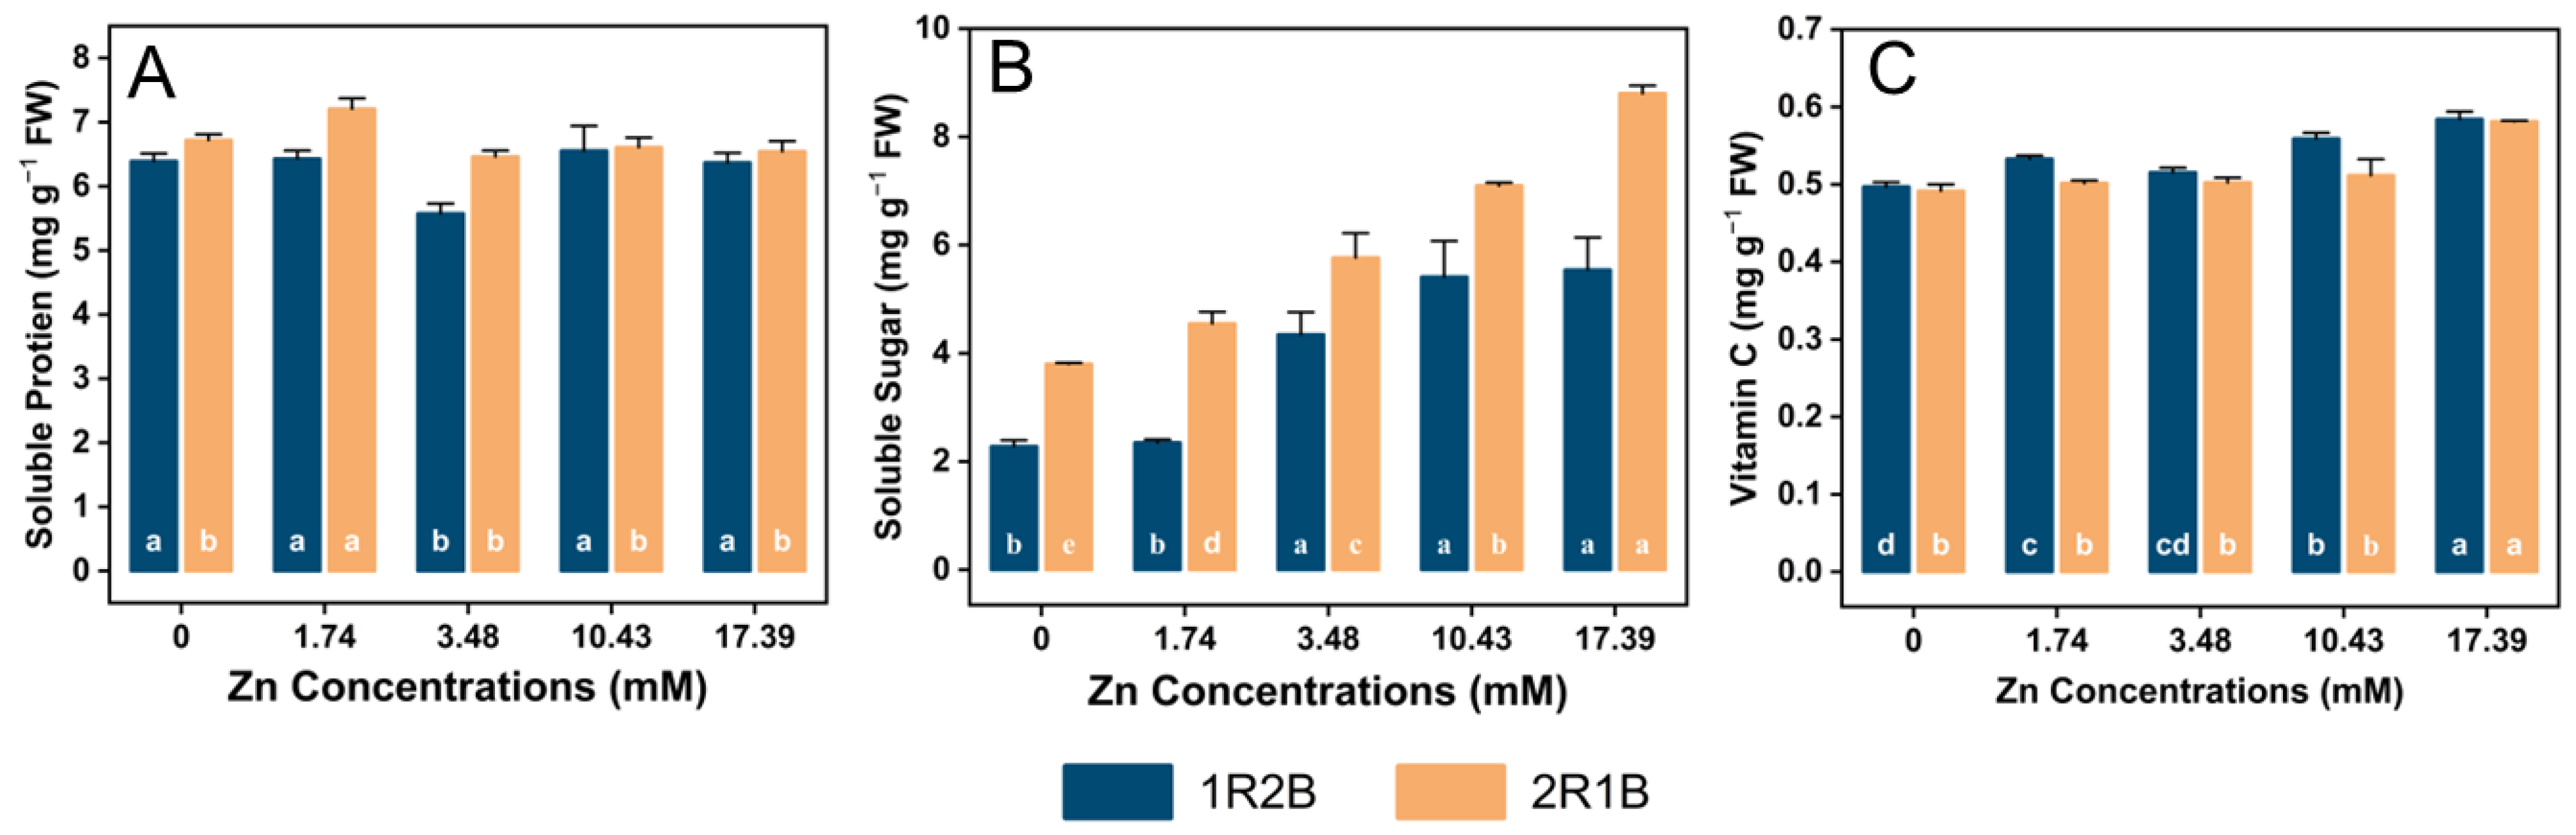
3.4. The Contents of Soluble Protein (SP), Soluble Sugar (SS) and Vitamin C (Vc)
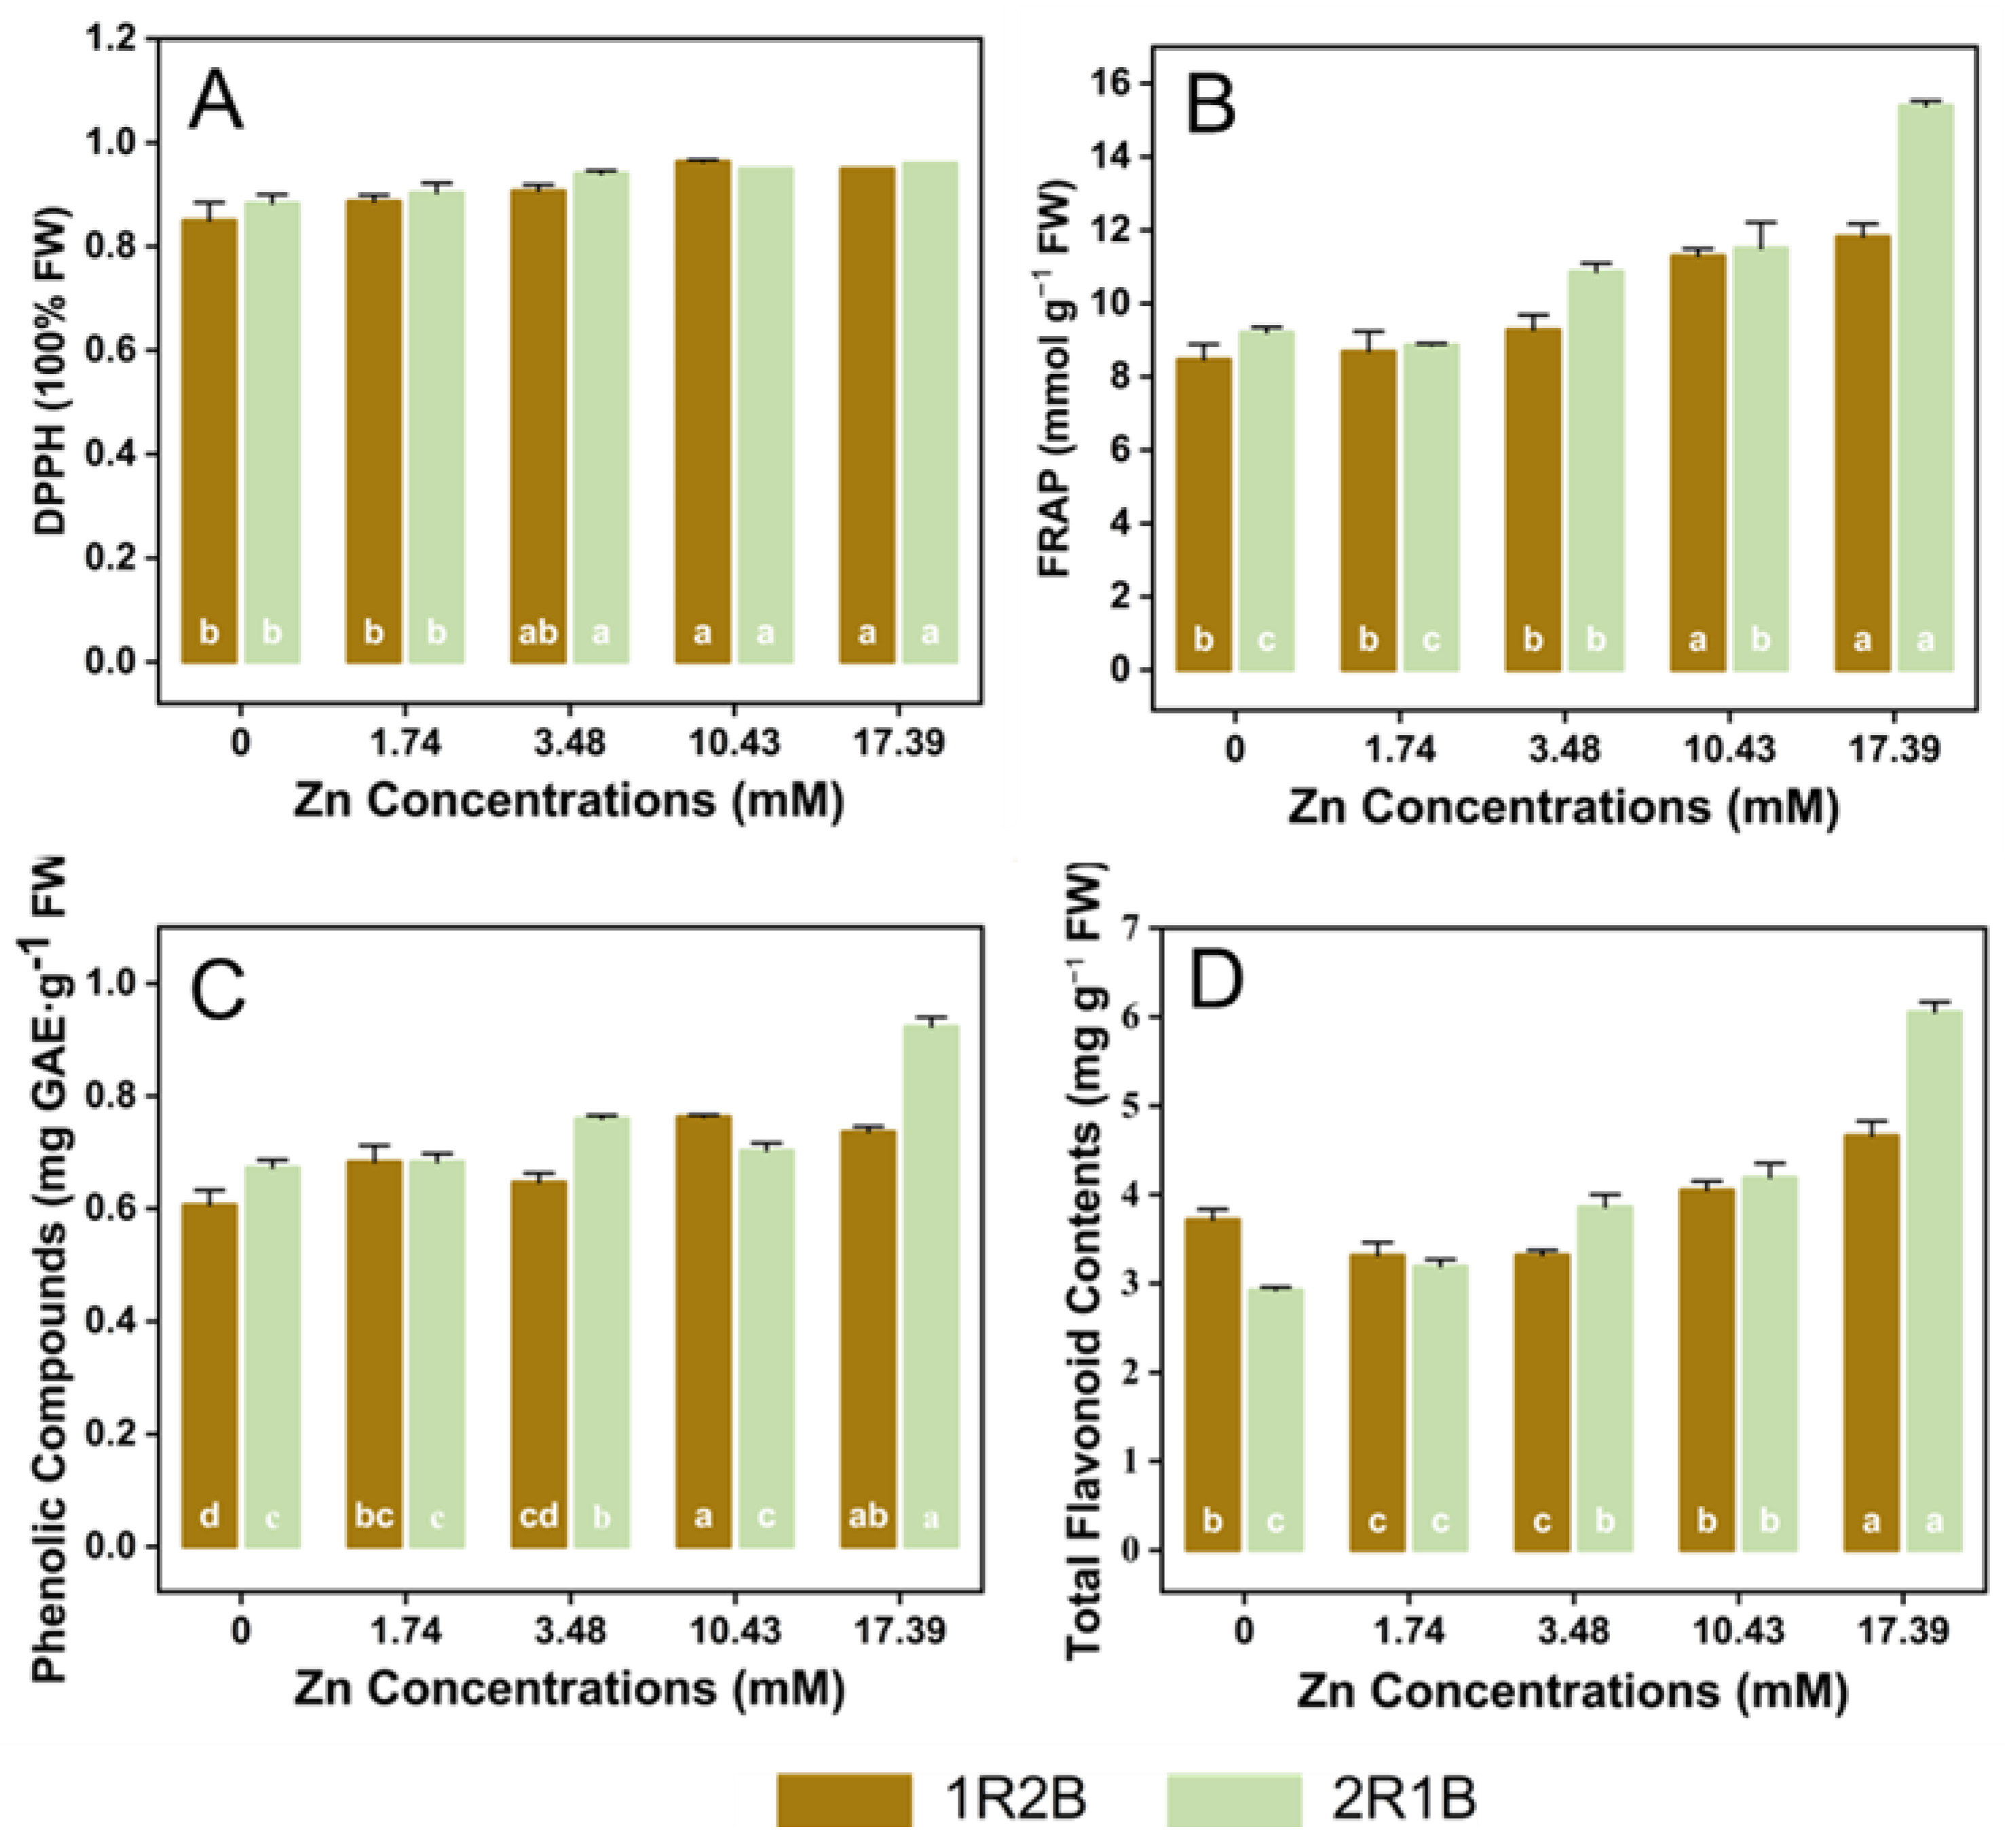
3.5. Antioxidants Contents and Activities in Flowering Chinese Cabbage Sprouts (FCCS)
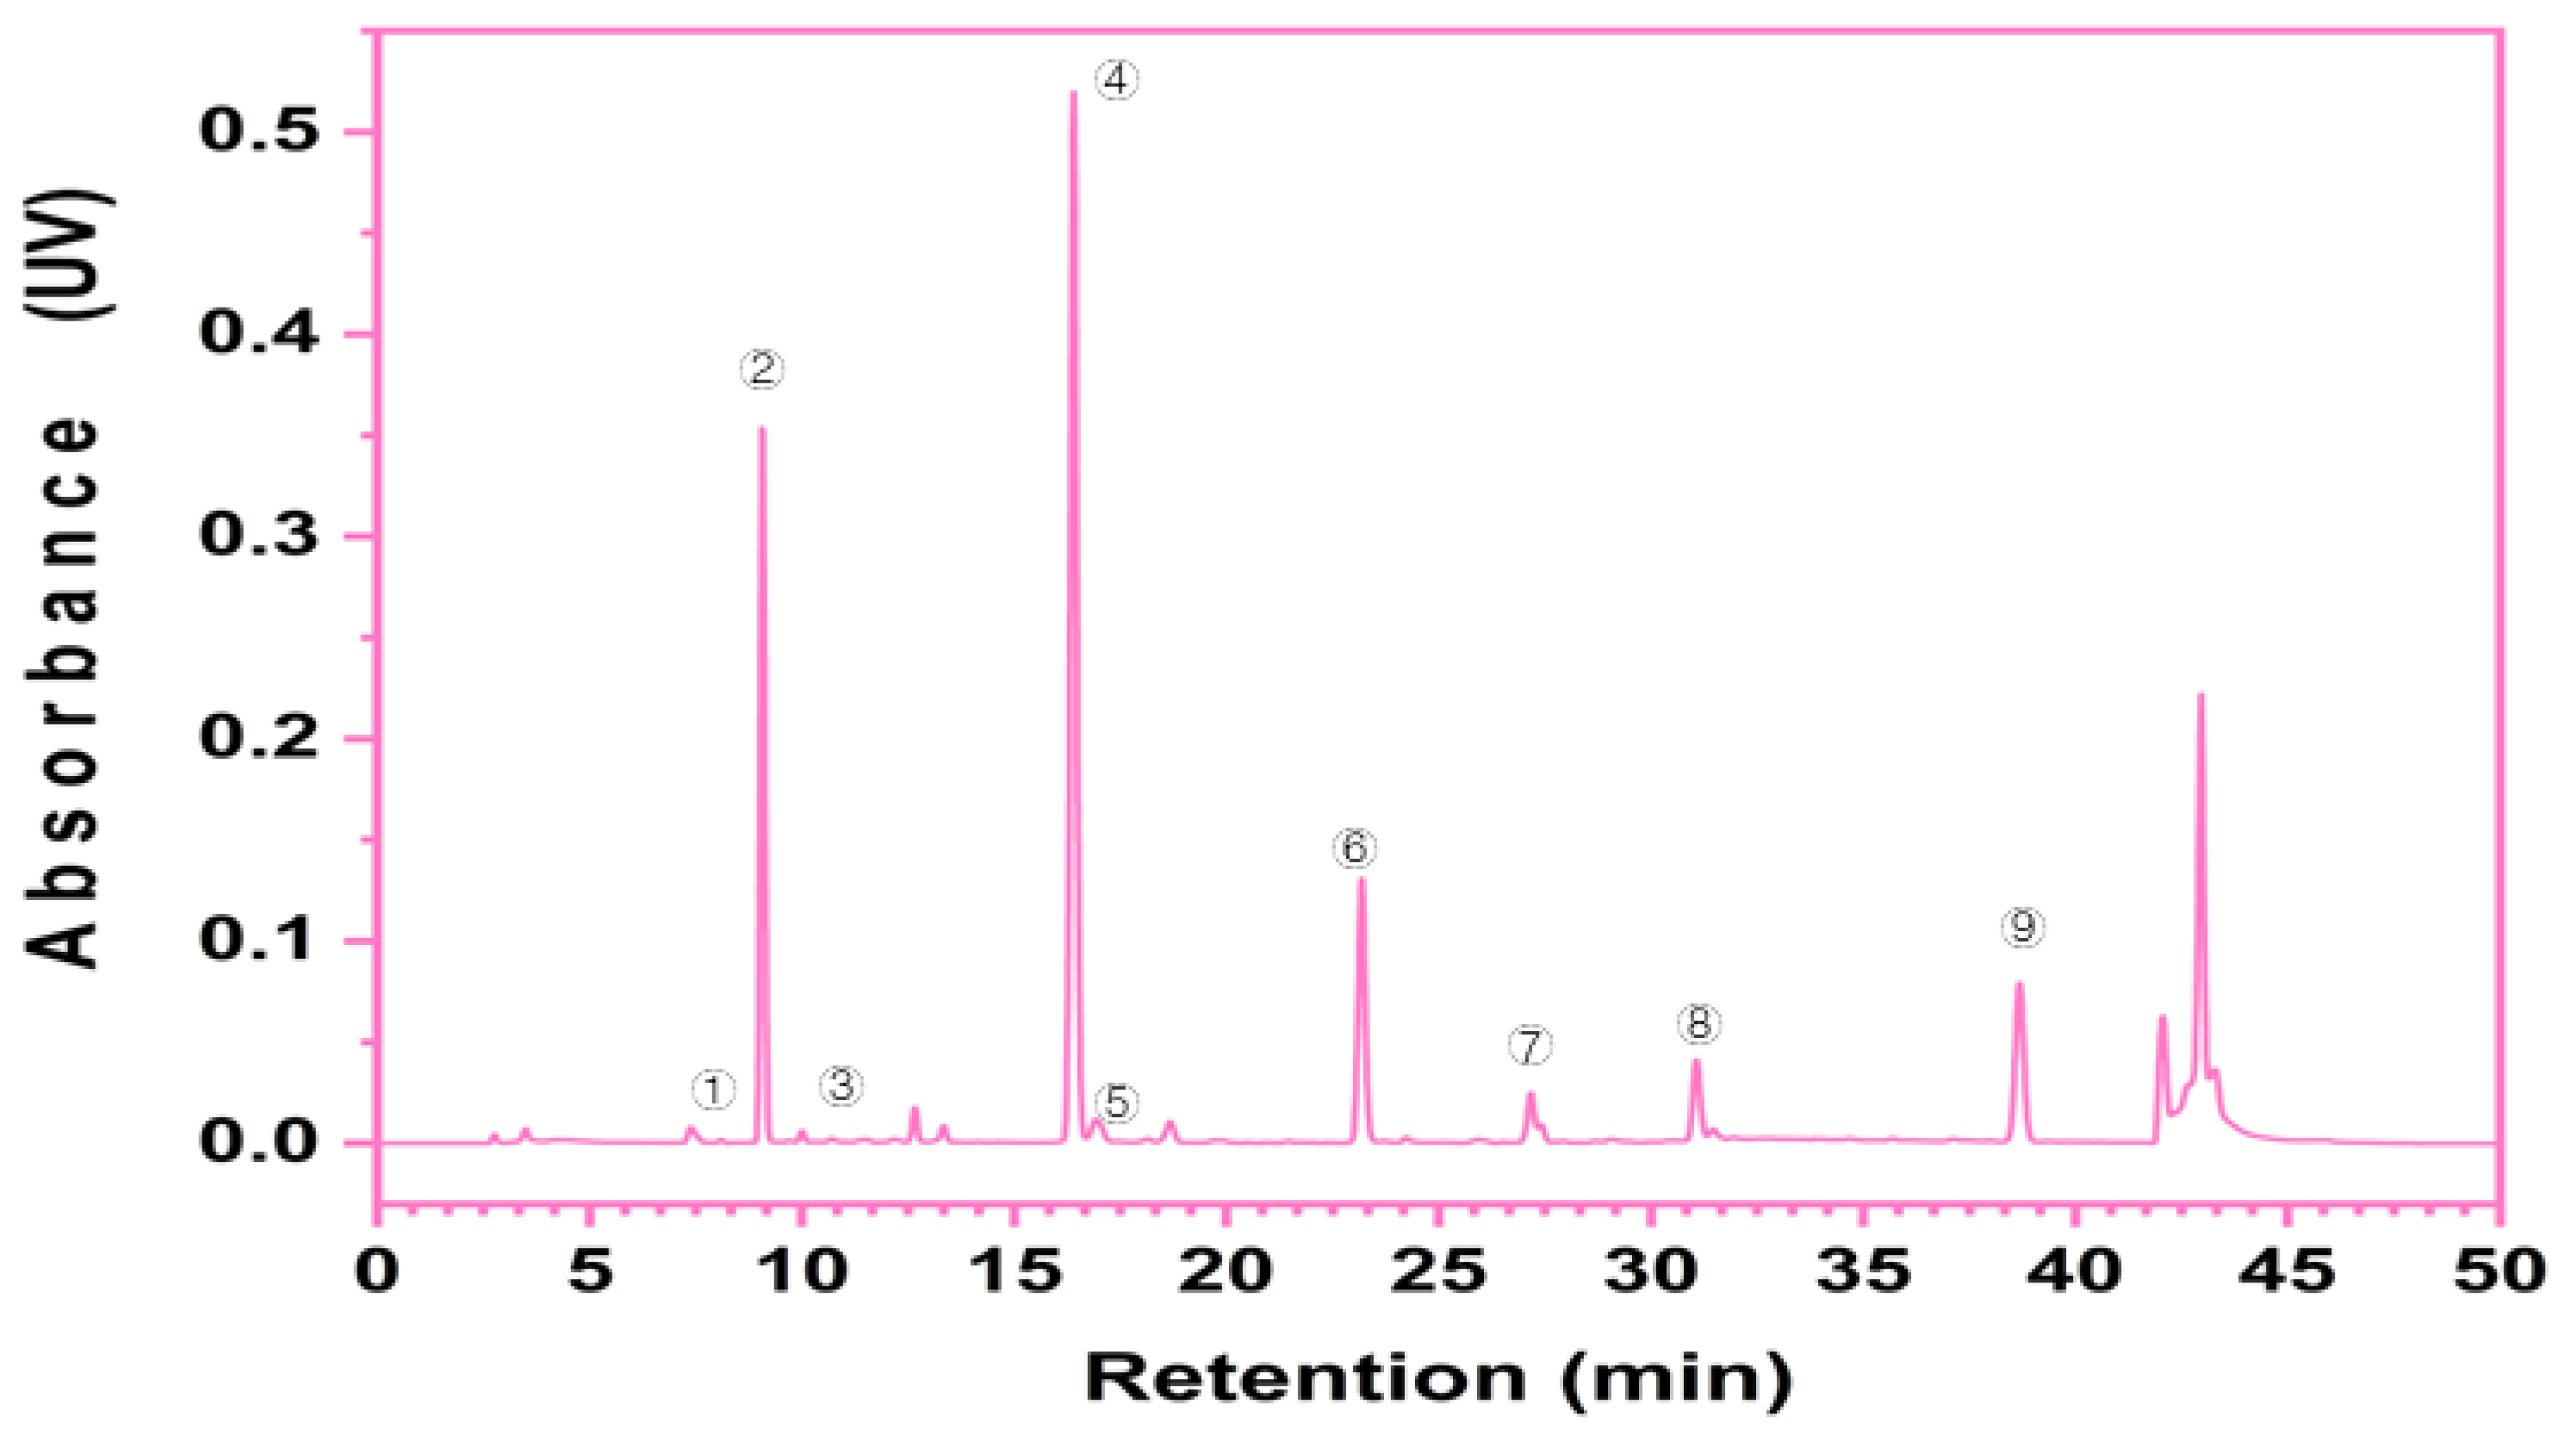
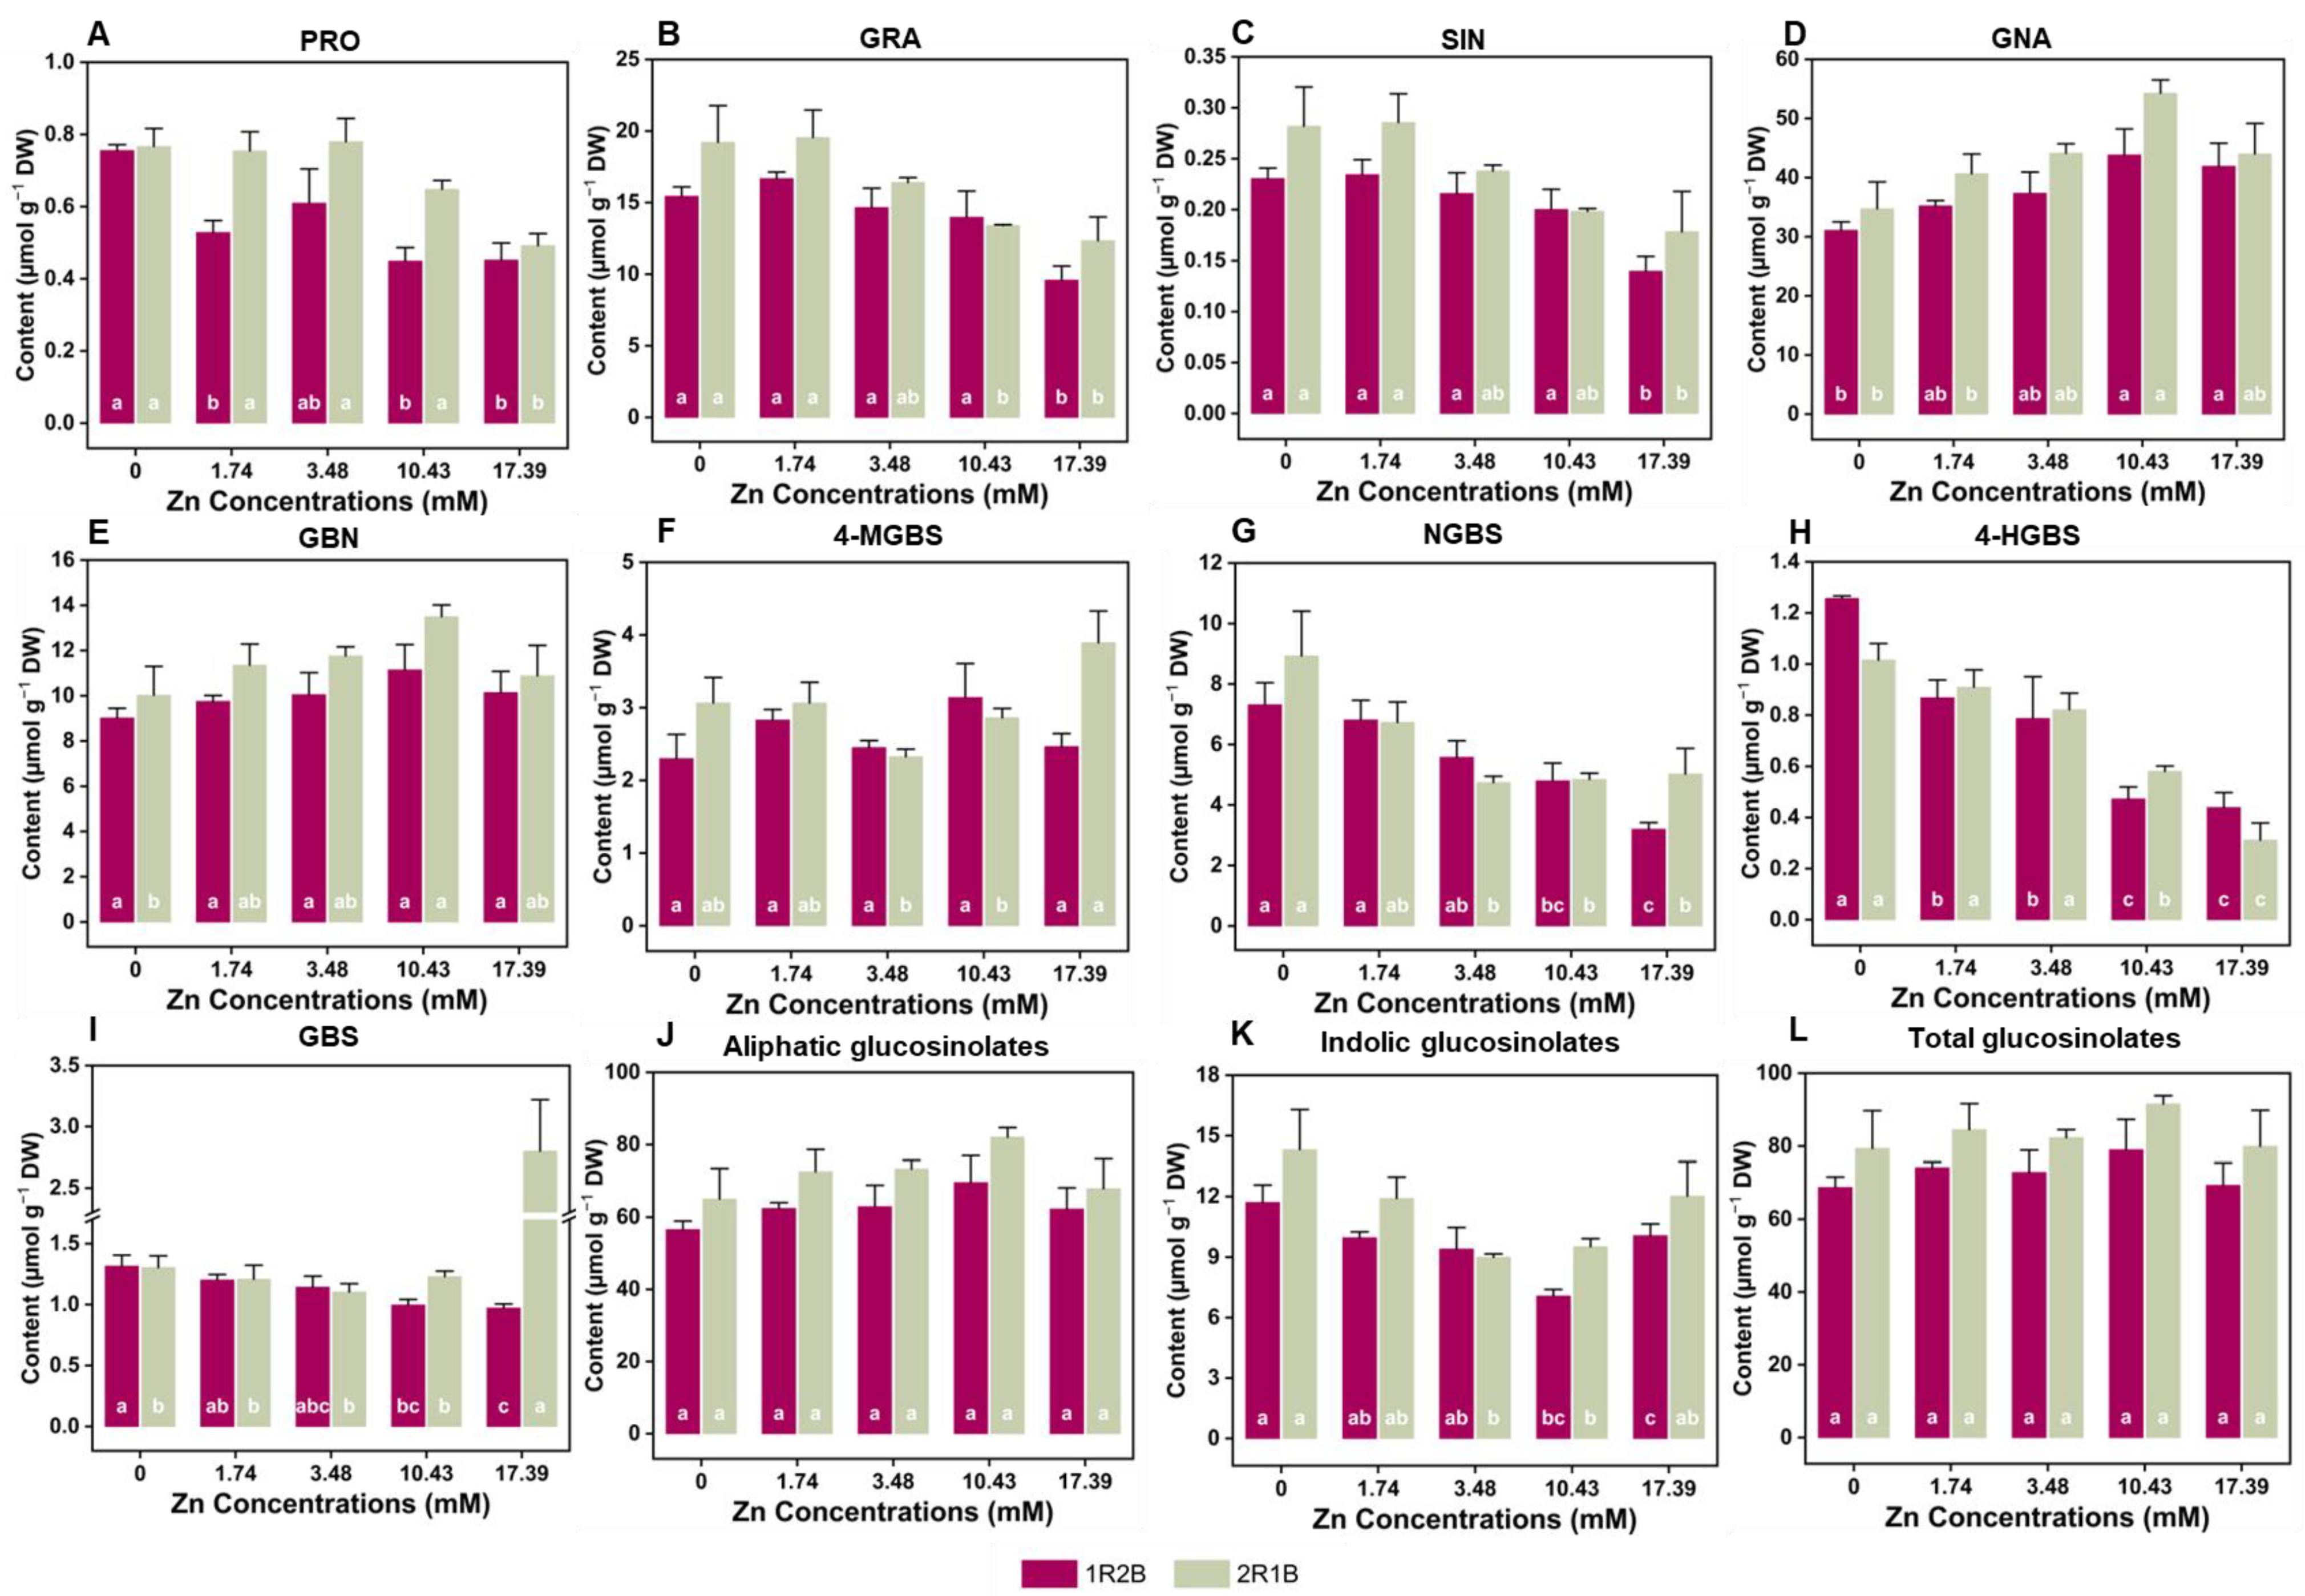
3.6. The Glucosinolates (GLs) Contents
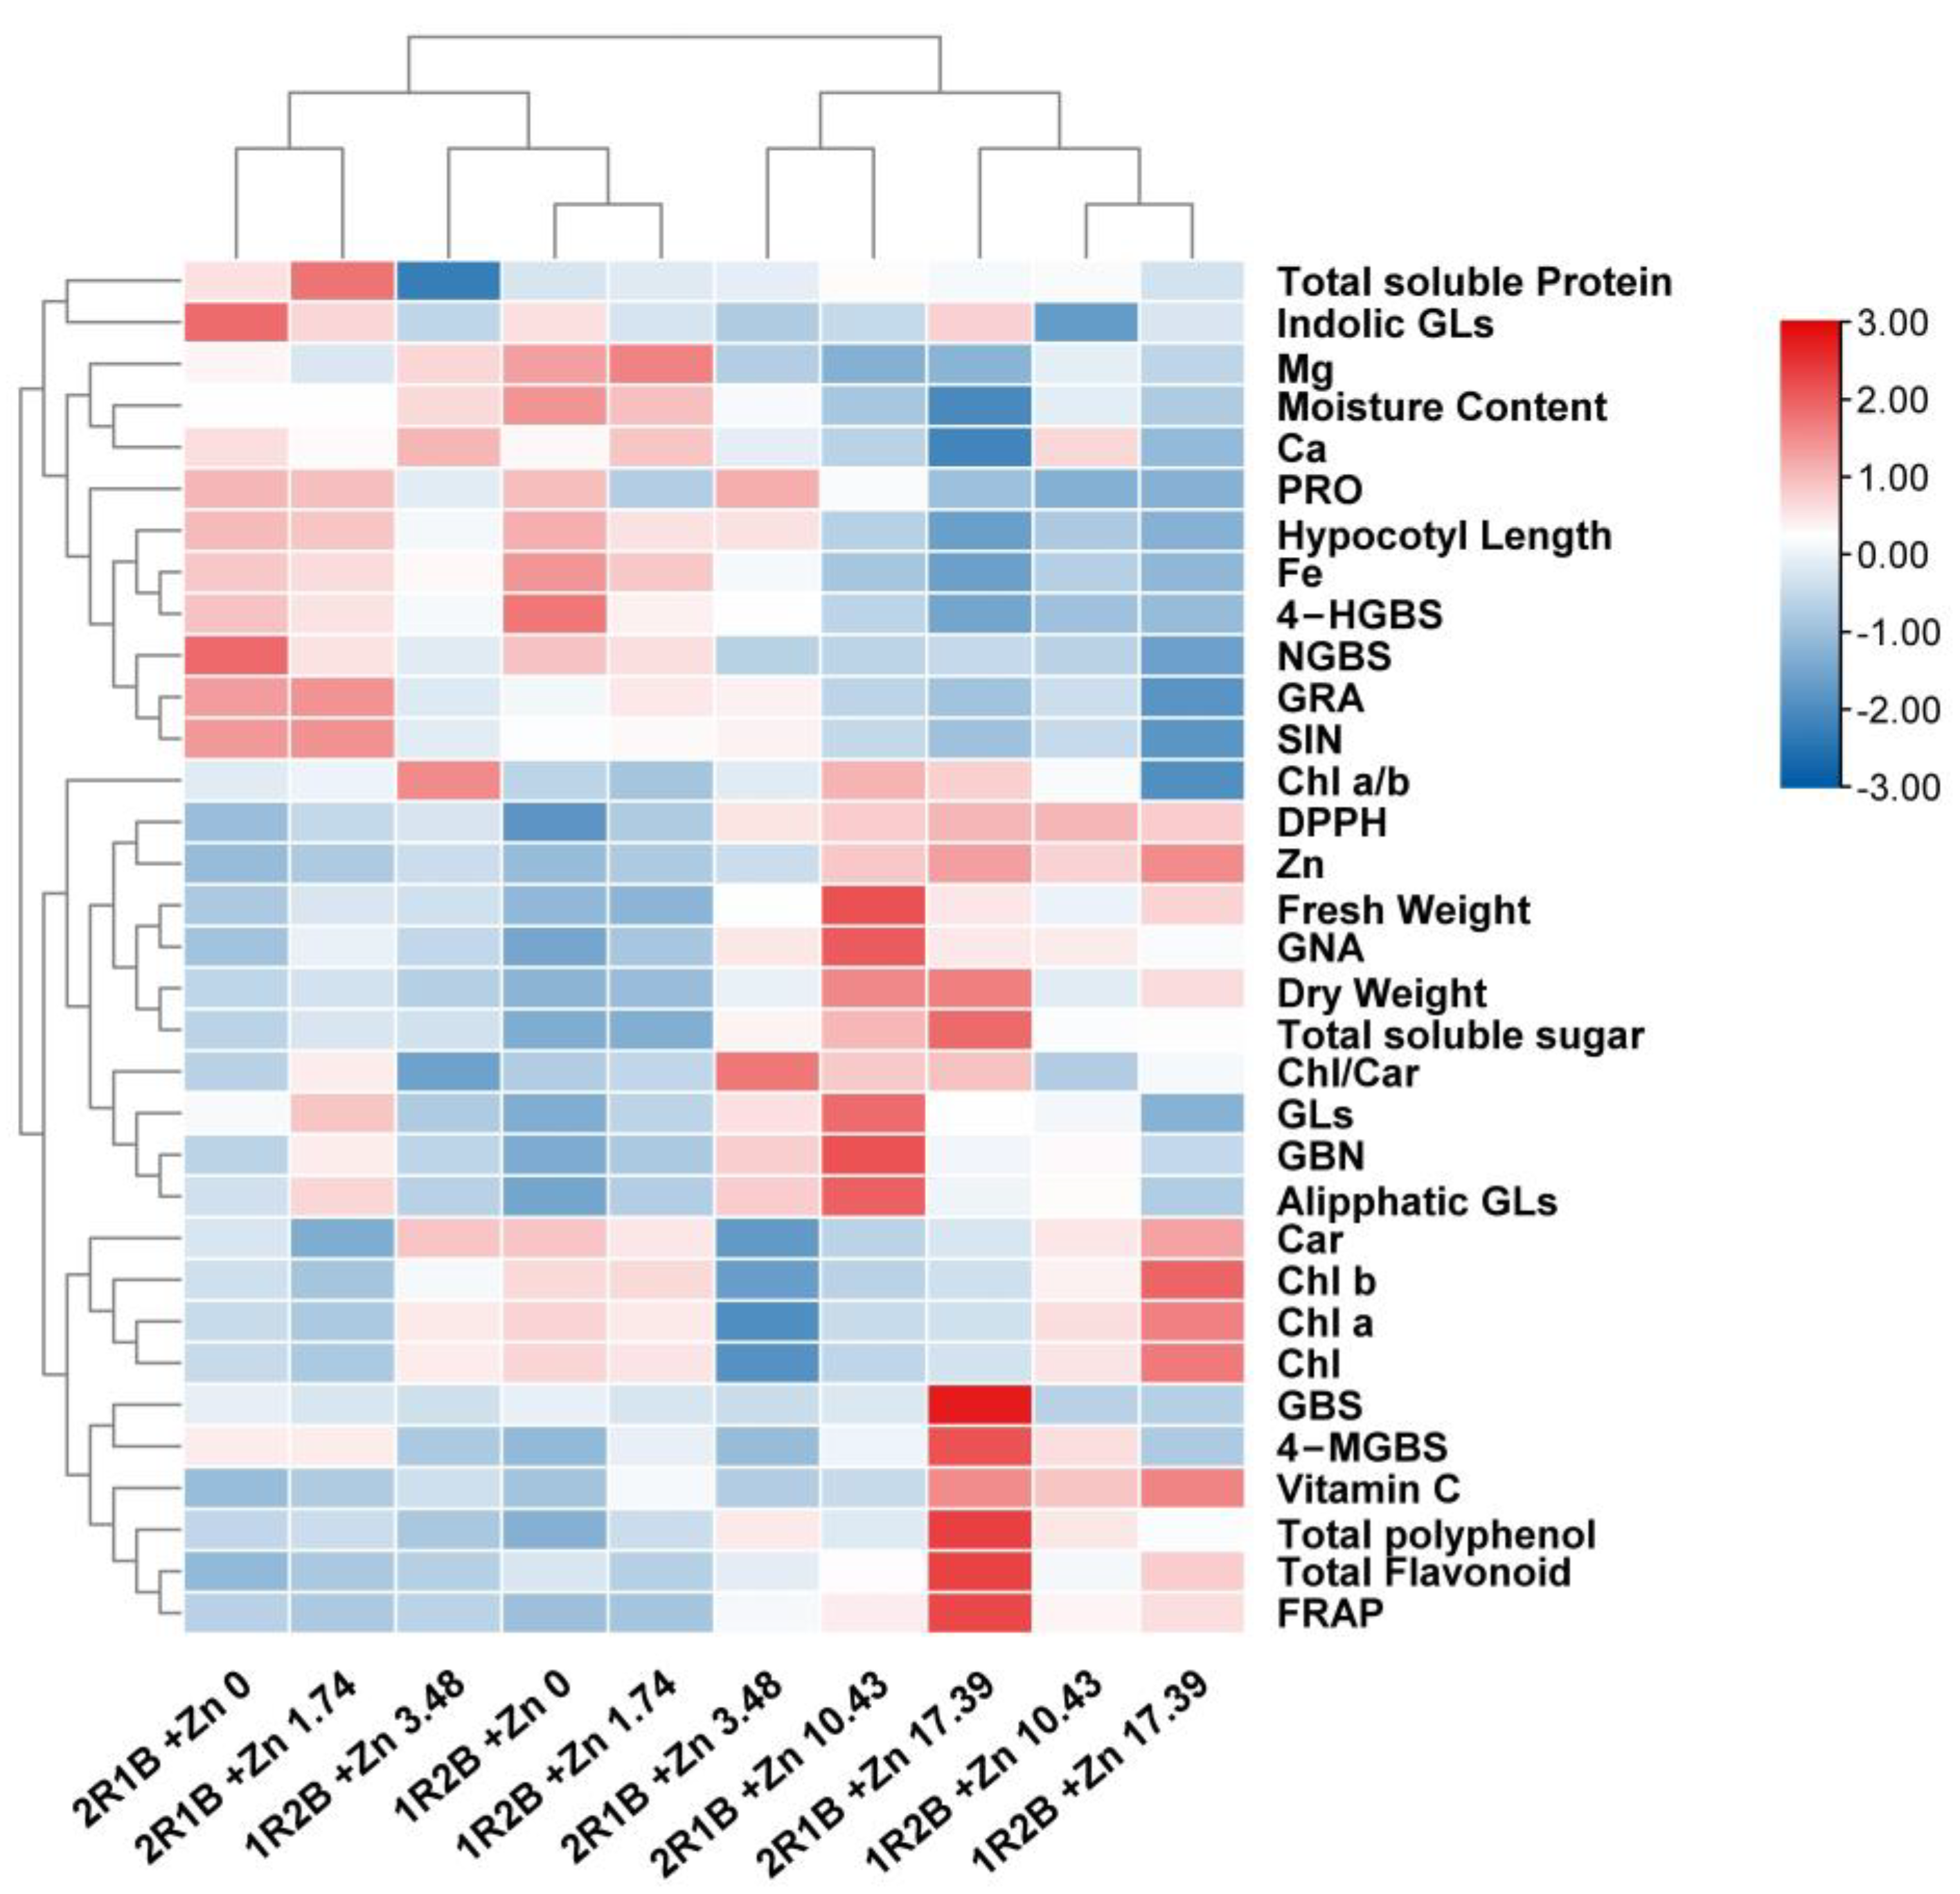
3.7. Heatmap Analysis
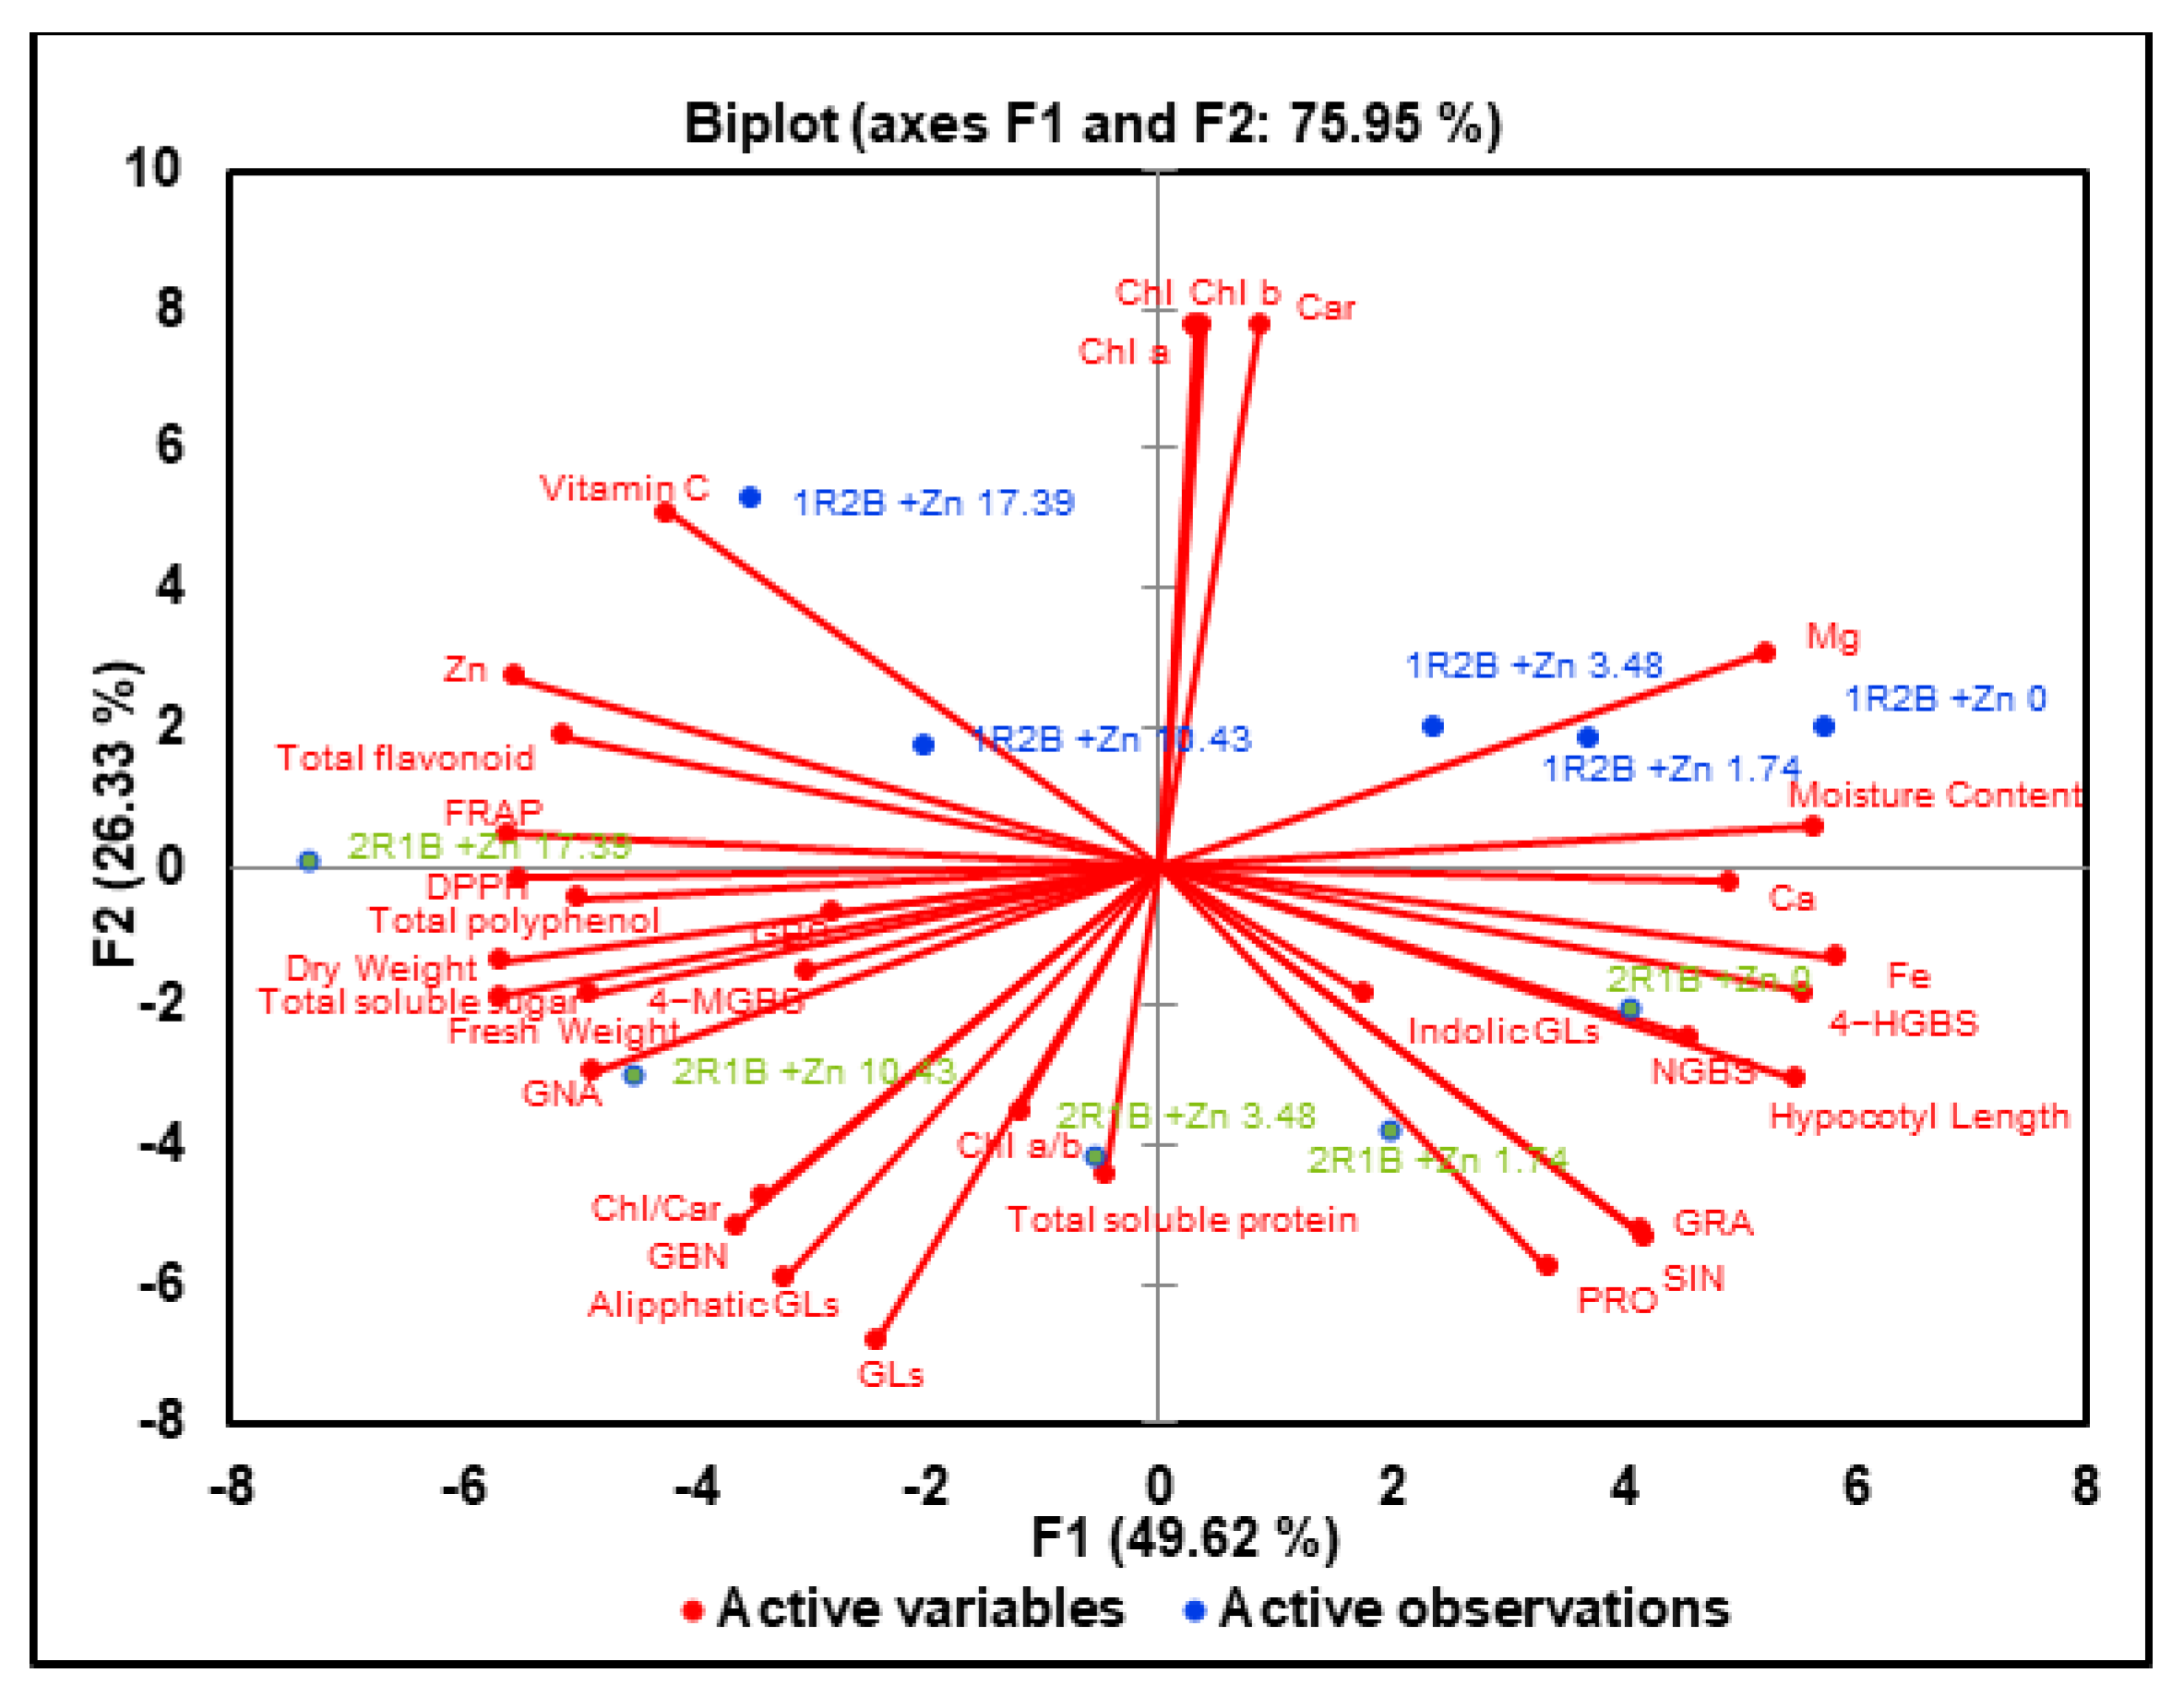
3.8. Principal Component Analysis (PCA)
4. Discussion
4.1. Effects of Zn Concentrations on the Growth of Flowering Chinese Cabbage Sprouts (FCCS) under Two Ratios of R-B
4.2. Effects of Zn Concentrations on the Mineral Element Content in Flowering Chinese Cabbage Sprouts (FCCS) under Two Ratios of R-B
4.3. Effects of Zn Concentrations on the Photosynthetic Pigment Contents in Flowering Chinese Cabbage Sprouts (FCCS) under Two Ratios of R-B
4.4. Effects of Zn Concentrations on the Phytochemical Content in Flowering Chinese Cabbage Sprouts (FCCS) under Two Ratios of R-B
4.5. Effects of Zn Concentrations on the Glucosinolates (Gls) Content in Flowering Chinese Cabbage Sprouts (FCCS) under Two Ratios of R-B
5. Conclusions
Author Contributions
Funding
Conflicts of Interest
References
- Penny, M.E. Zinc Supplementation in Public Health. Ann. Nutr. Metab. 2013, 62, 31–42. [Google Scholar] [CrossRef]
- Cakmak, I. Enrichment of cereal grains with zinc: Agronomic or genetic biofortification? Plant Soil 2018, 302, 1–17. [Google Scholar] [CrossRef]
- Bączek-Kwinta, R.; Baran, A.; Simlat, M.; Lang, J.; Bieniek, M.; Florek, B. Enrichment of Different Plant Seeds with Zinc and Assessment of Health Risk of Zn-Fortified Sprouts Consumption. Agronomy 2020, 10, 937. [Google Scholar] [CrossRef]
- Pecora, F.; Persico, F.; Argentiero, A.; Neglia, C.; Esposito, S. The Role of Micronutrients in Support of the Immune Response against Viral Infections. Nutrients 2020, 12, 3198. [Google Scholar]
- Valavi, E.; Hakimzadeh, M.; Shamsizadeh, A.; Aminzadeh, M.; Alghasi, A. The Efficacy of Zinc Supplementation on Outcome of Children with Severe Pneumonia. A Randomized Double-blind Placebo-controlled Clinical Trial. Indian J. Pediatr. 2011, 78, 1079–1084. [Google Scholar] [CrossRef]
- Wessels, I.; Rolles, B.; Slusarenko, A.J.; Rink, L. Zinc deficiency as a possible risk factor for increased susceptibility and severeprogression of Corona Virus Disease 19. Br. J. Nutr. 2021, 127, 214–232. [Google Scholar]
- Finzi, E. Treatment of SARS-CoV-2 with high dose oral zinc salts: A report on four patients. Int. J. Infect. Dis. 2020, 99, 307–309. [Google Scholar]
- Acevedo-Murillo, J.A.; García León, M.L.; Firo-Reyes, V.; Santiago-Cordova, J.L.; Gonzalez-Rodriguez, A.P.; Wong-Chew, R.M. Zinc Supplementation Promotes a Th1 Response and Improves Clinical Symptoms in Fewer Hours in Children with Pneumonia Younger Than 5 Years Old. A Randomized Controlled Clinical Trial. Front. Pediatr. 2019, 7, 431. [Google Scholar] [CrossRef]
- Kar, M.; Khan, N.A.; Panwar, A.; Bais, S.S.; Medigeshi, G.R. Zinc chelation specifically inhibits early stages of dengue virus replication by activation of NF-κB and induction of antiviral response in epithelial cells. Front. Immunol. 2019, 10, 2347. [Google Scholar]
- Zhang, H.; Xu, Z.; Guo, K.; Huo, Y.; He, G.; Sun, H.; Guan, Y.; Xu, N.; Yang, W.; Sun, G. Toxic effects of heavy metal Cd and Zn on chlorophyll, carotenoid metabolism and photosynthetic function in tobacco leaves revealed by physiological and proteomics analysis. Ecotoxicol. Environ. Saf. 2020, 202, 110856. [Google Scholar] [CrossRef]
- Tang, L.; Hamid, Y.; Liu, D.; Shohag, J.I.; Zehra, A.; He, Z.; Feng, Y.; Yang, X. Foliar application of zinc and selenium alleviates cadmium and lead toxicity of water spinach—Bioavailability/cytotoxicity study with human cell lines. Environ. Int. 2020, 145, 106122. [Google Scholar] [CrossRef]
- Cukrov, M. Effect of Zinc Oxide (Zno) and Zinc Sulfate (Znso4) on Strawberry Fruit Development; Changes in Fruit Secondary Metabolites, Corresponding Genes and Their Influence on Fruit Firmness. Master's Thesis, University of Zagreb, Zagreb, Croatia, 2018. [Google Scholar]
- Zou, T.; Xu, N.; Hu, G.; Pang, J.; Xu, H. Biofortification of soybean sprouts with zinc and bioaccessibility of zinc in the sprouts. J. Sci. Food Agric. 2014, 94, 3053–3060. [Google Scholar] [CrossRef]
- Yang, R.; Guo, L.; Jin, X.; Shen, C.; Zhou, Y.; Gu, Z. Enhancement of glucosinolate and sulforaphane formation of broccoli sprouts by zinc sulphate via its stress effect. J. Funct. Foods 2015, 13, 345–349. [Google Scholar] [CrossRef]
- Di Gioia, F.; Renna, M.; Santamaria, P. Sprouts, Microgreens and “Baby Leaf” Vegetables. In Minimally Processed Refrigerated Fruits and Vegetables, 2nd ed.; Yildiz, F., Wiley, R.C., Eds.; Springer: Boston, MA, USA, 2017; Volume 2, pp. 447–452. [Google Scholar]
- Zhang, X.; Bian, Z.; Yuan, X.; Chen, X.; Lu, C. A review on the effects of light-emitting diode (LED) light on the nutrients of sprouts and microgreens. Trends Food Sci. Technol. 2020, 99, 203–216. [Google Scholar] [CrossRef]
- Miyahira, R.F.; de Oliveira Lopes, J.; Antunes, A.E.C. The Use of Sprouts to Improve the Nutritional Value of Food Products: A Brief Review. Plant Foods Hum. Nutr. 2021, 76, 143–152. [Google Scholar] [CrossRef]
- Gan, R.-Y.; Lui, W.-Y.; Wu, K.; Chan, C.-L.; Dai, S.-H.; Sui, Z.-Q.; Corke, H. Bioactive compounds and bioactivities of germinated edible seeds and sprouts: An updated review. Trends Food Sci. Technol. 2017, 59, 1–14. [Google Scholar] [CrossRef]
- Johkan, M.; Shoji, K.; Goto, F.; Hashida, S.-N.; Yoshihara, T. Blue Light-emitting Diode Light Irradiation of Seedlings Improves Seedling Quality and Growth after Transplanting in Red Leaf Lettuce. HortScience 2010, 45, 1809–1814. [Google Scholar] [CrossRef]
- Kamal, K.Y.; Khodaeiaminjan, M.; El-Tantawy, A.A.; El Moneim, D.A.; Salam, A.A.; Ash-Shormillesy, S.M.A.I.; Attia, A.; Ali, M.A.S.; Herranz, R.; El-Esawi, M.A.; et al. Evaluation of growth and nutritional value of Brassica microgreens grown under red, blue and green LEDs combinations. Physiol. Plant. 2020, 169, 625–638. [Google Scholar] [CrossRef]
- Park, C.H.; Park, Y.E.; Yeo, H.J.; Kim, J.K.; Park, S.U. Effects of Light-Emitting Diodes on the Accumulation of Phenolic Compounds and Glucosinolates in Brassica juncea Sprouts. Horticulturae 2020, 6, 77. [Google Scholar] [CrossRef]
- Park, C.H.; Kim, N.S.; Park, J.S.; Lee, S.Y.; Lee, J.-W.; Park, S.U. Effects of Light-Emitting Diodes on the Accumulation of Glucosinolates and Phenolic Compounds in Sprouting Canola (Brassica napus L.). Foods 2019, 8, 76. [Google Scholar] [CrossRef]
- Gao, M.; He, R.; Shi, R.; Zhang, Y.; Song, S.; Su, W.; Liu, H. Differential Effects of Low Light Intensity on Broccoli Microgreens Growth and Phytochemicals. Agronomy 2021, 11, 537. [Google Scholar] [CrossRef]
- Wang, Y.; Chen, L.; Su, W.; Hao, Y.; Liu, H.; Sun, G.; Chen, R.; Song, S. Effect of Nitrate Concentration on the Growth, Bolting and Related Gene Expression in Flowering Chinese Cabbage. Agronomy 2021, 11, 936. [Google Scholar] [CrossRef]
- Yuan, L.; Wu, J.; Wang, C.; Liu, S.; Zhu, S. Effect of Zinc Enrichment on Growth and Nutritional Quality in Pea Sprouts. J. Food Nutr. Res. 2016, 4, 100–107. [Google Scholar]
- He, R.; Gao, M.; Shi, R.; Song, S.; Zhang, Y.; Su, W.; Liu, H. The Combination of Selenium and LED Light Quality Affects Growth and Nutritional Properties of Broccoli Sprouts. Molecules 2020, 25, 4788. [Google Scholar] [CrossRef]
- Lichtenthaler, H.K.; Buschmann, C. Chlorophylls and Carotenoids: Measurement and Characterization by UV-VIS Spectroscopy. Curr. Protoc. Food Anal. Chem. 2001, 1, F4.3.1–F4.3.8. [Google Scholar] [CrossRef]
- Kohyama, K.; Nishinari, K. Effect of soluble sugars on gelatinization and retrogradation of sweet potato starch. J. Agric. Food Chem. 1991, 39, 1406–1410. [Google Scholar] [CrossRef]
- Blakesley, R.W.; Boezi, J.A. A new staining technique for proteins in polyacrylamide gels using Coomassie brilliant blue G250. Anal. Biochem. 1977, 82, 580–582. [Google Scholar] [CrossRef]
- Chanwitheesuk, A.; Teerawutgulrag, A.; Rakariyatham, N. Screening of antioxidant activity and antioxidant compounds of some edible plants of Thailand. Food Chem. 2005, 92, 491–497. [Google Scholar] [CrossRef]
- Vernon, L.S.; Rudolf, O.; Rosa, M.L.R. Analysis of Total Phenols and Other Oxidation Substrates and Antioxidants by Means of Folin-Ciocalteu Reagent. Methods Enzymol. 1999, 299, 152–178. [Google Scholar]
- Xie, Y.; Zheng, Y.; Dai, X.; Wang, Q.; Cao, J.; Xiao, J. Seasonal dynamics of total flavonoid contents and antioxidant activity of Dryopteris erythrosora. Food Chem. 2015, 186, 113–118. [Google Scholar] [CrossRef]
- Musa, K.H.; Abdullah, A.; Kuswandi, B.; Hidayat, M.A. A novel high throughput method based on the DPPH dry reagent array for determination of antioxidant activity. Food Chem. 2013, 141, 4102–4106. [Google Scholar] [CrossRef]
- Benzie, I.F.F.; Strain, J.J. The Ferric Reducing Ability of Plasma (FRAP) as a Measure of “Antioxidant Power”: The FRAP Assay. Anal. Biochem. 1996, 239, 70–76. [Google Scholar]
- Qian, H.; Liu, T.; Deng, M.; Miao, H.; Cai, C.; Shen, W.; Wang, Q. Effects of light quality on main health-promoting compounds and antioxidant capacity of Chinese kale sprouts. Food Chem. 2016, 196, 1232–1238. [Google Scholar] [CrossRef]
- Sanui, H. Activated oxygen ashing of biological specimens for the micro determination of Na, K, Mg, and Ca by atomic absorption spectrophotometry. Anal. Biochem. 1971, 42, 21–28. [Google Scholar]
- Zhuang, L.; Huang, G.; Li, X.; Xiao, J.; Guo, L. Effect of different LED lights on aliphatic glucosinolates metabolism and biochemical characteristics in broccoli sprouts. Food Res. Int. 2022, 154, 111015. [Google Scholar] [CrossRef]
- Jribi, S.; Molnàr, H.; Antal, O.T.; Adànyi, N.; Kheriji, O.; Naàr, Z.; Debbabi, H. Zinc fortification as a tool for improving sprout hygienic and nutritional quality: A factorial design approach. J. Sci. Food Agric. 2019, 99, 5187–5194. [Google Scholar] [CrossRef]
- Wang, J.; Moeen-Ud-Din, M.; Yang, S. Dose-dependent responses of Arabidopsis thaliana to zinc are mediated by auxin homeostasis and transport. Environ. Exp. Bot. 2021, 189, 104554. [Google Scholar] [CrossRef]
- Di Gioia, F.; Petropoulos, S.A.; Ozores-Hampton, M.; Morgan, K.; Rosskopf, E.N. Zinc and Iron Agronomic Biofortification of Brassicaceae Microgreens. Agronomy 2019, 9, 677. [Google Scholar] [CrossRef] [Green Version]
- Kim, E.J.; Kim, T.S.; Kim, M.H. Physicochemical and Antioxidant Properties of Broccoli Sprouts Cultivated in the Plant Factory System. J. Korean Soc. Food Cult. 2013, 28, 57–69. [Google Scholar] [CrossRef]
- Shin, Y.-S.; Lee, M.-J.; Lee, E.-S.; Ahn, J.-H.; Do, H.-W.; Choi, D.-W.; Jeong, J.-D.; Lee, J.-E.; Kim, M.-K.; Park, J.-U.; et al. Effect of Light Emitting Diodes Treatment on Growth and Mineral Contents of Lettuce (Lactuca sativa L. ‘Chung Chi Ma’)*. Korean J. Org. Agric. 2013, 21, 659–668. [Google Scholar] [CrossRef]
- Gerovac, J.R.; Craver, J.K.; Boldt, J.K.; Lopez, R.G. Light Intensity and Quality from Sole-source Light-emitting Diodes Impact Growth, Morphology, and Nutrient Content of Brassica Microgreens. HortScience 2016, 51, 497–503. [Google Scholar] [CrossRef]
- Gao, S.; Kong, Y.; Lv, Y.; Cao, B.; Chen, Z.; Xu, K. Effect of different LED light quality combination on the content of vitamin C, soluble sugar, organic acids, amino acids, antioxidant capacity and mineral elements in green onion (Allium fistulosum L.). Food Res. Int. 2022, 156, 111329. [Google Scholar] [CrossRef]
- Kopsell, D.A.; Sams, C.E. Increases in Shoot Tissue Pigments, Glucosinolates, and Mineral Elements in Sprouting Broccoli after Exposure to Short-duration Blue Light from Light Emitting Diodes. J. Am. Soc. Hortic. Sci. 2013, 138, 31–37. [Google Scholar] [CrossRef]
- Kopsell, D.A.; Sams, C.E.; Morrow, R.C. Blue Wavelengths from LED Lighting Increase Nutritionally Important Metabolites in Specialty Crops. HortScience 2015, 50, 1285–1288. [Google Scholar] [CrossRef]
- Choi, M.-K.; Chang, M.-S.; Eom, S.-H.; Min, K.-S.; Kang, M.-H. Physicochemical Composition of Buckwheat Microgreens Grown under Different Light Conditions. J. Korean Soc. Food Sci. Nutr. 2015, 44, 709–715. [Google Scholar] [CrossRef]
- Sams, C.; Kopsell, D.; Morrow, R. Light quality impacts on growth, flowering, mineral uptake and petal pigmentation of marigold. Acta Hortic. 2016, 1134, 139–146. [Google Scholar] [CrossRef]
- Amoozgar, A.; Mohammadi, A.; Sabzalian, M.R. Impact of light-emitting diode irradiation on photosynthesis, phytochemical composition and mineral element content of lettuce cv. Grizzly. Photosynthetica 2016, 55, 85–95. [Google Scholar] [CrossRef]
- Pennisi, G.; Blasioli, S.; Cellini, A.; Maia, L.; Crepaldi, A.; Braschi, I.; Spinelli, F.; Nicola, S.; Fernandez, J.A.; Stanghellini, C.; et al. Unraveling the Role of Red:Blue LED Lights on Resource Use Efficiency and Nutritional Properties of Indoor Grown Sweet Basil. Front. Plant Sci. 2019, 10, 305. [Google Scholar] [CrossRef] [Green Version]
- Brazaitytė, A.; Miliauskienė, J.; Vaštakaitė-Kairienė, V.; Sutulienė, R.; Laužikė, K.; Duchovskis, P.; Małek, S. Effect of Different Ratios of Blue and Red LED Light on Brassicaceae Microgreens under a Controlled Environment. Plants 2021, 10, 801. [Google Scholar]
- Bartucca, M.L.; Del Buono, D.; Ballerini, E.; Benincasa, P.; Falcinelli, B.; Guiducci, M. Effect of Light Spectrum on Gas Exchange, Growth and Biochemical Characteristics of Einkorn Seedlings. Agronomy 2020, 10, 1042. [Google Scholar] [CrossRef]
- He, P.; Lv, X.; Wang, G. Effects of Se and Zn supplementation on the antagonism against Pb and Cd in vegetables. Environ. Int. 2004, 30, 167–172. [Google Scholar] [CrossRef]
- Gupta, N.; Ram, H.; Kumar, B. Mechanism of Zinc absorption in plants: Uptake, transport, translocation and accumulation. Rev. Environ. Sci. Biotechnol. 2016, 15, 89–109. [Google Scholar] [CrossRef]
- Angulo-Bejarano, P.I.; Puente-Rivera, J.; Cruz-Ortega, R. Metal and Metalloid Toxicity in Plants: An Overview on Molecular Aspects. Plants 2021, 10, 635. [Google Scholar] [CrossRef]
- Rietra, R.P.J.J.; Heinen, M.; Dimkpa, C.O.; Bindraban, P.S. Effects of Nutrient Antagonism and Synergism on Yield and Fertilizer Use Efficiency. Commun. Soil Sci. Plant Anal. 2017, 48, 1895–1920. [Google Scholar] [CrossRef]
- Shafiq, I.; Hussain, S.; Raza, M.A.; Iqbal, N.; Asghar, M.A.; Raza, A.; Fan, Y.-F.; Mumtaz, M.; Shoaib, M.; Ansar, M.; et al. Crop photosynthetic response to light quality and light intensity. J. Integr. Agric. 2020, 20, 4–23. [Google Scholar] [CrossRef]
- Pennisi, G.; Orsini, F.; Blasioli, S.; Cellini, A.; Crepaldi, A.; Braschi, I.; Spinelli, F.; Nicola, S.; Fernandez, J.A.; Stanghellini, C.; et al. Resource use efficiency of indoor lettuce (Lactuca sativa L.) cultivation as affected by red:blue ratio provided by LED lighting. Sci. Rep. 2019, 9, 14127. [Google Scholar] [CrossRef]
- Son, K.-H.; Oh, M.-M. Leaf Shape, Growth, and Antioxidant Phenolic Compounds of Two Lettuce Cultivars Grown under Various Combinations of Blue and Red Light-emitting Diodes. HortScience 2013, 48, 988–995. [Google Scholar] [CrossRef]
- Meas, S.; Luengwilai, K.; Thongket, T. Enhancing growth and phytochemicals of two amaranth microgreens by LEDs light irradiation. Sci. Hortic. 2020, 265, 109204. [Google Scholar] [CrossRef]
- Dou, H.; Niu, G.; Gu, M.; Masabni, J.G. Effects of Light Quality on Growth and Phytonutrient Accumulation of Herbs under Controlled Environments. Horticulturae 2017, 3, 36. [Google Scholar] [CrossRef] [Green Version]
- Huché-Thélier, L.; Crespel, L.; Le Gourrierec, J.; Morel, P.; Sakr, S.; Leduc, N. Light signaling and plant responses to blue and UV radiations—Perspectives for applications in horticulture. Environ. Exp. Bot. 2016, 121, 22–38. [Google Scholar] [CrossRef]
- Li, H.; Tang, C.; Xu, Z.; Liu, X.; Han, X. Effects of Different Light Sources on the Growth of Non-heading Chinese Cabbage (Brassica campestris L.). J. Agric. Sci. 2012, 4, 262–273. [Google Scholar] [CrossRef]
- Ricachenevsky, F.K.; Menguer, P.K.; Sperotto, R.A.; Fett, J.P. Got to hide your Zn away: Molecular control of Zn accumulation and biotechnological applications. Plant Sci. 2015, 236, 1–17. [Google Scholar] [CrossRef]
- De Micco, V.; Amitrano, C.; Vitaglione, P.; Ferracane, R.; Pugliese, M.; Arena, C. Effect of light quality and ionising radiation on morphological and nutraceutical traits of sprouts for astronauts’ diet. Acta Astronaut. 2021, 185, 188–197. [Google Scholar] [CrossRef]
- Lee, S.-W.; Seo, J.M.; Lee, M.-K.; Chun, J.-H.; Antonisamy, P.; Arasu, M.V.; Suzuki, T.; Al-Dhabi, N.A.; Kim, S.-J. Influence of different LED lamps on the production of phenolic compounds in common and Tartary buckwheat sprouts. Ind. Crops Prod. 2014, 54, 320–326. [Google Scholar] [CrossRef]
- Chen, X.-L.; Guo, W.-Z.; Xue, X.-Z.; Wang, L.-C.; Qiao, X.-J. Growth and quality responses of ‘Green Oak Leaf’ lettuce as affected by monochromic or mixed radiation provided by fluorescent lamp (FL) and light-emitting diode (LED). Sci. Hortic. 2014, 172, 168–175. [Google Scholar] [CrossRef]
- Ohashi-Kaneko, K.; Takase, M.; Kon, N.; Fujiwara, K.; Kurata, K. Effect of Light Quality on Growth and Vegetable Quality in Leaf Lettuce, Spinach and Komatsuna. Environ. Control Biol. 2007, 45, 189–198. [Google Scholar] [CrossRef]
- Lobiuc, A.; Vasilache, V.; Oroian, M.; Stoleru, T.; Burducea, M.; Pintilie, O.; Zamfirache, M.-M. Blue and Red LED Illumination Improves Growth and Bioactive Compounds Contents in Acyanic and Cyanic Ocimum basilicum L. Microgreens. Molecules 2017, 22, 2111. [Google Scholar] [CrossRef]
- Stanton, C.; Sanders, D.; Krämer, U.; Podar, D. Zinc in plants: Integrating homeostasis and biofortification. Mol. Plant 2022, 15, 65–85. [Google Scholar] [CrossRef]
- Dai, H.; Wei, S.; Twardowska, I. Biofortification of soybean (Glycine max L.) with Se and Zn, and enhancing its physiological functions by spiking these elements to soil during flowering phase. Sci. Total Environ. 2020, 740, 139648. [Google Scholar] [CrossRef]
- Zhao, K.; Zhao, C.; Yang, M.; Yin, D. ZnCl2 treatment improves nutrient quality and Zn accumulation in peanut seeds and sprouts. Sci. Rep. 2020, 10, 2364. [Google Scholar] [CrossRef]
- Augustine, R.; Bisht, N.C. Biofortification of oilseed Brassica juncea with the anti-cancer compound glucoraphanin by suppressing GSL-ALK gene family. Sci. Rep. 2015, 5, 18005. [Google Scholar] [CrossRef]
- Kopsell, D.A.; Sams, C.E.; Barickman, T.C.; Morrow, R.C. Sprouting Broccoli Accumulate Higher Concentrations of Nutritionally Important Metabolites under Narrow-band Light-emitting Diode Lighting. J. Am. Soc. Hortic. Sci. 2014, 139, 469–477. [Google Scholar] [CrossRef]
- Xue, A.; Liang, W.; Wen, S.; Gao, Y.; Huang, X.; Tong, Y.; Hao, Y.; Luo, L. Metabolomic analysis based on EESI-MS indicate blue LED light promotes aliphatic-glucosinolates biosynthesis in broccoli sprouts. J. Food Compos. Anal. 2021, 97, 103777. [Google Scholar] [CrossRef]
- Chen, J.; Chen, Z.; Li, Z.; Zhao, Y.; Chen, X.; Wang-Pruski, G.; Guo, R. Effect of Photoperiod on Chinese Kale (Brassica alboglabra) Sprouts Under White or Combined Red and Blue Light. Front. Plant Sci. 2021, 11, 589746. [Google Scholar] [CrossRef]
- Groenbaek, M.; Tybirk, E.; Kristensen, H.L. Glucosinolate and carotenoid content of white- and yellow-flowering rapeseed grown for human consumption as sprouts and seedlings under light emitting diodes. Eur. Food Res. Technol. 2018, 244, 1121–1131. [Google Scholar] [CrossRef]
- Jiráček, V.; Kutáček, M.; Salkade, S.; Koštíř, J. Effect of Zinc on the Biosynthesis of Indole Glucosinolates Glucobrassicin and Neoglucobrassicin in Etlolated Seedlings of Rape (Brassica napus var. arvensis (LAM) THELL). Biol. Plant. 1974, 16, 454–461. [Google Scholar]
- Klimek-Szczykutowicz, M.; Szopa, A.; Blicharska, E.; Dziurka, M.; Komsta, Ł.; Ekiert, H. Bioaccumulation of selected macro- and microelements and their impact on antioxidant properties and accumulation of glucosinolates and phenolic acids in in vitro cultures of Nasturtium officinale (watercress) microshoots. Food Chem. 2019, 300, 125184. [Google Scholar] [CrossRef]
- Aghajanzadeh, T.A.; Prajapati, D.H.; Burow, M. Differential partitioning of thiols and glucosinolates between shoot and root in Chinese cabbage upon excess zinc exposure. J. Plant Physiol. 2020, 244, 153088. [Google Scholar] [CrossRef]


| Treatment | R-B Ratio | Zn Concentration (mM) | Hypocotyl Length (cm) | Fresh Weight (mg/plant) | Dry Weight (mg/plant) | Moisture Content (%) |
|---|---|---|---|---|---|---|
| 1R2B +Zn 0 | 1R2B | 0 | 2.92 ± 0.41 a | 29.50 ± 0.87 b | 1.60 ± 0.05 d | 94.81 ± 0.17 a |
| 1R2B +Zn 1.74 | 1.74 | 2.78 ± 0.21 ab | 29.38 ± 0.80 b | 1.64 ± 0.05 cd | 94.54 ± 0.12 ab | |
| 1R2B +Zn 3.48 | 3.48 | 2.67 ± 0.33 b | 30.88 ± 0.44 ab | 1.73 ± 0.04 c | 94.38 ± 0.09 b | |
| 1R2B +Zn 10.43 | 10.43 | 2.44 ± 0.21 c | 31.50 ± 0.50 a | 1.87 ± 0.04 b | 93.95 ± 0.15 c | |
| 1R2B +Zn 17.39 | 17.39 | 2.32 ± 0.27 c | 32.75 ± 0.45 a | 2.05 ± 0.04 a | 93.58 ± 0.16 c | |
| 2R1B +Zn 0 | 2R1B | 0 | 2.89 ± 0.08 a | 30.10 ± 0.55 b | 1.76 ± 0.05 b | 94.14 ± 0.15 a |
| 2R1B +Zn 1.74 | 1.74 | 2.86 ± 0.07 a | 31.10 ± 0.85 b | 1.82 ± 0.06 b | 94.14 ± 0.10 a | |
| 2R1B +Zn 3.48 | 3.48 | 2.78 ± 0.08 a | 31.90 ± 1.64 b | 1.89 ± 0.05 b | 94.09 ± 0.09 a | |
| 2R1B +Zn 10.43 | 10.43 | 2.47 ± 0.05 b | 35.30 ± 5.84 a | 2.28 ± 0.07 a | 93.53 ± 0.14 b | |
| 2R1B +Zn 17.39 | 17.39 | 2.23 ± 0.05 c | 32.40 ± 3.42 b | 2.30 ± 0.07 a | 92.86 ± 0.14 c | |
| Significance | ||||||
| L | NS | ** | *** | *** | ||
| Zn | *** | *** | *** | *** | ||
| Zn*L | NS | * | NS | NS | ||
| Treatment | R-B Ratio | Zn Concentration (mM) | Zn (g kg−1 DW) | Ca (g kg−1 DW) | Mg (g kg−1 DW) | Fe (g kg−1 DW) |
|---|---|---|---|---|---|---|
| 1R2B +Zn 0 | 0 | 0.15 ± 0.00 e | 11.90 ± 0.11 a | 4.61 ± 0.05 a | 0.14 ± 0.00 a | |
| 1R2B +Zn 1.74 | 1.74 | 0.33 ± 0.00 d | 12.24 ± 0.27 a | 4.73 ± 0.04 a | 0.13 ± 0.00 ab | |
| 1R2B +Zn 3.48 | 1R2B | 3.48 | 0.58 ± 0.01 c | 12.34 ± 0.07 a | 4.37 ± 0.04 b | 0.12 ± 0.00 b |
| 1R2B +Zn 10.43 | 10.43 | 1.35 ± 0.04 b | 12.11 ± 0.24 a | 4.07 ± 0.04 c | 0.11 ± 0.00 c | |
| 1R2B +Zn 17.39 | 17.39 | 1.88 ± 0.01 a | 11.04 ± 0.20 b | 3.88 ± 0.04 d | 0.10 ± 0.00 c | |
| 2R1B +Zn 0 | 0 | 0.14 ± 0.00 e | 12.07 ± 0.54 a | 4.24 ± 0.13 a | 0.13 ± 0.00 a | |
| 2R1B +Zn 1.74 | 1.74 | 0.34 ± 0.01 d | 11.88 ± 0.14 a | 4.02 ± 0.26 ab | 0.13 ± 0.00 ab | |
| 2R1B +Zn 3.48 | 2R1B | 3.48 | 0.58 ± 0.01 c | 11.66 ± 0.13 a | 3.83 ± 0.17 ab | 0.12 ± 0.00 b |
| 2R1B +Zn 10.43 | 10.43 | 1.43 ± 0.01 b | 11.32 ± 0.13 ab | 3.60 ± 0.18 b | 0.11 ± 0.00 c | |
| 2R1B +Zn 17.39 | 17.39 | 1.74 ± 0.02 a | 10.41 ± 0.37 b | 3.63 ± 0.01 b | 0.10 ± 0.00 d | |
| Significance | ||||||
| L | NS | ** | *** | * | ||
| Zn | *** | *** | *** | *** | ||
| Zn*L | ** | NS | NS | NS | ||
| Interaction | Chl a | Chl b | Car | Chl | Chl a/b | Chl/Car |
|---|---|---|---|---|---|---|
| L | *** | *** | *** | *** | NS | *** |
| Zn | *** | *** | *** | *** | NS | * |
| L*Zn | ** | NS | ** | * | NS | *** |
| Interaction | SP | SS | Vc |
|---|---|---|---|
| L | *** | *** | *** |
| Zn | ** | *** | *** |
| L*Zn | NS | NS | NS |
| Interaction | DPPH | FRAP | TP | TF |
|---|---|---|---|---|
| L | NS | *** | *** | ** |
| Zn | *** | *** | *** | *** |
| L*Zn | NS | *** | *** | *** |
| Interaction | PRO | GRA | SIN | GNA | 4−HGBS | GBN | GBS | 4−MGBS | NGBS | AGLs | IGLs | GLs |
|---|---|---|---|---|---|---|---|---|---|---|---|---|
| L | *** | * | * | * | NS | * | *** | * | NS | * | NS | * |
| Zn | *** | *** | *** | ** | *** | NS | *** | NS | *** | NS | ** | NS |
| L*Zn | NS | NS | NS | NS | NS | NS | *** | * | NS | NS | NS | NS |
Disclaimer/Publisher’s Note: The statements, opinions and data contained in all publications are solely those of the individual author(s) and contributor(s) and not of MDPI and/or the editor(s). MDPI and/or the editor(s) disclaim responsibility for any injury to people or property resulting from any ideas, methods, instructions or products referred to in the content. |
© 2023 by the authors. Licensee MDPI, Basel, Switzerland. This article is an open access article distributed under the terms and conditions of the Creative Commons Attribution (CC BY) license (https://creativecommons.org/licenses/by/4.0/).
Share and Cite
Li, X.; Liu, K.; He, X.; Chen, Y.; Tan, J.; Jiang, H.; He, R.; Li, Y.; Liu, H. Mutual Effects of Zinc Concentration and Ratio of Red-Blue Light on Growth and Nutritional Quality of Flowering Chinese Cabbage Sprouts. Horticulturae 2023, 9, 226. https://doi.org/10.3390/horticulturae9020226
Li X, Liu K, He X, Chen Y, Tan J, Jiang H, He R, Li Y, Liu H. Mutual Effects of Zinc Concentration and Ratio of Red-Blue Light on Growth and Nutritional Quality of Flowering Chinese Cabbage Sprouts. Horticulturae. 2023; 9(2):226. https://doi.org/10.3390/horticulturae9020226
Chicago/Turabian StyleLi, Xiaopeng, Kaizhe Liu, Xinyang He, Yongkang Chen, Jiehui Tan, Haozhao Jiang, Rui He, Yamin Li, and Houcheng Liu. 2023. "Mutual Effects of Zinc Concentration and Ratio of Red-Blue Light on Growth and Nutritional Quality of Flowering Chinese Cabbage Sprouts" Horticulturae 9, no. 2: 226. https://doi.org/10.3390/horticulturae9020226