Article

Non-Thermal Plasma and Soilless Nutrient Solution Application: Effects on Nutrient Film Technique Lettuce Cultivation

Department of Agronomy, Food, Natural Resources, Animals and Environment (DAFNAE), University of Padova, 35020 Legnaro, Italy
*
Author to whom correspondence should be addressed.
Horticulturae 2023, 9(2), 208; https://doi.org/10.3390/horticulturae9020208
Submission received: 3 December 2022 / Revised: 27 January 2023 / Accepted: 1 February 2023 / Published: 4 February 2023
(This article belongs to the Special Issue Advanced of Horticulture Innovative Irrigation Technologies)

Abstract

:
Soilless cultivation is one of the best examples of the sustainable intensification concept due to the high use efficiency of its inputs. Managing the nutrient solution through a closed cycle system represents a crucial objective to be pursued, but the recovery of the nutrient solution requires chemical correction and sanitization. The application of non-thermal plasma (NTP) in agriculture promotes the safety of the nutrient solution, decreasing the use of chemicals. The aim of this study was to evaluate the effects of cold plasma on the nutrient depletion, yield, and qualitative traits of lettuce. A closed soilless system (nutrient film technique) was used to compare different NTP treatments: control, low ionization (LI), and high ionization (HI) in two successive lettuce cycles. No significant differences within the nutrient depletion trends were observed. The treated lettuce’s yield was 12% higher than that of the control, characterized by a higher total soluble solid content and a significantly higher electrical conductivity and titratable acidity than the control. The ion content was higher in HI plants, as were the contents of nitrogen, phosphorous, and potassium. In HI plants, the leaf pigments were higher, but no significant changes were observed for the antioxidant content. Cold plasma is a promising strategy that brings benefits to the crop.

1. Introduction

The agricultural industry is continually stressed by new challenges related to climate change; biotic and abiotic stresses; and reductions in resources, such as soil, water, and nutrients. In this context, soilless cultivations can offer significant support capable of pursuing the goals of sustainable intensification by trying to maximize the use efficiency of resources and the increased yield per unit area by limiting soil consumption [1,2,3,4]. In addition, the soilless technique can be used to cultivate crops on degraded soils, which are not suitable for conventional agricultural activities. Moreover, technologies able to promote the recirculation of the nutrient solution, reduce the water and nutrient waste, and manage the phytosanitary conditions can be useful. Non-thermal plasma (NTP) represents a technology capable of generating partially ionized gases at low temperatures that contain several reactive chemical species [5]. This technology has so far been widely used in medical, bio-medical [6], and environmental contexts for the removal or degradation of pollutants [7]. The agricultural industry represents a new area of recent application where NTP can find important applications. These can generally be performed within two main phases of the crop production: pre- and post-harvest [8]. In particular, the NTP can be directly supplied on the plant tissues through ionized air or through a physical medium, generally water, by irrigation, for example. In this case, the treated water is called plasma-activated water (PAW) [9]. The chemical species that make up the PAW are similar to those of ionized air. The applications of cold plasma post-harvest are more widespread and well known, especially for the decontamination of edible products and their storage [10,11,12]. However, pre-harvest treatments are promising, and one of their most interesting aspects is the improvement in germination and the early growth of the seedlings [13]. As mentioned above, one of the factors that limit the environmental sustainability of vegetable crops is the massive use of water, fertilizers, and plant protection products. Studies, such as those conducted by Burchi et al. [14], have shown that NTP can be effectively applied to the nutrient solutions, improving the closed-loop soilless cultivation systems. NTP can be a good alternative to conventional treatments, such as chlorine, heat, or ultraviolet light, which have good antimicrobial functions. Furthermore, recent experimental approaches have also considered the opportunity to apply NTP to ornamental species always cultivated in closed-loop soilless systems [15,16]. NTP turns out to be a treatment that can promote the growth performances of the plant. More precisely, NTP can induce the formation of nitrate (NO3) and ammonium (NH4+) through the oxidation and reduction of molecular nitrogen (N2) after its dissociation; this could support the global demand for nitrogen by offering a more sustainable response both from the economic and environmental point of view [17]. The results available so far on the application of NTP in the soilless cultivation of vegetables are still limited, often with inconsistent responses in relation to the species used [15,16]. The main aim of this research is to evaluate the treatment of the nutrient solution with NTP in the cultivation of lettuce using the nutrient film technique, one of the most widely grown species in soilless conditions, in order to evaluate the depletion of nutrients together with productive and qualitative effects.

2. Materials and Methods

The experiment was conducted at the experimental farm “Lucio Toniolo”, University of Padova, Northeastern Italy (45° 21′ N; 11° 58′ E; 6 m a.s.l.). The cultivation of two lettuce (Kerlis cv) crop cycles was considered: the first from 21 October to 14 December 2020 (57 days) and the second one from 5 March to 16 April 2021 (43 days). The main climatic parameters during the greenhouse crop cycles are shown in Table 1.
The experiment was carried out in a single-span greenhouse tunnel (12 × 50 m wide), 6 m and 4 m high at the roof top and at the gutter level, respectively, characterized by a plastic covering material and movable side walls controlled by a climatic control unit.
The soilless cultivation system adopted was a simplified version of the nutrient film technique (NFT). The NFT cultivation system was characterized by the following traits: 12 plastic PVC pipes (lengths of 2 m and 100 mm in diameter) organized in four cultivation plots (three pipes each). The pipes were placed on metal structures to facilitate the monitoring and harvest operations. Each cultivation system can be considered as a closed-loop system, since the nutrient solution was pumped (1700 L h−1) from the collection tank (400 L capacity) to the pipes where the plants were hosted (10 per pipe) and then flowed back into the tank by falling through a flexible pipe. The tank was closed by a lid to limit water losses through evaporation and housed the pumping unit of the system. Three NFT systems implemented as reported above were used to evaluate the effect of different ionization treatments of the nutrient solution: high ionization (HI), low ionization (LI), and untreated control.
In HI and LI systems, the nutrient solution was treated at different intensities with NTP air through porous stones immersed in the collection tanks. In the HI system, the treated air was derived from three lines of condensers, each consisting of five units that generated cold plasma at a flow rate of 5 L min−1 per line. Each unit produced NTP through a dielectric barrier discharge device system (Jonix S.p.A., Tribano, PD, Italy) capable of operating with a voltage of 2.85 kV (42.75 kV overall). The LI system, characterized by low ionization, used NTP generated by two elements (5.7 kV) for a flow rate of 2 L min−1. The functioning of both NTP systems was continuous. The control was equipped with an oxygenation system of the nutrient solution through an air flow comparable to that of the other systems in order to measure only the effect of NTP on plants. The composition of the nutrient solution set up at the beginning of each growing cycle is reported in Table 2. The solution was prepared according to the Resh method for leafy vegetables, and the composition was calculated using the free HydroBuddy software [18] to provide the nutrients necessary for the whole crop cycle.

2.1. Morphological and Plant Analyses

The height and number of leaves of plants were recorded twice a week in the first part of the crop cycle (20 days); afterwards, the diameter of the plant was measured as the plant was characterized by a compact vegetative habitus. The nutritional status of the crop was monitored weekly by means of the SPAD index (Chlorophyll Meter SPAD-502Plus), and the water consumption of the systems was quantified daily by refilling the tanks with water; subsequently, the pH, the electrical conductivity (EC), and the temperature (°C) of the nutrient solution were also evaluated. At the end of each refill, three samples of the solution were taken to measure the content of anions and cations. At harvest, destructive measurements were carried out, evaluating the fresh weight of the aerial and root biomass. All measurements were performed on 30 plants for each system. Then, the determination of the dry matter percentage was realized at 65 °C for 48 h in a ventilated oven (Pid System—MPM Instruments srl—Italy). Two subsamples (consisting of approximately 500 g of marketable product each) were used for qualitative analysis after freezing or freeze-drying process. The morphological and weight measurements were performed in the same way in both growth cycles.

2.2. Qualitative Analysis

The chemical analyses concerning pH, EC, titratable acidity, and total soluble solids content were performed on the plant leaves and root samples after milling the frozen sample and extracting the cellular juices via centrifuge (5000 rpm). The pH and EC values were measured using a portable pH meter–conductivity meter (HI19811—Hanna Instrument). An aliquot of the liquid sample was also used for the determination of the total soluble solids using a digital portable refractometer (HI96801 Hanna Instruments). The titratable acidity was determined according to the ISO 750: 1998 (E) standard method using an automatic titrator (Titrex Act Steroglass s.r.l). All the qualitative analyses were performed in three replicates.
As regards the determination of the content of anions and cations, ion chromatography (IC) was performed using an ICS-900 system (Dionex Corp., Milan, Italy) equipped with a dual piston pump, model AS-DV autosampler, isocratic column at room temperature, DS5 conductivity detector, and AMMS 300 suppressor (4 mm) for anions and CMMS 300 suppressor (4 mm) for cations. Chromeleon 6.5 Chromatography Management software was used for system control and data processing. A Dionex IonPac AS23 analytical column (4 × 250 mm) and guard column (4 × 50 mm) were used for anion separation, whereas a Dionex IonPac CS12A analytical column (4 × 250 mm) and guard column (4 × 50 mm) were used for cation separation. The eluent consisted of 4.5 mmol L−1 sodium carbonate and 0.8 mmol L−1 sodium bicarbonate at a flow rate of 1 mL min−1 for anions and of 20 mmol L−1 methanesulfonic acid for cations at the same flow rate. Anions and cations were quantified following a calibration method. Dionex solutions containing seven anions at different concentrations and five cations were taken as standards, and the calibration curves were generated, with concentrations ranging from 0.4 to 20 mg L−1 and from 0.5 to 50 mg L−1 of standards, respectively, as reported by Nicoletto et al. [19]. With respect to the elements N, P, and K, the dry samples were mineralized following the method proposed by Zancan et al. [20]. Samples were then filtered, and the solution was used for element determination, with an emission spectrophotometer ICP-AES (inductively coupled plasma–atomic emission spectroscopy) SPECTRO Ciros (Spectrum Italy Srl, Milan, Italy).

2.3. Determination of Antioxidant Capacity and Total Phenols

Freeze-dried lettuce tissues (0.1 g) were homogenized in methanol (20 mL), with an Ultra Turrax T25 until uniform consistency at 13,500 rpm. Samples were filtered (filter paper, 589 Schleicher), and appropriate aliquots of extracts were assayed by a Folin–Ciocalteau (FC) assay for total phenol (TP) content and by ferric reducing antioxidant power (FRAP) and the DPPH method for the total antioxidant capacity. These determinations were performed by using a Shimadzu UV-1800 spectrophotometer (Columbia, MD, USA).
The latter assay was based on the methodology of Benzie and Strain [21]. The ferric reducing antioxidant power (FRAP) reagent was prepared fresh so that it contained 1 mM 2,4,6-tripyridyl-2-triazine (TPTZ) and 2 mM ferric chloride in 0.25 M sodium acetate at pH 3.6. A 100 μL aliquot of the methanol extract was added to 1900 μL of FRAP reagent and accurately mixed. After incubation at 20 °C for 4 min, the absorbance at 593 nm was determined. Calibration was against a standard curve (0–1200 μg mL−1 ferrous ion) (correlation coefficient: R2 = 0.9968) obtained by the addition of freshly prepared ammonium ferrous sulfate. FRAP values were calculated as mg mL−1 ferrous ion (ferric reducing power) from three determinations and are presented as mg kg−1 of Fe2+E (ferrous ion equivalent).
DPPH (α,α-Diphenyl-β-picrylhydrazyl) radical scavenging activity was also determined. A 0.5 mL aliquot of the methanol extract was mixed with 0.25 mL of an ethanolic 0.5 mM DPPH solution and 0.5 mL of 100 mM acetate buffer (pH 5.5). The tubes were mixed for 15 s, and after 30 min, the absorbance of the mixture was measured at 517 nm [22].
The TP content was determined using the FC assay with gallic acid as the calibration standard. The FC assay was conducted by pipetting 200 μL of methanol extract into a 10 mL PP tube. This was followed by addition of 1 mL of Folin–Ciocalteau’s reagent. The mixture was vortexed for 20–30 s, and 800 μL of filtered 20% sodium carbonate solution was added after 1 min and within 8 min from addition of the FC reagent. This was recorded as time zero; the mixture was then vortexed for 20–30 s after addition of sodium carbonate. After 2 h at room temperature, the absorbance of the colored reaction product was measured at 765 nm. The TP content in the extracts was calculated from a standard calibration curve obtained with concentrations of gallic acid, ranging from 0 to 600 μg mL−1 (correlation coefficient: R2 = 0.9964). Results were expressed as mg of gallic acid equivalent per kg (mg GAE kg−1) of dry lettuce [23].

2.4. Statistical Analysis

The results coming from the two growing cycles revealed a substantial overlap between the two crop cycles, and no significant differences were recorded considering the growing cycle as a factor. Therefore, the two growth cycles were considered as replications of the treatments, and the data presented are the average of the two cycles. Overall, three NTP treatments and three cultivation systems were considered in two growing cycles. Quantitative and qualitative data were statistically processed through one-way analysis of variance (ANOVA), and the means were separated through the Tukey HSD test at p ≤ 0.05. Statgraphics 19 centurion software (Statgraphics Technologies, Inc., The Plains, United States) was used for statistical processing.

3. Results

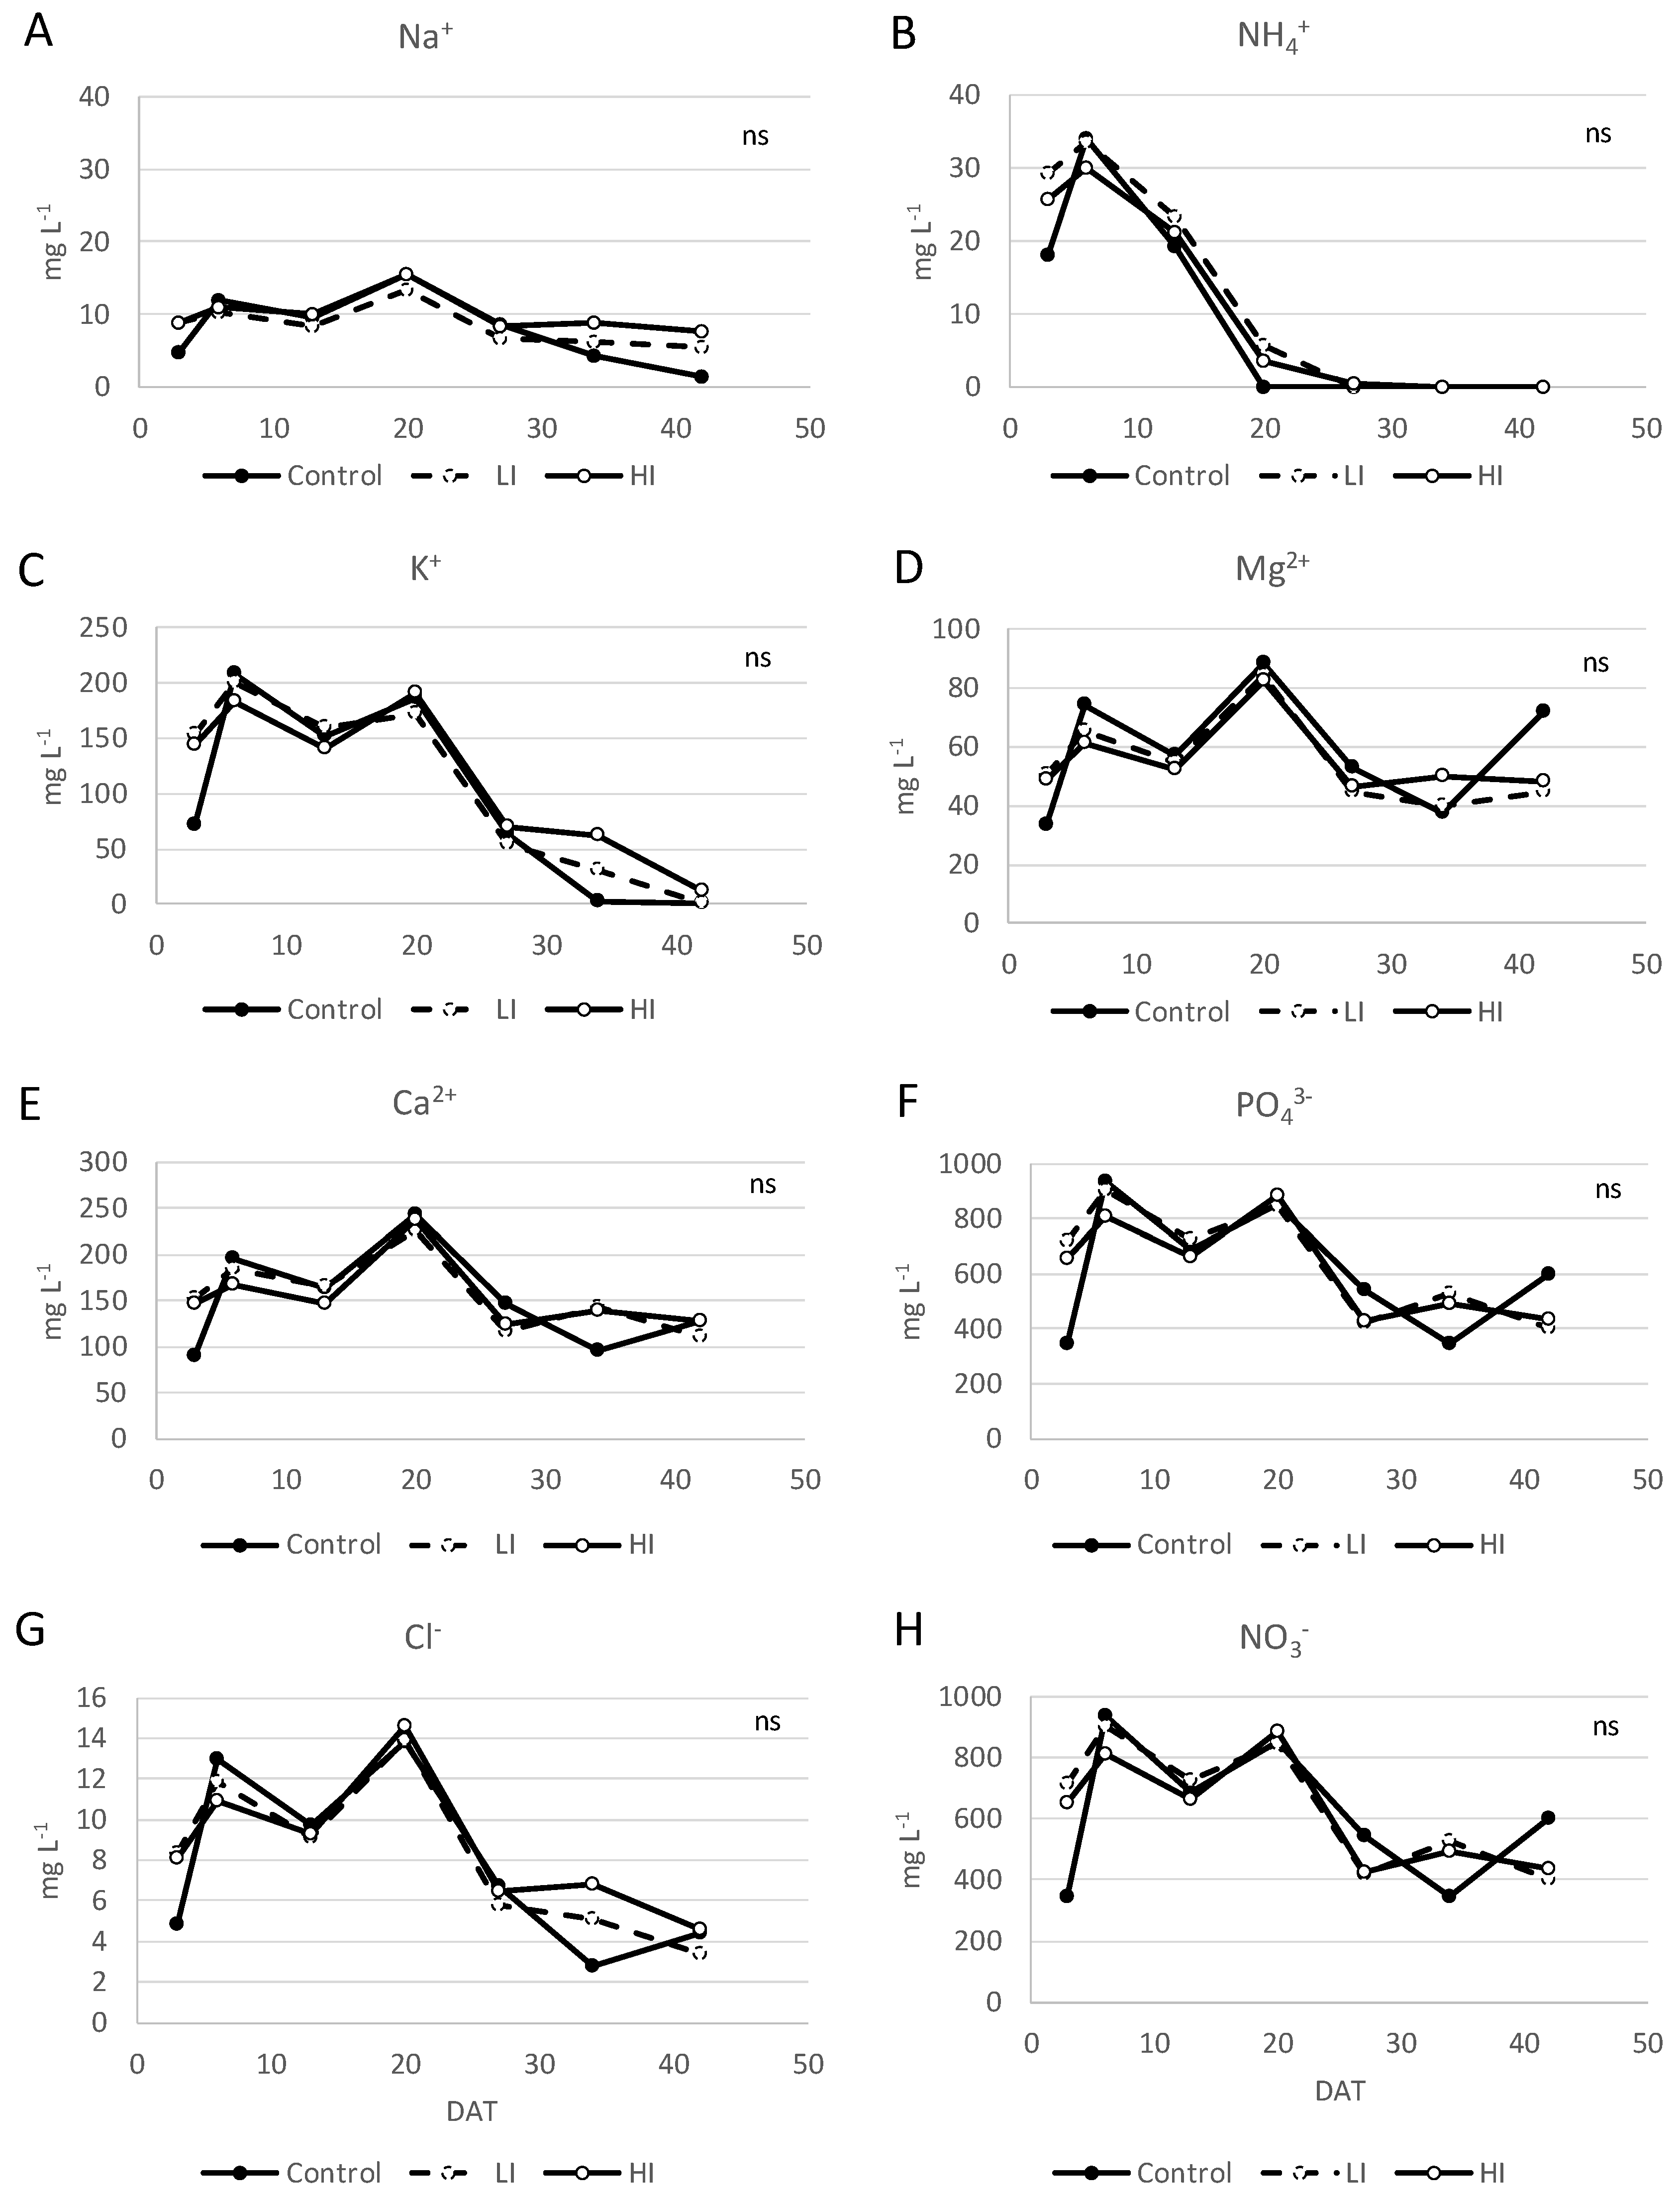
3.1. Nutrient Solution

The pH values of the three nutrient solutions showed the same trend, maintaining quite stable values between 7.00 and 7.50 throughout the crop cycle. The EC was characterized by a decreasing trend in all three nutritional solutions from 2.3 mS cm−1 to 0.9 mS cm−1, whereas the temperature of the nutrient solution varied from 15° to 23° C.
The evapotranspirated water volume was characterized by the same cumulative trend for the three treatments. However, the water consumption of the control, equal to 820 L, was 8.8% and 9.9% higher than LI and HI, respectively. Concerning the water use efficiency, no significant differences were detected, and the values were 3.67 g dry matter L−1, 3.49 g dry matter L−1, and 3.28 g dry matter L−1 for the control, LI, and HI, respectively. During the crop cycle, the samples of the nutrient solution allowed monitoring the anions and cations concentrations in relation to the NTP treatment (Figure 1), but no significant differences were observed. Concerning sodium, in the first period, the concentration gradually increased, reaching 15 mg L−1 after 21 DAT (Figure 1A). Afterwards, a reduction led to 7.66, 1.48, and 5.52 mg L−1, respectively, in the control, LI, and HI. The trend of ammonium and potassium concentration was similar (Figure 1B,C). For the first one, complete depletion was recorded after 21 DAT. For potassium, the concentration of the nutrient solution was significantly reduced after 21 DAT; values close to zero, especially for control and LI treatment, were observed just near the end of the crop cycle. For all the treatments, the magnesium and calcium contents were not stable (Figure 1D,E), but they all showed the same trend, showing values between 30 and 90 mg L−1 and between 96 and 250 mg L−1, respectively. As for sodium, also for these two cations, peaks corresponding to 83–88 and 225–243 mg L−1, respectively, were highlighted after 21 DAT, followed by a progressive decrease down to a concentration of 45 and 127 mg L−1, except for the magnesium contained in the nutrient solution of the control, the content of which was 72 mg L−1. Moving to the anions, the concentrations of chlorides, nitrates, and phosphates showed an evolution comparable to the sodium one and after 21 DAT (Figure 1F–H); then, the concentrations progressively decreased.

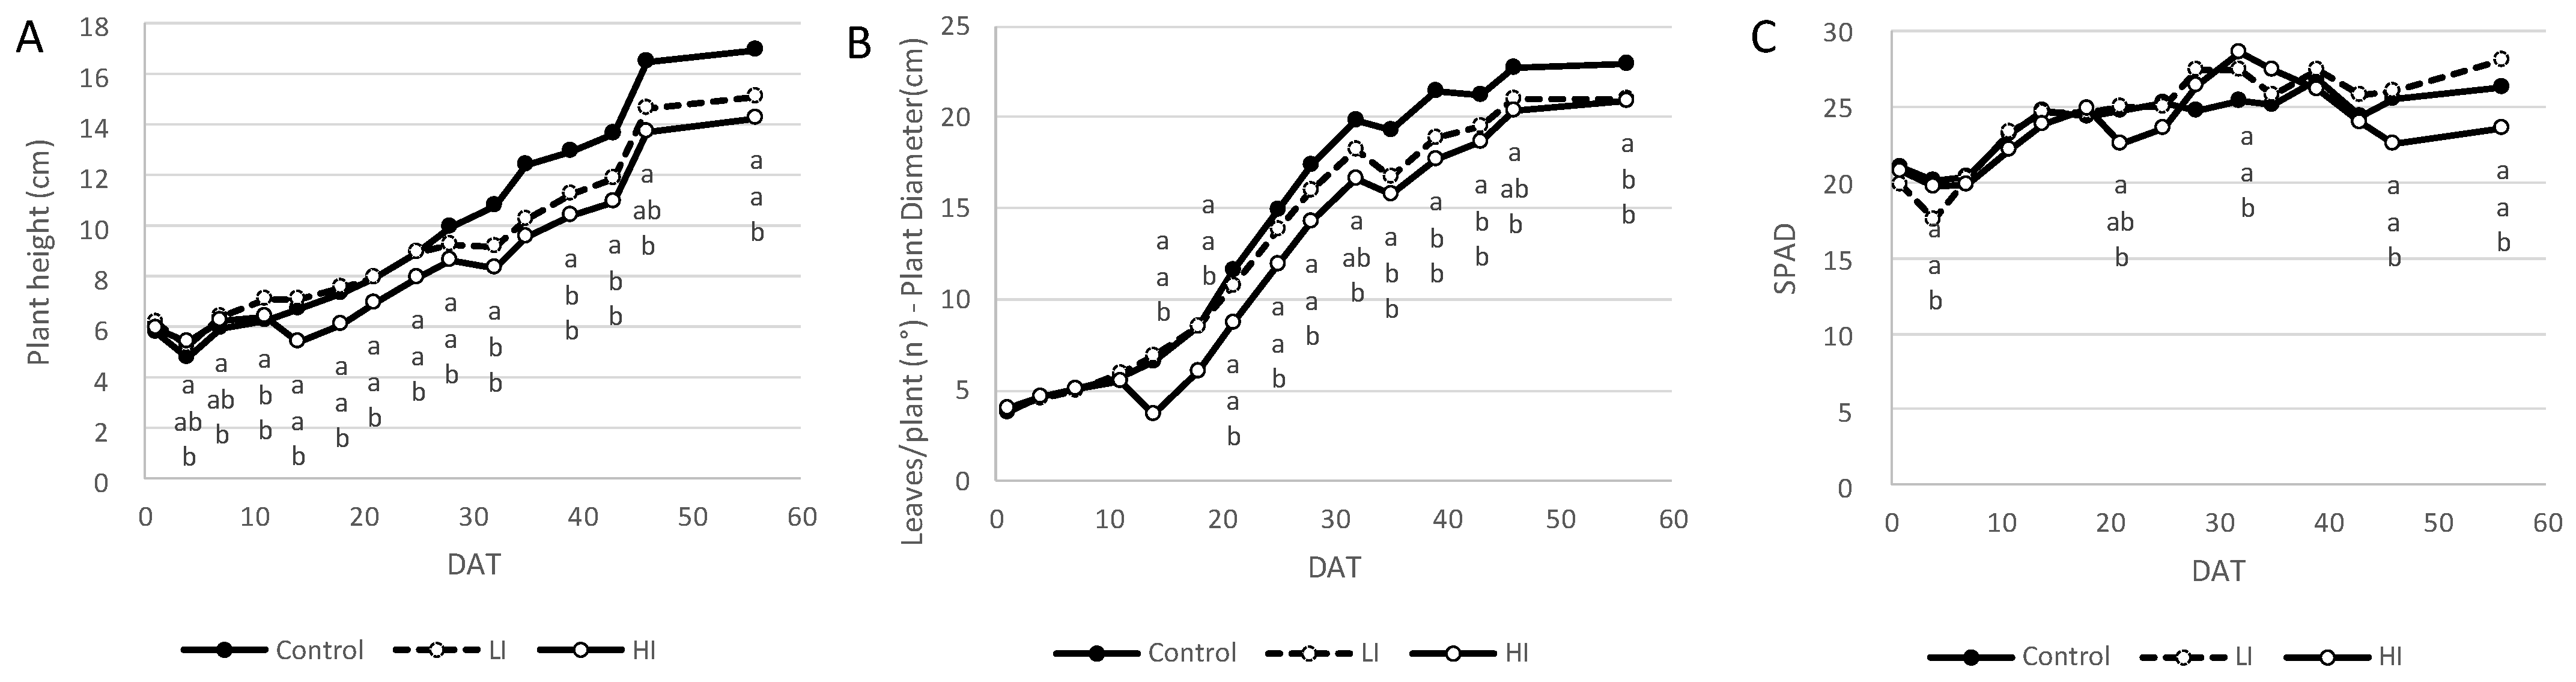
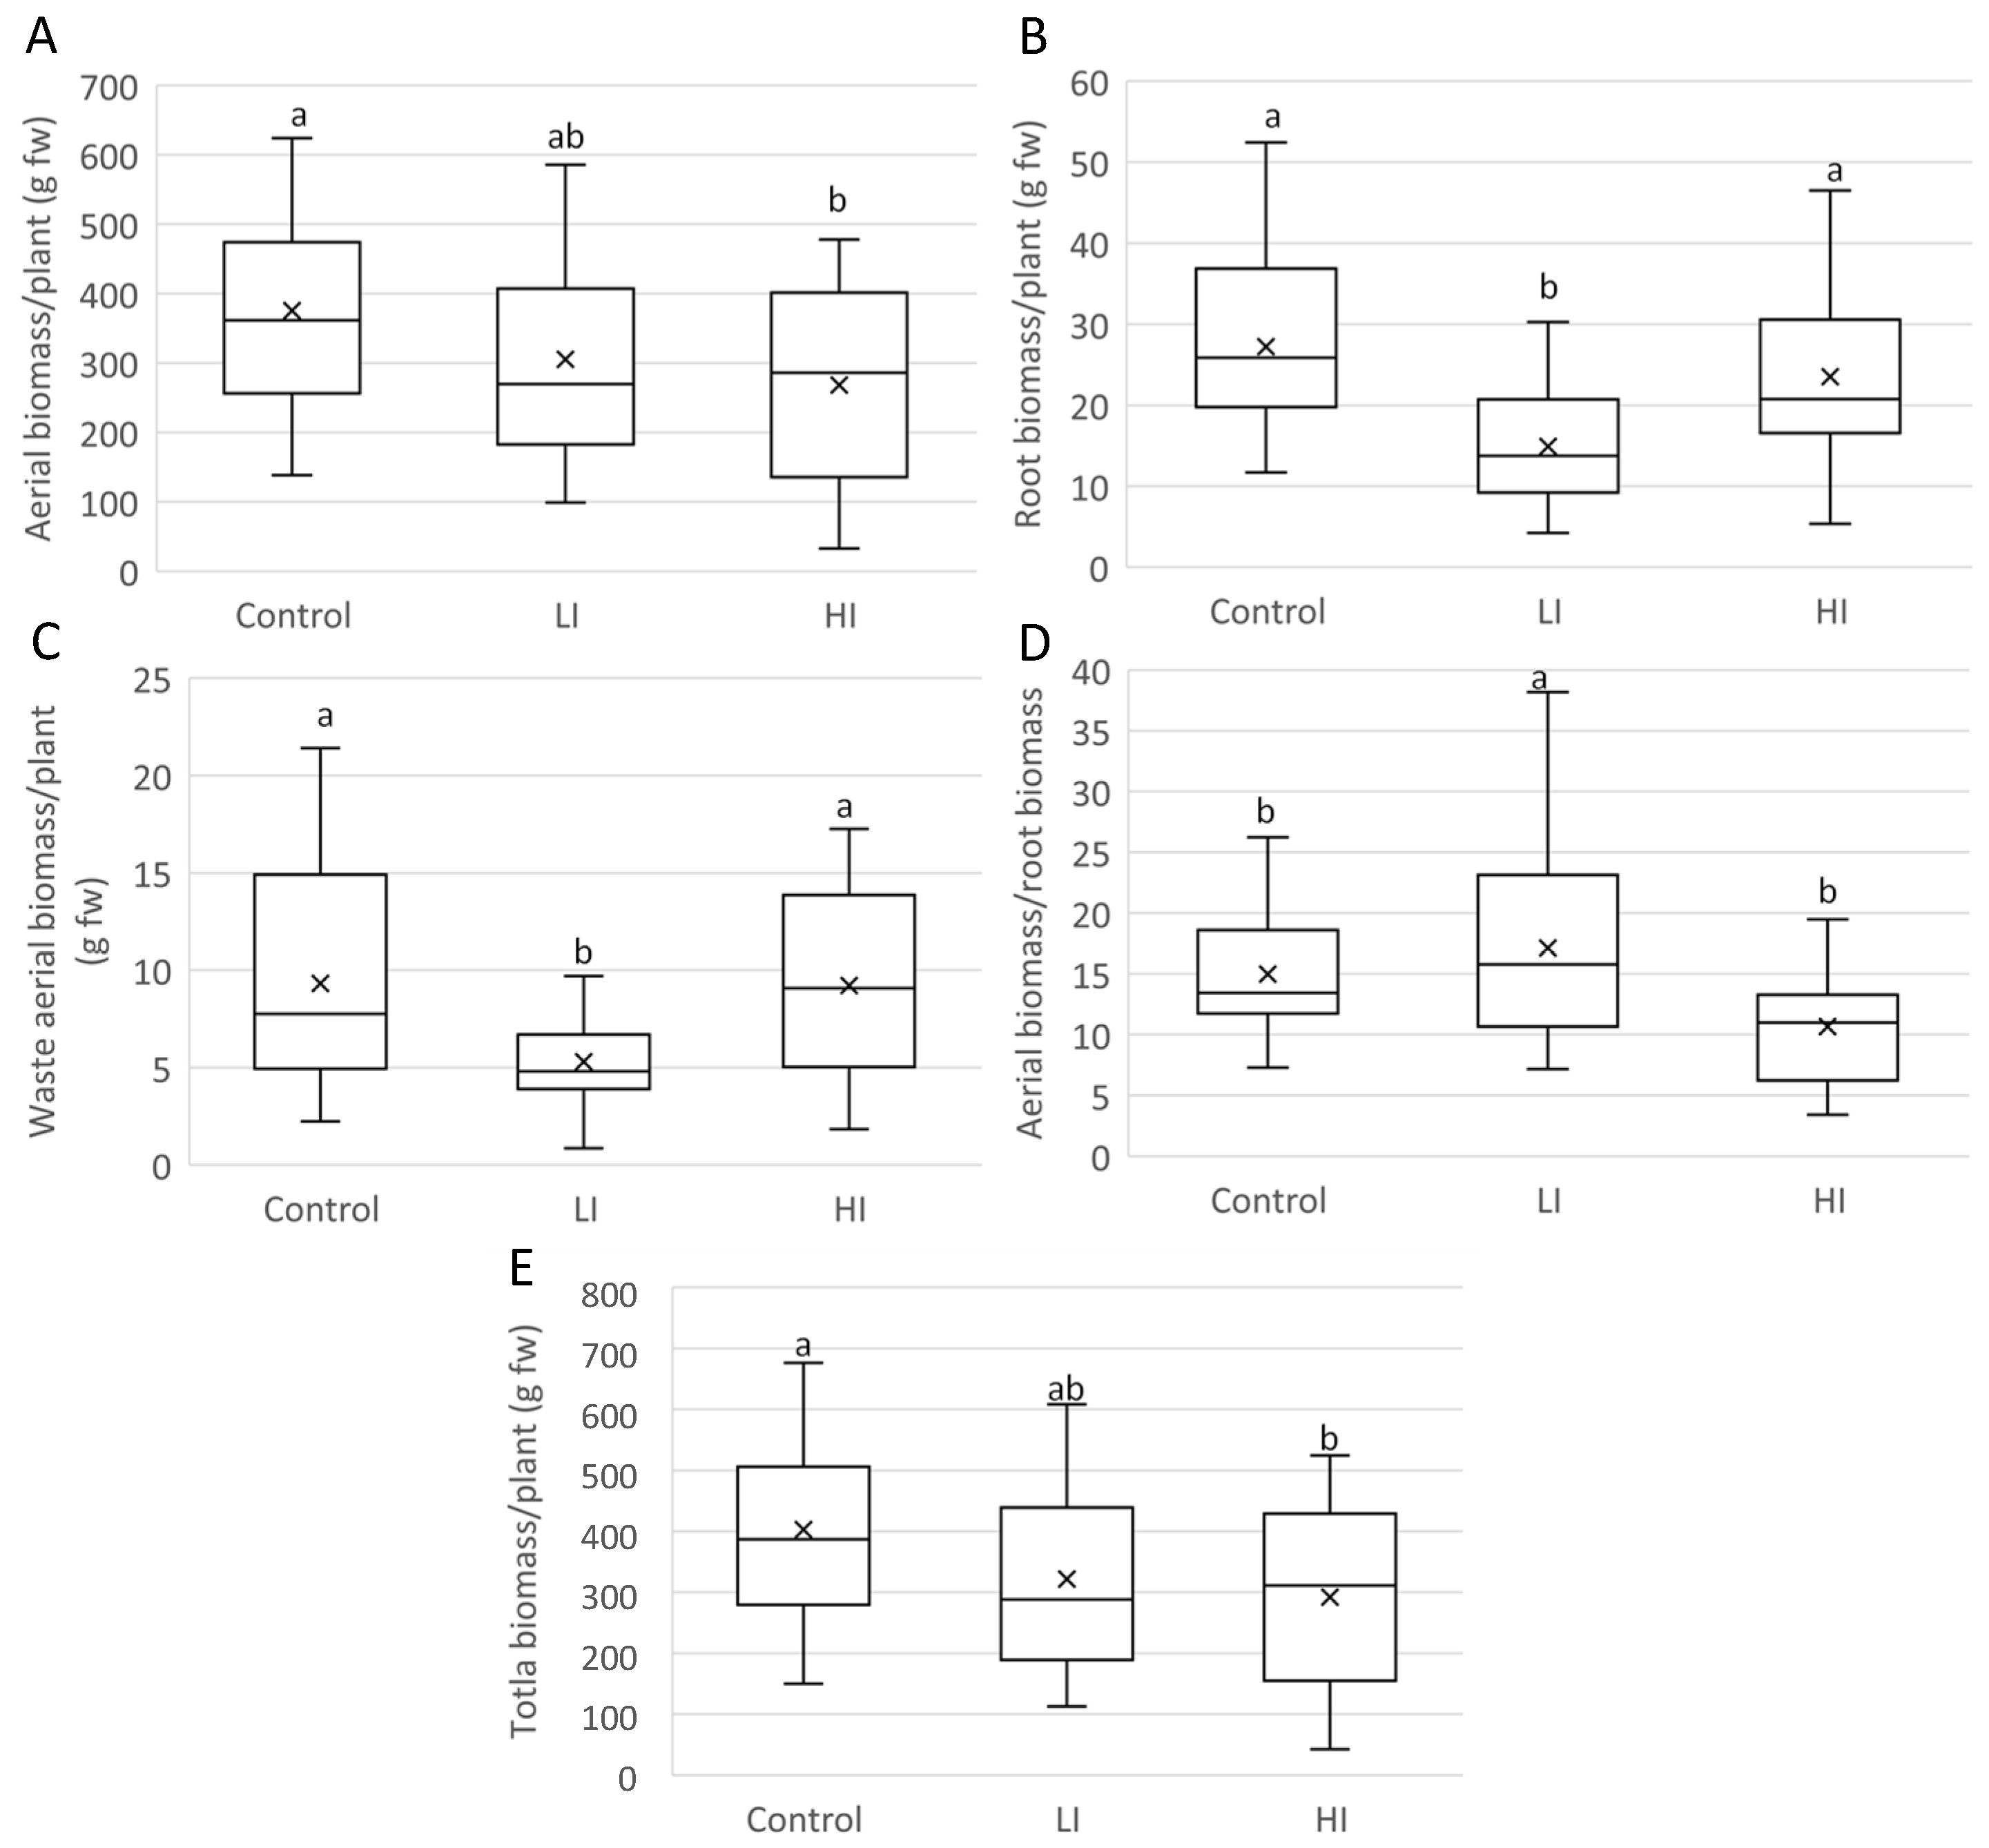
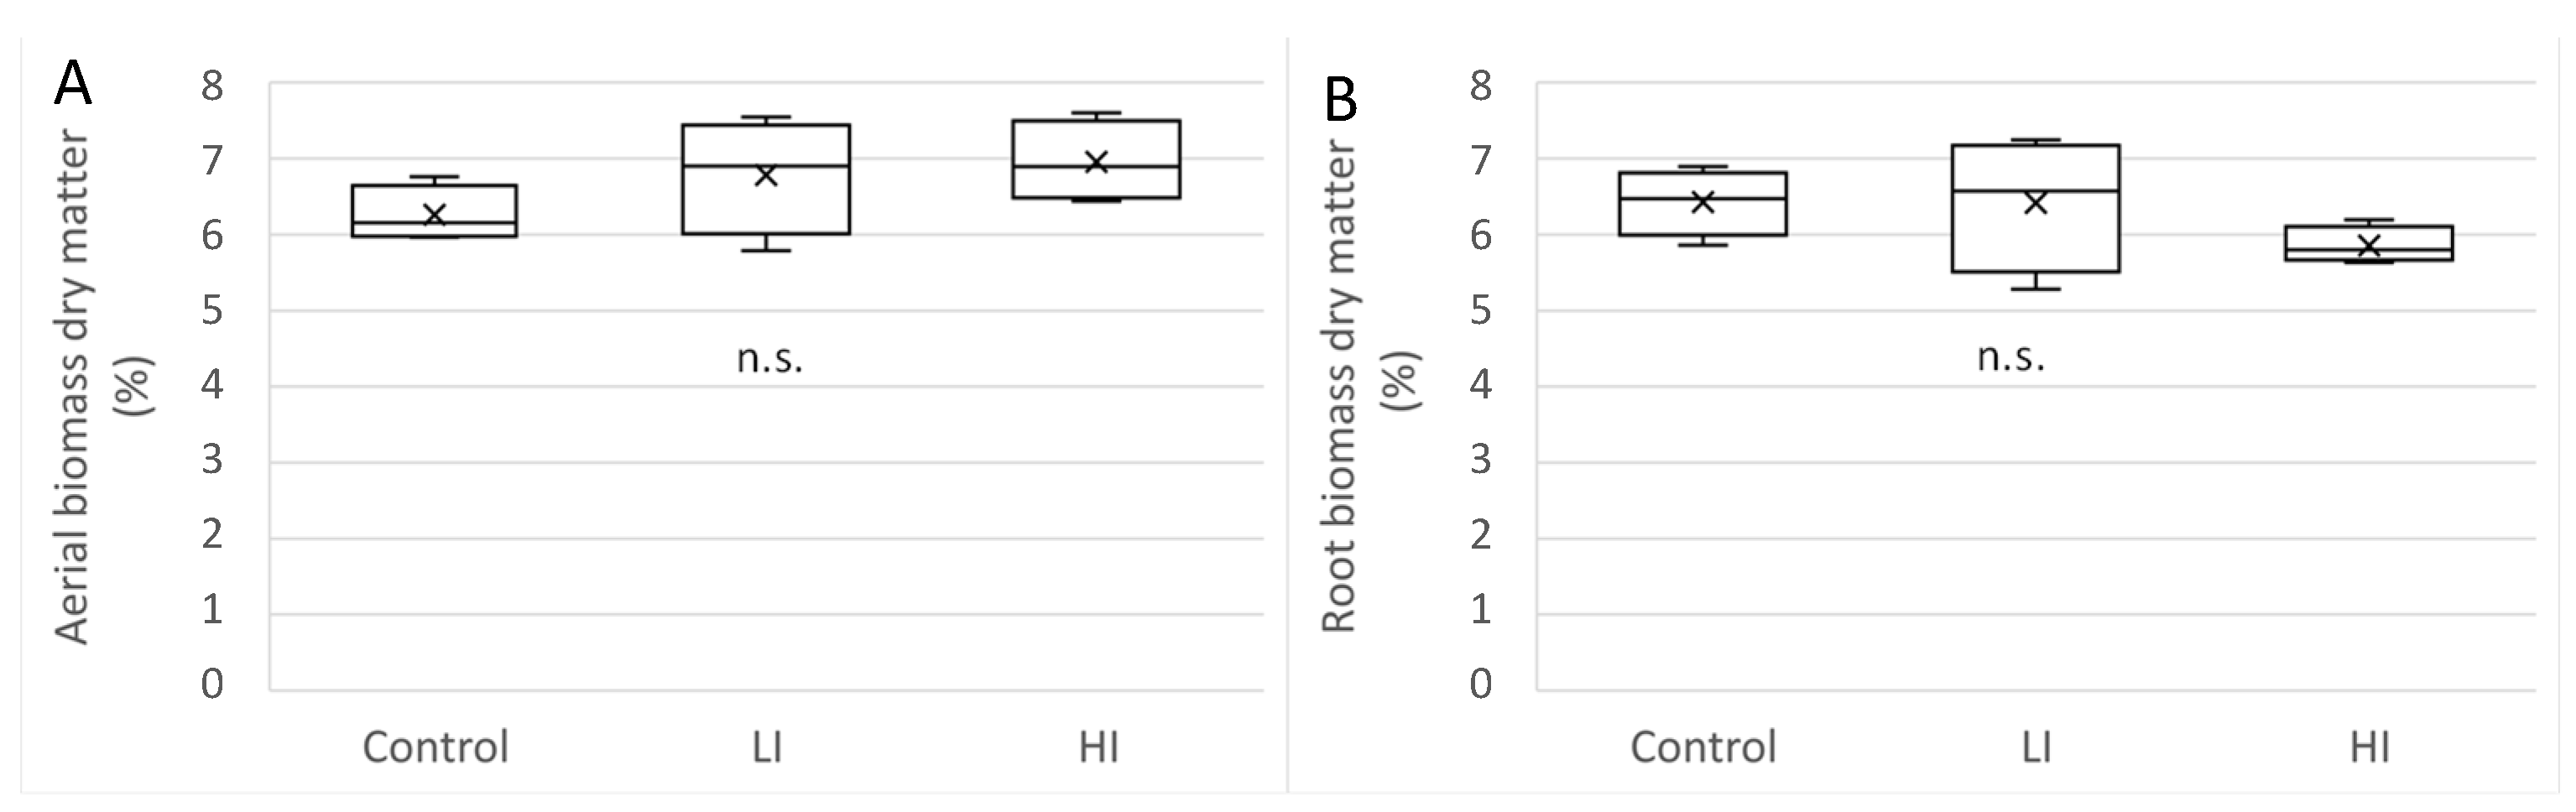
3.2. Biometric Characterization of Plants

The plant height (Figure 2A) was significantly higher for LI plants than the control (+12%) in the first 10 days. After that, the treated samples (HI and LI) expressed a significantly lower height than the control. This behavior was maintained until the end of the growing cycle. In particular, in the last sampling, the control plants presented an average height higher (+19%) than the treated ones.
Similar results were highlighted for the number of leaves and the diameter of the plant (Figure 2B). At the beginning of the growing cycle, the NTP-treated plants showed a number of leaves comparable to the control ones; afterward, in the latter, significantly higher values were recorded. At harvest time, the plant diameter of the control was on average 23 cm, 9.8% higher than the HI treatment.
In relation to the SPAD index (Figure 2C), increases of 25, 41, and 13% were observed for the control, HI, and LI values, respectively, from the beginning. At the end of the growth cycle, the SPAD values of the control and LI were found to be higher than the HI.
Comparing the aerial biomass, there is a significant difference between the control and the NTP plants (HI). In Figure 3A, the marketable aerial biomass of the control was equal to 375 g, significantly different from HI (−28.5%). Concerning the root system, the biomass (Figure 3B) in LI was 40.8% lower than the control, whereas no significant differences were observed between the control and HI. Similar results to those for the root biomass were found for the waste biomass of the crop (Figure 3C). The LI plants significantly differed from the control by presenting a waste biomass lower than 45.8%. Regarding the ratio of aerial biomass to root biomass, the LI samples (17.1) showed a higher ratio than HI and the control (Figure 3D). As regards the total biomass production (Figure 3E), the control showed a higher biomass (402 g/plant) compared to the HI treatment (−27.5%), but it showed no differences when compared to LI.
Comparing the dry matter among the samples, both in terms of the aerial part and the root system, no statistically significant differences were observed (Figure 4). Only for the aerial dry matter were slightly higher percentage values recorded in HI compared to the control (Figure 4A).

3.3. Plant Qualitative Traits

As for the total soluble solids (Brix°) (Table 3), the aerial part was affected by the NTP effect; the value detected in LI is equal to 4.12° Brix, significantly higher than the control, whereas HI displayed an intermediate result. Regarding the root system, statistics did not show a significant difference among the total soluble solids measured in the three systems with values ranging between 1.4° and 1.7° Brix.
The pH values were quite stable for both leaves and roots tissues (on average 5.25 and 5.80, respectively) and did not differ among treatments (Table 3).
As regards the EC, both for aerial biomass and the root system, it was found that the HI samples were characterized by a significantly higher EC (7.26 mS cm−1) compared to the other treatments. The latter did not differ, even if LI showed a slightly higher value than the control. In addition to the total soluble content, the EC value of the aerial part was also higher than those of the root system (HI: average aerial part = 7.26 mS cm−1; average root part = 5.20 mS cm−1) (Table 3).
The titratable acidity showed significant differences in both the aerial biomass and in the hypogeal one. The HI plants expressed higher values than the control, whereas LI displayed an intermediate position. Comparing the aerial fraction with the hypogeal one, the latter showed values 63.6% lower (Table 3) and, also in this case, higher values were recorded in HI and LI treatments.
Concerning the cation content (Table 4), the NTP treatment affected the sodium content, resulting in a statistically significantly lower absorption by the treated plant (Table 3). In the aerial part of the control, the amount of sodium was equal to 2957.5 mg kg−1 dw, much higher than in HI, whereas, in the root biomass, the control values were found to be 474% higher than the relative aerial part. Furthermore, although the control and the LI were not statistically different, the data showed a decreasing trend. The behavior of lettuce plants towards ammonium content was different. The aerial biomass of all the treatments did not show significant differences, whereas, in the root one, the control (262.1 mg kg−1 dw) had an ammonium concentration 43.5% lower than HI and LI displayed an intermediate position. The potassium content in the aerial part did not show significant differences, despite the values having expressed an increasing trend between the control and HI. This was also highlighted in the root system, where HI was characterized by 51.69 g kg−1 dw of potassium, 393% higher than the control (10.48 g kg−1 dw). In relation to the magnesium, no significant differences were found in the aerial part of the plant, with values ranging between 5367 and 4672 mg kg−1 dw for LI and HI, respectively; the root biomass of the control showed an accumulation of magnesium (90% higher than the HI), which displayed a concentration of 2502 mg kg−1 dw. The last cation analyzed, calcium, did not present any significant variation. Generally, calcium was detected in the aerial biomass, with a concentration between 11397 and 8167 mg kg−1 dw for LI and the control, respectively; in the roots biomass, the calcium content was lower, and the maximum value was expressed by LI with 2869 mg kg−1 dw.
Concerning the anions (Table 5), the aerial biomass showed no significant variations in the chlorides content, even if the concentration in HI (4853 mg kg−1 dw) was slightly higher than the control and LI (4315 and 3985 mg kg−1 dw, respectively). In the below-ground biomass, however, LI plants accumulated more chlorides than HI ones (+31.4%). In relation to nitrites, although the aerial biomass did not display significant differences, the plants in the HI and LI systems showed a higher concentration than the control. This trend also occurred in the root system: in HI, nitrites are 228% greater than in the control (16.1 mg kg−1 dw). The nitrate content detected in the aerial fraction was not different among the treatments, but it is evident that the average in HI is greater than in the other two systems; the same trend was statistically relevant in the root system, where the nitrates concentration in HI was 63% greater than the control. Moving to phosphates and considering the aerial biomass, the HI system accumulated a greater quantity (+87%) than the control. Concerning the root biomass, significant differences were observed, and the control was 63.5% lower than HI. In relation to the sulphates, no significant changes were highlighted; however, the sulphate concentration in the plants belonging to HI was 52% lower than control.
A further analysis quantified the content of total nitrogen, phosphorus, and potassium (Figure 5). The NTP treatment increased the nitrogen content in the HI samples, both for the aerial biomass (3.5% dw) and the root system (4.8% dw) (Figure 5). In addition, the trend was similar for phosphorus, which was found to be higher and equal to 0.45% dw and 0.8% dw in the aerial and root biomass of HI plants, respectively, exceeding the control by 51% and 85%. Concerning potassium, there was a higher concentration in the HI system, with 5.4% dw in both portions of the plant. However, while there is a variation of 44% in the aerial part with respect to the control, in the root part, the difference was equal to 433%.
The concentration of antioxidant compounds in the plant did not show statistically significant changes that could confirm the effect of ionization. Nevertheless, as far as total antioxidant capacity is concerned, a decreasing trend has been observed from control to HI. The average of HI plants (3147 mg Fe2+ E kg−1 dw) was 38.4% higher compared to the control. In addition, the DPPH test highlighted the same trend: 145 mg of TEAC g−1 of freeze-dried extract in HI plants and 94.2 mg of TEAC g−1 dw in the control. Similar to the total antioxidant capacity, the total polyphenol content also did not show significant differences; however, a slightly increasing trend can be mentioned, where the HI sample showed a higher value (4324 mg GAE dw) than the control (4154 mg GAE dw).
The pigment content in the foliar apparatus was significantly affected by the NTP treatment (Table 6). The content of chlorophyll a and xanthophyls + carotenoids was higher than the control; for chlorophyll b, only the HI treatment differed.

4. Discussion

Concerning the nutrient solution, the water consumption of the systems, although not statistically different, was higher in the control. This was due to a better water use efficiency of the crops treated with NTP, in agreement with the findings of Brar et al. [24] and Cannazzaro et al. [15]. In relation to the variations in the nutrient content within the nutrient solution, the trends within the treatments did not differ significantly and presented values that were consistent with what was expected in terms of availability during the crop cycle, considering that the nutrients supply was carried out at the beginning of the crop cycle in accordance with the nutritional needs of the crop.
The HI system plants were characterized by a slower growth, especially at the beginning of the cycle, and this led them to a lower yield than the control. This result is in agreement with Cannazzaro et al. [16], where the high-intensity NTP was applied without interruption in soilless lettuce cultivation. The authors found a lower yield, together with an increase in the dry matter. The increase in this parameter was found even in this research, but without a statistical difference. Moreover, as already reported in the results, HI lettuce grew slightly more in terms of height at the beginning of the cycle, in agreement with the findings reported by Stoleru et al. [25], who analyzed the germination and, therefore, the development of lettuce seedlings. Therefore, the cold plasma promoted a growth improvement in young plants. In an experiment by Stoleru et al. [25], the samplings conducted at 50, 57, and 64 days after transplantation did not show statistically significant variations between the samples, even if the average values identified in the samples treated with PAW were slightly higher than those in the control. The growth reduction in the early stages may also be linked to the continuous functioning of the NTP generator, especially the HI one, which may have negatively affected the early stages of development, mainly for the foliar apparatus. Ionization leads to the formation of reactive chemical species, such as nitrogen oxide (NO), hydrogen peroxide (H2O2), singlet oxygen, electrons, and positive ions, including many others that do not remain solubilized in solution, but which can react even in a gaseous form [5]. This finding is confirmed by the absence of differences in root biomass between HI and the control. In relation to the roots, in fact, a healthy appearance was noted, characterized by a white color, an indication of roots in good condition. The containment of plant size by cold plasma has been illustrated by various authors, including Iranbakhsh et al. [26], whose experiment involved the comparison among lettuce grown in hydroponics (control) and lettuce treated with cold plasma generated from helium or nitrogen used at different durations. Therefore, it is conceivable that high-intensity application of NTP causes a growth slowdown, leading to longer crop cycles. This can be controlled with a discontinuous use of ionization or a reduction in NTP intensity. More precisely, among the reactive oxygen species (ROS) produced, NO is the one attributable to the branching effect on the crops. In agreement with this scenario are Fernández-Marcos et al. [27], who published a study on the role of nitric oxide on growth inhibition. Nitric oxide can be a toxic compound for plants, despite it being a key regulator involved in several physiological processes during plant development and also an important disease resistance modulator.
The formation of nitric oxide, following the injection of NTP into the nutrient solution, occurs through the following reactions: N2 + e− → 2N + e−; O2 + e− → 2O + e−; N + O → NO. There is a fraction of the most peripheral part of the root that is particularly sensitive to NO. This is the so-called transition zone (TZ), which is located between the meristematic zone and the elongation zone. It is a fraction of a few millimetres, but it assumes an important sensory function for the plant by perceiving gravity, electrostimulation, water stress, and phytohormones, such as auxin and, indeed, NO. For this reason, the TZ is also considered a sensing area [28]. Fernández-Marcos et al. [27] also showed that an increase in NO concentration causes a decrease in primary root growth and reduces the number of cell divisions in the root meristem, leading to fewer cell cycles.
From the qualitative point of view, the HI samples, both aerial and hypogeal, showed higher electrical conductivity values than the control; the ion concentration was higher than the control, especially for phosphates, with the exception of sodium. This is also confirmed by the quantitative composition of N%, P%, and K%. Only sodium showed a decreasing trend with the increasing intensity of NTP treatment. These results were also found in the study conducted by Cannazzaro et al. [16]. The concentrations of organic nitrogen, nitrate, potassium, calcium, magnesium, phosphorus, manganese, and iron in gerbera are higher in those fertigated with nutrient solution treated by the non-thermal plasma. This is probably due to the fact that ionization determines a higher availability of nutrients due to the dissociated form.
An aspect that is not in agreement with the study by Cannazzaro et al. [16] is related to the nitrate content in the aerial biomass of lettuce. The authors identified a decrease in the nitrate content, unlike what was observed in this study, where this parameter increased both in the aerial biomass (not significantly) and at the root level (significantly), demonstrating a possible fertilization effect of the NTP treatment, following the enrichment of atmospheric nitrogen [29], possibly oxidized to NO3 [30]. A further supposition that justifies the higher concentration of nitrogen is that it is used for the synthesis of some antioxidants as a defence reaction to oxidative stress induced by cold plasma [25]. In fact, ROS generated by NTP can cause oxidative stress; therefore, the plant produces more antioxidants, with the function of acting as a substrate for ROS. The increase in the amount of antioxidants has not been statistically confirmed; however, the hypothesis presented seems to be supported by the trend of the values found in HI being slightly higher than in the other two systems. This leads to the hypothesis that lettuce plants belonging to HI, and to a lesser extent, to LI, are characterized by oxidative stress due to the NTP treatment, as suggested by other authors [31,32]; the latter stated that the effects of NTP reported to date are mainly time-dependent and can increase the concentrations of polyphenols, vitamin C, or the antioxidant activity for other products. The concentrations of pigments were affected by the NTP treatment. The higher content of chlorophyll a and b found in HI can be linked to the greater availability of nitrogen compounds found in the crop due to the enrichment mechanisms of atmospheric nitrogen [29] possibly oxidized to NO3 [33]. This result is in agreement with the findings of Stolerù et al. [25], which highlighted an increase in the chlorophyll content in lettuce plants treated with increasing NTP intensity.
Given these preliminary results, it is clear that NTP treatments determine physiological changes for lettuce by acting on both growth and qualitative composition. Using the LI parameters, it is possible to obtain a production comparable to that of the control, and an adequate containment is achieved without causing damage due to oxidative stresses. NTP-activated nutrient solution is able to vary different physiological and productive aspects, increasing the content of several ions according to the intensity. Adopting cold plasma technology in the agronomic field can represent an advantage, which, in any case, should be further investigated, considering the effects related to the management of the ionizing flux in terms of timing and intensity. Furthermore, cold plasma brings another important advantage, that is, to guarantee good phytosanitary conditions in the nutrient solution in a closed loop without using traditional techniques such as heat, ultraviolet rays, or fungicides, which tend to release residues. The next phase of this innovative agronomic approach is to consider different intensities and times of NTP application in order to identify the optimal combinations in relation to the cultivated species.

Author Contributions

Conceptualization, C.N. and P.S.; methodology, C.N.; validation, C.N.; formal analysis, C.N. and V.F.; investigation, C.N. and V.F.; resources, C.N.; data curation, C.N. and V.F.; writing—original draft preparation, C.N.; writing—review and editing, C.N., V.F. and S.L.; supervision, C.N. and P.S.; project administration, C.N.; funding acquisition, C.N. All authors have read and agreed to the published version of the manuscript.

Funding

This research was funded by Jonix S.p.A.

Institutional Review Board Statement

Not applicable.

Informed Consent Statement

Not applicable.

Data Availability Statement

Not applicable.

Conflicts of Interest

The authors declare no conflict of interest.

References

  1. Putra, P.A.; Yuliando, H. Soilless Culture System to Support Water Use Efficiency and Product Quality: A Review. Agric. Agric. Sci. Procedia 2015, 3, 283–288. [Google Scholar] [CrossRef]
  2. Savvas, D.; Gruda, N. Application of soilless culture technologies in the modern greenhouse industry–A review. Eur. J. Hortic. Sci. 2018, 83, 280–293. [Google Scholar] [CrossRef]
  3. Sambo, P.; Nicoletto, C.; Giro, A.; Pii, Y.; Valentinuzzi, F.; Mimmo, T.; Lugli, P.; Orzes, G.; Mazzetto, F.; Astolfi, S.; et al. Hydroponic Solutions for Soilless Production Systems: Issues and Opportunities in a Smart Agriculture Perspective. Front. Plant Sci. 2019, 10, 923. [Google Scholar] [CrossRef]
  4. Massa, D.; Magán, J.J.; Montesano, F.F.; Tzortzakis, N. Minimizing water and nutrient losses from soilless cropping in southern Europe. Agric. Water Manag. 2020, 241, 106395. [Google Scholar] [CrossRef]
  5. Scholtz, V.; Pazlarova, J.; Souskova, H.; Khun, J.; Julak, J. Nonthermal plasma—A tool for decontamination and disinfection. Biotechnol. Adv. 2015, 33, 1108–1119. [Google Scholar] [CrossRef]
  6. Adamovich, I.; Baalrud, S.D.; Bogaerts, A.; Bruggeman, P.J.; Cappelli, M.; Colombo, V.; Czarnetzki, U.; Ebert, U.; Eden, J.G.; Favia, P.; et al. The 2017 Plasma Roadmap: Low temperature plasma science and technology. J. Phys. D Appl. Phys. 2017, 50, 323001. [Google Scholar] [CrossRef]
  7. Bai, Y.-H.; Chen, J.-R.; Li, X.-Y.; Zhang, C.-H. Non-thermal Plasmas Chemistry as a Tool for Environmental Pollutants Abatement. Rev. Environ. Contam. Toxicol. 2009, 201, 117–136. [Google Scholar] [CrossRef] [PubMed]
  8. Attri, P.; Ishikawa, K.; Okumura, T.; Koga, K.; Shiratani, M. Plasma Agriculture from Laboratory to Farm: A Review. Processes 2020, 8, 1002. [Google Scholar] [CrossRef]
  9. Bradu, C.; Kutasi, K.; Magureanu, M.; Puač, N.; Živković, S. Reactive nitrogen species in plasma-activated water: Generation, chemistry and application in agriculture. J. Phys. D: Appl. Phys. 2020, 53, 223001. [Google Scholar] [CrossRef]
  10. Laroussi, M.; Mendis, D.A.; Rosenberg, M. Plasma interaction with microbes. New J. Phys. 2003, 5, 41. [Google Scholar] [CrossRef]
  11. Lii, C.Y.; Liao, C.D.; Stobinski, L.; Tomasik, P. Behaviour of granular starches in low-pressure glow plasma. Carbohydr. Polym. 2002, 49, 499–507. [Google Scholar] [CrossRef]
  12. Zou, J.-J.; Liu, C.-J.; Eliasson, B. Modification of starch by glow discharge plasma. Carbohydr. Polym. 2004, 55, 23–26. [Google Scholar] [CrossRef]
  13. Mihai, A.L.; Dobrin, D.; Măgureanu, M.; Popa, M.E. Positive effect of non-thermal plasma treatment on radish seeds. Rom. Rep. Phys. 2014, 66, 1110–1117. [Google Scholar]
  14. Burchi, G.; Chessa, S.; Gambineri, F.; Kocian, A.; Massa, D.; Milazzo, P.; Rimediotti, L.; Ruggeri, A. Information technology controlled greenhouse: A system architecture. In Proceedings of the 2018 IoT Vertical and Topical Summit on Agriculture—Tuscany (IOT Tuscany), Tuscany, Italy, 8–9 May 2018; pp. 1–6. [Google Scholar] [CrossRef]
  15. Cannazzaro, S.; Traversari, S.; Cacini, S.; Di Lonardo, S.; Pane, C.; Burchi, G.; Massa, D. Non-Thermal Plasma Treatment Influences Shoot Biomass, Flower Production and Nutrition of Gerbera Plants Depending on Substrate Composition and Fertigation Level. Plants 2021, 10, 689. [Google Scholar] [CrossRef] [PubMed]
  16. Cannazzaro, S.; Di Lonardo, S.; Cacini, S.; Traversari, S.; Burchi, G.; Pane, C.; Massa, D. Opportunities and challenges of using non-thermal plasma treatments in soilless cultures: Experience from greenhouse experiments. In III International Symposium on Soilless Culture and Hydroponics: Innovation and Advanced Technology for Circular Horticulture; Acta Hortic. 1321; 2021; pp. 259–266. [Google Scholar]
  17. Ranieri, P.; Sponsel, N.; Kizer, J.; Rojas-Pierce, M.; Hernández, R.; Gatiboni, L.; Grunden, A.; Stapelmann, K. Plasma agriculture: Review from the perspective of the plant and its ecosystem. Plasma Process. Polym. 2020, 18, 2000162. [Google Scholar] [CrossRef]
  18. Fernandez, D. HydroBuddy: An Open Source Nutrient Calculator for Hydroponics and 464 General Agriculture, v1.5. 2013. Available online: http://scienceinhydroponics.com (accessed on 15 February 2017).
  19. Nicoletto, C.; Tosini, F.; Sambo, P. Effect of grafting and ripening conditions on some qualitative traits of ‘Cuore di bue’ tomato fruits. J. Sci. Food Agric. 2012, 93, 1397–1403. [Google Scholar] [CrossRef] [PubMed]
  20. Zancan, S.; Cesco, S.; Ghisi, R. Effect of UV-B radiation on iron content and distribution in maize plants. Environ. Exp. Bot. 2006, 55, 266–272. [Google Scholar] [CrossRef]
  21. Benzie, I.F.F.; Strain, J.J. The ferric reducing ability of plasma (FRAP) as a measure of “antioxidant power”: The FRAP assay. Anal. Biochem. 1996, 239, 70–76. [Google Scholar] [CrossRef]
  22. Kang, H.-M.; Saltveit, M.E. Antioxidant Capacity of Lettuce Leaf Tissue Increases after Wounding. J. Agric. Food Chem. 2002, 50, 7536–7541. [Google Scholar] [CrossRef]
  23. Singleton, V.L.; Orthofer, R.; Lamuela-Raventós, R.M. Analysis of total phenols and other oxidation substrates and antioxi-dants by means of folin-ciocalteu reagent. Methods Enzymol. 1999, 299, 152–178. [Google Scholar]
  24. Brar, J.; Jiang, J.; Oubarri, A.; Ranieri, P.; Fridman, A.A.; Fridman, G.; Miller, V.; Peethambaran, B. Non-thermal Plasma Treatment of Flowing Water: A Solution to Reduce Water Usage and Soil Treatment Cost without Compromising Yield. Plasma Med. 2016, 6, 413–427. [Google Scholar] [CrossRef] [Green Version]
  25. Stoleru, V.; Burlica, R.; Mihalache, G.; Dirlau, D.; Padureanu, S.; Teliban, G.-C.; Astanei, D.; Cojocaru, A.; Beniuga, O.; Patras, A. Plant growth promotion effect of plasma activated water on Lactuca sativa L. cultivated in two different volumes of substrate. Sci. Rep. 2020, 10, 20920. [Google Scholar] [CrossRef] [PubMed]
  26. Iranbakhsh, A.; Ghoranneviss, M.; Ardebili, Z.O.; Tackallou, S.H.; Nikmaram, H. Non-thermal plasma modified growth and physiology in Triticum aestivum via generated signaling molecules and UV radiation. Biol. Plant. 2017, 61, 702–708. [Google Scholar] [CrossRef]
  27. Fernández-Marcos, M.; Sanz, L.; Lewis, D.R.; Muday, G.K.; Lorenzo, O. Nitric oxide causes root apical meristem defects and growth inhibition while reducing PIN-FORMED 1 (PIN1)-dependent acropetal auxin transport. Proc. Natl. Acad. Sci. USA 2011, 108, 18506–18511. [Google Scholar] [CrossRef] [PubMed]
  28. Baluška, F.; Mancuso, S.; Volkmann, D.; Barlow, P.W. Root apex transition zone: A signalling–response nexus in the root. Trends Plant Sci. 2010, 15, 402–408. [Google Scholar] [CrossRef]
  29. Puač, N.; Gherardi, M.; Shiratani, M. Plasma agriculture: A rapidly emerging field. Plasma Process. Polym. 2017, 15, 1700174. [Google Scholar] [CrossRef]
  30. Han, J.; Peethambaran, B.; Balsamo, R.; Fridman, A.; Rabinovich, A.; Miller, V.; Fridman, G. Non-equilibrium plasmas in agriculture. In Proceedings of the 22nd International Symposium on Plasma Chemistry, Antwerp, Belgium, 5–10 July 2015. [Google Scholar]
  31. Li, X.; Li, M.; Ji, N.; Jin, P.; Zhang, J.; Zheng, Y.; Zhang, X.; Li, F. Cold plasma treatment induces phenolic accumulation and enhances antioxidant activity in fresh-cut pitaya (Hylocereus undatus) fruit. LWT 2019, 115, 108447. [Google Scholar] [CrossRef]
  32. Muhammad, A.I.; Liao, X.; Cullen, P.J.; Liu, D.; Xiang, Q.; Wang, J.; Chen, S.; Ye, X.; Ding, T. Effects of non-thermal plasma technology on functional food components. Compr. Rev. Food Sci. Food Saf. 2018, 17, 1379–1394. [Google Scholar] [CrossRef]
  33. Kučerová, K.; Henselová, M.; Slováková, Ľ.; Bačovčinová, M.; Hensel, K. Effect of Plasma Activated Water, Hydrogen Peroxide, and Nitrates on Lettuce Growth and Its Physiological Parameters. Appl. Sci. 2021, 11, 1985. [Google Scholar] [CrossRef]
Figure 1. Evolution of the content of the main cations (AE) and anions (FH) present in the nutrient solution during the lettuce crop cycle in relation to treatments with non-thermal-plasma-activated nutrient solution. LI= low ionization intensity; HI= high ionization intensity; DAT= days after transplant. Within each parameter, values with different letters are significantly different at p < 0.05 based on the Tukey HSD test; ns: not significant.
Horticulturae 09 00208 g001
Figure 2. Effect of non-thermal-plasma-activated nutrient solution on plant height (A), number of leaves (B), plant diameter (B) and SPAD index (C). LI = low ionization intensity; HI = high ionization intensity; DAT = days after transplant. Within each parameter, values with different letters are significantly different at p < 0.05 based on the Tukey HSD test.
Horticulturae 09 00208 g002
Figure 3. Effect of non-thermal-plasma-activated nutrient solution on aerial (A), root (B), waste (C) fresh weight biomass production per plant together with the aerial biomass/root biomass ratio (D) and total biomass (E). LI = low ionization intensity; HI = high ionization intensity. Within each parameter, values with different letters are significantly different at p < 0.05 based on the Tukey HSD test.
Horticulturae 09 00208 g003
Figure 4. Effect of non-thermal plasma treatment on the dry matter concentration in the aerial biomass (A) and below-ground biomass (B) of lettuce. Within each parameter, values with different letters are significantly different at p < 0.05 based on the Tukey HSD test; LI = low ionization intensity; HI = high ionization intensity; n.s. = not significant.
Horticulturae 09 00208 g004
Figure 5. Effect of non-thermal-plasma-activated nutrient solution on the concentration of nitrogen, phosphorus, and potassium (dry weight basis) in the aerial and root biomass of lettuce. Within each parameter, values with different letters are significantly different at p < 0.05 based on a Tukey test (HSD).
Horticulturae 09 00208 g005
Table 1. Maximum and minimum values of the main climatic parameters during the crop cycles in the greenhouse.
CycleAir Temperature
(°C)
Air Relative Humidity
(%)
Global Solar Radiation
(MJ/m2)
minmaxminmaxminmax
1 cycle15256394118235
2 cycles15255892482530
Table 2. Chemical composition and concentration of the nutrient solution used in the nutrient film technique system for lettuce cultivation.
Nutrientsmg L−1
pH
MgSO4·7H2O
6.8
456
Fe (EDTA)30.77
Na2 MoO4·2H2O0.125
ZnSO4·2H2O0.302
CuSO4·5H2O0.392
MnCl2·4H2O1.80
KH2PO4219
H3BO32.86
NH4NO3225
K2SO4346
Ca(NO3)21007
Table 3. Effect of non-thermal-plasma-activated nutrient solution on the content of total soluble solids, pH, electric conductivity, and titratable acidity in the aerial and root biomass of lettuce.
NTP TreatmentTotal Soluble Solids
(Brix°)
pHEC
(mS cm−1)
Titratable Acidity
(% Citric Acid 100 g−1 fw)
Aerial
biomass
Control3.45 ± 0.155 b5.19 ± 0.028 a5.64 ± 0.138 b0.0755 ± 0.0016 b
LI4.12 ± 0.294 a5.27 ± 0.082a5.81 ± 0.394 b0.0870 ± 0.0022 ab
HI3.88 ± 0.154 ab5.29 ± 0.048 a7.26 ± 0.353 a0.0941 ± 0.0047 a
Root
biomass
Control1.53 ± 0.047 a5.83 ± 0.039 a3.52 ± 0.115 b0.0211 ± 0.0022 b
LI1.73 ± 0.108 a5.75 ± 0.119 a4.03 ± 0.270 b0.0262 ± 0.0049 ab
HI1.38 ± 0.047 a5.83 ± 0.179 a5.20 ± 0.065 a0.0461 ± 0.0068 a
Within each qualitative trait, values with different letters are significantly different at p < 0.05 based on the Tukey test (HSD). LI= low ionization intensity; HI= high ionization intensity; fw = fresh weight. Each value comes from three replications, and the standard error is reported.
Table 4. Effect of non-thermal-plasma-activated nutrient solution on the content of anions and cations in the aerial and root biomass of lettuce.
NTP TreatmentNa+NH4+K+Mg2+Ca2+
(mg kg−1 dw)
Aerial
biomass
Control2597 ± 95 a349 ± 2638,889 ± 32315057 ± 4008167 ± 850
LI1299 ± 154 b367 ± 743,141 ± 19595368 ± 15911,398 ± 287
HI1067 ± 93 b388 ± 1651,178 ± 42384673 ± 3819859 ± 1378
Root
biomass
Control14,916 ± 252 a262 ± 29 b10,488 ± 1835 b4750 ± 47 a2776 ± 127
LI12,051 ± 1191 a333 ± 27 ab16,681 ± 3443 b4155 ± 487 ab2869 ± 234
HI3368 ± 1609 b465 ± 44 a51,690 ± 3892 a2502 ± 589 b2236 ± 127
Within each qualitative trait, values with different letters are significantly different at p < 0.05 based on a Tukey test (HSD). LI = low ionization intensity; HI = high ionization intensity; dw = dry weight. Each value comes from three replications, and the standard error is reported.
Table 5. Effect of non-thermal-plasma-activated nutrient solution on the content of anions and cations in the aerial and root biomass of lettuce.
NTP TreatmentClNO2NO3PO₄³⁻SO₄²
(mg kg−1 dw)
Aerial
biomass
Control4315 ± 14729 ± 438,342 ± 24663314 ± 520 b3282 ± 171
LI3985 ± 29629 ± 540,982 ± 41024251 ± 524 ab3036 ± 345
HI4853 ± 20842 ± 846,582 ± 89526200 ± 686 a2162 ± 422
Root
biomass
Control1200 ± 57 ab16 ± 331,968 ± 2941 b2826 ± 90 b16,173 ± 1039
LI1422 ± 56 a15 ± 431,480 ± 1391 b3964 ± 259 b14,556 ± 631
HI976 ± 120 b53 ± 452,059 ± 1963 a7758 ± 851 a17,584 ± 1170
Within each qualitative trait, values with different letters are significantly different at p < 0.05 based on a Tukey (HSD). LI = low ionization intensity; HI = high ionization intensity; dw = dry weight. Each value comes from three replications, and the standard error is reported.
Table 6. Effect of non-thermal-plasma-activated nutrient solution on the content of leaf pigments in lettuce.
NTP TreatmentChlorophyll a
(µg g−1 dw)
Chlorophyll b
(µg g−1 dw)
Xanthophyll and Carotenoids(µg g−1 dw)DPPH
(TEAC g−1 dw)
Total Antioxidant Capacity
(mg Fe2+ E kg−1 dw)
Total
Phenols
(mg GAE dw)
Aerial
biomass
Control772 ± 37 b231 ± 25 b175 ± 12 b94.2 ± 24 a1938 ± 124 a4154 ± 257 a
LI841 ± 45 a233 ± 19 b197 ± 9 a127 ± 32 a2749 ± 167 a4268 ± 316 a
HI903 ± 54 a292 ± 15 a199 ± 16 a145 ± 28 a3147 ± 245 a4324 ± 485 a
Within each qualitative trait, values with different letters are significantly different at p < 0.05 based on the Tukey test (HSD). LI = low ionization intensity; HI = high ionization intensity; dw = dry weight. Each value comes from three replications, and the standard error is reported.
Disclaimer/Publisher’s Note: The statements, opinions and data contained in all publications are solely those of the individual author(s) and contributor(s) and not of MDPI and/or the editor(s). MDPI and/or the editor(s) disclaim responsibility for any injury to people or property resulting from any ideas, methods, instructions or products referred to in the content.

