Article

Improved Annotation of the Peach (Prunus persica) Genome and Identification of Tissue- or Development Stage-Specific Alternative Splicing through the Integration of Iso-Seq and RNA-Seq Data

1
Key Laboratory of Genetic Improvement and Ecophysiology of Horticultural Crops, Institute of Horticulture, Anhui Academy of Agricultural Sciences, Hefei 230001, China
2
Institute of Forestry and Pomology, Beijing Academy of Agriculture and Forestry Sciences, Beijing 100097, China
*
Authors to whom correspondence should be addressed.
Horticulturae 2023, 9(2), 175; https://doi.org/10.3390/horticulturae9020175
Submission received: 9 November 2022 / Revised: 18 January 2023 / Accepted: 28 January 2023 / Published: 30 January 2023
(This article belongs to the Section Genetics, Genomics, Breeding, and Biotechnology (G2B2))

Abstract

:
Alternative splicing (AS) is an important way to generate notable regulatory and proteomic complexity in eukaryotes. However, accurate full-length splicing isoform discovery by second-generation sequencing (SGS) technologies is beset with the precise assembly of multiple isoforms from the same gene loci. In recent years, third-generation sequencing (TGS) technologies have been adopted to gain insight into different aspects of transcriptome complexity, such as complete sequences of mRNA, alternative splicing, fusion transcript, and alternative polyadenylation (APA). Here, we combined PacBio Iso-Seq and Illumina RNA-Seq technologies to decipher the full-length transcriptome of peach. In total, 40,477 nonredundant high-quality consensus transcript sequences were obtained from equally pooled libraries from 10 samples of 6 organs, including leaf, shoot, flower, fruit peel, fruit mesocarp, and fruit stone, of which 18,274 isoforms were novel isoforms of known genes and 546 isoforms were novel gene transcripts. We also discovered 148 fusion transcripts, 15,434 AS events, 508 potential lncRNAs, and 4368 genes with APA events. Of these AS events, the most abundant (62.48%) AS type was intron retention (IR). Moreover, the expression levels of different isoforms identified in this study were quantitatively evaluated, and highly tissue- or development stage-specific expression patterns were observed. The novel transcript isoforms and new characteristics of the peach transcriptome revealed by this study will facilitate the annotation of the peach genome and lay the foundations for functional research in the future.

1. Introduction

Peach (Prunus persica) is one of the most popular fruit trees cultivated in temperate zones around the world. According to the reports of the Food and Agriculture Organization (FAO, https://www.fao.org/faostat/, accessed on 1 June 2022), as of 2020, the worldwide peach harvested area and yield reached 1.5 million hectares and 24.6 million tons, respectively. However, more than 20% of peach is lost at the postharvest stage every year due to the short fruit shelf life [1]. Peach trees also suffer from attacks by different diseases and insects, such as gummosis and aphids, and environmental stress, such as chilling and flooding stresses [2,3]. To breed peach cultivars with high fruit quality and stress tolerance and extend the shelf life of fruits, extensive research has been conducted at the genetic and molecular biological levels. Nevertheless, highly efficient genetic and molecular biological research depends on genomes with high-quality assembly and gene annotation.
Peach belongs to the Rosaceae family, with a base chromosome number of eight and a small genome size of 265 Mb, as estimated by flow cytometry [4]. The peach reference genome (double haploid material of cv. Lovell) was assembled at 224.6 Mb in size (v1.0) using Sanger whole-genome shotgun methods [5]. Later, the v2.0 peach genome improved the previous assembly using Illumina sequencing reads, and the final genome assembly was 227.4 Mb arranged in 191 scaffolds [6]. By integration of de novo prediction and RNA-Seq data, 26,873 gene models and 47,089 transcripts were included in peach reference genome annotation v2.1, with an average of 1.75 transcripts per gene model [6]. Similarly, we performed a meta-analysis of tissue-specific Arabidopsis SGS RNA-Seq libraries from 113 datasets and found 48,359 transcript models, also with an average of 1.75 transcripts per gene model [7]. As the TGS RNA-Seq (including PacBio, Nanopore direct RNA, and Nanopore cDNA sequencing) technologies developed, an increasing number of novel transcripts with accurate sequences were identified [8]. A recent Arabidopsis nanopore direct RNA sequencing (DRS) study showed that more than half of the unique splice junctions detected by DRS were absent from the transcript annotation supported by Illumina RNA-Seq data [9]. To date, no TGS-based full-length transcriptomes have been reported in peach, although several TGS-based genome assemblies with high N50 have been released [10,11]. Therefore, great improvements would be made to peach transcript landscapes by conducting TGS-based full-length transcriptome sequencing.
With the rapid development of high-throughput sequencing technology, transcriptome sequencing has been widely used for gene and transcript discovery [12,13,14]. SGS platforms, such as Illumina, have been widely used in the past decade due to their early invention, high throughput, high accuracy, and low cost. However, SGS usually yields short reads, which is not an advantage for transcript discovery. In recent years, TGS has been adopted to gain insight into different aspects of transcriptome complexity, such as complete sequences of mRNA, alternative splicing, fusion transcripts, and APA, owing to single molecular real-time sequencing (SMRT) technology (PacBio platform) and Oxford Nanopore Technologies (ONT)-based nanopore sequencing [15,16]. TGS offers the advantages of no PCR amplification and long-read reading ability, but their sequencing error rate is high [17]. Therefore, combining TGS and SGS technologies can provide more accurate and intact transcriptome information and has been used for many plant species, such as Arabidopsis, rice cotton, and maize [9,18,19,20].
Here, we combined Pacbio Iso-Seq and Illumina RNA-Seq to analyze the peach transcriptome. Different aspects of transcriptome complexity were revealed, including the discovery of novel transcripts, identification of fusion transcripts, prediction of lncRNAs, analysis of AS and APA events, and investigation of transcription factor (TF) families. The expression levels of different transcripts identified by SMRT RNA-Seq were further estimated using RNA-Seq data. This is the first report of TGS-based global transcriptome analysis of peach, and the results provide valuable information on new transcript characteristics and serve as a solid supplement to existing genome annotation.

2. Materials and Methods

2.1. Plant Materials

The peach cultivar “Li Xia Hong” (LXH) was grown in the greenhouse of Anhui Academy of Agricultural Sciences, Hefei, Anhui, China. The young leaf (YL), mature leaf (ML), shoot (SH), flower at balloon stage (BF), juvenile peel (JP), maturing peel (MP), lignified stone (LS), fruit flesh of the first (S1) and the second (S3) exponential expansion, and maturing (S4) stages were collected with three biological replicates from three trees. For the fruit epicarp, mesocarp and endocarp, each replicate was derived from 5 mixed fruits. All the samples were cut into pieces, immediately frozen in liquid nitrogen, and stored at −80 °C until use.

2.2. Illumina RNA-Seq Library Construction

Total RNAs of 30 samples were extracted using the standard TRIzol (Invitrogen Life Technologies) method from 10 tissues, including YL, ML, BF, JP, MP, SH, LS, S1, S3, and S4, with three biological replicates for each tissue and the RNA concentration was measured using a NanoDrop 2000 (Thermo Scientific, Vacaville, CA, USA). RNA integrity was assessed using the RNA Nano 6000 Assay Kit of the Agilent Bioanalyzer 2100 system (Agilent Technologies, Santa Clara, CA, USA). Total RNA was purified by magnetic Oligo(dT) beads (Dynabeads mRNA Purification kit, Invitrogen, Carlsbad, CA, USA), and approximately 1 μg per sample was used as input material for the library construction. Sequencing libraries were generated using the NEBNext UltraTM RNA Library Prep Kit for Illumina (NEB, Beverly, MA, USA) following the manufacturer’s recommendations. Briefly, after mRNA purification, fragmentation of mRNA was carried out using divalent cations in NEBNext First Strand Synthesis Reaction Buffer (5X). First-strand cDNA was synthesized using M-MuLV Reverse Transcriptase and random hexamers, and then the second strand of cDNA was synthesized according to the base-pairing rule. The new double-strand cDNA was end-repaired via exonuclease/polymerase activities, and a single nucleotide “A” was added to the 3′ ends of DNA fragments. To preferentially select cDNA fragments 240 bp in length, the library fragments were purified with an AMPure XP system (Beckman Coulter, Beverly, MA, USA), and 3 μL USER Enzyme (NEB, USA) was used with size-selected, adaptor-ligated cDNA at 37 °C for 15 min followed by 5 min at 95 °C before PCR. Then, PCR was conducted with High-Fidelity DNA polymerase, Index (X) Primer, and Universal PCR primers. The PCR products were purified, and library quality was assessed on the Agilent Bioanalyzer 2100 system. The clustering of the index-coded samples was performed on a cBot Cluster Generation System (Illumina) according to the manufacturer’s instructions. After cluster generation, the libraries were sequenced on an Illumina NovaSeq 6000 platform to generate paired-end reads.

2.3. PacBio Technology-Based Full-Length cDNA Library Preparation and Sequencing

To construct the library for PacBio sequencing, qualified RNA from 10 tissues, including YL, ML, BF, JP, MP, SH, LS, S1, S3, and S4, were mixed in equal amounts. The mixed RNA was reverse transcribed using the SMARTer® PCR cDNA Synthesis Kit (Clontech, Japan). PCR amplification was then conducted, and the PCR products were purified using 1× and 0.4× AMpure PB beads (Pacific Biosciences, Menlo Park, CA, USA). After the QC test, the PCR product was end-repaired and ligated with adaptors using a SMRTbell Template Prep Kit (Pacific Biosciences, Menlo Park, CA, USA), digested by an exonuclease and purified with AMpure PB beads. After the QC test, the library was sequenced on the PacBio Sequel II platform.

2.4. Preprocessing of PacBio Reads

Raw PacBio sequencing reads were processed by removing polymerase reads with lengths shorter than 50 bp and quality lower than 0.80. After removing the low-quality reads, the subreads were obtained by removing the adapter sequences. Then, the final clean reads were obtained by removing the subreads that were <50 bp. CCS sequences were extracted from the clean reads using SMRT Link v7.0 (--min-passes 3). The CCS sequences containing both the 5′ and 3′ primer sequences and a poly(A) tail were characterized as full-length nonchimeric (FLNC) reads.
The FLNC reads were clustered into high-quality (HQ) isoforms (with quality ≥0.99) and low-quality (LQ) isoforms (with quality < 0.99) using the IsoSeq module of SMRT Link v7.0. The LQ isoforms were polished by high-quality Illumina RNA-Seq data using proovread v2.13.8 [21]. Then, the HQ and the corrected LQ isoforms were combined into consensus isoforms. Next, consensus isoforms were mapped to the peach reference genome (v2.0) using GMAP software (v43054,--cross-species --allow_close_indels 0). Finally, nonredundant high-quality consensus transcript sequences were obtained by removing the redundant sequences from consensus isoforms using cDNA_Cupcake v6.1 (https://github.com/Magdoll/cDNA_Cupcake/wiki, accessed on 1 January 2019).

2.5. Gene Fusion Characterization

Consensus transcript sequences from PacBio RNA-Seq were selected for fusion transcript identification. Fusion transcripts were identified according to the criteria used in a previous report [19] with minor modifications: (1) full-length transcripts (the redundancy has not been removed) mapped to 2 or more loci in the peach genome; (2) each mapped locus must align with at least 5% of the relevant transcript; (3) the total combined alignment coverage of these mapped loci must be at least 95%; and (4) all mapped loci must be at least 10 kb apart from each other.

2.6. Identification of Novel Genes

The PacBio RNA-Seq data were used to improve the gene annotations of the peach genome. Cuffcompare (v2.1.1 with default parameters) was used to compare the locations of the PacBio isoforms with the reference gene annotations (v2.1). The Cuffcompare class codes used in the categorization of the long-read transcripts were defined as follows: “=” for “complete match to annotation”, “c” for “transcripts contained in reference transcript annotation”, and the other code definitions can be found in Table S1.

2.7. Identification of Alternative Splicing (AS) Isoforms and Poly(A) Sites

The alternative splicing landscape was investigated using the Astalavista software v3.2 [22], and five types of AS events (alternative acceptor site, alternative donor site, exon skipping, intron retention, and mutually exclusive exons) were examined. The FLNC reads were used to identify poly(A) sites using the TAPIS pipeline (https://bitbucket.org/comp_bio/tapis/overview, accessed on 1 January 2019). The conserved motifs 50 bp upstream of the poly(A) sites were analyzed using MEME suites v5.5.0 (https://meme-suite.org/meme/, accessed on 1 June 2022).

2.8. Prediction of lncRNAs

Four bioinformatics programs, CPC2 v0.1 (default parameters) [23], CNCI v2 (default parameters) [24], CPAT v1.2.2 (-cutoff 0.38) [25], and PfamScan v1.6 (-translate orf) [26], were used to screen nonprotein coding RNA candidates from the FL transcripts. In this way, RNAs with putatively high protein-coding potentials were removed from the database. Finally, transcripts with lengths greater than 200 nt and with more than two exons were selected as lncRNA candidates. The putative lncRNAs were classified into 4 types, including lincRNAs, antisense lncRNAs, intronic lncRNAs, and sense lncRNAs, using Cuffcompare software v2.1.1 [27].

2.9. Illumina Sequencing Data Analysis

First, adaptors and low-quality reads were filtered from raw data using fastp software v0.20.1 [28]. Then, the high-quality clean reads were mapped to the peach reference genome v2.0 (https://www.rosaceae.org/species/prunus_persica/genome_v2.0.a1, accessed on 1 June 2022) [6] using HISAT2 v2.2.1 [29]. Estimation of the expression levels of the transcripts identified by PacBio sequencing was conducted using Rsubread featureCounts v2.4.3 software [30]. The transcript expression levels were quantified in transcripts per kilobase million (TPM). Principal component analysis (PCA) was calculated based on the expression levels of transcripts using the R package “PCAtools” (https://github.com/kevinblighe/PCAtools, accessed on 1 June 2021). UpSet plots of different group sets were generated using the R package “UpSetR” [31]. DETs were annotated according to the KEGG (http:// www. genome. jp/ kegg/, accessed on 1 June 2021) databases using the eggNOG-mapper software v2 [32], and KEGG enrichments were performed using the R package “clusterProfiler” v4.0 [33].

2.10. Real-Time Quantitative PCR (RT–qPCR)

Total RNA was extracted using the RNAprep Pure Plant Kit (Polysaccharides and Polyphenolics-rich, TianGen, Beijing, China). First-strand cDNA synthesis was performed using the PrimeScript™ RT reagent Kit with gDNA Eraser (Perfect Real Time, Takara Bio, Dalian, China). RT–qPCR was conducted using AceQ ® qPCR SYBR Green Master Mix (Vazyme, Nanjing, China), with the following program: one cycle of 5 min at 95 °C for denaturation, followed by 40 cycles of 10 s at 95 °C and 34 s at 60 °C, and the standard melting curves step. A peach gene PpTEF2 was set as the internal reference. RT–qPCRs were performed on StepOne plus (ABI) machine with three independent biological replicates for each sample. Sequences of the primers used are listed in Table S6.

3. Results

3.1. Peach PacBio Iso-Seq

To explore the landscape of alternative splicing events in peach, equal amounts of total RNA from 10 samples of six organs, including young leaf (YL), mature leaf (ML), shoot (SH), flower at balloon stage (BF), juvenile peel (JP), maturing peel (MP), lignified stone (LS), fruit flesh of the first (S1) and the second (S3) exponential expansion, and maturing (S4) stages, were pooled to prepare the library for PacBio SMRT technology-based Iso-Seq. The Illumina RNA-Seq libraries were also separately constructed from these peach materials, with three biological replicates. For the PacBio sequencing data, 19.53 Gb clean data comprising 250,803 circular consensuses (CCS) reads with 1–6 kb cDNA size from two SMRT cells of the PacBio Sequel II platform were obtained (Table 1). Among the CCSs, 89% (223,186) were identified as FLNC (full-length nonchimeric) reads. The FLNC reads were then clustered by using the IsoSeq module of SMRTLink software, and 72,175 consensus isoforms were obtained, including 70,436 high-quality and 1538 low-quality isoforms. After correction of the low-quality isoforms by Illumina data, all the isoforms were mapped to the peach v2.0 reference genome using GMAP. A total of 69,719 (96.6%) consensus isoforms were mapped to the peach reference genome. After the removal of redundant sequences using cDNA_Cupcake software, 40,477 nonredundant high-quality consensus transcript sequences were ultimately obtained. Each nonredundant high-quality consensus transcript sequence was designated “PB.x.x”, in which the first and second “x” represented the locus and the isoform, respectively. The distribution of genes and isoforms identified by our Iso-Seq data is shown in Figure 1.

3.2. Discovery of Novel Transcripts

The Iso-Seq data were used to improve the gene annotations of the peach genome. All nonredundant high-quality consensus transcript sequences were compared with the peach reference genome (v2.0) using Cuffcompare software to identify novel gene transcripts. The transcript set of “=” and “c” was defined as “known transcripts”, and the other was considered “novel transcripts”. The genes with code “u” were considered “novel genes”. In total, 18,820 novel transcripts were obtained, of which 18,274 were novel isoforms of known genes. The remaining 546 transcripts had no homology with known genes in the peach genome annotation (v2.1) and were identified as novel gene transcripts.

3.3. Identification of Fusion Transcripts

Fusion transcripts, usually generated as a result of fusion either at the DNA level or during splicing events, have been proven to play important roles in promoting hematological and solid cancers in humans [34]. In total, 148 fusion transcripts were detected from the SMRT Iso-Seq data in this study. Among them, 32 and 116 fusion transcripts were intra- and inter-chromosomal, respectively (Table S2). As shown in Figure 1, these fusion transcripts were distributed over all peach chromosomes.

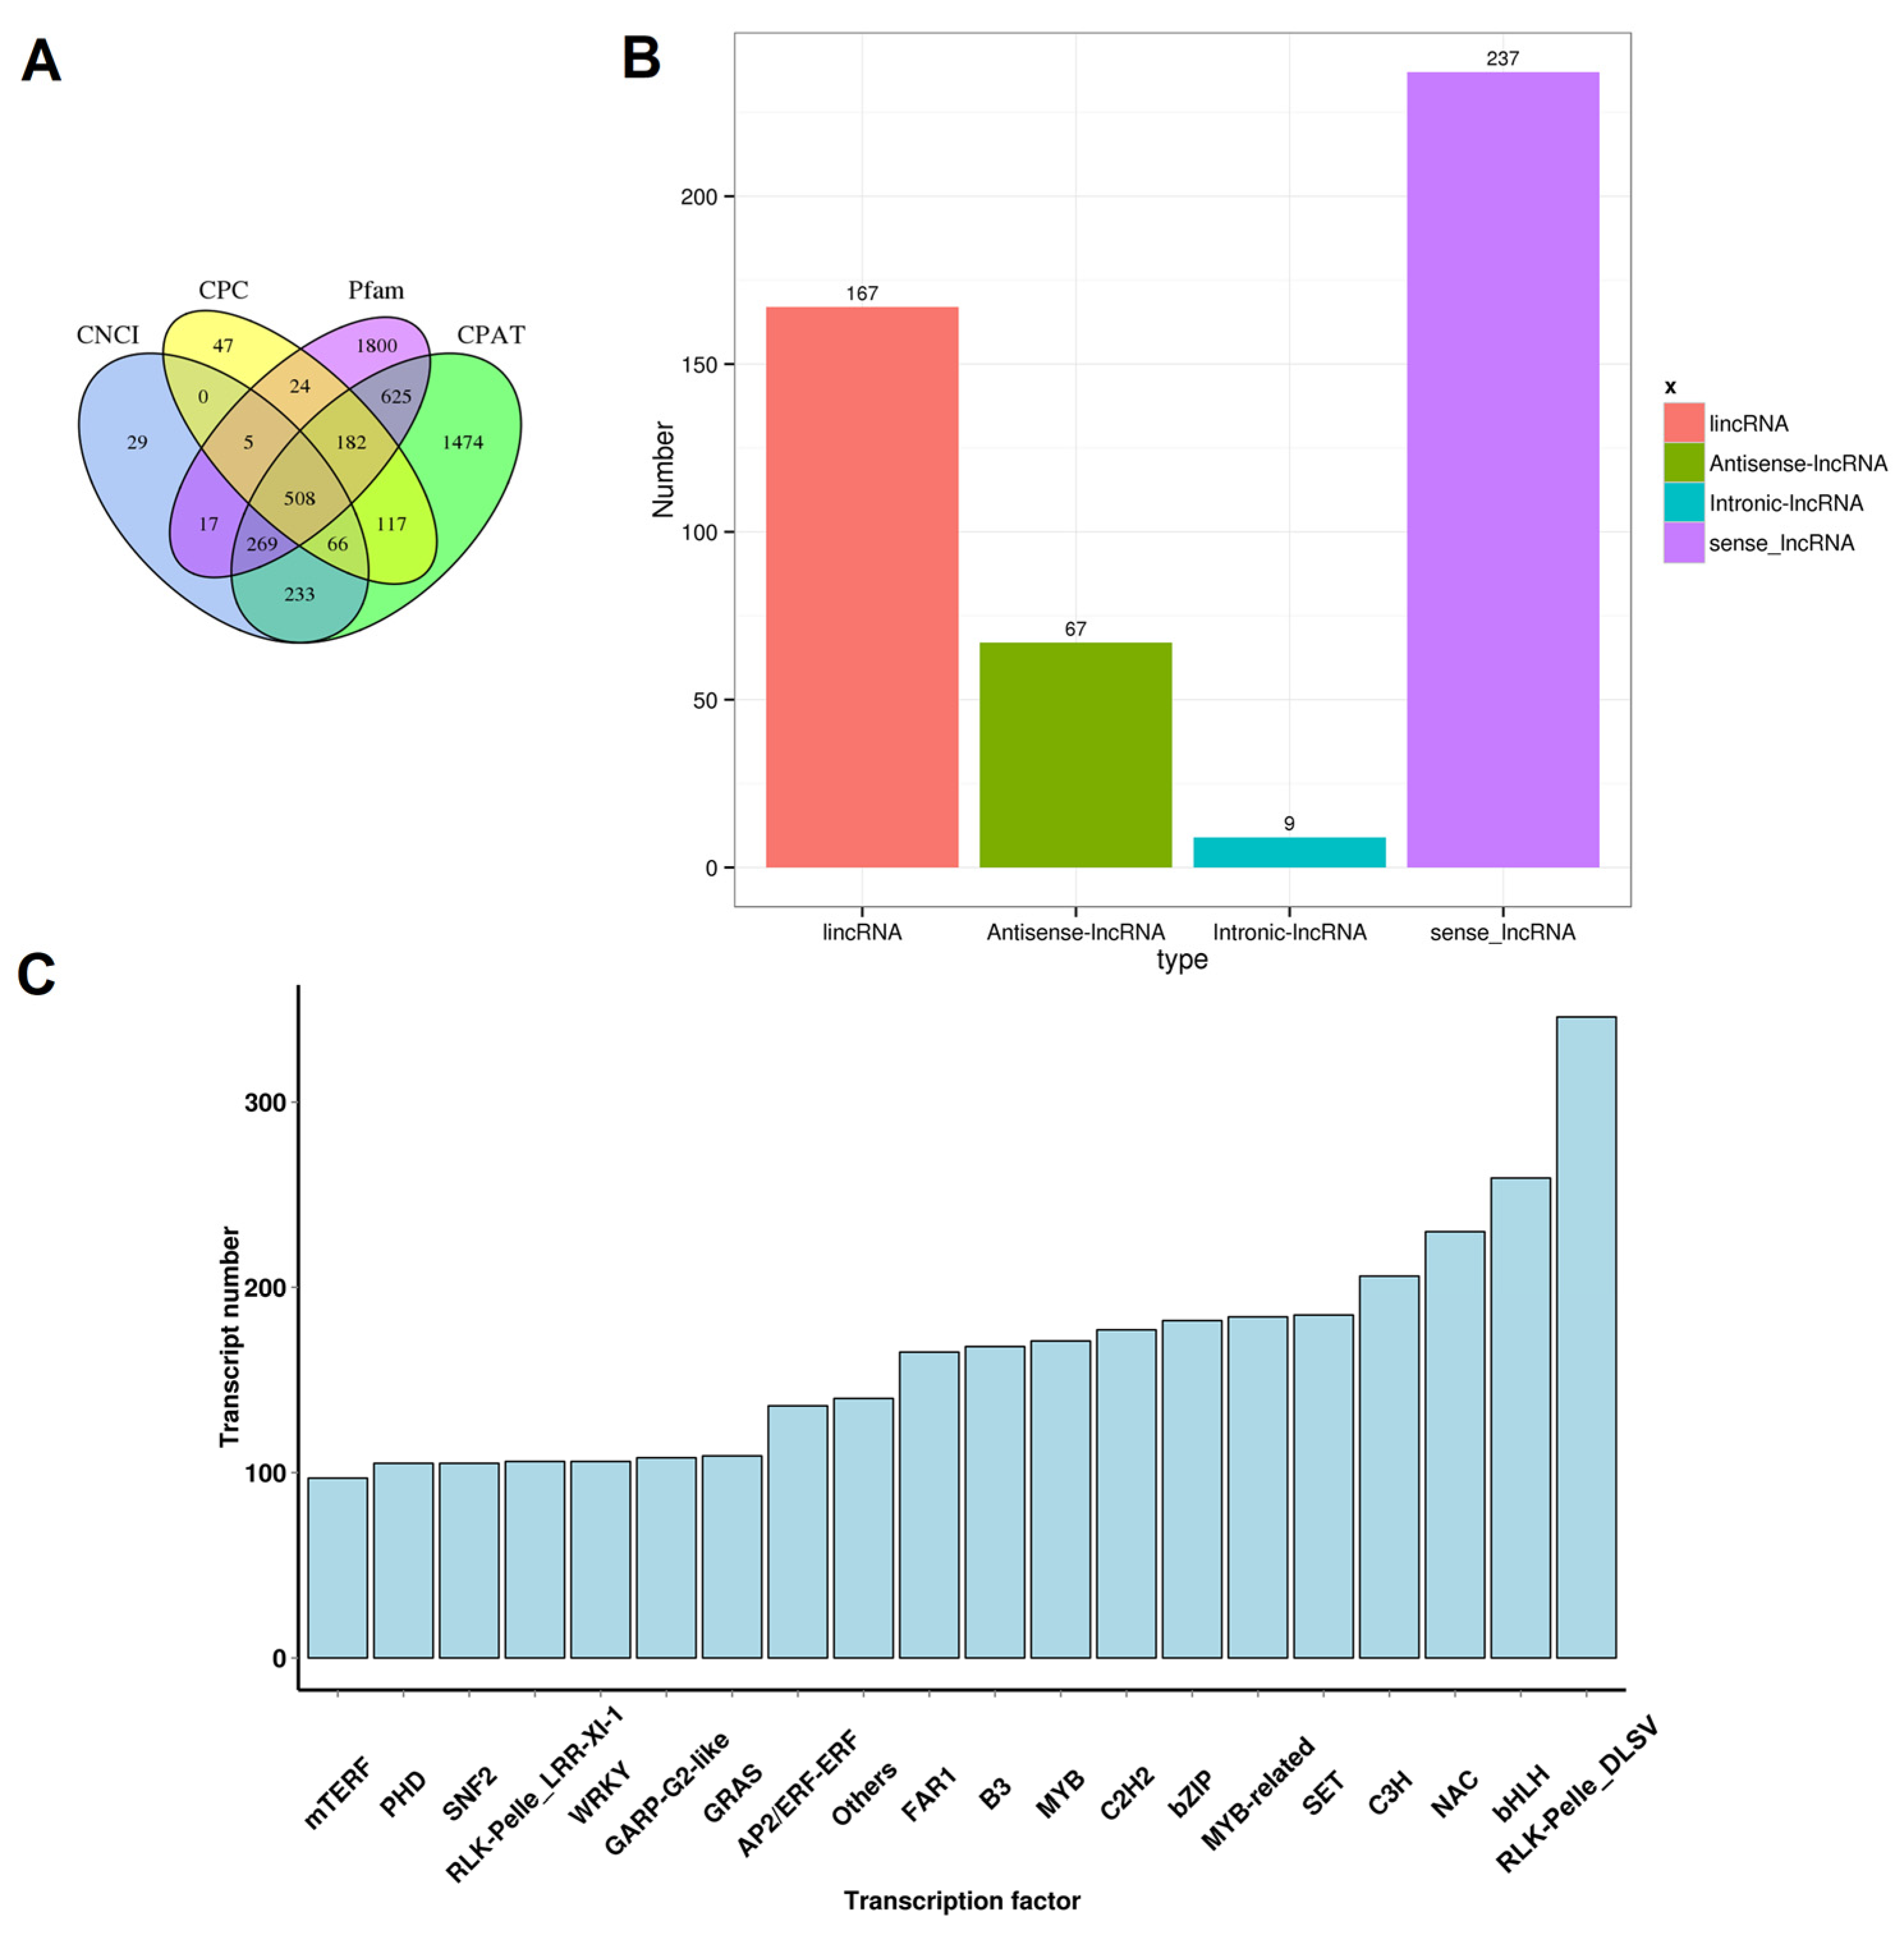
3.4. Prediction of lncRNAs and Determination of TFs

LncRNAs are a class of transcripts of more than 200 nucleotides in length but without discernable protein-coding potential [35]. It has been proven that lncRNAs play important roles in plant growth and development and reactions to biotic or abiotic stresses [36]. Candidate lncRNAs were predicted by evaluating the protein-coding potentials using four tools, CPC, CNC, CPAT, and Pfam domain analysis. Ultimately, 508 potential lncRNA transcripts went through selections of all four methods (Figure 1 and Figure 2A). According to the relative location between lncRNA transcripts and the closest protein-coding genes, these lncRNAs were further divided into four types, including 167 lincRNAs, 67 antisense-lncRNAs, 9 intronic-lncRNAs, and 237 sense-lncRNAs (Figure 2B). In our recent study on peach fruit lncRNAs, a total of 1500 lncRNAs were reported [37]. We used the sequences of potential lncRNA transcripts of this study as queries to blast our previous database, and the results showed that 335 of the 508 potential lncRNA transcripts of this study found hits (e-value < 1 × 10⁻⁵ and identity ≥ 90) in our previously reported 1500 lncRNAs [37]. Moreover, we annotated the TFs from the transcripts. In total, 7603 transcripts in our data encoding functional TF domains were found (Table S3). The top three TF families with the most numerous members were the RLK-Pelle_DLSV, bHLH, and NAC families (Figure 2C).

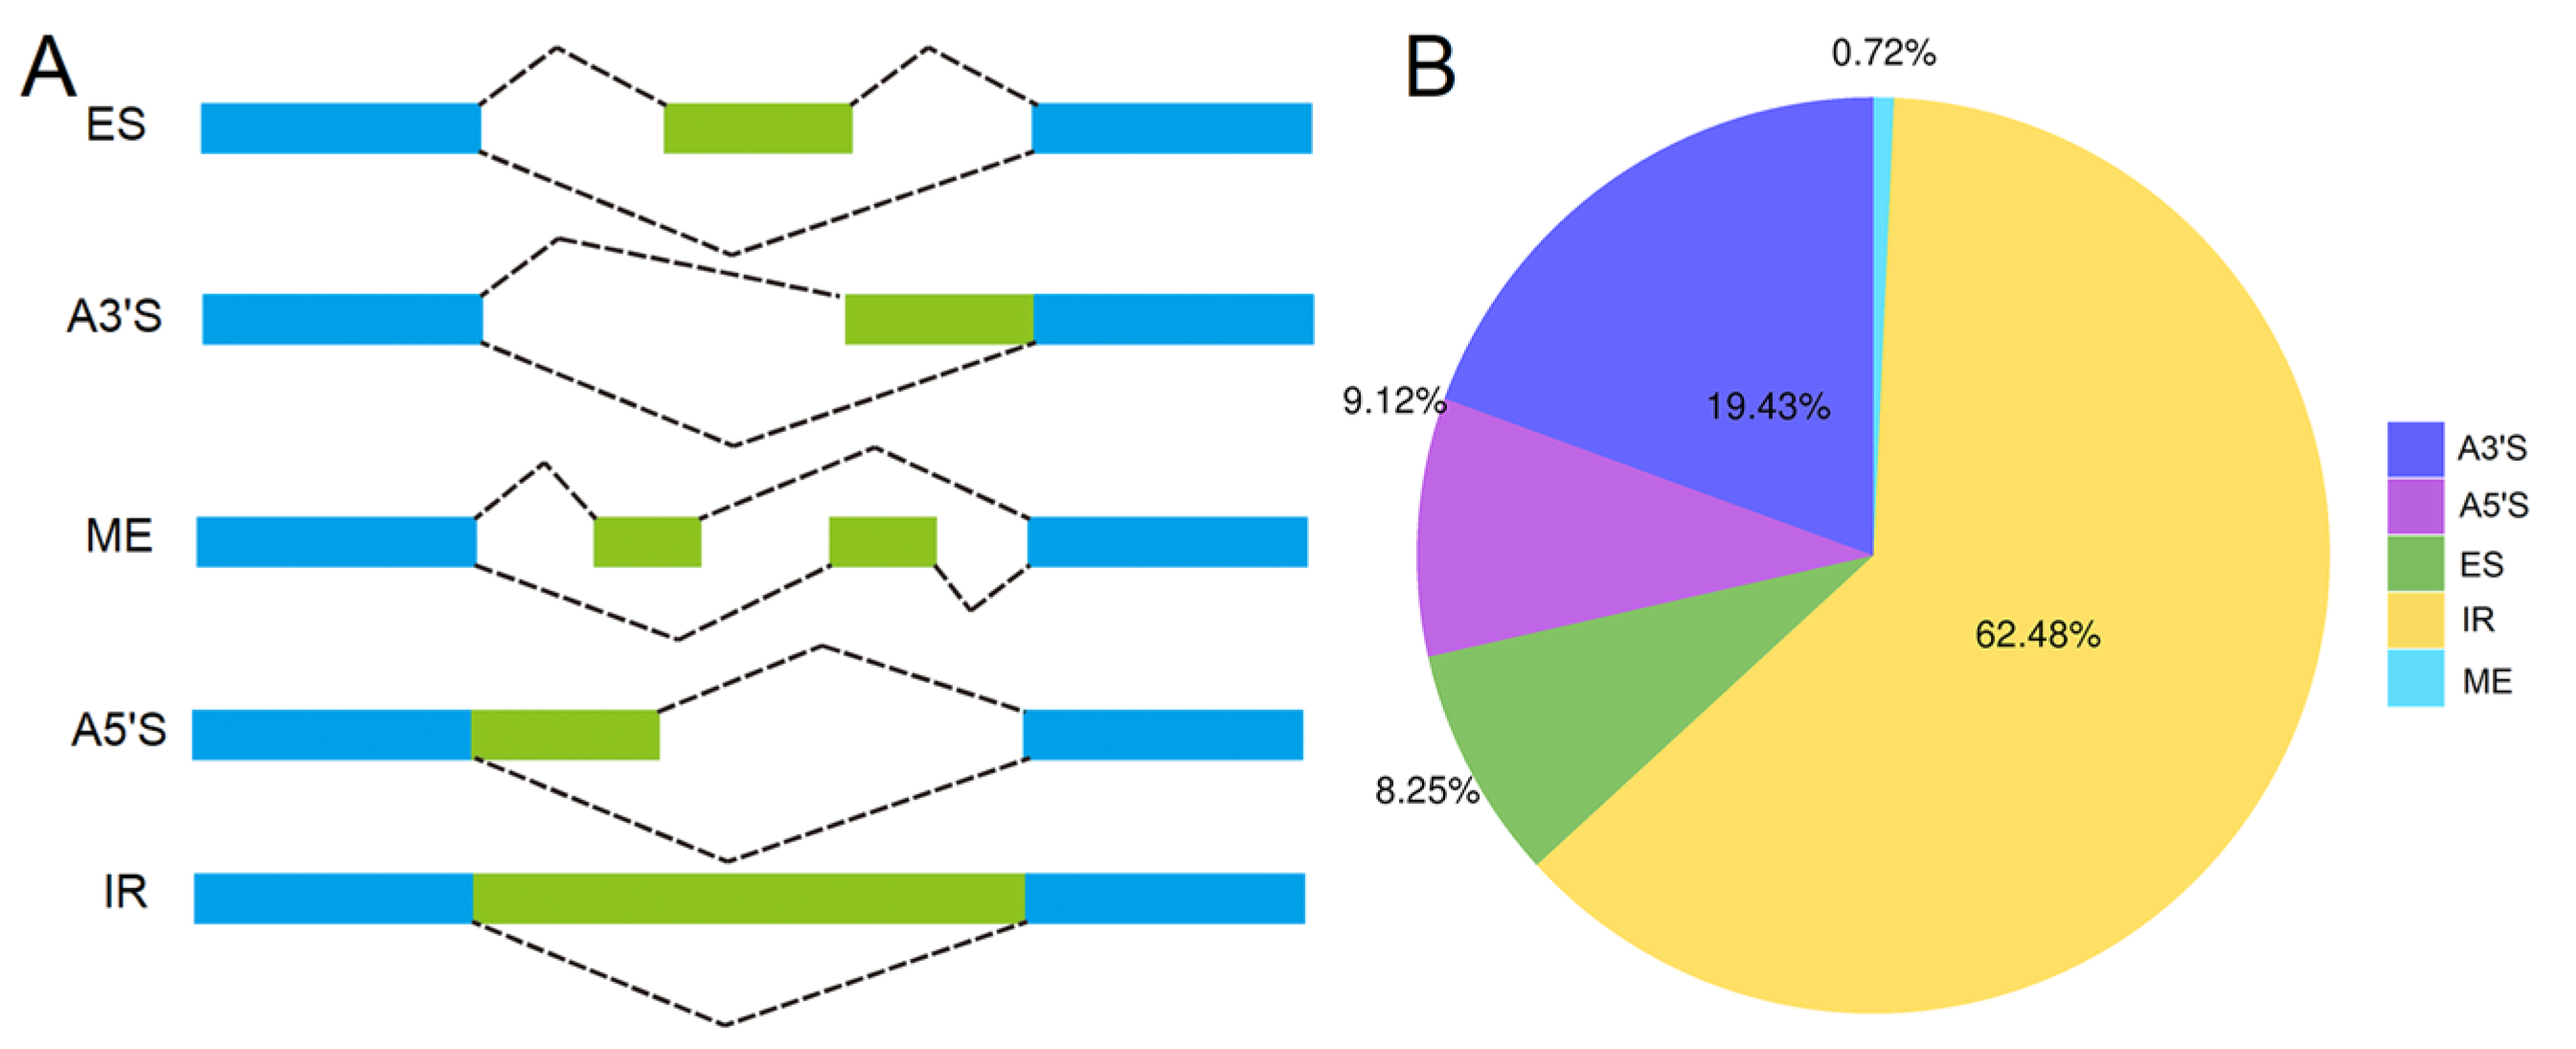
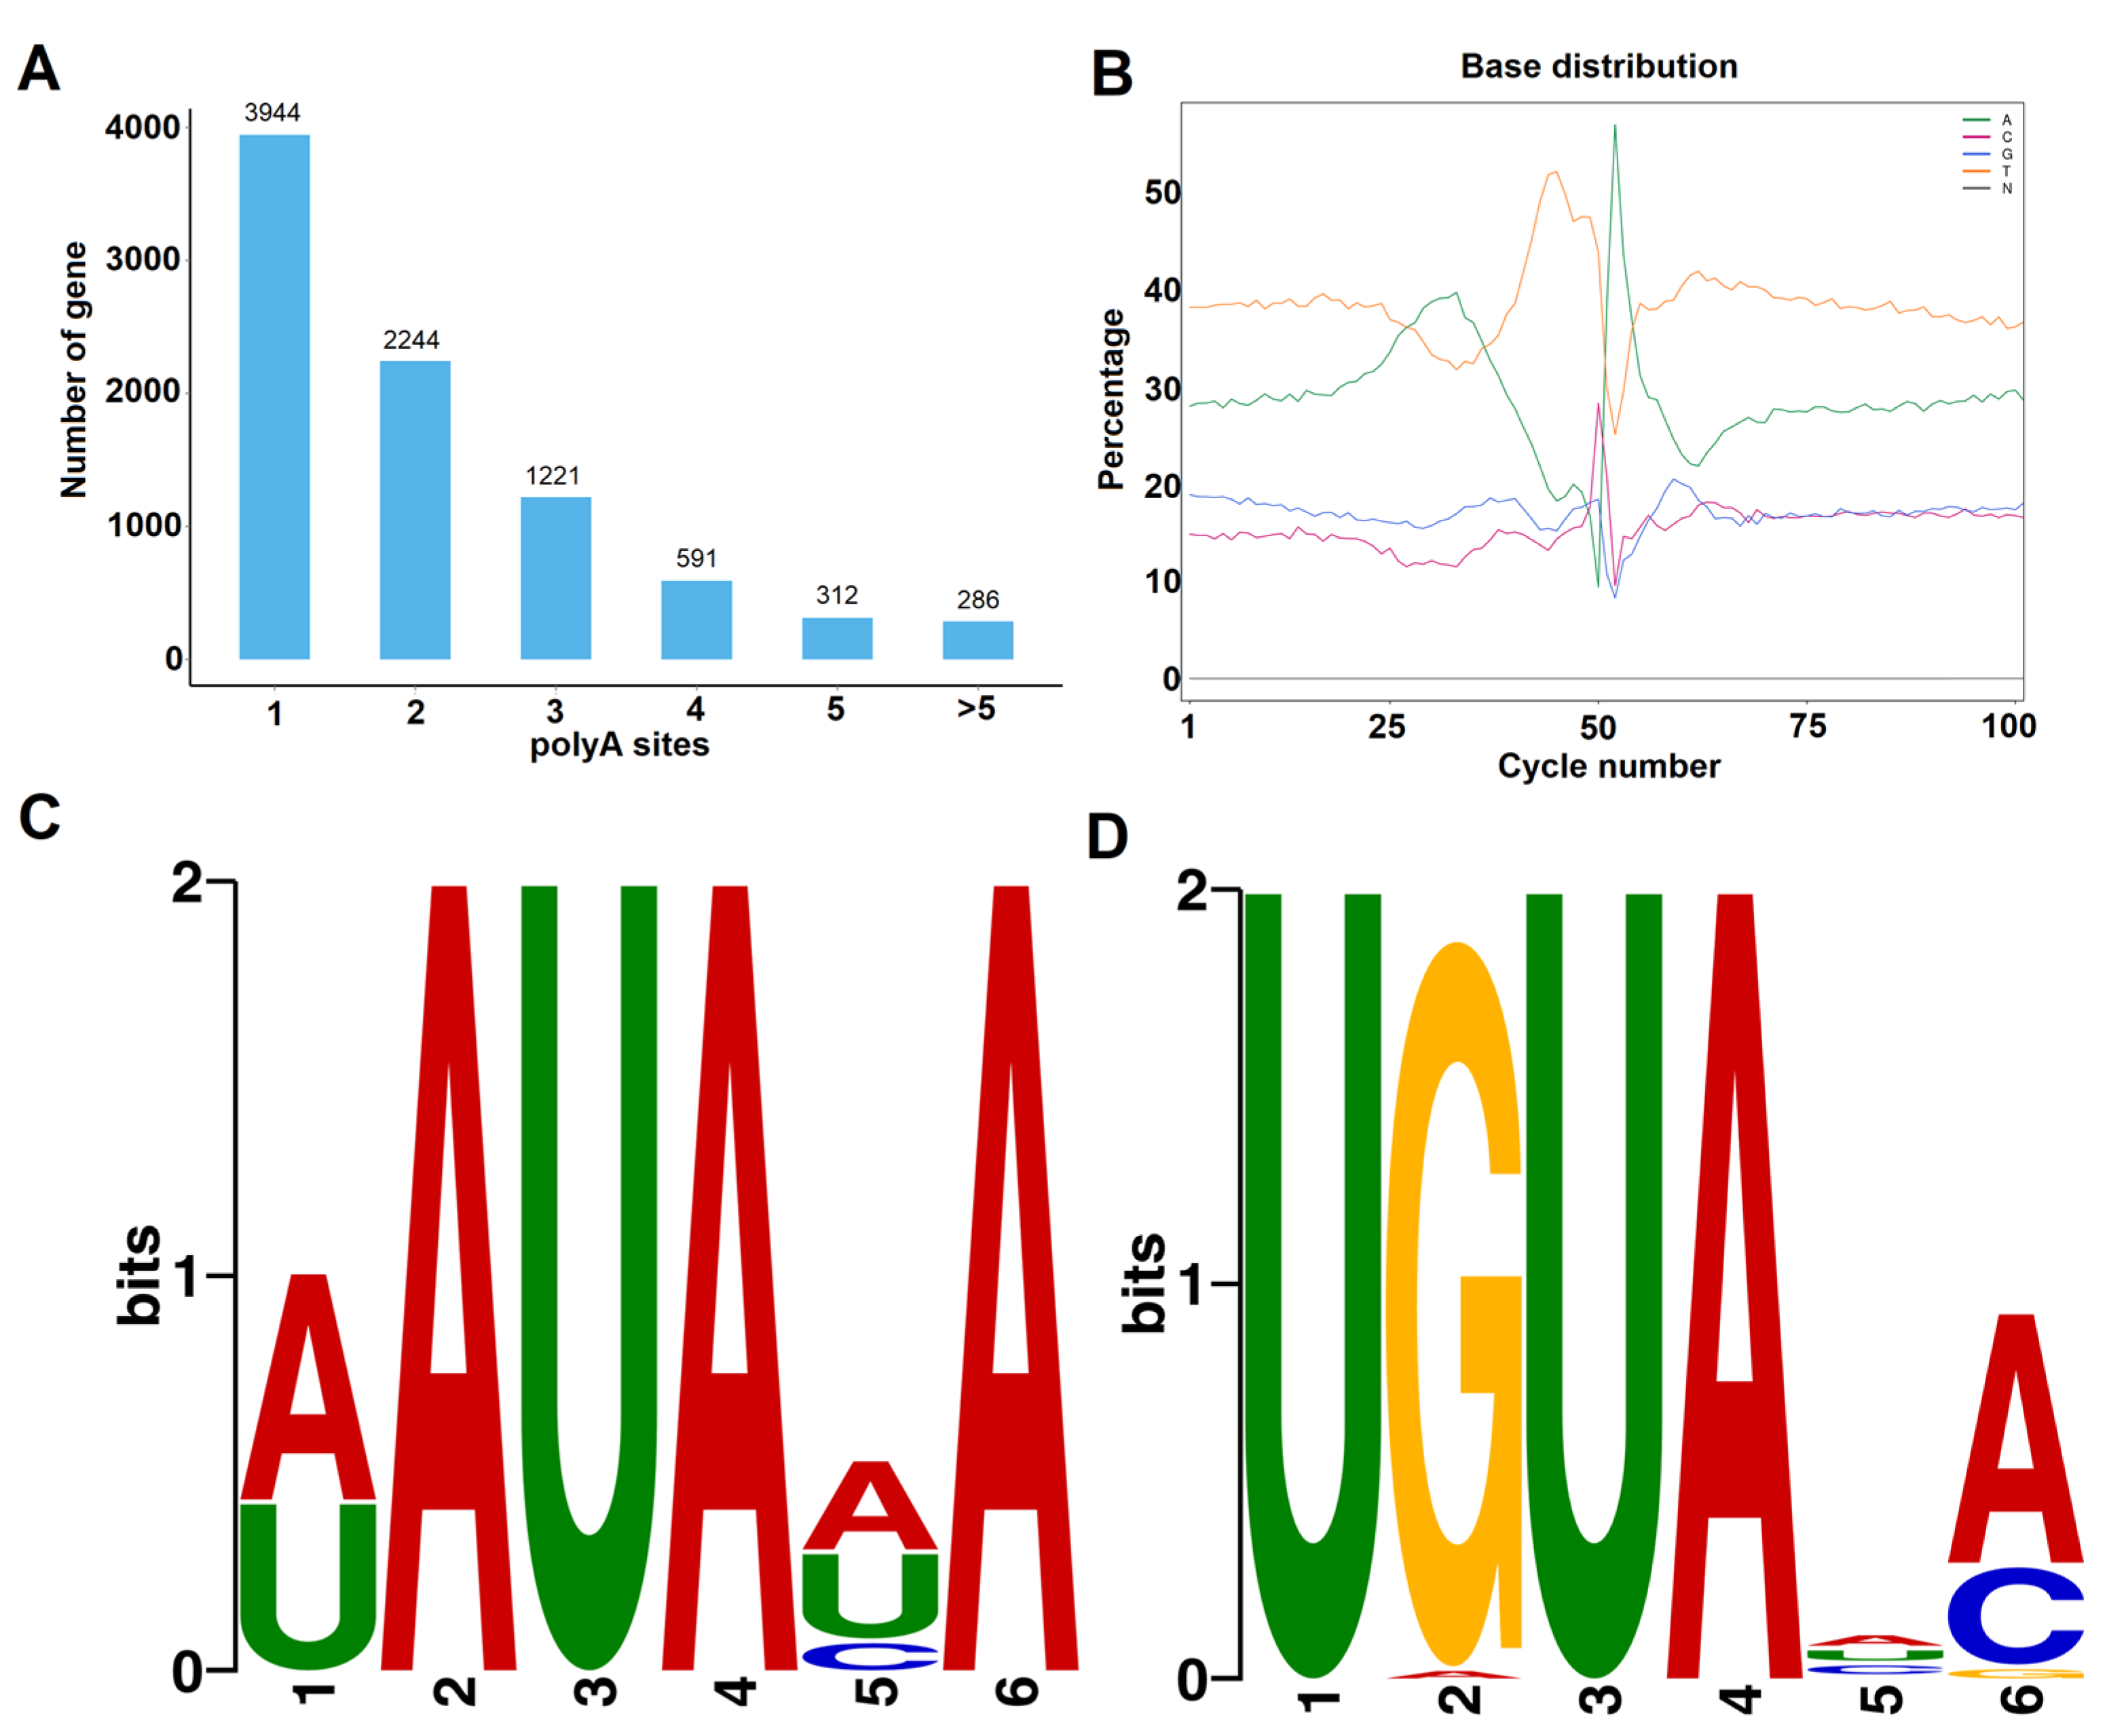
3.5. Analysis of AS and APA Events

AS events were investigated for the 40,477 nonredundant high-quality consensus transcripts. A total of 15,434 AS events were detected and were further classified into five types, intron retention (IR), alternative 3’ splice site (A3′S), alternative 5’ splice site (A5′S), exon skipping (ES), and mutually exclusive exon (ME) (Figure 3A), representing 62.48%, 19.43%, 9.12%, 8.25%, and 0.72% of the total AS events, respectively (Figure 3B).
APA events were detected using the TAPIS pipeline. In total, 8598 genes with evidence of at least one poly(A) site were detected. Among them, 3944 genes (45.87%) were found to possess a single poly(A) site (Figure 4A). Among the other genes, 4368 genes (50.80%) were found to have two to five poly(A) sites, and 286 genes were found to contain more than five poly(A) sites. As an example, the 3′ downstream structure of a laccase gene (Prupe.6G271500), containing five distinct APA sites, is illustrated in Figure S1. The largest number of APA events identified was 12, found for three genes: Prupe.6G163400, Prupe.7G174300, and Prupe.8G135300 (Figure S1). Next, the nucleotide sequence composition in the 50 bp upstream and downstream flanking regions of all polyadenylation cleavage sites was analyzed (Figure 4B). The results showed that uracil (U) and adenine (A) were enriched in upstream and downstream regions of the cleavage site, which was in accordance with previous reports on other plant species [38,39]. To investigate potentially conserved motifs necessary for polyadenylation, a MEME analysis was conducted using the sequences of 60 nucleotides upstream from the poly(A) sites of all transcripts. As shown in Figure 4C,D, the motifs found 25 and 35 nt upstream of the poly(A) site were similar to the known signals in dicots identified in previous studies [38,39].

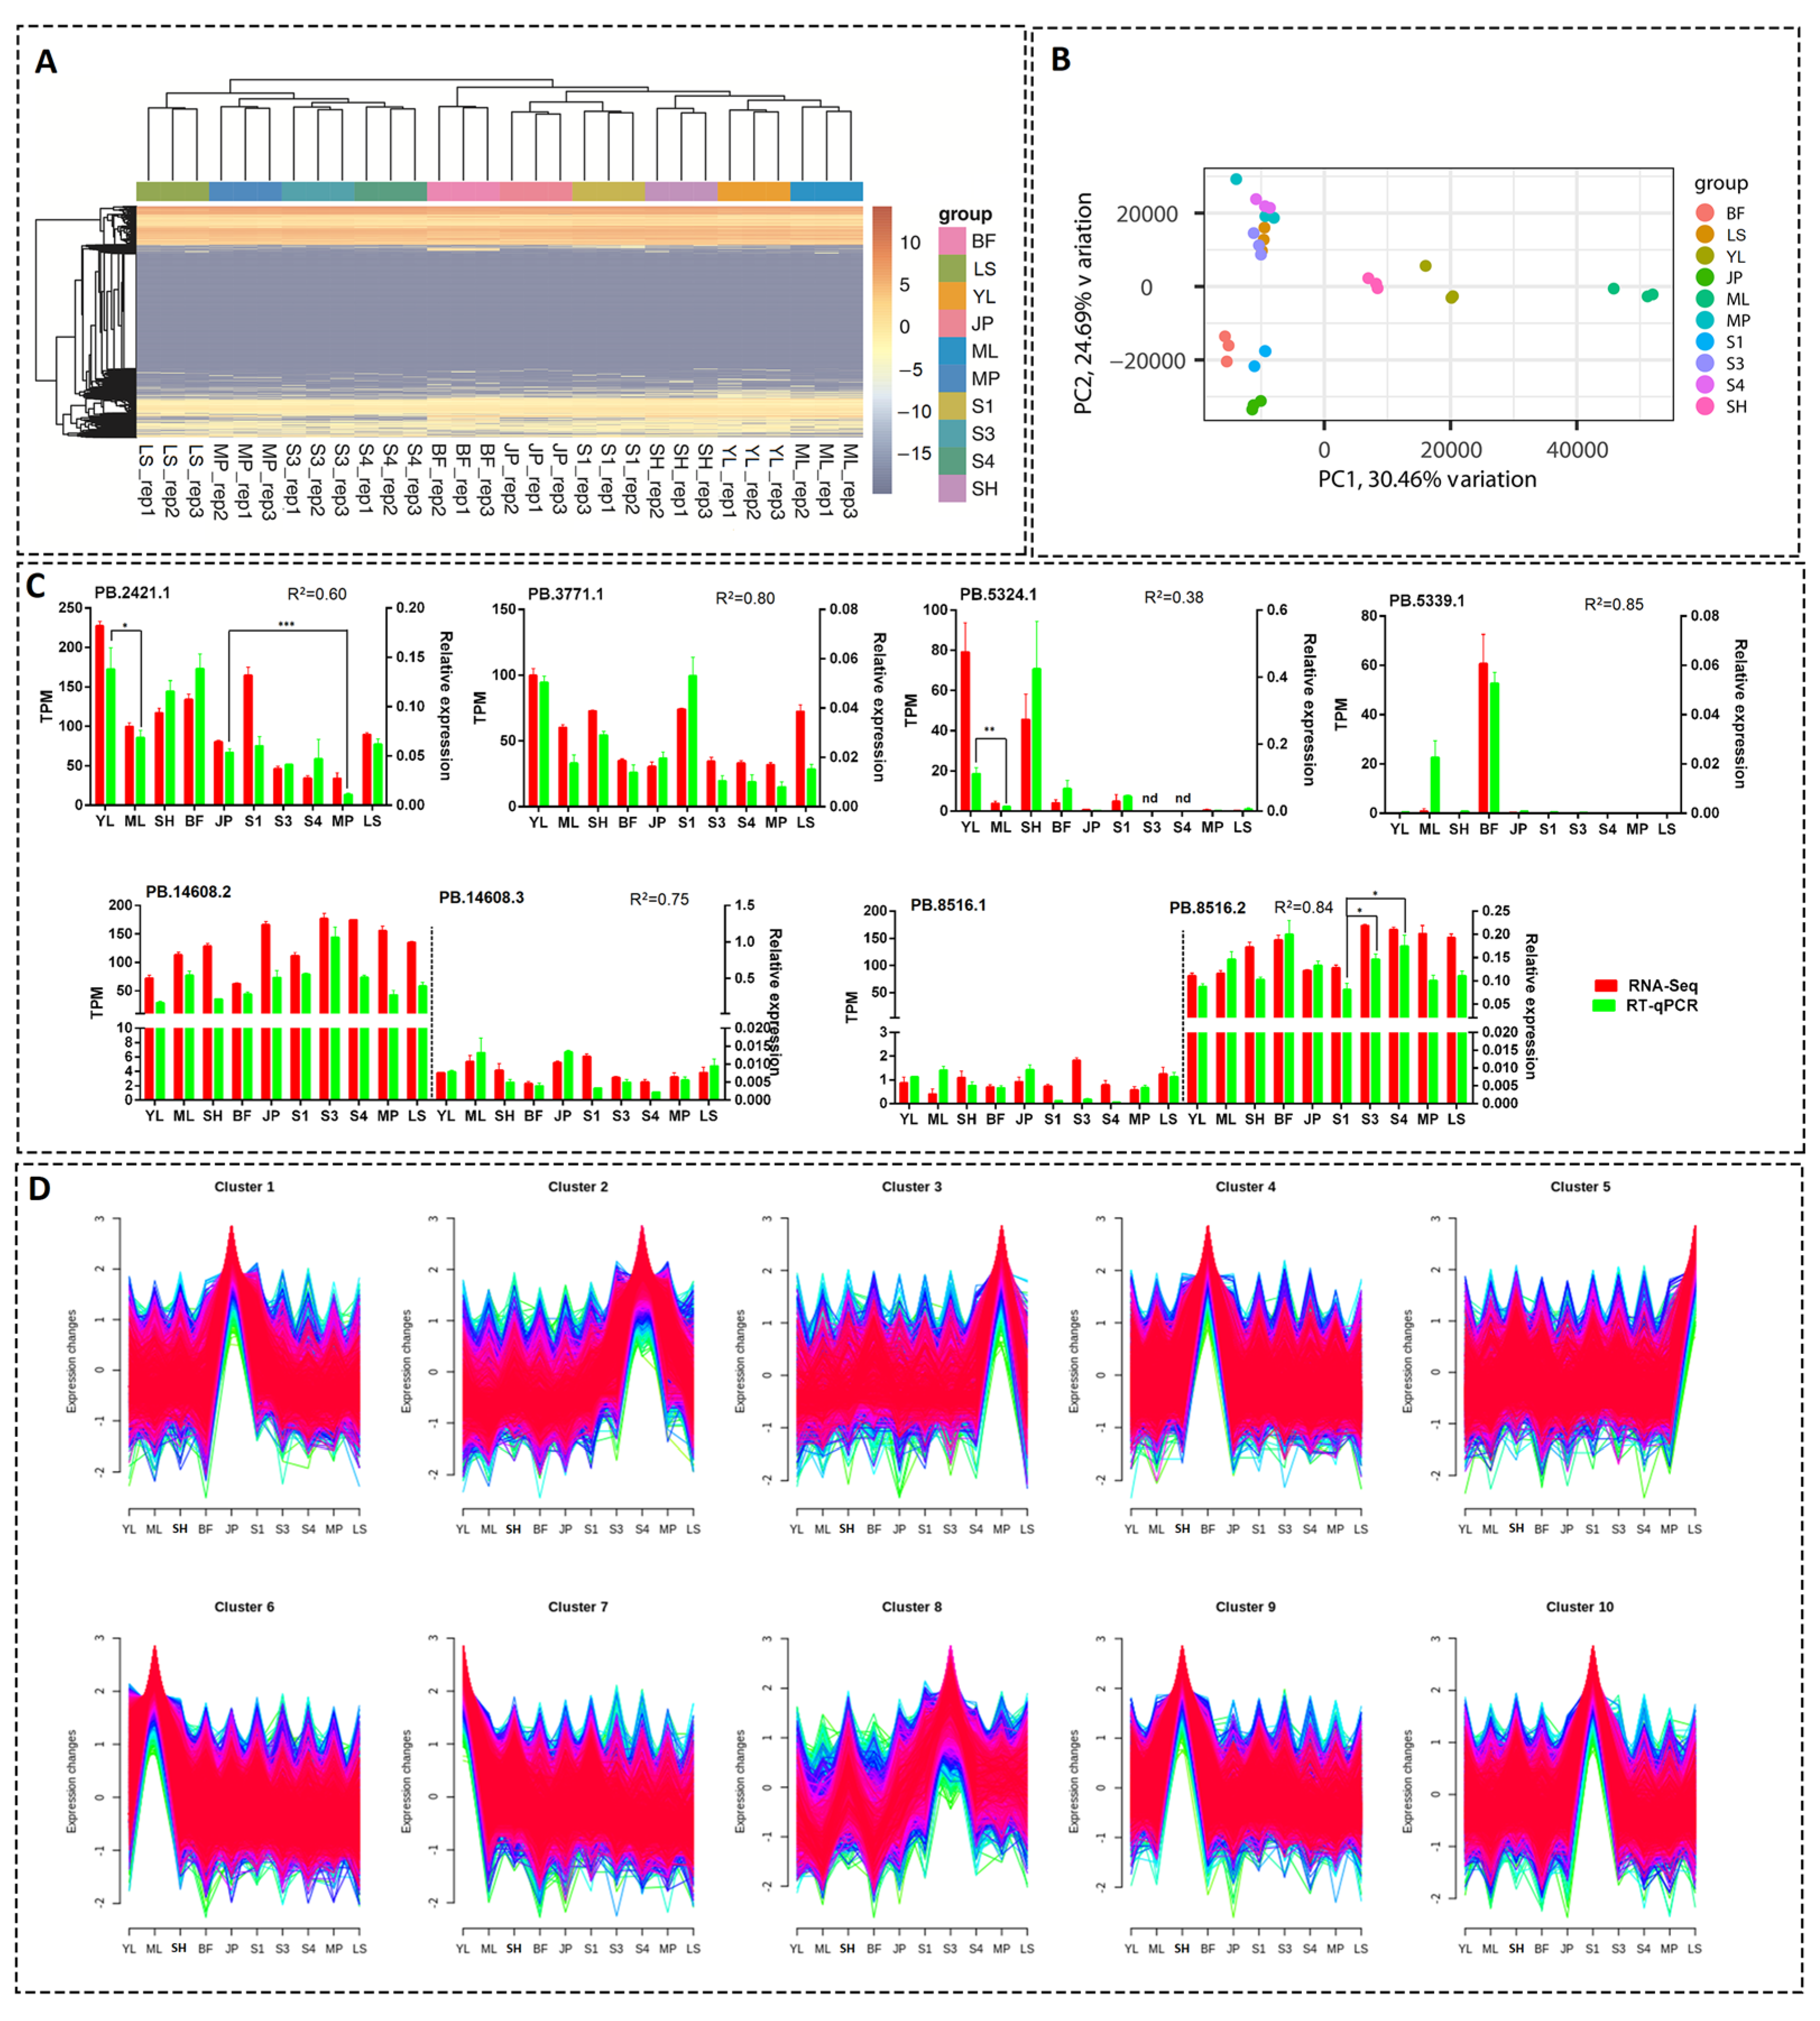
3.6. Estimation of Expression Levels of the Transcripts

To estimate the expression levels of the transcripts identified by PacBio sequencing, we individually sequenced the samples included in the PacBio mixed samples using the Illumina platform with three biological replicates. In total, 682 million reads representing 204 billion bases were obtained for 30 libraries, with the Q30 ratio ranging from 90.91% to 95.51% (Table S4). The expression levels of the transcripts identified by PacBio sequencing were quantitatively estimated in transcripts per kilobase million (TPM). Hierarchical clustering of the samples was conducted, and the results showed that all samples were mainly divided into two clades, with S3, S4, LS, and MP in one clade and the other tissues in the other clade (Figure 5A). The hierarchical cluster results were further confirmed by PCA. PCA using PCA1 and PCA2, accounting for 30.46% and 24.69% variation, respectively, showed that the 30 libraries were clustered into four groups (Figure 5B). BF, JP, and S1 showed relatively similar expression patterns and clustered together (Figure 5B). S3, S4, LS, and MP clustered together into a group, and SH, YL, and ML were roughly clustered into one group (Figure 5B).
Eight novel gene transcripts or alternative transcripts were randomly selected, and the expression levels of these transcripts in different tissues were verified by RT-qPCR (Figure 5C). Pearson correlation analysis revealed that the correlation coefficient square (R2) between RNA-Seq and RT-qPCR results were generally high (0.60–0.85 for seven of the eight tested transcripts), except for PB.5324.1, with a relatively low R2 value of 0.38 due to the higher variance among the biological replicates (Figure 5C). The above results indicated that the RT–qPCR results were generally in accordance with the RNA-seq-based quantifications of transcript levels.
Based on the expression levels in each sample, the transcripts were further classified into 10 clusters, with the least number of transcripts (1096) in cluster 3 and the maximum number (2896) in cluster 6 (Figure 5D). Each cluster showed expression bias for one or several tissues or development stages. In total, 50.1% (20,262) of the transcripts showed tissue- or development-stage-specific expression patterns, and 3348 genes contained at least two transcripts distributed in different clusters.
We further investigated the genes containing different transcripts distributed in both juvenile fruits (cluster 10) and ripening fruits (cluster 2). In total, 100 genes met the filtering criteria (Table S5). For example, two transcripts of a phosphoribosyltransferase encoding gene, PB.14148 (Prupe.8G043500), showed a distinct trend of expression levels: one transcript, PB.14148.1, was highly expressed in the ripening mesocarp, but another transcript, PB.14148.2, showed a decreasing trend during fruit development and ripening processes. Similarly, a “peroxisome biogenesis protein” encoding gene, PB.9021 (Prupe.5G069700), also contained two transcripts showing opposite expression patterns.

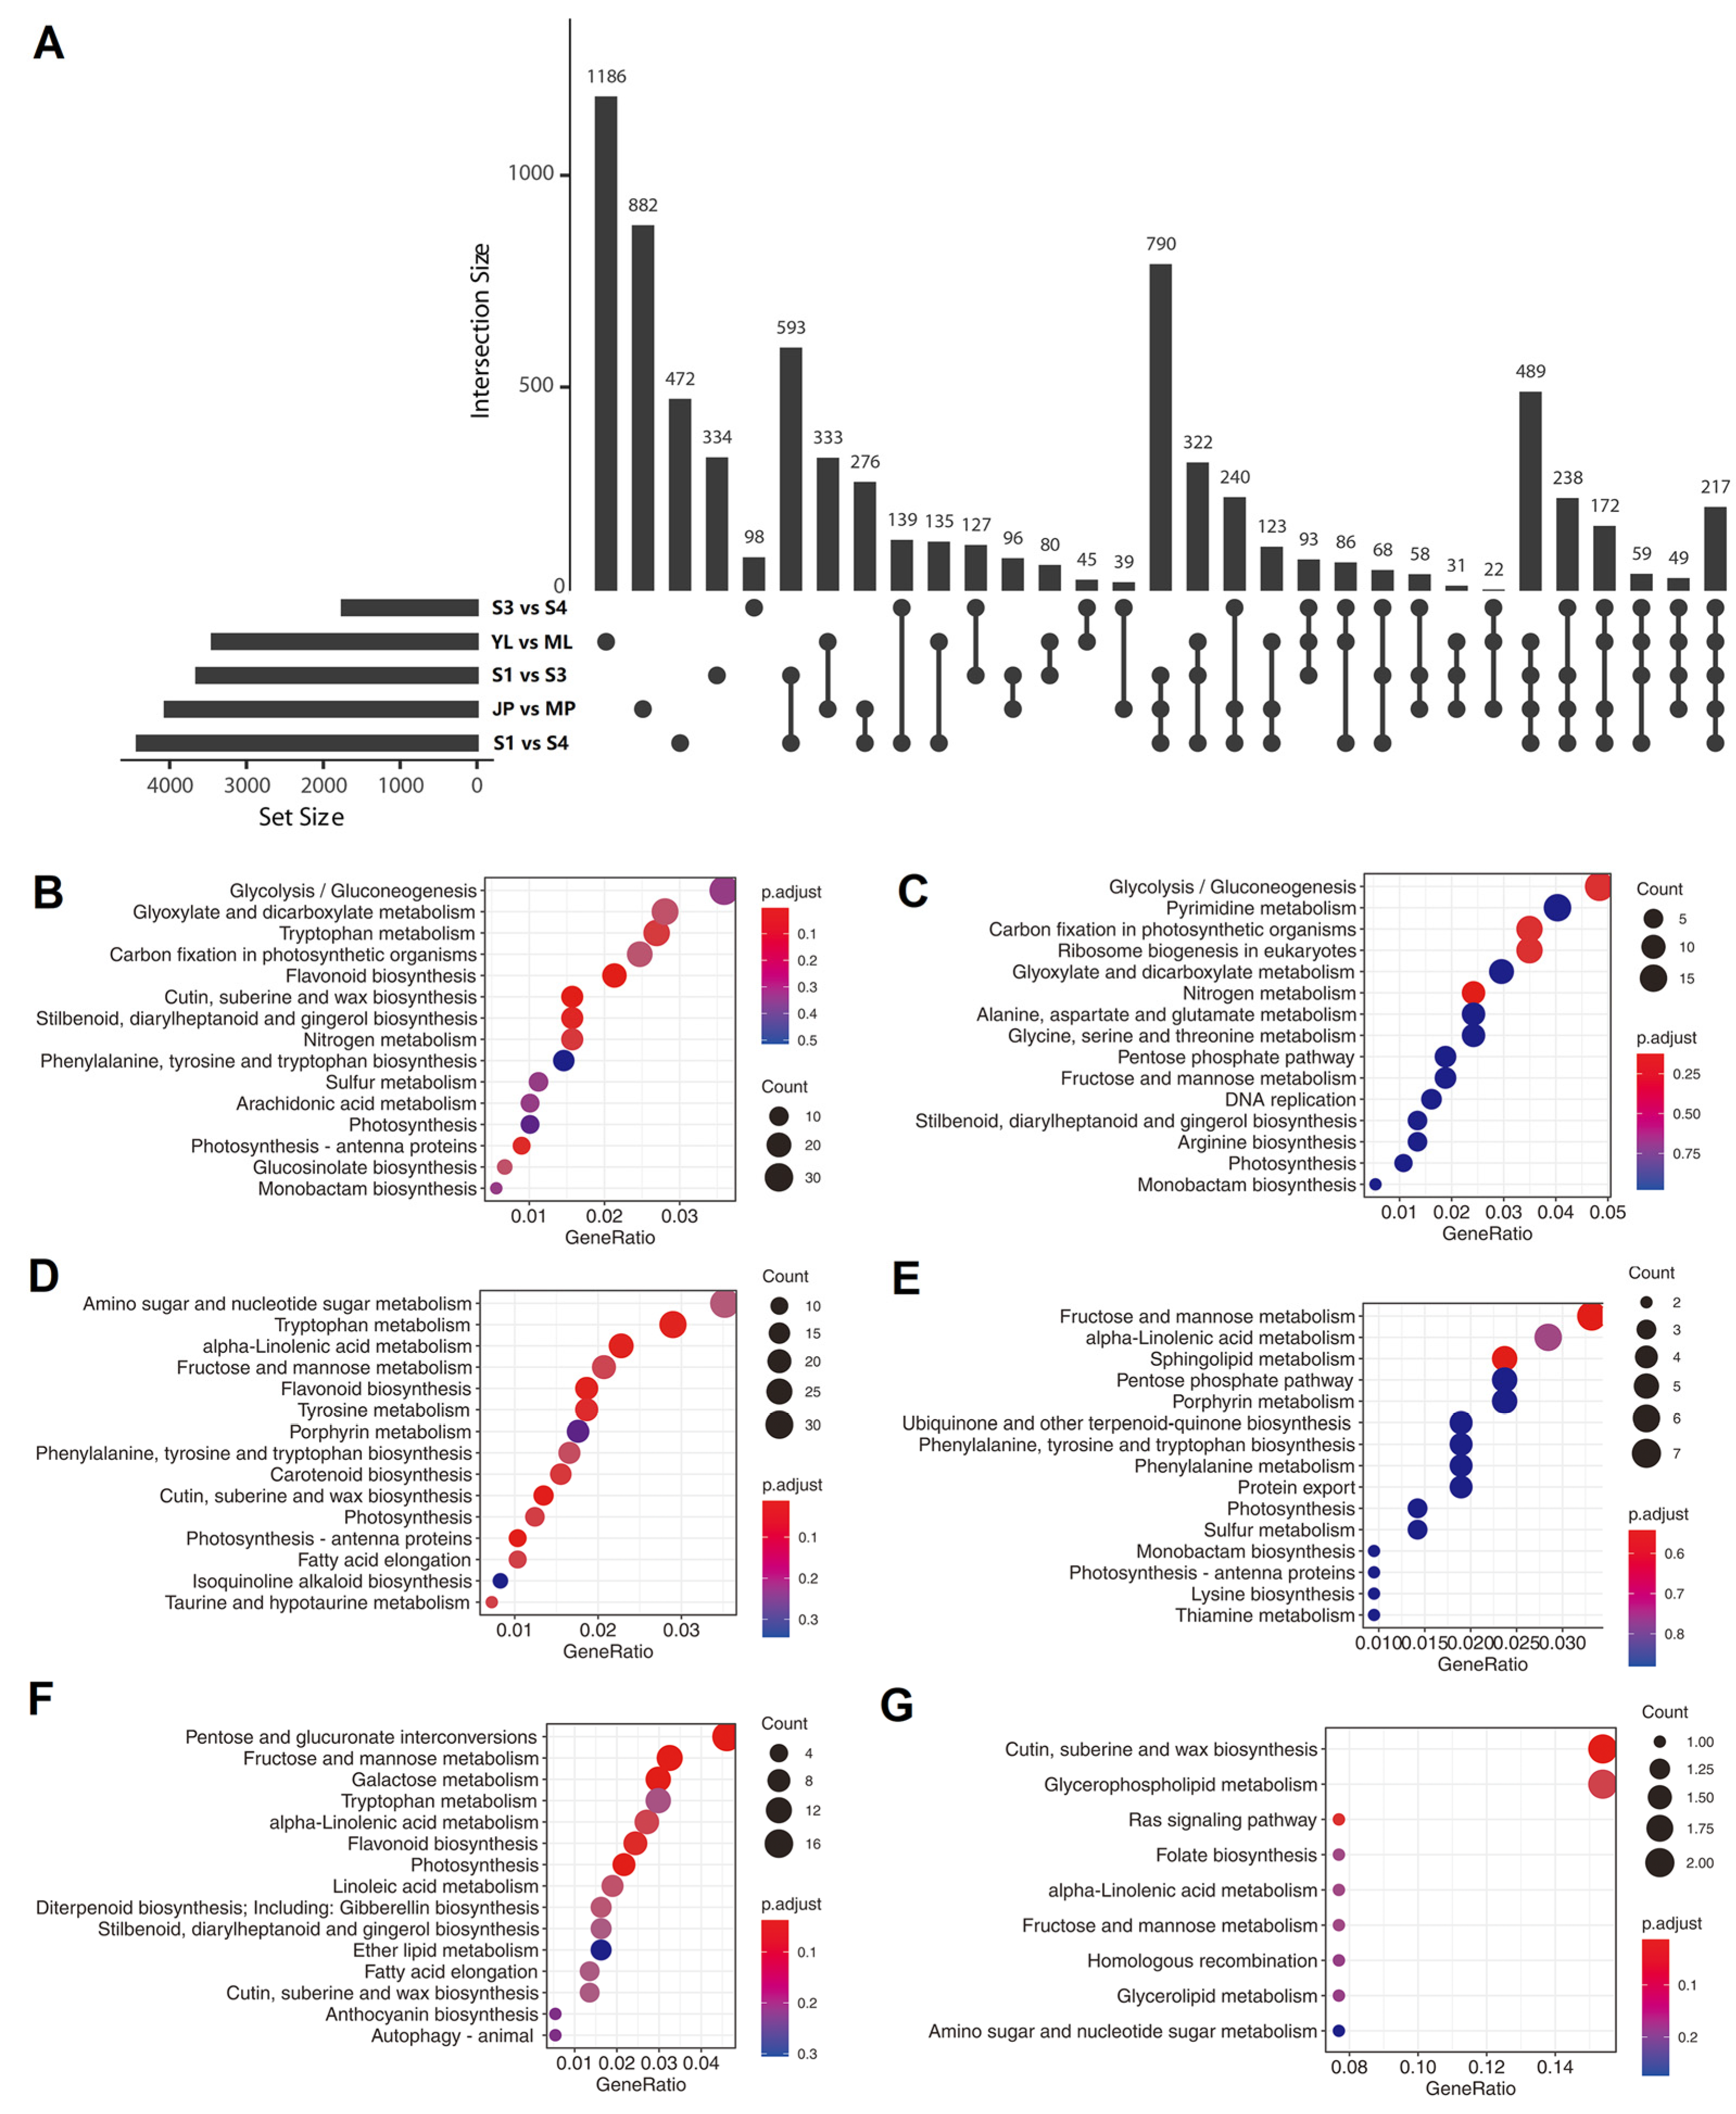
3.7. Analysis of Tissue- or Development Stage-Specific Differentially Expressed Transcripts (DETs)

We compared the transcript expression levels among different samples and found 4055, 3442, 3644, 4419, and 1750 DETs in different group sets, including “JP vs. MP”, “YL vs. ML”, “S1 vs. S3”, “S1 vs. S4”, and “S3 vs. S4”, respectively (Figure 6A). These group sets represented “peel development and ripening”, “leaf growth”, “mesocarp development”, “mesocarp development and ripening”, and “mesocarp ripening” processes, respectively. Furthermore, an UpSet plot was generated to represent the intersecting sets of these groups, and the results showed that the numbers of “JP vs. MP”-, “YL vs. ML”-, “S1 vs. S3”-, “S1 vs. S4”-, and “S3 vs. S4”- specific DETs were 882, 1186, 334, 472, and 98, respectively (Figure 6A). We further checked the expression pattern of the transcripts verified by RT-qPCR in Section 3.6 (Figure 5C). In total, four (PB.2421.1, PB.5324.1, PB.8516.1, and PB.8516.2) of the eight transcripts were found in the above UpSet plot results. All four transcripts showed relatively high expression levels, except PB.8516.1. PB.2421.1, which tended to be expressed in juvenile tissues (young leaf or fruit peel) compared to adult/maturing tissues. A similar case was found for PB.5324.1, of which the expression level was significantly higher in the young leaf than in maturing leaf (Figure 5C). In accordance with the RNA-Seq-based expression pattern, PB.8516.2 showed a significantly lower expression level in juvenile fruit than in ripening fruits, although it tended to be constructively expressed in all the tested tissues (Figure 5C). Another two transcripts, PB.3771.1 and PB.14608.2, showed similar expression patterns between RNA-Seq and RT-qPCR though they were not present in the UpSet results due to the constructive expression patterns. Nevertheless, PB.5339.1 was not specifically expressed in the leaf in the RNA-Seq analysis but showed a relatively high expression level in RT-qPCR (Figure 5C), perhaps due to the seasonal variation of the leaf samples. Collectively, the above results showed that the RT–qPCR results were generally in accordance with the RNA-seq-based UpSet analysis of expression trends.
When counting the common specific DETs in at least two group sets, it was found that “S1 vs. S3” and “S1 vs. S4” had the highest number (593) of common specific DETs in two group set intersections. “S1 vs. S3”, “S1 vs. S4”, and “JP vs. MP” had the highest number (790) of common specific DETs in three group set intersections. “S1 vs. S3”, “S1 vs. S4”, “JP vs. MP”, and “YL vs. ML” had the highest number (489) of common specific DETs in four group sets of intersections (Figure 6A). These results indicated that common gene modules and biological processes were shared within these group sets.
We also compared the functional annotations between all- and set-specific DETs of the “YL vs. ML” group set (Figure 6B,C). The top five pathways enriched for all “YL vs. ML” DETs were “glycolysis”, “glyoxylate and dicarboxylate metabolism”, “tryptophan metabolism”, “carbon fixation in photosynthetic organisms”, and “flavonoid biosynthesis”. However, only “glycolysis” and “carbon fixation in a photosynthetic organism” were included among the top 15 pathways enriched for “YL vs. ML” specific-DETs. These results are in accordance with elevated photosynthetic efficiency during leaf growth but not fruit development. Next, a comparison of the functional annotations between all- and set-specific-DETs of group set “JP vs. MP” was also conducted (Figure 6D,E). The results showed that the specifically enriched pathways with lower q-values were “fructose and mannose metabolism”, “alpha-linolenic acid metabolism”, and “sphingolipid metabolism”, indicating their specific functions in epicarp ripening processes. Finally, a comparison of the functional annotations between all- and set-specific-DETs of a group set “S3 vs. S4” (Figure 6F,G) revealed that “cutin, suberin, and wax biosynthesis” and “glycerophospholipid metabolism” were specifically enriched in “S3 vs. S4”.

4. Discussion

The advent of high-throughput SGS, coupled with rapid advances in computational algorithms and tools, has enabled genome-wide dissection of transcriptome landscapes of different species [40]. However, due to the short read length, SGS data are often unable to accurately assemble multiple isoforms from the same gene locus. In the human genome, 92–94% of genes undergo alternative splicing, and these different isoforms of the same locus are usually expressed simultaneously [41,42]. In Arabidopsis, 62.2–66.4% of multiexonic genes are alternatively spliced across tissue and developmental samples or under abiotic stresses [43]. Under such a background, TGS platforms, including PacBio SMRT technology-based Iso-Seq and ONT-based sequencing, are expected to be used for accurate isoform discovery due to long read lengths, up to 10 kb or longer, which eliminates the step of transcript assembly [15,16]. An application of TGS to the discovery of AS events in rice showed that 37.9% of AS events identified by the combined use of PacBio Iso-Seq and Illumina RNA-Seq technologies were not observed in assembled transcripts from RNA-Seq reads alone [44]. Similarly, 87,150 full-length transcripts of the Populus stem transcriptome were discovered, with 2.4% novel isoforms and 71.2% novel alternatively spliced isoforms [45]. These results indicated that TGS technologies are powerful tools for exploring new transcript isoforms and characteristics. Indeed, our joint Iso-Seq and RNA-Seq analysis in peach obtained 40,477 nonredundant high-quality consensus transcripts covering 15,338 gene loci, nearly half of which were novel isoforms, including 574 gene transcripts and 19,255 new alternatively spliced isoforms, compared to the v2.1 peach genome annotation. However, the average number of isoforms per gene (2.6) in this study is much smaller than the average number (4.4) for the Arabidopsis thaliana Reference Transcript Dataset 3 (AtRTD3), of which most transcripts result from PacBio Iso-Seq [46]. The main reason for this is that the AtRTD3 database records isoform information for all seedlings, not only in different development stages but also under different biotic or abiotic stresses [37]. Therefore, to further improve the integrity of the peach transcript database, more isoform information from broad tissues or organs in different development stages and under different stresses needs to be obtained in the future.
Alternative splicing (AS) is an important way to generate notable regulatory and proteomic complexity in metazoans [47]. ES and IR are the most prevalent forms of AS in animal and eukaryotic groups, including plants [48]. More than half of the AS events in Arabidopsis and rice belong to IR, and the proportions are approximately 56% and 53.5%, respectively [49]. Similarly, 62.5% of the AS events in peach belonged to IR, and the ES-type AS only accounted for 8.25% (Figure 3A,B). It is generally assumed that IR participates in regulating gene expression by nonsense-mediated decay (NMD), and nearly half of the IR events in Arabidopsis and rice are related to NMD [50,51]. We checked the 9643 IR events identified in this study and found that only 3280 (34.0%) of them maintained the constitutive reading frame, which indicated that most of the peach IR had the potential to be involved in NMD.
APA sites play important roles in diverse cellular processes, including mRNA stability and translation, mRNA nuclear export, protein diversification, and gene regulation [52]. In this study, 8598 genes were detected with poly(A) sites, and most of them contained two or more poly(A) sites (Figure 4A), which was in line with recent reports regarding Arabidopsis [53], sorghum [39], and potato [54]. However, in some other reports, such as those pertaining to Populus alba [38] and wild apple [55], most genes contained only one poly(A) site, indicating the species or tissue specificity of APA. Moreover, it has been widely accepted that conserved motifs or near-upstream elements (NUEs) located upstream of the cleavage site (CS) play critical roles in mRNA polyadenylation [56]. In this study, we identified two conserved NUEs, (A/U)AUA(A/U/C)A and UGUA (Figure 4C,D), which are similar to those found in previous reports in Arabidopsis and Populus alba [38,39]. These two NUEs work independently in plants, and the UGUA motif was found to recruit N6-methyladenosine (m6A) modifications of mRNAs [56]. The canonical AAUAAA and AAUGAA NUEs rank high in Arabidopsis and rice [57]; however, the AAUGAA motif seemed to be a minor type of NUE that rarely appeared upstream of the cleavage sites of mRNAs in this study, which indicated that this motif might scarcely function as an mRNA polyadenylation signal in peach. Interestingly, a potential link between the absence of an appended poly(A) tail and a rare polyadenylation signal mutation (AAUAAA→AAUGAA) was reported in a previous study [58]. Therefore, this NUE usage bias may reshape the mRNA landscape and have important effects on gene regulation.
The different isoforms generated from the same gene locus sometimes function in different tissues, organs, or development stages [59]. For example, according to a previous report, two isoforms of the Arabidopsis auxin biosynthesis gene YUCCA4 were generated by AS, and one of them was ubiquitously expressed, but another one showed a flower-specific expression pattern [60]. Similarly, a major facilitator superfamily transporter, AtZIFL1, has two isoforms expressed mainly in the root and the plasma membrane of leaf stomatal guard cells [61]. Indeed, in this study, we found that half of the transcripts showed tissue- or development stage-specific expression patterns, and 21.8% of genes contained at least two transcripts distributed in different clusters (Figure 5D), which suggests that both organ-specific gene expression and post-transcriptional modification may be involved in the formation of organ-specific AS modes [62,63].

5. Conclusions

In this study, we combined PacBio Iso-Seq and Illumina RNA-Seq technologies to decipher the full-length transcriptome of peach. In total, 40,477 nonredundant high-quality consensus transcript sequences were obtained, of which 18,274 isoforms were novel isoforms of known genes, and 546 isoforms were novel gene transcripts. We also discovered 148 fusion transcripts, 15,434 AS events, 508 potential lncRNAs, and 4368 genes with APA events. Moreover, the expression levels of different isoforms identified in this study were estimated, and high tissue- or development stage-specific expression patterns were observed. Our study reveals the complexity of the peach transcriptome and will be helpful for improved annotation of the peach genome.

Supplementary Materials

The following supporting information can be downloaded at: https://www.mdpi.com/article/10.3390/horticulturae9020175/s1, Figure S1: The APA signals of mRNAs; Table S1: Classification of isoforms by Cuffcompare software; Table S2: A list of peach fusion transcripts identified by Iso-Seq; Table S3: List of candidate TF transcripts; Table S4: Overview of Illumina RNA-Seq libraries; Table S5: List of genes containing different transcripts distributed in both juvenile fruits (cluster 10) and ripening fruits (cluster 2); Table S6: Sequences of primers used for RT-qPCR.

Author Contributions

Conceptualization, H.Z. and J.Z.; methodology, H.Z.; software, H.Z.; validation, Y.S., K.Q., P.S. and Q.X.; formal analysis, H.P.; investigation, H.Z. and Y.S.; resources, H.P. and J.Z.; data curation, H.Z.; writing—original draft preparation, H.Z.; writing—review and editing, J.Z.; visualization, H.Z.; supervision, J.Z.; project administration, H.P. and J.Z.; funding acquisition, J.G., F.R., H.Z. and J.Z. All authors have read and agreed to the published version of the manuscript.

Funding

This research was funded by the Key Technologies Research and Development Program, grant number “2019YFD100078”, Natural Science Foundation of Anhui Province, grant number “2108085MC106” and the Agriculture Research System of Anhui Province, grant number “AHNYCYTX-10”.

Data Availability Statement

The sequence data involved in this study have been deposited in the NCBI SRA database (https://www.ncbi.nlm.nih.gov/sra/, accessed on 1 December 2022) with the Bio-Project accession number: PRJNA904411.

Conflicts of Interest

The authors declare no conflict of interest.

References

  1. Khan, M.; Rahim, T.; Naeem, M.; Shah, M.; Bakhtiar, Y.; Tahir, M. Post harvest economic losses in peach produce in district Swat. Sarhad J. Agric. 2008, 24, 705–711. [Google Scholar]
  2. Luo, C.-X.; Schnabel, G.; Hu, M.; De Cal, A. Global distribution and management of peach diseases. Phytopathol. Res. 2022, 4, 30. [Google Scholar] [CrossRef]
  3. Minas, I.S.; Tanou, G.; Molassiotis, A. Environmental and orchard bases of peach fruit quality. Sci. Hortic.-Amst. 2018, 235, 307–322. [Google Scholar] [CrossRef]
  4. Arumuganathan, K.; Earle, E. Nuclear DNA content of some important plant species. Plant Mol. Biol. Rep. 1991, 9, 208–218. [Google Scholar] [CrossRef]
  5. Verde, I.; Abbott, A.G.; Scalabrin, S.; Jung, S.; Shu, S.; Marroni, F.; Zhebentyayeva, T.; Dettori, M.T.; Grimwood, J.; Cattonaro, F.; et al. The high-quality draft genome of peach (Prunus persica) identifies unique patterns of genetic diversity, domestication and genome evolution. Nat. Genet. 2013, 45, 487–494. [Google Scholar] [CrossRef] [PubMed] [Green Version]
  6. Verde, I.; Jenkins, J.; Dondini, L.; Micali, S.; Pagliarani, G.; Vendramin, E.; Paris, R.; Aramini, V.; Gazza, L.; Rossini, L.; et al. The Peach v2.0 release: High-resolution linkage mapping and deep resequencing improve chromosome-scale assembly and contiguity. BMC Genom. 2017, 18, 225. [Google Scholar] [CrossRef] [PubMed] [Green Version]
  7. Cheng, C.Y.; Krishnakumar, V.; Chan, A.P.; Thibaud-Nissen, F.; Schobel, S.; Town, C.D. Araport11: A complete reannotation of the Arabidopsis thaliana reference genome. Plant J. 2017, 89, 789–804. [Google Scholar] [CrossRef] [Green Version]
  8. Cui, J.; Shen, N.; Lu, Z.; Xu, G.; Wang, Y.; Jin, B. Analysis and comprehensive comparison of PacBio and nanopore-based RNA sequencing of the Arabidopsis transcriptome. Plant Methods 2020, 16, 85. [Google Scholar] [CrossRef]
  9. Parker, M.T.; Knop, K.; Sherwood, A.V.; Schurch, N.J.; Mackinnon, K.; Gould, P.D.; Hall, A.J.; Barton, G.J.; Simpson, G.G. Nanopore direct RNA sequencing maps the complexity of Arabidopsis mRNA processing and m(6)A modification. Elife 2020, 9, e49658. [Google Scholar] [CrossRef]
  10. Yu, Y.; Guan, J.; Xu, Y.; Ren, F.; Zhang, Z.; Yan, J.; Fu, J.; Guo, J.; Shen, Z.; Zhao, J.; et al. Population-scale peach genome analyses unravel selection patterns and biochemical basis underlying fruit flavor. Nat. Commun. 2021, 12, 3604. [Google Scholar] [CrossRef]
  11. Cao, K.; Yang, X.; Li, Y.; Zhu, G.; Fang, W.; Chen, C.; Wang, X.; Wu, J.; Wang, L. New high-quality peach (Prunus persica L. Batsch) genome assembly to analyze the molecular evolutionary mechanism of volatile compounds in peach fruits. Plant J. 2021, 108, 281–295. [Google Scholar] [CrossRef] [PubMed]
  12. Martin, J.A.; Wang, Z. Next-generation transcriptome assembly. Nat. Rev. Genet. 2011, 12, 671–682. [Google Scholar] [CrossRef] [PubMed]
  13. Morozova, O.; Hirst, M.; Marra, M.A. Applications of new sequencing technologies for transcriptome analysis. Annu. Rev. Genom. Hum. Genet. 2009, 10, 135–151. [Google Scholar] [CrossRef] [PubMed] [Green Version]
  14. Byrne, A.; Cole, C.; Volden, R.; Vollmers, C. Realizing the potential of full-length transcriptome sequencing. Philos. Trans. R. Soc. Lond. B Biol. Sci. 2019, 374, 20190097. [Google Scholar] [CrossRef] [Green Version]
  15. Rhoads, A.; Au, K.F. PacBio sequencing and its applications. Genom. Proteom. Bioinf. 2015, 13, 278–289. [Google Scholar] [CrossRef] [PubMed] [Green Version]
  16. Bayega, A.; Wang, Y.C.; Oikonomopoulos, S.; Djambazian, H.; Fahiminiya, S.; Ragoussis, J. Transcript profiling using long-read sequencing technologies. Methods Mol. Biol. 2018, 1783, 121–147. [Google Scholar]
  17. McCarthy, A. Third generation DNA sequencing: Pacific biosciences’ single molecule real time technology. Chem. Biol. 2010, 17, 675–676. [Google Scholar] [CrossRef] [Green Version]
  18. He, W.; Zhang, X.; Lv, P.; Wang, W.; Wang, J.; He, Y.; Song, Z.; Cai, D. Full-length transcriptome reconstruction reveals genetic differences in hybrids of Oryza sativa and Oryza punctata with different ploidy and genome compositions. BMC Plant Biol. 2022, 22, 131. [Google Scholar] [CrossRef]
  19. Wang, B.; Tseng, E.; Regulski, M.; Clark, T.A.; Hon, T.; Jiao, Y.; Lu, Z.; Olson, A.; Stein, J.C.; Ware, D. Unveiling the complexity of the maize transcriptome by single-molecule long-read sequencing. Nat. Commun. 2016, 7, 11708. [Google Scholar] [CrossRef] [Green Version]
  20. Feng, S.; Xu, M.; Liu, F.; Cui, C.; Zhou, B. Reconstruction of the full-length transcriptome atlas using PacBio Iso-Seq provides insight into the alternative splicing in Gossypium australe. BMC Plant Biol. 2019, 19, 365. [Google Scholar] [CrossRef] [Green Version]
  21. Hackl, T.; Hedrich, R.; Schultz, J.; Forster, F. proovread: Large-scale high-accuracy PacBio correction through iterative short read consensus. Bioinformatics 2014, 30, 3004–3011. [Google Scholar] [CrossRef] [PubMed] [Green Version]
  22. Foissac, S.; Sammeth, M. ASTALAVISTA: Dynamic and flexible analysis of alternative splicing events in custom gene datasets. Nucleic Acids Res. 2007, 35 (Suppl. S2), W297–W299. [Google Scholar] [CrossRef] [PubMed]
  23. Kong, L.; Zhang, Y.; Ye, Z.Q.; Liu, X.Q.; Zhao, S.Q.; Wei, L.; Gao, G. CPC: Assess the protein-coding potential of transcripts using sequence features and support vector machine. Nucleic Acids Res. 2007, 35 (Suppl. S2), W345–W349. [Google Scholar] [CrossRef]
  24. Sun, L.; Luo, H.; Bu, D.; Zhao, G.; Yu, K.; Zhang, C.; Liu, Y.; Chen, R.; Zhao, Y. Utilizing sequence intrinsic composition to classify protein-coding and long non-coding transcripts. Nucleic Acids Res. 2013, 41, e166. [Google Scholar] [CrossRef] [PubMed]
  25. Wang, L.; Park, H.J.; Dasari, S.; Wang, S.; Kocher, J.-P.; Li, W. CPAT: Coding-Potential Assessment Tool using an alignment-free logistic regression model. Nucleic Acids Res. 2013, 41, e74. [Google Scholar] [CrossRef]
  26. Finn, R.D.; Bateman, A.; Clements, J.; Coggill, P.; Eberhardt, R.Y.; Eddy, S.R.; Heger, A.; Hetherington, K.; Holm, L.; Mistry, J. Pfam: The protein families database. Nucleic Acids Res. 2014, 42, D222–D230. [Google Scholar] [CrossRef] [PubMed] [Green Version]
  27. Trapnell, C.; Williams, B.A.; Pertea, G.; Mortazavi, A.; Kwan, G.; Van Baren, M.J.; Salzberg, S.L.; Wold, B.J.; Pachter, L. Transcript assembly and quantification by RNA-Seq reveals unannotated transcripts and isoform switching during cell differentiation. Nat. Biotechnol. 2010, 28, 511–515. [Google Scholar] [CrossRef] [Green Version]
  28. Chen, S.; Zhou, Y.; Chen, Y.; Gu, J. fastp: An ultra-fast all-in-one FASTQ preprocessor. Bioinformatics 2018, 34, i884–i890. [Google Scholar] [CrossRef]
  29. Kim, D.; Langmead, B.; Salzberg, S.L. HISAT: A fast spliced aligner with low memory requirements. Nat. Methods 2015, 12, 357. [Google Scholar] [CrossRef] [Green Version]
  30. Liao, Y.; Smyth, G.K.; Shi, W. featureCounts: An efficient general purpose program for assigning sequence reads to genomic features. Bioinformatics 2013, 30, 923–930. [Google Scholar] [CrossRef] [Green Version]
  31. Lex, A.; Gehlenborg, N.; Strobelt, H.; Vuillemot, R.; Pfister, H. UpSet: Visualization of intersecting sets. IEEE Trans. Vis. Comput. Graph. 2014, 20, 1983–1992. [Google Scholar] [CrossRef] [PubMed]
  32. Cantalapiedra, C.P.; Hernandez-Plaza, A.; Letunic, I.; Bork, P.; Huerta-Cepas, J. eggNOG-mapper v2: Functional annotation, orthology assignments, and domain prediction at the metagenomic scale. Mol. Biol. Evol. 2021, 38, 5825–5829. [Google Scholar] [CrossRef] [PubMed]
  33. Wu, T.; Hu, E.; Xu, S.; Chen, M.; Guo, P.; Dai, Z.; Feng, T.; Zhou, L.; Tang, W.; Zhan, L.; et al. clusterProfiler 4.0: A universal enrichment tool for interpreting omics data. Innovation 2021, 2, 100141. [Google Scholar] [CrossRef] [PubMed]
  34. Singh, A.; Zahra, S.; Das, D.; Kumar, S. AtFusionDB: A database of fusion transcripts in Arabidopsis thaliana. Database 2019, 2019, bay135. [Google Scholar] [CrossRef] [Green Version]
  35. Wang, H.; Chung, P.J.; Liu, J.; Jang, I.C.; Kean, M.J.; Xu, J.; Chua, N.H. Genome-wide identification of long noncoding natural antisense transcripts and their responses to light in Arabidopsis. Genome Res. 2014, 24, 444–453. [Google Scholar] [CrossRef] [Green Version]
  36. Sun, X.; Zheng, H.; Sui, N. Regulation mechanism of long non-coding RNA in plant response to stress. Biochem. Biophys. Res. Commun. 2018, 503, 402–407. [Google Scholar] [CrossRef]
  37. Zhou, H.; Ren, F.; Wang, X.; Qiu, K.; Sheng, Y.; Xie, Q.; Shi, P.; Zhang, J.; Pan, H. Genome-wide identification and characterization of long noncoding RNAs during peach (Prunus persica) fruit development and ripening. Sci. Rep. 2022, 12, 11044. [Google Scholar] [CrossRef]
  38. Hu, H.; Yang, W.; Zheng, Z.; Niu, Z.; Yang, Y.; Wan, D.; Liu, J.; Ma, T. Analysis of alternative splicing and alternative polyadenylation in Populus alba var. pyramidalis by single-molecular long-read sequencing. Front Genet. 2020, 11, 48. [Google Scholar] [CrossRef] [Green Version]
  39. Abdel-Ghany, S.E.; Hamilton, M.; Jacobi, J.L.; Ngam, P.; Devitt, N.; Schilkey, F.; Ben-Hur, A.; Reddy, A.S. A survey of the sorghum transcriptome using single-molecule long reads. Nat. Commun. 2016, 7, 11706. [Google Scholar] [CrossRef] [Green Version]
  40. Ward, R.M.; Schmieder, R.; Highnam, G.; Mittelman, D. Big data challenges and opportunities in high-throughput sequencing. Syst. Biomed. 2013, 1, 29–34. [Google Scholar] [CrossRef] [Green Version]
  41. Djebali, S.; Davis, C.A.; Merkel, A.; Dobin, A.; Lassmann, T.; Mortazavi, A.; Tanzer, A.; Lagarde, J.; Lin, W.; Schlesinger, F.; et al. Landscape of transcription in human cells. Nature 2012, 489, 101–108. [Google Scholar] [CrossRef] [PubMed] [Green Version]
  42. Wang, E.T.; Sandberg, R.; Luo, S.; Khrebtukova, I.; Zhang, L.; Mayr, C.; Kingsmore, S.F.; Schroth, G.P.; Burge, C.B. Alternative isoform regulation in human tissue transcriptomes. Nature 2008, 456, 470–476. [Google Scholar] [CrossRef]
  43. Martin, G.; Marquez, Y.; Mantica, F.; Duque, P.; Irimia, M. Alternative splicing landscapes in Arabidopsis thaliana across tissues and stress conditions highlight major functional differences with animals. Genome Biol. 2021, 22, 35. [Google Scholar] [CrossRef]
  44. Zhang, G.; Sun, M.; Wang, J.; Lei, M.; Li, C.; Zhao, D.; Huang, J.; Li, W.; Li, S.; Li, J.; et al. PacBio full-length cDNA sequencing integrated with RNA-seq reads drastically improves the discovery of splicing transcripts in rice. Plant J. 2019, 97, 296–305. [Google Scholar] [CrossRef] [Green Version]
  45. Chao, Q.; Gao, Z.-F.; Zhang, D.; Zhao, B.-G.; Dong, F.-Q.; Fu, C.-X.; Liu, L.-J.; Wang, B.-C. The developmental dynamics of the Populus stem transcriptome. Plant Biotechnol. J. 2019, 17, 206–219. [Google Scholar] [CrossRef] [Green Version]
  46. Zhang, R.; Kuo, R.; Coulter, M.; Calixto, C.P.G.; Entizne, J.C.; Guo, W.; Marquez, Y.; Milne, L.; Riegler, S.; Matsui, A.; et al. A high-resolution single-molecule sequencing-based Arabidopsis transcriptome using novel methods of Iso-seq analysis. Genome Biol. 2022, 23, 149. [Google Scholar] [CrossRef] [PubMed]
  47. Tapial, J.; Ha, K.C.H.; Sterne-Weiler, T.; Gohr, A.; Braunschweig, U.; Hermoso-Pulido, A.; Quesnel-Vallieres, M.; Permanyer, J.; Sodaei, R.; Marquez, Y.; et al. An atlas of alternative splicing profiles and functional associations reveals new regulatory programs and genes that simultaneously express multiple major isoforms. Genome Res. 2017, 27, 1759–1768. [Google Scholar] [CrossRef] [PubMed] [Green Version]
  48. Grau-Bove, X.; Ruiz-Trillo, I.; Irimia, M. Origin of exon skipping-rich transcriptomes in animals driven by evolution of gene architecture. Genome Biol. 2018, 19, 135. [Google Scholar] [CrossRef]
  49. Wang, B.-B.; Brendel, V. Genomewide comparative analysis of alternative splicing in plants. Proc. Natl. Acad. Sci. USA 2006, 103, 7175–7180. [Google Scholar] [CrossRef] [Green Version]
  50. Zhang, C.; Gschwend, A.R.; Ouyang, Y.; Long, M. Evolution of gene structural complexity: An alternative-splicing-based model accounts for intron-containing retrogenes. Plant Physiol. 2014, 165, 412–423. [Google Scholar] [CrossRef] [Green Version]
  51. Barbazuk, W.B.; Fu, Y.; McGinnis, K.M. Genome-wide analyses of alternative splicing in plants: Opportunities and challenges. Genome Res. 2008, 18, 1381–1392. [Google Scholar] [CrossRef] [Green Version]
  52. Tian, B.; Manley, J.L. Alternative polyadenylation of mRNA precursors. Nat. Rev. Mol. Cell Biol. 2017, 18, 18–30. [Google Scholar] [CrossRef] [PubMed]
  53. Wu, X.; Liu, M.; Downie, B.; Liang, C.; Ji, G.; Li, Q.Q.; Hunt, A.G. Genome-wide landscape of polyadenylation in Arabidopsis provides evidence for extensive alternative polyadenylation. Proc. Natl. Acad. Sci. USA 2011, 108, 12533–12538. [Google Scholar] [CrossRef] [PubMed] [Green Version]
  54. Yan, C.; Zhang, N.; Wang, Q.; Fu, Y.; Zhao, H.; Wang, J.; Wu, G.; Wang, F.; Li, X.; Liao, H. Full-length transcriptome sequencing reveals the molecular mechanism of potato seedlings responding to low-temperature. BMC Plant Biol. 2022, 22, 125. [Google Scholar] [CrossRef] [PubMed]
  55. Liu, X.; Li, X.; Wen, X.; Zhang, Y.; Ding, Y.; Zhang, Y.; Gao, B.; Zhang, D. PacBio full-length transcriptome of wild apple (Malus sieversii) provides insights into canker disease dynamic response. BMC Genom. 2021, 22, 52. [Google Scholar] [CrossRef] [PubMed]
  56. Lin, J.; Li, Q.Q. Coupling epigenetics and RNA polyadenylation: Missing links. Trends Plant Sci. 2023, 28, 223–234. [Google Scholar] [CrossRef] [PubMed]
  57. Wang, P.H.; Kumar, S.; Zeng, J.; McEwan, R.; Wright, T.R.; Gupta, M. Transcription terminator-mediated enhancement in transgene expression in maize: Preponderance of the AUGAAU motif overlapping with poly(A) signals. Front Plant Sci. 2020, 11, 570778. [Google Scholar] [CrossRef]
  58. Bennett, C.L.; Brunkow, M.E.; Ramsdell, F.; O’Briant, K.C.; Zhu, Q.; Fuleihan, R.L.; Shigeoka, A.O.; Ochs, H.D.; Chance, P.F. A rare polyadenylation signal mutation of the FOXP3 gene (AAUAAA→AAUGAA) leads to the IPEX syndrome. Immunogenetics 2001, 53, 435–439. [Google Scholar] [CrossRef]
  59. Staiger, D.; Brown, J.W. Alternative splicing at the intersection of biological timing, development, and stress responses. Plant Cell 2013, 25, 3640–3656. [Google Scholar] [CrossRef] [Green Version]
  60. Kriechbaumer, V.; Wang, P.; Hawes, C.; Abell, B.M. Alternative splicing of the auxin biosynthesis gene YUCCA4 determines its subcellular compartmentation. Plant J. 2012, 70, 292–302. [Google Scholar] [CrossRef]
  61. Remy, E.; Cabrito, T.R.; Baster, P.; Batista, R.A.; Teixeira, M.C.; Friml, J.; Sá-Correia, I.; Duque, P. A major facilitator superfamily transporter plays a dual role in polar auxin transport and drought stress tolerance in Arabidopsis. Plant Cell 2013, 25, 901–926. [Google Scholar] [CrossRef] [PubMed] [Green Version]
  62. Naftaly, A.S.; Pau, S.; White, M.A. Long-read RNA sequencing reveals widespread sex-specific alternative splicing in threespine stickleback fish. Genome Res. 2021, 31, 1486–1497. [Google Scholar] [CrossRef] [PubMed]
  63. Wang, Q.; Ci, D.; Li, T.; Li, P.; Song, Y.; Chen, J.; Quan, M.; Zhou, D.; Zhang, D. The role of DNA methylation in xylogenesis in different tissues of poplar. Front Plant Sci. 2016, 7, 1003. [Google Scholar] [CrossRef] [PubMed]
Figure 1. Circos visualization of Prunus persica genome and SMRT Iso-Seq results. Tracks from outside to inside are Karyotype of the Prunus persica chromosome, gene density of the Prunus persica genome, gene density of SMRT Iso-Seq, transcript density of the Prunus persica chromosome, transcript density of SMRT Iso-Seq, long non-coding RNA distribution, and Fusion transcripts distribution. The red and green lines represent the intra-chromosome and inter-chromosome, respectively. The red and blue columns represent the highest and lowest values of gene or transcript density, respectively. The distribution was calculated in a 1-Mb sliding window at 20-kb intervals.
Horticulturae 09 00175 g001
Figure 2. Prediction of lncRNAs and identification of TFs. (A) Venn diagram of lncRNAs filtered by CPC, CNCI, CPAT, and Pfam databases. (B) Classification of putative lncRNAs based on their relative physical locations with the related genes. (C) Classification of transcription factors.
Horticulturae 09 00175 g002
Figure 3. Overview of alternative splicing (AS) events. (A) Illustration of different types of AS. IR: intron retention, A3′S: alternative 3’ splice site, A5′S: alternative 5’ splice site, ES: exon skipping, ME: mutually exclusive exon. (B) Proportion of different types of AS.
Horticulturae 09 00175 g003
Figure 4. Characteristics of APA events in Prunus persica. (A) Distribution of polyadenylation sites per gene. (B) nucleotide composition around poly (A) cleavage sites. A signal motif identified by MEME suite at about 25 nts (C) and 35 nts (D) upstream of the poly (A) sites in Prunus persica transcripts.
Horticulturae 09 00175 g004
Figure 5. Overall view of transcript expression of each sample. (A) Heatmap analysis of all transcripts. (B) PCA of gene expression levels of each sample. (C) Expression profiles of randomly selected novel and alternative transcripts by RT–qPCR and RNA-Seq. Error bars represent the SE of three biological replicates. R, the Pearson correlation coefficient. *, ** and *** stand for “p < 0.05”, “p < 0.01”, and “p < 0.001” (Student’s t-test), respectively. (D) Mfuzz clusters of genes showing variable expression among samples. The colors reflect “Membership” values calculated by Mfuzz software, where red color corresponds to high membership scores and green or blue colors to low values.
Horticulturae 09 00175 g005
Figure 6. Functional annotations of differentially expressed transcripts (DETs). (A) Upset plot (an alternative Venn diagram) of differentially expressed transcripts. KEGG enrichment of all DETs of groups “YL vs. ML” (B), “JP vs. MP” (D), “S3 vs. S4” (E), and specific DETs of groups “YL vs. ML” (C), “JP vs. MP” (F), “S3 vs. S4” (G).
Horticulturae 09 00175 g006
Table 1. Overview of peach Iso-Seq data.
Peach Iso-Seq Data
cDNA size1–6K
CCS Number250,803
Read Bases of CCS552,197,124
Mean Read Length of CCS2201
Number of FLNC reads223,186 (88.99%)
Number of consensus isoforms72,175
Average consensus isoforms read length2097
Number of polished high-quality isoforms70,436
Disclaimer/Publisher’s Note: The statements, opinions and data contained in all publications are solely those of the individual author(s) and contributor(s) and not of MDPI and/or the editor(s). MDPI and/or the editor(s) disclaim responsibility for any injury to people or property resulting from any ideas, methods, instructions or products referred to in the content.

