
Tomato Leaf Disease Classification via Compact Convolutional Neural Networks with Transfer Learning and Feature Selection


Abstract
:1. Introduction
2. Literature Review
- Employing three compact CNNs with dissimilar structures involving ResNet-18, ShuffleNet, and MobileNet to extract deep features via TL.
- Retrieving deep features out of the final fully connected (FC) layer for each CNN before the softmax layer and obtaining a lower number of deep features from this FC layer compared to earlier layers.
- Blending deep features obtained from the three CNNs to merge benefits of every CNN construction.
- Utilizing a hybrid FS approach for selection among merged deep features diminishes their dimensionality.
- Using three search policies to choose among these combined features results in selecting only the most significant.
3. Materials and Methods
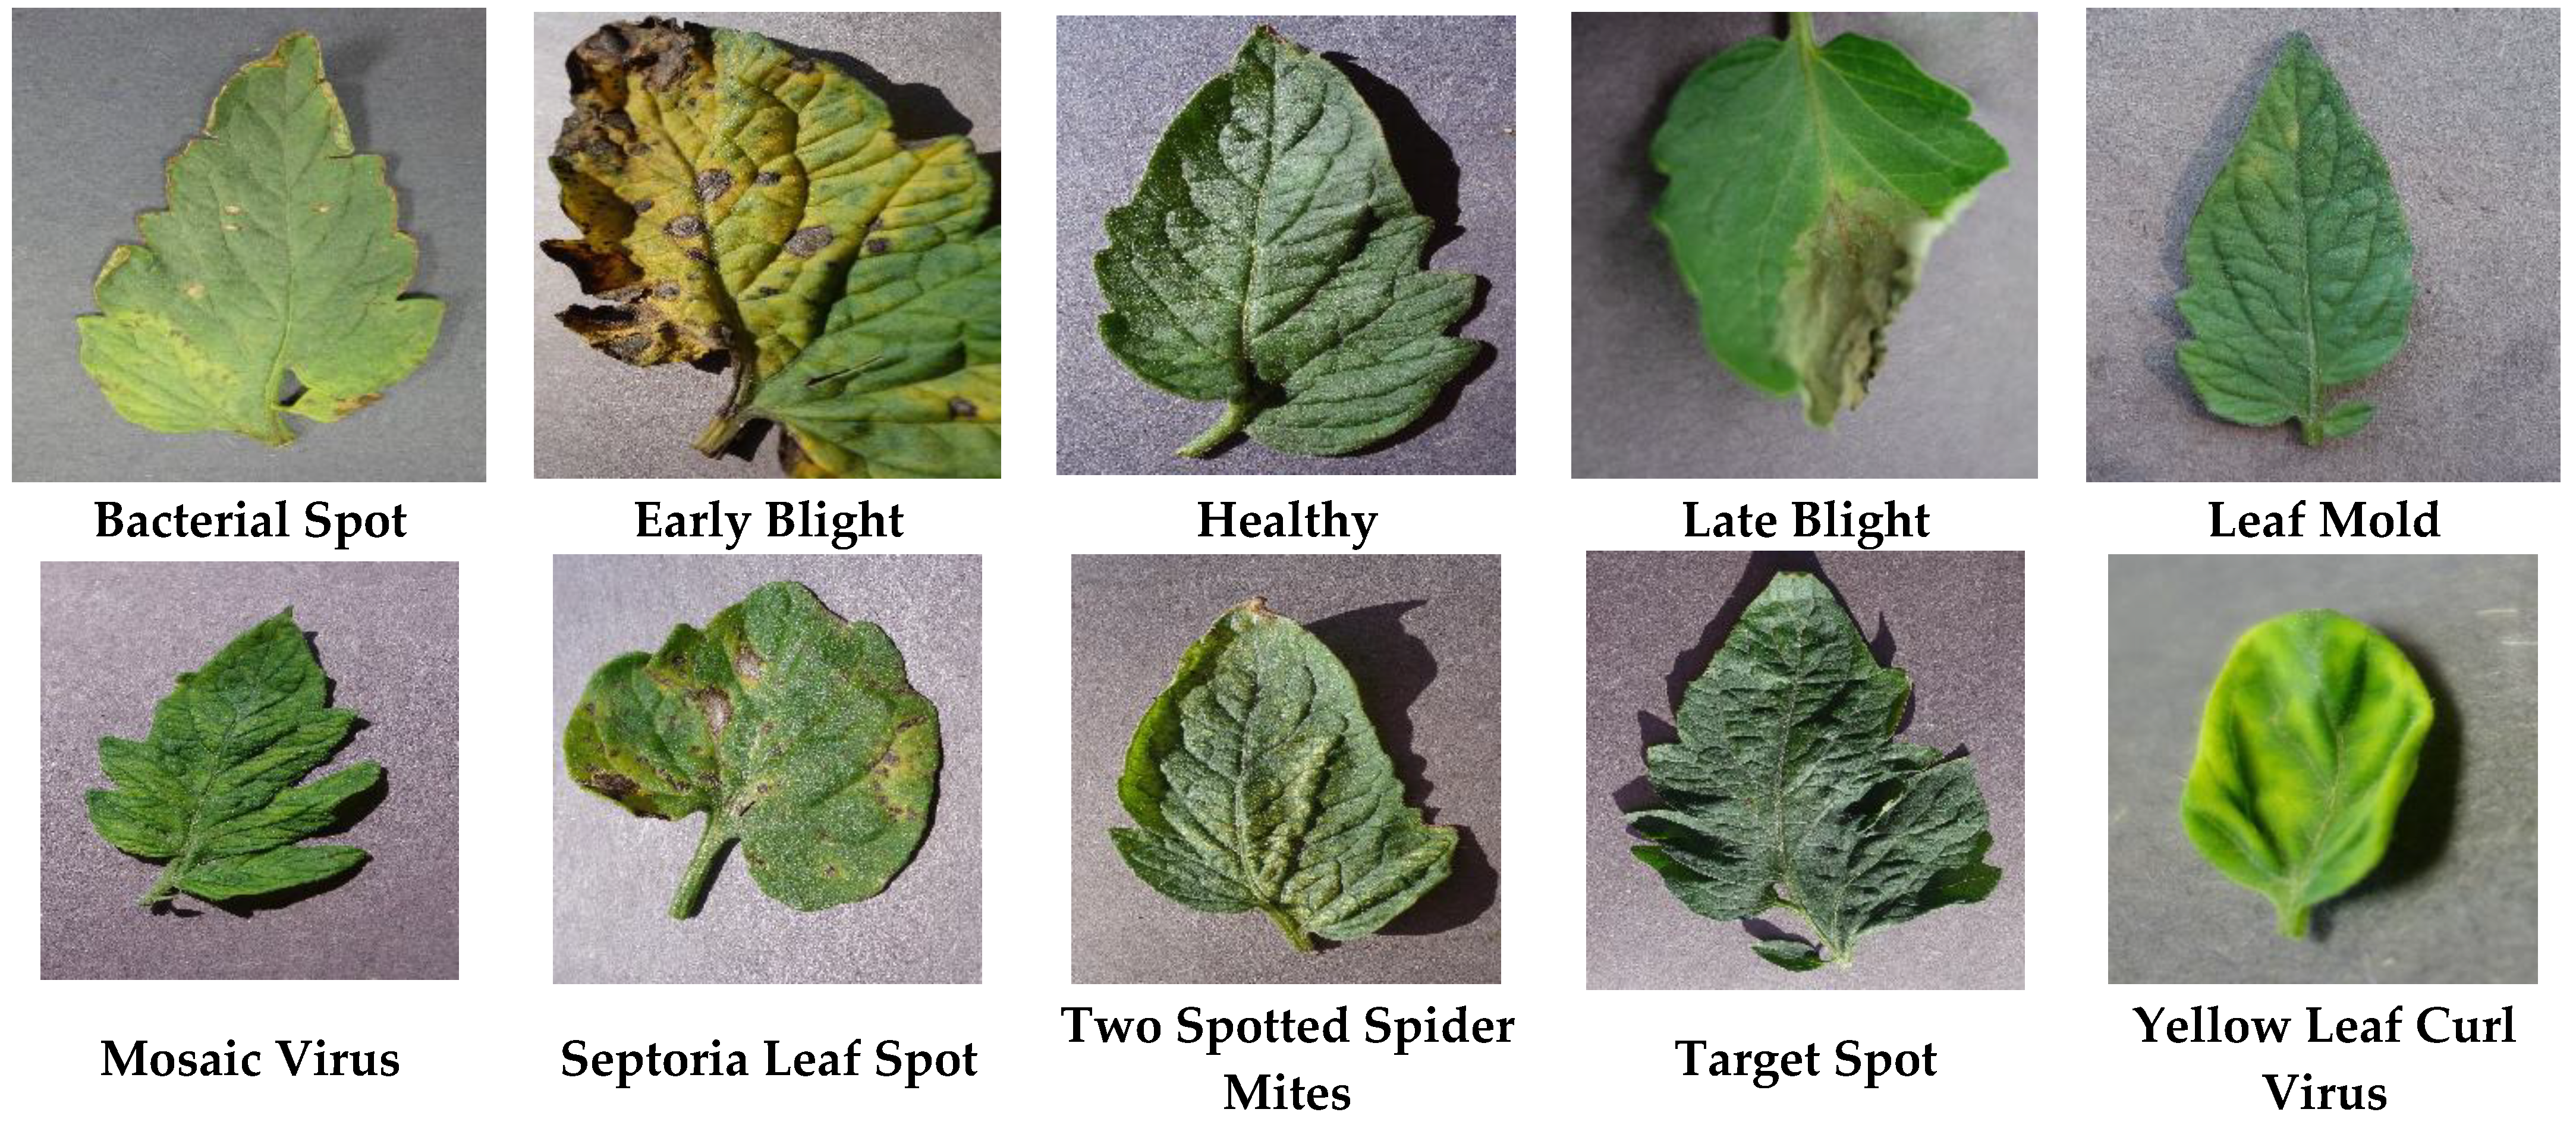
3.1. Tomato Diseases Dataset Acquisition
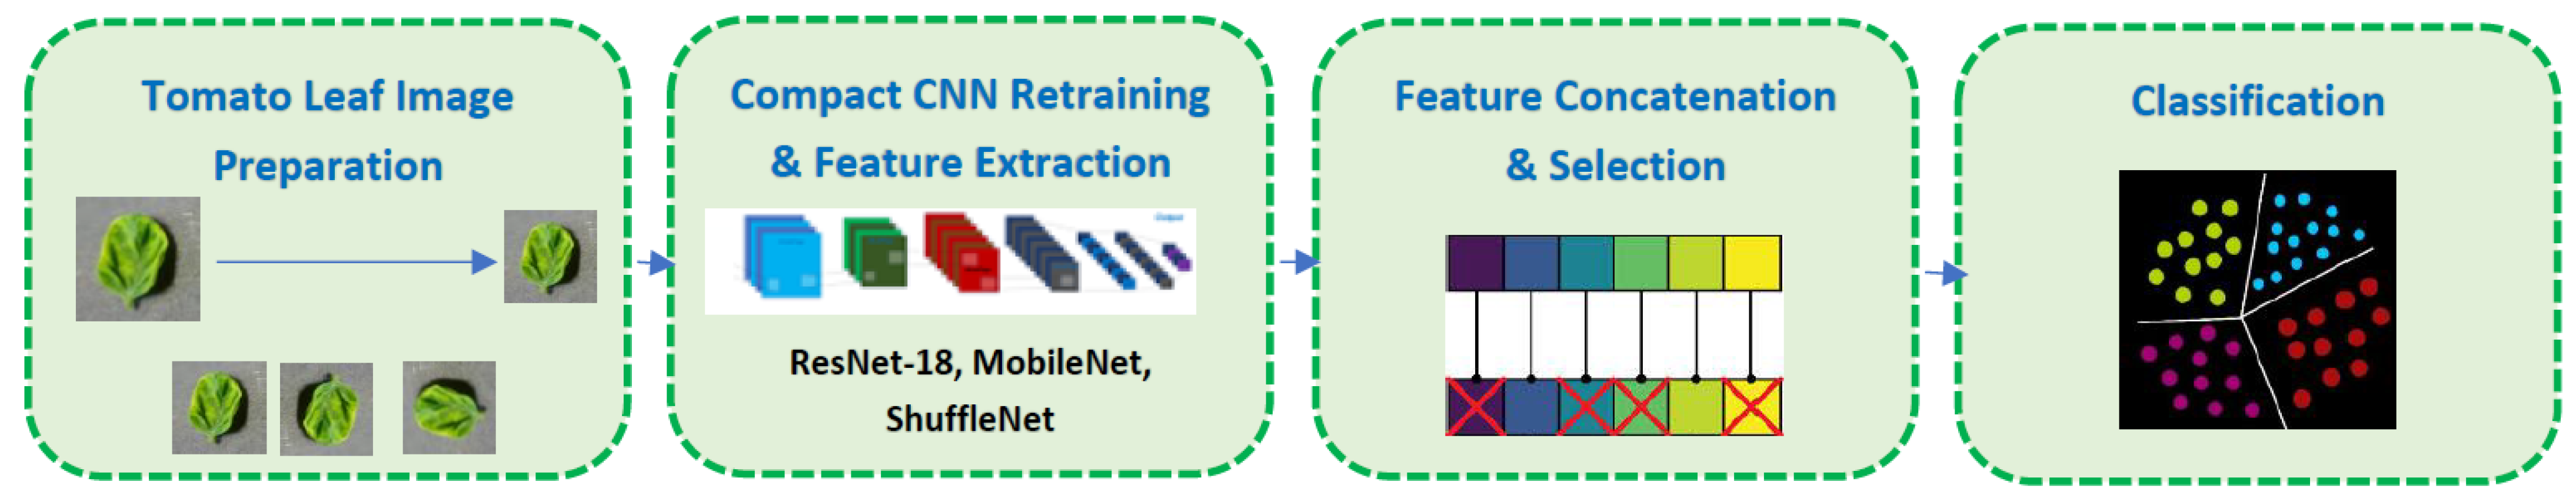
3.2. Proposed Tomato Leaf Disease Classification Pipeline
3.2.1. Tomato Leaf Image Preparation
3.2.2. Compact CNNs Retraining and Feature Extraction with TL
3.2.3. Feature Concatenation and Selection
3.2.4. Classification
4. Pipeline Evaluation and Networks’ Hyperparameters Setting
4.1. Pipeline Results Evaluation
4.2. Networks Hyperparameters Setting
5. Results
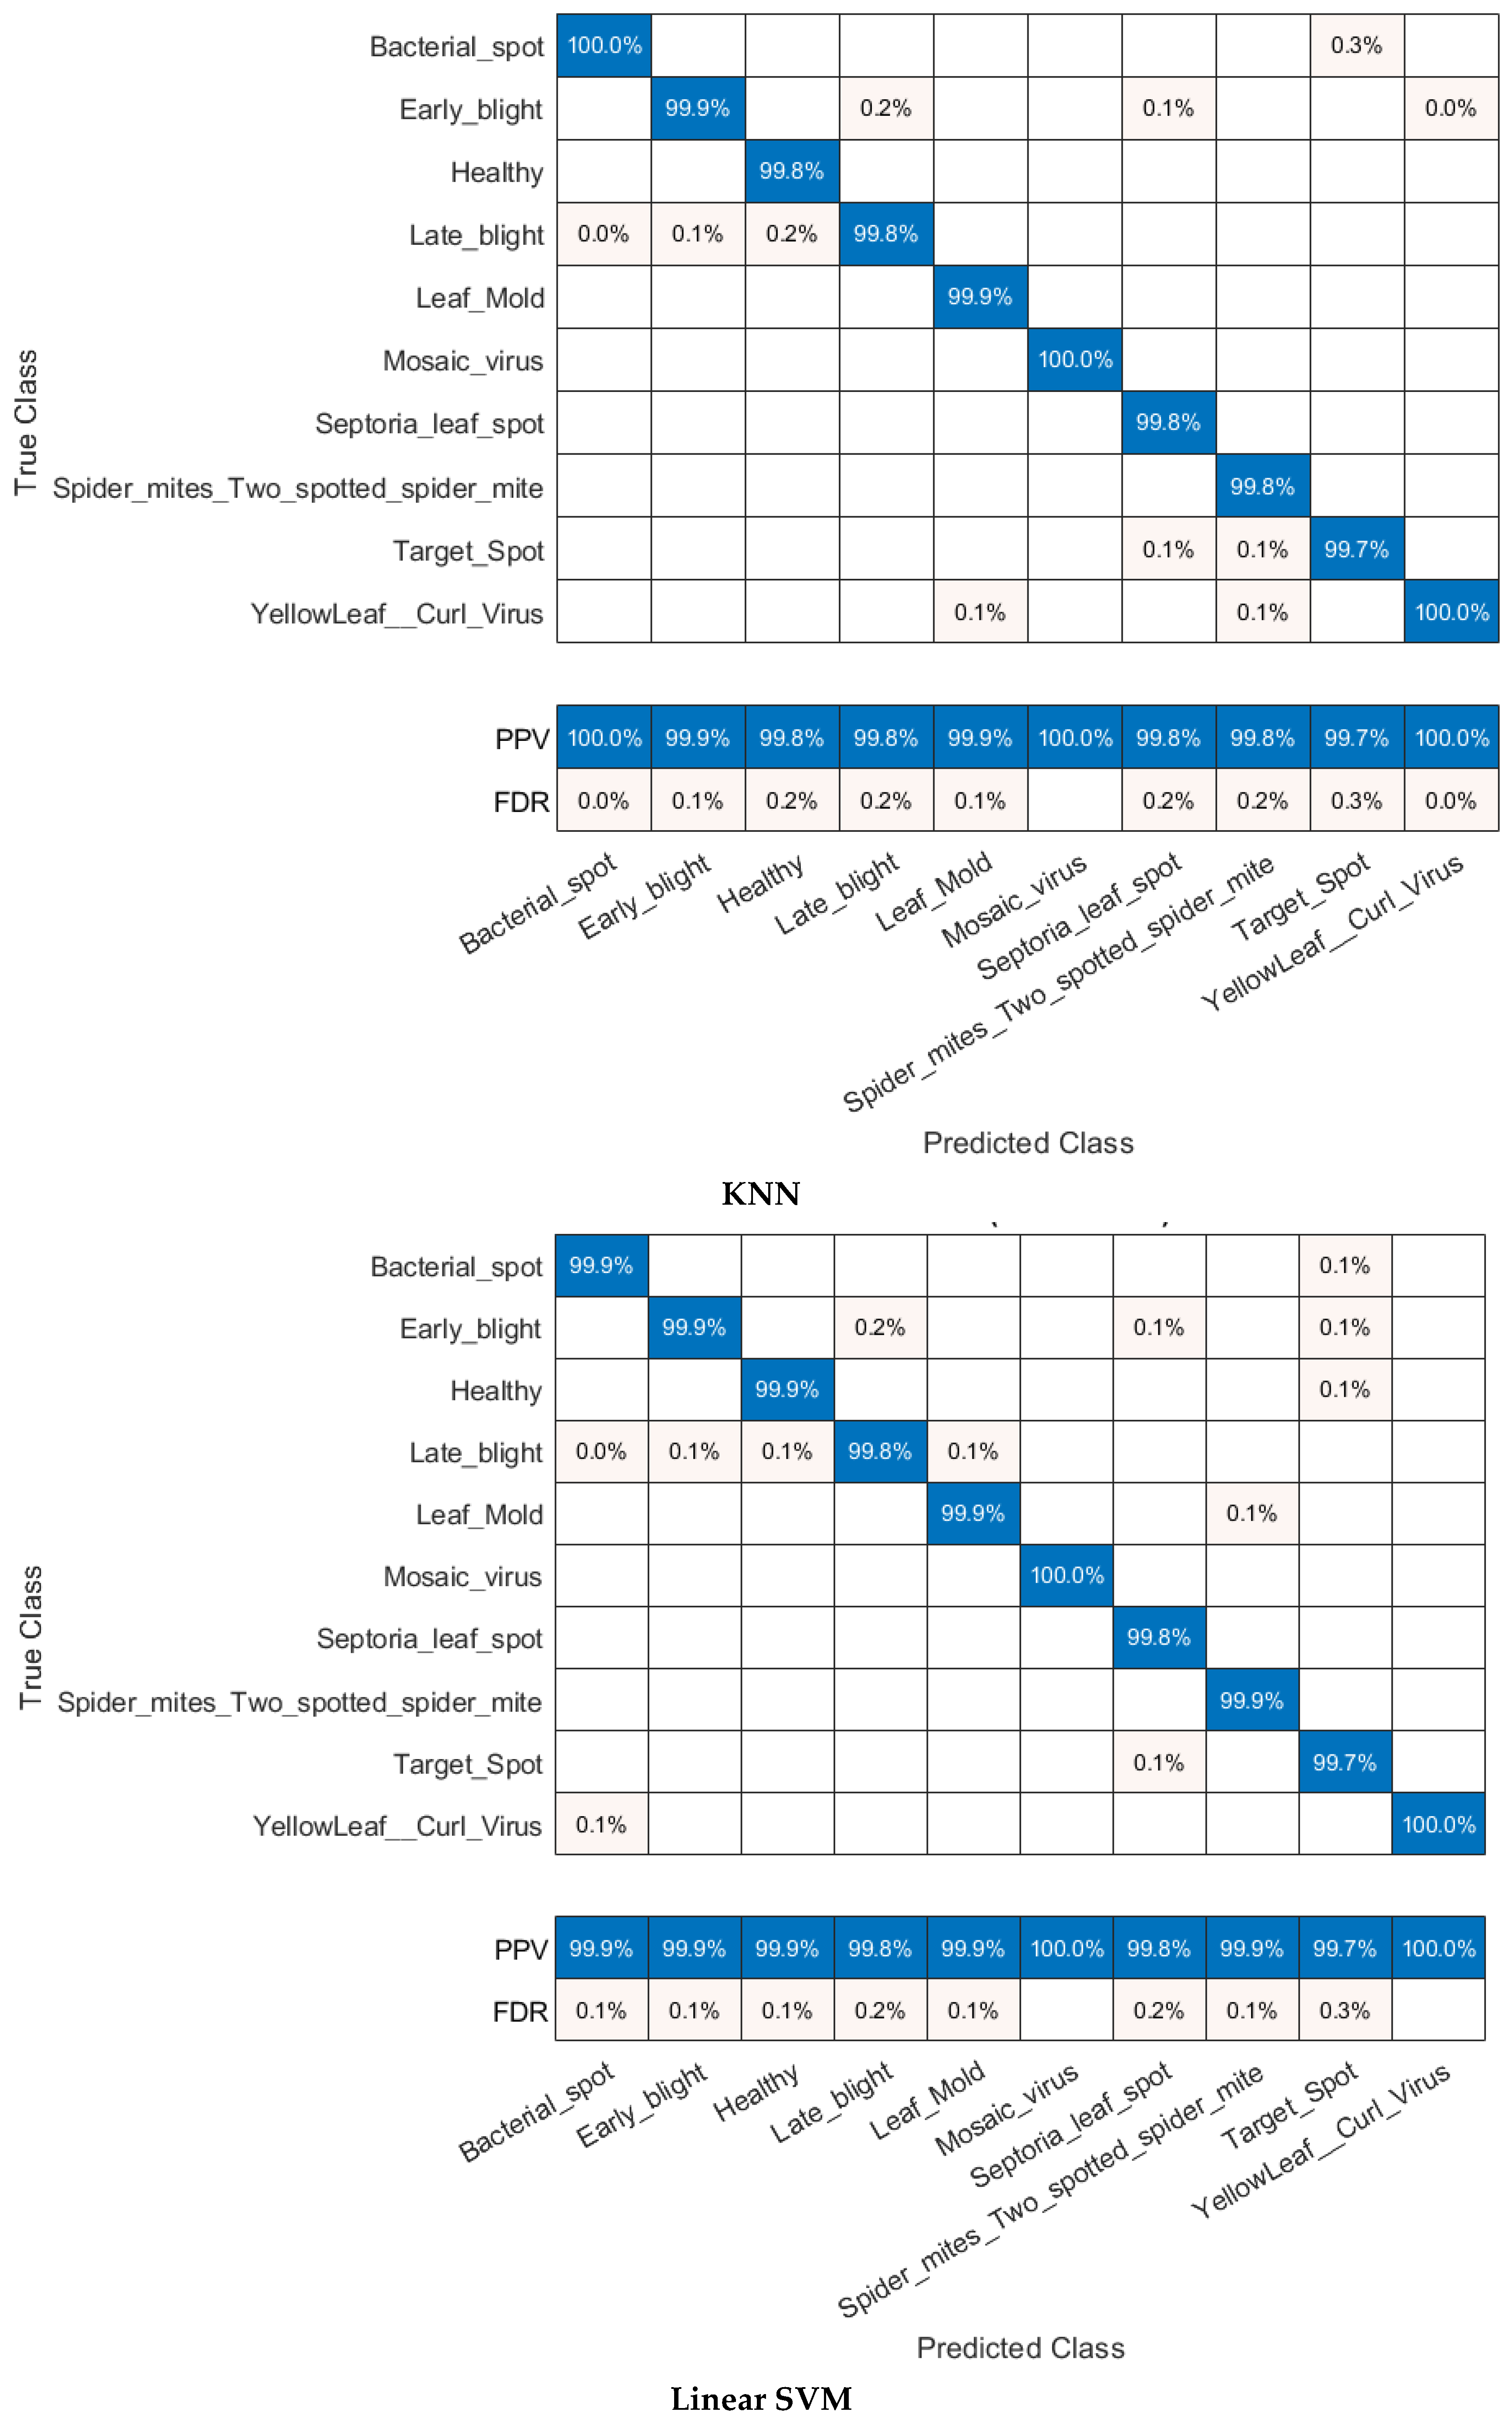
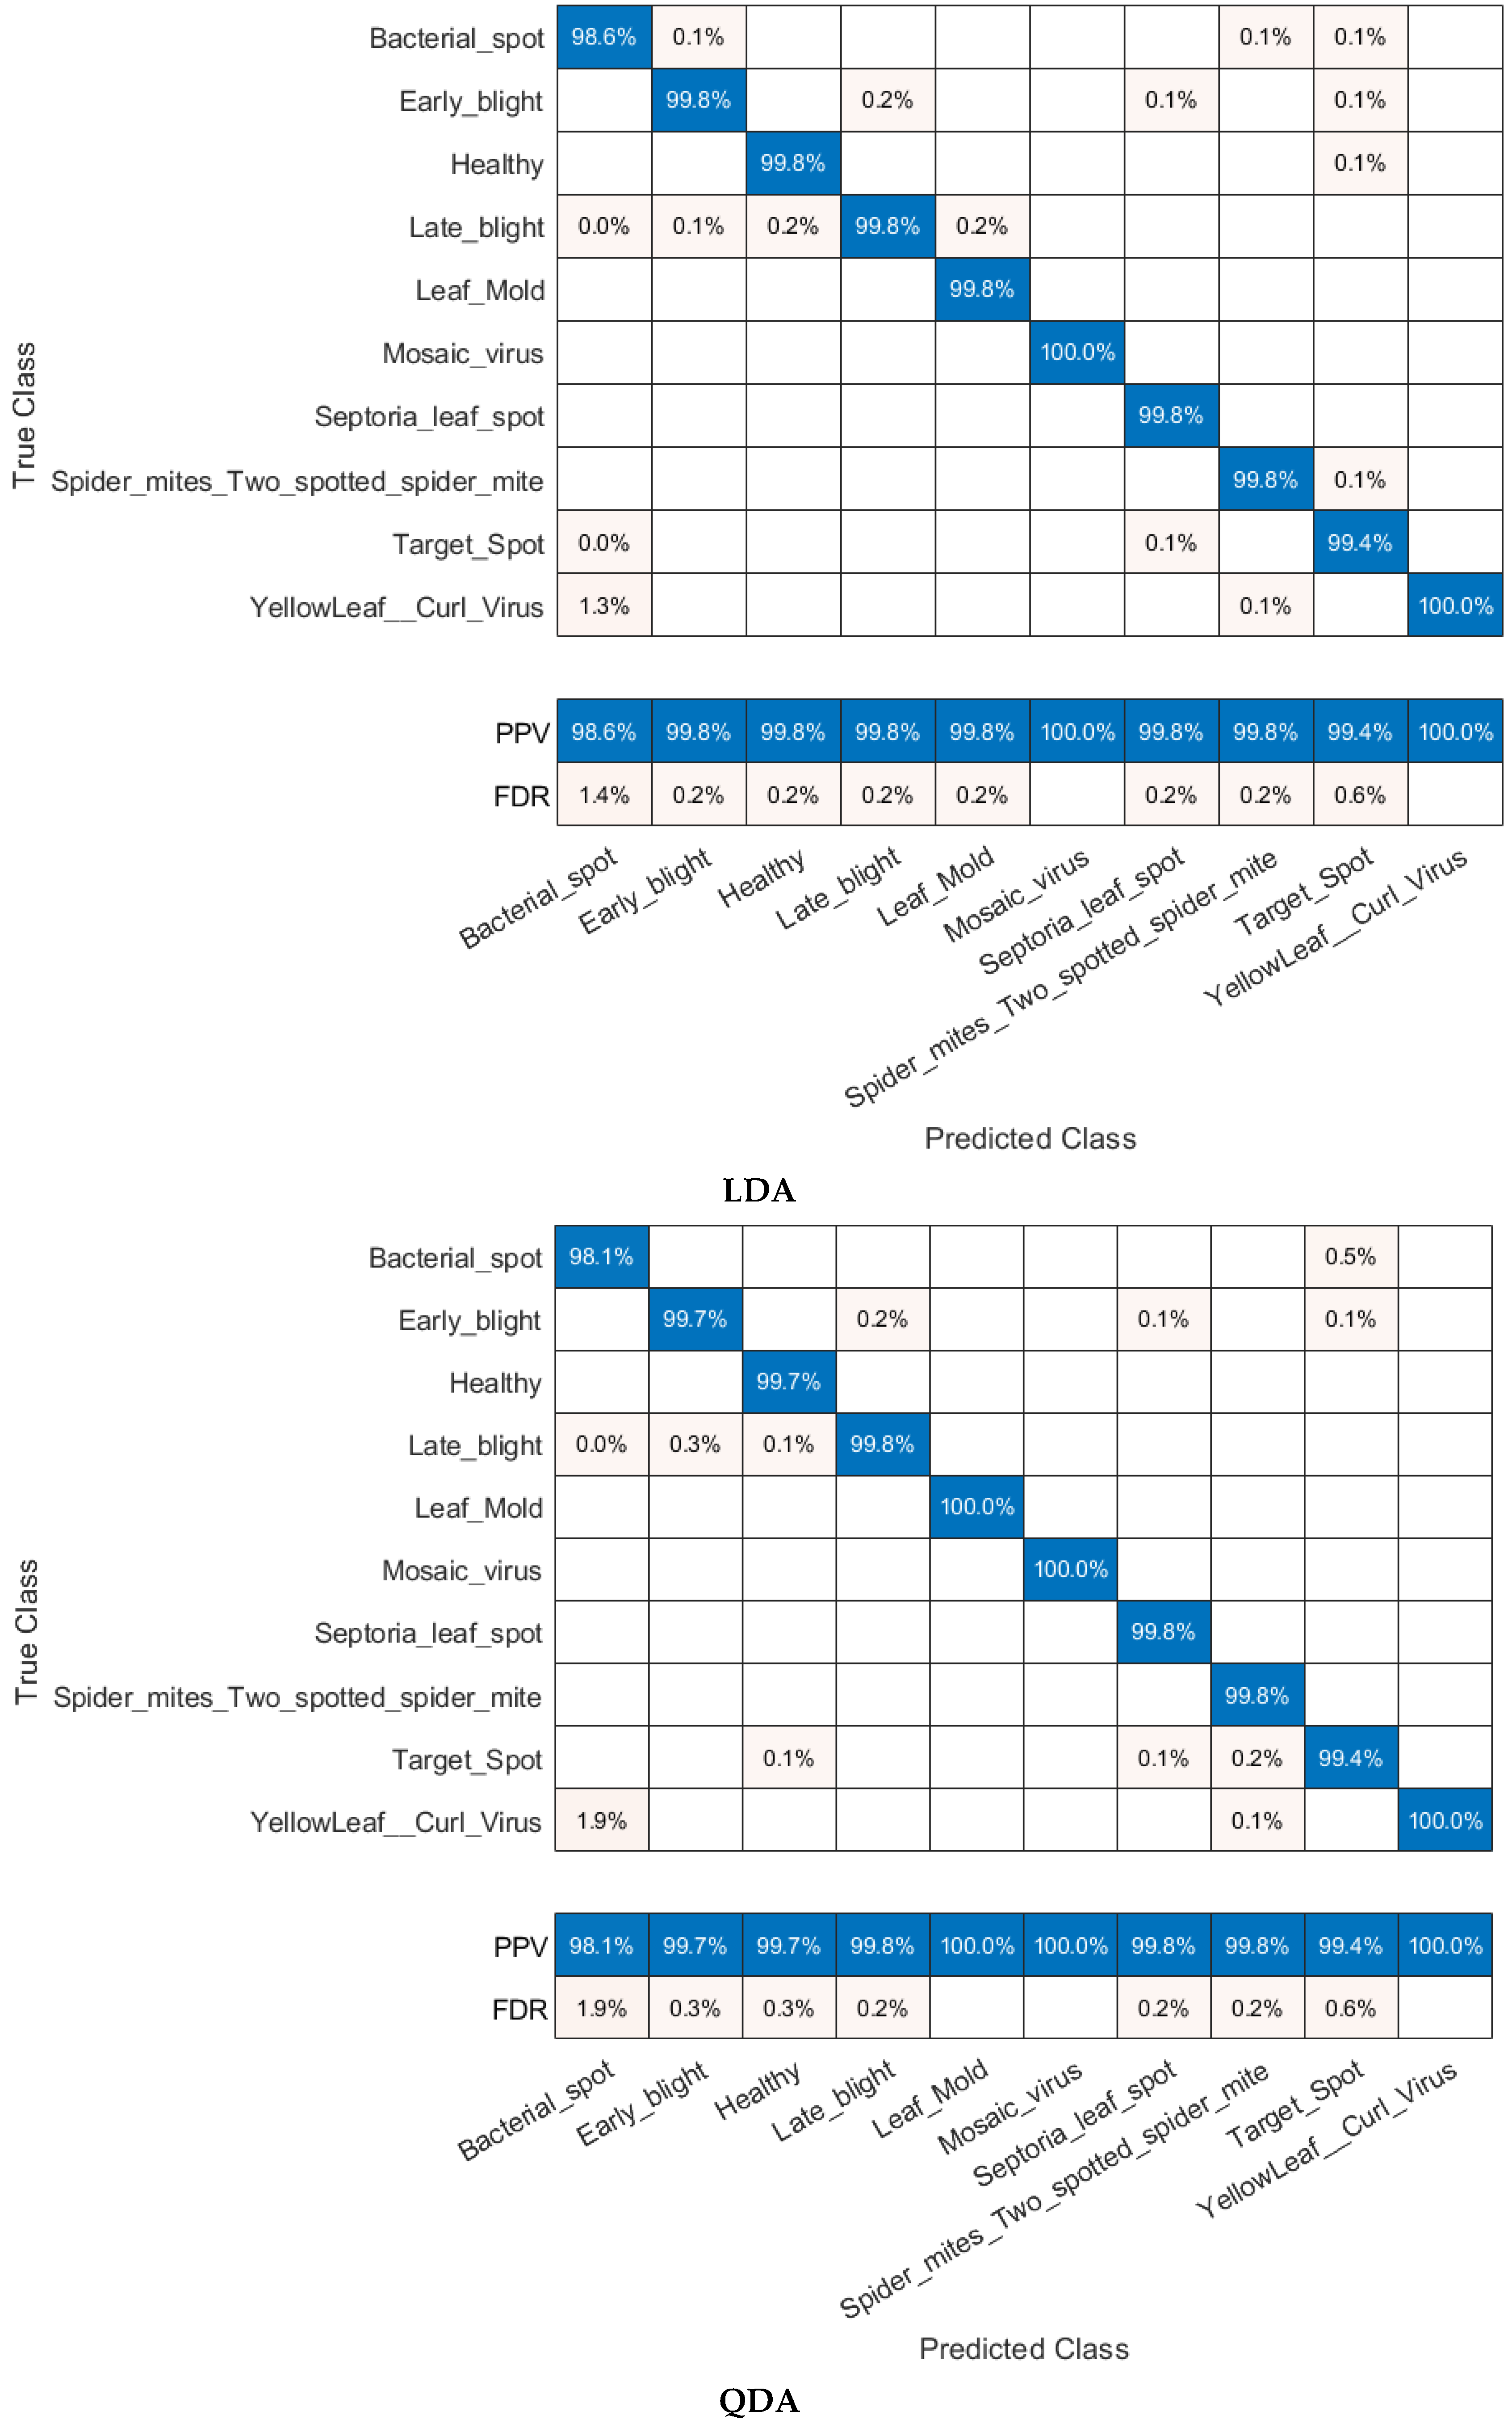
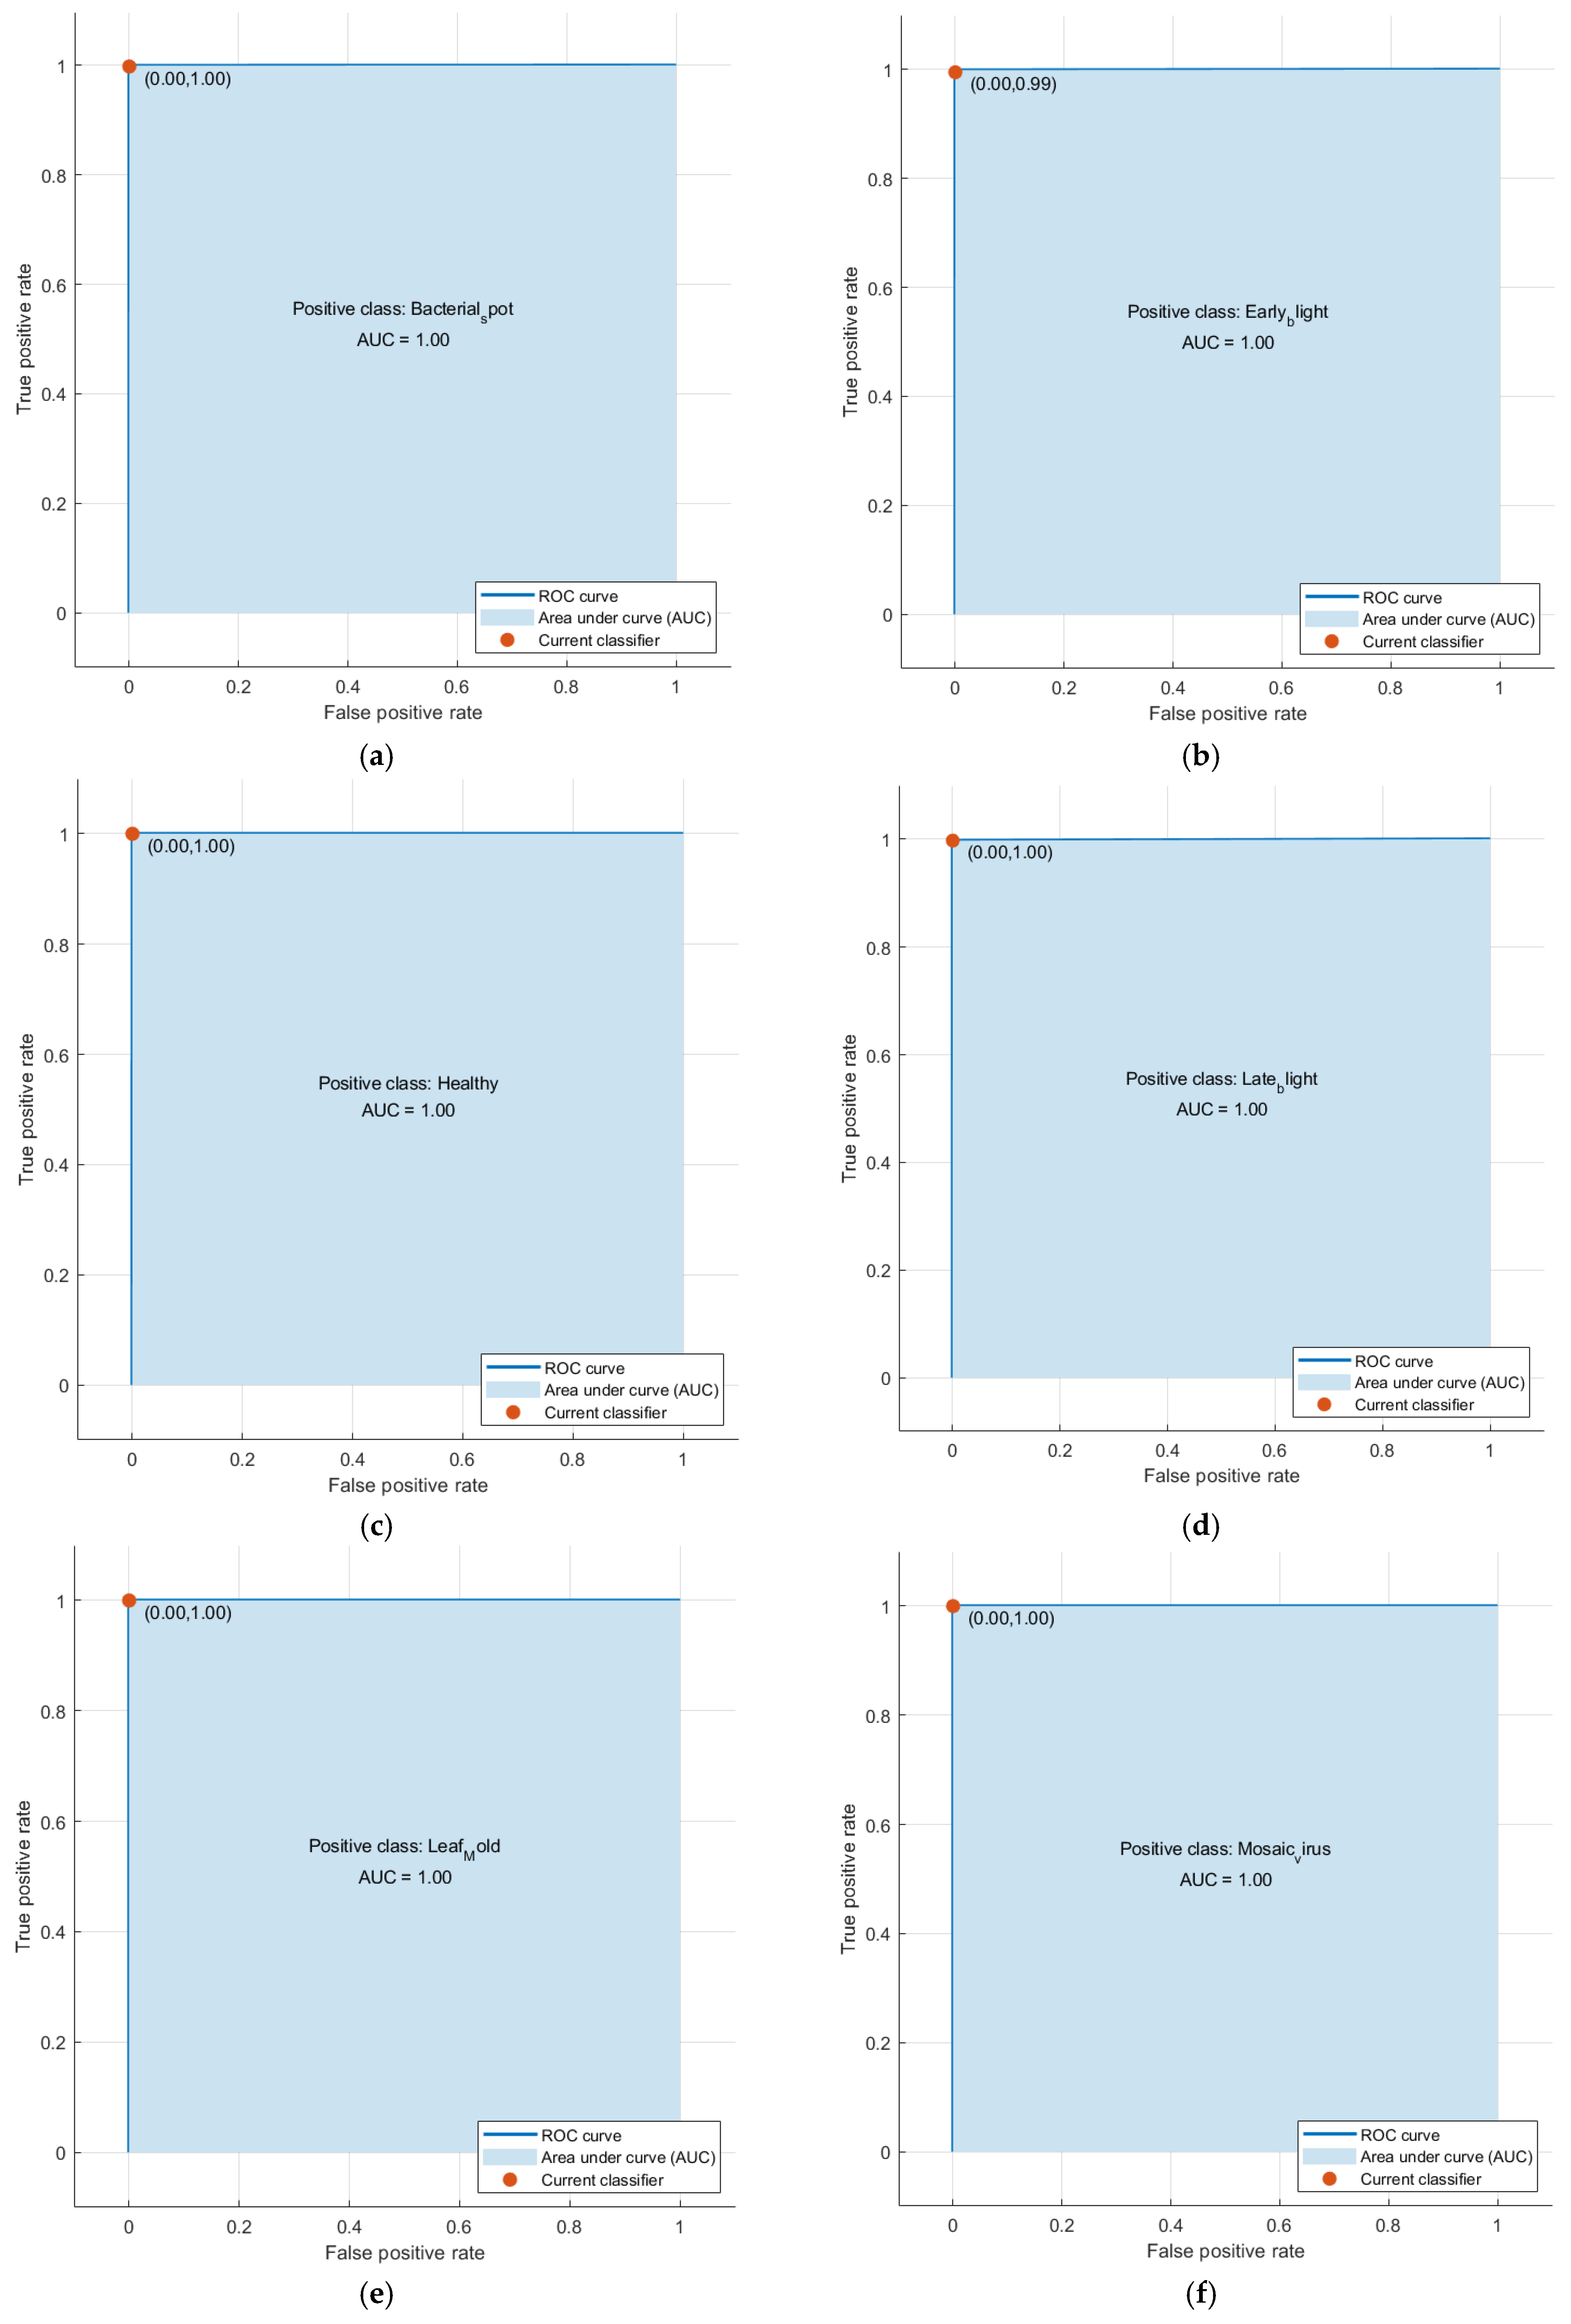
5.1. Context 1 Classification Performance
5.2. Context 2 Classification Performance
5.3. Context 3 Classification Performance
6. Discussion
6.1. Comparative Analysis
6.2. Limitations and Forthcoming Directions
7. Conclusions
Funding
Institutional Review Board Statement
Informed Consent Statement
Data Availability Statement
Conflicts of Interest
References
- Savary, S.; Ficke, A.; Aubertot, J.-N.; Hollier, C. Crop Losses Due to Diseases and Their Implications for Global Food Production Losses and Food Security. Food Secur. 2012, 4, 519–537. [Google Scholar] [CrossRef]
- Al-gaashani, M.S.; Shang, F.; Muthanna, M.S.; Khayyat, M.; Abd El-Latif, A.A. Tomato Leaf Disease Classification by Exploiting Transfer Learning and Feature Concatenation. IET Image Process. 2022, 16, 913–925. [Google Scholar] [CrossRef]
- Ahmed, S.; Hasan, M.B.; Ahmed, T.; Sony, M.R.K.; Kabir, M.H. Less Is More: Lighter and Faster Deep Neural Architecture for Tomato Leaf Disease Classification. IEEE Access 2022, 10, 68868–68884. [Google Scholar] [CrossRef]
- Panno, S.; Davino, S.; Caruso, A.G.; Bertacca, S.; Crnogorac, A.; Mandić, A.; Noris, E.; Matić, S. A Review of the Most Common and Economically Important Diseases That Undermine the Cultivation of Tomato Crop in the Mediterranean Basin. Agronomy 2021, 11, 2188. [Google Scholar] [CrossRef]
- Azlah, M.A.F.; Chua, L.S.; Rahmad, F.R.; Abdullah, F.I.; Wan Alwi, S.R. Review on Techniques for Plant Leaf Classification and Recognition. Computers 2019, 8, 77. [Google Scholar] [CrossRef] [Green Version]
- Li, L.; Zhang, S.; Wang, B. Plant Disease Detection and Classification by Deep Learning—A Review. IEEE Access 2021, 9, 56683–56698. [Google Scholar] [CrossRef]
- Attallah, O. CoMB-Deep: Composite Deep Learning-Based Pipeline for Classifying Childhood Medulloblastoma and Its Classes. Front. Neuroinform. 2021, 15, 663592. [Google Scholar] [CrossRef]
- Attallah, O. MB-AI-His: Histopathological Diagnosis of Pediatric Medulloblastoma and Its Subtypes via AI. Diagnostics 2021, 11, 359. [Google Scholar] [CrossRef]
- Attallah, O. A Computer-Aided Diagnostic Framework for Coronavirus Diagnosis Using Texture-Based Radiomics Images. Digit. Health 2022, 8, 20552076221092544. [Google Scholar] [CrossRef]
- Attallah, O.; Samir, A. A Wavelet-Based Deep Learning Pipeline for Efficient COVID-19 Diagnosis via CT Slices. Appl. Soft Comput. 2022, 128, 109401. [Google Scholar] [CrossRef]
- Attallah, O. An Intelligent ECG-Based Tool for Diagnosing COVID-19 via Ensemble Deep Learning Techniques. Biosensors 2022, 12, 299. [Google Scholar] [CrossRef] [PubMed]
- Attallah, O. GabROP: Gabor Wavelets-Based CAD for Retinopathy of Prematurity Diagnosis via Convolutional Neural Networks. Diagnostics 2023, 13, 171. [Google Scholar] [CrossRef] [PubMed]
- Attallah, O. DIAROP: Automated Deep Learning-Based Diagnostic Tool for Retinopathy of Prematurity. Diagnostics 2021, 11, 2034. [Google Scholar] [CrossRef] [PubMed]
- Attallah, O. ECG-BiCoNet: An ECG-Based Pipeline for COVID-19 Diagnosis Using Bi-Layers of Deep Features Integration. Comput. Biol. Med. 2022, 2022, 105210. [Google Scholar] [CrossRef] [PubMed]
- Attallah, O. A Deep Learning-Based Diagnostic Tool for Identifying Various Diseases via Facial Images. Digit. Health 2022, 8, 20552076221124430. [Google Scholar] [CrossRef]
- Attallah, O. RADIC: A Tool for Diagnosing COVID-19 from Chest CT and X-Ray Scans Using Deep Learning and Quad-Radiomics. Chemom. Intell. Lab. Syst. 2023, 233, 104750. [Google Scholar] [CrossRef]
- Attallah, O. An Effective Mental Stress State Detection and Evaluation System Using Minimum Number of Frontal Brain Electrodes. Diagnostics 2020, 10, 292. [Google Scholar] [CrossRef]
- Attallah, O.; Zaghlool, S. AI-Based Pipeline for Classifying Pediatric Medulloblastoma Using Histopathological and Textural Images. Life 2022, 12, 232. [Google Scholar] [CrossRef]
- Agarwal, K.; Jalali, S. Classification of Retinopathy of Prematurity: From Then till Now. Community Eye Health 2018, 31, S4. [Google Scholar]
- Attallah, O.; Morsi, I. An Electronic Nose for Identifying Multiple Combustible/Harmful Gases and Their Concentration Levels via Artificial Intelligence. Measurement 2022, 199, 111458. [Google Scholar] [CrossRef]
- Agarwal, M.; Gupta, S.K.; Biswas, K.K. Development of Efficient CNN Model for Tomato Crop Disease Identification. Sustain. Comput. Inform. Syst. 2020, 28, 100407. [Google Scholar] [CrossRef]
- Kamilaris, A.; Prenafeta-Boldú, F.X. Deep Learning in Agriculture: A Survey. Comput. Electron. Agric. 2018, 147, 70–90. [Google Scholar] [CrossRef] [Green Version]
- Hassan, S.M.; Maji, A.K.; Jasiński, M.; Leonowicz, Z.; Jasińska, E. Identification of Plant-Leaf Diseases Using CNN and Transfer-Learning Approach. Electronics 2021, 10, 1388. [Google Scholar] [CrossRef]
- Karthik, R.; Hariharan, M.; Anand, S.; Mathikshara, P.; Johnson, A.; Menaka, R. Attention Embedded Residual CNN for Disease Detection in Tomato Leaves. Appl. Soft Comput. 2020, 86, 105933. [Google Scholar]
- Kaya, A.; Keceli, A.S.; Catal, C.; Yalic, H.Y.; Temucin, H.; Tekinerdogan, B. Analysis of Transfer Learning for Deep Neural Network Based Plant Classification Models. Comput. Electron. Agric. 2019, 158, 20–29. [Google Scholar] [CrossRef]
- Kaur, S.; Pandey, S.; Goel, S. Plants Disease Identification and Classification through Leaf Images: A Survey. Arch. Comput. Methods Eng. 2019, 26, 507–530. [Google Scholar] [CrossRef]
- Hughes, D.; Salathé, M. An Open Access Repository of Images on Plant Health to Enable the Development of Mobile Disease Diagnostics. arXiv 2015, arXiv:1511.08060. [Google Scholar]
- Abbas, A.; Jain, S.; Gour, M.; Vankudothu, S. Tomato Plant Disease Detection Using Transfer Learning with C-GAN Synthetic Images. Comput. Electron. Agric. 2021, 187, 106279. [Google Scholar] [CrossRef]
- Li, M.; Zhou, G.; Chen, A.; Yi, J.; Lu, C.; He, M.; Hu, Y. FWDGAN-Based Data Augmentation for Tomato Leaf Disease Identification. Comput. Electron. Agric. 2022, 194, 106779. [Google Scholar] [CrossRef]
- Bhujel, A.; Kim, N.-E.; Arulmozhi, E.; Basak, J.K.; Kim, H.-T. A Lightweight Attention-Based Convolutional Neural Networks for Tomato Leaf Disease Classification. Agriculture 2022, 12, 228. [Google Scholar] [CrossRef]
- Özbılge, E.; Ulukök, M.K.; Toygar, Ö.; Ozbılge, E. Tomato Disease Recognition Using a Compact Convolutional Neural Network. IEEE Access 2022, 10, 77213–77224. [Google Scholar] [CrossRef]
- Thangaraj, R.; Anandamurugan, S.; Kaliappan, V.K. Automated Tomato Leaf Disease Classification Using Transfer Learning-Based Deep Convolution Neural Network. J. Plant Dis. Prot. 2021, 128, 73–86. [Google Scholar] [CrossRef]
- Kumar, A.; Vani, M. Image Based Tomato Leaf Disease Detection. In Proceedings of the 2019 10th International Conference on Computing, Communication and Networking Technologies (ICCCNT), Kanpur, India, 6–8 July 2019; IEEE: New York, NY, USA, 2019; pp. 1–6. [Google Scholar]
- Maeda-Gutiérrez, V.; Galvan-Tejada, C.E.; Zanella-Calzada, L.A.; Celaya-Padilla, J.M.; Galván-Tejada, J.I.; Gamboa-Rosales, H.; Luna-Garcia, H.; Magallanes-Quintanar, R.; Guerrero Mendez, C.A.; Olvera-Olvera, C.A. Comparison of Convolutional Neural Network Architectures for Classification of Tomato Plant Diseases. Appl. Sci. 2020, 10, 1245. [Google Scholar] [CrossRef]
- Tan, L.; Lu, J.; Jiang, H. Tomato Leaf Diseases Classification Based on Leaf Images: A Comparison between Classical Machine Learning and Deep Learning Methods. AgriEngineering 2021, 3, 542–558. [Google Scholar] [CrossRef]
- Islam, M.S.; Sultana, S.; Farid, F.A.; Islam, M.N.; Rashid, M.; Bari, B.S.; Hashim, N.; Husen, M.N. Multimodal Hybrid Deep Learning Approach to Detect Tomato Leaf Disease Using Attention Based Dilated Convolution Feature Extractor with Logistic Regression Classification. Sensors 2022, 22, 6079. [Google Scholar] [CrossRef]
- Chen, H.-C.; Widodo, A.M.; Wisnujati, A.; Rahaman, M.; Lin, J.C.-W.; Chen, L.; Weng, C.-E. AlexNet Convolutional Neural Network for Disease Detection and Classification of Tomato Leaf. Electronics 2022, 11, 951. [Google Scholar] [CrossRef]
- Amin, J.; Sharif, A.; Gul, N.; Anjum, M.A.; Nisar, M.W.; Azam, F.; Bukhari, S.A.C. Integrated Design of Deep Features Fusion for Localization and Classification of Skin Cancer. Pattern Recognit. Lett. 2020, 131, 63–70. [Google Scholar] [CrossRef]
- Amrani, M.; Hammad, M.; Jiang, F.; Wang, K.; Amrani, A. Very Deep Feature Extraction and Fusion for Arrhythmias Detection. Neural Comput. Appl. 2018, 30, 2047–2057. [Google Scholar] [CrossRef]
- Zhang, Q.; Li, H.; Sun, Z.; Tan, T. Deep Feature Fusion for Iris and Periocular Biometrics on Mobile Devices. IEEE Trans. Inf. Secur. 2018, 13, 2897–2912. [Google Scholar] [CrossRef]
- Nandhini, S.; Ashokkumar, K. Improved Crossover Based Monarch Butterfly Optimization for Tomato Leaf Disease Classification Using Convolutional Neural Network. Multimed. Tools Appl. 2021, 80, 18583–18610. [Google Scholar] [CrossRef]
- Gadekallu, T.R.; Rajput, D.S.; Reddy, M.; Lakshmanna, K.; Bhattacharya, S.; Singh, S.; Jolfaei, A.; Alazab, M. A Novel PCA–Whale Optimization-Based Deep Neural Network Model for Classification of Tomato Plant Diseases Using GPU. J. Real-Time Image Process. 2021, 18, 1383–1396. [Google Scholar] [CrossRef]
- Tian, K.; Zeng, J.; Song, T.; Li, Z.; Evans, A.; Li, J. Tomato Leaf Diseases Recognition Based on Deep Convolutional Neural Networks. J. Agric. Eng. 2022, in press. [CrossRef]
- Alhenawi, E.; Al-Sayyed, R.; Hudaib, A.; Mirjalili, S. Feature Selection Methods on Gene Expression Microarray Data for Cancer Classification: A Systematic Review. Comput. Biol. Med. 2022, 140, 105051. [Google Scholar] [CrossRef]
- Fei, H.; Fan, Z.; Wang, C.; Zhang, N.; Wang, T.; Chen, R.; Bai, T. Cotton Classification Method at the County Scale Based on Multi-Features and Random Forest Feature Selection Algorithm and Classifier. Remote Sens. 2022, 14, 829. [Google Scholar] [CrossRef]
- Chandrashekar, G.; Sahin, F. A Survey on Feature Selection Methods. Comput. Electr. Eng. 2014, 40, 16–28. [Google Scholar] [CrossRef]
- Attallah, O.; Karthikesalingam, A.; Holt, P.J.; Thompson, M.M.; Sayers, R.; Bown, M.J.; Choke, E.C.; Ma, X. Using Multiple Classifiers for Predicting the Risk of Endovascular Aortic Aneurysm Repair Re-Intervention through Hybrid Feature Selection. Proc. Inst. Mech. Eng. Part H J. Eng. Med. 2017, 231, 1048–1063. [Google Scholar] [CrossRef]
- Attallah, O.; Karthikesalingam, A.; Holt, P.J.; Thompson, M.M.; Sayers, R.; Bown, M.J.; Choke, E.C.; Ma, X. Feature Selection through Validation and Un-Censoring of Endovascular Repair Survival Data for Predicting the Risk of Re-Intervention. BMC Med. Inform. Decis. Mak. 2017, 17, 115–133. [Google Scholar] [CrossRef] [Green Version]
- Pasha, S.J.; Mohamed, E.S. Ensemble Gain Ratio Feature Selection (EGFS) Model with Machine Learning and Data Mining Algorithms for Disease Risk Prediction. In Proceedings of the 2020 International Conference on Inventive Computation Technologies (ICICT), Coimbatore, India, 26–28 February 2020; pp. 590–596. [Google Scholar]
- Hall, M.; Frank, E.; Holmes, G.; Pfahringer, B.; Reutemann, P.; Witten, I.H. The WEKA Data Mining Software: An Update. ACM SIGKDD Explor. Newsl. 2009, 11, 10–18. [Google Scholar] [CrossRef]
- Wspanialy, P.; Moussa, M. A Detection and Severity Estimation System for Generic Diseases of Tomato Greenhouse Plants. Comput. Electron. Agric. 2020, 178, 105701. [Google Scholar] [CrossRef]
- Zaki, S.Z.M.; Zulkifley, M.A.; Stofa, M.M.; Kamari, N.A.M.; Mohamed, N.A. Classification of Tomato Leaf Diseases Using MobileNet V2. IAES Int. J. Artif. Intell. 2020, 9, 290. [Google Scholar] [CrossRef]
- Mohanty, S.P.; Hughes, D.P.; Salathé, M. Using Deep Learning for Image-Based Plant Disease Detection. Front. Plant Sci. 2016, 7, 1419. [Google Scholar] [CrossRef] [PubMed] [Green Version]
- Rangarajan, A.K.; Purushothaman, R.; Ramesh, A. Tomato Crop Disease Classification Using Pre-Trained Deep Learning Algorithm. Procedia Comput. Sci. 2018, 133, 1040–1047. [Google Scholar] [CrossRef]
- Bir, P.; Kumar, R.; Singh, G. Transfer Learning Based Tomato Leaf Disease Detection for Mobile Applications. In Proceedings of the 2020 IEEE International Conference on Computing, Power and Communication Technologies (GUCON), Greater Noida, 2–4 October 2020; IEEE: New York, NY, USA, 2020; pp. 34–39. [Google Scholar]


| Class Label | Number of Images |
|---|---|
| Bacterial Spot | 2127 |
| Early Blight | 1000 |
| Healthy | 1591 |
| Late Blight | 1909 |
| Leaf Mold | 952 |
| Mosaic virus | 373 |
| Septoria Leaf Spot | 1771 |
| Two Spotted Spider Mites | 1676 |
| Target Spot | 1405 |
| Yellow Leaf Curl Virus | 3209 |
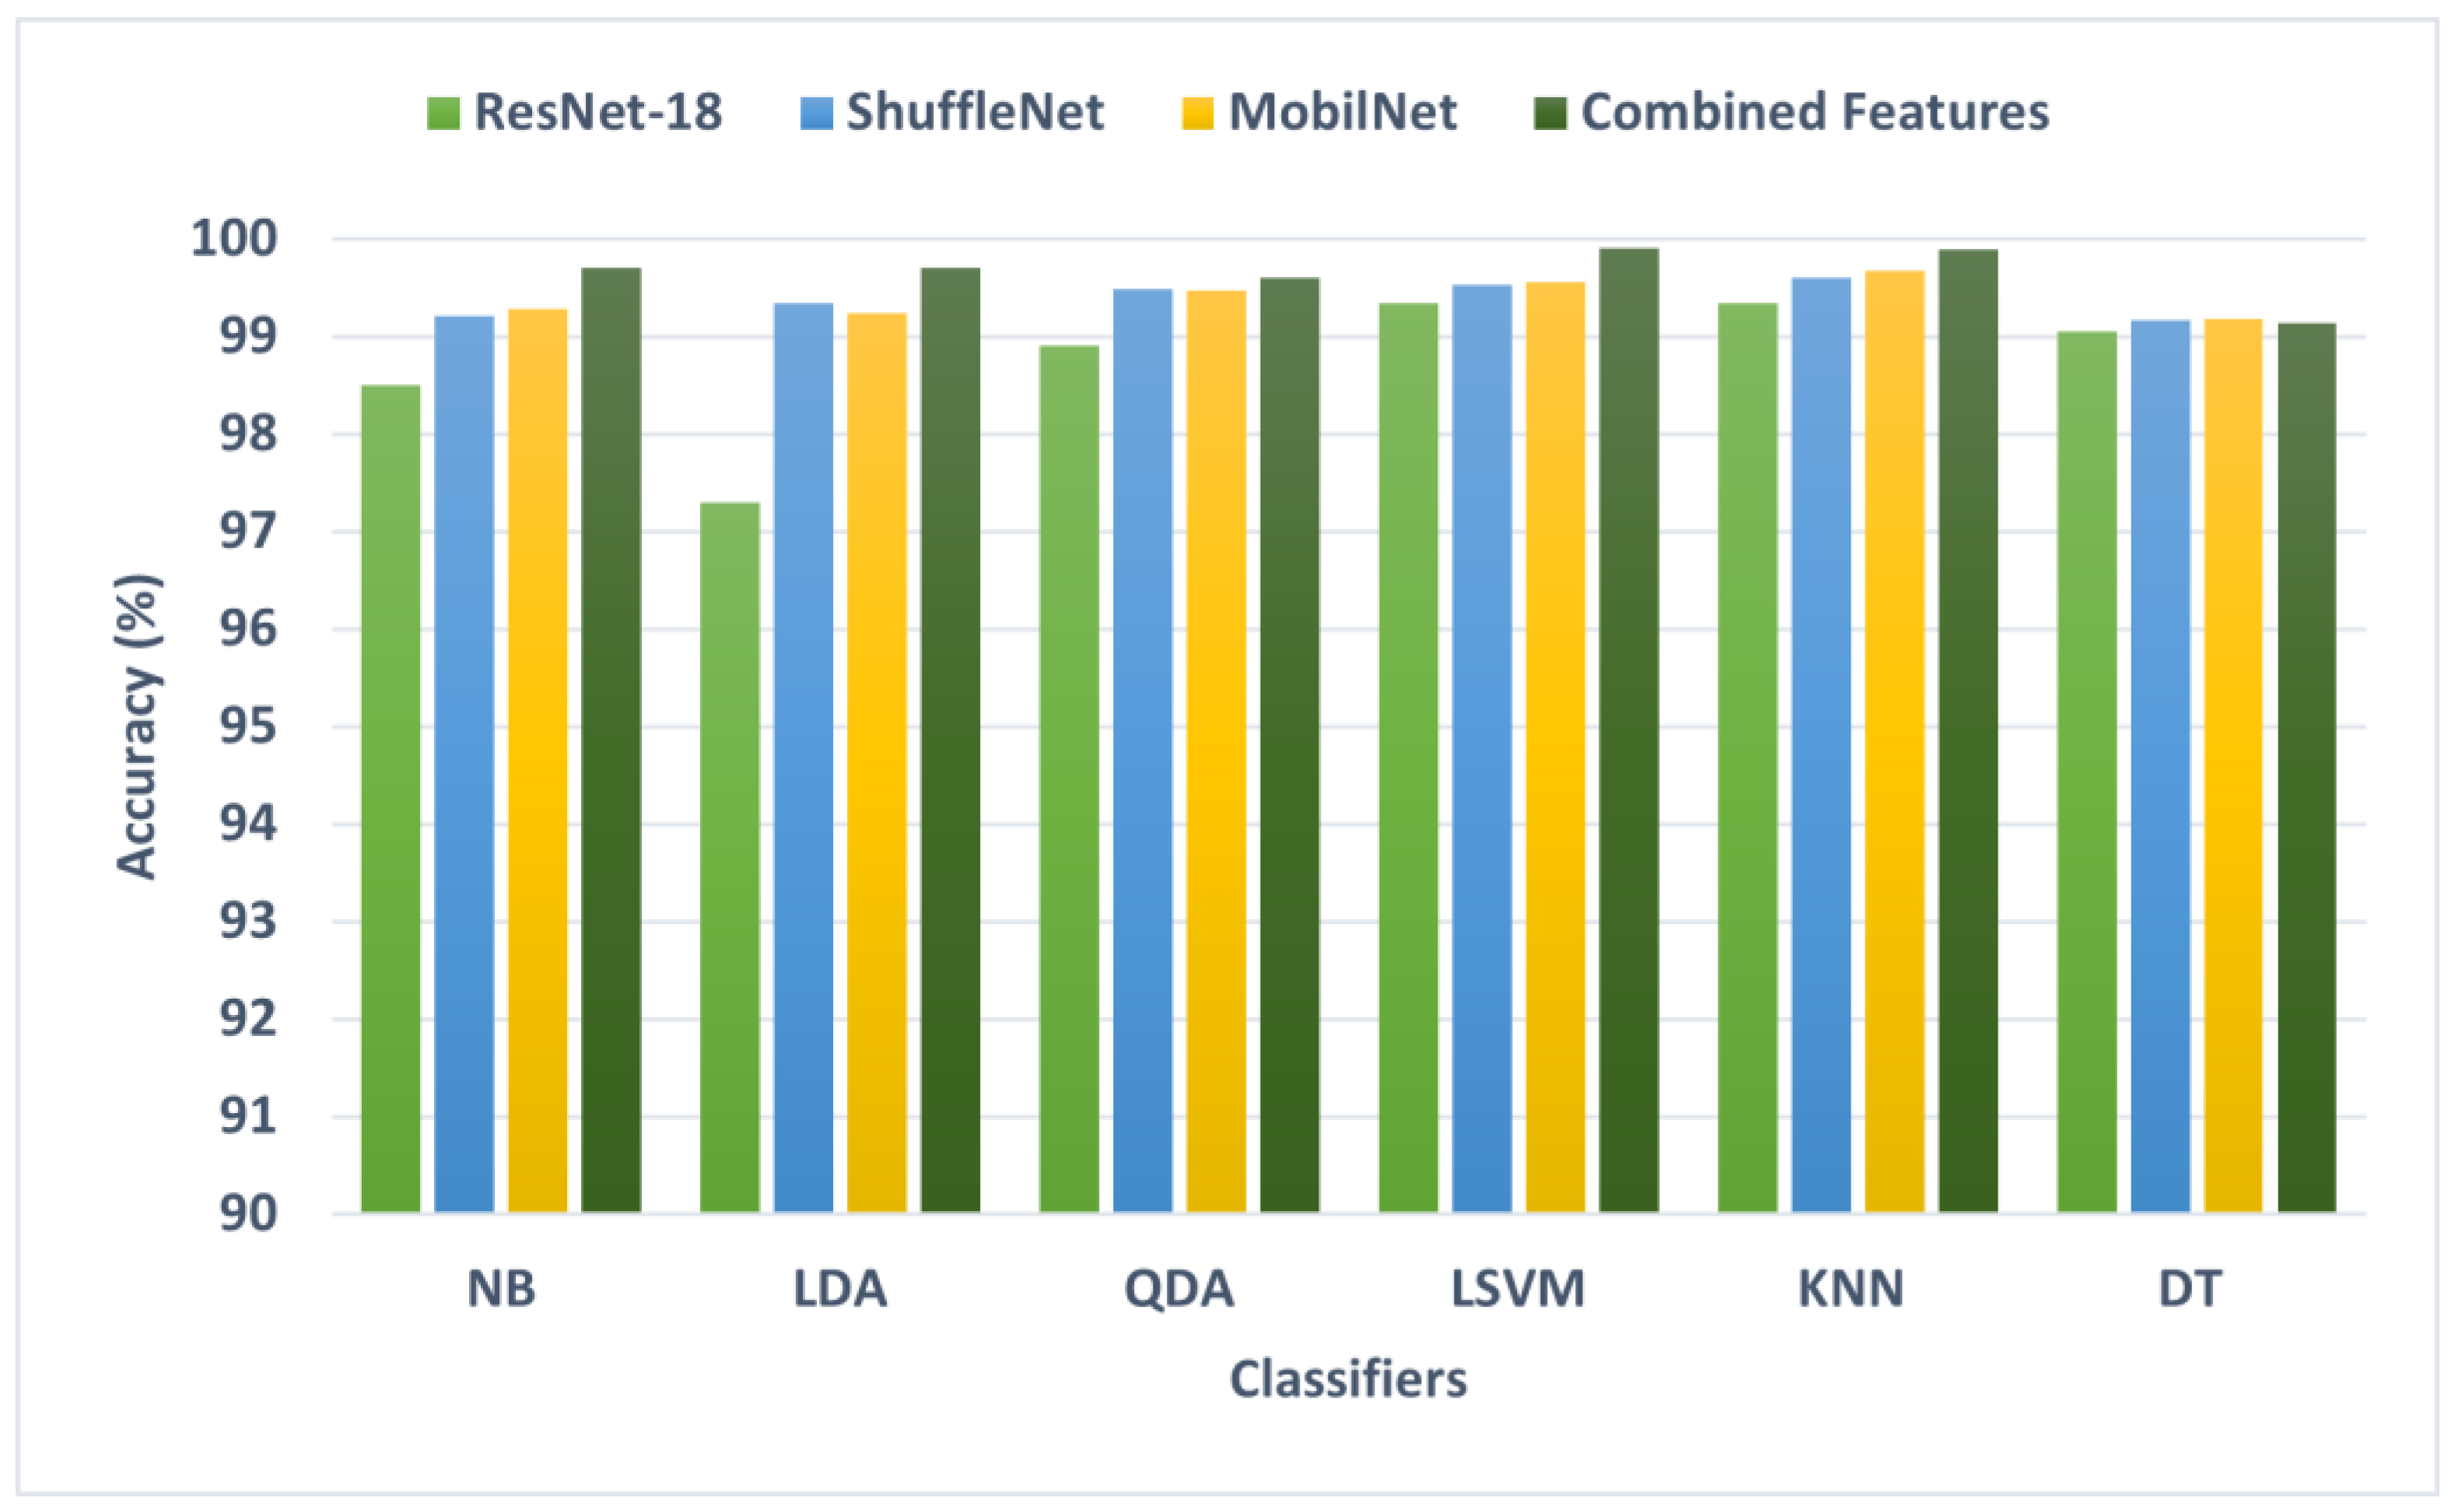
| Accuracy | Sensitivity | Specificity | Precision | F1-Score | MCC | |
|---|---|---|---|---|---|---|
| ResNet-18 Features | ||||||
| NB | 98.5 | 98.2 | 99.8 | 98.5 | 98.5 | 98.3 |
| LDA | 97.3 | 97.3 | 97.0 | 97.4 | 97.3 | 96.9 |
| QDA | 98.9 | 98.9 | 99.9 | 98.9 | 98.9 | 98.8 |
| LSVM | 99.34 | 99.3 | 99.9 | 99.3 | 99.3 | 99.3 |
| KNN | 99.34 | 99.3 | 99.9 | 99.3 | 99.3 | 99.3 |
| DT | 99.05 | 99.1 | 99.1 | 99.1 | 98.9 | 99.6 |
| ShuffleNet Features | ||||||
| NB | 99.21 | 99.2 | 99.9 | 99.2 | 99.2 | 99.1 |
| LDA | 99.33 | 99.3 | 99.9 | 99.3 | 99.3 | 99.2 |
| QDA | 99.48 | 99.5 | 99.9 | 99.5 | 99.5 | 99.4 |
| LSVM | 99.53 | 99.5 | 99.9 | 99.5 | 99.5 | 99.5 |
| KNN | 99.60 | 99.6 | 100 | 99.6 | 99.6 | 99.6 |
| DT | 99.17 | 99.2 | 99.9 | 99.2 | 99.2 | 99.1 |
| MobileNet Features | ||||||
| NB | 99.28 | 99.3 | 99.9 | 99.3 | 99.3 | 99.2 |
| LDA | 99.24 | 99.3 | 99.9 | 99.3 | 99.3 | 99.2 |
| QDA | 99.47 | 99.5 | 99.9 | 99.5 | 99.5 | 99.4 |
| LSVM | 99.56 | 99.6 | 99.9 | 99.6 | 99.6 | 99.5 |
| KNN | 99.67 | 99.7 | 100 | 99.7 | 99.7 | 99.6 |
| DT | 99.18 | 99.2 | 99.9 | 99.2 | 99.2 | 99.1 |
| Sensitivity | Specificity | Precision | F1-Score | MCC | |
|---|---|---|---|---|---|
| NB | 99.7 | 100 | 99.7 | 99.7 | 99.7 |
| LDA | 99.7 | 100 | 99.7 | 99.7 | 99.7 |
| QDA | 99.6 | 99.9 | 99.6 | 99.6 | 99.5 |
| LSVM | 99.9 | 100 | 99.9 | 99.9 | 99.8 |
| KNN | 99.9 | 100 | 99.9 | 99.9 | 99.9 |
| DT | 99.1 | 99.9 | 99.1 | 99.1 | 99.0 |
| # Features | Accuracy | Sensitivity | Specificity | Precision | F1-Score | MCC | |
|---|---|---|---|---|---|---|---|
| Forward Search Methodology | |||||||
| NB | 21 | 99.80 | 99.8 | 100 | 99.8 | 99.8 | 99.8 |
| LDA | 21 | 99.80 | 99.8 | 100 | 99.8 | 99.8 | 99.8 |
| QDA | 15 | 99.80 | 99.8 | 100 | 99.8 | 99.8 | 99.8 |
| LSVM | 24 | 99.90 | 99.9 | 100 | 99.9 | 99.9 | 99.8 |
| KNN | 22 | 99.90 | 99.9 | 100 | 99.9 | 99.9 | 99.9 |
| DT | 14 | 99.34 | 99.3 | 99.9 | 99.3 | 99.3 | 99.3 |
| Backward Search Methodology | |||||||
| NB | 19 | 99.81 | 99.8 | 100 | 99.8 | 99.8 | 99.8 |
| LDA | 24 | 99.81 | 99.8 | 100 | 99.8 | 99.8 | 99.8 |
| QDA | 16 | 99.92 | 99.9 | 100 | 99.9 | 99.9 | 99.8 |
| LSVM | 16 | 99.8 | 99.8 | 100 | 99.8 | 99.8 | 99.8 |
| KNN | 24 | 99.91 | 99.9 | 100 | 99.9 | 99.9 | 99.9 |
| DT | 14 | 99.34 | 99.3 | 99.9 | 99.3 | 99.3 | 99.3 |
| Bidirectional Search Methodology | |||||||
| NB | 21 | 99.81 | 99.8 | 100 | 99.8 | 99.8 | 99.8 |
| LDA | 19 | 99.81 | 99.8 | 100 | 99.8 | 99.8 | 99.8 |
| QDA | 16 | 99.92 | 99.9 | 100 | 99.9 | 99.9 | 99.9 |
| LSVM | 24 | 99.90 | 99.9 | 100 | 99.9 | 99.9 | 99.8 |
| KNN | 22 | 99.92 | 99.9 | 100 | 99.9 | 99.9 | 99.9 |
| DT | 14 | 99.36 | 99.4 | 99.9 | 99.4 | 99.4 | 99.3 |
| Article | # Diseases | Model | Features | Accuracy |
|---|---|---|---|---|
| [51] | 10 | ResNet-50 | Features of ResNet-50 | 97.0% |
| [28] | 10 | U-Net | ResNet-50 | 97.11% |
| [3] | 10 | Customized CNN | Customized CNN | 99.3% |
| [21] | 10 | Customized CNN | Customized CNN | 98.70% |
| [52] | 4 | Fine-tuned MobileNet | Features of MobileNet | 90.3% |
| [53] | 10 | Spatial attention with CNN | Fully connected layer | 95.20% |
| [54] | 7 | VGG16 | Features of VGG16 | 96.19% |
| [2] | 6 | Multinomial Logistic regression | MobileNetV2 or NASNetMobile | 97% |
| [55] | 10 | EfficientNet-B0 | EfficientNet-B0 | 98.60% |
| Proposed | 10 | KNN | Fully connected layer (MobileNet + ShuffleNet + ResNet-18) + hybrid FS | 99.92% |
Disclaimer/Publisher’s Note: The statements, opinions and data contained in all publications are solely those of the individual author(s) and contributor(s) and not of MDPI and/or the editor(s). MDPI and/or the editor(s) disclaim responsibility for any injury to people or property resulting from any ideas, methods, instructions or products referred to in the content. |
© 2023 by the author. Licensee MDPI, Basel, Switzerland. This article is an open access article distributed under the terms and conditions of the Creative Commons Attribution (CC BY) license (https://creativecommons.org/licenses/by/4.0/).
Share and Cite
Attallah, O. Tomato Leaf Disease Classification via Compact Convolutional Neural Networks with Transfer Learning and Feature Selection. Horticulturae 2023, 9, 149. https://doi.org/10.3390/horticulturae9020149
Attallah O. Tomato Leaf Disease Classification via Compact Convolutional Neural Networks with Transfer Learning and Feature Selection. Horticulturae. 2023; 9(2):149. https://doi.org/10.3390/horticulturae9020149
Chicago/Turabian StyleAttallah, Omneya. 2023. "Tomato Leaf Disease Classification via Compact Convolutional Neural Networks with Transfer Learning and Feature Selection" Horticulturae 9, no. 2: 149. https://doi.org/10.3390/horticulturae9020149