Article

Identification and Characterization of CCD Gene Family in Rose (Rosa chinensis Jacq. ‘Old Blush’) and Gene Co-Expression Network in Biosynthesis of Flower Scent

1
Beijing Key Laboratory of Development and Quality Control of Ornamental Crops, Department of Ornamental Horticulture, China Agricultural University, Beijing 100193, China
2
Key Laboratory for Quality Regulation of Tropical Horticultural Crops of Hainan Province, School of Horticulture, Hainan University, Haikou 570228, China
*
Author to whom correspondence should be addressed.
Horticulturae 2023, 9(1), 115; https://doi.org/10.3390/horticulturae9010115
Submission received: 30 November 2022 / Revised: 11 January 2023 / Accepted: 13 January 2023 / Published: 15 January 2023

Abstract

:
Rose (Rosa sp.) is a widely used raw material for essential oil extraction and fragrance production. The carotenoid cleavage dioxygenases pathway is one of the main metabolic pathways for the degradation of carotenoids, which is located downstream of the terpenoids biosynthesis pathway and is closely related to the biosynthesis of volatile compounds. We performed a comprehensive genome-wide analysis of the rose CCD family genes (RcCCDs) in terms of phylogeny, sequence characterization, gene structure, gene duplication events, and transcriptome. Finally, 15 CCD family members were identified from the rose genome, and they were classified into three clades: nine for the CCD clade, four for the NCED clade, and two for the CCD-LIKE clade. The RcCCDs were distributed on chromosomes 1, 4, 5, 6, and 7, and were concentrated on both ends of the chromosomes. RcCCDs did not have paralogous genes or whole genome duplication events (WGD), eleven of them were single-copy genes, and their repetitive sequences were mainly dispersed and tandem. Ten RcCCDs were differentially expressed in the transcriptomes of different flowering stages. The expression of four of them increased and then decreased, which was the same process as the accumulation of volatile compounds, and it was speculated that these genes might be involved in the biosynthesis of volatile compounds. A total of fifteen modules were obtained by weighted gene co-expression network analysis of eighteen volatile compounds-related genes, of which six modules were a highly significant positive correlation with volatile compounds, and 20 hub genes in the modules were predicted. These hub genes all exercised their functions in the early flowering stage with strict temporal specificity. This study provided a theoretical basis for further exploring the biological functions of RcCCDs and hub genes regulating the synthesis and metabolism of volatile compounds in rose.

1. Introduction

As a widely used plant material for essential oil extraction and fragrance production, the extracted volatile compounds are used as additives in perfumes, cosmetics, and edible flavors, while the extracted essential oils are also used as antibacterial, antioxidant, and cytotoxic activities in medical consultations [1]. The volatile compounds in rose are mainly produced by the terpenoids biosynthesis pathway and phenylpropanoids/benzenoids metabolic pathway and to a lesser extent by fatty acid derivatives including lipoxygenase pathway products [2].
In rose, the terpenoids biosynthesis pathway is the main pathway for volatile compounds and contains two branches: (1) the 2-C-Methyl-D-Erythritol-4-Phosphate (MEP) pathway [3], which is mainly located in the plastids and produces monoterpenes and diterpenes [4]. (2) The mevalonate (MVA) pathway, mainly located in the cytoplasm, endoplasmic reticulum, and peroxisomes [5,6], produces volatile sesquiterpenes. The phenylpropanoids/benzenoids metabolic pathway is the second major synthetic pathway [4], both of which are derived from L-phenylalanine (L-Phe). The Phenylpropanoids are synthesized directly from L-phenylalanine, but most products acquire volatility only after acylation or methylation at the C9 position. Benzenoids are based on a branch of the phenylpropanoid pathway, and the cinnamic acid pathway, and are all volatile [7]. Only a few fatty acid derivatives are present in rose, such as leaf alcohol, cis-3-Hexenyl Acetate, hexyl acetate, and 4-hexen-1-ol acetate, but no related enzymes or genes have been isolated or identified from rose so far.
In our pre-laboratory GWAS and WGCNA results, we found that the gene RcCCD1 was associated with flower scent. Carotenoid cleavage dioxygenases (CCDs) are a widespread family of enzymes located downstream of the MEP pathway that is capable of mediating the cleavage of conjugated double bonds in carotenoid polyolefin chains [8], thus catalyzing the initial steps of natural active substance formation. The end products of its metabolism include naturally occurring active compounds such as natural flavor substances, volatile volatile compounds, the phytohormone abscisic acid (ABA), and solanum lactone (SL).
The CCD gene family can be further divided into two clades, carotenoid cleavage dioxygenases (CCD) and 9-cis-epoxycarotenoid dioxygenases (NCED) based on whether their substrates are oxidized [9]. In addition to this, a new group was identified from three species of tomato (Solanum lycopersicum) [10], strawberry (Fragaria vescv) [11], and apple (Malus domastica) [12], named CCD-Like (CCDL). Carotenoid cleavage dioxygenases all contain an RPE65 (retinal pigment epithelial membrane protein) domain where Fe2+ can activate the catalytic activity of the enzyme and four conserved histidines within CCDs can regulate its binding to Fe2+ [13,14]. ZmVP14 is the first CCD family gene identified in a plant species [15], which is associated with the synthesis of abscisic acid. Subsequently, nine homologs of ZmVP14 were identified in Arabidopsis, namely NCED2, NCED3, NCED5, NCED6, and NCED9 of the NCED clade (all involved in ABA synthesis) and CCD1, CCD4, CCD7, and CCD8 of the CCD clade [9]. Several carotenoids have been reported to be degraded to a variety of norisoprenoids, such as α-Ionone and β-Ionone, 6-methyl-5-hepten-2-one, Citral, Geranylactone, pseudoionone, 3- 3-Hydroxy-β-ionone, 5,6-Epoxy-3-hydroxy-β-ionone, Geranial, β-Cyclocitral, β-Citraurin, and Farnesyl acetone.
So far, 11, 12, 11, and 9 CCD family members have been identified in maize (Zea mays), sorghum (Sorghum bicolor), rice (Oryza sativa) [16], and grape (Vitis vinifera) [17], respectively. The CCD family has also been identified in several horticultural crops such as grape [18], tomato [10], apple [12] and are closely related to the biosynthesis of volatile compounds. However, the CCD gene family of the rose genome is still not reported, and only one gene, RdCCD1, has been reported, whose expression was associated with the accumulation of C13-norisoprenoids compounds in roses. Therefore, we performed a genome-wide analysis of the CCD gene family.
WGCNA was able to identify biologically important co-expression modules and target genes through correlation analysis between the co-expression module and target trait/phenotype [19]. In this study, the hybrid offspring of modern rose varieties R. hybrida ‘First blush’ and R. hybrida ‘Elle’, R. hybrida ‘tianmidemeng’ with super-parental floral fragrance, and R. hybrida ‘Chingge’ with normal floral fragrance were used as the experimental materials.
Based on the differential expression gene data of R. hybrida ‘tianmidemeng’ at three different flowering stages, R. hybrida ‘Elle’, R. hybrida ‘First blush’ and R. hybrida ‘Chingge’ at SF stage. With 18 volatile compounds detection amounts as the target traits, the gene co-expression network was constructed by WGCNA to explore the hub genes regulating volatile compound synthesis and metabolism in rose. A view to providing important references for the study of the regulation of rose flower scent synthesis, providing new insights and clues for further exploring the molecular mechanism of the CCD gene family in roses, and at the same time, providing ideas and genetic resources for variety improvement of rose flower scent by means of genetic engineering.

2. Materials and Methods

2.1. Identification and Characteristics of the CCD Gene Family in Rose Genome

In total, 45,469 proteins of rose genome (R. ‘Old Blush’) (https://www.rosaceae.org/species/rosa/all (accessed on 10 September 2022)) were searched for the Hidden Markov Model of the RPE protein super-family (RPE65/PF03055) by hmmsearch to retain sequences with E-value < 1 × 10⁻⁵, as candidates for CCD gene family members [20]. Twenty CCD family member sequences from O. sativa [16], A. thaliana [9,13], S. lycopersicum [10], and Z. mays VP14 [15] were used as queries to search for homologous sequences in 45,469 proteins of rose genome using the blastp program with E-value < 1 × 10⁻⁵ [12]. All of the results were combined to validate all candidate CCD gene sequences using MEME (https://meme-suite.org/meme/ (accessed on 12 September 2022)) and PfamScan (https://www.ebi.ac.uk/Tools/pfa/pfamscan/ (accessed on 12 September 2022)); sequences not containing conserved motifs or domains were removed. TBtools [21] was used to count the detailed information of RcCCD genes.

2.2. Chromosome Distribution and Collinearity Analysis

The rose genome annotation file (GFF3) was downloaded from the GDR website (Genome Database for Rosaceae) [22] and then the GFF3 information and gene ID list of RcCCDs were extracted to map the chromosome distribution using TBtools (v 1.108, Guangzhou, China). One Step MCScanX module in TBtools was used to identify collinear blocks; a simple Ka/Ks calculator module was used to calculate Ka/Ks values. Single-copy sequences were found using OrthoFinder (v.2.5.2, Oxford, England) [23].

2.3. Phylogenetic and CCD Gene Family Structure Analysis

ClustalW (v 2.0, Cambridge, England) [24] was used to perform multiple alignments of the amino acid sequences of candidate genes and 20 known CCD family genes (from O. sativa, A. thaliana, S. lycopersicum, and ZmVP14) (National Center for Biotechnology Information, https://www.ncbi.nlm.nih.gov/ (accessed on 10 September 2022)). Iqtree (v 1.6.12, Vienna, Austria) [25] was used to construct the phylogenetic tree with ML method, -MFP parameter was used to find the optimal amino acid substitution model and 1000 bootstrap replicates. TBtools [21] was used to show phylogenetic trees, MEME motifs, pfam domain, and gene structure.

2.4. Expression of RcCCD Genes in Floral Organs of R. hybrida at Three Flower Developmentstages

Nine sets of transcriptome data from three flower development stages of R. hybrida ‘tianmidemeng’ were used for differential expression analysis. (EF: early-flowering, SF: semi-flowering, LF: late-flowering) (NCBI database, BioProject PRJNA667625, SraAcc SRR12779319, SRR12779320, SRR12779321, SRR12779322, SRR12779323, SRR12779324, SRR12779325, SRR12779326, and SRR12779327) [26]. Transcriptome data were first quality-controlled using Trimmomatic (v.0.35, Düsseldorf, Germany) [27] before assembling a reference-guided transcriptome using HISAT2 (v2.0.4, Baltimore, MD, USA) [28]. Expression levels were then calculated using StringTie2 (v2.1.5, Baltimore, MD, USA) [29], and differential expression analysis was performed using DESeq2 (v1.20.0, Heidelberg, Germany) in R [30].

2.5. Weighted Gene Co-Expression Network Analysis, WGCNA

We performed differential expression analysis of transcriptome data of R. hybrida ‘tianmidemeng’ at three flower development stages (EF, SF, LF), R. hybrida ‘Elle’, R. hybrida ‘First blush’, and R. hybrida ‘Chingge’ at the SF stage, available in our laboratory, and obtained a total of 11,679 differentially expressed genes, and these differential genes were used for gene co-expression network analysis. The GC-MS data used in this paper come from Shi’s paper [26], which contains 18 volatile compounds. These include R. hybrida ‘tianmidemeng’ in three flower development stages (EF, SF, LF), R. hybrida ‘Elle’, R. hybrida ‘First blush’, and R. hybrida ‘Qingge’ were in the SF stage.
Weighted gene co-expression network analysis was performed using the R software WGCNA package [31], and the optimal soft threshold (β) was determined according to the scale-free network principle. Co-expression networks were constructed using the automatic network construction function blockwiseModules to obtain co-expression modules, limiting the minimum number of modules to 100 genes (minModuleSize = 100), constructing the network type as networkType = “unsigned”, and subsequently merging modules with module Eigengenes value correlation > 0.75 (mergeCutHeight = 0.25). merged.
The module Eigengenes values of each module were obtained by calculating the Pearson correlation between the gene co-expression modules and the 18 volatile compound detected amount.
In this study, gene co-expression modules with correlation coefficients r ≥ 0.7 and modules containing RcCCDs were used as candidate target modules, and KEGG functional enrichment analysis was performed, while the top 10% of connectivity, kME > 0.8, and top 500 genes weighted within a single module were used as criteria to screen genes within hub modules. Finally, Cytoscape software (v 3.7.1, Washington, DC, USA) was used to visualize the gene co-expression regulatory network within the target modules [32].

3. Results

3.1. Identification and Characterization of the CCD Gene Family in Rose

We found 15 and 13 CCD genes from the rose genome by hmmsearch and blastp programs, respectively, and obtain a total of 15 CCD family genes by verifying against the conserved motifs and domains in the MEME and PFam databases about the CCD family, all of which contained the RPE65 domain. Fifteen CCD family genes were named according to the motif type, blastp results, and the number of introns and exons. At the same time, 15 RcCCDs were classified into three clades: nine for the CCD clade (RcCCD1, RcCCD4, RcCCD7, RcCCD8), four for the NCED clade (RcNCED3, RcNCED6) and two for the CCD-LIKE clade (RcCCD-like). (Table S1, Figure 1, Figure 2 and Figure 3). The number of amino acids in the RcCCDs varied greatly, with the longest being 688 amino acids (RcNCED3_2) and the shortest being 149 aa (RcCCD7_4), containing an average of 524.13 aa.

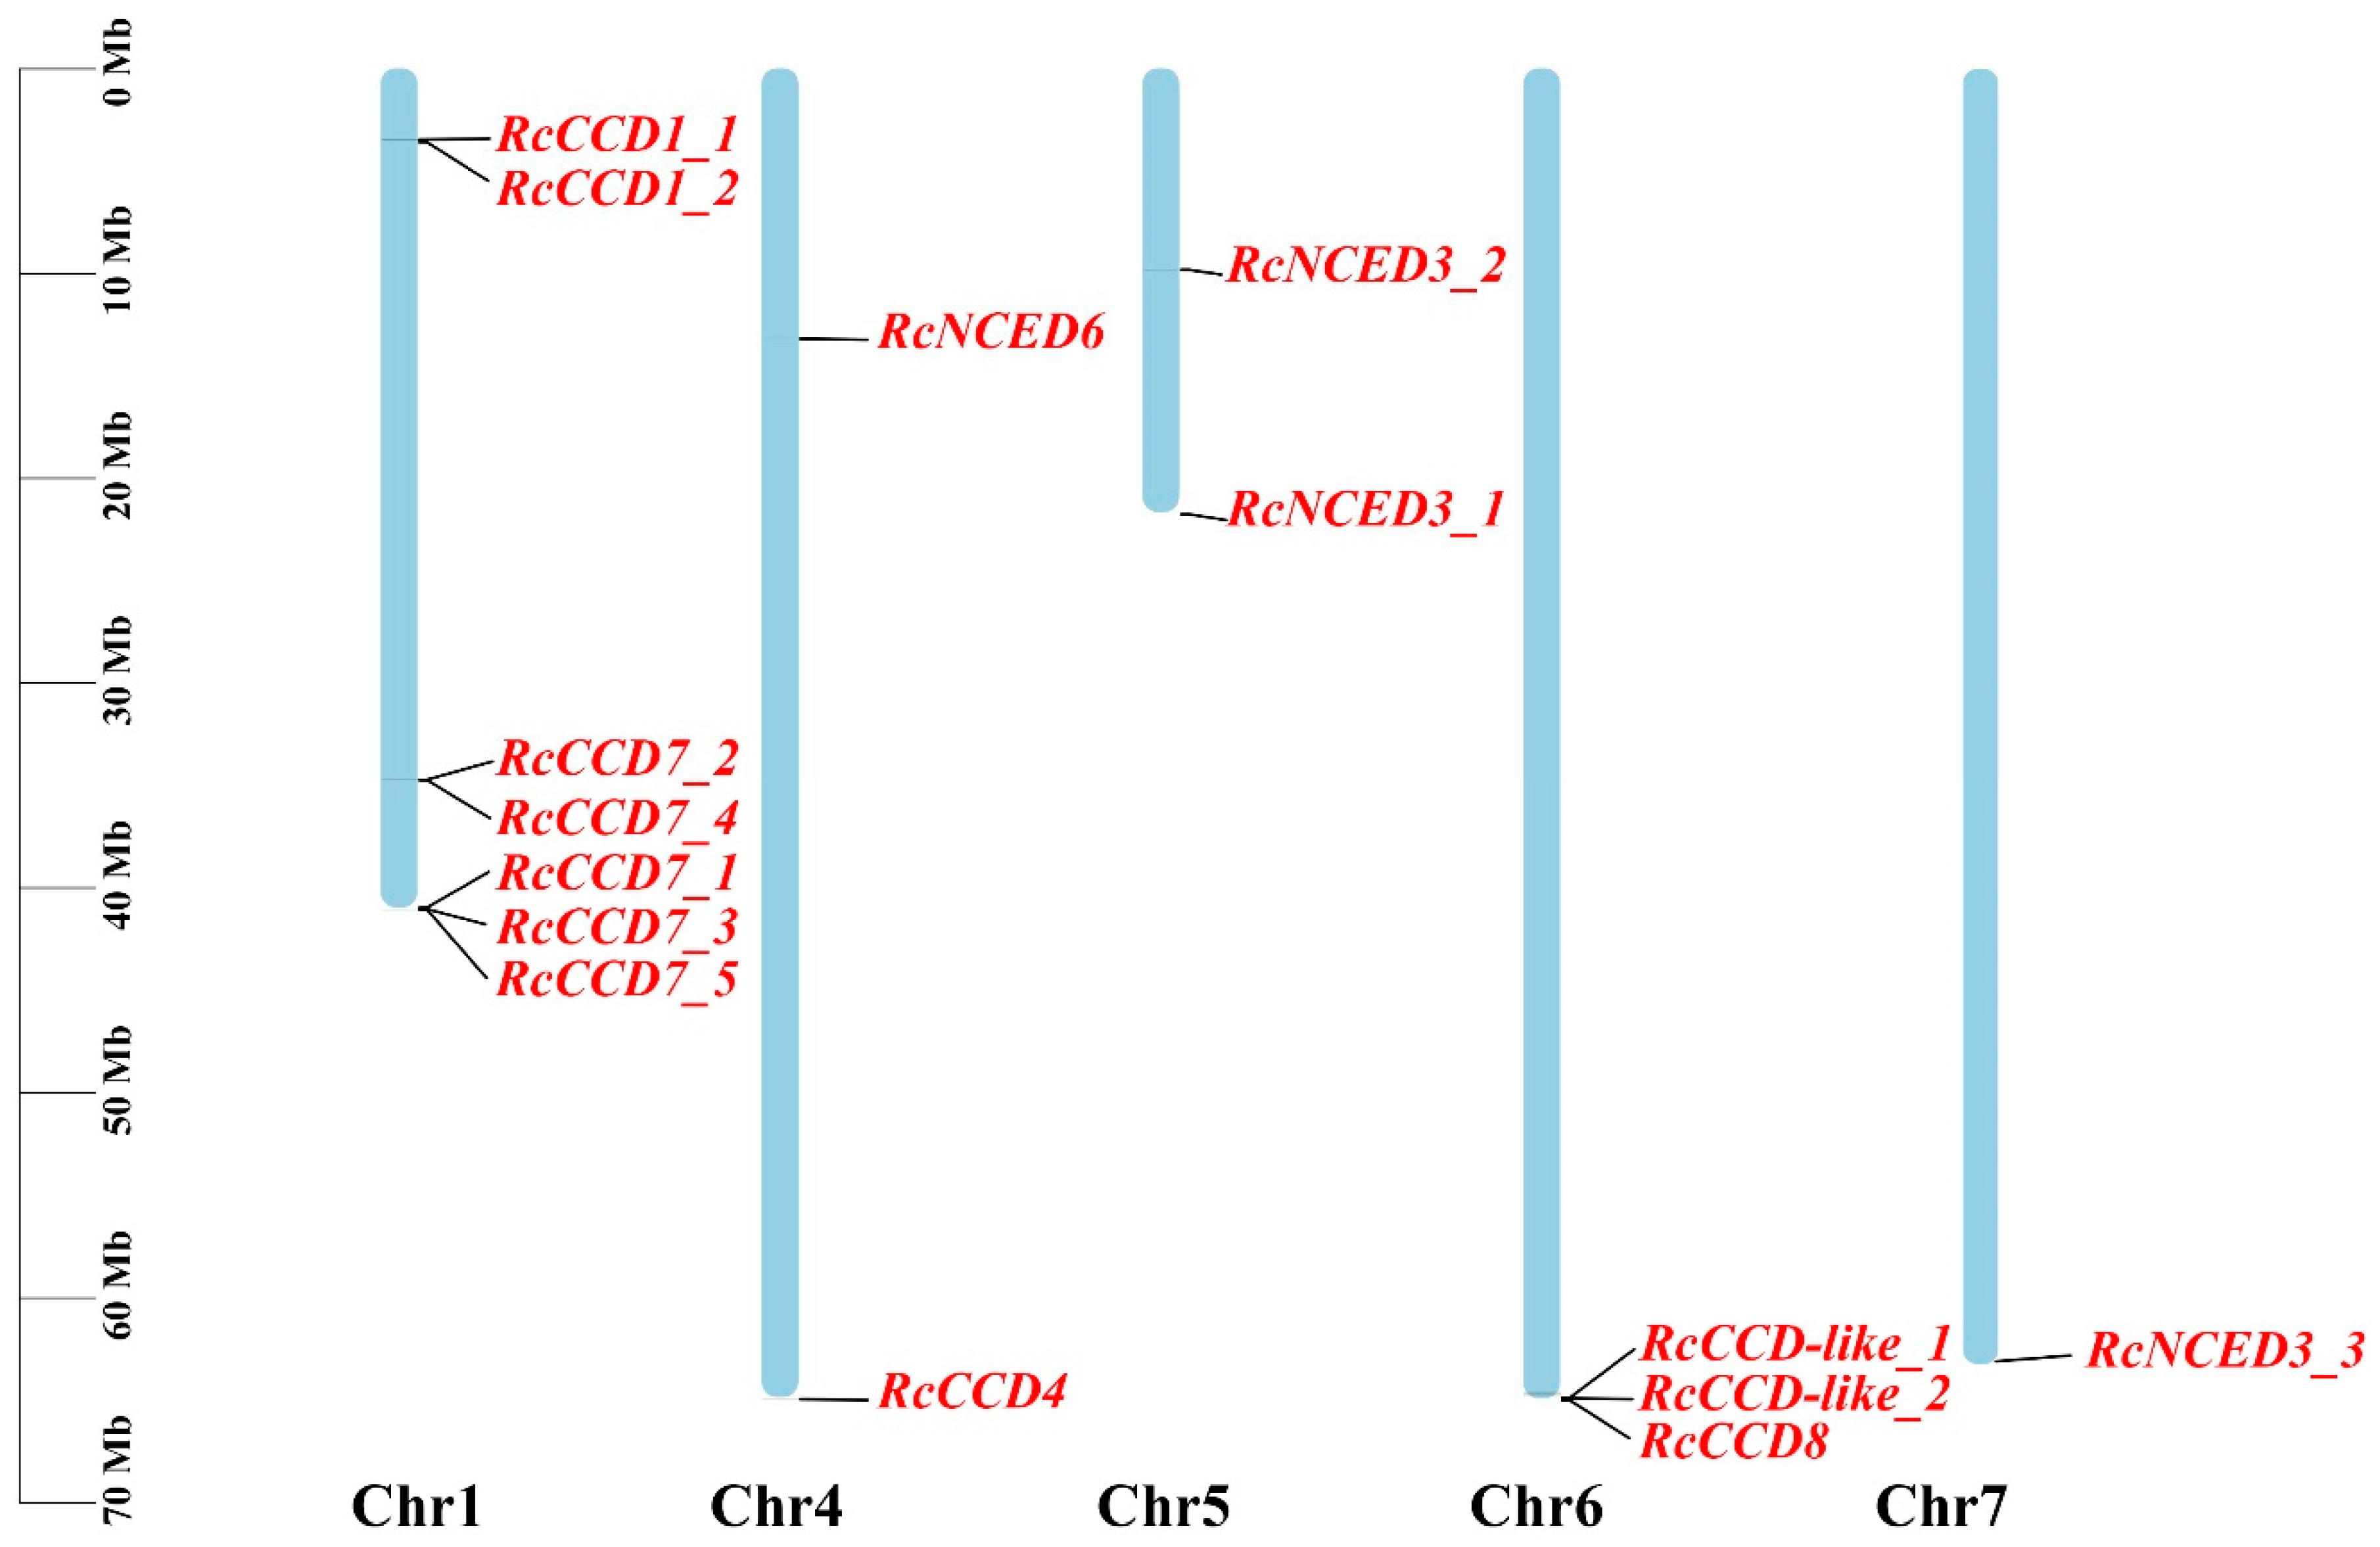
3.2. Chromosomal Locations and Microsynteny

RcCCDs are distributed on chromosomes 1, 4, 5, 6, and 7 in rose, and their distribution was location specific, which is concentrated at both ends of the chromosome, especially at the bottom, except for RcNAED3_2. All CCD and CCD-like clade genes were located on chromosomes 1 and 6 except RcCCD4. The distribution of the NCED clade was fragmented and not concentrated on one chromosome, with distribution on chromosomes 4, 5, and 7 (Figure 1).
We further investigated the synteny of the rose genome and found that there were no paralogous genes and no genome-wide duplication events in RcCCDs. Eleven RcCCDs were single-copy genes, and their repeat sequences were mainly dispersed and tandem repeats (Table S1). We subjected 15 RcCCDs to mutual blastp, analyzed the ratio of nonsynonymous (Ka) to synonymous (Ks) nucleotide substitutions (Ka/Ks) between homologous gene pairs of two RcCCD1 (RcCCD1_1, RcCCD1_2), three RcNCED3 (RcNCED3_1, RcNCED3_2, RcNCED3_3), five RcCCD7 (RcCCD7_1, RcCCD7_2, RcCCD7_3, RcCCD7_4, RcCCD7_5), and found that Ka/Ks < 1 for seven gene pairs, indicating that homologous RcCCD genes may have undergone selective pressure for purification during evolution (Table S2).

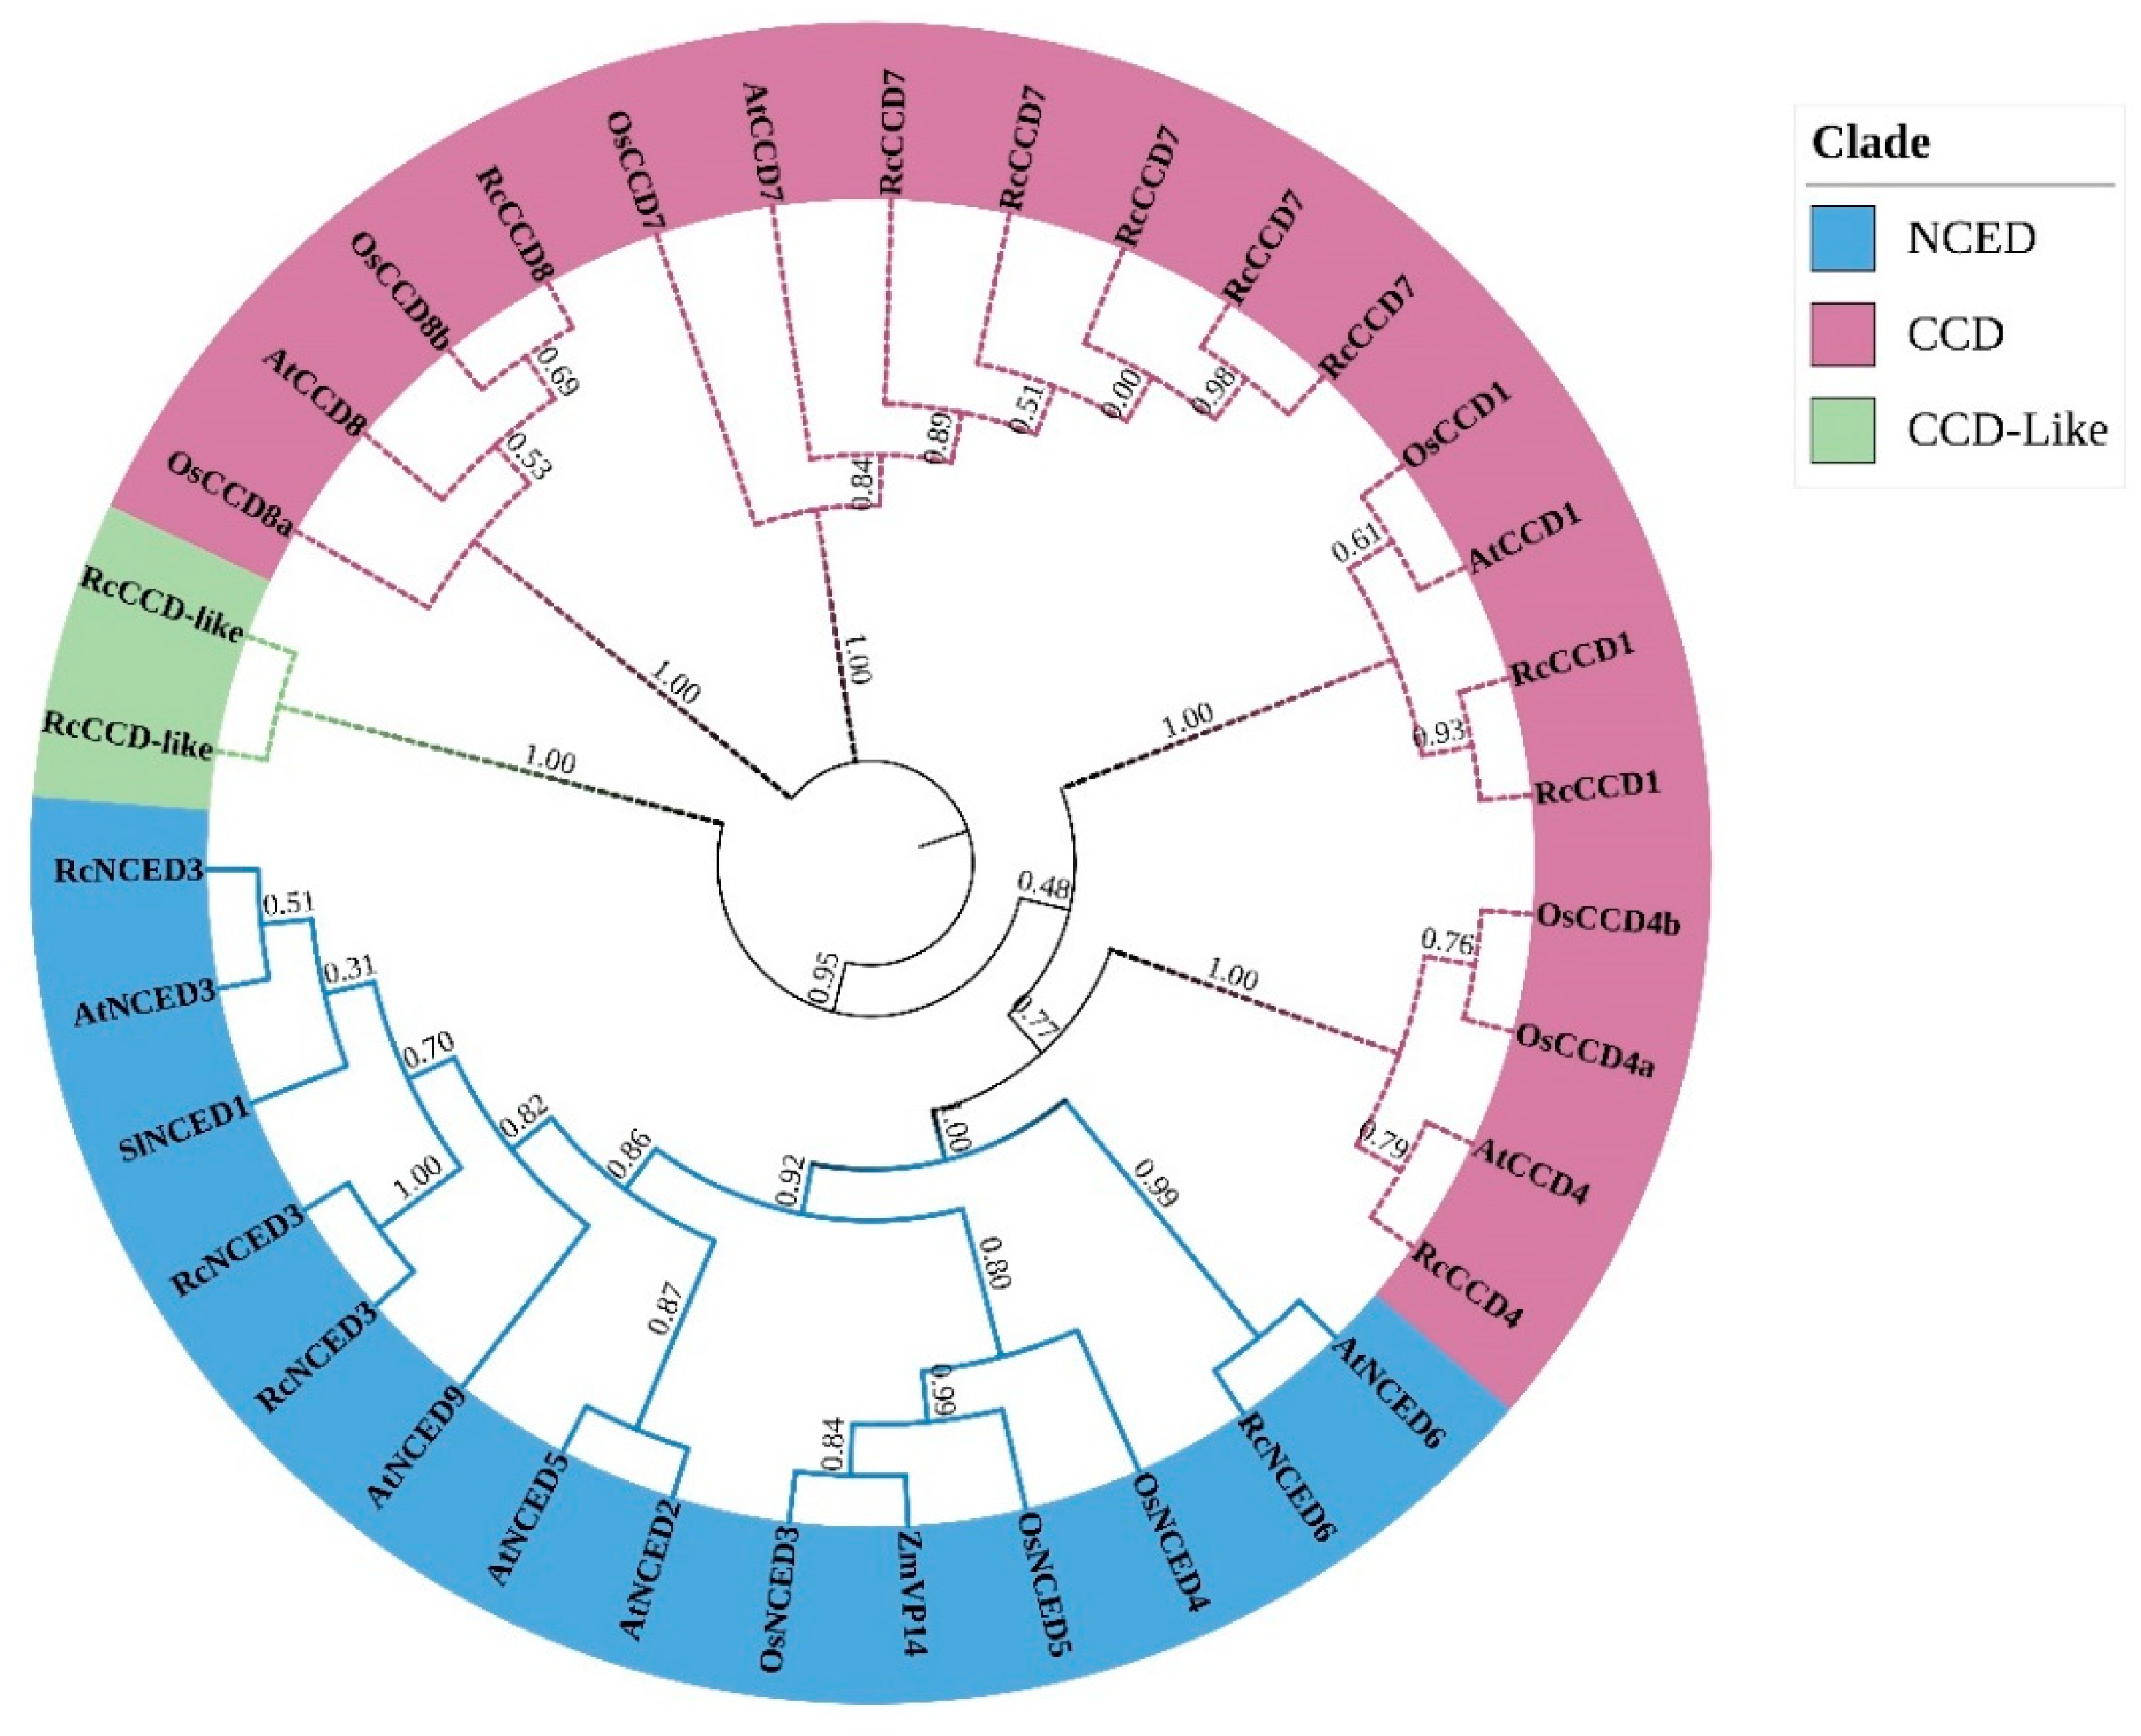
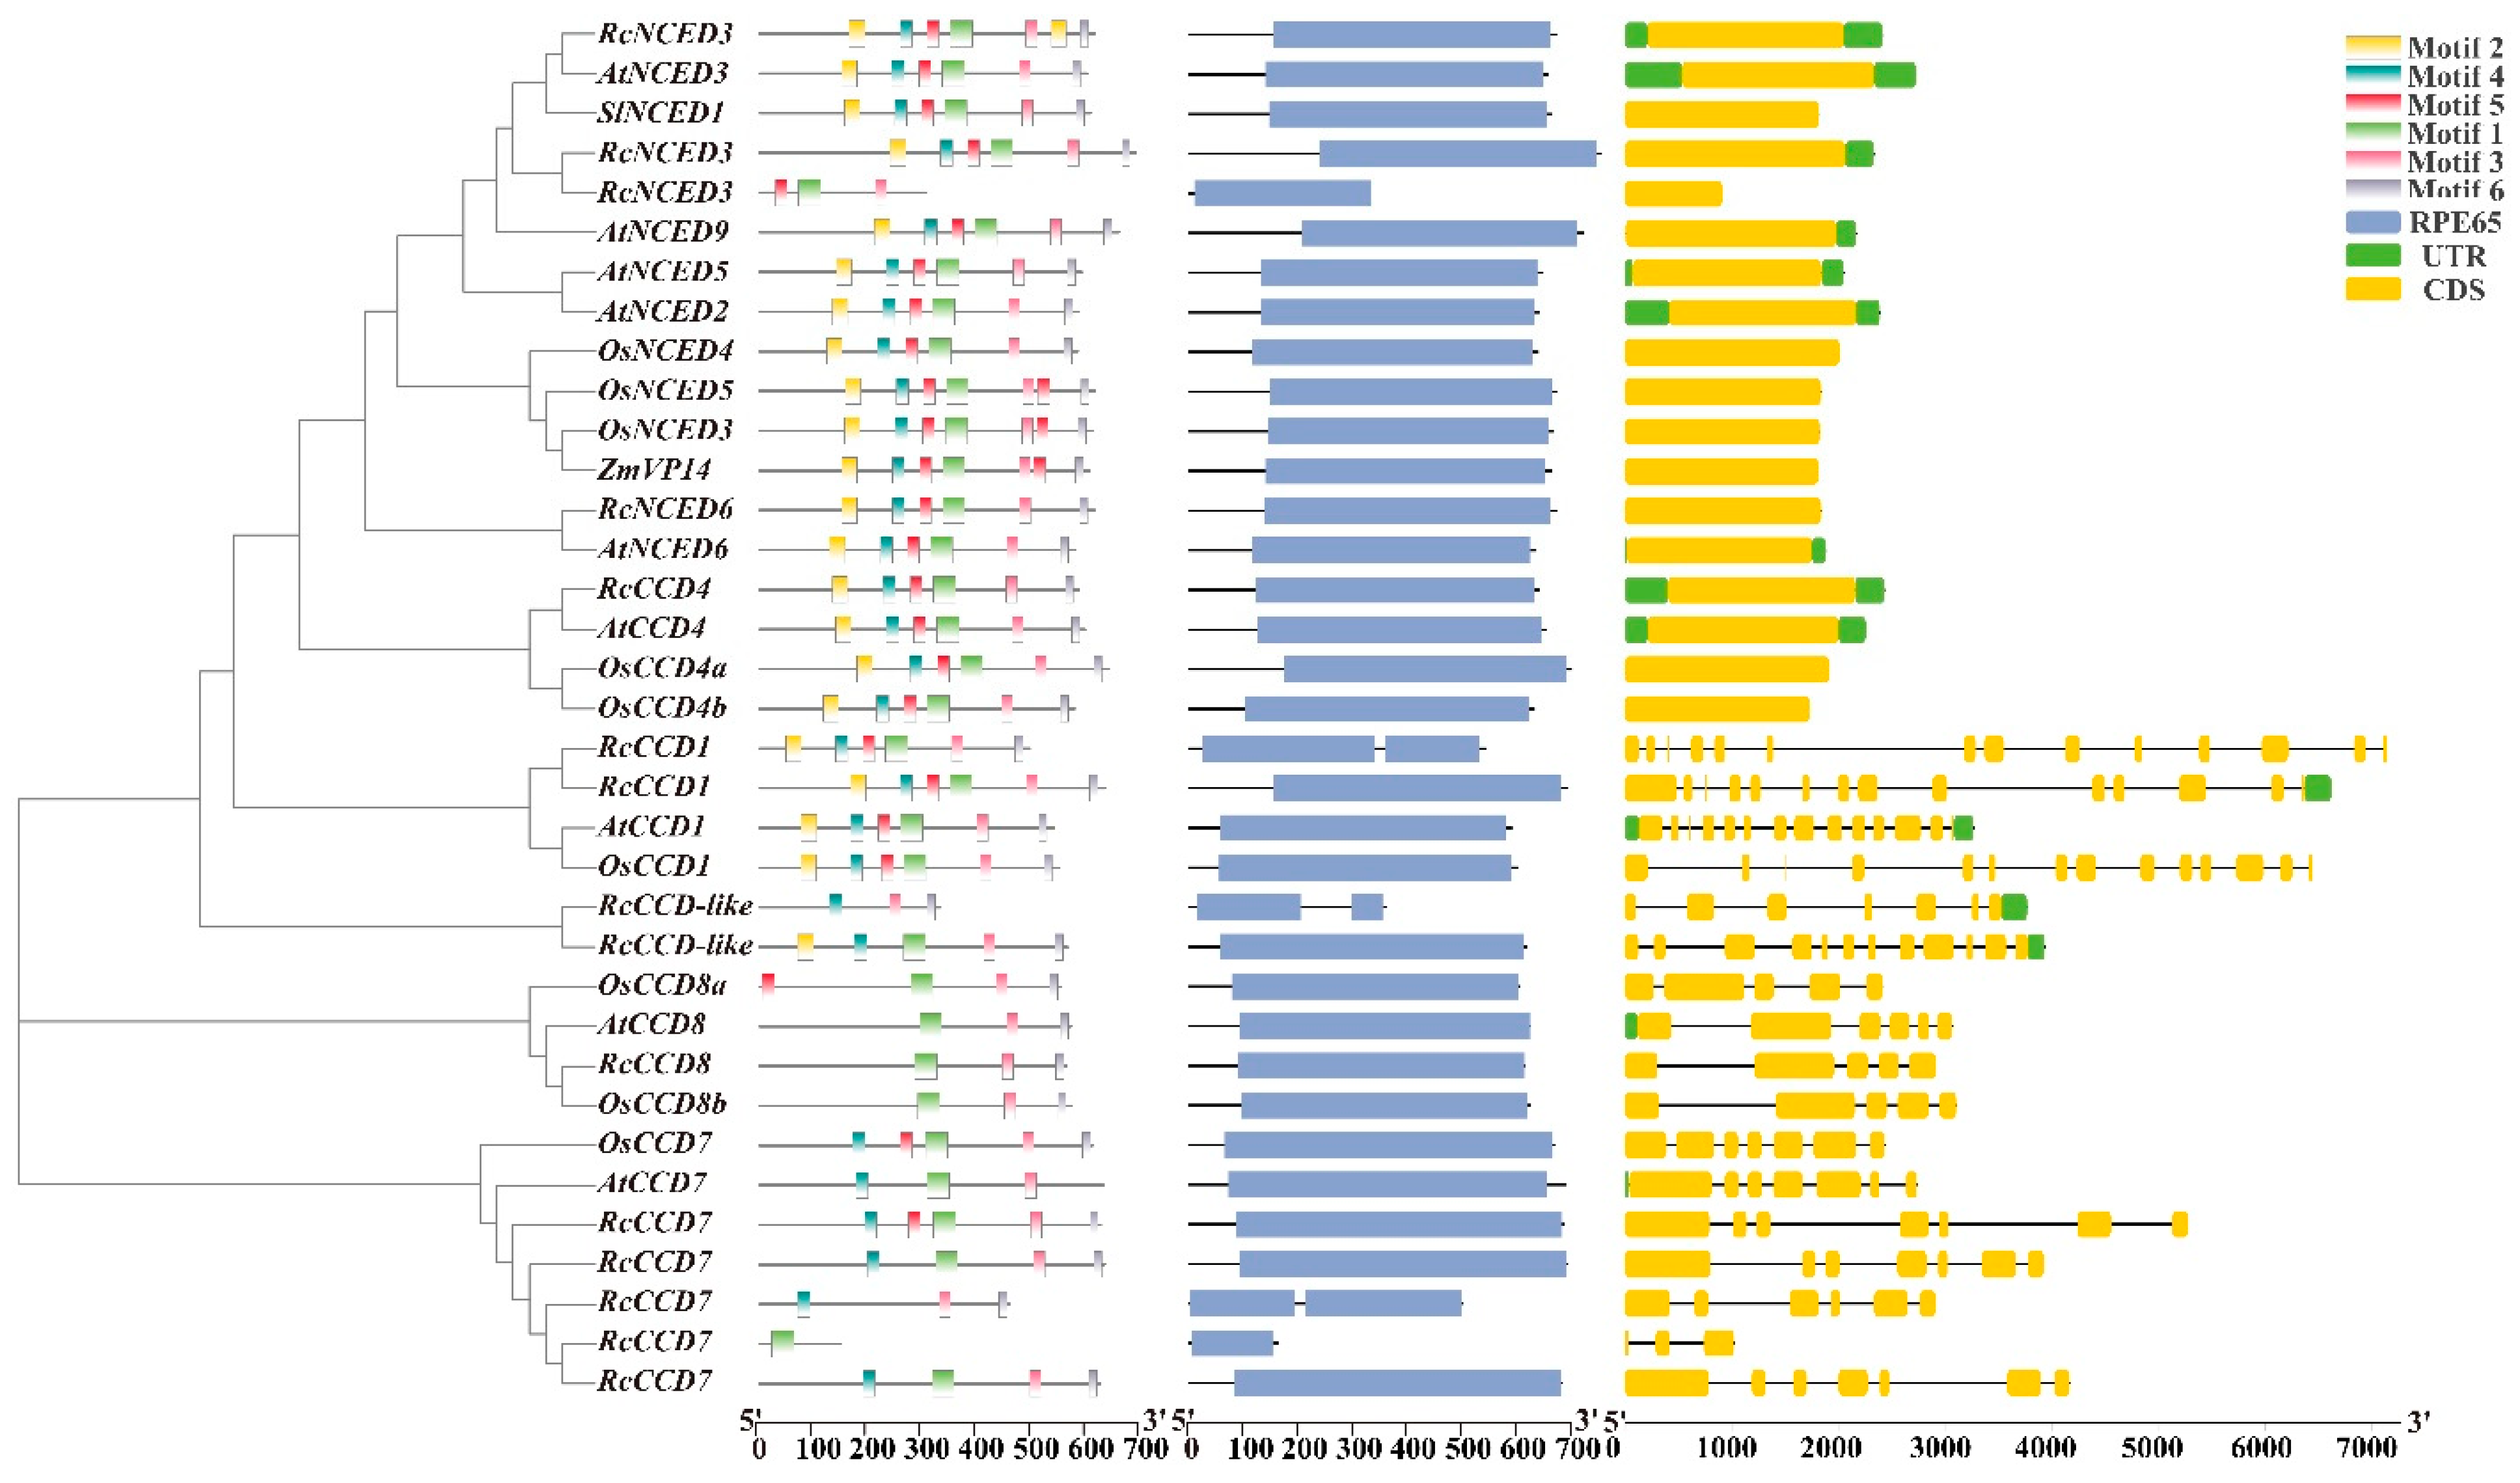
3.3. Phylogenetic Tree and Sequence Structure Analysis of Rose CCD Genes

We used the maximum likelihood method (ML), JTT amino acid substitution model to construct tree (Figure 2). In Arabidopsis, there are nine AtCCDs, four members of the CCD clade (AtCCD1, AtCCD4, AtCCD7, AtCCD8), and five members of the NCED clade (AtNCED2, AtNCED3, AtNCED5, AtNCED6, AtNCED9) [9]. There are also nine OsCCDs in rice, six in the CCD clade (OsCCD1, OsCCD4a, OsCCD4b, OsCCD7, OsCCD8a, OsCCD8b) and three in the NCED clade (OsNCED3, OsNCED4, OsNCED5).
Fifteen RcCCDs were named and grouped according to motif type, blastp results, and the number of introns and exons as well as groupings with known genes. The NCED clade all clustered together (blue part of Figure 2), they all contained six motifs (except RcNCED3_2) and did not contain intron structures. CCD clades were also clustered together (Figure 2 purple), while RcCCD1, RcCCD4, RcCCD7, and RcCCD8 can each be separated into separate CCDs. RcCCD1 contained 6 motifs and 13 introns; RcCCD4 contained 6 motifs and no intron; RcCCD7 contained motif1 and 5–6 introns (except RcCCD7_3); RcCCD8 contained motif1, motif3, motif6 and 4–5 introns. CCD-like (green part of Figure 2) contained motif3, motif4, motif6 (Figure 3).

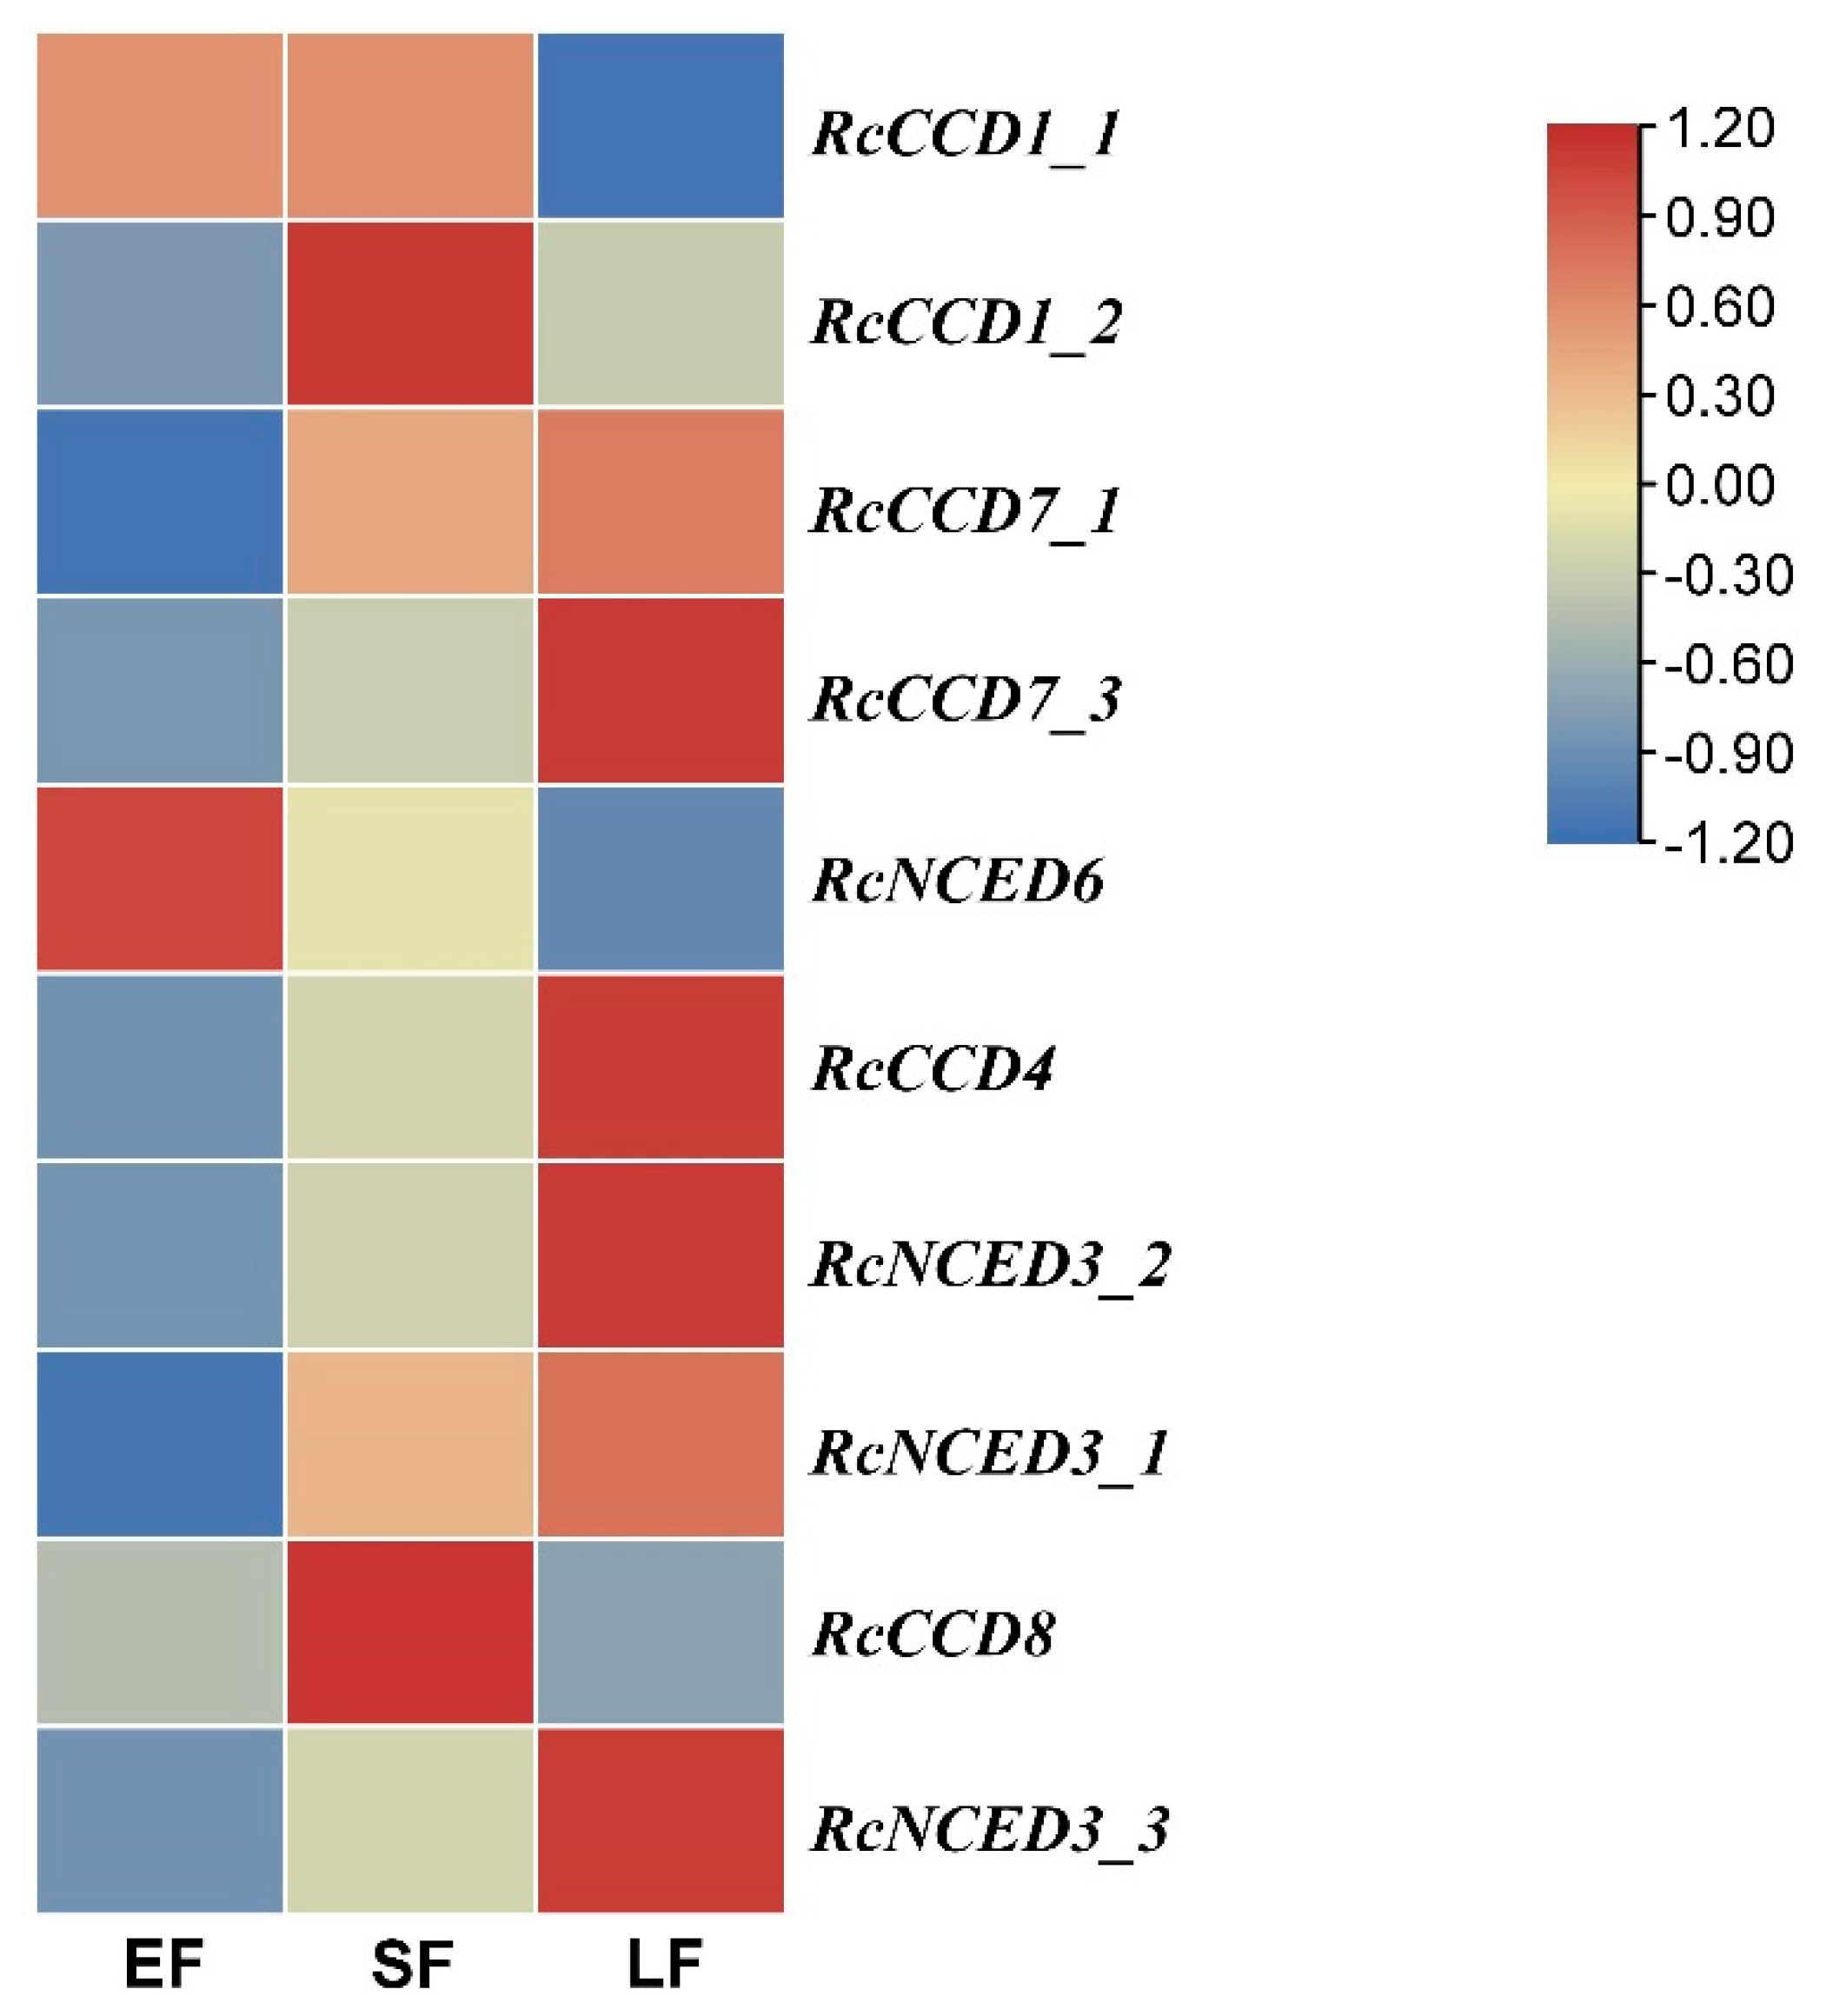
3.4. Expression of RcCCD genes in Floral Organs of R. hybrida ‘Tianmidemeng’ at Three Flower Development Stages

Carotenoid cleavage dioxygenases (CCD) genes were key enzyme genes in the carotenoid degradation process, in which the dioxygenase cleavage pathway (CCD metabolic pathway) mainly formed a series of volatile compounds and was also related to the coloration of fruit and flower organs. Based on the transcriptome data available in our team for R. hybrida ‘tianmidemeng’ at three flowering stages, we performed differential expression analysis to investigate the dynamic changes of RcCCDs during flowering (EF: early-flowering, SF: semi-flowering, LF: late-flowering).
Ten genes (RcCCD1_1, RcCCD1_2, RcCCD4, RcCCD7_1, RcCCD7_3, RcCCD8, RcNCED3_1, RcNCED3_2, RcNCED3_3, RcNCED6) were differentially expressed at three stages. Among them, RcCCD4, RcCCD7_1, RcCCD7_3, RcNCED3_1, RcNCED3_2, RcNCED3_3 were significantly up-regulated in the SF stage, and RcCCD7_1, RcCCD7_3, RcNCED3_1, RcNCED3_2, RcNCED3_3 were significantly down-regulated in the LF stage, which was consistent with the accumulation of volatile compounds. This indicated that these genes may be involved in the biosynthesis of volatile compounds (Table S3, Figure 4).
The expression of RcCCD1_2 increased gradually from EF to SF and then to the LF stage and was significantly higher in the LF stage, which was different from the expression patterns of RcCCD4, RcCCD7, and RcNCED3. It has been reported that the expression of CpCCD1 in summer squash (Cucurbita pepo) [33] also showed an elevated trend during the flowering process. Among the fifteen RcCCDs, eight genes were detected at EF, SF, and LF stages by qRT-PCR. Among them, six genes were detected in EF, SF, and LF simultaneously, and their expression trends were the same as the RNA-seq, which proved that the transcriptome data were accurate and reliable (Figure 5).

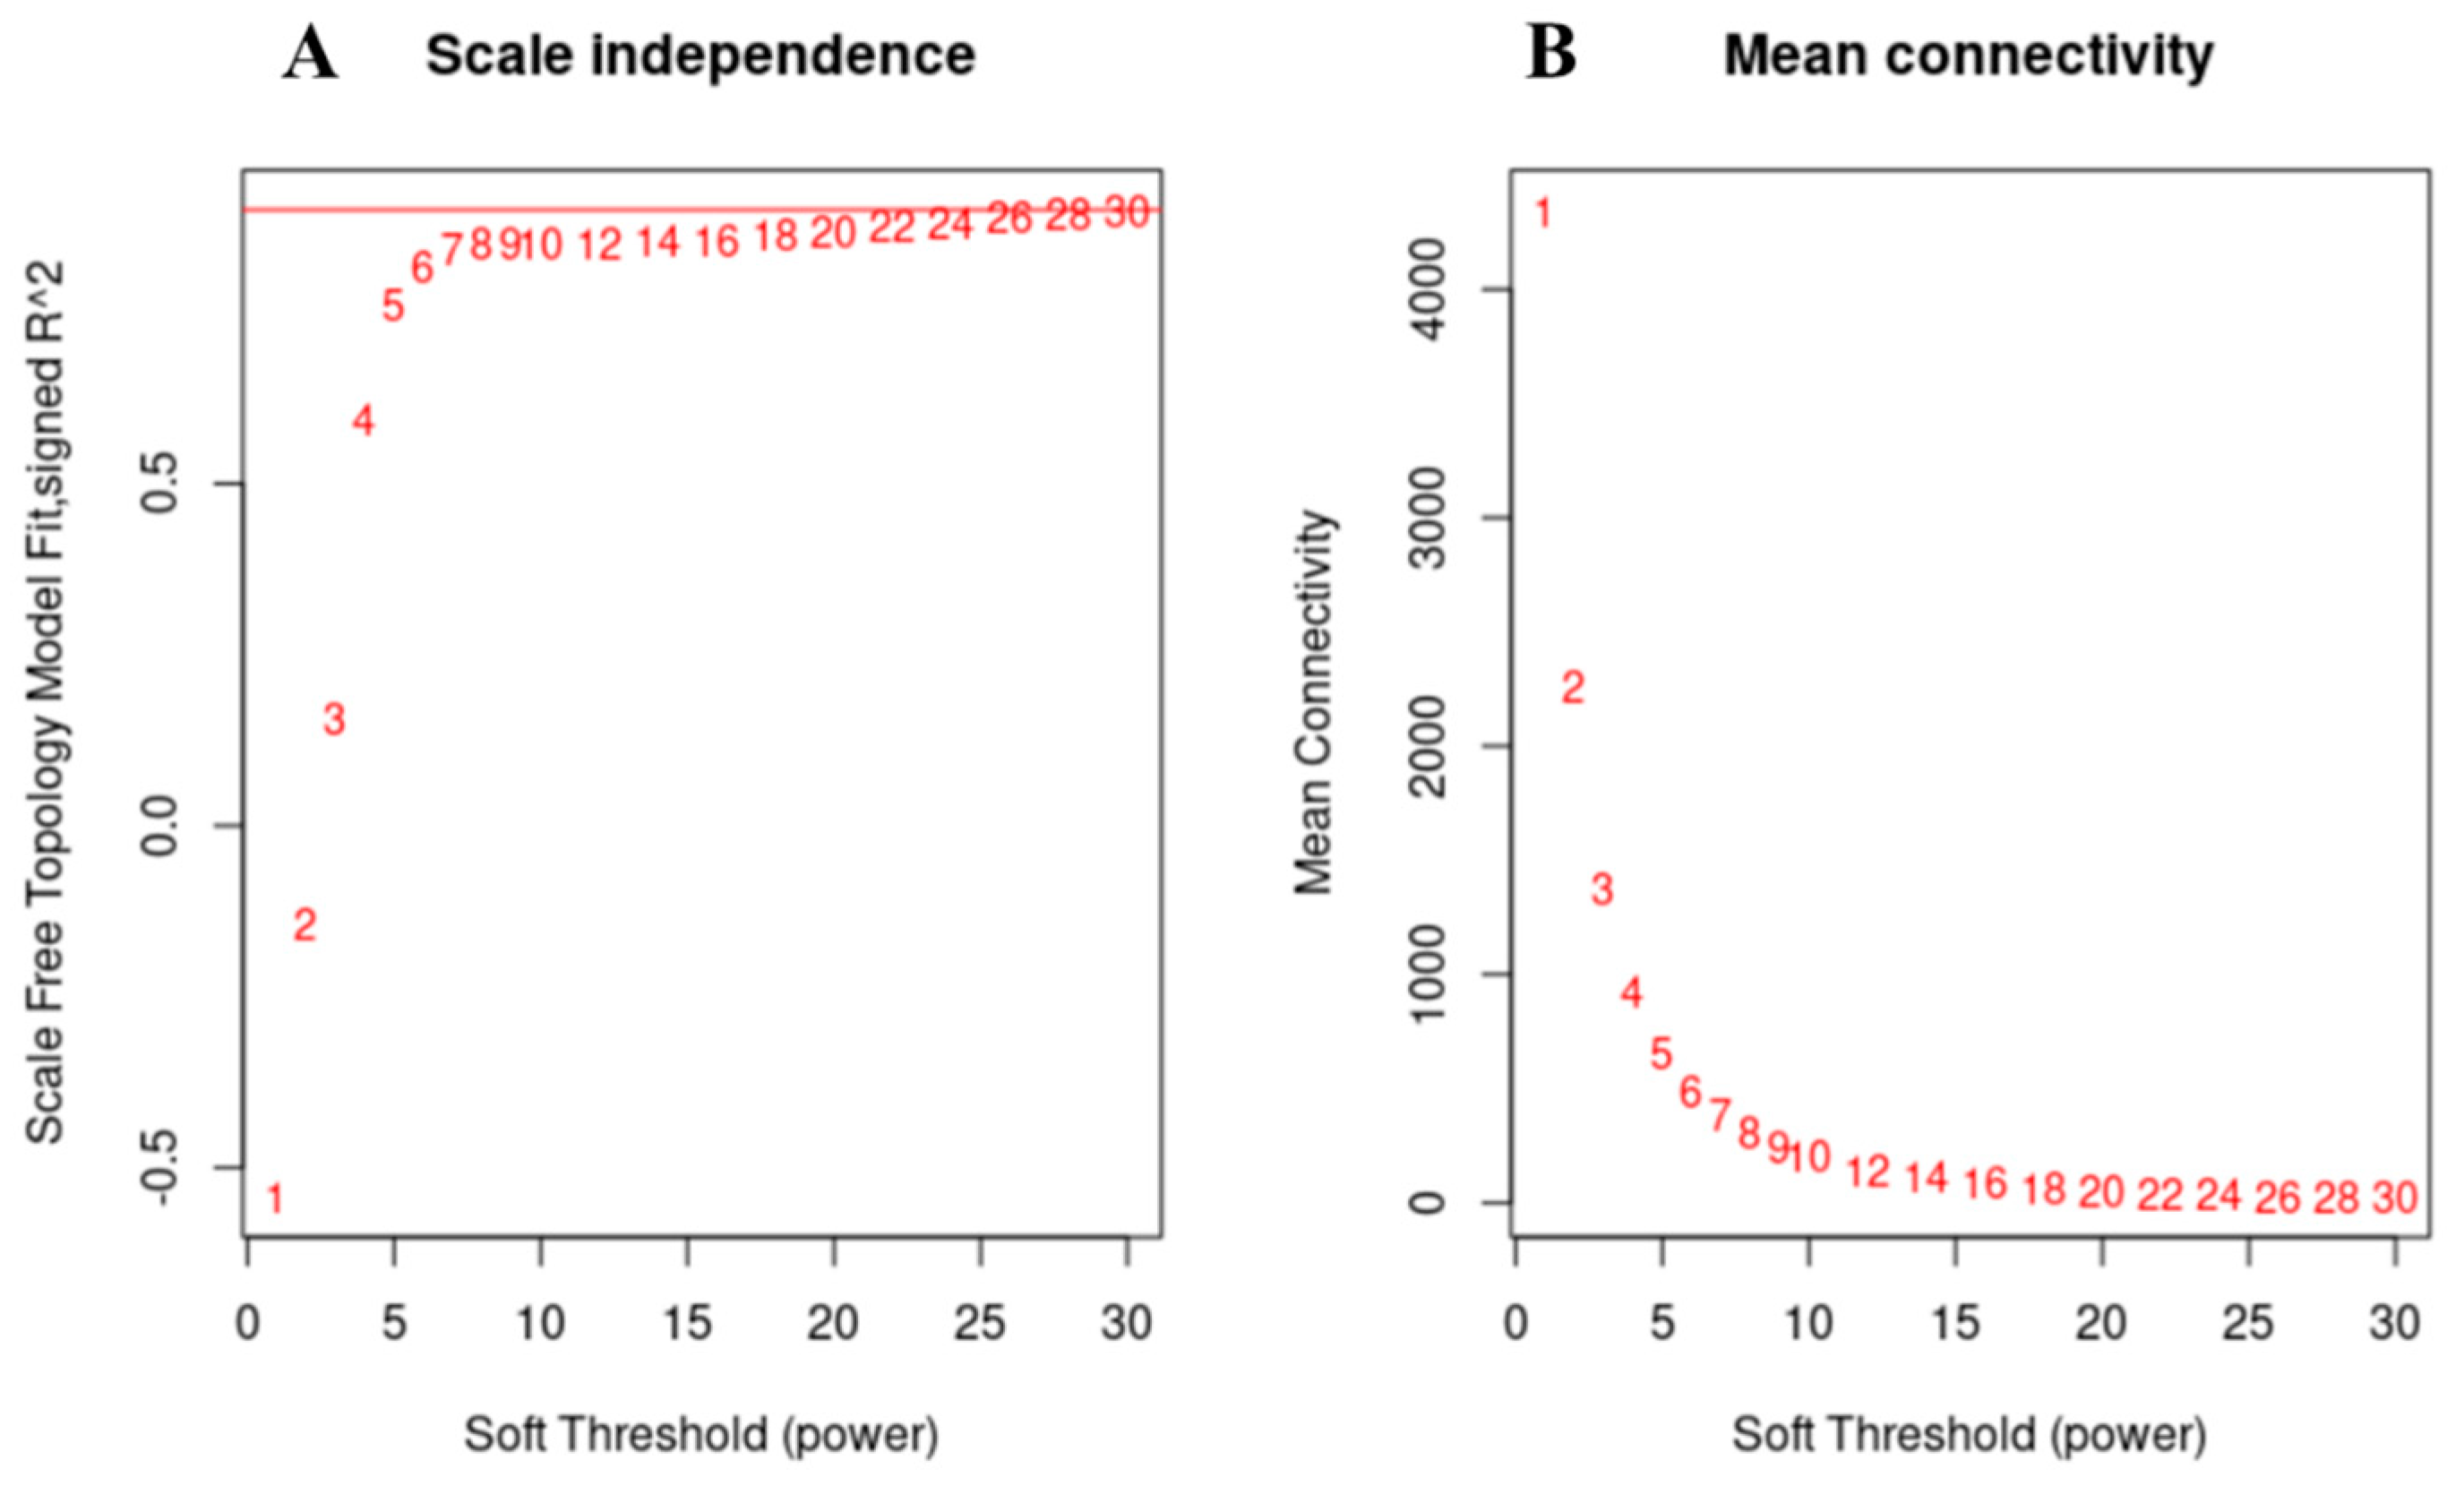
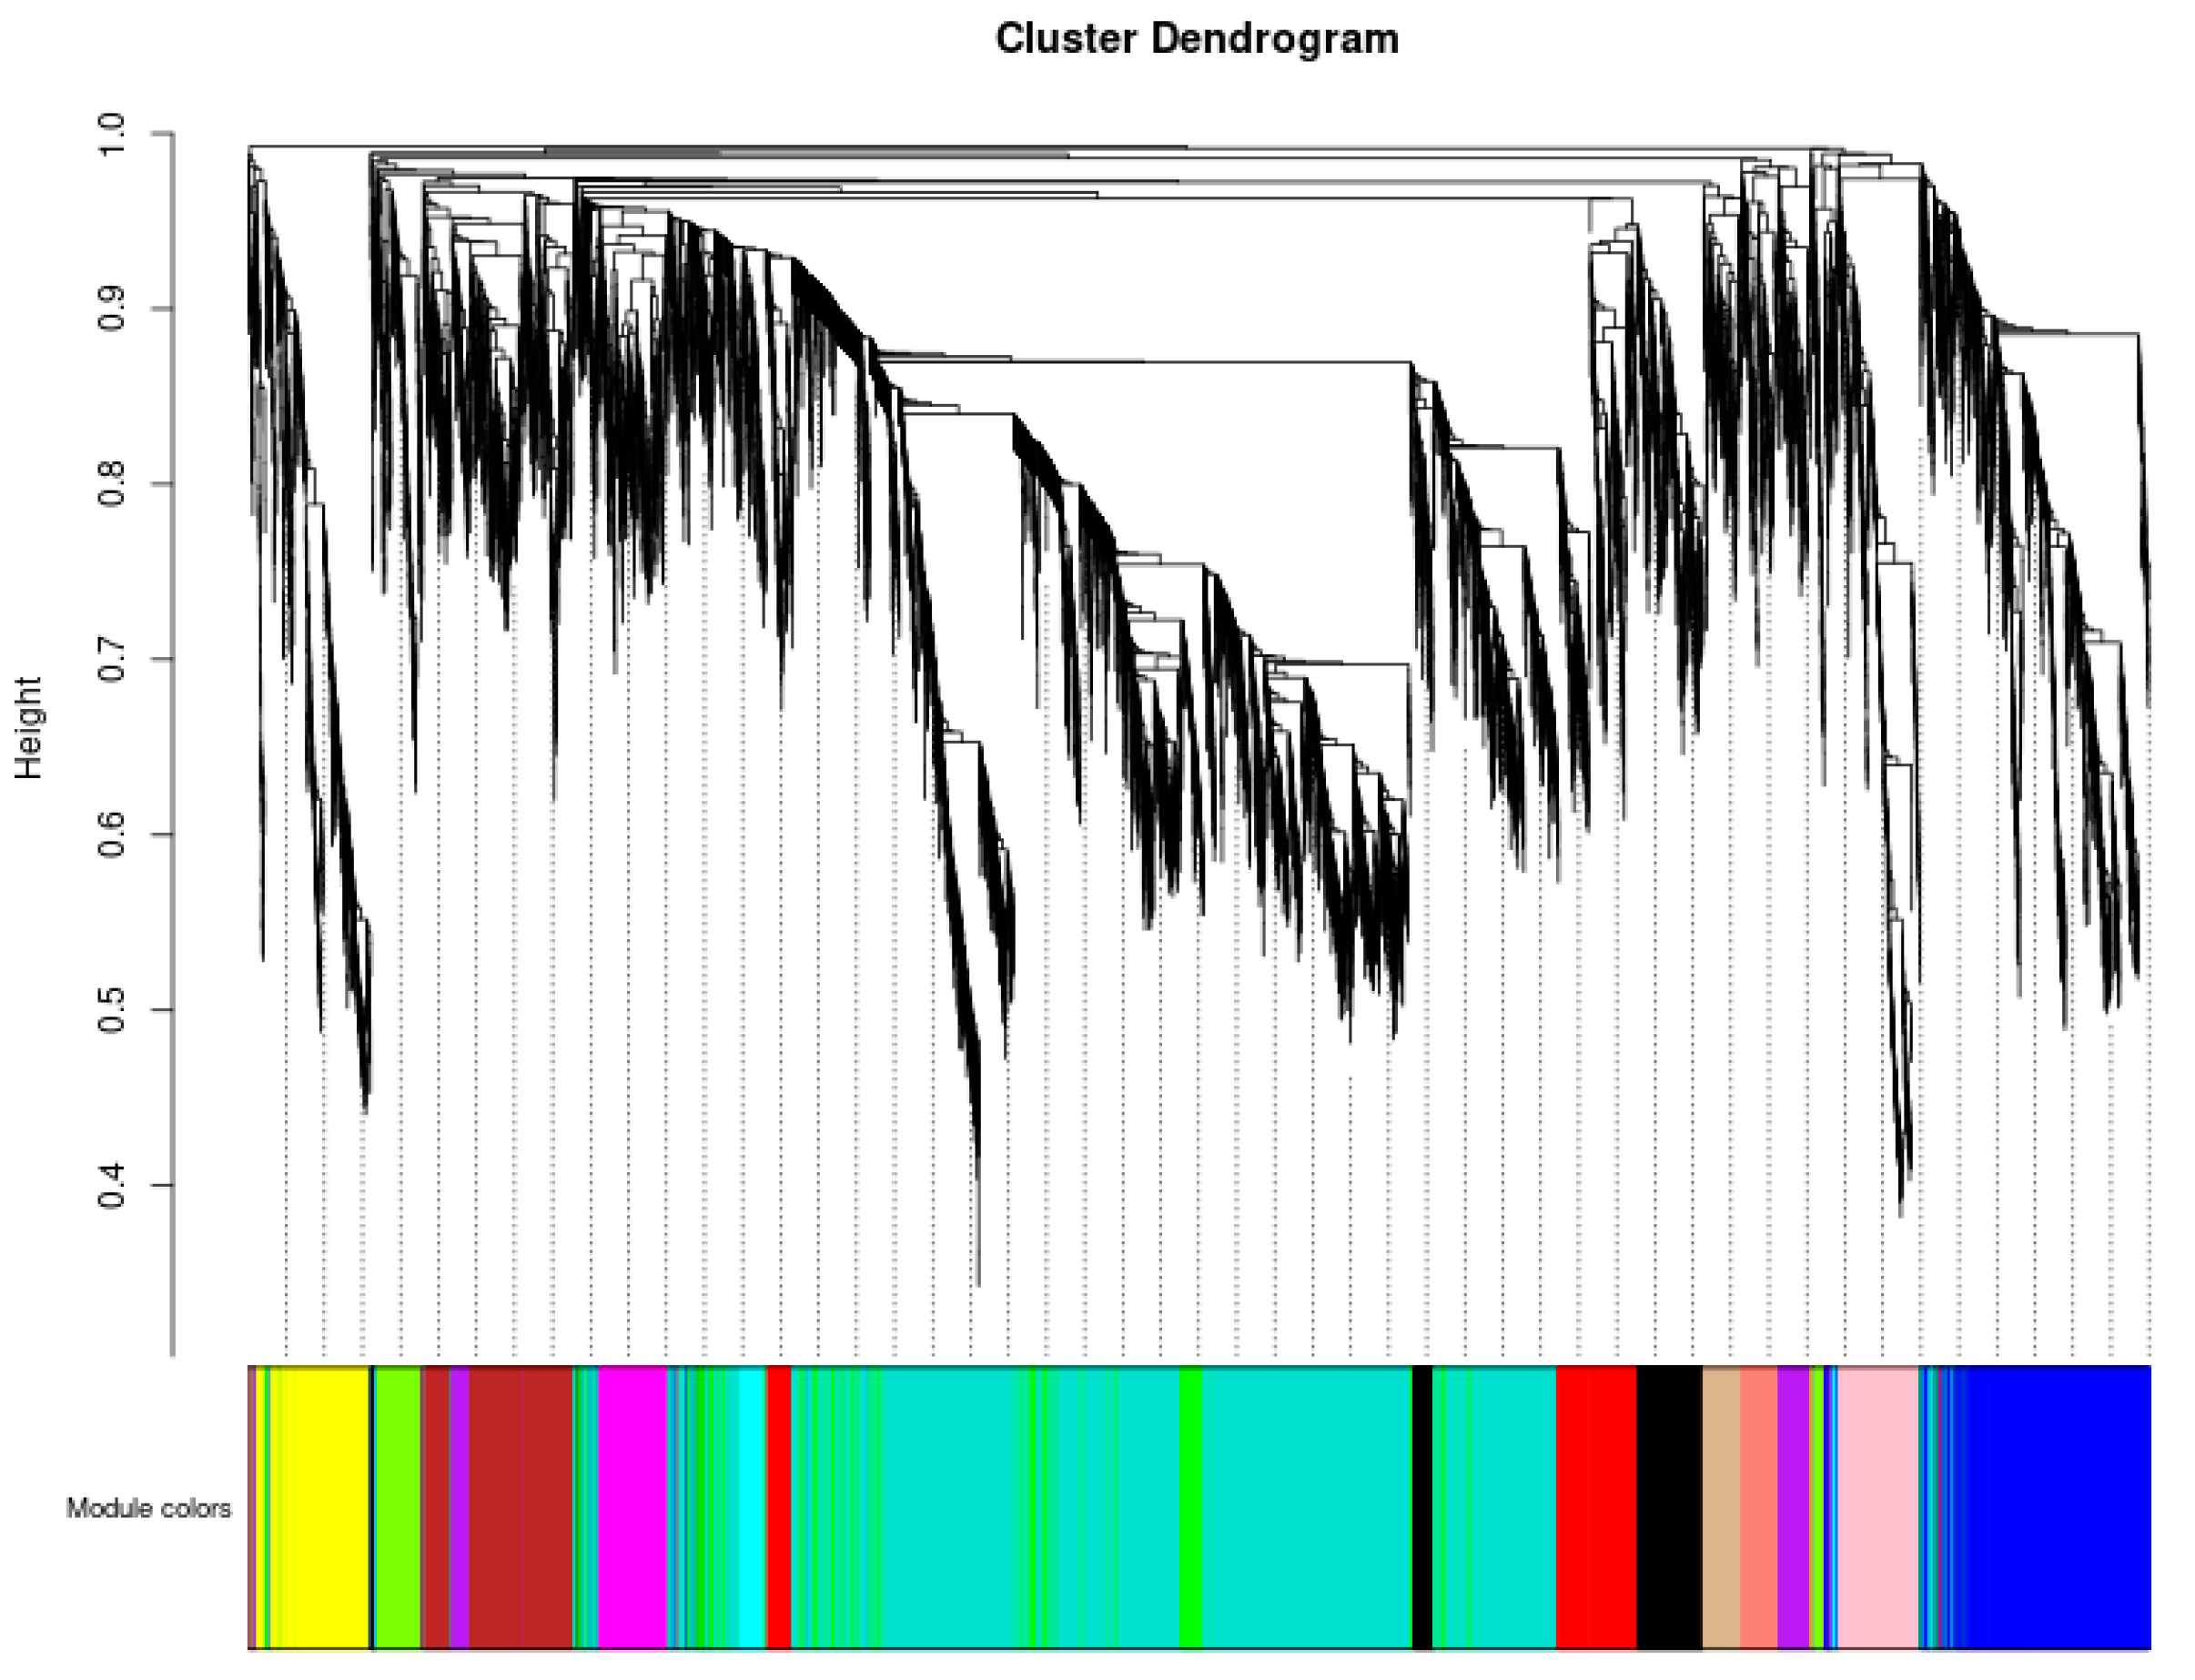
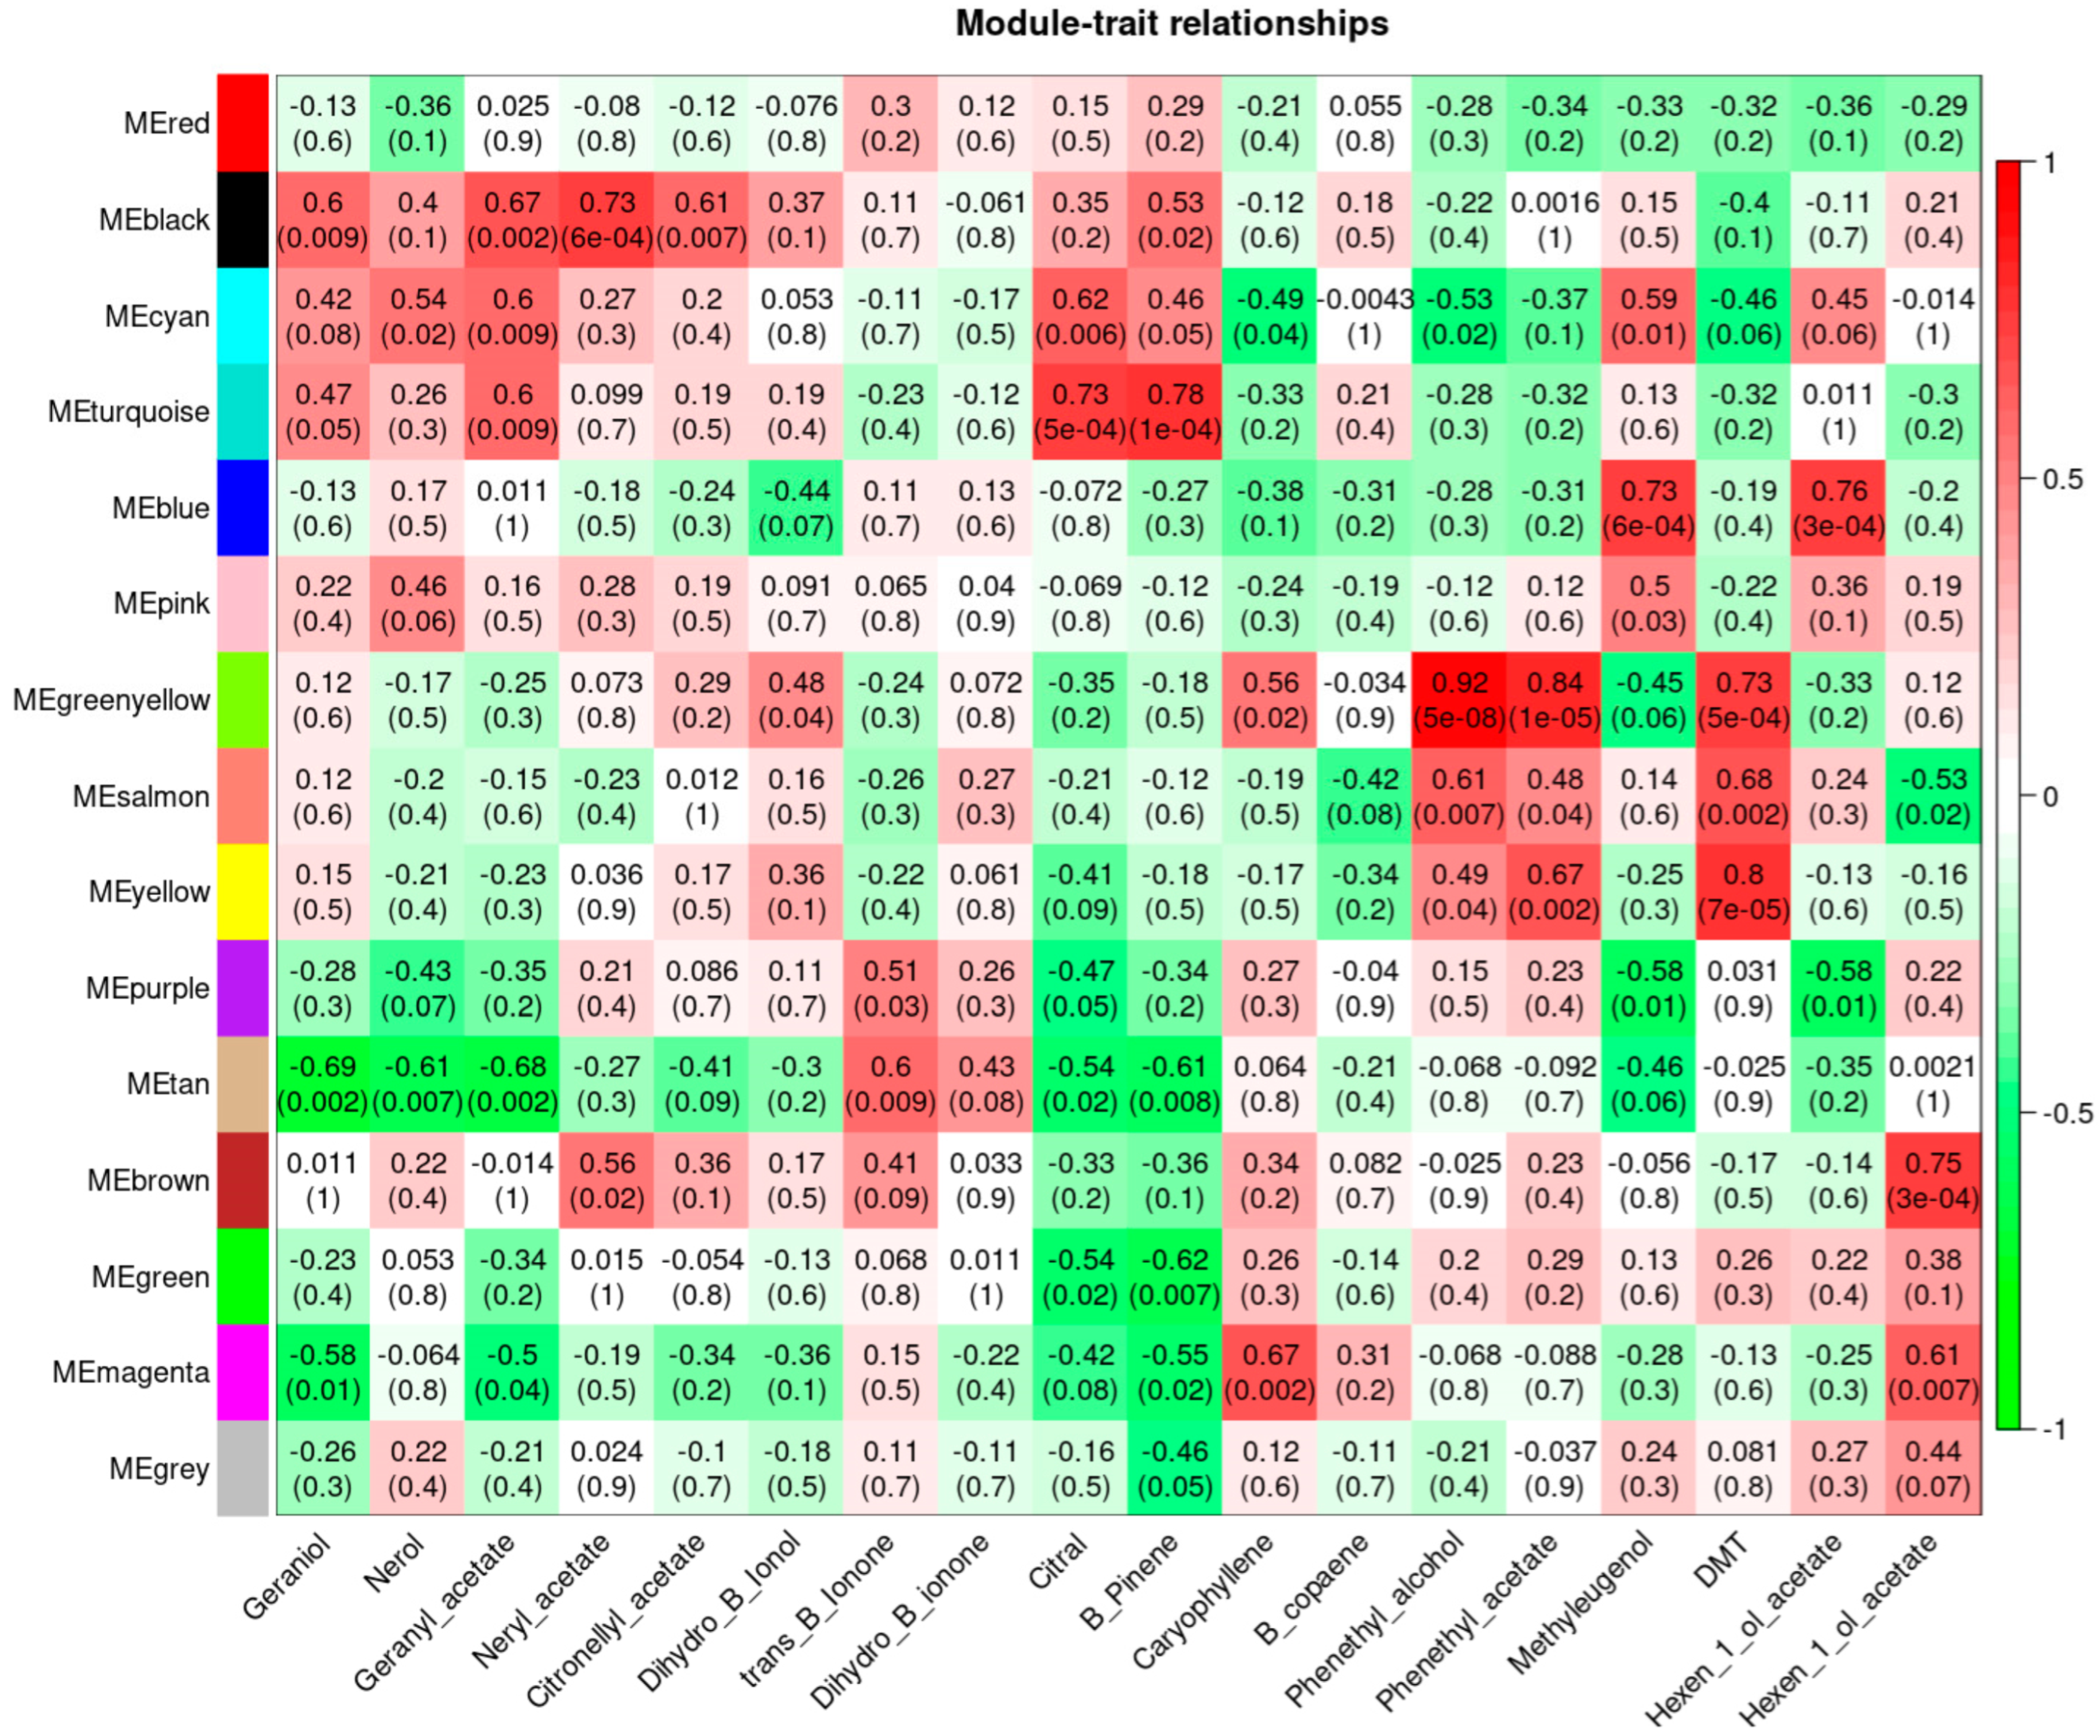
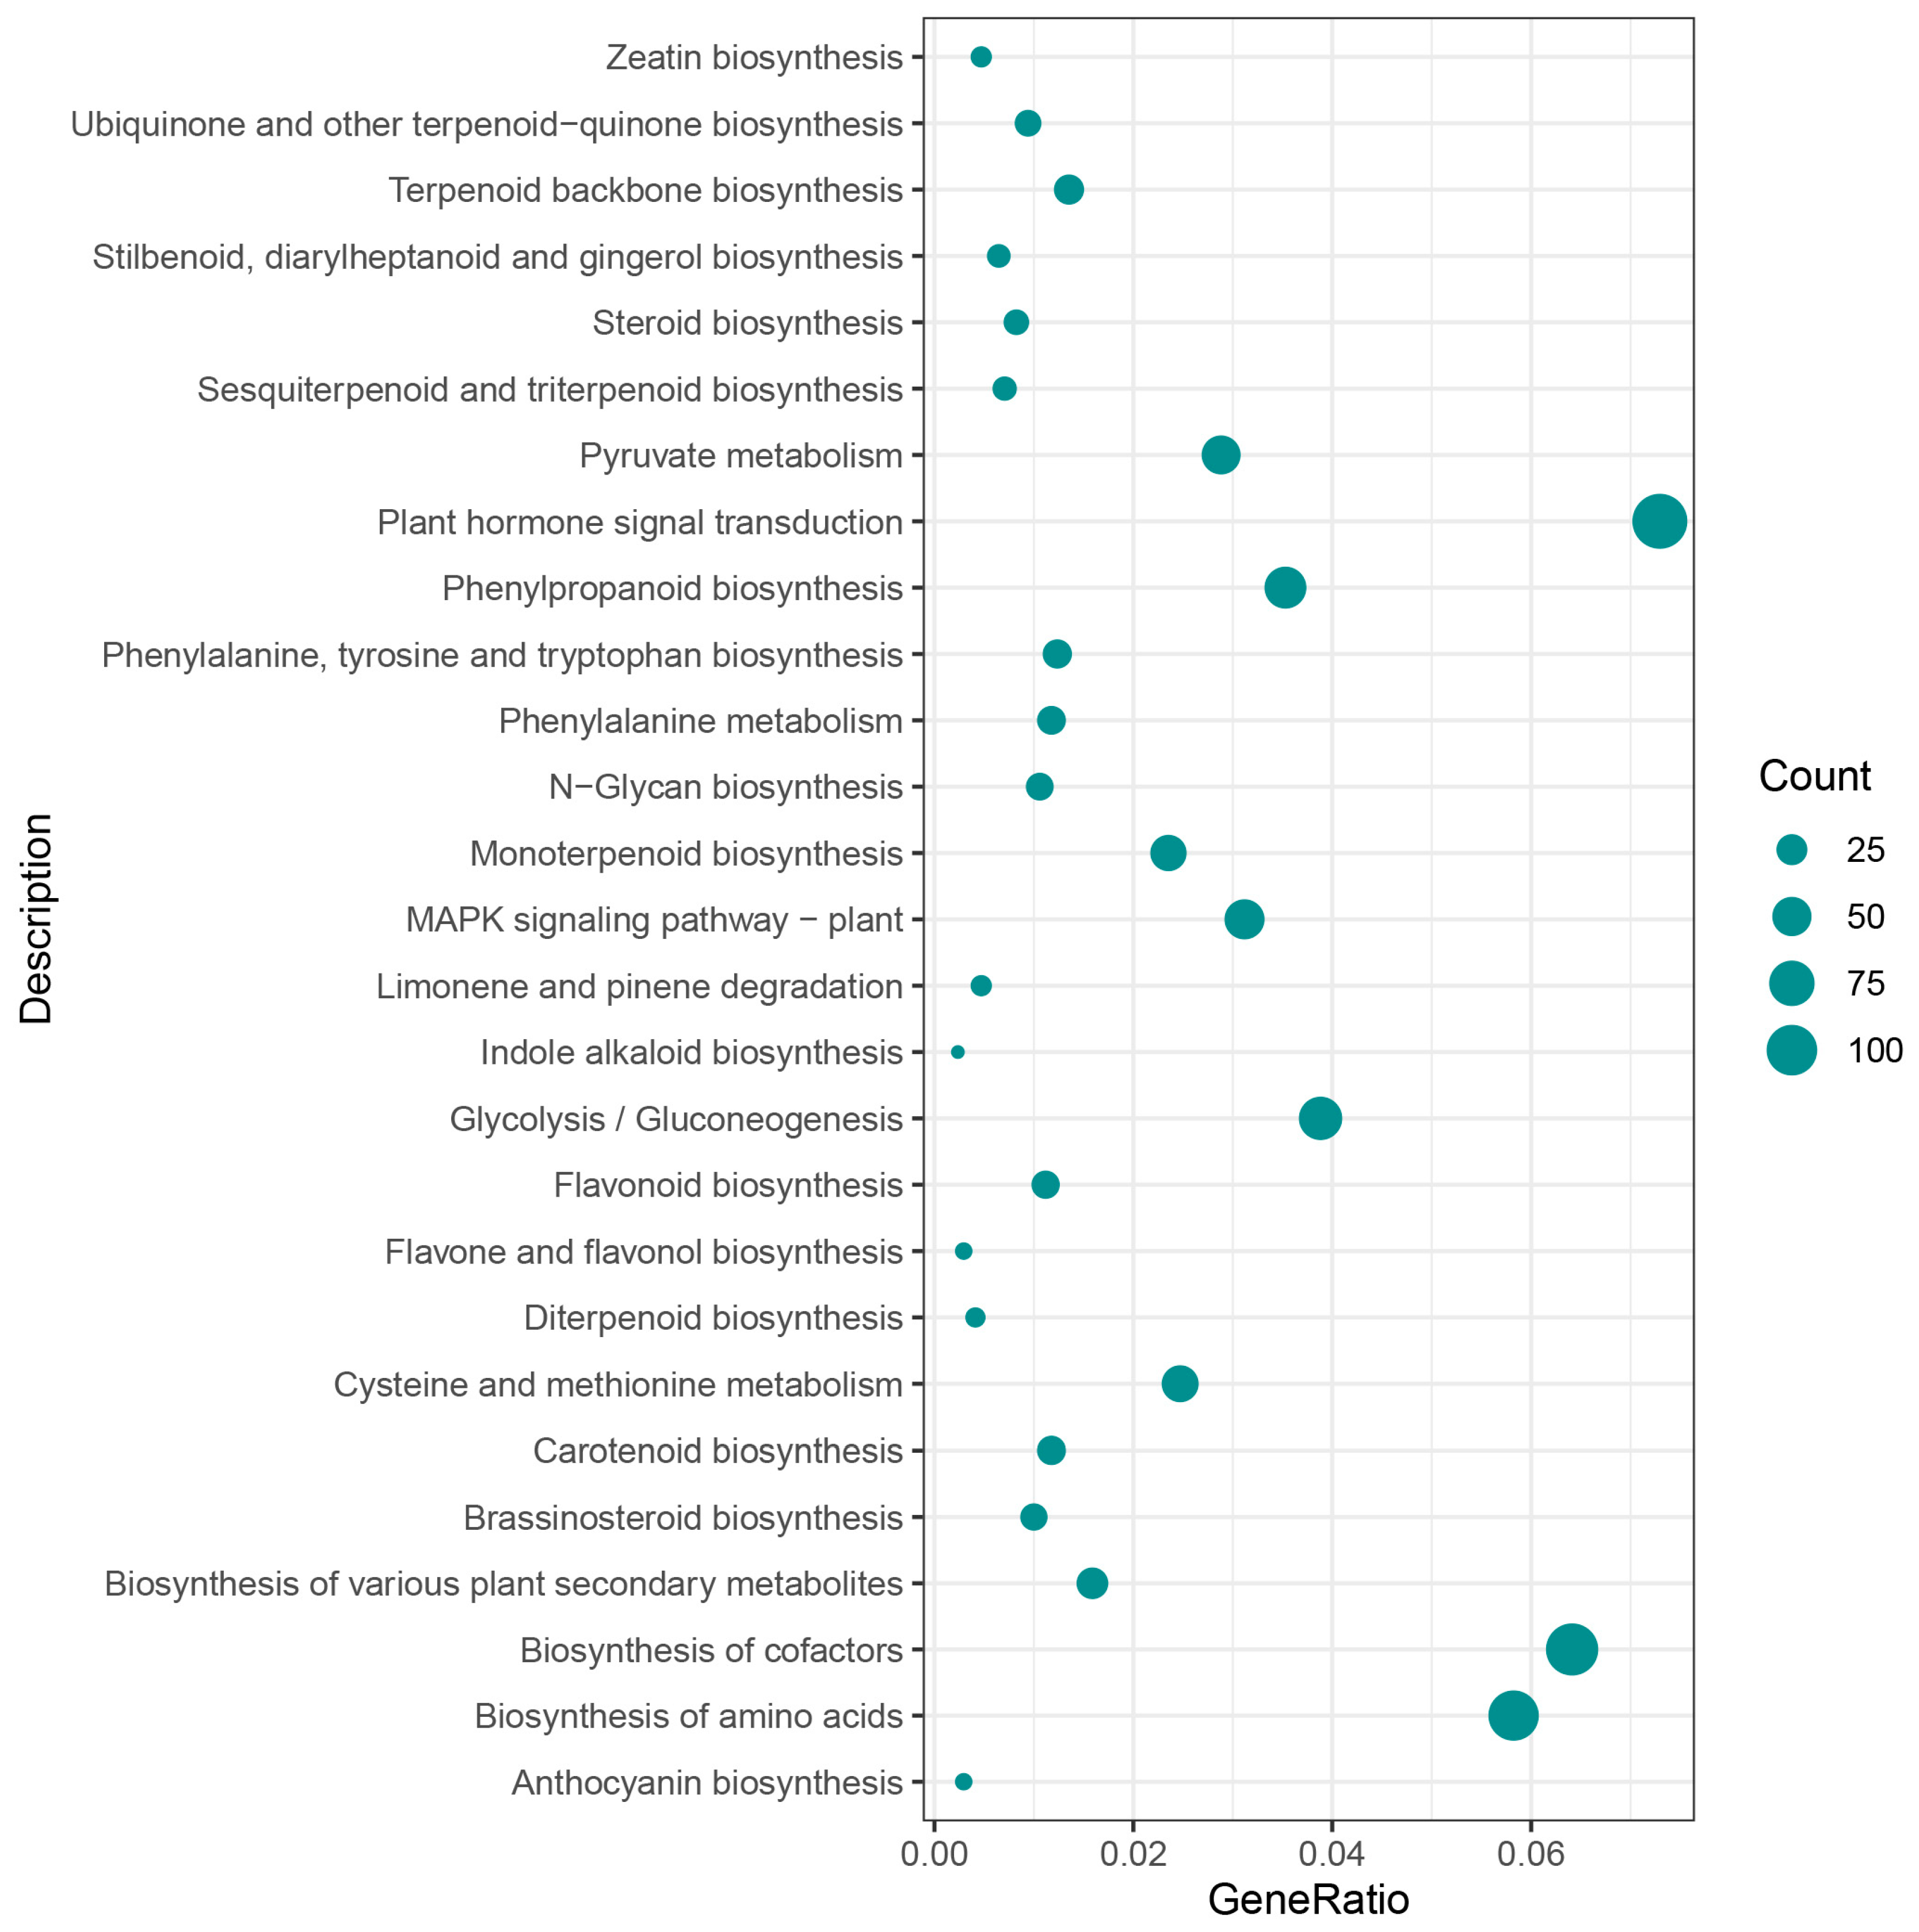
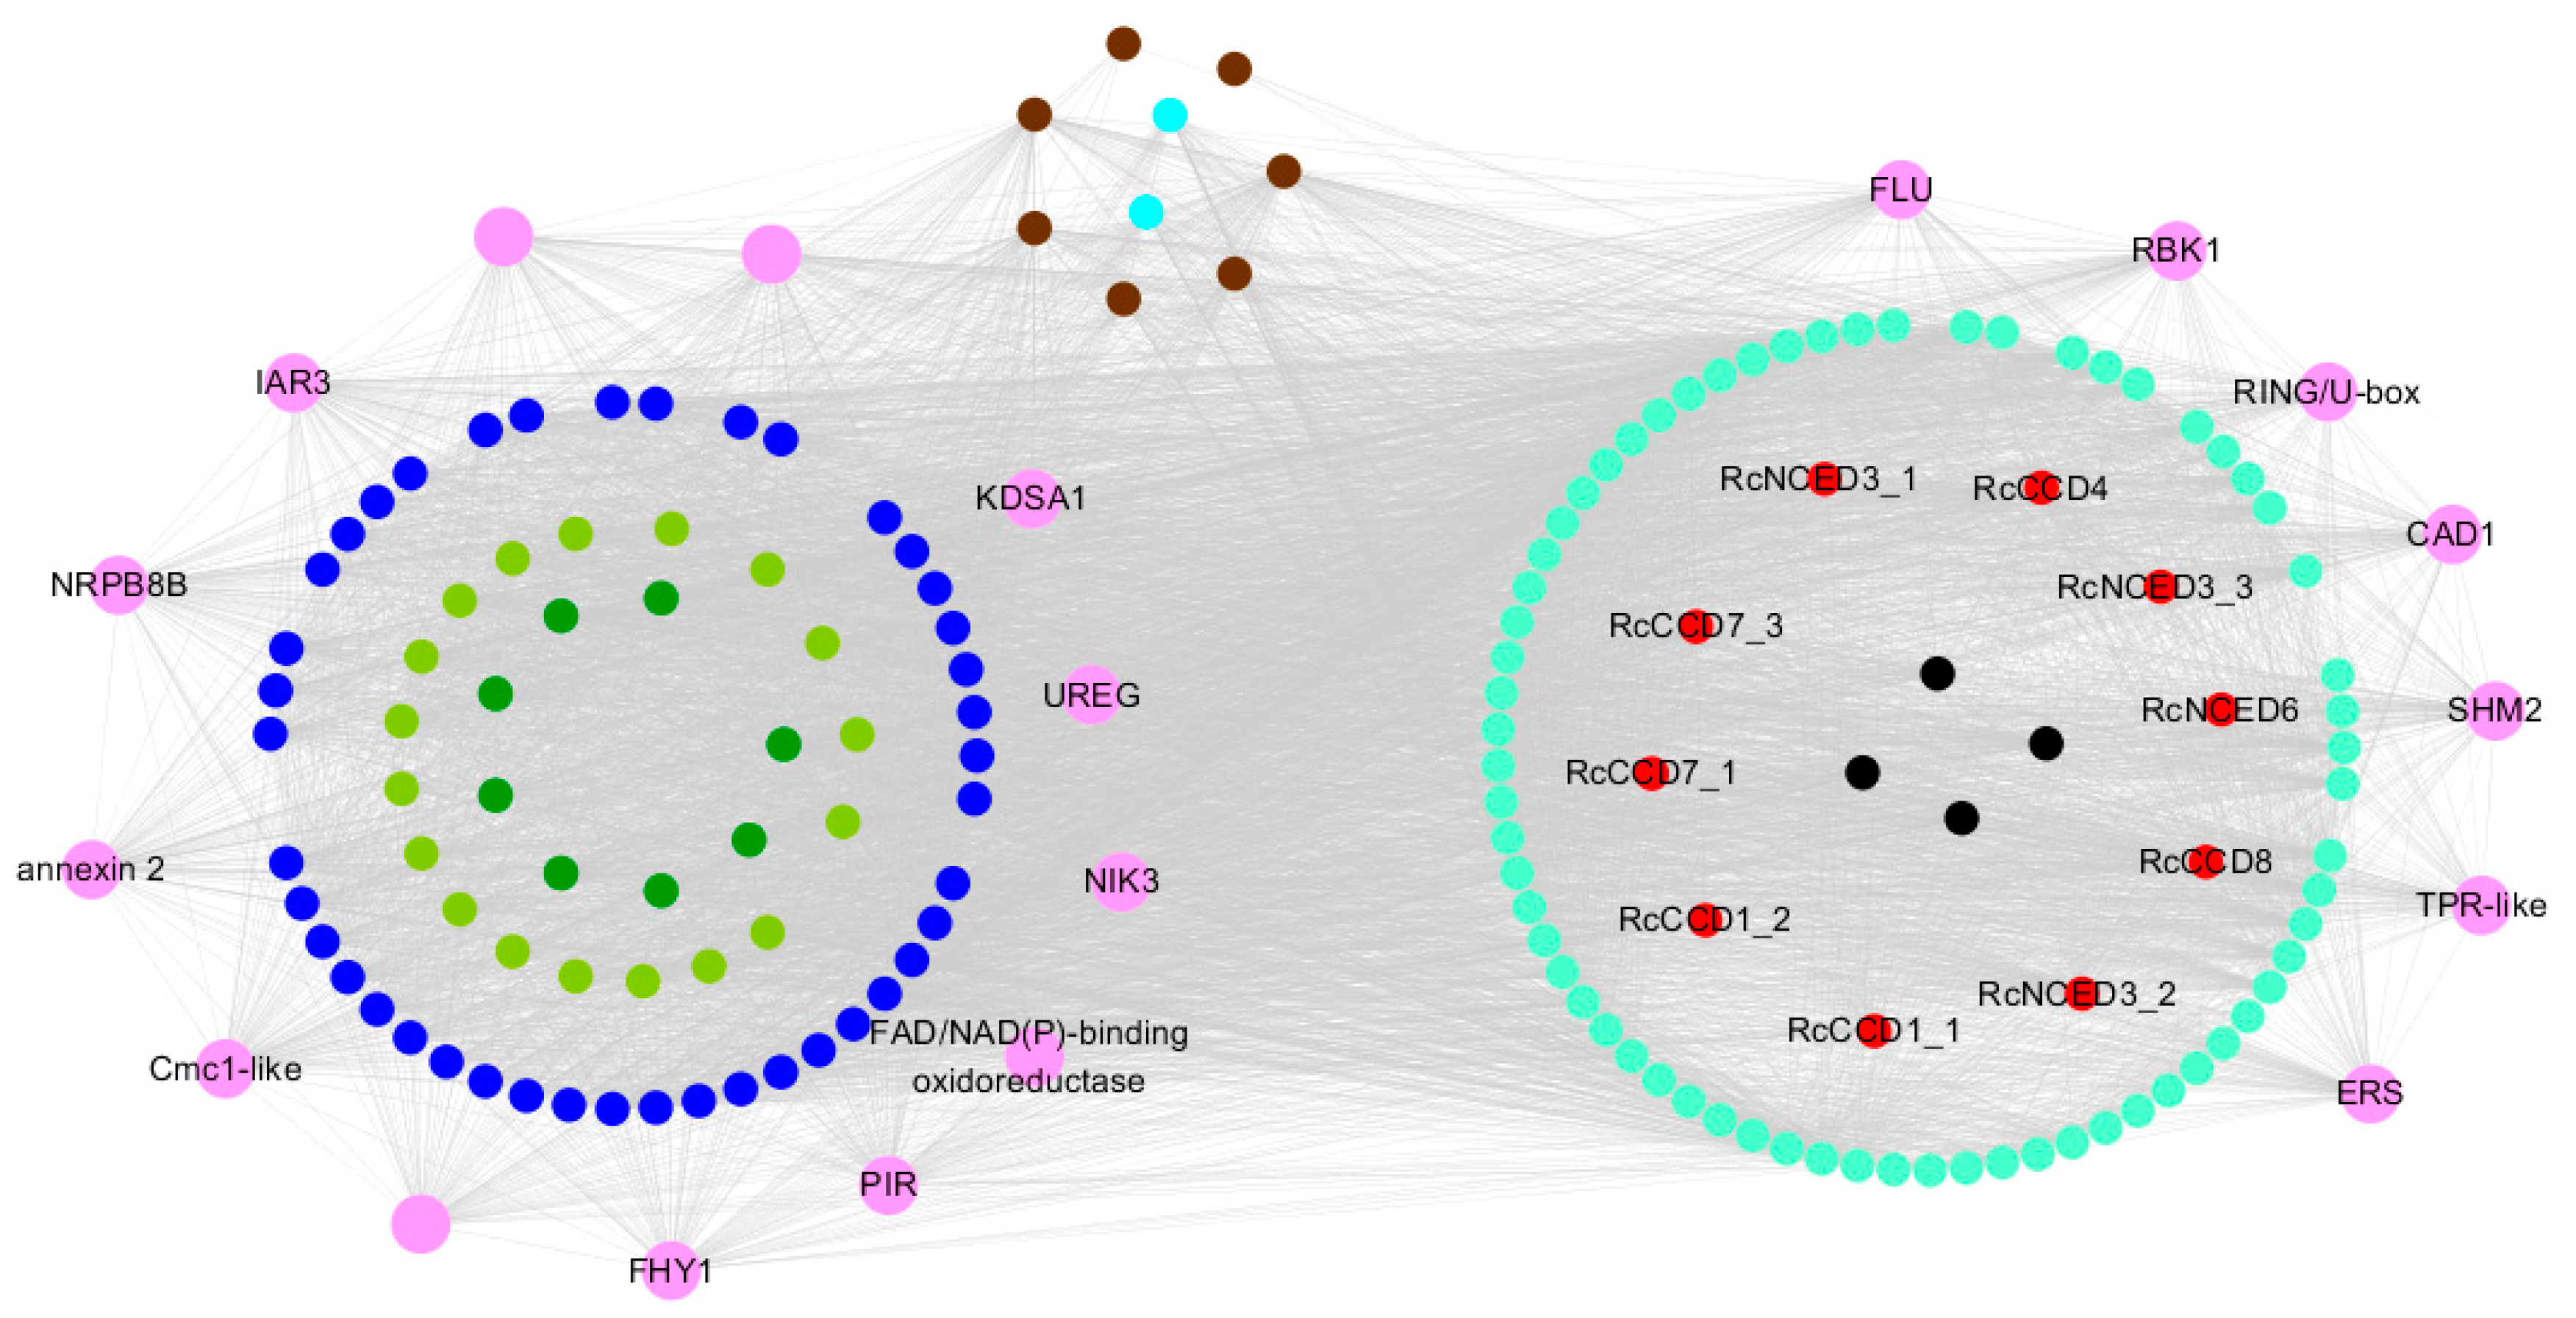
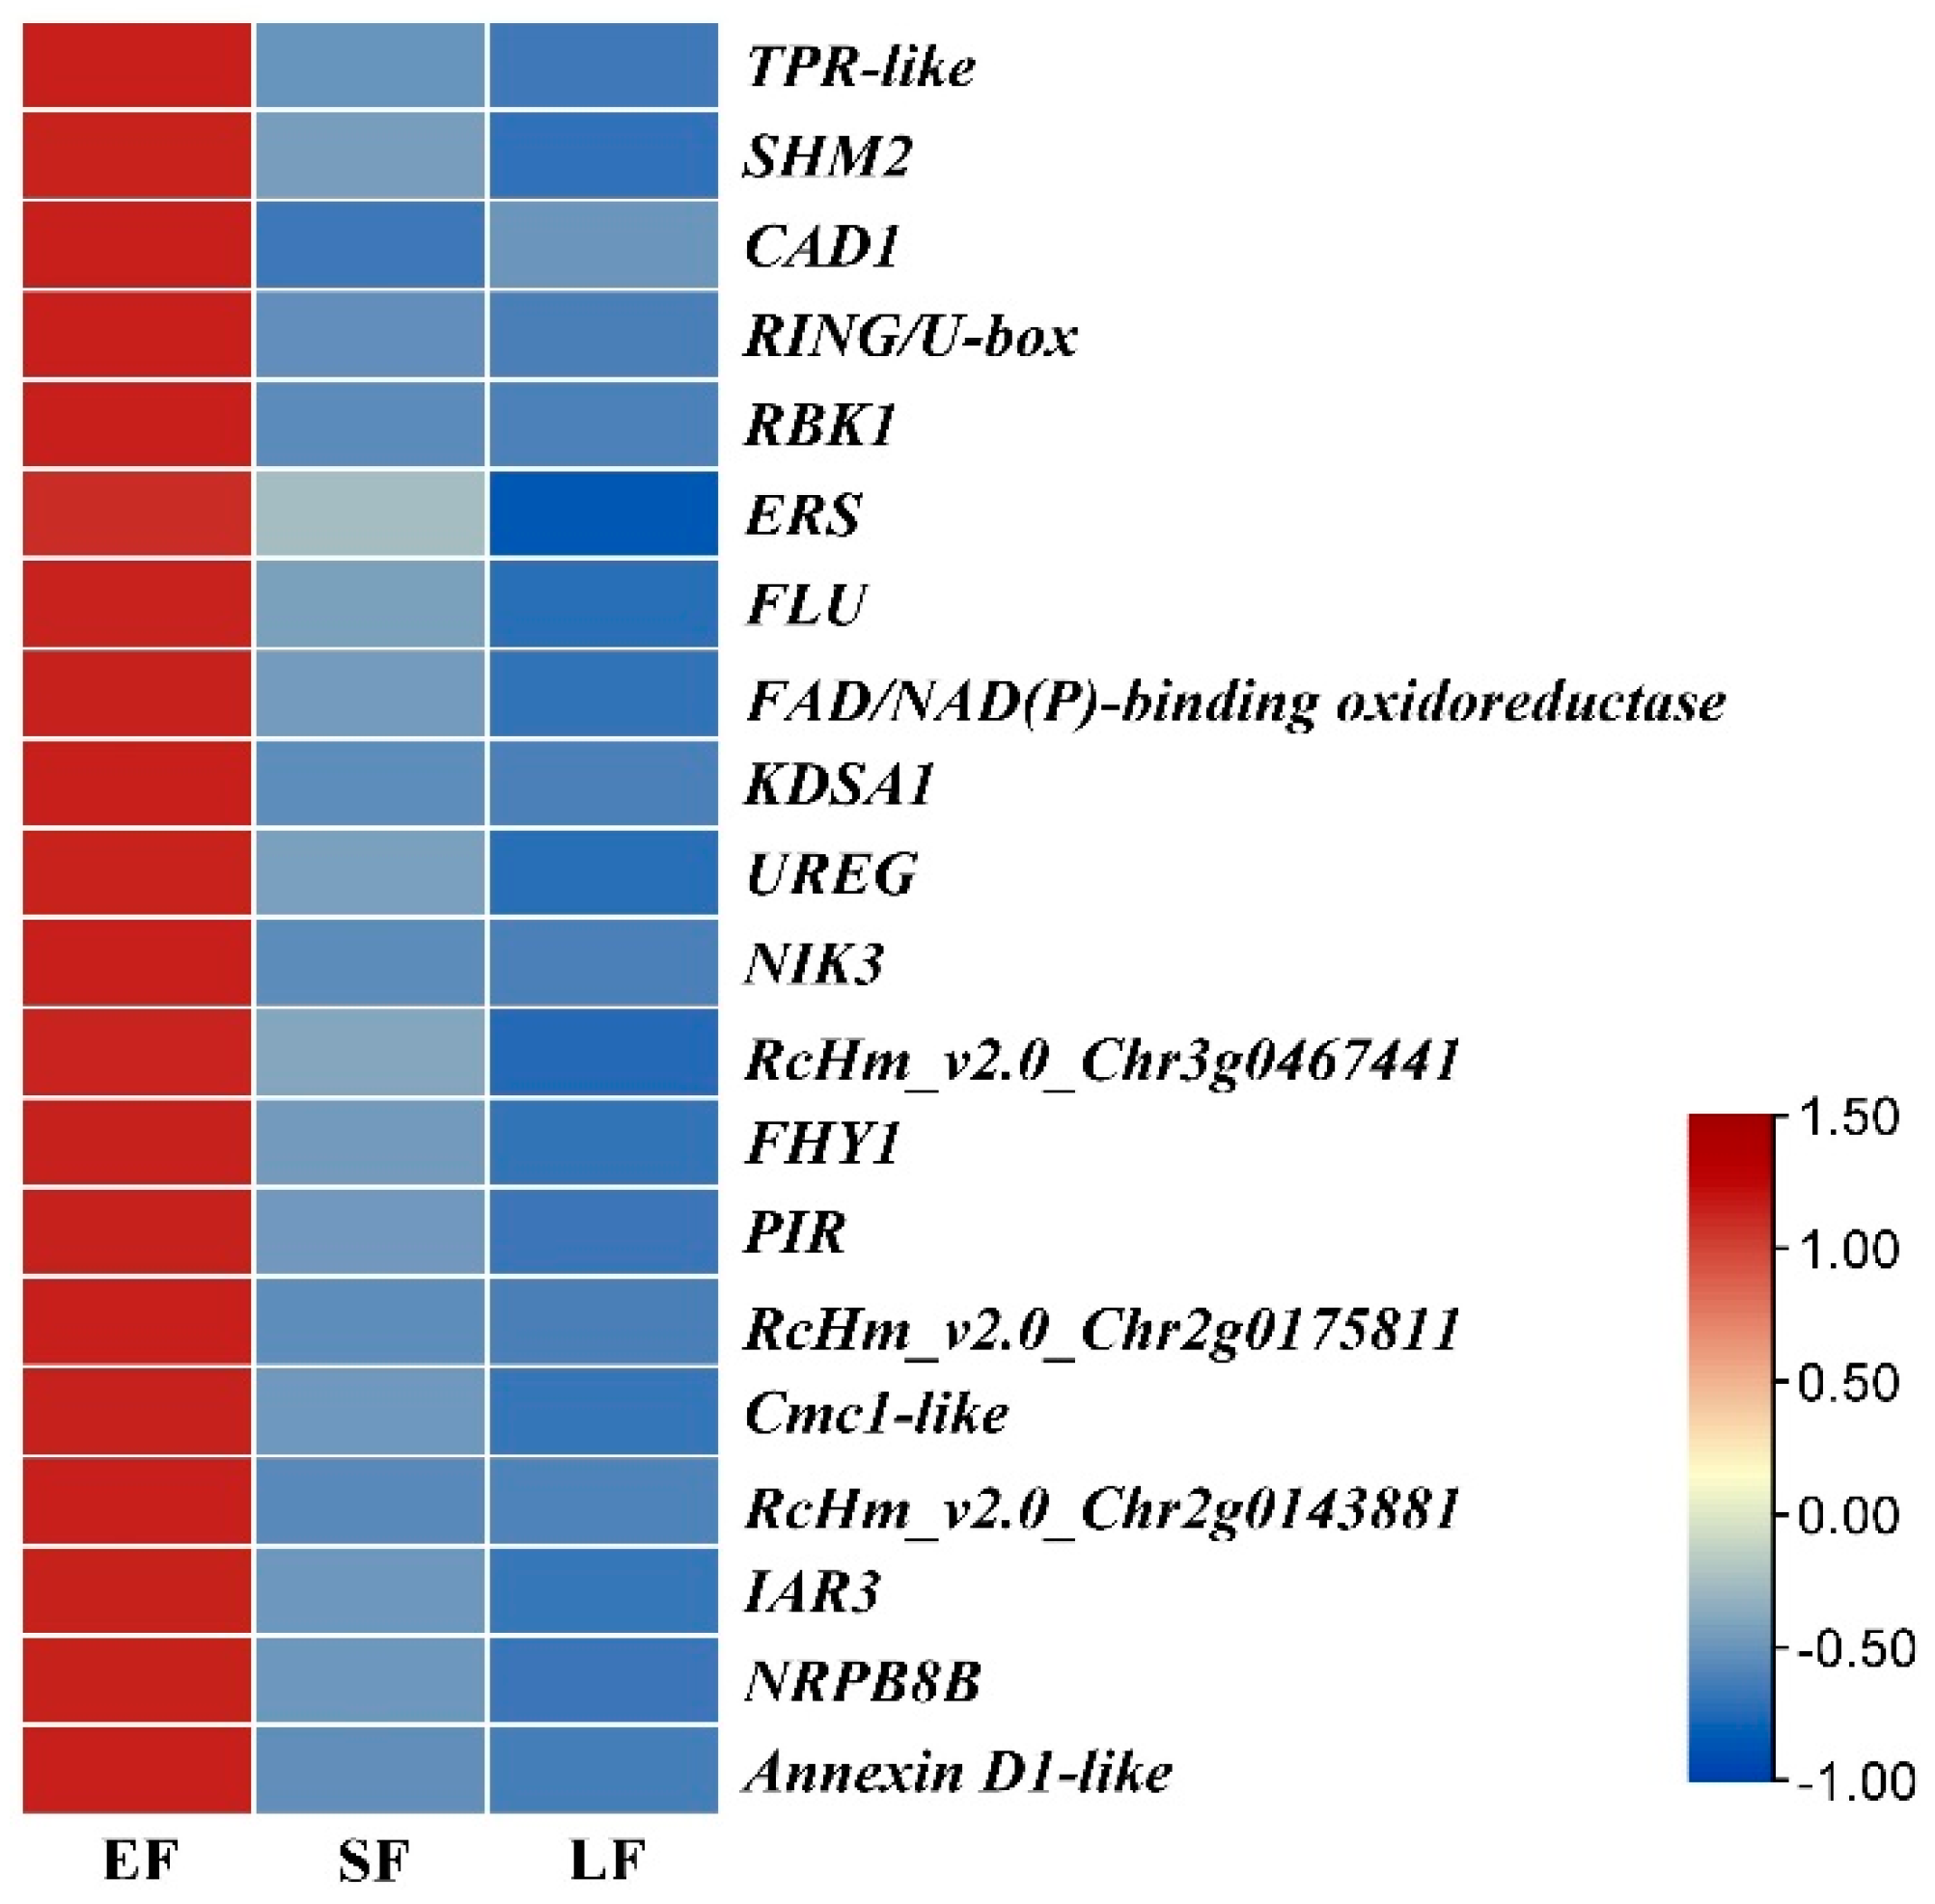
3.5. Weighted Gene Co-Expression Network Analysis, WGCNA

The optimal soft threshold (β) was determined by the pickSoftThreshold function in the WGCNA package to make the network converge infinitely to the distribution of the scale-free network. As shown in Figure 6A, the β = 8 when the correlation coefficient was greater than 0.85 for the first time was chosen for subsequent further construction of the gene co-expression network (Figure 6A).
The phase dissimilarity coefficients of differentially expressed genes were calculated to construct gene clustering trees, and then the modules were cut according to the mixed dynamic tree cut method to integrate genes with similar expression patterns to the same branch. Each branch represented a co-expression module and different modules were indicated by different colors, and gray modules represented genes that could not be integrated into any other modules. As shown in Figure 7, all genes were divided into 15 modules, among which the turquoise module had the largest number of genes, 4597, and NUDX, the star gene of floral scent in rose, was in this module with five homologous genes. Followed by the blue module with 1385 and the cyan module with the least number with only 176 (Table S4).
Figure 7. Gene cluster dendrograms and co-expression module detecting. Each branch represented a co-expression module and different modules indicated by different colors, and gray modules represented genes that could not be integrated into any other modules. Module Eigengenes of 15 modules were calculated, which represented the expression pattern of genes within that module. Correlations between module Eigengenes and 18 volatile compounds detected amount were calculated and heat maps of module and trait relationships were generated (Figure 8).
Horticulturae 09 00115 g007
Figure 8. The correlation heat map between gene co-expression modules and volatile compounds by WGCNA analysis. Each row corresponds to a module eigengene, column to volatile compounds. Red indicated positive correlation and green indicated negative correlation, the number in each cell, the upper layer represented r, and the lower layer represented p-value.
Horticulturae 09 00115 g008
The results showed that six co-expression modules were highly significantly correlation with multiple volatile compounds (correlation coefficient r ≥ 0.7, p-value ≤ 0.05), with black and turquoise modules being more associated with terpenoid, specifically, the black module was highly significantly positively correlated with Neryl acetate (r = 0.73, p = 6 × 10⁻⁴); the turquoise module was positively correlated with Citral (r = 0.73, p = 5 × 10⁻⁴) and β-Pinene (r = 0.78, p = 1 × 10⁻⁴). While the blue, green yellow, yellow, and brown modules were more associated with phenylpropanoids/benzenoids. Blue module was positively correlated with Methyleugenol (r = 0.73, p = 6 × 10−4) and X4-Hexen-1-ol-acetate (r = 0.76, p = 3 × 10⁻⁴). Green yellow module was significantly positively correlated with Phenethyl alcohol (r = 0.92, p = 5 × 10⁻⁸), Phenethyl acetate (r = 0.84, p = 1 × 10⁻⁵), and DMT (r = 0.73, p = 5 × 10⁻⁴). Yellow module was highly significantly positively correlated with DMT (r = 0.80, p = 7 × 10⁻⁵); and the brown module was highly significantly positively correlated with X4-Hexen-1-ol-acetate (r = 0.75, p = 3 × 10⁻⁴).
To further identify the target gene co-expression modules and their biological functions, KEGG functional enrichment analysis was performed on five of the highly significantly correlated modules (black, turquoise, blue, green yellow, brown) and two modules containing RcCCDs (green and cyan) (p < 0.05).
The results showed that the genes in these seven modules were mainly enriched in Plant hormone signal transduction (map04075), Terpenoid backbone biosynthesis (map00900), Monoterpenoid biosynthesis (map00902), Phenylalanine, tyrosine, and tryptophan biosynthesis (map00400), Carotenoid biosynthesis (map00906), Phenylalanine metabolism (map00360), Sesquiterpenoid and triterpenoid biosynthesis (map00909). These KEGG pathways were related to the metabolism of volatile compounds, suggesting that WGCNA identified biologically significant gene co-expression modules (Figure 9, Table S5). GO enrichment analysis of these modules revealed that black, blue, brown, and turquoise modules were enriched in isoprenoid metabolic process (GO:0006720), automatic compound catabolic process (GO:0019439), terpenoid metabolic process (GO:0006721), phenylpropanoid metabolic process (GO:0009698), phenylpropanoid biosynthetic process (GO:0009699), and terpenoid biosynthetic process (GO:0016114), all of which were terms related to the metabolic pathways of terpenoids biosynthesis and phenylpropanoids/benzenoids metabolic pathway in rose. The isoprenoid metabolic process (GO:0006720) was more related to the CCD family, which degrades carotenoids to C-13-norisoprenoids, which were important volatile compounds (Table S6).
Within seven modules, the top 10% of genes connectivity, kME > 0.8, and the top 500 weighted values within a single module were screened as candidate hub genes, totaling 162 hub genes. Then ten RcCCDs and five NUDX genes (related to) were added to a total of 177 genes for co-expression network map display, based on which 20 hub genes were further screened as shown in the pink circles (Figure 10, Tables S3 and S7). The differential expression analysis revealed that these 20 genes had the highest expression in the EF stage, all of them were down-regulated in the SF stage, and 19 of them were not expressed in the LF stage, indicating that these genes all exercised their functions in the early flowering stage with strict temporal specificity (Table S3, Figure 11). These hub genes are involved in Carbon metabolism (map01200), Biosynthesis of amino acids (map01230), Phenylpropanoid biosynthesis (map00940), Aminoacyl-tRNA biosynthesis (map00970), and other metabolic pathways. Twenty hub genes were enriched not only for the phenylpropanoid metabolic process (GO:0009698), phenylpropanoid biosynthetic process (GO:0009699) but also for many biological processes related to the carbohydrate metabolic process (GO:0005975), and secondary metabolic process (GO:0019748). The accumulation of volatile compounds was closely related to floral development, and we also enriched floral organ development (GO:0048437). These suggested that WGCNA could indeed identify co-expression modules and genes that were highly correlated with the target traits and had biological significance.

4. Discussions

Rose is a widely used plant material for essential oil extraction and fragrance production. Its volatile compounds are mainly produced through terpenoid, phenylpropanoids/benzenoids metabolic pathways. The carotenoid cleavage dioxygenases pathway (CCD metabolic pathway) is one of the main metabolic pathways for the degradation of carotenoids, which is located downstream of the terpenoids biosynthesis pathway and is closely related to the biosynthesis of volatile compounds.
The function of the CCD genes in the rose genome is unknown, and only one gene, RdCCD1, has been reported, whose expression is associated with the accumulation of C-13-norisoprenoids in R. damascena [34].
In this study, 15 CCD family member genes were identified from the rose genome, similar to the reported numbers of 9 in Arabidopsis, 9 in rice, and 19 in tobacco.
We comprehensively analyzed the CCD family in terms of phylogeny, sequence characteristics, gene structure, chromosomal location, and repeats, and found that the CCD protein sequences in different groups of rose were highly conserved but still have some differences.
The CCD clade was rich in structural variation, with large variations in exon, intron, and motif numbers. In contrast to the gene sequences in the CCD clade, NCED clade genes were free of introns, and had a typical chloroplast-targeted transit peptide at the N-terminal end of the amino acid sequence. Their C-terminal end was highly homologous at the, and all contain four conserved histidine structures (His). There was evidence that the highly conserved Glu/Asp active sites of His and CCD proteins were essential for enzyme activity [10,14].
The NCED clade contained more motifs, implying that their protein structure was highly conserved and whether these more motifs confer more function to the NCED clade proteins would require further research to demonstrate. However, several studies have confirmed that the CCDs protein sequences were not highly conserved [9,16,17,35,36], which was somewhat different from the results of my study, perhaps related to inter-species variability.
Gene retention and chromosomal rearrangement after WGD events were usually the main cause of gene family expansion, but in RcCCDs there was no WGD event. Our results show that fragment duplication was the main driver of gene amplification in RcCCDs, which was consistent with the results in the apple CCD family [12], but unlike in tobacco, where no tandem repeat events were found, gene retention and chromosomal arrangement after WGD were responsible for the expansion of the tobacco CCD gene family [37]. Meanwhile, 11 of the RcCCDs were single-copy genes, indicating that most of the CCD family proteins were not functionally redundant. Indeed, CCDs showed diverse expression, indicating that modifications including mutations have occurred in function regions, regulatory regions, and coding sequence sites, of duplicated members, affecting the expression as well as function [38,39].

5. Conclusions

Fifteen CCD family genes were identified in the rose genome, and they belong to three clades: CCD, NCED, and CCD-LIKE. RcCCDs without WGD events, their repetitive sequences were mainly dispersed and tandem, and fragment replication was the main driving force of RcCCDs amplification. RcCCDs were differentially expressed in the transcriptomes of different flowering stages, and the expression patterns of some genes were identical to the accumulation process of volatile compounds. A total of 15 modules were obtained by weighted gene co-expression network analysis of 18 volatile compounds-related genes, of which 6 modules were highly-significant positive correlation with volatile compounds, and 20 hub genes in the modules were predicted. These hub genes all exercised their functions in the early flowering stage with strict temporal specificity. This study provided a theoretical basis for further exploring the biological functions of RcCCDs and hub genes regulating the synthesis and metabolism of volatile compounds in rose.

Supplementary Materials

The following supporting information can be downloaded at: https://www.mdpi.com/article/10.3390/horticulturae9010115/s1, Table S1: Memebers of the CCD gene family, as predicted in R. chinensis genome sequence; Table S2: KA/KS analysis of RcCCDs in R. chinensis; Table S3: Expression of RcCCDs and hub genes in floral organs of Rosa hybrida ‘tianmidemeng’ at different stages; Table S4: The number distribution statistics of differentially expressed genes in 15 co-expressed modules; Table S5: Partial KEGG enrichment results of seven target gene modules; Table S6: Partial GO enrichment results of seven target gene modules; Table S7: Functional annotations of hub genes in seven modules.

Author Contributions

Z.Z. conceived and designed the paper. F.J. and J.W. performed the experiments and analysis. F.J. and Z.Z. wrote the paper. All authors have read and agreed to the published version of the manuscript.

Funding

This study was supported by the National Key Research and Development Project (2020YFD1000403), the Construction of Beijing Science and Technology Innovation and Service Capacity in Top Subjects (PXM2019_014207_000032), and National Natural Science Foundation of China to Zhao Zhang (grant number 31772344 and 31972444). The funders played no role in study design, data collection, and analysis, the decision to publish, or the preparation of the manuscript.

Data Availability Statement

The datasets used and/or analyzed during the current study has been included within supplemental data. The plant materials are available from the corresponding author upon reasonable request.

Conflicts of Interest

The authors declare that the research was conducted in the absence of any commercial or financial relationships that could be construed as a potential conflict of interest.

References

  1. Venkatesha, K.T.; Gupta, A.; Rai, A.N.; Jambhulkar, S.J.; Bisht, R.; Padalia, R.C. Recent developments, challenges, and opportunities in genetic improvement of essential oil-bearing rose (Rosa damascena): A review. Ind. Crops Prod. 2022, 184, 471–479. [Google Scholar] [CrossRef]
  2. Dudareva, N.; Pichersky, E.; Gershenzon, J. Biochemistry of plant Volatiles. Plant Physiol. 2004, 135, 1893–1902. [Google Scholar] [CrossRef] [PubMed] [Green Version]
  3. Hsieh, M.H.; Chang, C.Y.; Hsu, S.J.; Chen, J.J. Chloroplast localization of methylerythritol 4-phosphate pathway enzymes and regulation of mitochondrial genes in ispD and ispE albino mutants in Arabidopsis. Plant Mol. Biol. 2008, 66, 663–673. [Google Scholar] [CrossRef]
  4. Knudsen, J.T.; Eriksson, R.; Gershenzon, J.; Stahl, B. Diversity and distribution of floral scent. Bot. Rev. 2006, 72, 1–120. [Google Scholar] [CrossRef]
  5. Simkin, A.J.; Guirimand, G.; Papon, N.; Courdavault, V.; Thabet, I.; Ginis, O.; Bouzid, S.; Giglioli-Guivarc’h, N.; Clastre, M. Peroxisomal localisation of the final steps of the mevalonic acid pathway in planta. Planta 2011, 234, 903–914. [Google Scholar] [CrossRef] [PubMed]
  6. Pulido, P.; Perello, C.; Rodriguez-Concepcion, M. New Insights into Plant Isoprenoid Metabolism. Mol. Plant 2012, 5, 964–967. [Google Scholar] [CrossRef] [Green Version]
  7. Boatright, J.; Negre, F.; Chen, X.L.; Kish, C.M.; Wood, B.; Peel, G.; Orlova, I.; Gang, D.; Rhodes, D.; Dudareva, N. Understanding in vivo benzenoid metabolism in petunia petal tissue. Plant Physiol. 2004, 135, 1993–2011. [Google Scholar] [CrossRef] [Green Version]
  8. Bouvier, F.; Isner, J.C.; Dogbo, O.; Camara, B. Oxidative tailoring of carotenoids: A prospect towards novel functions in plants. Trends Plant Sci. 2005, 10, 187–194. [Google Scholar] [CrossRef]
  9. Auldridge, M.E.; Block, A.; Vogel, J.T.; Dabney-Smith, C.; Mila, I.; Bouzayen, M.; Magallanes-Lundback, M.; DellaPenna, D.; McCarty, D.R.; Klee, H.J. Characterization of three members of the Arabidopsis carotenoid cleavage dioxygenase family demonstrates the divergent roles of this multifunctional enzyme family. Plant J. 2006, 45, 982–993. [Google Scholar] [CrossRef]
  10. Wei, Y.P.; Wan, H.J.; Wu, Z.M.; Wang, R.Q.; Ruan, M.Y.; Ye, Q.J.; Li, Z.M.; Zhou, G.Z.; Yao, Z.P.; Yang, Y.J. A Comprehensive Analysis of Carotenoid Cleavage Dioxygenases Genes in Solanum lycopersicum. Plant Mol. Biol. Rep. 2016, 34, 512–523. [Google Scholar] [CrossRef]
  11. Wang, Y.; Ding, G.Q.; Gu, T.T.; Ding, J.; Li, Y. Bioinformatic and expression analyses on carotenoid dioxygenase genes in fruit development and abiotic stress responses in Fragaria vesca. Mol. Genet. Genom. 2017, 292, 895–907. [Google Scholar] [CrossRef] [PubMed]
  12. Chen, H.F.; Zuo, X.Y.; Shao, H.X.; Fan, S.; Ma, J.J.; Zhang, D.; Zhao, C.P.; Yan, X.Y.; Liu, X.J.; Han, M.Y. Genome-wide analysis of carotenoid cleavage oxygenase genes and their responses to various phytohormones and abiotic stresses in apple (Malus domestica). Plant Physiol. Biochem. 2018, 123, 81–93. [Google Scholar] [CrossRef] [PubMed]
  13. Tan, B.C.; Joseph, L.M.; Deng, W.T.; Liu, L.J.; Li, Q.B.; Cline, K.; McCarty, D.R. Molecular characterization of the Arabidopsis 9-cis epoxycarotenoid dioxygenase gene family. Plant J. 2003, 35, 44–56. [Google Scholar] [CrossRef] [PubMed]
  14. Kloer, D.P.; Ruch, S.; Al-Babili, S.; Beyer, P.; Schulz, G.E. The structure of a retinal-forming carotenoid oxygenase. Science 2005, 308, 267–269. [Google Scholar] [CrossRef] [Green Version]
  15. Schwartz, S.H.; Tan, B.C.; Gage, D.A.; Zeevaart, J.A.D.; McCarty, D.R. Specific oxidative cleavage of carotenoids by VP14 of maize. Science 1997, 276, 1872–1874. [Google Scholar] [CrossRef] [Green Version]
  16. Vallabhaneni, R.; Bradbury, L.M.T.; Wurtzel, E.T. The carotenoid dioxygenase gene family in maize, sorghum, and rice. Arch. Biochem. Biophys. 2010, 504, 104–111. [Google Scholar] [CrossRef] [Green Version]
  17. Lashbrooke, J.G.; Young, P.R.; Dockrall, S.J.; Vasanth, K.; Vivier, M.A. Functional characterisation of three members of the Vitis vinifera L. carotenoid cleavage dioxygenase gene family. BMC Plant Biol. 2013, 13, 156. [Google Scholar] [CrossRef] [Green Version]
  18. Schwab, W.; Huang, F.C.; Molnar, P. Carotenoid Cleavage Dioxygenase Genes from Fruit. In Proceedings of the American-Chemical-Society Symposium on Carotenoid Cleavage Products/243rd American-Chemical-Society National Meeting, San Diego, CA, USA, 25–26 March 2012; pp. 11–19. [Google Scholar]
  19. He, Y.J.; Wang, Z.W.; Ge, H.Y.; Liu, Y.; Chen, H.Y. Weighted gene co-expression network analysis identifies genes related to anthocyanin biosynthesis and functional verification of hub gene SmWRKY44. Plant Sci. 2021, 309, 110935. [Google Scholar] [CrossRef]
  20. Li, M.; Zhang, D.; Gao, Q.; Luo, Y.; Zhang, H.; Ma, B.; Chen, C.; Whibley, A.; Zhang, Y.; Cao, Y.; et al. Genome structure and evolution of Antirrhinum majus L. Nat. Plants 2019, 5, 174–183. [Google Scholar] [CrossRef] [Green Version]
  21. Chen, C.J.; Chen, H.; Zhang, Y.; Thomas, H.R.; Frank, M.H.; He, Y.H.; Xia, R. TBtools: An Integrative Toolkit Developed for Interactive Analyses of Big Biological Data. Mol. Plant 2020, 13, 1194–1202. [Google Scholar] [CrossRef]
  22. Jung, S.; Lee, T.; Cheng, C.H.; Buble, K.; Zheng, P.; Yu, J.; Humann, J.; Ficklin, S.P.; Gasic, K.; Scott, K.; et al. 15 years of GDR: New data and functionality in the Genome Database for Rosaceae. Nucleic Acids Res. 2019, 47, D1137–D1145. [Google Scholar] [CrossRef] [PubMed] [Green Version]
  23. Emms, D.M.; Kelly, S. OrthoFinder: Phylogenetic orthology inference for comparative genomics. Genome Biol. 2019, 20, 238. [Google Scholar] [CrossRef] [Green Version]
  24. Larkin, M.A.; Blackshields, G.; Brown, N.P.; Chenna, R.; McGettigan, P.A.; McWilliam, H.; Valentin, F.; Wallace, I.M.; Wilm, A.; Lopez, R.; et al. Clustal W and clustal X version 2.0. Bioinformatics 2007, 23, 2947–2948. [Google Scholar] [CrossRef] [PubMed] [Green Version]
  25. Nguyen, L.T.; Schmidt, H.A.; von Haeseler, A.; Minh, B.Q. IQ-TREE: A Fast and Effective Stochastic Algorithm for Estimating Maximum-Likelihood Phylogenies. Mol. Biol. Evol. 2015, 32, 268–274. [Google Scholar] [CrossRef]
  26. Shi, S.; Zhang, S.; Wu, J.; Liu, X.; Zhang, Z. Identification of long non-coding RNAs involved in floral scent of Rosa hybrida. Front. Plant Sci. 2022, 13, 996474. [Google Scholar] [CrossRef]
  27. Bolger, A.M.; Lohse, M.; Usadel, B. Trimmomatic: A flexible trimmer for Illumina sequence data. Bioinformatics 2014, 30, 2114–2120. [Google Scholar] [CrossRef] [Green Version]
  28. Kim, D.; Landmead, B.; Salzberg, S.L. HISAT: A fast spliced aligner with low memory requirements. Nat. Methods 2015, 12, 357–360. [Google Scholar] [CrossRef] [PubMed] [Green Version]
  29. Kovaka, S.; Zimin, A.V.; Pertea, G.M.; Razaghi, R.; Salzberg, S.L.; Pertea, M. Transcriptome assembly from long-read RNA-seq alignments with StringTie2. Genome Biol. 2019, 20, 278. [Google Scholar] [CrossRef] [PubMed] [Green Version]
  30. Love, M.I.; Huber, W.; Anders, S. Moderated estimation of fold change and dispersion for RNA-seq data with DESeq2. Genome Biol. 2014, 15, 550. [Google Scholar] [CrossRef] [Green Version]
  31. Langfelder, P.; Horvath, S. WGCNA: An R package for weighted correlation network analysis. BMC Bioinform. 2008, 9, 1265. [Google Scholar] [CrossRef]
  32. Shannon, P.; Markiel, A.; Ozier, O.; Baliga, N.S.; Wang, J.T.; Ramage, D.; Amin, N.; Schwikowski, B.; Ideker, T. Cytoscape: A software environment for integrated models of biomolecular interaction networks. Genome Res. 2003, 13, 2498–2504. [Google Scholar] [CrossRef] [PubMed]
  33. Gonzalez-Verdejo, C.I.; Obrero, A.; Roman, B.; Gomez, P. Expression Profile of Carotenoid Cleavage Dioxygenase Genes in Summer Squash (Cucurbita pepo L.). Plant Foods Hum. Nutr. 2015, 70, 200–206. [Google Scholar] [CrossRef] [PubMed]
  34. Huang, F.C.; Horvath, G.; Molnar, P.; Turcsi, E.; Deli, J.; Schrader, J.; Sandmann, G.; Schmidt, H.; Schwab, W. Substrate promiscuity of RdCCD1, a carotenoid cleavage oxygenase from Rosa damascena. Phytochemistry 2009, 70, 457–464. [Google Scholar] [CrossRef] [PubMed]
  35. Kim, Y.; Hwang, I.; Jung, H.J.; Park, J.I.; Kang, J.G.; Nou, I.S. Genome-Wide Classification and Abiotic Stress-Responsive Expression Profiling of Carotenoid Oxygenase Genes in Brassica rapa and Brassica oleracea. J. Plant Growth Regul. 2016, 35, 202–214. [Google Scholar] [CrossRef]
  36. Walter, M.H.; Strack, D. Carotenoids and their cleavage products: Biosynthesis and functions. Nat. Prod. Rep. 2011, 28, 663–692. [Google Scholar] [CrossRef]
  37. Zhou, Q.Q.; Li, Q.C.; Li, P.; Zhang, S.T.; Liu, C.; Jin, J.J.; Cao, P.J.; Yang, Y.X. Carotenoid Cleavage Dioxygenases: Identification, Expression, and Evolutionary Analysis of This Gene Family in Tobacco. Int. J. Mol. Sci. 2019, 20, 5796. [Google Scholar] [CrossRef] [Green Version]
  38. Faraji, S.; Heidari, P.; Amouei, H.; Filiz, E.; Abdullah; Poczai, P. Investigation and Computational Analysis of the Sulfotransferase (SOT) Gene Family in Potato (Solanum tuberosum): Insights into Sulfur Adjustment for Proper Development and Stimuli Responses. Plants 2021, 10, 2597. [Google Scholar] [CrossRef]
  39. Heidari, P.; Abdullah; Faraji, S.; Poczai, P. Magnesium transporter Gene Family: Genome-Wide Identification and Characterization in Theobroma cacao, Corchorus capsularis, and Gossypium hirsutum of Family Malvaceae. Agronomy 2021, 11, 1651. [Google Scholar] [CrossRef]
Figure 1. Chromosomal distribution of the RcCCDs. The scale of the physical distance of chromosomes is located on the left side of the picture. Chr1-7 represents chromosome numbers 1–7.
Horticulturae 09 00115 g001
Figure 2. Phylogenetic analysis of the RcCCDs. The dendrogram was drawn by iqtree with the maximum likelihood method (ML), JTT amino acid substitution model. CCD clade was purple, NCED clade was blue, and CCD-Like was green.
Horticulturae 09 00115 g002
Figure 3. Dendrogram, MEME motifs, pfam, and exon–intron structures of CCDs in rose, arabidopsis, rice, tomato, and maize. Motif1-6 represents conserved motifs of the MEME structure diagram. Blue boxes represent the RPE65 domain. Yellow boxes, green boxes, and black lines in the exon–intron structure diagram represent CDS, UTR, and introns, respectively. Scales (nt) were provided as a reference.
Horticulturae 09 00115 g003
Figure 4. Expression patterns of the ten RcCCDs at three flower development stages in R. hybrida ‘tianmidemeng’. Legend from red to blue indicated gene expression levels from high to low. EF: early-flowering, SF: semi-flowering, LF: late-flowering.
Horticulturae 09 00115 g004
Figure 5. Expression of six RcCCDs by RNA-seq and qRT-PCR at three flowering stages. RcUBI2 was used as an internal control. Preserved samples of RNA-seq were used for qRT-PCR validation. RNA-seq values were the mean of three biological replicates and qRT-PCR values were the mean of three technical replicates. Black was RNA-seq expression and gray was the relative expression of qRT-PCR. The lower scale corresponded to RNA-seq RPKM and the upper scale corresponded to qRT-PCR values. EF: early-flowering, SF: semi-flowering, LF: late-flowering.
Horticulturae 09 00115 g005
Figure 6. The election of WGCNA soft threshold. (A): Scale independence diagram. The horizontal axis was soft thresholds, and the vertical axis was scale-free fit indices, with 0.9 at the red line. (B): Average connectivity plot. The horizontal axis was the soft threshold, and the vertical axis was the average connectivity.
Horticulturae 09 00115 g006
Figure 9. KEGG gene enrichment bubble map of seven target gene modules. On the left is the name of the KEGG pathway, and the size of the circle indicated the number of genes enriched.
Horticulturae 09 00115 g009
Figure 10. Gene co-expression network and hub genes in seven modules. Pink: hub gene, blue: blue module, yellow-green: yellow-green module, green: green module, brown: brown module, cyan: cyan module, turquoise: turquoise module, red: RcCCDs, black: black module.
Horticulturae 09 00115 g010
Figure 11. Expression patterns of the 20 hub genes at three flower development stages in R. hybrida ‘tianmidemeng’. Legend from red to blue indicated gene expression levels from high to low. EF: early-flowering, SF: semi-flowering, LF: late-flowering.
Horticulturae 09 00115 g011
Disclaimer/Publisher’s Note: The statements, opinions and data contained in all publications are solely those of the individual author(s) and contributor(s) and not of MDPI and/or the editor(s). MDPI and/or the editor(s) disclaim responsibility for any injury to people or property resulting from any ideas, methods, instructions or products referred to in the content.

