Article

A Cost-Effective Novel Biochemical Fertilizer for Better Managing Nutrient Levels and Vegetative Growth in the Immature Oil Palm (Elaeis guineensis Jacq.)

1
Department Land Management, Faculty of Agriculture, Universiti Putra Malaysia, Serdang 43400, Selangor, Malaysia
2
All Cosmos Bio-Tech Holding Corporation, PLO650, Jalan Keluli, Pasir Gudang Industrial Estate, Pasir Gudang 81700, Johor, Malaysia
3
Department of Agriculture Technology, Faculty of Agriculture, Universiti Putra Malaysia, Serdang 43400, Selangor, Malaysia
4
Department of Crop Science, Faculty of Agriculture, Universiti Putra Malaysia, Serdang 43400, Selangor, Malaysia
5
Institute of Tropical Agriculture and Food Security, Universiti Putra Malaysia, Serdang 43400, Selangor, Malaysia
*
Author to whom correspondence should be addressed.
Horticulturae 2022, 8(9), 758; https://doi.org/10.3390/horticulturae8090758
Submission received: 14 July 2022 / Revised: 12 August 2022 / Accepted: 19 August 2022 / Published: 23 August 2022
(This article belongs to the Topic Innovation and Solution for Sustainable Agriculture)

Abstract

:
The oil palm (OP) Elaeis guineensis is a robust feeder of nutrients and necessitates the adjustment and adequate allocation of nutrients for optimum growth and yields. Therefore, information on leaf nutrient concentrations during the immature stage is essential for maximal OP yield at the mature stage. Currently, in Malaysia, fertilizer by the standard practice application (Treatment 1; T1) is considered a cost-effective fertilization practice in terms of fertilization cost and the overall cost per palm oil tree per hectare. However, there is an idea to further reduce the costs of fertilizers and labour per hectare to make it more cost-effective. Therefore, the present study aims to develop a novel biochemical fertilizer by testing the Universiti Putra Malaysia (UPM) biochemical fertilizer (Treatment 2; T2) in the immature OP. Since the use of T1 has been well established in Malaysia, the present study is to compare the leaflets’ nutrient levels (nitrogen (N), phosphorus (P), potassium (K), magnesium (Mg), calcium (Ca), and boron (B)) and vegetative parameters (frond length (FL), frond number of leaves (FNL), frond width (FW), frond thickness (FT), chlorophyll index (CI), and the canopy of immature OP by using T2 to compare with those in T1. This study was conducted 6 to 48 months after planting (MAP) at the Telang OP plantation, Kuala Lipis (Pahang), from January 2015 to December 2018. Based on the chemical levels of the pre-treatment soil samples collected at the weeded circle area in January 2015 in the two depths (0–15 cm and 15–30 cm), there was no significant difference (p > 0.05) in all 11 chemical parameters (pH, total N, organic carbon (Org C), total P, available P (Av P), cation exchange capacity (CEC), exchangeable K, (Ex K), exchangeable Ca (Ex Ca), exchangeable Mg (Ex Mg), exchangeable aluminium (Ex Al) and B between T1 and T2. This indicated that the chemical levels in the OP soils in both T1 and T2 would not be significant factors when T1 and T2 were applied. All six leaflets’ nutrient levels showed at least ‘Optimum’ or ‘Excessive’ compared to the established guideline using T1 and T2. Overall, there was no significant (p > 0.05) difference in all the above six leaflets’ nutrient levels and six vegetative parameters between T1 and T2 based on the t-Test, multiple linear stepwise regression analysis, and correlation analysis. These results suggested that rates of T1 and T2 applied in this study are enough to provide the amount of nutrients needed to support the OP vegetative growth during the immature period. The estimated cost savings for the combination of T2 fertilizers per hectare (RM 1113.43 or 250 USD) and reduction of the number of rounds (RM 133.85; or 30 USD) of T2 fertilizer application would give a sum of total cost savings of at least RM 1247.25 (280 USD) per hectare. If only based on the T2 fertilizer per hectare, the economic benefit of the total cost saving is estimated to be at least 10.6%. In summary, this study recommends the utilization of T2 as a novel, cost-effective, and alternative biochemical fertilizer treatment for better management of immature OP plantations in Malaysia.

1. Introduction

Oil palm (OP) (Elaeis guineensis Jacq.) is an agricultural commodity with a high economic value in Malaysia and Indonesia. These countries require a relatively high amount of nutrients for optimum growth and fresh fruit production, which is the cost of the OP. However, the available land for the cultivation of OP generally has a low fertility level [1]. Therefore, the addition of nutrients in the form of fertilizers is necessary. Most importantly, the information on the soil nutrient status and OP leaf nutrient levels is essential for a suitable fertilizer application [2,3]. OP’s physiology requires the sufficiency of essential macronutrients with suitable fertilization rates in the specific OP plantation area to be identified so that OP can grow and reach maximum production [4,5,6].
According to Goh [7,8], fertilizer management for OP comprises the major field budget item in OP plantations management. Out of the production cost in Malaysia, 85% or more goes into purchasing fertilizers alone. Together with the leaching of nutrients due to high rainfall in Malaysia [9], an optimal amount and fertilizer application rate are required to provide the maximum benefit and high yield production at a low cost [2]. Using fertilizers accounting for 70–80% of overall production cost, is the most expensive input in OP cultivation [10]. Fertilizers can increase OP yields by 50–80% on fertility soils [11]. On the other hand, a large amount of fertilizer usage, an upsurge in the price of imported fertilizers, and an unpredictable economic situation contribute to higher production costs in Malaysia [7,8].
There were many trial studies on recommendations for economically optimum nutrient management in OP plantations [12,13,14,15,16,17,18,19,20,21]. These studies usually focus on a wide range of soil types, climatic factors, OP ages, the genetic potential of the planting materials, tree spacing, groundcover conditions, soil fertility [13,14,15,16,17,18,22,23,24,25,26], rates, and timing of fertilizer applications to reduce nutrient losses [12]. Besides, the reduction of chemical fertilizer inputs during the immature stage [25,26] is also equally important in the agricultural practices of OP.
Currently, in Malaysia, the fertilizer by the standard practice application (Treatment 1; T1) is considered a cost-effective fertilization practice in terms of fertilization cost and the overall cost per palm oil tree per hectare. However, there is an idea to reduce further the prices of fertilizers and labour per hectare to make it more cost-effective. It is hypothesized that using T2 can be more cost-effective in terms of reduced rate/round of fertilization and the overall cost per palm oil tree per hectare. The hypothetic economic benefit of the cost saving is estimated at least 10%. In the present study, the novel Universiti Putra Malaysia (UPM) biochemical fertilizer (Treatment 2; T2) was tested to see its efficacy in nutrient levels and vegetative growth compared to the T1 in the immature OP.
Therefore, the present study aims to develop a novel biochemical fertilizer by testing the Universiti Putra Malaysia (UPM) biochemical fertilizer (Treatment 2; T2) in the immature OP. Since the use of T1 is well established in Malaysia, the present study is to compare the leaflets’ nutrient levels (nitrogen (N), phosphorus (P), potassium (K), magnesium (Mg), calcium (Ca), and boron (B)) and vegetative parameters (frond length (FL), frond number of leaves (FNL), frond width (FW), frond thickness (FT), chlorophyll index (CI), and canopy) of immature OP by using T2 to compare with those in T1. The specific objectives of this study were (a) to determine the chemical parameters of soil samples before the treatments in the trial sites at Telang OP plantation, Kuala Lipis (Pahang), between T1 and T2; (b) to determine the variations of the six nutrient concentrations in the OP leaflets in the trial site between T1 and T2; (c) to determine the variations of the six vegetative parameters in the trial sites between T1 and T2; (d) to understand the relationships of OP leaflets’ nutrient concentrations and vegetative parameters in the trial sites between T1 and T2.
The T2 combines plant growth promoting rhizobacteria (PGPR) and organic and inorganic materials produced in pellet form. The PGPRs are incorporated into the fertilizer using low temperature and pressure bio-stabilized technology. This would enhance the retention of the fertilizers’ nutritional content, benefit the soil’s long-term quality, and keep beneficial microorganisms active upon application to the soil. This is called biochemical fertilizer because the viable microorganisms in the fertilizer are high at 1 × 10⁶ to 6 × 10⁷ CFU/g after pelleting. The pelleting temperature is below 50 °C, and the pressure is between 2000 psi to 6000 psi, while the survival rate of the microbe has been ensured. The bio-stabilized technology has managed to produce multifunctional fertilizers which provide sufficient nitrogen, phosphorus, and potassium (NPK) nutrients, organic matter, and beneficial microorganisms that can enhance the growth of OP. This novel biofertilizer has not been tested in trials and is the first report in the literature.

2. Materials and Methods

2.1. Planting of Seedlings during Pre-Nursery

The soils from the study site were ploughed and brought from an estate of OP nursery for polybag filling. Four-month-old seedlings from the pre-nursery site were used for transplantation to the main nursery in this field trial experiment. Ten to 12 cm of seedling height was chosen with three to four pairs of leaves. The soil was scooped out from a large polybag size (15 × 18 inches) to leave a planting hole with a depth equal to a polybag. These planting holes were shaped, with the width at the bottom being at least 4 inches for each. On the day before planting, the large polybags were watered to facilitate soil handling at transplanting. As soon as a nursery block was planted, the lateral irrigation pipes and micro spray in that section of the nursery should be re-checked to ensure the polybags received the same amount of water. Frequent irrigation was given 1 L per day during the first three months and 1.5 L per day until eight months.
Fertilizer was applied every month up to eight-month-old at the main nursery. The schedule and quantity of fertilizers were used at monthly intervals immediately after weeding. The initial applications of 10 g NPK were given 3 to 4 weeks after planting in the large polybags. This means that seedlings would receive nine applications during their period in the main nursery. Since fertilizer application rates vary according to the period in the nursery, it is essential to draw up a fertilizer application schedule geared to the planting schedule to ensure that plants of different ages receive the correct quantity. The basic steps methods of fertilizer application confirmed the appropriate application rate for each block to be fertilized on any given day. This involved checking the planting date in the main nursery and the last application date. The rates of fertilizers applied (by even broadcasting in the polybags) were given according to the rate presented in Table S1. Nutrient types and manuring programs were followed as normal standard OP nursery practices.

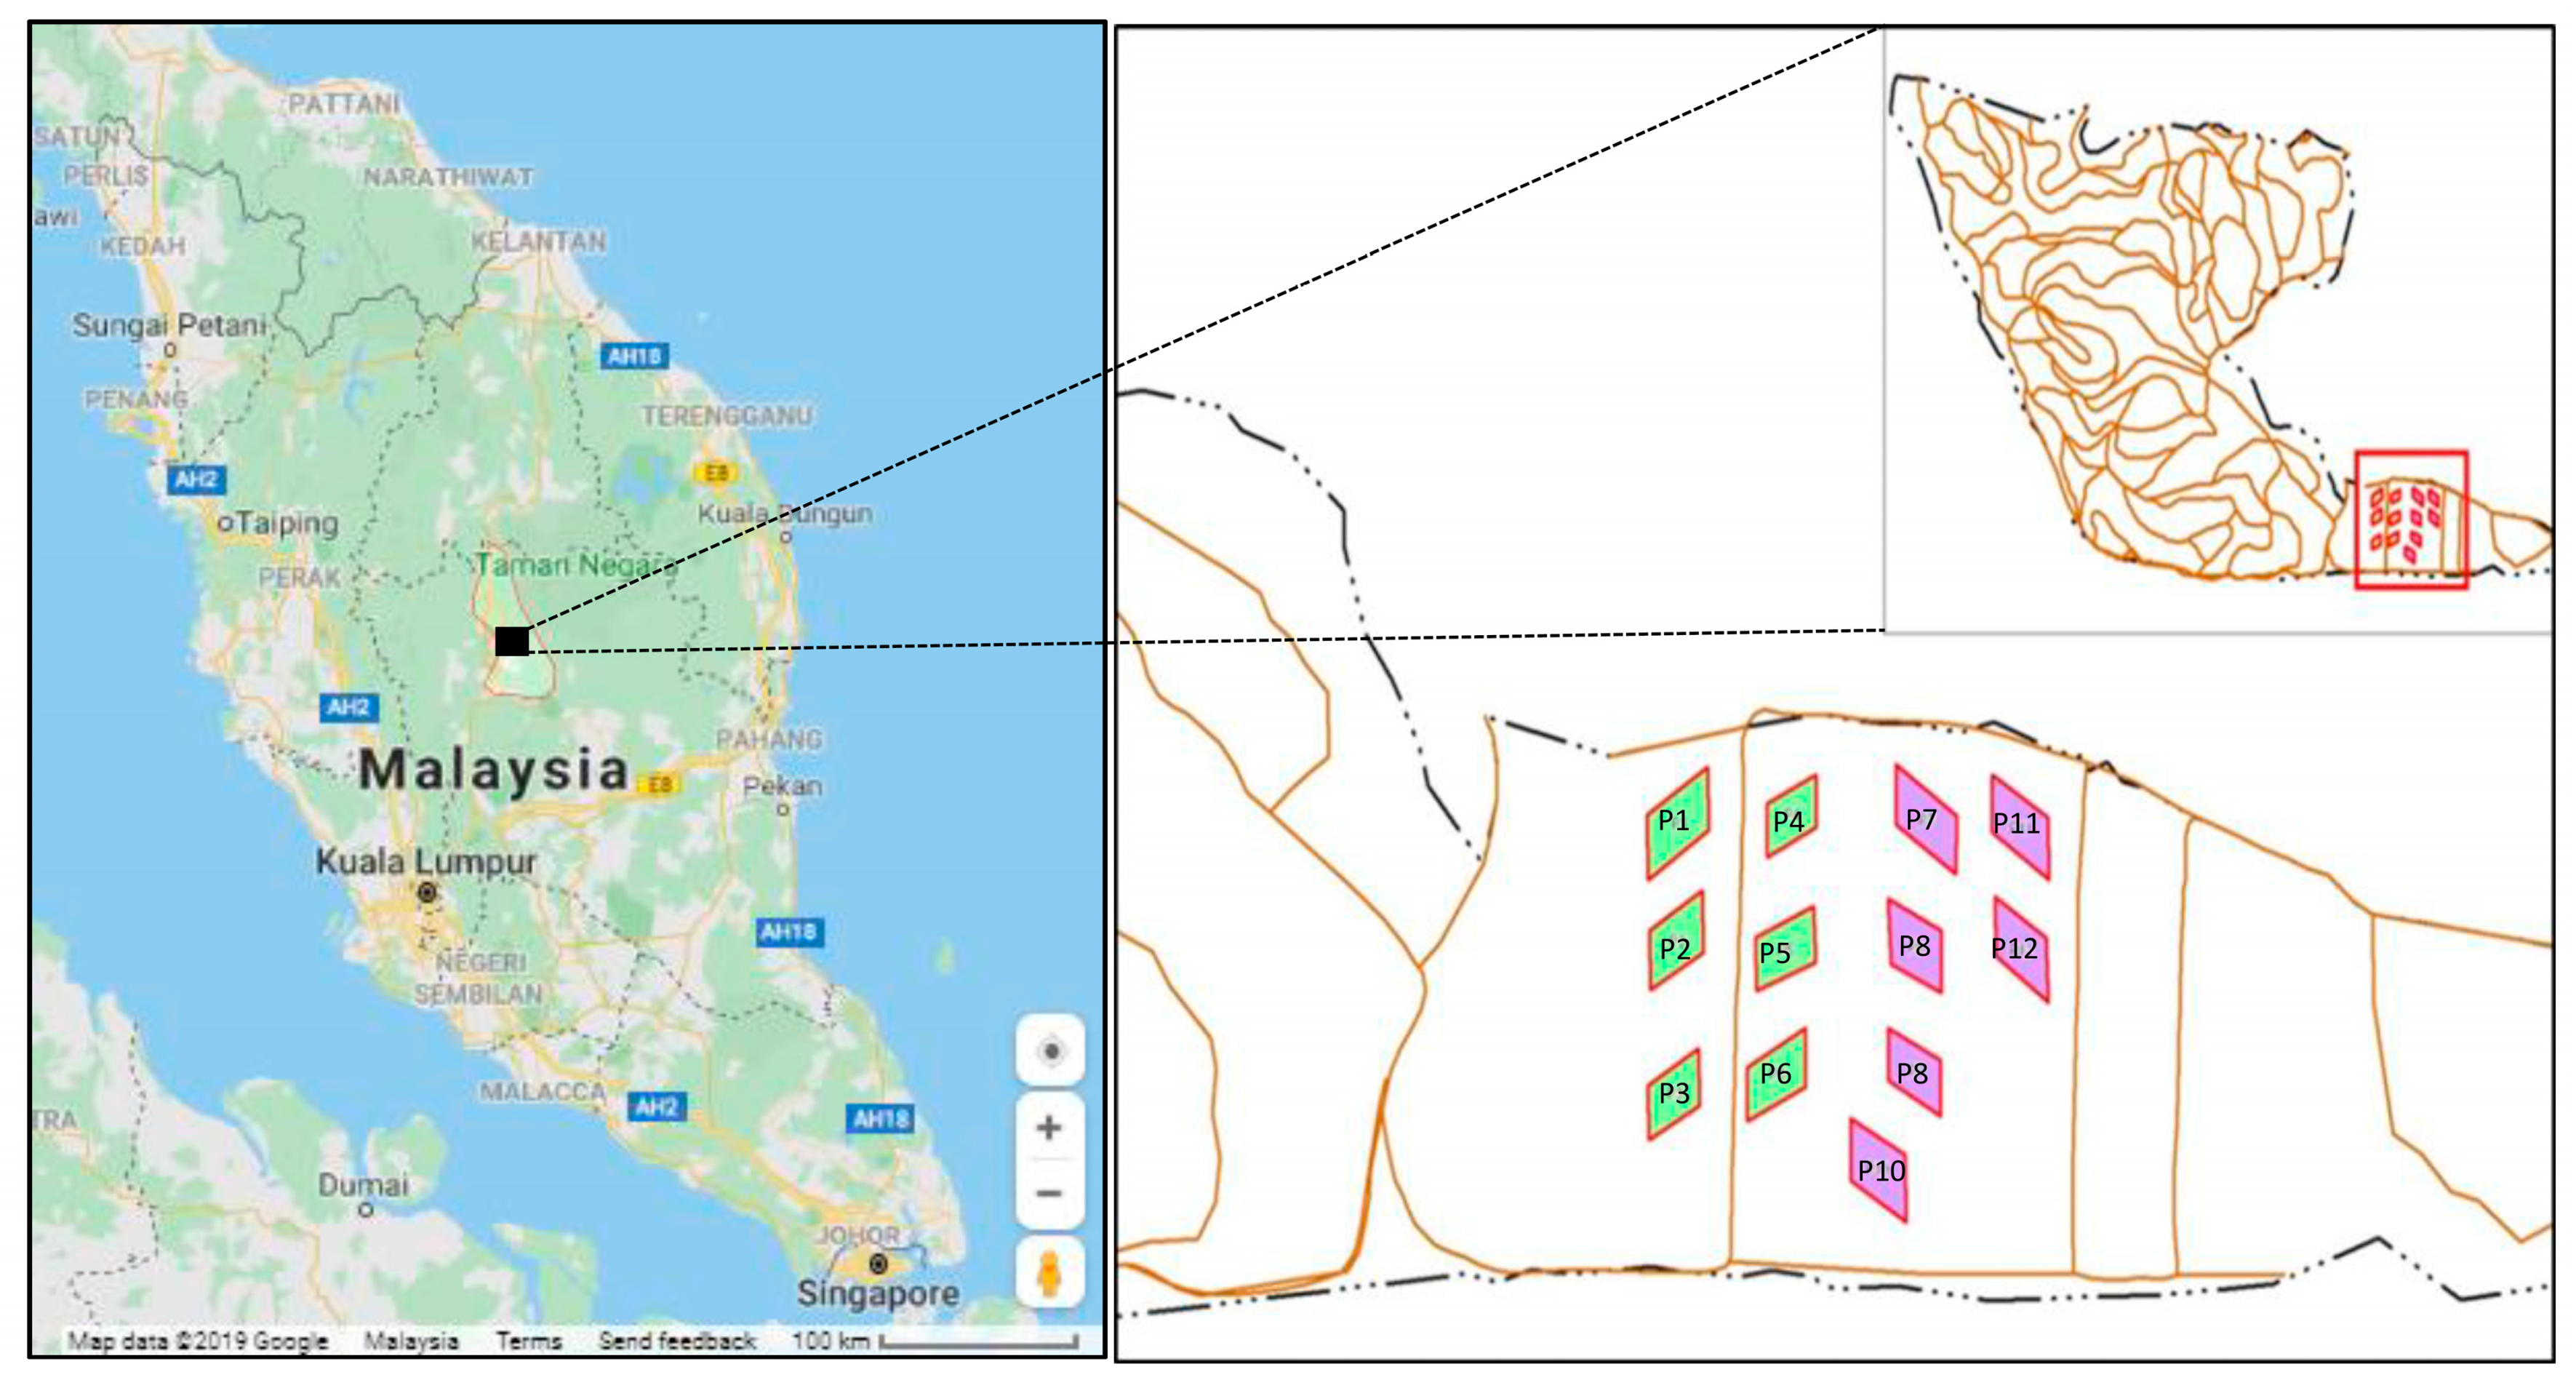
2.2. Field Trial Site and Research Setup

After eight months of nursery periods, the OP trees were transferred to a 3.2 ha block of Telang trial plot, Kuala Lipis, Pahang (Figure 1). Based on World Weather Online [27] in Figure 1, weather data showed that the study area experienced a dry season (<100 mm/month) between January–April 2015, July 2015, January–April 2016, June–October 2017, January–March 2018, and May–October 2018. The study area experienced a wet season (>200 mm/month) between April–May 2015, November–December 2016, March–May 2017, and November–December 2018. The climate is humid tropical, with an average annual temperature ranging from 24 °C to 31 °C (Figure 1) and annual precipitation of 3613 mm.
The variety of OP used in this trial study was D × P Yangambi palms (D × P tenera seed as planting material) (3.2 ha block for T1 and T2). For the experimental design, a t-Test block design is used for this trial. The experimental trials consisted of two blocks; each block was adjacent to the other (Figure 1). One block represented one treatment and consisted of six replicates for each treatment. One replicate has 12 (4 × 3) recording palm trees. Overall, two treatments (T1 and T2; two blocks) were applied for a total of 144 recording OP trees divided into Block 1 (T1) and Block 2 (T2), each with 6 replicates for each treatment.
The fertilizer application periods and rounds for T1 and T2 at the Telang trial project from 2015–2018 (48 months after planting (MAP)) are presented in Table S2. The fertilizer application rounds for T1 and T2 are inserted with rainfall data cited from World Weather Online [27] for Kuala Lipis from January 2015 to December 2018 (Figure 2). The compositions of fertilizer applications in T1 and T2 from 2015–2018 are given in Table S3. Additionally, all experimental palms received a fertilizer regime/composition application according to T1, and applications of T1 and T2 from 2015–2018 are shown in Table S3.

2.3. Sampling and Chemical Analysis of Soils

Soil sampling during pretreatment was conducted in January 2015, before the application of T1 and T2. The total sample size was 144 (72 from T1 and 72 from T2) for weeded circle (WC) soils. The soil samples were collected using an auger soil collector at two soil depths of 0–15 cm and 15–30 cm.
Soil samples were air dried in plastic trays or open plastic bags and ground. Later, the samples were sieved to <2 mm after grinding to remove debris and aggregates and improve homogeneity. The soil samples were first air-dried and then oven-dried at 65 °C for 48 h. After drying, the samples were sent to an accredited analytical laboratory in Pahang for further analysis.
All the soil samples were analyzed for pH, total N (Tot N), organic carbon (Org C), total P (Tot P), available P (Av P), cation exchange capacity (CEC), exchangeable K (Ex K), exchangeable Ca (Ex Ca), exchangeable Mg (Ex Mg), exchangeable aluminium (Ex Al) and B. The soil analyses followed the methods of Anderson and Ingram [28] (1992) and the Manual of Soil Analysis [29]. The methodologies for the elemental analysis followed those set out in the Malaysian SIRIM [30] Standards. Standard Malaysia Accredited Laboratory has verified all the soil data with a certificate number of 025/2017.

2.4. Sampling and Nutrient Analysis of Leaflet and Rachis

Samplings for leaflets and rachis in the fronds were conducted from July 2015 until December 2018 on 6, 12, 18, 24, 30, 36, 42, and 48 MAP. The total sample size was 144 (72 from T1 and 72 from T2) for leaflets and rachis. Both T1 and T2 were sampled in the same periods and by the same research personnel, and there were no significant differences in treatment methods. The leaflet and rachis samples were gathered from the 17th frond of the palm using the recommended protocol [31]. The 17th frond was selected because this allowed year-on-year comparisons and compared with established critical nutrient levels [31].
A 15 cm length sample was cut into small slices approximately 1 cm thick to facilitate drying. All the rachis samples from one plot were bulked in one bag. The collected leaf samples were washed first with tap water, followed by 0.2% detergent, 0.1 N hydrochloric acid (HCl), and double-distilled water. The excess water is removed using blotting papers. Rachis sample was chosen from the same point on the frond where leaflet samples were collected. The leaflets and rachis were oven-dried at 105 °C for 2 h before laboratory analysis followed the plant analysis manual [32]. The dried samples were powdered in a stainless-steel mill, followed by grounding to pass through a one mm sieve, and kept in labelled plastic bags.
The methodologies for the nutrient analysis followed those set out in the Malaysian SIRIM [30] Standards. For the nutrient analysis, the following analyses were carried out: (i) nitrogen (N) through sulphuric acid digestion and semi-micro Kjeldahl distillation; (ii) phosphorus (P) through ashing followed by spectrophotometric analysis (vanadomolybdate method); (iii) potassium (K) using [a flame photometer after ashing; (iv) calcium (Ca) and magnesium (Mg) by Atomic Absorption Spectrophotometer (AAS; Analyst 100, USA) after ashing; and (v) boron (B) by using a colourimetric method after dry-ashing with CaO.

2.5. Vegetative Measurements

Vegetative measurements were conducted from July 2015 until December 2018 on 6, 12, 18, 24, 30, 36, 42, and 48 MAP at the 17th frond of each OP tree [33]. Following the recommended protocol by Woittiez et al. [31], the vegetative parameters investigated were the FL, NL, FW, FT, CI, and canopy.
Chlorophyll content was recorded using a chlorophyll meter (SPAD 502 Plus Chlorophyll Meters; Konica Minolta, Tokyo, Japan). Frond 3 was selected to obtain the leaf chlorophyll data.

2.6. Data Treatment

The balance between the different nutrient concentrations was calculated for (i) critical P in the leaflets and (ii) total leaf cation (TLC), which were based on K, Mg, and Ca in the leaflets. Leaflet P concentrations are closely related to leaflet N concentrations, and the critical deficiency threshold for P depends on the concentration of N [34]. Hence, the critical P level was calculated using the following equation:
Critical P (%) = 0.0487 Leaflet N (%) + 0.039
Thus, changes in leaflet N affect N and P status indirectly, with P and N in % dry matter [34].
Deficiency thresholds for leaflet cations (Ca, K and Mg) are also closely related. The TLC concentration was calculated using the following equation:
TLC = (leaflet Ca/20.05 + leaflet K/39.1 + leaflet Mg/12.15)
where TLC is measured in cmol/kg dry matter and leaflet Ca, K, and Mg are measured in % dry matter [35]. The optimum values for leaflet Ca, K, and Mg were calculated relative to the TLC concentration by dividing the leaflet nutrient concentrations in cmol/kg (for example, leaf K/39.1 × 1000) over the TLC concentration.

2.7. Statistical Analyses

All graphical histograms were established using the KaleidaGraph (Version 3.08, Synergy Software, Eden Prairie, MN, USA). Although there are other ways of verifying normality, when the sample size is small (N < 50), the Shapiro–Wilk test was selected since it has greater sensitivity to identify non-normality and is the most common and widely used approach [36,37,38].
Based on the normality test of Shapiro-Wilk (Table S4), for T1, the data of MAP, P, Ca, Mg/TLC, Ca/TLC, Critical P, Rachis P, FNL, FW, FT, CI, and Canopy were found to have the significance values of the Shapiro-Wilk Test below 0.05, indicating the data significantly deviated from a normal distribution. For T2, those data having significance values below 0.05 were found as MAP, P, K, Ca, B, K/TLC, Ca/TLC, Critical P, Rachis P, FNL, FW, FT, and CI. They were log10[mean + 1] transformed prior to the t-Test, multiple linear stepwise regression analysis (MLSRA), and correlation analysis (CA). This log10-transformation was to meet the assumption of normality required for the regression model and to stabilize the variance and the lack of normality to produce a frequency distribution nearer to a normal distribution [39,40]. The MLSRA, CA, and t-Test were performed using STATISTICA (Version 10; StatSoft. Inc., Tulsa, OK, USA, 1984–2011).
The parameters between T1 and T2 were statistically analyzed using t-Test analysis. The relationships between nutrient levels and their vegetative parameters were investigated using Pearson’s CA and MLSRA. This has been shown by many studies on relationships between a dependent variable and independent variables [41,42,43,44,45]. These analyses aim to compare the statistical outputs between T1 and T2.
For CA, the correlations between the six vegetative parameters (Canopy, CI, FL, FNL, FT, and FW) and the tissue nutrient concentrations (N, P, K, Ca, Mg, B, TLC, K/TLC, Mg/TLC, Ca/TLC, Critical P, Rachis P, and Rachis K) and MAP, were performed.
For the MLSRA, the vegetative growth parameters (Canopy, CI, FL, FNL, FT, and FW) as the dependent variables, while MAP (palm age) and tissue nutrient concentrations (N, P, K, Ca, Mg, B, TLC, K/TLC, Mg/TLC, Ca/TLC, Critical P, Rachis P, and Rachis K) as the independent variables.

3. Results

3.1. Chemical Levels of the Pre-Treatment Soil Samples

Comparisons of chemical concentrations in pre-treatment soils of OPs between Treatment 1 (T1) and Treatment 2 (T2) from two different depths (0–15 cm and 15–30 cm) collected from the WC area are presented in Tables S4 and S5.
Based on Table S5, for T1 (T2), based on soils collected from WC from two layers (0–15 cm and 15–30 cm), the chemical values range from 3.99 to 4.47 (4.20–4.37) for pH, 0.10–0.14 (0.08–0.11) for Tot N, 1.65–3.26 (1.46–2.44) for Org C, 106–410 (103–368) for Tot P, 2–33 (5–12) for Av P, 3.62–6.16 (2.38–5.95) for CEC, 0.09–0.15 (0.06–0.14) for Ex K, 0.41–1.63 (0.91–1.57) for Ex Ca, 0.09–0.68 (0.10–0.58) for Ex Mg, 0.28–0.75 (0.32–0.51) for Ex Al, and 1.22–2.44 (1.59–2.13) for B. There is no significant difference (p > 0.05) in all chemical parameters between the surface (0–15 cm) and deeper soils (15–30 cm). Also, there is no significant difference (p > 0.05) in all chemical parameters in the soils collected from WC from the two layers between T1 and T2.
Comparisons of chemical levels in the pre-treatment soils collected at WC of OPs between the present study and some reported studies in the literature are presented in Table 1. In general, the present chemical levels in the soils were comparable with some reports in the literature from Sabah and Indonesia but different from Ghana and India.
Based on Bangawat soils in Sabah, Afandi et al. [46] reported that most of the chemical parameters are very high compared to the nutrients required by the palms except for Av P and Org C. In general, most soil nutrients decrease with depth, especially the mobile nutrients such as N and K. Av P is much higher in the topsoil (11.9 mg/kg) because P is relatively immobile. They reported that Ex Ca and Ex, Mg does not change significantly with depth. The very high Ex Ca [13.68–16.02 cmol(+)/kg], and Ex Mg [6.04–6.33 cmol(+)/kg] will most probably affect K uptake or even Mg uptake due to the dominance of Ca2+ ions in the soil [46].
Based on sandy soils in Central Kalimantan of Indonesia (T1; 0–20 cm), Tao et al. [47] measured key soil properties of each treatment block at 0–0.2 m depth in the palm circle area before the start of the trial. All the treatment blocks had sandy textured soil with 77–88% sand contents. Soils in these blocks were acidic, with their pH ranging between 4.3 and 5.3. The soils contained high Org C, ranging between 3.1 and 4.9%. Ex K, Ex Mg, and Ex Ca levels across treatments were 0.08–0.41, 0.08–0.27, and 0.46–1.34 cmol/kg, respectively. Based on soils in the WC (0–40 cm) OP in Ghana, Rhebergen et al. [48] reported the mean values of 5.30 for pH, 0.12% for Tot N, 1.21% for Org C, 7.0 mg/kg for Av P, 0.117 cmol/kg for Ex K, and 0.82 cmol/kg for Ex Mg. Behera et al. [49] reported that the soil parameters were pH (mean: 6.94) and Org C contents (mean: 1.16) for the topsoils (0–20 cm), while pH (mean: 6.81), and Org C contents (mean: 0.79) for the deeper soils (20–40 cm). Goh and Chew [50] reported the critical levels for pH (4.00), Tot N (0.12%), Org C (1.20%), Total P (200 mg/kg), Av P (15 mg/kg), CEC (12 cmol(+)/kg), Ex K (0.20 cmol(+)/kg), and Ex Mg (0.20 cmol(+)/kg). The comparison with the present findings indicated that the pH, Org C, and Ex Mg were above the critical levels, and Total N and Tot P were within the borderline or slightly lower than the respective critical levels. At the same time, Av P, CEC, and Ex K were all lower than the critical levels.
In summary, there are no significant differences (p > 0.05) in pH, Tot N, Org C, Tot P, Av P, CEC, Ex K, Ex Ca, Ex Mg, Ex Al, and B levels between the surface (0–15 cm) and deeper soils (15–30 cm). Also, there is no significant difference (p > 0.05) in all chemical parameters in the soils collected from WC from the two layers between T1 and T2.

3.2. Variations of Nutrient Concentrations (N, P, K, Ca, Mg and B) in the Leaflets of Fronds

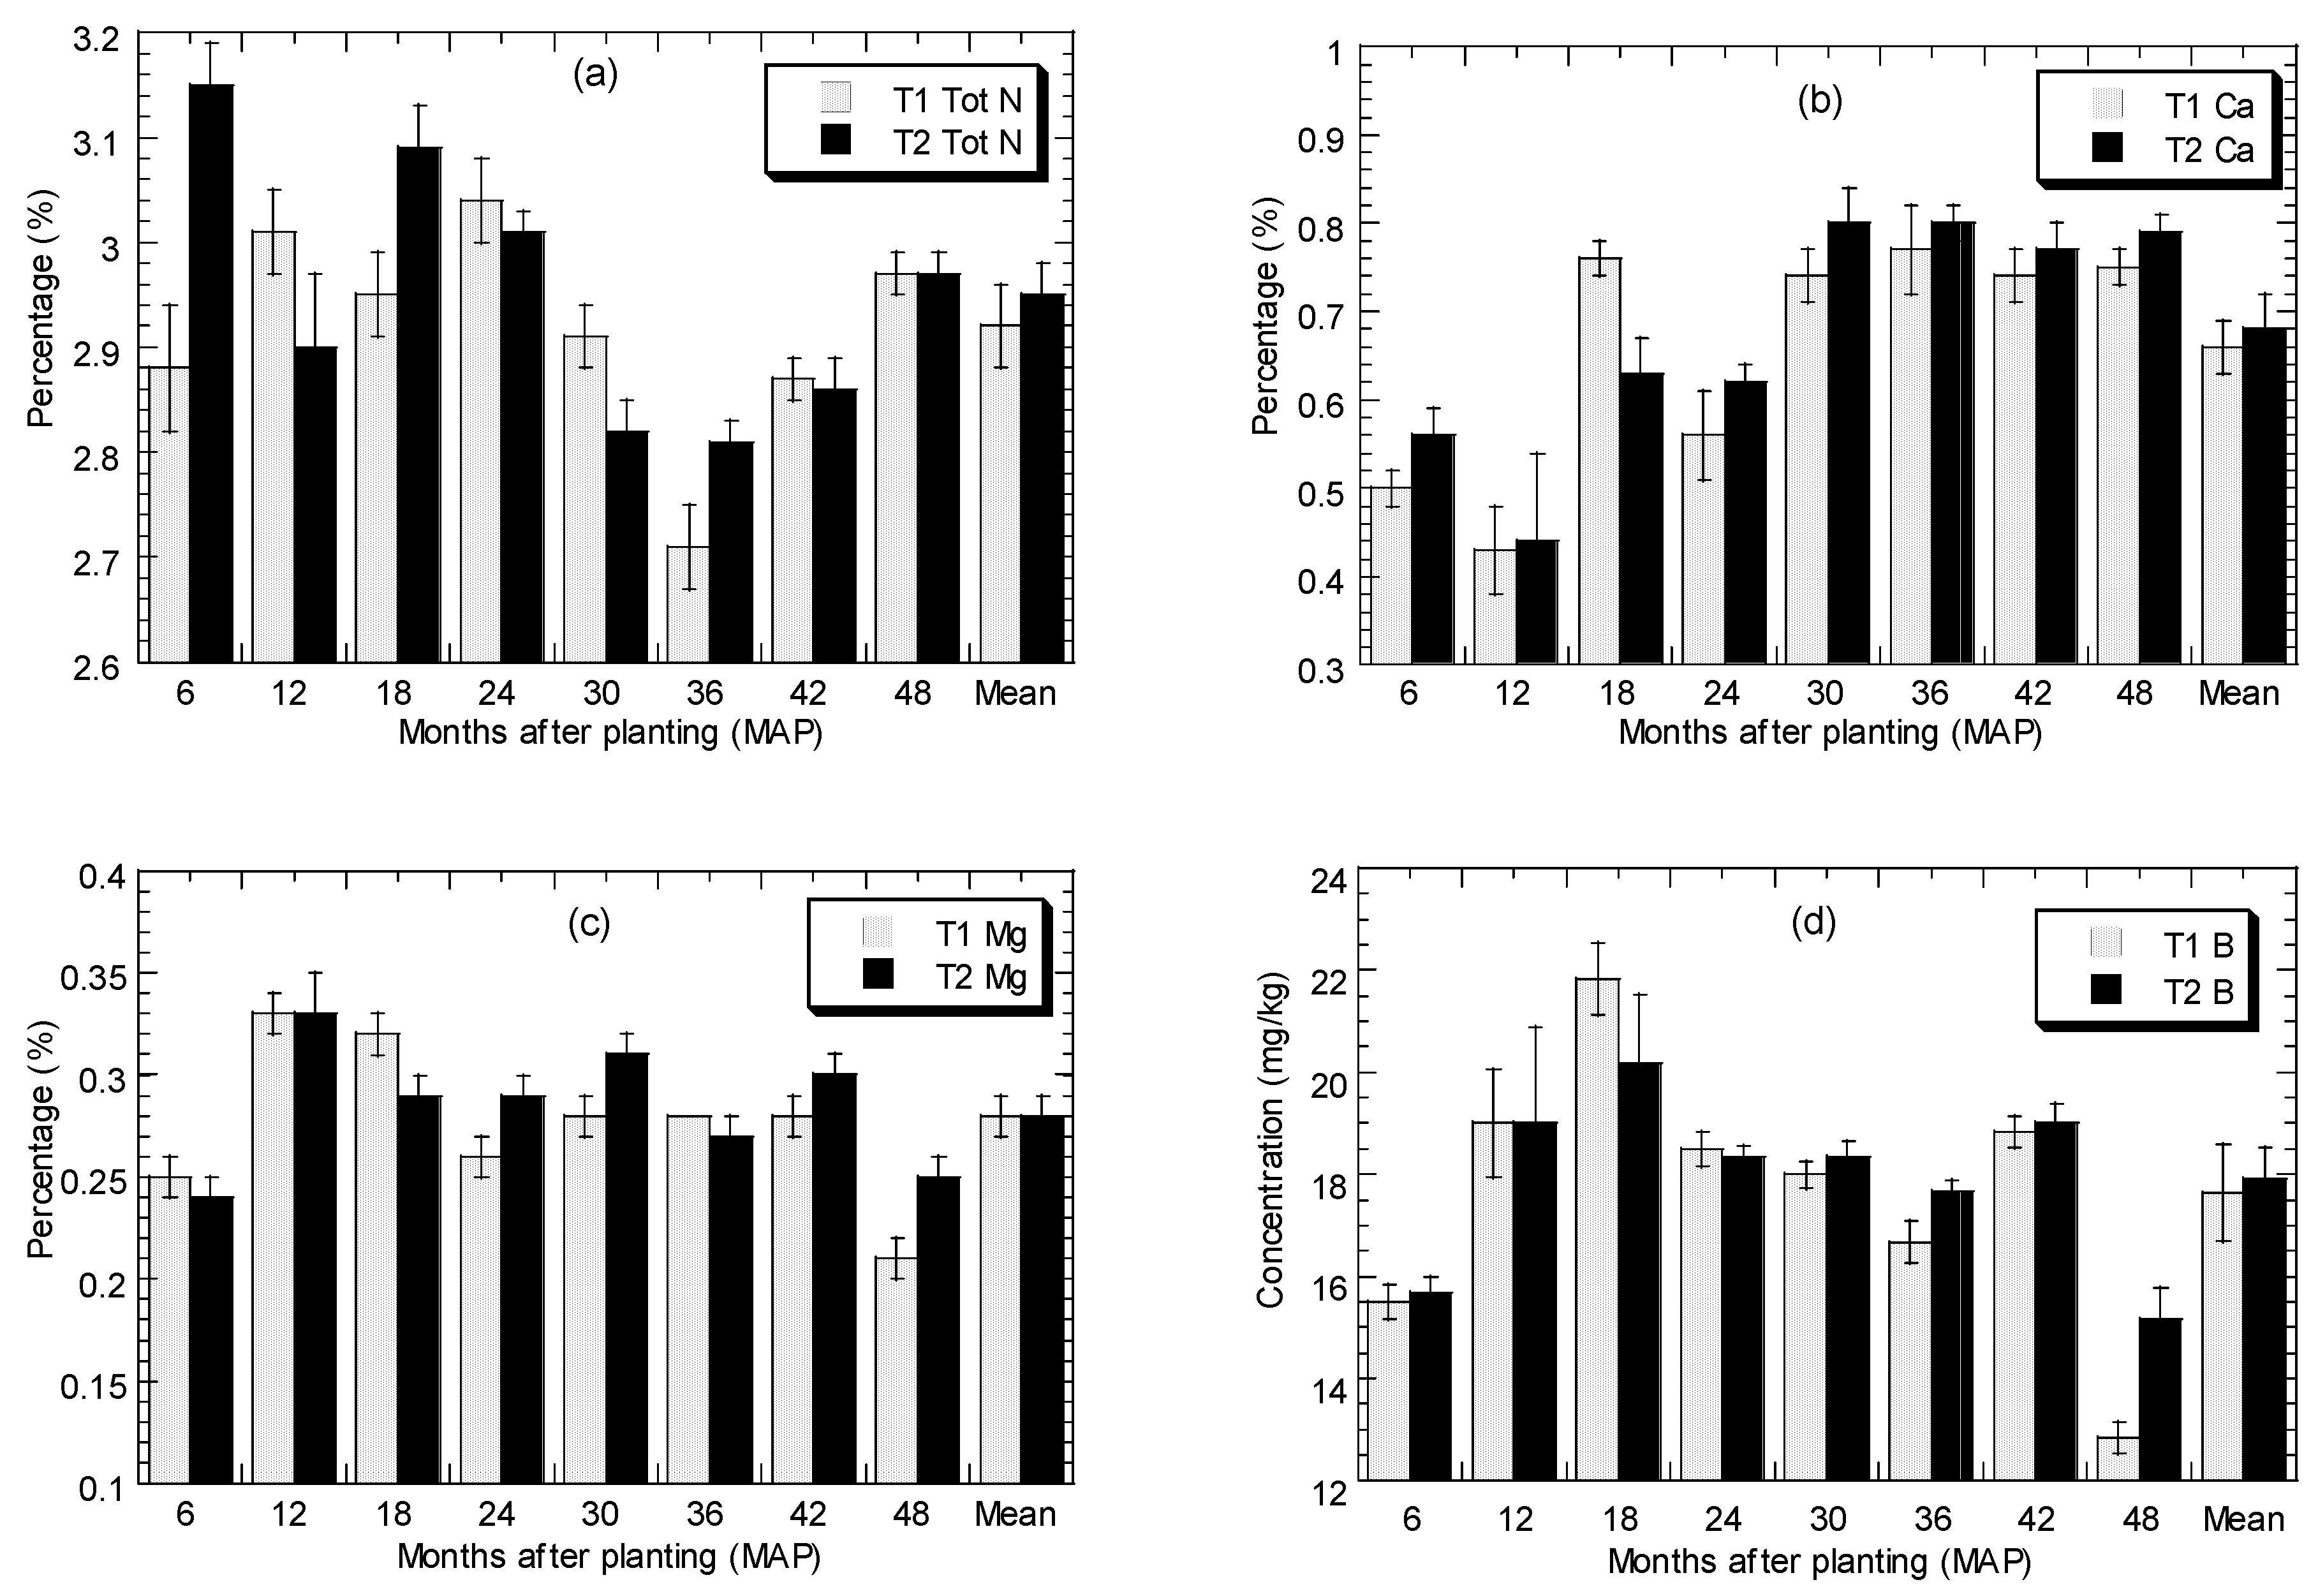
3.2.1. Concentrations of Na, Ca, Mg and B in the Leaflets

Sodium

The overall mean concentrations (%) of N in the fronds of OP from the present study are given in Tables S4 and S6. Variations of N concentrations in the leaflets and rachis are presented in Figure 3a.
Based on Figure 3a, N levels range from 2.57–3.21% and 2.70–3.25% for T1 and T2, respectively. T2 has significantly (p < 0.05) increased the level of total N uptake in the leaflets of OP in six MAP, 18 MAP, and 36 MAP in comparison to those of T1. However, the use of T1 has significantly (p < 0.05) increased the level of total N uptake in the leaflets of OP in 12 MAP and 30 MAP. There is no significant difference (p > 0.05) for total N uptake in the leaflets of OP between T1 and T2 for 24 MAP, 42 MAP, and 48 MAP. All these results show that total N uptake in the leaflets of OP in T2 is insignificantly (p > 0.05) different from T1 and therefore is almost like those in T1, as shown in the mean value of total N between T1 (2.92 ± 0.04, %) and T2 (2.95 ± 0.04), although T2 is higher than T1. The above results indicated that the use of T2 is very comparable to T1 in terms of total N uptake in the leaflets of OP.
Woittiez et al. [51] reported that average leaflet N concentrations were 2.33% in Jambi and 2.66% in Sintang (Indonesia). Based on the study by Behera et al. [52] on OP plantation in west Godavari district (India), they reported that the OP leaflets’ nutrient concentration of N was 0.62–3.97%, while Lee et al. [53] recorded 2.49–2.81% N, in the leaf samples of FELDA clone and FELDA D × P planting material grown in Pahang, Malaysia. Behera et al. [54] recorded mean values of leaf nutrient concentration of 2.21–2.49% N in OPs of different areas of India. Behera et al. [49] reported 2.26% N in OP leaflets in the Southern Plateau of India, Tao et al. [47] reported 2.59–2.50% N in the OP leaflets in Central Kalimantan, Rhebergen et al. [48] reported 2.51% N in OP leaflets of Ghana smallholders while Afandi et al. [46] reported 2.53% N in Bengawat Soil in Sabah. Based on the immature OP of 13 MAP, Amirruddin et al. [4] reported the leaflet N content (%) ranged from 1.59 for N treatment (0.011 kg/palm) to 2.52 for N treatment (0.063 kg/palm). Afandi et al. [46] reported that at 30 MAP, the total N reserve (0.12% to 0.21% N) in the ex-jungle soil could sustain the early growth of OP.
According to the total N guideline in leaves of OP of 1–6 years (or >6 years) after planting suggested by Fairhurst and Mutert [9], the three total N concentrations (%) are ‘Deficiency (<2.50)’, ‘Optimum (2.60–2.90)’, and ‘Excessive (>3.10)’. Based on this N guideline, all MAPs show ‘Excessive’ N except for 36 and 42 MAPs. These two MAPs show ‘Optimum’ N. Between T1 and T2, T2 shows significantly (p < 0.05) higher levels of N at 6, 18, and 36 MAPs. T1 shows higher levels of N at 12, 24, 30, and 42 MAPs. Overall, the mean N level for T2 is higher (not insignificantly p > 0.05) than that in T2, both are considered ‘Optimum’. With increasing MAPs in the present study, the distribution of N to the leaflets will decrease because of the increased N amount that will be distributed to other parts of OP, such as the trunk [19,20].
Woittiez et al. [51] reported that the leaflet N concentrations in the OP from Jambi (Indonesia) were often in deficiency because of suppressed P mobilization from the reserve tissue into the OP leaflets [55]. However, in the present study, the N levels from 6 to 48 MAP are all above the ‘Optimum (2.60–2.90%)’ as suggested by Fairhurst and Mutert [9].
Nitrogen, a mobile element within OP, is the most abundant nutrient in plants, constituting 2 to 4% of plant dry matter. In addition to the process of N fixation occurring in legumes, plants can absorb N in the form of the nitrate ion (NO3−) or ammonium ion (NH4+) [5]. According to a review by Amirruddin et al. [4], N is an essential component of amino acids, proteins, and nucleic acids. These organic compounds play important roles in forming chlorophyll and vegetative growth in the OP [56] and in respiration and transpiration [24]. In the case of N deficiency, the symptoms are chlorosis in younger leaves and stunting [57,58]. The N application to the OP can affect the susceptibility to pests and diseases, the quality of fresh fruit bunch, and oil quality as well [24]. The N fertilizer application is needed to compensate for the N losses due to surface runoff, leaching, and denitrification that influence the N nutrient uptake by OP [24].

Calcium

Based on Figure 3b, Ca levels range from 0.29–0.90% and 0.25–0.96% for T1 and T2, respectively. There is no significant difference (p > 0.05) for Ca levels in the leaflets of OP between T1 and T2 for all the periods of sampling except for 18 MAP, in which T1 is significantly (p < 0.05) higher than that in T2. One interesting pattern is that Ca levels in the leaflets of T2 leaflets are always higher than those in T1 in all the MAPs except for 18 MAP. Overall, all these results show that Ca levels in the leaflets of OP in T2 are higher but not significant (p > 0.05). Therefore, the Ca levels in T2 are almost like those in T1, as shown in the mean value of Ca between T1 (0.66 ± 0.05, %) and T2 (0.68 ± 0.05, %). Again, the above results indicated that T2 is very comparable to T1 in terms of Ca uptake in the leaflets of OPs.
A study by Behera et al. [52] on OP plantations in the West Godavari district (India) reported that the leaflets’ nutrient concentration of Ca was 0.66–2.66%. Lee et al. [53] recorded Ca concentrations of 0.68–1.02% in the leaf samples of the FELDA clone and FELDA D × P planting material grown in Pahang, Malaysia. Behera et al. [49] reported 1.78% Ca in the OP leaf of the Southern Plateau of India, Tao et al. [47] reported 0.81–0.82% Ca in the OP leaflet of Sandy soils Central Kalimantan, Rhebergen et al. [48] reported 0.72% Ca in OP leaf of Ghana smallholders while Afandi et al. [46] reported 0.61% Ca in Bengawat Soil in Sabah.
According to the Ca guideline in OP leaflets of 1–6 years (or >6 years) after planting suggested by Fairhurst and Mutert [9], the three Ca concentrations (%) are ‘Deficiency (<0.30)’, ‘Optimum (0.50–0.70)’, and ‘Excessive (>0.70)’. Two levels can be categorized based on the Ca guideline. Firstly, periods of 6, 12, and 24 MAPs are considered ‘Optimum’ while 18 (only T1), 30, 36, 42, and 48 MAPs are categorized as ‘Excessive’ in both T1 and T2. However, the overall mean Ca levels in both T1 and T2 are considered ‘Optimum’.
Calcium is the least abundant macronutrient in plants. Plant roots absorb it as the divalent cation Ca2+. This element is essential in cell division, growth, root lengthening, and activation or inhibition of enzymes. It is immobile in the phloem. Ca deficiency is seen first on growing tips and the youngest leaves, which is often related to the inability of Ca to be transported in the phloem of OP [59].

Magnesium

Based on Figure 3c, Mg levels range from 0.16–0.38% and 0.19–0.41% for T1 and T2, respectively. There is no significant difference (p > 0.05) for Mg levels in the leaflets of OP between T1 and T2 for all the periods of sampling. The Mg levels in all the periods of T1 are higher than those in T2, except for 18 and 36 MAPs. Overall, all these results show that Mg levels in the OP leaflets in T2 are higher than in T1 but not significant (p > 0.05). Therefore, the Mg levels in T2 are almost like those in T1, as shown in the mean value of Mg between T1 (0.275 ± 0.01, %) and T2 (0.285 ± 0.01, %). The above results indicated that T2 is stabilized or less variable with increasing MAP in terms of Mg uptake in the OP leaflets.
Woittiez et al. [51] reported that average leaflet Mg concentrations were 0.39% in Jambi and 0.28% in Sintang (Indonesia), which is considered high in both areas. Based on the study by Behera et al. [52] on OP plantations in the West Godavari district (India), they reported that the leaflet’s nutrient concentration of Mg was 0.10–1.03%. Lee et al. [53] recorded 0.17–0.26% Mg in the leaflet samples of the FELDA clone and FELDA D × P planting material grown in Pahang (Malaysia). Behera et al. [49] reported 0.61% Mg in OP leaflets of Southern Plateau of India, Tao et al. [47] reported 0.22–0.24% Mg in the OP leaflet of Sandy soils Central Kalimantan, Rhebergen et al. [48] reported 0.41% Mg in OP leaf of Ghana smallholders while Afandi et al. [46] reported 0.25% Mg in Bengawat Soil in Sabah.
According to the Mg guideline in leaflets of OP of 1–6 years (or >6 years) after planting suggested by Fairhurst and Mutert [9], the three Mg concentrations (%) are ‘Deficiency (<0.20)’, ‘Optimum (0.30–0.45)’, and ‘Excessive (>0.70)’. Since all the MAPs range from 0.21 and 0.33%, this shows that all T1 and T2 of all periods of MAPs cannot be categorized as ‘Deficiency’ and are close to ‘Optimum’.
Plants take up Mg in the form of Mg2+. This element is vital for photosynthesis, activation of enzymes, energy transfer, maintenance of electrical balance, production of proteins, and metabolism of carbohydrates. This mobile element is readily translocated from older to younger plant parts [60,61]. However, the effect of Mg deficiency on OP can cause reduced yield and oil/bunch ratio. Visual deficiency symptoms of N include yellow/orange colour in leaflets of older leaves exposed to sunlight [23,57,58].

Boron

Based on Figure 3d, B levels range from 12.0–25 mg/kg and 13.0–27.0 mg/kg for T1 and T2, respectively. T2 has increased (although not significantly, p > 0.05) the level of B uptake in the leaflets of OP in 6, 30, 36, 42, and 48 MAPs in comparison to those of T1. However, the use of T1 has increased (although not significantly, p > 0.05) the level of B uptake in the leaflets of OP in 18 and 24 MAPs. All these results show that B uptake in the leaflets of OP in T2 is comparable and like those in T1, as shown in the mean value of B between T1 (17.65 ± 0.95, mg/kg) and T2 (17.92 ± 0.60, mg/kg), although T2 is higher than T1 but not significant (p > 0.05). These results also show that both T1 and T2 are stabilizing or less variable with increasing MAP in terms of B uptake in the leaflets of OP.
Based on the study by Behera et al. [52] on OP plantation in the West Godavari district (India), they reported that the leaflet nutrient concentration of B was 9.55–119 mg/kg. Lee et al. [53] recorded 13.7–17.3 mg/kg B in the leaflet samples of the FELDA clone and FELDA D × P planting material grown in Pahang (Malaysia). Behera et al. [49] reported 18.3 mg/kg B in OP leaflets of Southern Plateau of India, Rhebergen et al. [48] reported 12 mg/kg B in OP leaflets in Ghana smallholders while Afandi et al. [46] reported 12.2 mg/kg B in Bengawat Soil in Sabah.
According to the B guideline in OP leaflets of 1–6 years (or >6 years) after planting suggested by Fairhurst and Mutert [9], the three B concentrations (mg/kg) are ‘Deficiency (<8.0)’, ‘Optimum (15.0–25.0)’, and ‘Excessive (>40.0)’. Except for 48 MAP for T1 (12.8%), all the B levels range from 15.5 and 22.0 mg/kg. This shows that all T1 and T2 of all periods of MAPs are categorized as ‘Optimum’. Even the 48 MAP for T1 cannot be categorized as ‘Deficiency’.
Plants probably take up B as the undissociated boric acid (H3BO3). This element plays an essential physiological role in RNA formation, flavonoid synthesis, and pollen formation, as well as seed, cell, and wall formation. However, the B deficiency in OP includes decreased leave area index and decreased bunch number. Visual deficiency symptoms of N include crinkling of older leaflets, stunting of young leaves [62,63].

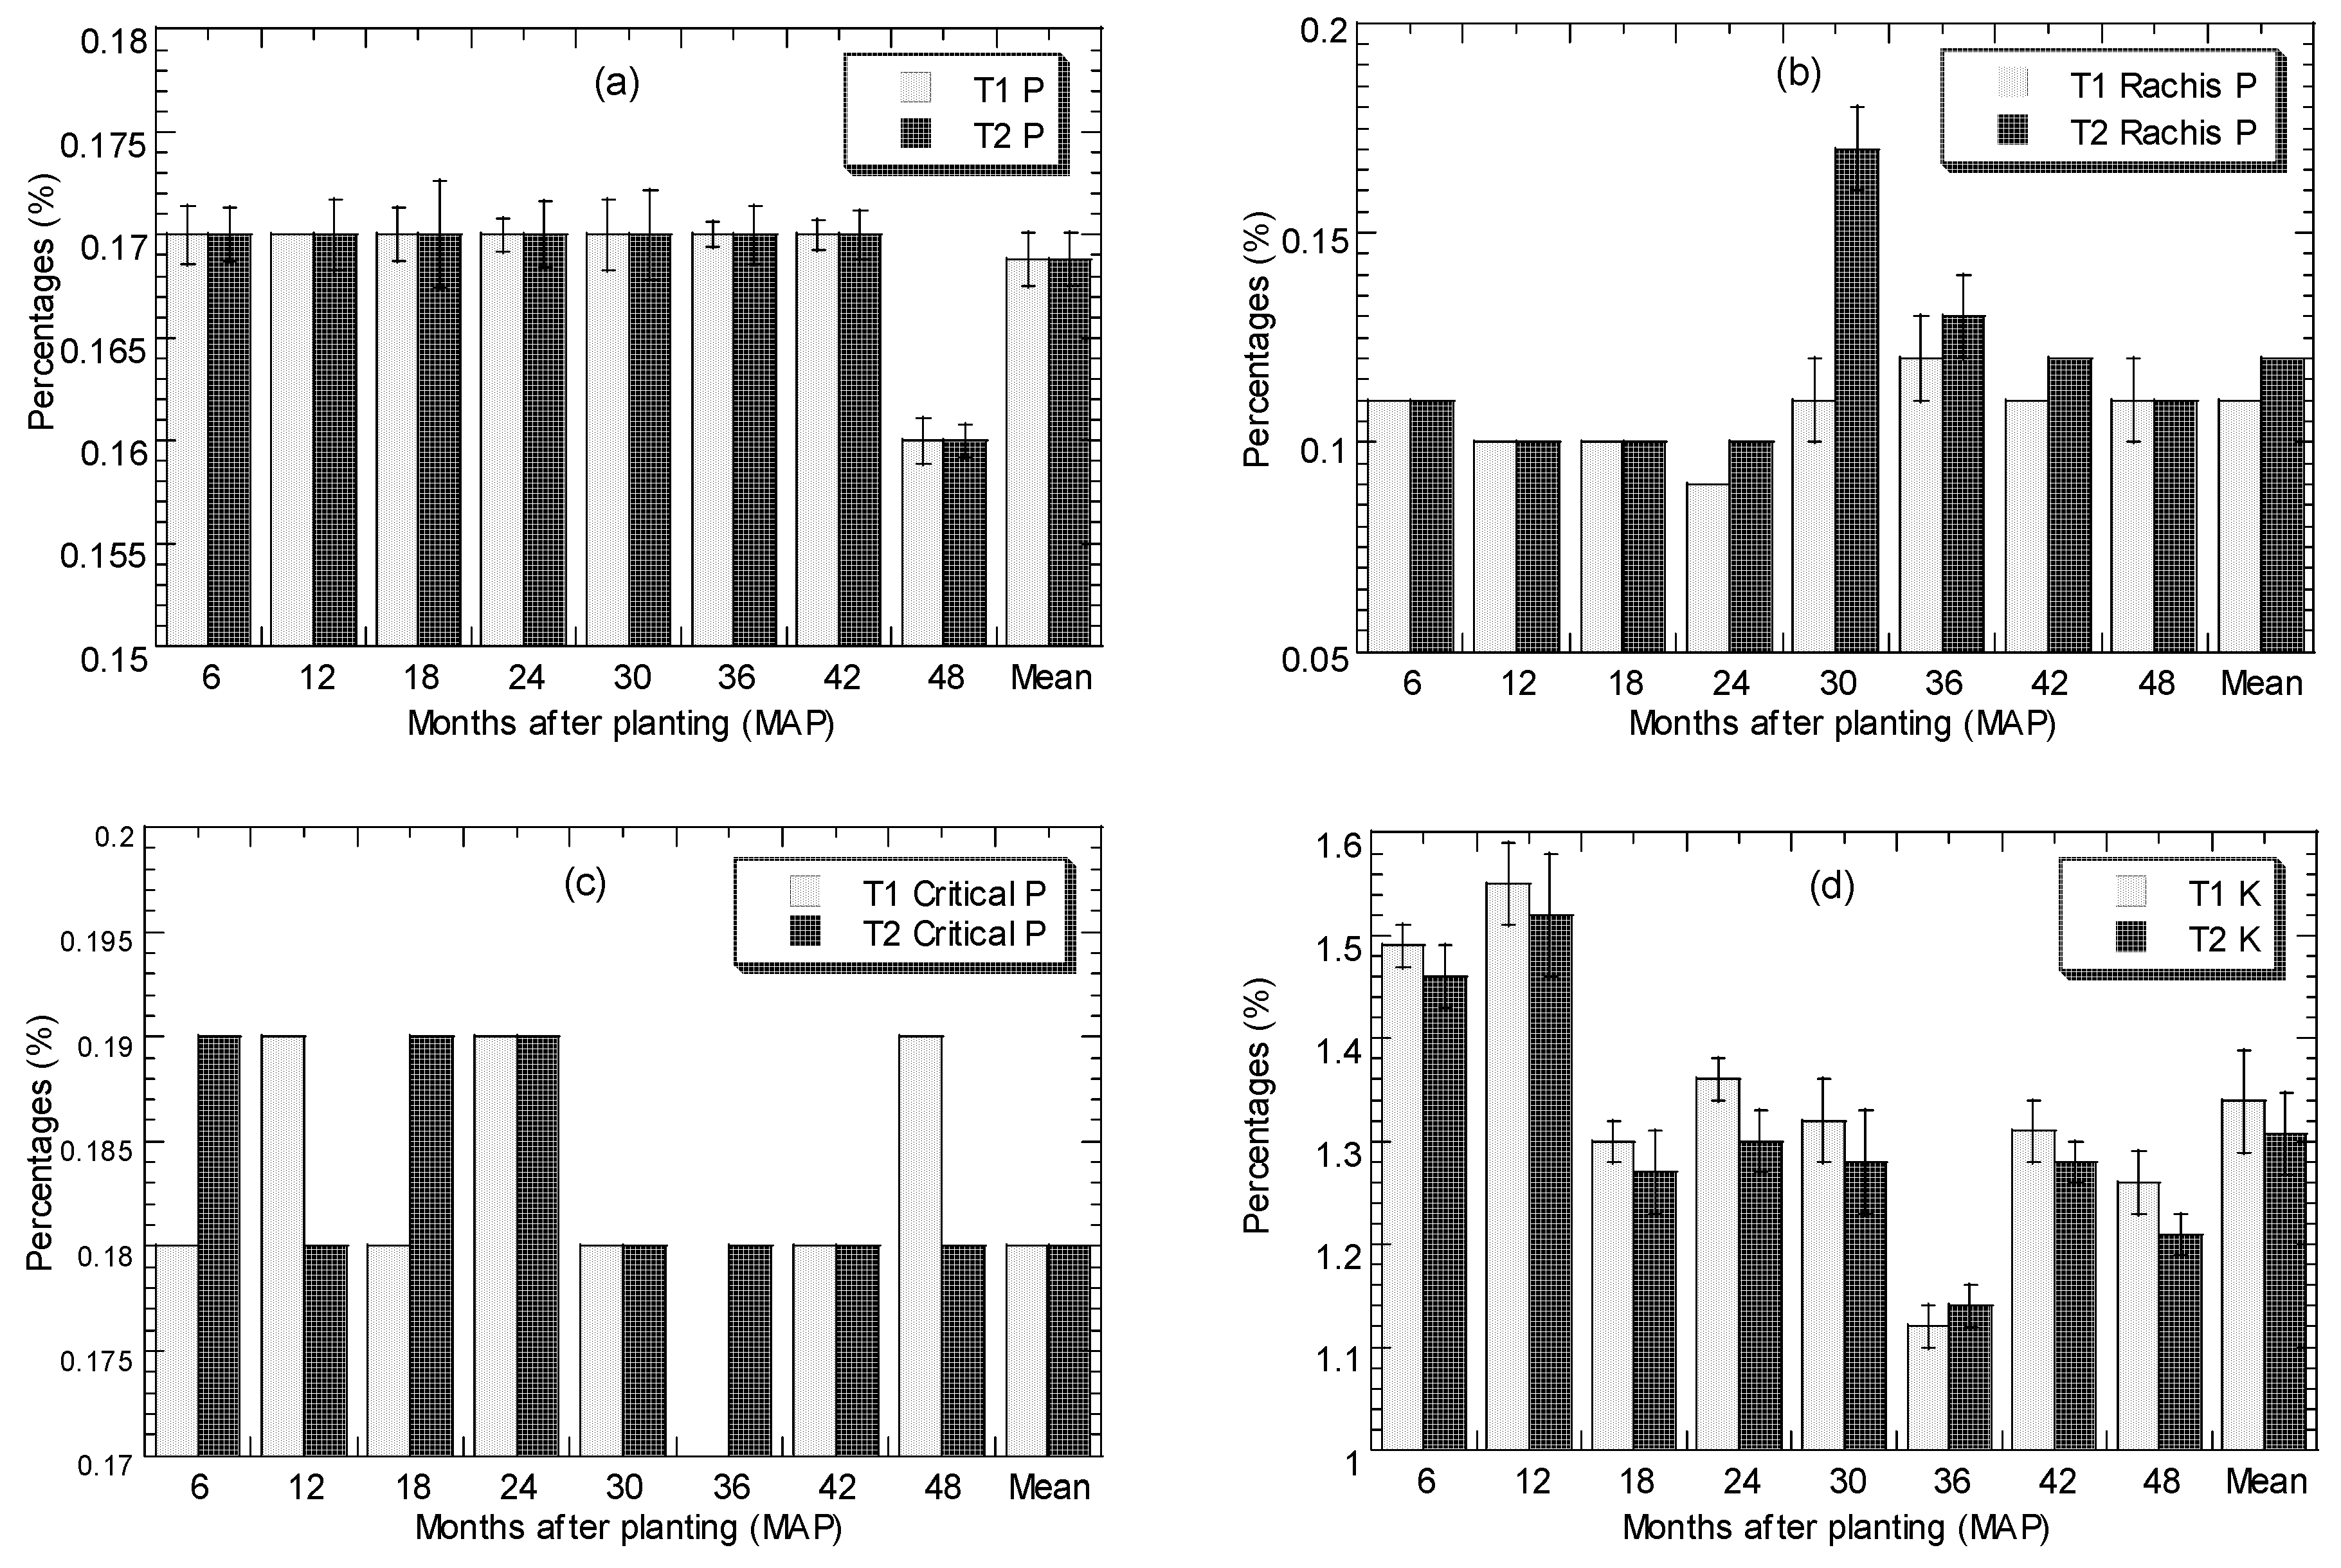
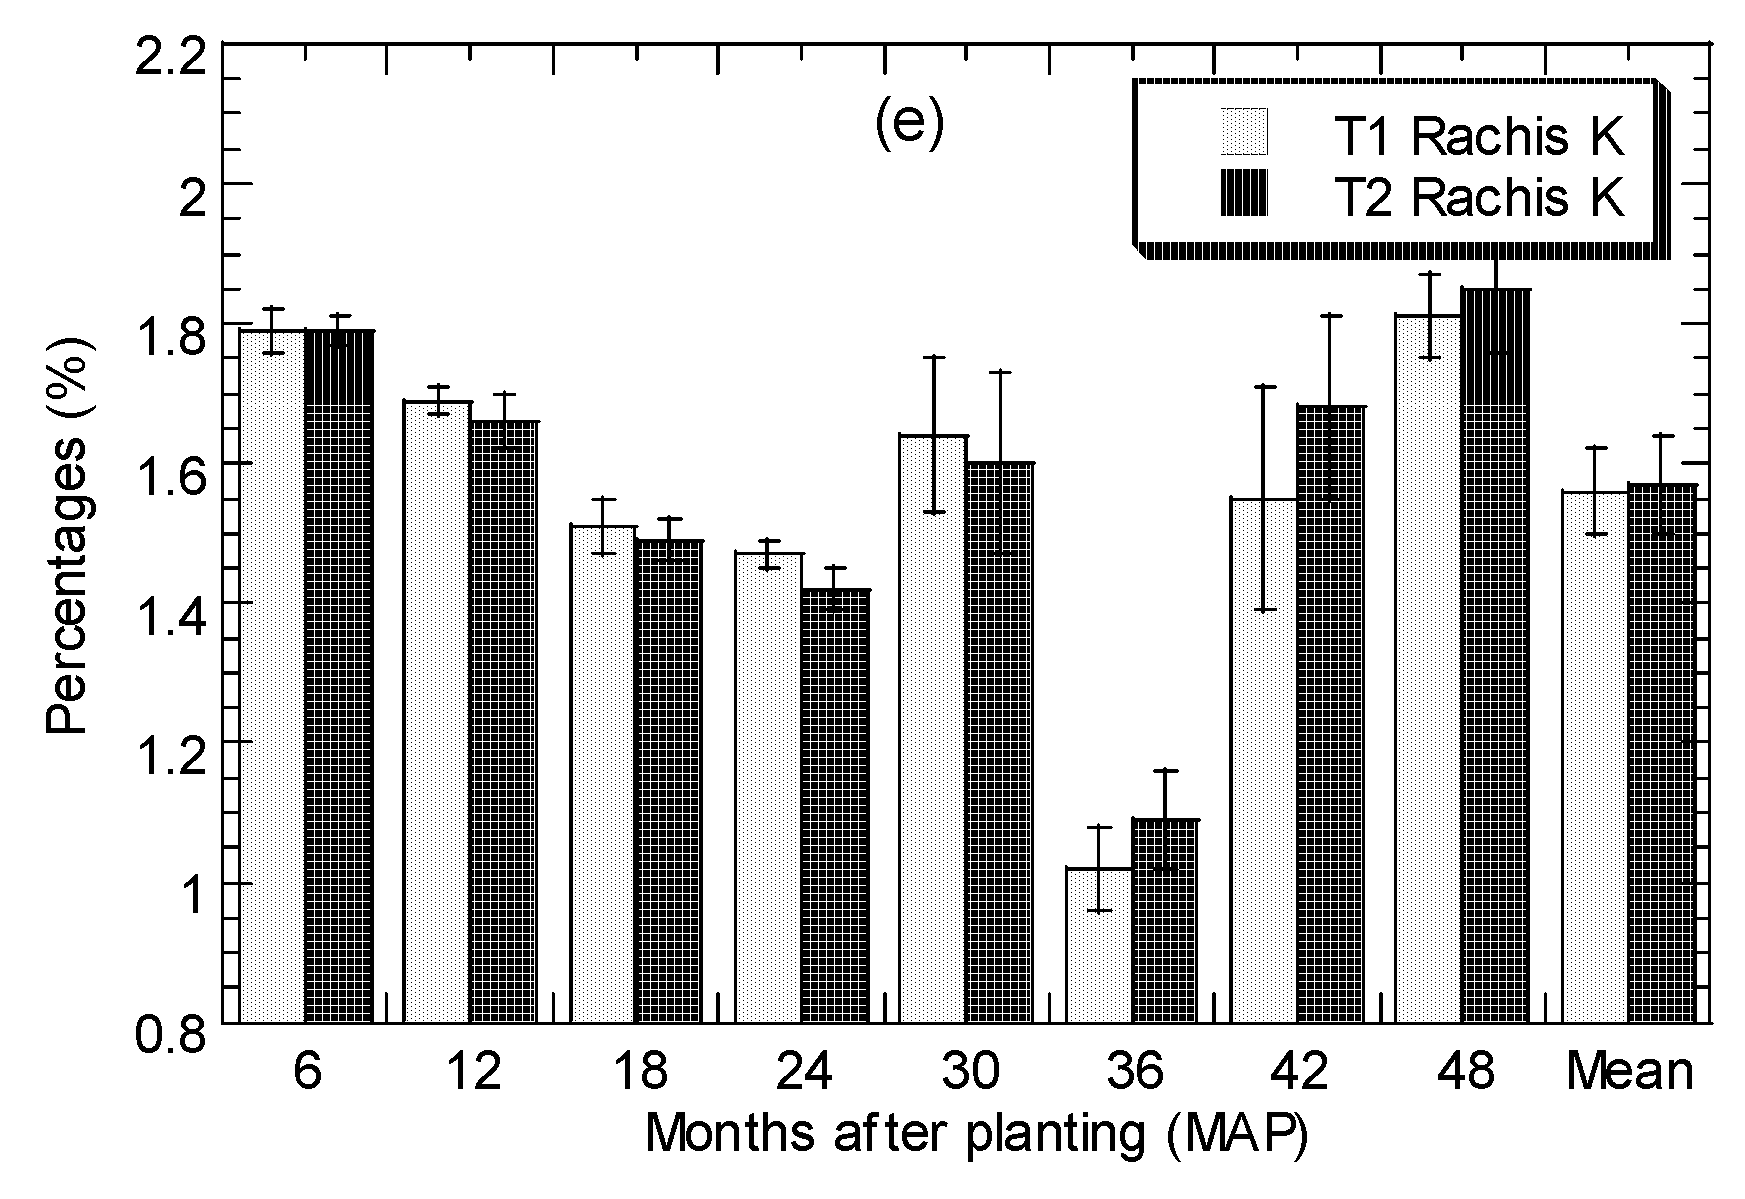
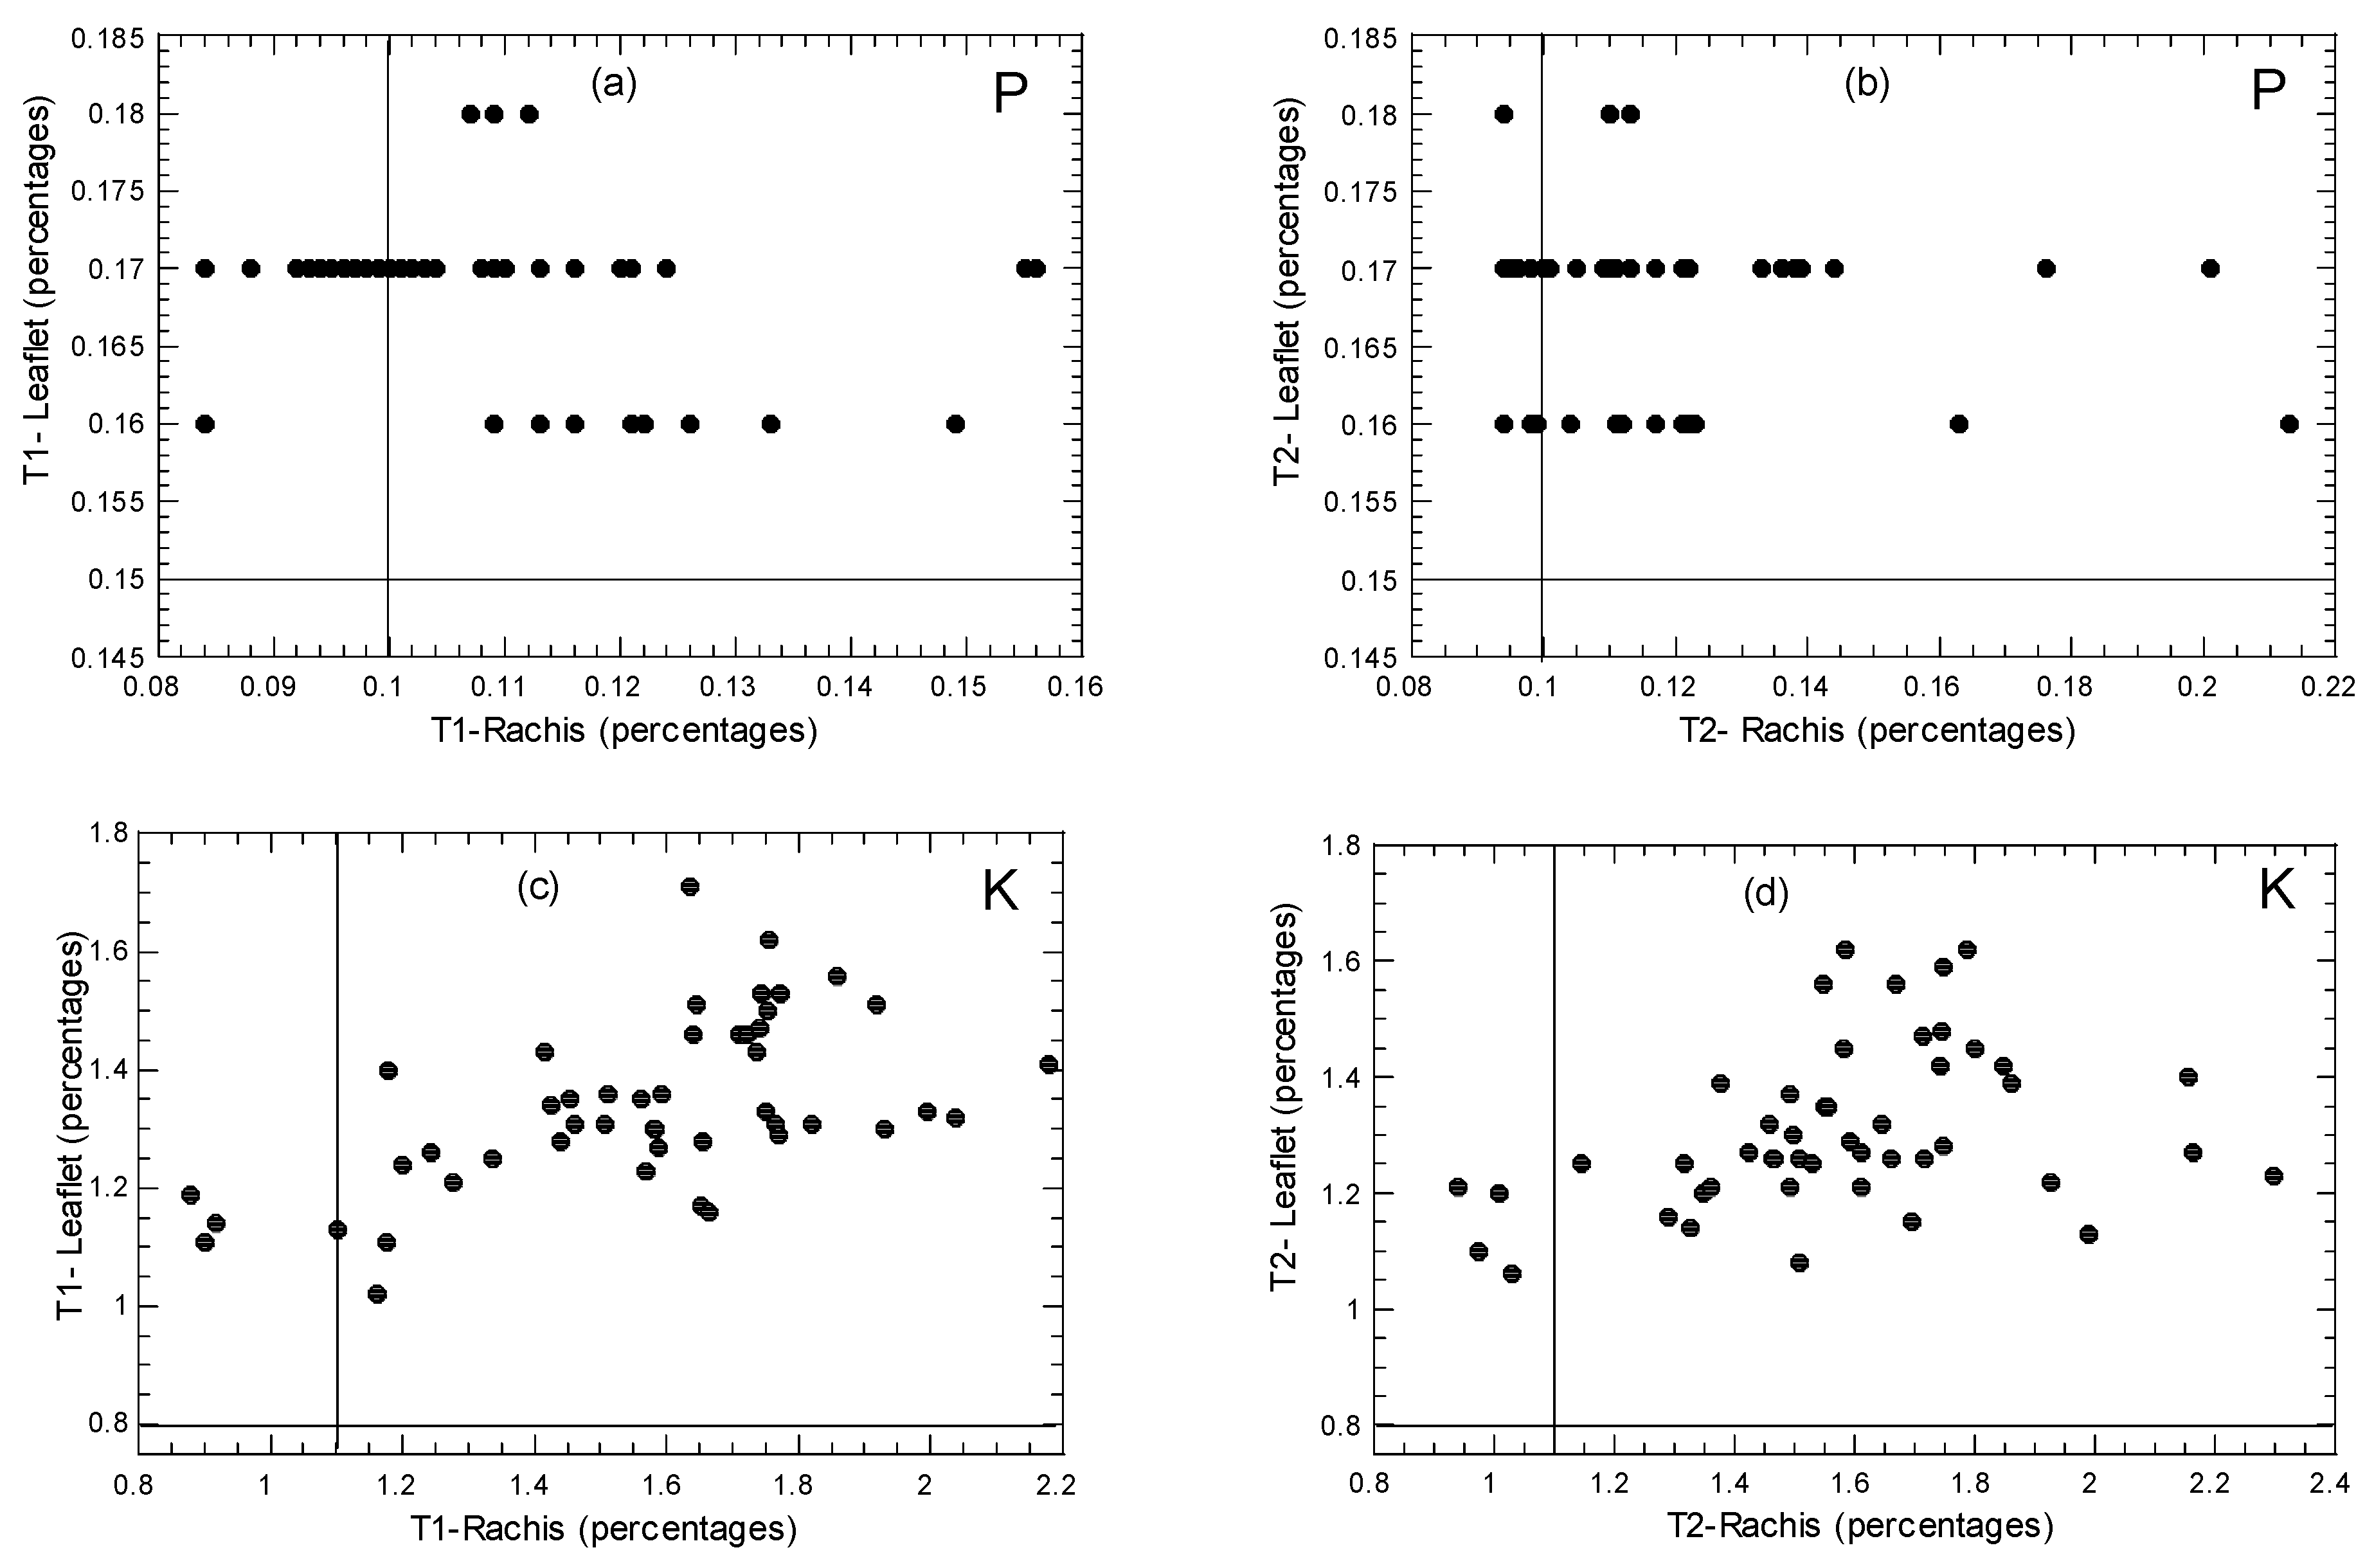
3.2.2. P and K in the Leaflets (Critical P) and Rachis of Oil Palm

Phosphorus

The overall mean concentrations (%) of P and K in the rachis of OP from the present study are given in Tables S4 and S6. Variations of P concentrations in the leaflets and rachis, from 6 to 48 MAP, are presented in Figure 4.
Based on Figure 4a, P levels range from 0.16–0.18% and 0.16–0.18% for T1 and T2, respectively. There is no significant difference (p > 0.05) for P uptake in the leaflets of OP between T1 and T2 for all the eight periods of sampling from 6 to 48 MAP. All these results show that P uptake in the OP leaflets in T2 is insignificantly (p > 0.05) different from T1 and therefore almost like those in T1, as shown in the mean value of P between T1 (0.168 ± 0.001, %) and T2 (0.167 ± 0.001). The above results indicated that the use of T2 is very comparable to T1 in terms of P uptake in the OP leaflets.
Woittiez et al. [51] reported that average leaflet P concentrations were 0.146% in Jambi and 0.17% in Sintang (Indonesia). Based on the study by Behera et al. [49] on OP plantations in the West Godavari district (India), they reported that the leaflets’ nutrient concentration of P was 0.04–0.26%. Lee et al. [53] recorded 0.16–0.18% P in the OP leaflets of the FELDA clone and FELDA D × P planting material grown in Pahang, Malaysia. Behera et al. [54] recorded mean values of leaflets’ nutrient concentration of 0.10–0.53% P in OPs in different areas of India. Behera et al. [49] reported 0.10% P in OP leaflets of the Southern Plateau of India, Tao et al. [47] reported 0.15–0.16% P in the OP leaflets of sandy soils in Central Kalimantan, Rhebergen et al. [48] reported 0.14% P in OP leaflets of Ghana smallholders while Afandi et al. [46] reported 0.12% P in Bengawat Soil in Sabah.
According to the P guideline in OP leaflets of 1–6 years (or >6 years) after planting suggested by Fairhurst and Mutert [9], the three P concentrations (%) are ‘Deficiency (<0.15)’, ‘Optimum (0.16–0.19)’, and ‘Excessive (>0.25)’. Based on this P guideline, all MAPs show ‘Optimum’ P for both T1 and T2, which are closely comparable. According to Ollagnier and Ochs [34], the equation for estimating critical leaflet P concentrations is valid in environments where N is non-limiting. Therefore, the critical P levels in the leaflets are valid since N is above the optimum level.
For rachis, from 6 to 48 MAP, the P concentrations in the rachis range from 0.093 to 0.156% in T1 and 0.094 to 0.213 for T2. P levels in the OP leaflets range from 0.16–0.18% and 0.16–0.18% for T1 and T2, respectively (Figure 4). For P, all MAPs are not significantly (p > 0.05) different between T1 and T2, except for 6 MAP and 30 MAP. Woittiez et al. [51] reported that mean leaflet and rachis P concentrations in the OP were 0.146 and 0.064% in Jambi and 0.17 and 0.062% in Sintang, respectively.
When looking at rachis P, both T1 and T2 of all MAPs (except for T1′s 24 MAP) were above the critical concentration of 0.10% proposed by Foster and Prabowo [55]. The good tissue P status is remarkable considering the optimum application of P from T2 relative to T1. Foster and Prabowo [55] suggested that the rachis P concentration in OP is a more reliable value than leaflet P.
Figure 5 shows the relationships of P levels between leaflets and rachis of the OP from the present study. Concentrations of P in leaflets and rachis were comparable for both T1 and T2, generally falling in the optimal range of Fairhurst and Hardter [33].
Based on 13-year OP on sandy soils in Kalimantan with Best Management Practice (fertilizers blended, then applied 4× per year), Gerendas et al. [64] reported the mean P concentrations as 0.159 and 0.058% in the leaflets and rachis, respectively. Almost similarly, based on 13-year OP on sandy soils in Kalimantan with Standard Estate Practice (fertilizers applied as straights/compounds), Gerendas et al. [64] reported the mean P concentrations as 0.156 and 0.044% in the leaflets and rachis, respectively. Based on sandy soils in Central Kalimantan (Indonesia), Tao et al. [47] reported the levels (2012 and 2015) of P in the rachis of OP as 0.04 and 0.03%.
Based on the matured OP of 9–11 years (2008–2011) of planting in the FELDA D × P (planting material Yangambi-DQ8) in Jerantut (Pahang), Lee et al. [65] reported the mean concentrations of rachis P in the four-years trial study as 0.084%. According to Foster and Prabowo [55], the levels of critical leaf for the OP are 0.19 for P for 3–7 years after planting. However, the level of critical rachis for P is not specified, assuming not established.
Overall, rachis P concentrations for T1 and T2 are above the critical levels for rachis P (>0.08%). Therefore, assessing the leaflet concentration itself may not reflect the nutrition status. Incorporating other parameters, such as rachis nutrient concentration and contents, is certainly useful [52]. The critical rachis K concentration is 1.30% on the dry matter; both T1 and T2 showed an above the critical rachis K concentration at all periods of MAP except for 36 MAP. However, moving forward from 42 to 48 MAP, the K level eventually increased periodically.
Phosphorus is taken up as the orthophosphate ion (either as H2PO4− or HPO 4 2 ), depending on the pH of the soils. Physiologically, P plays a role as a molecular component of the energy transfer or which are energy-rich compound that controls various reactions in plants, such as photosynthesis, respiration, protein synthesis, amino acids, and nutrient transport. The P deficiency in OP includes a decrease in growth and yield [3,59,66]. According to Rankine and Fairhurst [67], it is not easy to see the leaf P deficiency symptoms in OP. However, P-deficient plants may be stunted with short leaflets, and the OP trunk may have a pronounced pyramid shape.

Potassium

The overall mean concentrations (%) of K in the rachis of OP from the present study are given in Table S6. Variations of K concentrations in the rachis, from 6 to 48 MAP, are presented in Figure 4. Based on Figure 6a, K levels range from 1.02–1.71% and 1.05–1.62% for T1 and T2, respectively. There is no significant difference (p > 0.05) for K uptake in the leaflets of OP between T1 and T2 for all the eight periods of sampling from 6 to 48 MAP. However, one pattern can be found in which K levels in the leaflets of T1 are always higher than those in T2 in all the MAPs except for 36 MAP. Overall, all these results show that K levels in the leaflets of OP in T2 are insignificantly (p > 0.05) different, even though lower, from T1 and therefore almost like those in T1, as shown in the mean value of K between T1 (1.34 ± 0.05, %) and T2 (1.31 ± 0.04). Again, the above results indicated that T2 is very comparable to T1 in terms of K uptake in the leaflets of OP.
Woittiez et al. [51] reported that average leaflet K concentrations were 0.59% in Jambi and 0.60% in Sintang (Indonesia). Based on the study by Behera et al. [52] on OP in the West Godavari district (India), they reported that the leaflets’ nutrient concentration of K was 0.34–1.38%. Lee et al. [53] recorded 0.96–1.20% K in the leaflets of the FELDA clone and FELDA D × P planting material grown in Pahang, Malaysia. Behera et al. [51] recorded mean values of leaflets’ nutrient concentration of 0.56–0.78% K in OPs of different areas of India. Behera et al. [49] reported 0.68% K in OP leaflets of the Southern Plateau of India, Tao et al. [47] reported 1.03–1.25% K in the OP leaflets of sandy soils in Central Kalimantan, Rhebergen et al. [48] reported 0.81% K in OP leaflets of Ghana smallholders while Afandi et al. [46] reported 0.78% K in Bengawat Soil in Sabah. Sudradjat et al. [1] reported that K content in leaflets at 24 and 36 MAP for immature OP on a ultisol soil in Indonesia was lower. This could be due to phase change from vegetative to generative plants at 24 and 36 MAP. This resulted in the transfer of nutrients to the seeds and fruit that were forming. According to Ochs and Olivin [68], the critical K level of leaflets in frond 9 is 1.25%, while that of the leaflets in midrib 17th frond is 1.00% in young OP less than six years after transplanting.
According to the K guideline in OP leaflets of 1–6 years (or >6 years) after planting suggested by Fairhurst and Mutert [9], the three K concentrations (%) are ‘Deficiency (<1.00)’, ‘Optimum (1.10–1.30)’, and ‘Excessive (>1.80)’. Based on this K guideline, all MAPs show ‘Optimum’ K levels in the leaflets of OP for both T1 and T2 in most periods of MAPs. The mean values for both T1 and T2 are <1.80, although higher than >1.80, both T1 and T2 are still considered ‘Optimum’ and are closely comparable.
For rachis K, from 6 to 48 MAP, the K concentrations in the rachis range from 1.05–1.85% for T1 and 1.10–1.90% for T2. K levels in the OP leaflets range from 1.02–1.71% and 1.05–1.62% for T1 and T2, respectively (Figure 6). All periods of sampling (all MAPs) for K are not significantly (p > 0.05) different between T1 and T2. Woittiez et al. [51] reported average K concentrations in the OP leaflets and the rachis were 0.59 and 0.46%, respectively, in Jambi, while 0.60 and 0.50%, respectively, in Sintang. According to Teoh and Chew [69], the measurement of K content on the rachis of OP is more sensitive because it can indicate the status of K in the OP leaflets.
When looking at rachis K, both T1 and T2 of all MAPs were above the K critical concentration of 1.10%, as proposed by Foster and Prabowo [55]. Woittiez et al. [51] reported that leaflet and rachis K concentrations were well below the optimum level in most of the OP plantations in Jambi, while rachis K concentrations exhibited more critical deficiencies than leaflet K concentrations [55].
Figure 5 shows the relationships of K levels between leaflets and rachis of the OP from the present study. Concentrations of K in leaflets and rachis were comparable for both T1 and T2, generally falling in the optimal range of Fairhurst and Hardter [33]. Based on 13-year OP on sandy soils in Kalimantan with Best Management Practice (fertilizers blended, then applied 4x per year), Gerendas et al. [64] reported the mean K concentrations as 1.15 and 1.61% in the leaflets and rachis, respectively. Almost similarly, based on 13-year OP on sandy soils in Kalimantan with Standard Estate Practice (fertilizers applied as straights/compounds), Gerendas et al. [64] reported the mean K concentrations as 1.25 and 1.63% in the leaflets and rachis, respectively. Based on sandy soils in Central Kalimantan (Indonesia), Tao et al. [47] reported the levels (2012 and 2015) of K in the rachis of OP as 1.63 and 1.34%. Based on the matured OP of 9–11 years (2008–2011) of planting in the FELDA DxP (planting material Yangambi-DQ8) in Jerantut (Pahang), Lee et al. [65] reported the mean concentrations of rachis K in the four-years trial study as 1.61 ± 0.03%.
According to Foster and Prabowo [55], the levels of critical leaf for the OP are 1.10% for K for 3–7 years after planting. However, the levels of critical rachis for P and K are not specified, assuming they are not established. The critical rachis K concentration is 1.30% on the dry matter; both T1 and T2 showed an above the critical rachis K concentration at all periods of MAP except for 36 MAP. However, moving forward from 42 to 48 MAP, the K level eventually increased periodically. This might be due to the OP having started producing food bunches in response to K nutrient that can also be observed through K status in the rachis.
Overall, rachis K concentrations for T1 and T2 are above the critical levels for rachis K (>1.2%). Therefore, assessing the leaflet concentration itself may not reflect the nutrition status. The incorporation of other parameters, such as rachis nutrient concentration and contents, is certainly useful [52].
Potassium is the second most abundant nutrient in plants after N. It is absorbed as the monovalent cation K+ and is highly mobile in the phloem tissue of the plants. This element plays a physiological role in the control of stomatal opening and transport of photosynthates [5]. However, the K deficiency in OP growth and yield includes decreased vegetative and fruit bunch production. Visual deficiency symptoms of N include yellow spotting in older leaves [57,58,70].
The elemental analysis based on the leaflets in the 17th frond was established as a diagnostic tool for assessing fertilizer requirements of OP [24]. It has become one of the common methods to evaluate the OP’s nutritional status. Rachis tissues are well-known as an organ to store a substantial amount of plant nutrients but are less commonly used as a reference in OP [13,14,15,16,17,18]. This is partly due to the tediousness of the rachis sampling procedure and limited research works on the subject. Overall, these rachis assessments indicated that nutrient status, particularly P and K, provides a reasonably good correlation to fresh fruit bunch yield.
Teoh and Chew [69] reported that rachis K is more accurate than leaflet K in recording deficiency of K in OP, especially when soil exchangeable Ca and Mg are high in relation to soil exchangeable K. Foster and Prabowo [55] also found that rachis P is more reflective of the P nutrient status of the OP with a critical level of 0.10%.

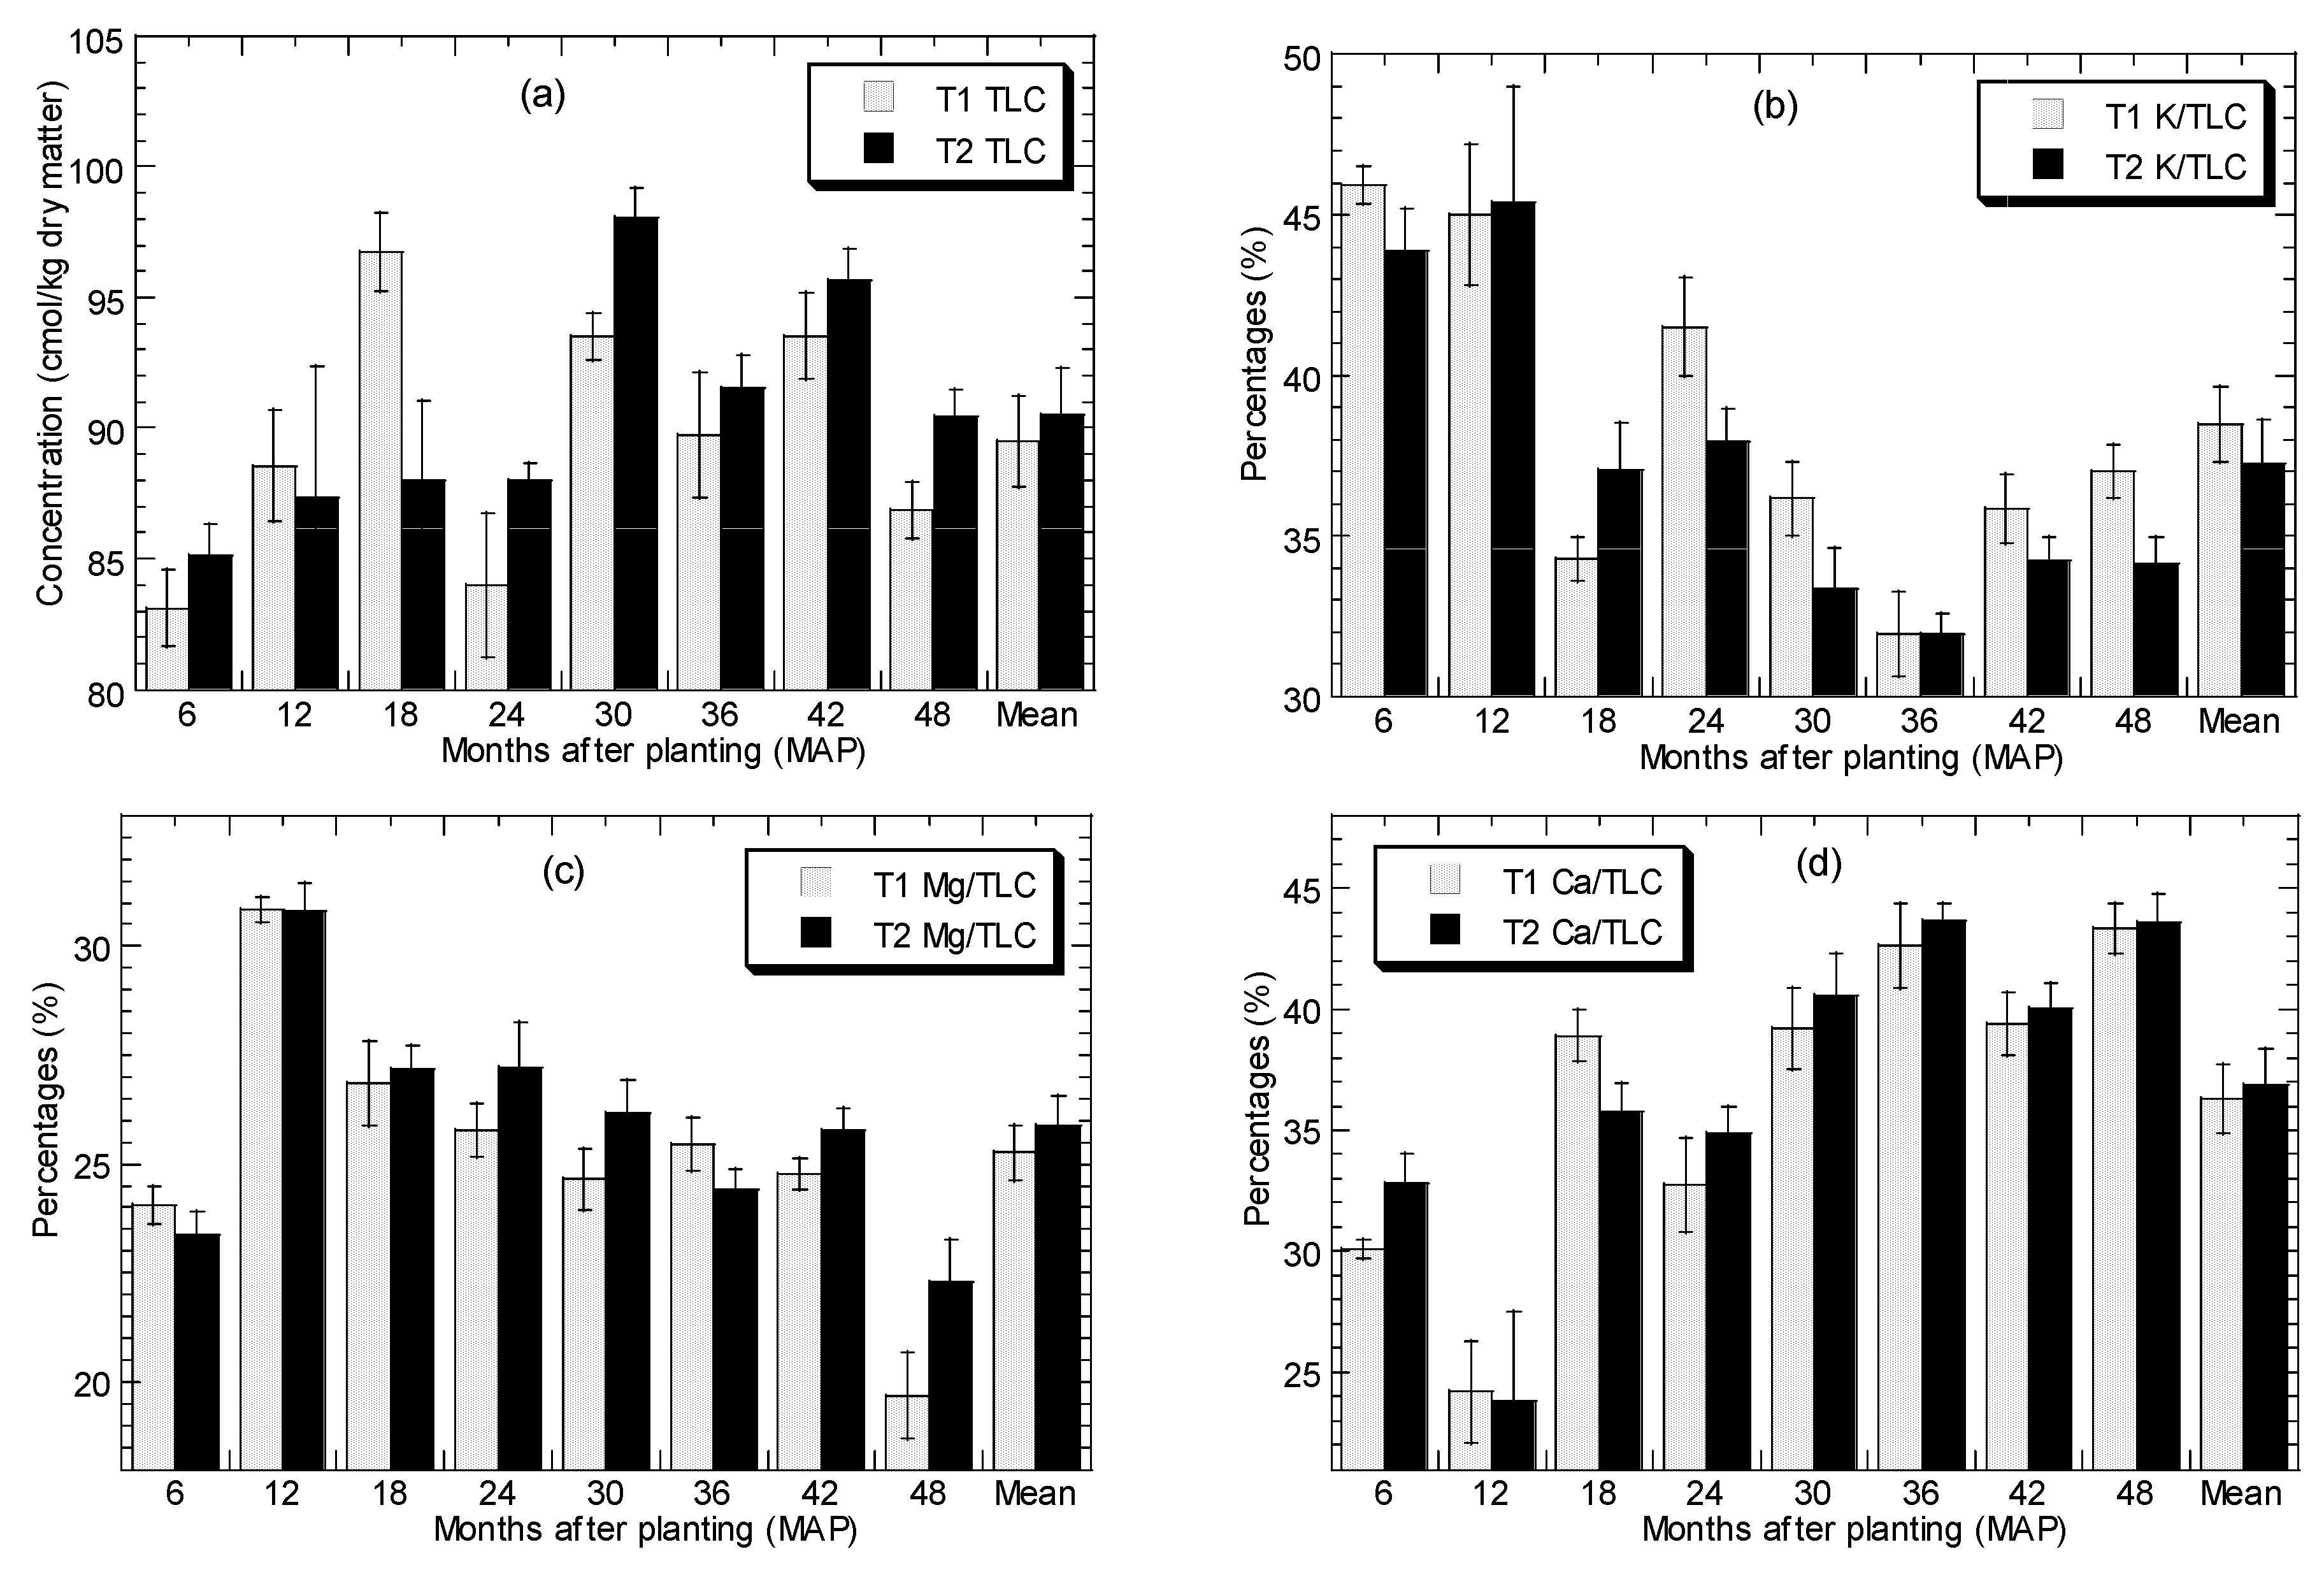
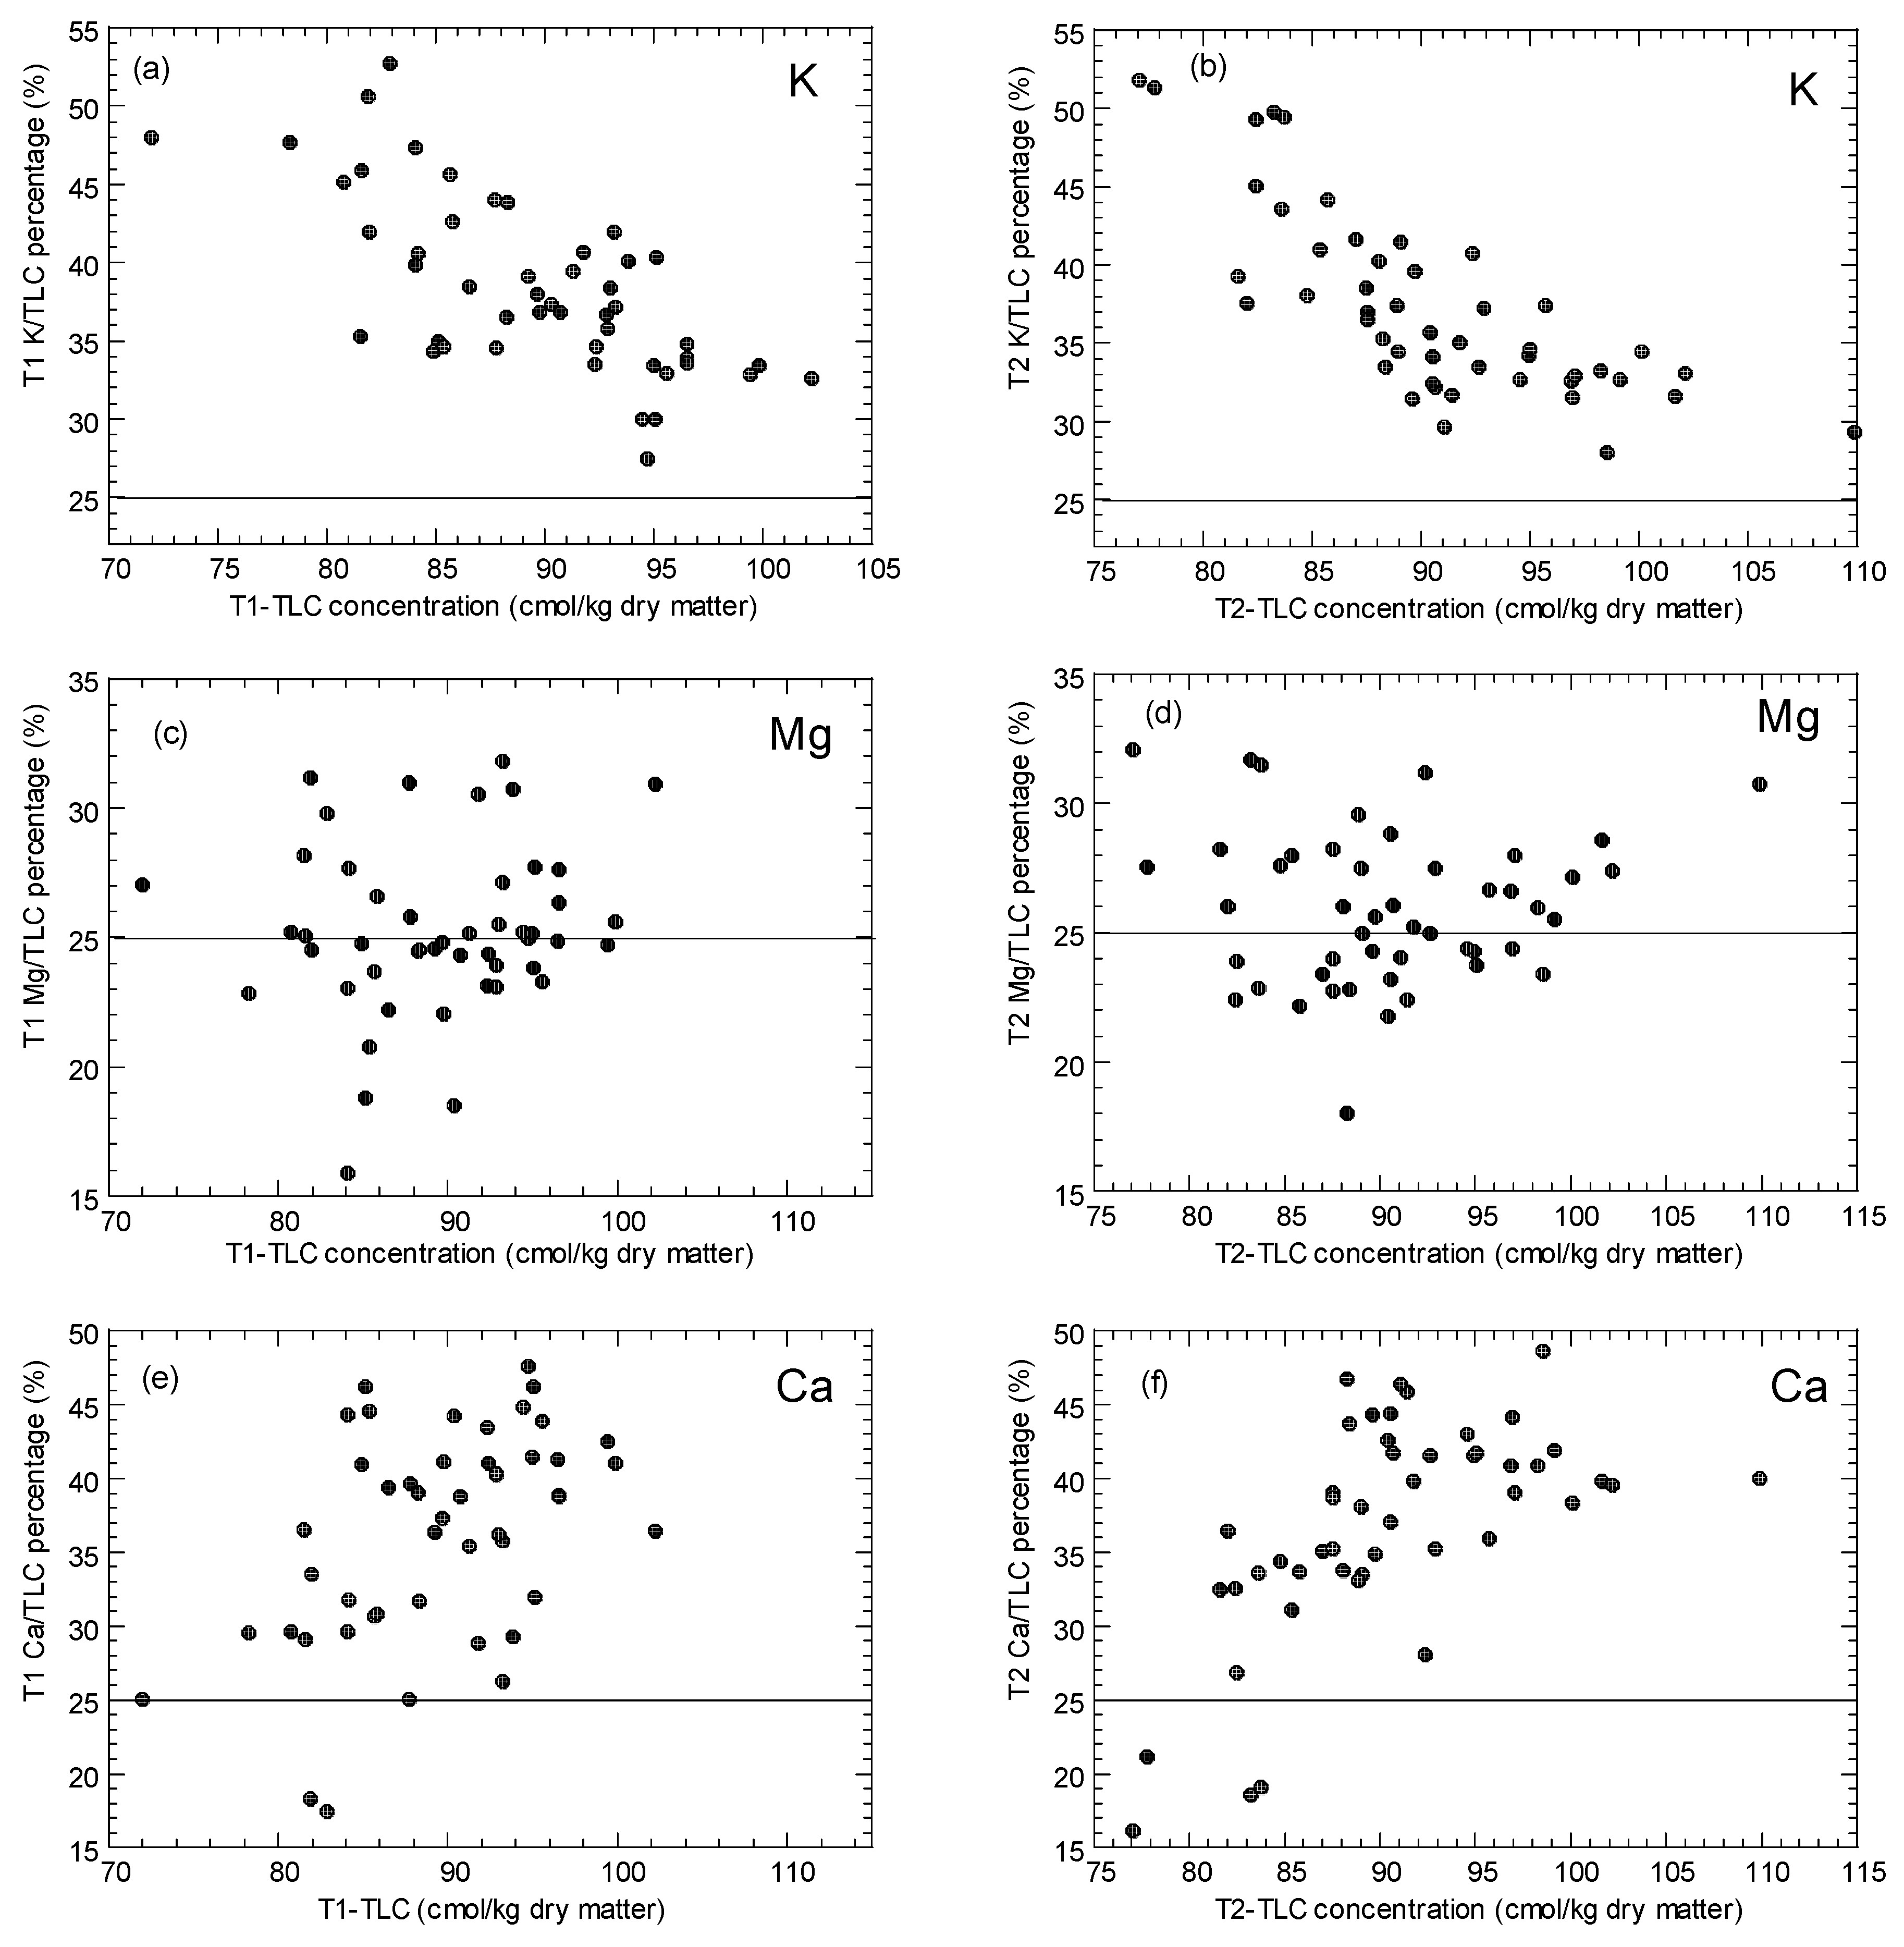
3.2.3. Total Leaf Cations: K, Mg and Ca

The variations of TLC concentrations, and ratios of each nutrient (K, Mg, and Ca) to TLC, from 6 to 48 MAP of OP, are presented in Figure 6. It was found that the TLC concentrations for T1 range from 83.11–96.72 (mean: 89.5) while T2 ranged from 85.15–98.08 (mean: 90.52). Woittiez et al. [51] reported that the average TLC concentration was 86.2 in Jambi and 76.7 in Sintang. There is no significant difference (p > 0.05) in TLC values between T1 and T2.
The concentrations of K, Mg, and Ca in the leaflets as percentages of TLC concentrations in T1 and T2 are given in Figure 7. This shows the levels of K, Mg, and Ca in the leaflets relative to the TLC. For K, all samples for T1 and t2 are enough (>25%). For Mg, almost 50% of T1 are deficient (<25%), while T2 shows 39.5% of samples in deficiency. For Ca, if 25% Ca is taken as a critical guideline, only 4.2% for T1 and 8.3% for T2 are deficient. Woittiez et al. [51] reported that the Mg relative to TLC was sufficient in all plantations in Jambi and 80% of the plantations in Sintang. For K, it was less than 25% relative to TLC in all the plantations in Jambi and 80% of the plantation in Sintang as sufficient.
Foster et al. [71] developed Foster’s system that uses the TLCs (K, Ca, and Mg) as an internal reference point for various nutrients such as N, K, and Mg. The TLC method overcomes the effect of site factors and palm age on the optimum leaflets’ nutrient levels. In general, K and Mg deficiency can be assessed based on their proportion of TLC, where <25 is considered ‘deficient,’ 25 to 30 as ‘low,’ and >30 is ‘sufficient’ [35].

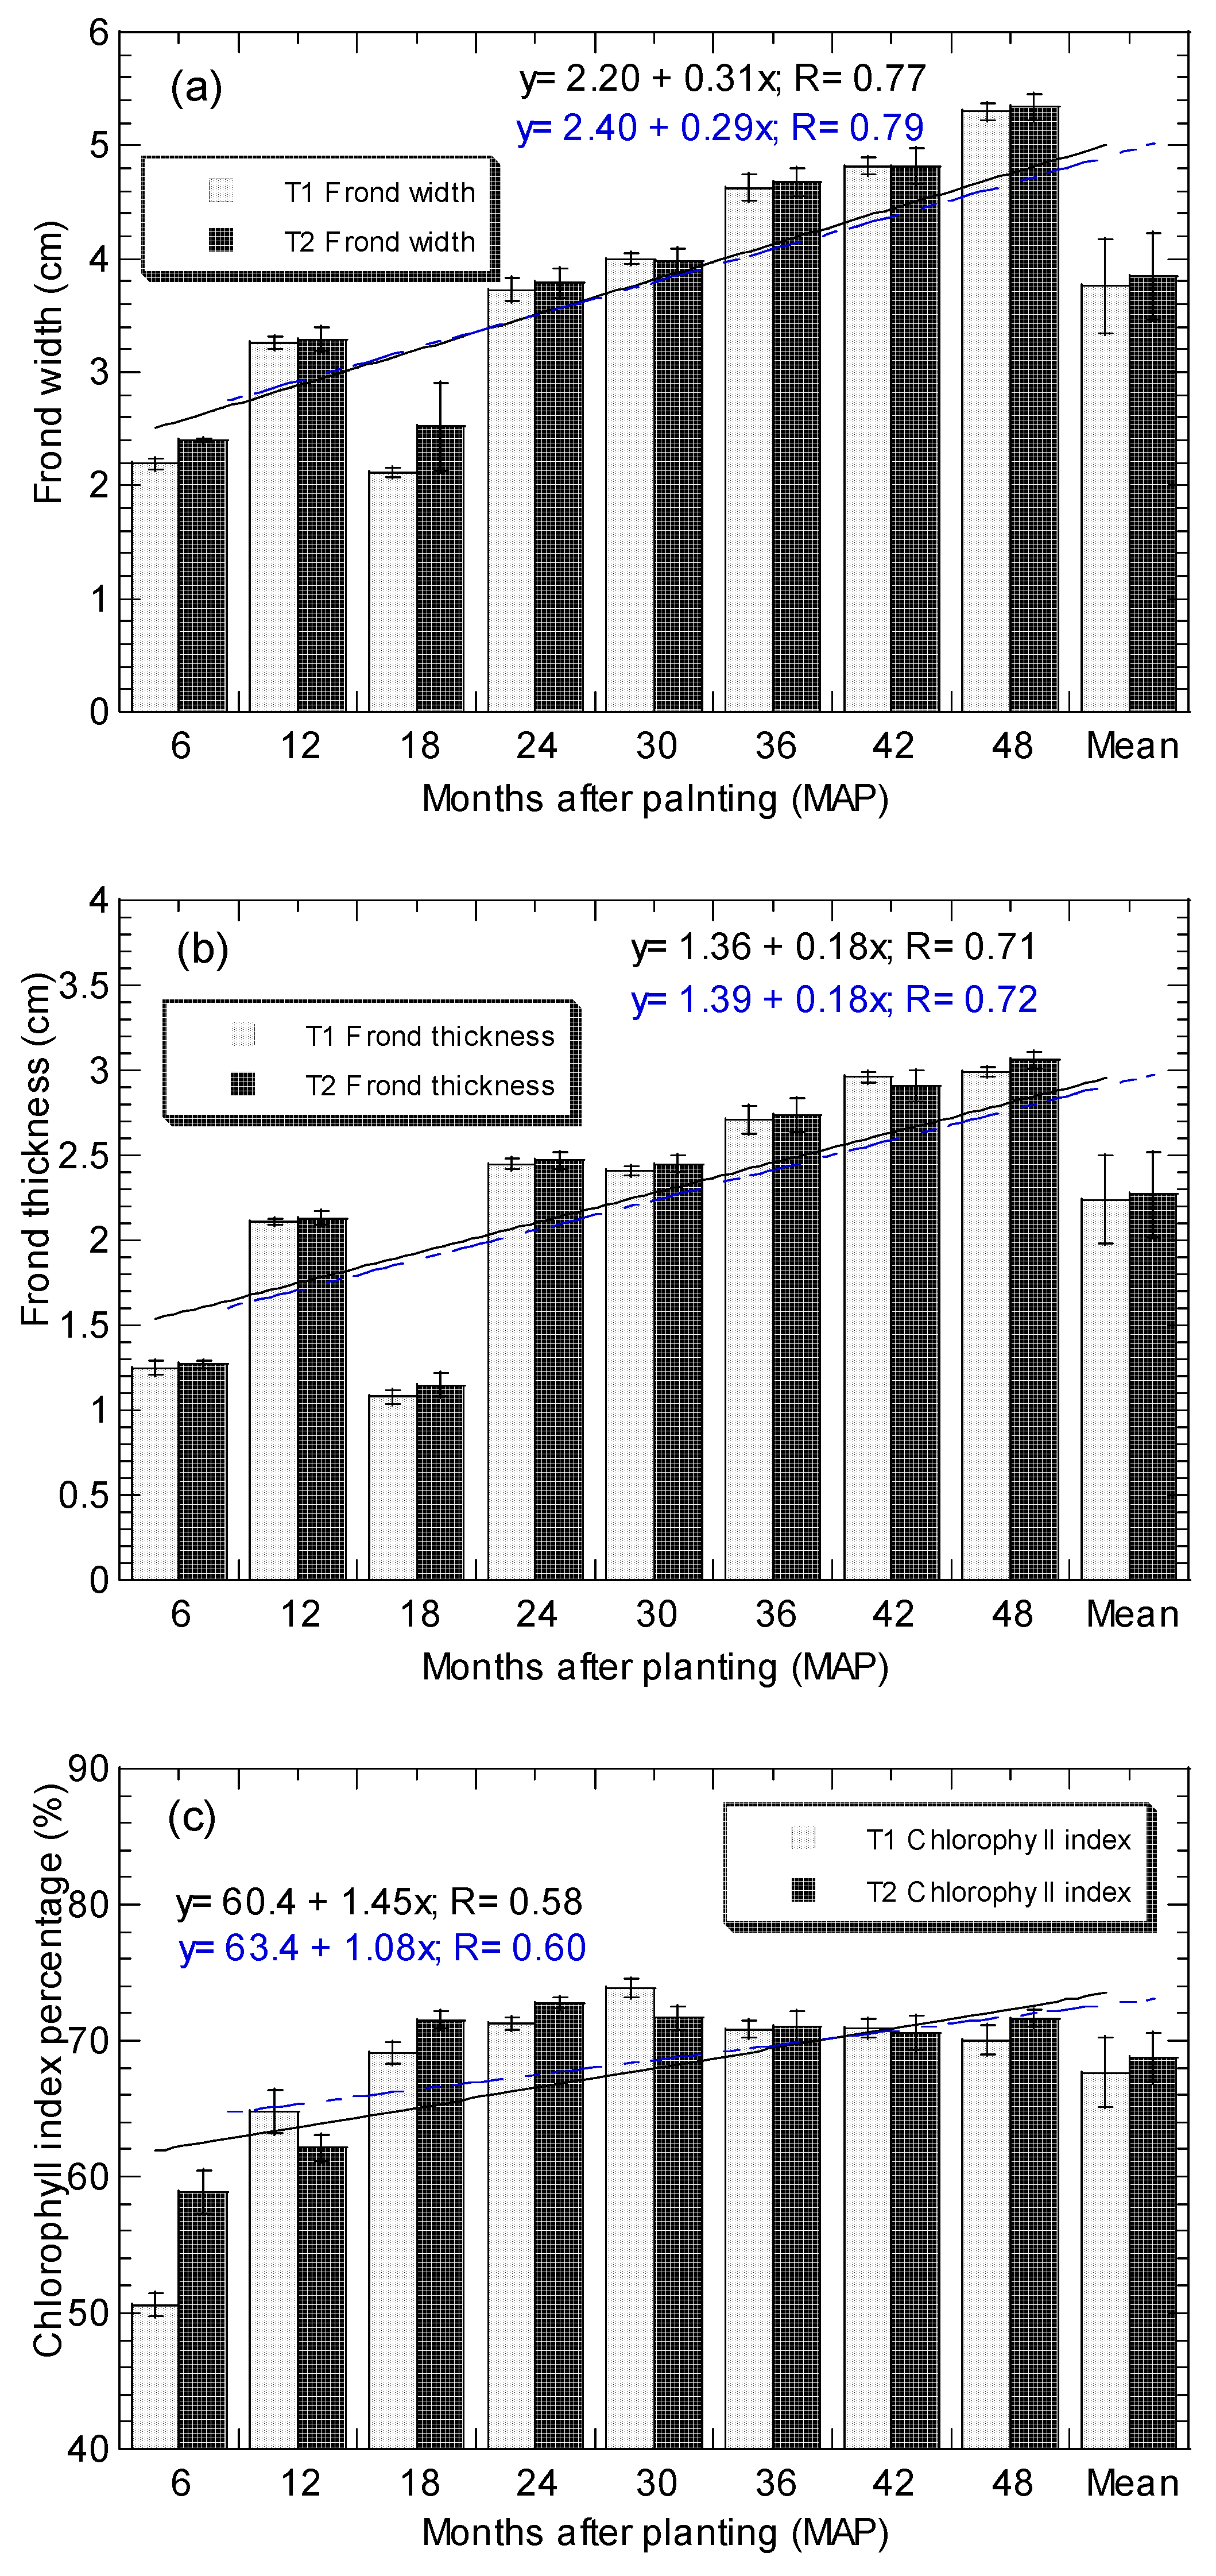
3.3. Variations of Vegetative Parameters in Oil Palms

Variations of FL, FNL, and canopy, from 6 to 48 MAP of the OP, are shown in Figure 8. The FL for T2 ranges from 114–433 cm (mean: 260 cm), compared to those in T1, ranging from 103–428 cm (mean: 255.89 cm). The FL increases almost linearly from 6 to 48 MAP for both T1 and T2. There is no significant difference (p > 0.05) between T1 and T2 based on the mean value of this parameter.
The FNL for T2 ranges from 49.1–140 (mean: 102), compared to those in T1, ranging from 40.1–139 (mean: 98.1). Similarly, the FNL increases almost linearly from 6 to 48 MAP for both T1 and T2. There is no significant difference (p > 0.05) between T1 and T2 based on the mean value of this parameter.
For T2, the canopy was from 92.2–425 cm (mean: 258 cm), compared to those for T1, ranging from 82.8–418 cm (mean: 252 cm). The canopy increases almost in a linear pattern from 6 to 48 MAP for both T1 and T2. There is no significant difference (p > 0.05) between T1 and T2 based on the mean value of this parameter.
Variations of FW, FT, and CI, between T1 and T2, from 6 to 48 MAP of the OP, are shown in Figure 9. The FW for T2 ranges from 2.40–5.34 cm (mean: 3.85 cm) compared to those in T1, ranging from 2.11–5.30 cm (mean: 3.76 cm). The FW generally increases from 6 to 48 MAP for both T1 and T2 but fluctuates at 18 MAP. There is no significant difference (p > 0.05) between T1 and T2 based on the mean value of this parameter.
For T2, the FT ranges from 1.15–3.06 cm (mean: 2.27 cm), compared to those for T1, ranging from 1.08–2.99 cm (mean: 2.25 cm). The FT increases in general from 6 to 48 MAP for both T1 and T2 but fluctuates at 18 MAP. For T2, the CI ranges from 58.9–72.8% (mean: 68.8%), compared to those for T1, ranging from 50.6–73.9% (mean: 67.7%). The CI increases significantly from 6 to 18 MAP for both T1 and T2, stabilizing between 68–74% from 18–48 MAP.
Based on the immature OP of 13 MAP, Amirruddin et al. [4] reported that the CI as measured by the SPAD ranged from 37.4% for N treatment (0.011 kg/palm) to 54.3% for N treatment (0.053 kg/palm). This CI was relatively like foliar N, indicating the effects of N fertilization [4]. From Afandi et al. [46]; collected at 26 MAP at the 17th frond, it was reported that (based on 140 palm/hectare), the frond production was 14.11, total frond (per palm) was 34.9, and FL was 288.9 cm.
The overall results of the t-Test analysis of vegetative parameters of the OPs from 6 to 48 MAP between T1 and T2 are presented in Tables S4 and S8. For all vegetative parameters, higher mean values of FL, FNL, FW, FT, CI, and canopy in the T2 than those in the T1. However, the differences in the values of the six vegetative parameters are not significant (p > 0.05) between T1 and T2.

3.4. Relationship between Tissue Nutrients and Vegetative Growth between T1 and T2

Multiple Linear Stepwise Regression Analysis and Correlation Analysis

The results of MLSRA and CA are given in Table 2 and Table 3) in both T1 and T2, respectively. The relationships between the vegetative parameters and nutrient levels of the OP leaflets are found in both T1 and T2 using these two statistical analyses. In comparison between T1 and T2, three characteristics can be summarized in Table 2 and Table 3.
Firstly, regardless of whether T1 or T2, MAP is always an independent variable to significantly influence all the six vegetative parameters. As expected, the highest and most positive significant (p < 0.05) correlation coefficients are found between MAP and all the vegetative parameters, with R values ranging from 0.78–0.99. The R values between T1 and T2 are very comparable. Since increasing age or MAP all significantly (p < 0.05) and positively correlated in all the six vegetative parameters, this has complemented the results of MLSRA in which MAP is selected as one of the significant and influential factors for all the six vegetative parameters investigated in this study. Therefore, both CA and MLSRA have evidently identified MAP as a significant and influential abiotic factor in the six vegetative parameters of OP in both T1 and T2.
Secondly, some similarities and differences in the nutrient parameters were selected to influence the vegetative parameters significantly between T1 and T2. Whether T1 or T2, these similarities and differences in significance levels between MLSRA and CA are almost expected; for example, based on MLSRA (Table 3), TLC and Ca were selected as some of the influential factors for the CI inT2 only, while Mg/TLC in T1 only. Based on CA (Table 3), Ca does positively correlate significantly (p < 0.05) with CI in T1 and T2, with R values ranging from 0.47 to 0.53. This shows some significant correlation coefficients for the selected influential variables but low and insignificant R-values for other variables, which were also selected as influential variables by the MLSRA plantation ecosystem consisting of multi-factors with abiotic and biotic interactions. MLSRA is an ecologically favoured multivariate statistical method. However, CA could be used to complement the findings based on MLSRA [36].
Thirdly, CA gives inconsistent correlation coefficients (no correlations, positive or negative R values) between vegetative parameters and leaflets’ nutrient levels in both T1 and T2, which could be due to several factors. For example, based on CA (Table 3), the rachis-P did not significantly correlate with the six vegetative parameters except for canopy in T2 (R = 0.30; p < 0.05). However, based on MLSRA (Table 2), the rachis-P was selected as an influential parameter for CI in both T1 and T2, FL in T2, FNL in both T1 and T2, FT in both T1 and T2, and FW in T1.

4. Discussion

4.1. ‘Optimum’ or ‘Excessive’ Status of Nutrient Levels in Comparison to the Guideline

The comparison of nutrient levels in the OP leaflets between the present study and those reported in the literature is presented in Table 4. Behera et al. [54] recorded the mean values of leaflets’ concentration of 2.21–2.49% N, 0.10–0.53% P, and 0.56–0.78% K in OPs of different areas of India. The variation in leaf nutrient concentration in the study area is ascribed to differences in soil properties and crop management ways.
According to Fairhurst and Mutert [9], the critical leaflets’ nutrient concentrations should be used with the greatest caution. Factors such as leaf number, palm age, leaflet rank, soil properties, rainfall, planting material, fruiting cycle, and fertilizer application can all influence the leaf nutrient concentration of the OP [72]. Leaf analysis data will be more comprehensive when a series of data has been collected over several years [9]. Therefore, a total period of four years in this study of immature OP can reasonably provide a conclusive result on the use of T2 in comparison to T1.
Because of the importance of fertilizer in the production and maintenance of large and sustainable yields of fresh fruit bunch, considerable efforts have been made to develop methods providing a scientific basis for estimating fertilizer requirements of OP. However, while soil and leaflet analysis may provide the basis for decisions on fertilizer use, the final OP yield is the result of the interaction of many different factors, some of which cannot be controlled or predicted. Hence, exact ‘prescriptions’ are not possible.
It is important to note that effective fertilizer recommendations are usually the result of combining the results of leaflet analysis with field knowledge and common sense [9]. The OP necessitates large quantities of K, N, P, Mg, and B [1,13,14,15,16]. Leaflet analysis remains the most common diagnostic tool to determine the nutritional status of OP for the estimation of suitable fertilizer rates [35]. This is because of the significant association between leaflets’ nutrient concentration and fresh fruit bunch yield [6,25,73]. Suitable fertilizer recommendations can result in significant cost savings in fertilizer usage when compared to the ‘standard’ rate suggested by foliar diagnosis and fertilizer response experiments [69]. Accurate measurements of the concentrations of N, P, K, and Mg in both the leaflet and the rachis tissues are needed [55] to provide correct fertilizer recommendations for the immature OP. Therefore, T2 can be recommended for the new biofertilizer application from the present trial study.
In the Indonesian OP area, Woittiez et al. [74] recommended that fertilizers should be placed in proper order and the correct balance. Besides, a ground cover vegetation is highly suggested where it is sustained and maintained to protect against soil erosion. The empty fruit bunches are recommended as the ground cover vegetation for OP plantations.
Based on the results of the t-Test analysis, there is no significant difference (p > 0.05) between T1 and T2. The overall results of the t-Test analysis of nutrient concentrations of the OPs from 6 to 48 MAP between T1 and T2 are presented in Table S7. For nutrients in the OP leaflets, it is found that higher concentrations (but not significant, p > 0.05) of N, Ca, Mg, Cl, and B are found in T2 when compared to those in T1. Similarly, as not significant (p > 0.05), T1 shows higher levels of K.
This study has determined that T2 is comparable to T1 in terms of >optimum levels of nutrients and good vegetative parameters without symptoms of deficiency in the OP leaflets. T2 can be applied similarly to T1 since NPK fertilizer is needed in large quantities by OP for vegetative growth during the immature period (0 to 48 months). The T2 fertilizer, with a lower rate and lower amount, can be recommended to accelerate the productive period during this immature, which will greatly determine the high yield of the overall productivity of OP cultivated in Malaysia.
By using applications of T1 and T2, all the levels of N, P, K, Ca, Mg, and B in the leaflets from the present study, from 6 to 48 MAP, were at least showing ‘Optimum’ or ‘Excessive’ in comparison to the guideline suggested by Fairhurst and Mutert [9], for OP leaflets of 1–6 years after planting.

4.2. Insights of Negative or Lack of Relationships between Vegetative Parameters and Leaflet Nutrients

These negative relationships between vegetative parameters and leaflet nutrient levels hint to three possible explanations.
  • First: Optimal nutrient uptake in both T1 and T2
It is speculated that these nutrient concentrations may have been over the optimal level and that any potential positive effects on the vegetative growth were masked by the variability between and within OP plantations. Thus, there is over-fertilization for both T1 and T2, which can be reduced to save the cost of fertilization through a reduction of the rate or amount of fertilizers. Sudradjat et al. [75] studied the role of N, P, and K fertilizers on the growth of one-year-old immature OP on marginal soil in Jonggol (Indonesia). Their results of leaf analysis and vegetative growth of OP showed that the rates of inorganic fertilizer application were inadequate to improve the immature OP growth in terms of leaf stomatal density, CI, and leaf NPK contents. The above study lends to the possible explanation of optimal levels of NPK or the excess amounts of fertilization of T1 and T2, which have led to negative correlations. NPK are important enzyme activators that maintain osmotic potential and water uptake during photosynthetic processes [76].
The present finding disagreed with that reported by Amirruddin et al. [4] because they reported that the N contents for immature OPs were under N deficiency (<2.5%) [24]. Therefore, they found that the growth and vegetative parameters of OP were affected by N treatments and OP maturity. Therefore, the present study based on T1 and T2 fertilizers generally tended to increase the leaflets’ NPK levels and vegetative parameters.
The insignificant differences might be credited to the high NPK reserve within the OP trunk. A negative response in growth parameters can only be perceived when nutrient reserve in OP is worn out. Application of NPK fertilizers would only significantly affect plant growth parameters of immature OPs only because of their active growing stage. Therefore, the nutrient reserve in immature OPs should be exhausted first before any differences in vegetative parameters can be observed. The absence of a correlation or negative correlation in both T1 and T2 fertilizer application is, therefore, due to optimal levels of nutrient uptakes and levels in both T1 and T2.
  • Second: Rainfall conditions
This could be explained by the fluctuations in rainfall and temperatures (Figure 2). These two climatic factors might have a strong effect on soil nutrient concentrations prior to and after applications of T1 and T2. Different periods of fertilizer application between T1 and T2 can also create variability in the uptake of nutrients between T1 and T2 (Figure 2). This could have contributed to the large variability and poor correlations between vegetative parameters and leaflets’ nutrient levels in both T1 and T2. Sudradjat et al. [75] found a significant response of frond production to NPK fertilizers one to two months after the fertilizer application. Frond production is highly affected by rainfall one to two months earlier. Water availability is important in dissolving nutrients that can be absorbed by the OP roots in the soil. Therefore, water shortages will result in problems in nutrient uptake by the OP roots. This consequently can contribute to the variability of vegetative growth and leaflets’ nutrient uptake within the OP trees in both T1 and T2.
  • Third: Different distribution patterns of nutrients to build up other important parts with increasing age
Since leaflets are the major sink sites for NPK at the immature stage of the OP, the amount of NPK to be allocated to these leaflets will decrease gradually as the age of the OP increases [20]. This could be attributed to mobilizing the nature of NPK with their major elemental feature in OPs. The decrement of NPK in the leaflets could be due to those elements being distributed to the formation of the OP trunk when they reach three years old and above. The trunks are important for supporting the structure of the leaves, flowers, and fruits [19]. According to Corley and Tinker [21], the OP trunks represent approximately 50% of the total above-ground biomass when the plants reach the age of 10 years.
Therefore, the negative relationships between vegetative parameters and leaflets’ nutrient levels could be related to some of the nutrients that have been transported and distributed to build up and support the formation of the OP trunks with increasing MAP. Besides, the immature phase of the OP received more than optimal levels of NPK as measured in the OP leaflets from 6 to 48 MAP. Since there are no deficient symptoms in the leaves (by observation) of OP from 6 to 48 MAP, there are insignificant positive correlations between NPK and vegetative parameters. This also may be related to the antagonistic relationship between K on the one hand and Ca and Mg on the other [34,35]. There have been many fertilizer trials reporting positive effects of K on growth and yield [11,34]). However, Woittiez et al. [51] reported no significant relationships between tissue K and vegetative growth.
It is hypothesized that the insignificant correlation between leaflets’ nutrient and vegetative parameters of the immature OP could also be due to this complex NPK partitioning and rainfall received during trial periods (2015–2018). Besides, Soon and Hoong [77] and Corley and Tinker [19] addressed that a longer time period (preferably four years or more) is needed for the immature OPs to manifest a stabilized fertilizer response on leaflets’ nutrition status.
It is acceptable that the factors of age and NPK fertilization are dependent variables for the vegetative parameters of OP in the present study. Some authors [78,79,80] exhibited that N fertilization positively increased OP trunk measurements and leaf area. Higher increments of growth parameters in 48 MAP were found when compared to the younger OP (6 MAP). Since the chemical properties of the pre-treatment soils and the soil type of both trial sites of T1 and T2 are not significantly (p > 0.05) different, other factors causing variability of leaflets’ nutrient levels and vegetative parameters can influence different growth rates of the OP T1 and T2. Sudradjat et al. [1] reported that K has a linear effect at 18 MAP on the leaf area of OPs.
No correlation exists between N and CI for T1 (R = 0.01) and T2 (−0.26). Amirruddin et al. [4] reported that green leaf reflectance of the immature OP was found to have negative moderate relationships to leaflets’ N and SPAD readings. Rajaratnam et al. [81] reported that the 17th frond (for the leaflet N analysis) was highly correlated to fruit bunch yield. Hatfield et al. [82] reported that the canopy measurements could be used for N estimation status, although this is dependent on many factors potentially confounding the N levels.
Sudradjat et al. [1] reported that K fertilizer application linearly affected the CI at six and 12MAP. Nevertheless, the K fertilizer application did not influence the CI in the second-year and third-year immature OP. They also reported that K fertilizer application linearly affected the nutrient content of K in the OP leaflets 6, 12, and 18 MAP, but not at 24 and 36 MAP. Their results suggested that the K nutrient at 6, 12, and 18 MAP was taken up and was needed by the OP for growth. However, it is possible that the K was not yet optimally taken up by OP roots [1].
The reports on the correlations between leaflets’ nutrient levels and vegetative parameters of the OP are limited in the literature. Manurung et al. [72] reported that NPK fertilizer positively and significantly influenced the plant height, leaf area, trunk girth, chlorophyll, and NPK leaf contents of the OP. They did not establish a direct CA between the leaflets’ NPK levels and the vegetative parameters of the OP. Therefore, it is difficult to compare with the present study. Woittiez et al. [51] reported a significant positive correlation between soil and leaflets’ nutrient concentrations in the OP for P (Sintang) and Mg (in both Sintang and Jambi) but not for the other nutrients. However, strong correlations between soil and leaflets’ K in the OP were reported by Foster and Prabowo [55].
For TLC, the leaflets Ca is found to correlate positively (R values ranging from 0.11 to 0.64) with the six vegetative parameters, while leaflets Mg is found to have almost no correlation (R values ranging from −0.32 to 0.31) with all the vegetative parameters. However, leaflets K correlates negatively and significantly (R values ranging from −0.68 to −0.15) with the six vegetative parameters. Similar patterns are found based on the three cations to TLC. The leaflets Ca/TLC are also found to correlate positively (R values from 0.01 to 0.65), the Mg/TLC has almost no significant correlation (R values from −0.45 to 0.21), and the K/TLC correlates positively (R values from −0.69 to −0.24), with the six vegetative parameters. The results may confirm the interdependence between the cations [35] besides their significant role in OP nutrition [55].
Woittiez et al. [51] reported a significant positive effect of rachis P and a significant negative effect of the leaflets’ K–Mg–Ca interaction component on the vegetative growth of OP in Indonesia. However, these relationships are not found for the individual leaflets’ K, Mg, and Ca components. Woittiez et al. [51] reported that the effects of leaflets’ Mg and Ca on vegetative growth were negative but insignificantly correlated (p > 0.05).
For all nutrients, the variability between plantations was considered low (<20%), and the sample size was relatively acceptable (N = 6 for each MAP). However, it is still possible to draw definitive conclusions about the relationship between optimal leaflets’ nutrient levels and vegetative parameters based on the present study. We can conclude that nutrient levels based on T1 and T2 are at least optimal in the OP leaflets and that vegetative growth was in the optimal and healthy condition, at least, in almost all the OP treated with T1 and T2.
In summary, there is no significant (p > 0.05) difference in terms of vegetative parameters and leaflets’ nutrient levels between T1 and T2 based on MLSRA and CA. The negative or no correlation between leaflets’ nutrient levels and vegetative parameters could be likely due to (a) the optimal levels of nutrients have been reached, (b) rainfall conditions, and (c) the formation of other major parts of the OP tree with increasing MAP.
Nutrient levels in the leaflets and rachis showed that applications of T1 and T2 had significant effects on the uptake of all nutrients (>optimal levels for all nutrients) investigated in the present study. By using applications of T1 and T2, all the levels of N, P, K, Ca, Mg and B in the leaflets from the present study were at least showing ‘Optimum’ or ‘Excessive’ in comparison to the guideline suggested by Fairhurst and Mutert [9], for OP of 1–6 years (or >6 years) after planting. T1 and T2 resulted in leaflets’ nutrient levels above the critical nutrient levels from 6 to 48 MAP. The results of leaflets’ nutrients and vegetative parameters suggested that the rate of T1 and T2 applied in this study was sufficient to improve immature OP growth in the present study.

4.3. Estimated Cost Saving

To estimate the cost savings, we used the estimated fertilizer costs for the year 2022 by the World Bank Blogs [83,84] (Table 5). For the estimation of the labour cost per hectare, we used the labour cost of RM 26.77/ha (Table 5) based on 300 independent smallholders’ interviews in Malaysia [85]. However, the study was conducted in early 2000. Therefore, the labour cost is expected to be significantly higher in 2022. According to the Ministry of Human Resources of Malaysia [86], for the palm oil industry, the average salary level is around RM2000 to RM2500 per month in 2022. Therefore, there is less argument if the salary was between RM500 to RM1000 in 2000 since there have been no reports on the salary in 2000.
The cost savings for the combination of T2 fertilizers per hectare (RM 1113.43) and reduction of the number of rounds (RM 133.85) of fertilizer application would give a sum of total cost savings of RM 1247.25 per hectare. If only based on the T2 fertilizer per hectare, the economic benefit of the total cost saving is estimated to be at least 10.6%. In the case of an OP plantation estate industry with 10,000 hectares of immature OP, this could mean a cost saving of >RM 1,247,250 (or >279,770 USD). Thus, clearly, this estimation has shown a significant cost saving if the T2 fertilizer was applied to the OP industries in Malaysia.

5. Conclusions

The aim of the present study was to compare the leaflets’ nutrient levels and vegetative parameters of E. guineensis using T2 in comparison with T1, from 6 to 48 MAP. It was found that there was no significant difference (p > 0.05) in the six chemical parameters (N, P, K, Mg, Ca, and B) in the OP leaflets between T1 and T2. Similarly, the differences in the values of the six vegetative parameters (FL, FNL, FW, FT, CI, and canopy) were not significant (p > 0.05) between T1 and T2, but higher mean values of the six parameters were found in the T2 than those in the T1. Both applications of T1 and T2 resulted in leaflets’ nutrient levels above the critical nutrient levels from 6 to 48 MAP. This indicated that both T1 and T2 applied in this study were enough to improve immature OP growth in the present study. The use of T2 is comparable to T1 in terms of nutrient levels and vegetative growth of the OP trees. Application of T2 fertilizer provided the amount of nutrients needed to support OP growth. Therefore, T2 is comparable to T1. Noteworthily, the T2 fertilizer, with a lower rate and lower amount, can be recommended to accelerate the productive period during this immature period, leading to the potentially high yield of the overall productivity of OP in the following years of OP cultivation in Malaysia.
From an economic benefit perspective, T2 reduced the cost compared to T1. The cost savings for the combination of T2 fertilizers per hectare (RM 1113.43) and reduction of the number of rounds (RM 133.85) of fertilizer application would give a sum of total cost savings of RM 1247.25 per hectare. If only based on the T2 fertilizer per hectare, the economic benefit of the total cost saving is estimated to be at least 10.6%.
In summary, this study provided a novel utilization of T2 as more cost-effective since it can reduce the overall cost of fertilization for better management of nutrients and vegetative parameters of the immature OP in Malaysia and in this region.

Supplementary Materials

The following supporting information can be downloaded at: https://www.mdpi.com/article/10.3390/horticulturae8090758/s1, Table S1. The rates of fertilizers applied at nursery period; Table S2. Fertilizer application periods and rounds for standard practice application (Treatment 1; T1) and Universiti Putra Malaysia (UPM) Biochemical Fertilizer (Treatment; T2), at Telang trial project from 2015–2018; Table S3. Regime/composition of fertilizer applications in standard practice application (Treatment 1; T1) and Universiti Putra Malaysia (UPM) Biochemical Fertilizer (Treatment; T2), from 2015–2018; Table S4. Normality test of Shapiro-Wilk results based on all the data investigated in the presented study; Table S5. Comparisons of chemical concentrations pre-treatment soils of oil palms between Treatment 1 (T1) and Treatment 2 (T2) from two different depths (0–15 cm and 15–30 cm) collected from Weeded Circle (WC); Table S6. Overall mean concentrations (%) of P and K in the rachis of oil palm from the present study, from 6 to 48 months after planting (MAP); Table S7. Overall results of t-Test analysis of nutrients concentrations of the leaflets of oil palms from 6 to 48 months after planting between Treatment 1 (T1) and Treatment 2 (T2) (N = 48 for T1 and T2); Table S8. Overall mean values of t-Test analysis of vegetative parameters of the oil palms from 6 to 48 months after planting between Treatment 1 (T1) and Treatment 2 (T2) (N = 48 for T1 and T2).

Author Contributions

Conceptualization, S.H.T.P. and G.H.T.; methodology and validation, S.H.T.P. and G.H.T.; formal analysis, S.H.T.P. and G.H.T.; investigation, S.H.T.P.; resources, S.H.T.P.; data curation, K.H.C., H.M.S. and M.R.Y.; writing—original draft preparation, S.H.T.P.; writing—review and editing, K.H.C., H.M.S., M.R.Y. and G.H.T. All authors have read and agreed to the published version of the manuscript.

Funding

This research received funding from All Cosmos Bio-Tech Holding Corporation.

Institutional Review Board Statement

Not applicable.

Informed Consent Statement

Not applicable.

Data Availability Statement

Not applicable.

Acknowledgments

Authors would like to thank the reviewers for providing constructive comments.

Conflicts of Interest

The authors declare no conflict of interest.

References

  1. Purwanto, O.D.; Faustina, E.; Shintarika, F. Roles and optimisation rate of potassium fertiliser for immature oil palm (Elaeis guineensis Jacq.) on an Ultisol soil in Indonesia. J. Agric. Rural Develop. Trop. Subtrop. 2018, 119, 13–22. [Google Scholar]
  2. Ng, S.K. Review of oil palm nutrition and manuring. Scope for greater economy in fertilizer usage. Oleagineux 1977, 32, 197–209. [Google Scholar]
  3. Ng, S.K. Greater Productivity of the Oil Palm (Elaeis guineensis Jacq.) with Efficient Fertilizer Practices. In Proceedings of the 9th Congress International Potash & Phosphate Institute, Landshut, Germany, 19 May 1979; pp. 357–376. [Google Scholar]
  4. Amirruddin, A.D.; Farrah Melissa, M.; Tan, N.P.; Daljit Singh, K.S.; Martini, M.Y. Nitrogen effects on growth and spectral characteristics of immature and mature oil palms. Asian J. Plant Sci. 2017, 16, 200–210. [Google Scholar] [CrossRef]
  5. Broschat, T.K. Palm Nutrition and Fertilization. HortTechnology 2009, 19, 690–694. [Google Scholar] [CrossRef]
  6. Mengel, K.; Kirkby, E.A. Principles of Plant Nutrition; International Potash Institute: Basel, Switzerland, 1987. [Google Scholar]
  7. Goh, K.J. Fertilizer recommendation systems for oil palm: Estimating the fertilizer rates. In Proceedings of the MOSTA Best Practices Workshops: Agronomy and Crop Management, 27 March–14 August 2004; Soon, C.P., Pau, T.Y., Eds.; Malaysian Oil Scientists’ and Technologists’ Association (MOSTA): Kuala Lumpur, Malaysia, 2005; pp. 235–268. [Google Scholar]
  8. Chew, P.S.; Tan, Y.P. MOSTA Best Practices Workshops 2004, Proceedings of the Agronomy and Crop Management, Kuala Lumpur, Malaysia, 27 March–14 August 2004; Malaysian Oil Scientists’ and Technologists’ Association (MOSTA): Kuala Lumpur, Malaysia, 2005; p. 546. [Google Scholar]
  9. Fairhurst, T.H.; Mutert, E. Interpretation and Management of Oil Palm Leaf Analysis Data. Better Crops Int. 1999, 13, 1. [Google Scholar]
  10. Goh, K.; Teo, C. Agronomic principles and practices of fertilizer management of oil palm. In Agronomic Principles and Practices of Oil Palm Cultivation; Goh, K., Chiu, S., Paramananthan, S., Eds.; Agricultural Crop Trust: Petaling Jaya, Malaysia, 2008; pp. 241–318. [Google Scholar]
  11. Tohiruddin, L.; Tandiono, J.; Silalahi, A.J.; Prabowo, N.E.; Foster, H.L. Effects of N, P and K fertilizers on leaf trace element levels of oil palm in Sumatra. J. Oil Palm Res. 2010, 22, 869–877. [Google Scholar]
  12. Goh, K.J.; Chew, P.S. Managing soils for plantation tree crops. 1. General soil management. In Course on Soil Survey and Managing Tropical Soils; Paramanathan, S., Ed.; MSSS and PASS: Kuala Lumpur, Malaysia, 1995; pp. 228–245. [Google Scholar]
  13. Goh, K.J.; Chew, P.S.; Kee, K.K. Spatial soil fertility in mature oil palm agroecosystem and its implications on fertiliser management. In Proceedings of the Soil Science Conference of Malaysia, Langkawi, Kedah, 17–19 April 1995; Aminuddin, B.Y., Ismail, A.B., Ahmad, A.R., Ghazali, M.Z., Eds.; Malaysian Society of Soil Science: Kuala Lumpur, Malaysia, 1996. [Google Scholar]
  14. Goh, K.J.; Kee, K.K.; Chew, P.S. Soil fertility status of some common soils in Sabah, Malaysia. In Proceedings of the Soil Science Conference of Malaysia, Penang, Malaysia, 19–21 April 1993; Aziz, B., Amir Husni, M.S., Eds.; Malaysian Society of Soil Science: Kuala Lumpur, Malaysia, 1998; pp. 1–16. [Google Scholar]
  15. Goh, K.J.; Chew, P.S.; Teoh, K.C. Ground magnesium limestone as a source of magnesium for mature oil palm on sandy soil in Malaysia. In Proceedings of the 1998 International OP Conference on Commodity of the Past, Today and Future, Nusa Dua, Indonesia, 23–25 September 1998; Jatmika, A., Bangun, D., Asmono, D., Sutarta, E.S., Kabul, P., Guritno, P., Prawirosukarto, S., Wahyono, T., Herawan, T., Hutomo, T., et al., Eds.; IOPRI: Bali, Indonesia, 1999; pp. 347–362. [Google Scholar]
  16. Goh, K.J.; Teo, C.B.; Chew, P.S.; Chiu, S.B. Fertiliser management in oil palm: Agronomic principles and field practices. In Fertiliser Management for Oil Palm Plantations; ISP North-East Branch: Sandakan, Malaysia, 1999; p. 44. [Google Scholar]
  17. Goh, K.J.; Tee, B.H.; Anuar, A.R.; Woo, C.Y. Spatial yield variation of oil palm in a fertilizer response trial in Malaysia. In Proceedings of the Annual Soil Science Conference, Johor, Malaysia, 4–8 December 2000; Malaysian Society of Soil Science (MSSS): Kuala Lumpur, Malaysia, 2000. [Google Scholar]
  18. Goh, K.J.; Hardter, R.; Fairhurst, T. Fertilizing for maximum return. In Oil Palm: Management for Large and Sustainable Yields; Fairhurst, T., Hardter, R., Eds.; Potash & Phosphate Institute/Potash & Phosphate Institute of Canada and International Potash Institute (PPI/PPIC and IPI): Singapore, 2003; pp. 279–306. [Google Scholar]
  19. Corley, R.H.V.; Tinker, P.B.H. Growth, Flowering and Yield. In The Oil Palm, 4th ed.; Corley, R.H.V., Tinker, P.B.H., Eds.; Blackwell Science Ltd.: Oxford, UK, 2003; Chapter 4; pp. 89–132. [Google Scholar]
  20. Corley, R.; Tinker, P. Mineral Nutrition of Oil Palms. Plant. Rech. Dev. 1994, 1, 36–54. [Google Scholar] [CrossRef]
  21. Kee, K.K.; Goh, K.J. Efficient fertiliser management for higher productivity and sustainability in oil palm production. In Proceedings of the International Planters Conference on Higher Productivity and Efficient Practices for Sustainable Plantation Agriculture, Putrajaya, Malaysia, 26–28 June 2006; Technical Papers. Incorporated Society of Planters: Kuala Lampur, Malaysia, 2006; Volume 1, pp. 157–182. [Google Scholar]
  22. Breure, K. The search for yield in oil palm: Basic principles. In Oil Palm: Management for Large and Sustainable Yields; Fairhurst, T., Hardter, R., Eds.; Potash & Phosphate Institute/Potash Institute of Canada and International Potash Institute: Singapore, 2003; pp. 59–98. [Google Scholar]
  23. Hardter, R. A review of magnesium nutrition in oil palm. In Proceedings of the Branch Seminar on Reforming the Mindset of Plantation Management into the Next Millennium, Taiping, Malaysia, 29 July 1999. [Google Scholar]
  24. Goh, K.J.; Hardter, R. General oil palm nutrition. In Oil Palm: Management for Large and Sustainable Yields; Fairhurst, T., Hardter, R., Eds.; PPI/PPIC and IPI: Singapore, 2003; pp. 191–230. [Google Scholar]
  25. Agamuthu, P.; Broughton, W. Nutrient cycling within the developing oil palm-legume ecosystem. Agric. Ecosyst. Environ. 1985, 13, 111–123. [Google Scholar] [CrossRef]
  26. Tarmizi, M.A.; Mohd, T.D. Nutrient demands of Tenera oil palm planted on inland soils of Malaysia. J. Oil Palm Res. 2006, 18, 204–209. [Google Scholar]
  27. World Weather Online. 2019. Available online: https://www.worldweatheronline.com/kuala-lipis-weather-averages/pahang/my.aspx (accessed on 30 July 2019).
  28. Anderson, J.M.; Ingram, J.S.I. Tropical soil biology and fertility. In A Handbook of Methods, 2nd ed.; CAB International: Wallingford, UK, 1992; 221p. [Google Scholar]
  29. Zulkefli, H.; Masnon, Z.M. Soil Analysis; Laboratory Manual. Part 1. Biology Division; PORIM: Bangi, Malaysia, 1993; 63p.
  30. SIRIM. SIRIM Recommended Methods for Plants Analysis, 1st ed.; MS 677: PT.1-VII; SIRIM: Shah Alam, Malaysia, 1980. [Google Scholar]
  31. Woittiez, L.S.; Haryono, S.; Turhina, S.; Dani, H.; Dukan, T.P.; Smit, H. Smallholder Oil Palm Handbook Module 4: Fertiliser Application, 3rd ed.; Wageningen, and SNV International Development Organisation, Wageningen University: The Hague, The Netherlands, 2016; 64p. [Google Scholar]
  32. Zulkefli, H.; Masnon, Z.M. Plant Analysis; Laboratory Manual. Part II. Biology Division; PORIM: Bangi, Malaysia, 1993; 44p.
  33. Fairhurst, T.H.; Hardter, R. Oil Palm: Management for Large and Sustainable Yields; Potash & Phosphate Institute (PPI), Potash & Phosphate Institute of Canada (PPIC) and International Potash Institute (IPI): Singapore, 2003; p. 382. [Google Scholar]
  34. Ollagnier, M.; Ochs, R. Management of mineral nutrition in industrial oil palm plantations. Fertilizer savings. Oleagineux 1981, 36, 409–421. [Google Scholar]
  35. Foster, H.L. Assessment of oil palm fertilizer requirements. In Oil Palm: Management for Large and Sustainable Yields; Fairhurst, T., Hardter, R., Eds.; Potash and Phosphate Institute (PPI), Potash and Phosphate Institute Canada (PPIC) and Int. Potash Inst. (IPI): Singapore, 2003; pp. 231–257. [Google Scholar]
  36. Shapiro, S.S.; Wilk, M.B. An Analysis of Variance Test for Normality (Complete Samples). Biometrika 1965, 52, 591. [Google Scholar] [CrossRef]
  37. Ghasemi, A.; Zahediasl, S. Normality Tests for Statistical Analysis: A Guide for Non-Statisticians. Int. J. Endocrinol. Metab. 2012, 10, 486–489. [Google Scholar] [CrossRef] [PubMed]
  38. Mishra, P.; Pandey, C.M.; Singh, U.; Gupta, A.; Sahu, C.; Keshri, A. Descriptive statistics and normality tests for statistical data. Ann. Card. Anaesth. 2019, 22, 67–72. [Google Scholar] [CrossRef] [PubMed]
  39. Zar, J.H. Biostatistical Analysis, 3rd ed.; Prentice-Hall International: Hoboken, NJ, USA, 1996. [Google Scholar]
  40. Manly, B.F.J. Multivariate Statistical Methods: A Primer, 2nd ed.; Chapman and Hall: London, UK, 1997. [Google Scholar]
  41. Yap, C.K.; Rahim Ismail, A.; Ismail, A.; Tan, S.G. Analysis of heavy metal level data (Cd, Cu, Pb and Zn) in different geochemical fractions of the surface sediments in the Straits of Malacca by the use of correlation and multiple linear stepwise regression analyses. Malays. Appl. Biol. 2005, 34, 51–59. [Google Scholar]
  42. Yap, C.K.; Edward, F.B.; Tan, S.G. Similarities and differences of metal distributions in the tissues of molluscs by using multivariate analyses. Environ. Monit. Assess. 2009, 165, 39–53. [Google Scholar] [CrossRef] [PubMed]
  43. Yap, C.K.; Noorhaidah, A.; Tan, S.G. Zn concentrations in the different soft tissues of Telescopium telescopium and their relationships with Zn speciation by sequential extraction in surface sediments: A statistical multiple linear stepwise regression analysis. In Gastropods: Diversity, Habitat and Genetics; Andrea, M.B., Jamie, N.F., Eds.; Nova Science Publishers: New York, NY, USA, 2011; pp. 127–148. [Google Scholar]
  44. Yap, C.K.; Rahim Ismail, A. Relationships of distribution of macrobenthic invertebrates and the physico-chemical parameters from Semenyih River by using correlation and multiple linear stepwise regression analyses. Pertanika J. Trop. Agric. Sci. 2011, 34, 229–245. [Google Scholar]
  45. Yap, C.K.; Rahim Ismail, A.; Ismail, A.; Tan, S.G. Studies on heavy metal accumulations in green-lipped mussel Perna viridis by using multiple linear stepwise regression analysis. Pertanika J. Sci. Technol. 2003, 11, 43–55. [Google Scholar]
  46. Afandi, A.M.; Hamdan, A.B.; Tarmizi, A.M.; Kushairi, A.; Khairuman, H. Oil palm growth and yield as affected by densities, progenies and N fertilizer on Bengawat Soil: The preliminary results. Oil Palm Bull. 2005, 50, 14–23. [Google Scholar]
  47. Tao, H.-H.; Donough, C.; Gerendas, J.; Hoffmann, M.P.; Cahyo, A.; Sugianto, H.; Wandri, R.; Rahim, G.A.; Fisher, M.; Rötter, R.P.; et al. Fertilizer management effects on oil palm yield and nutrient use efficiency on sandy soils with limited water supply in Central Kalimantan. Nutr. Cycl. Agroecosyst. 2018, 112, 317–333. [Google Scholar] [CrossRef]
  48. Rhebergen, T.; Fairhurst, T.; Whitbread, A.; Giller, K.E.; Zingore, S. Yield gap analysis and entry points for improving productivity on large oil palm plantations and smallholder farms in Ghana. Agric. Syst. 2018, 165, 14–25. [Google Scholar] [CrossRef]
  49. Behera, S.K.; Rao, B.N.; Suresh, K.; Manoja, K. Soil Nutrient Status and Leaf Nutrient Norms in Oil Palm (Elaeis guineensis Jacq.) Plantations Grown on Southern Plateau of India. Proc. Natl. Acad. Sci. India Sect. B Boil. Sci. 2015, 86, 691–697. [Google Scholar] [CrossRef]
  50. Goh, K.J.; Chew, P.S. Interpretations of Analytical Data from Soil Survey Reports for Manuring Recommendations: Some Pointers. R. Johore Plant. Assoc. Annu. Rep. 1997, 1997, 25–30. [Google Scholar]
  51. Woittiez, L.S.; Turhina, S.; Deccy, D.; Slingerland, M.; VAN Noordwijk, M.; Giller, K.E. Fertiliser application practices and nutrient deficiencies in smallholder oil palm plantations in Indonesia. Exp. Agric. 2018, 55, 543–559. [Google Scholar] [CrossRef]
  52. Behera, S.K.; Shukla, A.K.; Suresh, K.; Mathur, R.K. Estimation of Soil Properties and Leaf Nutrients Status of Oil Palm Plantations in an Intensively Cultivated Region of India. Curr. Sci. 2019, 117, 497. [Google Scholar] [CrossRef]
  53. Lee, C.T.; Rahman, Z.A.; Musa, M.H.; Norizan, M.S.; Tan, C.C. Leaf nutrient concentrations in oil palm as affected by genotypes, irrigation and terrain. J. Oil Palm Environ. 2011, 2, 38–47. [Google Scholar]
  54. Behera, S.K.; Suresh, K.; Rao, B.N.; Manoja, K.; Manorama, K. Soil nutrient status and leaf nutrient norms in oil palm (Elaeis guineensis Jacq.) plantations grown on west coastal area of India. Commun. Soil Sci. Plant Anal. 2016, 47, 255–262. [Google Scholar] [CrossRef]
  55. Foster, H.L.; Prabowo, N.E. Partition and transfer of nutrients in the reserve tissues and leaves of oil palm. In Proceedings of the Workshop on Nutrient Needs in Oil Palm, Singapore, 17–18 October 2006; Potash and Phosphate Institute: Singapore, 2006. [Google Scholar]
  56. Uwumarongie-Iloria, E.; Sulaiman-Ilobu, B.; Ederion, O.; Imogie, A.; Ugbah, M.; Imoisi, B.O.; Garuba, N. Vegetative Growth Performance of Oil Palm (Elaeis guineensis) Seedlings in Response to Inorganic and organic fertilizers. Greener J. Agric. Sci. 2012, 2, 26–30. [Google Scholar] [CrossRef]
  57. Corley, R.H.V.; Mok, C.K. Effects of Nitrogen, Phosphorus, Potassium and Magnesium on Growth of the Oil Palm. Exp. Agric. 1972, 8, 347–353. [Google Scholar] [CrossRef]
  58. Lias, B. Oil palm NPKMg fertiliser trial (Sei Lakitan) EXPT EG00.1412A; Bah Lias Annual Report Volume 1, Bah Lias Research Station; PTPP London Sumatra Indonesia: Medan, Indonesia, 2011; pp. 89–92. [Google Scholar]
  59. White, P.J.; Broadley, M.R. Calcium in plants. An. bot. 2003, 92, 487–511. [Google Scholar] [CrossRef]
  60. Shaul, O. Magnesium transport and function in plants: The tip of the iceberg. BioMetals 2002, 15, 307–321. [Google Scholar] [CrossRef]
  61. Dubos, B.; Caliman, J.P.; Corrado, F.; Quencez, P.; Siswo, S.; Tailez, B. Importance of magnesium nutrition in oil palm. Plant. Recherche Dév. 1999, 6, 25–39. [Google Scholar]
  62. Rajaratnam, J.A. Effect of boron deficiency on the production of oil palm in Malaysia. Oléagineux 1973, 28, 329–332. [Google Scholar]
  63. Rajaratnam, J.A.; Lowry, J.B. The Role of Boron in the Oil-palm (Elaeis guineensis). Ann. Bot. 1974, 38, 193–200. [Google Scholar] [CrossRef]
  64. Gerendas, J.; Utomo, B.; Martoyo, K.; Donough, C.R.; Oberthür, T. Effect of nutrient application frequency on nutrient uptake in oil palm production on sandy soils. In Proceedings of the International Palm Oil Congress (PIPOC), Kuala Lumpur, Malaysia, 28 January 2014. [Google Scholar]
  65. Lee, C.T.; Abdul Rahman, Z.; Ishak, C.F.; Norizan, M.S.; Tan, C.C.; Mohd Yusif, M.S. Rachis nutrient concentrations of different oil palm genotypes as affected by irrigation and terrain. J. Oil Palm Res. 2014, 26, 146–153. [Google Scholar]
  66. Kraip, J.; Nake, S. Response of Oil Palm (Elaeis guineensis Jacq.) to Additions of Nitrogen, Phosphorus and Potassium from Planting to 7 Years after Planting: PNG OPRA Trial 501; Oil Palm Research Association: Kimbe, Papua New Guinea, 2006. [Google Scholar]
  67. Rankine, I.R.; Fairhurst, T.H. Field Handbook: Oil Palm Series, Volume 3—Mature; Potash & Phosphate Institute: Singapore, 1999. [Google Scholar]
  68. Ochs, R.; Olivin, J. Le diagnostic foliaire pour le controle de la nutrition des plantations de palmiers à huile: Prélèvement des échantillions foliares. Oléagineux 1977, 32, 211–216. [Google Scholar]
  69. Teoh, K.C.; Chew, P.S. Use of rachis K analysis as an indicator of K nutrient status in oil palm. In Proceedings of the 1987 International Oil Palm Conference, Kuala Lumpur, Malaysia, 23–26 June 1987; Halim, H.A.H., Chew, P.S., Wood, B.J., Pushparajah, E., Eds.; PORIM and Inc. Soc. of Planters: Kuala Lumpur, Malaysia, 1988; pp. 262–271. [Google Scholar]
  70. Braconnier, S.; Auzac, J.D. Anatomical study and cytological demonstration of potassium and chlorine flux associated with oil palm and coconut stomatal opening. Oléagineux 1985, 40, 547–551. [Google Scholar]
  71. Foster, H.L.; Tarmizi, A.M.; Zin, Z.Z. Foliar diagnosis of oil palm in Peninsular Malaysia. In Proceedings of the 1987 International Oil Palm Conference, Kuala Lumpur, Malaysia, 23–26 June 1987; Halim, H.A.H., Chew, P.S., Wood, B.J., Pushparajah, E., Eds.; PORIM and Inc. Soc. of Planters: Kuala Lumpur, Malaysia, 1988; pp. 244–261. [Google Scholar]
  72. Manurung, A.N.H.; Sudradjat, H. Optimization rate of organic and NPK compound fertilizers on second-year immature oil palm. Asian J. Appl. Sci. 2015, 3, 375–381. [Google Scholar]
  73. Foster, H.L.; Chang, K.C. The diagnosis of the nutrient status of oil palms in West Malaysia. In International Development in Oil Palms; Earp, D.A., Newall, W., Eds.; Incorporated Society of Planters: Kuala Lumpur, Malaysia, 1977; pp. 290–312. [Google Scholar]
  74. Woittiez, L.S.; Slingerland, M.; Rafik, R.; Giller, K.E. Nutritional imbalance in smallholder oil palm plantations in Indonesia. Nutr. Cycl. Agroecosyst. 2018, 111, 73–86. [Google Scholar] [CrossRef]
  75. Sudrajat, S.; Sukmawan, Y.; Sugiyanta, S. Influence of manure, nitrogen, phosphorus and potassium fertilizer application on growth of one-year-old oil palms on marginal soil in Jonggol, Bogor, Indonesia. J. Trop. Crop Sci. 2014, 1, 18–24. [Google Scholar] [CrossRef]
  76. Taiz, L.; Zeiger, E. Plant Physiology, 5th ed.; Sinauer Associates: Sunderland, UK, 2010; 690p. [Google Scholar]
  77. Soon, B.B.F.; Hoong, H.W. Agronomic practices to alleviate soil and surface runoff losses in an oil palm estate. Malays. J. Soil Sci. 2002, 6, 53–64. [Google Scholar]
  78. Afandi, A.M.; Tarmizi, A.M.; Haniff, M.H.; Zulkifli, H.; Noh, A.; Hamdan, A.B.; Hairuman, H. Dry matter production and nutrient uptake by PS1 and D×P planting materials on typic endoaquepts soil in Sabah. Oil Palm Bull. 2008, 57, 10–16. [Google Scholar]
  79. Moradi, A.; Sung, C.T.B.; Joo, G.K.; Hanif, A.H.M.; Ishak, C.F. Evaluation of Four Soil Conservation Practices in a Non-Terraced Oil Palm Plantation. Agron. J. 2012, 104, 1727–1740. [Google Scholar] [CrossRef]
  80. Moradi, A.; Teh, C.; Goh, K.; Husni, M.; Ishak, C. Decomposition and nutrient release temporal pattern of oil palm residues. Ann. Appl. Biol. 2013, 164, 208–219. [Google Scholar] [CrossRef]
  81. Rajaratnam, J.A.; Chan, K.W.; Goh, M.K. The foundation for selecting leaf 17 for nutrient requirements of mature oil palms. In Classification and Management of Tropical Soils; Joseph, K.T., Ed.; Malaysian Society for Soil Science: Kuala Lumpur, Malaysia, 1980. [Google Scholar]
  82. Hatfield, J.L.; Gitelson, A.A.; Schepers, J.S.; Walthall, C.L. Application of Spectral Remote Sensing for Agronomic Decisions. Agron. J. 2008, 100, S-117–S-131. [Google Scholar] [CrossRef]
  83. Baffes, J.; Koh, W.C. Fertilizer Prices Expected to Remain Higher for Longer. World Bank Blogs. 11 May 2022. Available online: https://blogs.worldbank.org/opendata/fertilizer-prices-expected-remain-higher-longer (accessed on 1 July 2022).
  84. DOSM (Department of Statistic Malaysia). DOSM/BPHPP/4.2022/Series 36—How Fertiliser Price Was Affected by the Global Situation. Department of Statistic Malaysia. 2022. Available online: https://www.dosm.gov.my/v1/uploads/files/6_Newsletter/Newsletter%202022/DOSM_BPHPP_4_2022_Series%2036_compressed.pdf (accessed on 3 August 2022).
  85. Ismail, A.; Simeh, M.A.; Noor, M.M. The Production Cost of Oil Palm Fresh Fruit Bunches: The Case of Independent Smallholders in Johor. Oil Palm Ind. Econ. J. 2003, 3, 1–7. [Google Scholar]
  86. The Malaysian Reserve. No Problem for RM 1500 Minimum Wage in Plantation Sector. 2022. Available online: https://themalaysianreserve.com/2022/03/15/plantation-sector-has-no-problem-to-implement-rm1500-minimum-wage/ (accessed on 1 July 2022).
Figure 1. Study trial site and the experimental layout for Treatment 1 (T1) and Treatment 2 (T2) at an oil palm plantation (Telang trial project) in Kuala Lipis (Pahang). There are twelve recording oil palm trees for each replicate (P). The map on the left is from the source: google.com/map. Note: T1 as Standard Practice application fertilizer (P1 to P6); T2 as UPM biochemical fertilizer application (P7 to P12).
Horticulturae 08 00758 g001
Figure 2. Temperature (°C; top) and rainfall (mm; below) from 2015 to 2018 at Kuala Lipis, Pahang (Graphs cited and edited from the source World Weather Online [27]. Note: Slanting arrow ( Horticulturae 08 00758 i001) shows the sampling time for foliar analysis and vegetative measurement. MAP = Months after planting. Horticulturae 08 00758 i002 = T1 fertilizer application, Horticulturae 08 00758 i003 = T2 fertilizer application; ‘Jan = January; Jul = July’.
Horticulturae 08 00758 g002
Figure 3. Variations of (a) total nitrogen (Tot N) concentrations (mean ± SE, %), (b) calcium (Ca) concentrations (mean ± SE, %), (c) magnesium (Mg) concentrations (mean ± SE, %), and (d) boron (B) concentrations (mean ± SE, mg/kg) in the leaflets from 6 to 48 months after planting (MAP) between Treatment 1 (T1) and Treatment 2 (T2) of the oil palm (Elaeis guineensis) at the trial site in Telang plantation area, Pahang.
Horticulturae 08 00758 g003
Figure 4. Variations of (a) phosphorus (P) concentrations (mean ± SE, %) in the leaflets, (b) P concentrations (mean ± SE, %) in the rachis, (c) critical P (mean ± SE, %) in the leaflets, (d) potassium (K) concentrations (mean ± SE, %) in the leaflets, and (e) K concentrations (mean ± SE, %) in the rachis, from 6 to 48 months after planting (MAP), of the oil palm (Elaeis guineensis) at the trial site in Telang plantation area, Pahang.
Horticulturae 08 00758 g004aHorticulturae 08 00758 g004b
Figure 5. Relationships of rachis (x-axis) and leaflets (y-axis) concentrations of (a) phosphorus (P) for Treatmen 1 (T1), (b) P for Treatment 2 (T2), (c) potassium (K) for T1, and (d) K for T2, of the oil palm (Elaeis guineensis) at the trial site in Telang plantation area, Pahang. Black lines show the fixed critical levels for P (0.10% for rachis and 0.15% for leaflet) and for K (1.10% for rachis and 0.80% for leaflet) below which a yield response to nutrient application would be expected [55].
Horticulturae 08 00758 g005
Figure 6. Variations of (a) total leaf cation (TLC) concentrations (mean ± SE, cmol/kg dry matter), percentages (%) of concentrations of (b) sodium (K), (c) magnesium (Mg), and (d) calcium (Ca) to TLC concentrations, from 6 to 48 months after planting (MAP), of the oil palm (Elaeis guineensis) at the trial site in Telang plantation area, Pahang.
Horticulturae 08 00758 g006
Figure 7. Relationships of percentages (%) of concentrations of (a) sodium (K) for Treatment 1 (T1), (b) K for Treatment 2 (T2), (c) magnesium (Mg) for T1, (d) Mg for T2, (e) calcium (Ca) for T1, and (f) Ca for T2, to their respective total leaf cation (TLC) concentrations (cmol/kg dry matter), in the leaflets of oil palms. The horizontal black lines show the critical percentages for K, Mg, and Ca, below which a yield response to the nutrient application would be expected [35].
Horticulturae 08 00758 g007
Figure 8. Variations of (a) frond length (mean ± SE, cm), (b) frond number of leaflets (frond no leaf) (mean ± SE, number), and (c) canopy (mean ± SE, cm), between T1 and T2, from 6 to 48 months after planting (MAP) of the oil palm (Elaeis guineensis) at the trial site in Telang plantation area, Pahang. Doted blue line indicates T2 while solid black line indicates T1.
Horticulturae 08 00758 g008
Figure 9. Variations of (a) frond width (mean ± SE, cm), (b) frond thickness (mean ± SE, cm), and (c) chlorophyll index (mean ± SE, %), between T1 and T2, from 6 to 48 months after planting (MAP) of the oil palm (Elaeis guineensis) at the trial site in Telang plantation area, Pahang. Note: Doted blue line indicates T2 while solid black line indicates T1.
Horticulturae 08 00758 g009
Table 1. Comparisons of chemical levels in the pre-treatment soils collected at the weeded circle of oil palms between the present study and some reported studies in the literature.
T1 MeanT2 MeanT1 MeanT2 MeanBehera et al. [49]Behera et al. [49]Tao et al. [47]Rhebergen et al. [48]Afandi et al. [46]Afandi et al. [46]Goh and Chew [50]
WC 0–15 (N = 6)WC 0–15 (N = 6)WC 15–30 (N = 6)WC 15–30 (N = 6)Southern Plateau of India (0–20)Southern Plateau of India (20–40)Sandy Soils Central Kalimantan (0–20 cm)Ghana Smallholders (WC; 0–40 cm)Bengawat Soil (WC; 0–15 cm)Bengawat Soil (WC; 15–30 cm)Critical Level
pH4.254.294.184.316.946.814.4–4.85.305.395.164.00
Tot N0.120.100.120.10NANA0.22–0.260.12NANA0.12
Org C2.271.982.361.851.160.7863.3–3.91.211.271.051.20
Tot P240212240209--NANANA 200
Av P11.38.0010.58.17NANA7–29711.949.0515
CEC4.644.345.274.19NANANANANANA12
Ex K0.120.100.120.10--0.08–0.320.1170.590.390.20
Ex Ca0.981.150.951.10--0.46–1.03NA16.0214.20NA
Ex Mg0.330.390.380.35--0.1–0.20.826.096.040.20
Ex Al0.490.410.530.42NANANANA2.112.62NA
B1.941.911.831.85NANANANANANANA
Note: pH is unitless; Total N in %; Organic (Org) C in %; Total P in mg/kg; Available P in mg/kg; CEC in cmol(+)/kg; exchangeable K, Ca, Mg and Al in cmol(+)/kg; B in mg/kg; NA = data are not available.
Table 2. Comparisons of the results of the multiple linear stepwise regression analysis between standard practice application (Treatment 1; T1) and Universiti Putra Malaysia (UPM) Biochemical Fertilizer (UPM-BCF) (Treatment; T2) in their nutrient concentrations in the leaflets (as independent variables) and vegetative parameters (as dependent variables) of the oil palm trees (N = 48 for both T1 and T2). All p = 0.000.
CanopyT1InterceptMAPBMgTot-N RF
1.340.99−0.090.06−0.01 0.991841
T2InterceptMAPKMg/TLCPRachis-KCritical-P RF
0.511.080.10−0.050.090.05−0.04 0.99303
Chlorophyll indexT1InterceptMAPMg/TLCPRachis-PBCa/TLCK/TLCMgK RF
3.290.920.530.07−0.170.32−1.85−2.67−1.500.89 0.9429.5
T2InterceptMAPPBTLCCa/TLCCaRachis-PKK/TLCMgRF
−7.711.460.570.0010.886.26−14.220.20−8.668.24−2.360.9117.2
Frond lengthT1InterceptMAPBRachis-KPMg/TLC RF
775.120.81−0.150.09−0.15−0.08 0.98237
T2InterceptMAPMg/TLCRachis-KCa/TLCCaRachis-PB RF
1007.370.90−0.260.12−0.630.64−0.14−0.14 0.97109
Frond no leafletsT1InterceptMAPMg/TLCRachis-PRachis-KTot-NP RF
1.300.960.05−0.05−0.080.05−0.05 0.99310
T2InterceptMAPPCritical-PCa/TLCRachis-P RF
0.351.150.090.13−0.100.05 0.98231
Frond thicknessT1InterceptMAPCaRachis-PBTLCCa/TLCPRachis-K RF
−2.771.21−2.340.18−0.380.781.320.14−0.08 0.9226.0
T2InterceptMAPKTot-NK/TLCBRachis-PTLCPCa/TLC RF
12.110.753.76−0.29−5.28−0.43−0.23−1.890.16−0.27 0.918.3
Frond widthT1InterceptMAPBMg/TLCKRachis-PTLCK/TLC RF
0.511.03−0.340.241.190.13−0.74−1.31 0.9659.6
T2InterceptMAPBKK/TLCTot-NP RF
0.920.89−0.270.43−0.35−0.130.12 0.8619.6
Note: Independent (14) variables included in the present study are N, P, K, Ca, Mg, B, TLC, K/TLC, Mg/TLC, Ca/TLC, Critical P, Rachis P, Rachis K, and age of the plant (a month after planting); TLC = Total Leaf Cation. For T1, the data that were found to have the significance value of the Shapiro-Wilk Test below 0.05, indicating the data significantly deviated from a normal distribution. These data (MAP, P, Ca, Mg/TLC, Ca/TLC, Critical P, Rachis P, FNL, FW, FT, CI, and Canopy) were log10[mean + 1] transformed prior to multiple linear stepwise regression analysis. For T2, the data that were found to have the significance value of the Shapiro-Wilk Test below 0.05, indicating the data significantly deviated from a normal distribution. These data (MAP, P, K, Ca, B, K/TLC, Ca/TLC, Critical P, Rachis P, FNL, FW, FT, and CI) were log10[mean + 1] transformed prior to multiple linear stepwise regression analysis.
Table 3. Comparisons of the correlation coefficients between standard practice application (Treatment 1; T1) and Universiti Putra Malaysia (UPM) Biochemical Fertilizer (UPM-BCF) (Treatment; T2) in the nutrient concentrations in the leaflets and rachis, and vegetative parameters of oil palm trees, based on log10(mean + 1)-transformed data (N = 48 for both T1 and T2).
Frond LengthFrond No LeafletFrond WidthFrond ThicknessChlorophyll IndexCanopy
MAPT10.94 *0.98 *0.86 *0.79 *0.82 *0.99 *
T20.92 *0.98 *0.82 *0.80 *0.78 *0.98 *
BT1−0.39 *−0.10−0.44 *−0.39 *0.17−0.21
T2−0.150.10−0.13−0.100.29 *0.03
CaT10.59 *0.64 *0.33 *0.240.47 *0.64 *
T20.62 *0.64 *0.47 *0.43 *0.53 *0.63 *
MgT1−0.40 *−0.16−0.32 *−0.280.10−0.24
T2−0.160.07−0.060.080.100.00
NT1−0.18−0.13−0.20−0.130.01−0.18
T2−0.43 *−0.46 *−0.56 *−0.61 *−0.26−0.53 *
PT1−0.78 *−0.70 *−0.69 *−0.60 *−0.46 *−0.73 *
T2−0.54 *−0.49 *−0.51 *−0.49 *−0.22−0.53 *
KT1−0.62 *−0.69 *−0.45 *−0.36 *−0.51 *−0.68 *
T2−0.59 *−0.67 *−0.46 *−0.38 *−0.61 *−0.63 *
Critical-PT1−0.18−0.13−0.20−0.130.01−0.18
T2−0.42 *−0.46 *−0.56 *−0.60 *−0.26−0.53 *
Rachis-KT1−0.13−0.32 *−0.18−0.17−0.34 *−0.26
T20.04−0.17−0.05−0.07−0.31 *−0.12
Rachis-PT10.220.160.270.23−0.020.22
T20.240.270.280.280.150.30 *
Ca/TLCT10.64 *0.64 *0.39 *0.29 *0.41 *0.65 *
T20.60 *0.60 *0.43 *0.34 *0.54 *0.59 *
K/TLCT1−0.54 *−0.67 *−0.34 *−0.25−0.55 *−0.64 *
T2−0.59 *−0.69 *−0.48 *−0.45 *−0.60 *−0.65 *
Mg/TLCT1−0.56 *−0.35 *−0.37 *−0.29 *−0.05−0.42 *
T2−0.43 *−0.20−0.26−0.13−0.11−0.27
TLCT10.140.29 *−0.04−0.080.35 *0.24
T20.36 *0.45 *0.32 *0.37 *0.36 *0.44 *
Note: TLC = Total Leaf Cation. Values with * are significant at p < 0.05. For T1, the data was found to have the significance value of the Shapiro-Wilk Test below 0.05, indicating the data significantly deviated from a normal distribution. These data (MAP, P, Ca, Mg/TLC, Ca/TLC, Critical P, Rachis P, FNL, FW, FT, CI, and Canopy) were log10[mean + 1] transformed prior to correlation analysis. For T2, the data that were found to have the significance value of the Shapiro-Wilk Test below 0.05, indicating the data significantly deviated from a normal distribution. These data (MAP, P, K, Ca, B, K/TLC, Ca/TLC, Critical P, Rachis P, FNL, FW, FT, and CI) were log10[mean + 1] transformed prior to correlation analysis.
Table 4. Comparison of nutrient levels (mean) in the leaflets of oil palm (Elaeis guineensis) between the present study and those reported in the literature.
This StudyThis StudyBehera et al. [46]Tao et al. [44] *Tao et al. [44] *Rhebergen et al. [45]Afandi et al. [43]Behera et al. [49]Lee et al. [50]
Leaf NutrientT1T2Southern Plateau of IndiaSandy Soils Central Kalimantan (T1; Leaflets)Sandy Soils Central Kalimantan (T1; Rachis)Ghana Smallholders (Leaflets of 17th Frond)Bengawat Soil Godavari District (India),FELDA Clone and FELDA D × P Planting Material Grown in Pahang, Malaysia
N (%)2.922.952.262.59/2.500.34/0.402.51 (%)2.530.62–3.972.49–2.81
P (%)0.170.170.100.16/0.150.04/0.030.14 (%)0.120.04–0.260.16–0.18
K (%)1.341.310.681.25/1.031.63/1.340.81 (%)0.780.34–1.380.96–1.20
Ca (%)0.660.681.780.82/0.81NA0.72 (%)0.610.66–2.660.68–1.02
Mg (%)0.270.280.610.22/0.24NA0.41 (%)0.250.10–1.030.17–0.26
B (mg/kg)17.6517.9218.3NANA12 (mg/kg)12.199.55–11913.7–17.3
TLC (cmol/kg)89.65–95.58 (30 MAP)94.93–102.1 (MAP)NANANANA70.95NANA
Age (MAP)6–486–48Unknown13 years old13 years old< 17 years30.0 MAPNANA
Note: Tao et al. [44] * = Year 2012/Year 2015; NA = not available. MAP = months after planting. TLC = Total Leaf Cation (mol/kg dry matter).
Table 5. Estimations of cost savings for Universiti Putra Malaysia (UPM) Biochemical Fertilizer (UPM-BCF) (Treatment; T2) fertilizer per hectare and labour cost per hectare in comparison to standard practice application (Treatment 1; T1).
YearTreatmentNORRM26.77/ha Per Round *Labour Cost SavedContentsFormulation RatioTotal Fertilizer Cost (RM/palm) **Total Fertilizer Cost (RM/ha)Fertilizer Cost Saved
2015T14107.0826.8NPK Granular9/9/12/48.461150−468.4
T2380.31 UPM-BCF11/11/15/411.901618
2016T15133.8553.5NPK Granular9/9/12/415.702136612.5
T2380.31 UPM-BCF11/11/15/411.201523
2017T15133.8526.8NK 2711.6/2723.103142440.1
Kieserite27 MgO1.30177
107.08 ERP28% P2O51.70231
T24 UPM-BCF8.5/6.2/20/322.863109
2018T15133.8526.8NK 2711.6/2723.933254529.2
Kieserite27 MgO1.30177
ERP28% P2O51.53208.1
T24107.08 UPM-BCF8.5/6.2/20/322.863110
Total cost saving133.9 Total cost saving1113.4
Note: * One hectare is assumed to have 136 palm trees. ** Estimated fertilizer costs for the year 2022 by the World Bank Blogs [83,84]; NOR = Number of round. RM = Ringgit Malaysia.
Publisher’s Note: MDPI stays neutral with regard to jurisdictional claims in published maps and institutional affiliations.

