Article

Metabolite Analysis of Lettuce in Response to Sulfur Nutrition

1
Department of Agronomy, Gyeongsang National University, Jinju 52828, Korea
2
Institute of Agriculture and Life Science, Gyeongsang National University, Jinju 52828, Korea
3
Division of Applied Life Science, Gyeongsang National University, Jinju 52828, Korea
4
Department of Food Science and Technology, Gyeongsang National University, Jinju 52828, Korea
5
Department of Applied Biology, Chonnam National University, Gwangju 61186, Korea
6
Department of Plant Medicine, Gyeongsang National University, Jinju 52828, Korea
*
Author to whom correspondence should be addressed.
Horticulturae 2022, 8(8), 734; https://doi.org/10.3390/horticulturae8080734
Submission received: 13 July 2022 / Revised: 10 August 2022 / Accepted: 13 August 2022 / Published: 16 August 2022
(This article belongs to the Topic Plants Nutrients)

Abstract

:
Sulfur is an essential nutrient required for plant growth and metabolism, and plays an important role in relieving stress. Nutrient deficiency is one of the main factors that negatively affect crop growth, quality, and yield. This study aimed to evaluate the effect of sulfur nutrients on the growth and metabolites of lettuce after treatment with two different sulfur concentrations (16 μM and 2 mM) in spray hydroponics. The fresh weight, chlorophyll, and carotenoid content of lettuce leaves were analyzed. Root morphology was examined using the WinRHIZO program. Metabolites were comparatively evaluated with the help of LC-MS and GC-MS. The fresh weight, chlorophyll, and carotenoid contents of lettuce were higher in the high concentration sulfur treatment group than in the low concentration sulfur treatment group. In the characteristics analysis of the lettuce roots, treatment with a high concentration of sulfur had a more positive effect on the lettuce root development than treatment with a low concentration of sulfur. Moreover, mass-based metabolomics analysis showed that the lettuce metabolites content was significantly different according to low- and high-concentration sulfur treatments. Therefore, this study highlights the importance of sulfur nutrient content in lettuce growth and metabolites.

1. Introduction

Sulfur (S) is an essential component of cells and is a macronutrient required for plant growth and metabolism. Cysteine, which is a product of the reductive sulfate assimilation pathway, is a source of reduced sulfur for many other essential metabolites, including methionine. Additionally, the reactivity of the thiol group (-SH) makes it critical for structural maintenance as the protein’s cysteine residues form disulfide bridges [1]. Since the amino acids cysteine and methionine contain sulfur, it is present in many significant biomolecules such as proteins, nucleic acids, vitamin cofactors, and metabolites and is very important for the synthesis of chlorophyll in plants. Sulfur affects plant growth, development, nutritional quality, disease tolerance, and resistance [2,3,4,5].
Plants absorb sulfur mainly in the form of sulfate. Sulfate itself and cysteine or glutathione (GSH) play a signaling role in regulating the absorption and distribution of sulfate in plants [6,7]. This involves increased expression of several sulfate transporters and enzymes involved in sulfate assimilation, such as ATP sulfurylase (ATPS) and adenosine 5′-phosphosulfate (APS), and reductase (APR) [8].
Nutrient deficiencies in plants are the main factors that negatively affect plant growth and agricultural and horticultural yields. Among plant nutrient deficiences, sulfur deficiency reduces the quality and yield of crops [9,10]. Sulfate deficiency reduces the synthesis of the enzyme Rubisco (ribulose-1,5-biphosphate carboxylase/oxygenase), which affects the assimilation rate of CO2, eventually delaying carbohydrate synthesis [11,12]. Furthermore, sulfur deficiency in Eruca sativa leads to alterations in biomass production and chlorophyll synthesis [13]. Water stress and sulfur deficiency interfered with the reproductive process with synergistic effect, reducing seed weight and seed number, and causing seed miscarriage, underscoring the importance of sulfur in maintaining seed yield components under water stress [14]. Rice has a high absorption rate of arsenic, a dangerous heavy metal, which can potentially pose serious health risks. While sulfur is an important essential macronutrient, it also has the ability to reduce arsenic accumulation in plants. The additionally supplied sulfur reduced the arsenic content of rice by trapping arsenic in the rice roots [15]. Sulfur deficiency inhibits imidacloprid-induced detoxification enzymes including cytochrome P450, glutathione S-transferases (GSTs), and glycosyltransferases in lettuce tissue, further increasing the production of reactive oxygen species and exacerbating lipid peroxidation. It has been reported that these results lead to oxidative damage in plants by increasing the accumulation of pesticide residues and toxic metabolites and decreasing detoxification capacity [16]. Furthermore, other studies showed that sulfur supplementation in wheat improves both grain yield and protein quality and content [17,18,19]. Additionally, sulfur deficiency is one of the plant stresses that can disrupt plant homeostasis. Sulfur is an essential element for the physiological function and growth of plants [20,21]. Another study found that levels of organic acids, including malic and citric acids, were decreased in lettuce plants under higher selenium and sulfur supply, whereas malic and citric acid levels were significantly increased for moderate sulfur and low selenium fertilization. The two selenium levels (1.3 and 3.8 μM) in the 1 mM sulfur condition also led to higher concentrations of soluble sugars including glucose and fructose. Moreover, amino acids (Asn, Glu, and Gln) show significantly higher levels under higher sulfur and selenium conditions. This shows that “crosstalk” between selenium and sulfur exhibits a unique synergistic effect on amino acid and soluble sugar biosynthesis [22].
Lettuce (Lactuca sativa L.) is one of the most popular leaf vegetables as the most basic ingredient in vegetable salads and occupies the largest share of all wrapped vegetables in Korea. Lettuce is grown worldwide and is a source of phenolics, flavonoids, minerals, fiber, and various vitamins and antioxidants. These physiologically active compounds in lettuce are foods that are beneficial to human health, showing anti-inflammatory, cholesterol-lowering, and anti-diabetic activities [23,24,25]. A sufficient nutrient supply level has a significant effect on crop yield and, consequently, a decrease in minerals affects plant metabolic processes. This nutrient deficiency may reduce the quality of crops. Supplementing plants with mineral elements is one of the most effective strategies for obtaining bio fortified crops to improve both plant and human health [26,27]. However, the effect of sulfur nutrients on the growth and chemical profiles of lettuce has been rarely investigated.
Therefore, this study aims to analyze the metabolite changes relating to sulfur nutrients in lettuce using ultra-performance liquid chromatography-quadrupole-time-of-flight mass spectrometry (UPLC-Q-TOF MS) and gas chromatography-mass spectrometry (GC-MS) to obtain detailed information on metabolite changes. Based on the identified metabolites, a lettuce metabolomic pathway associated with sulfur treatment was proposed. Sulfur will play an important role in improving the nutritional quality of the most popular vegetables, such as lettuce.

2. Materials and Methods

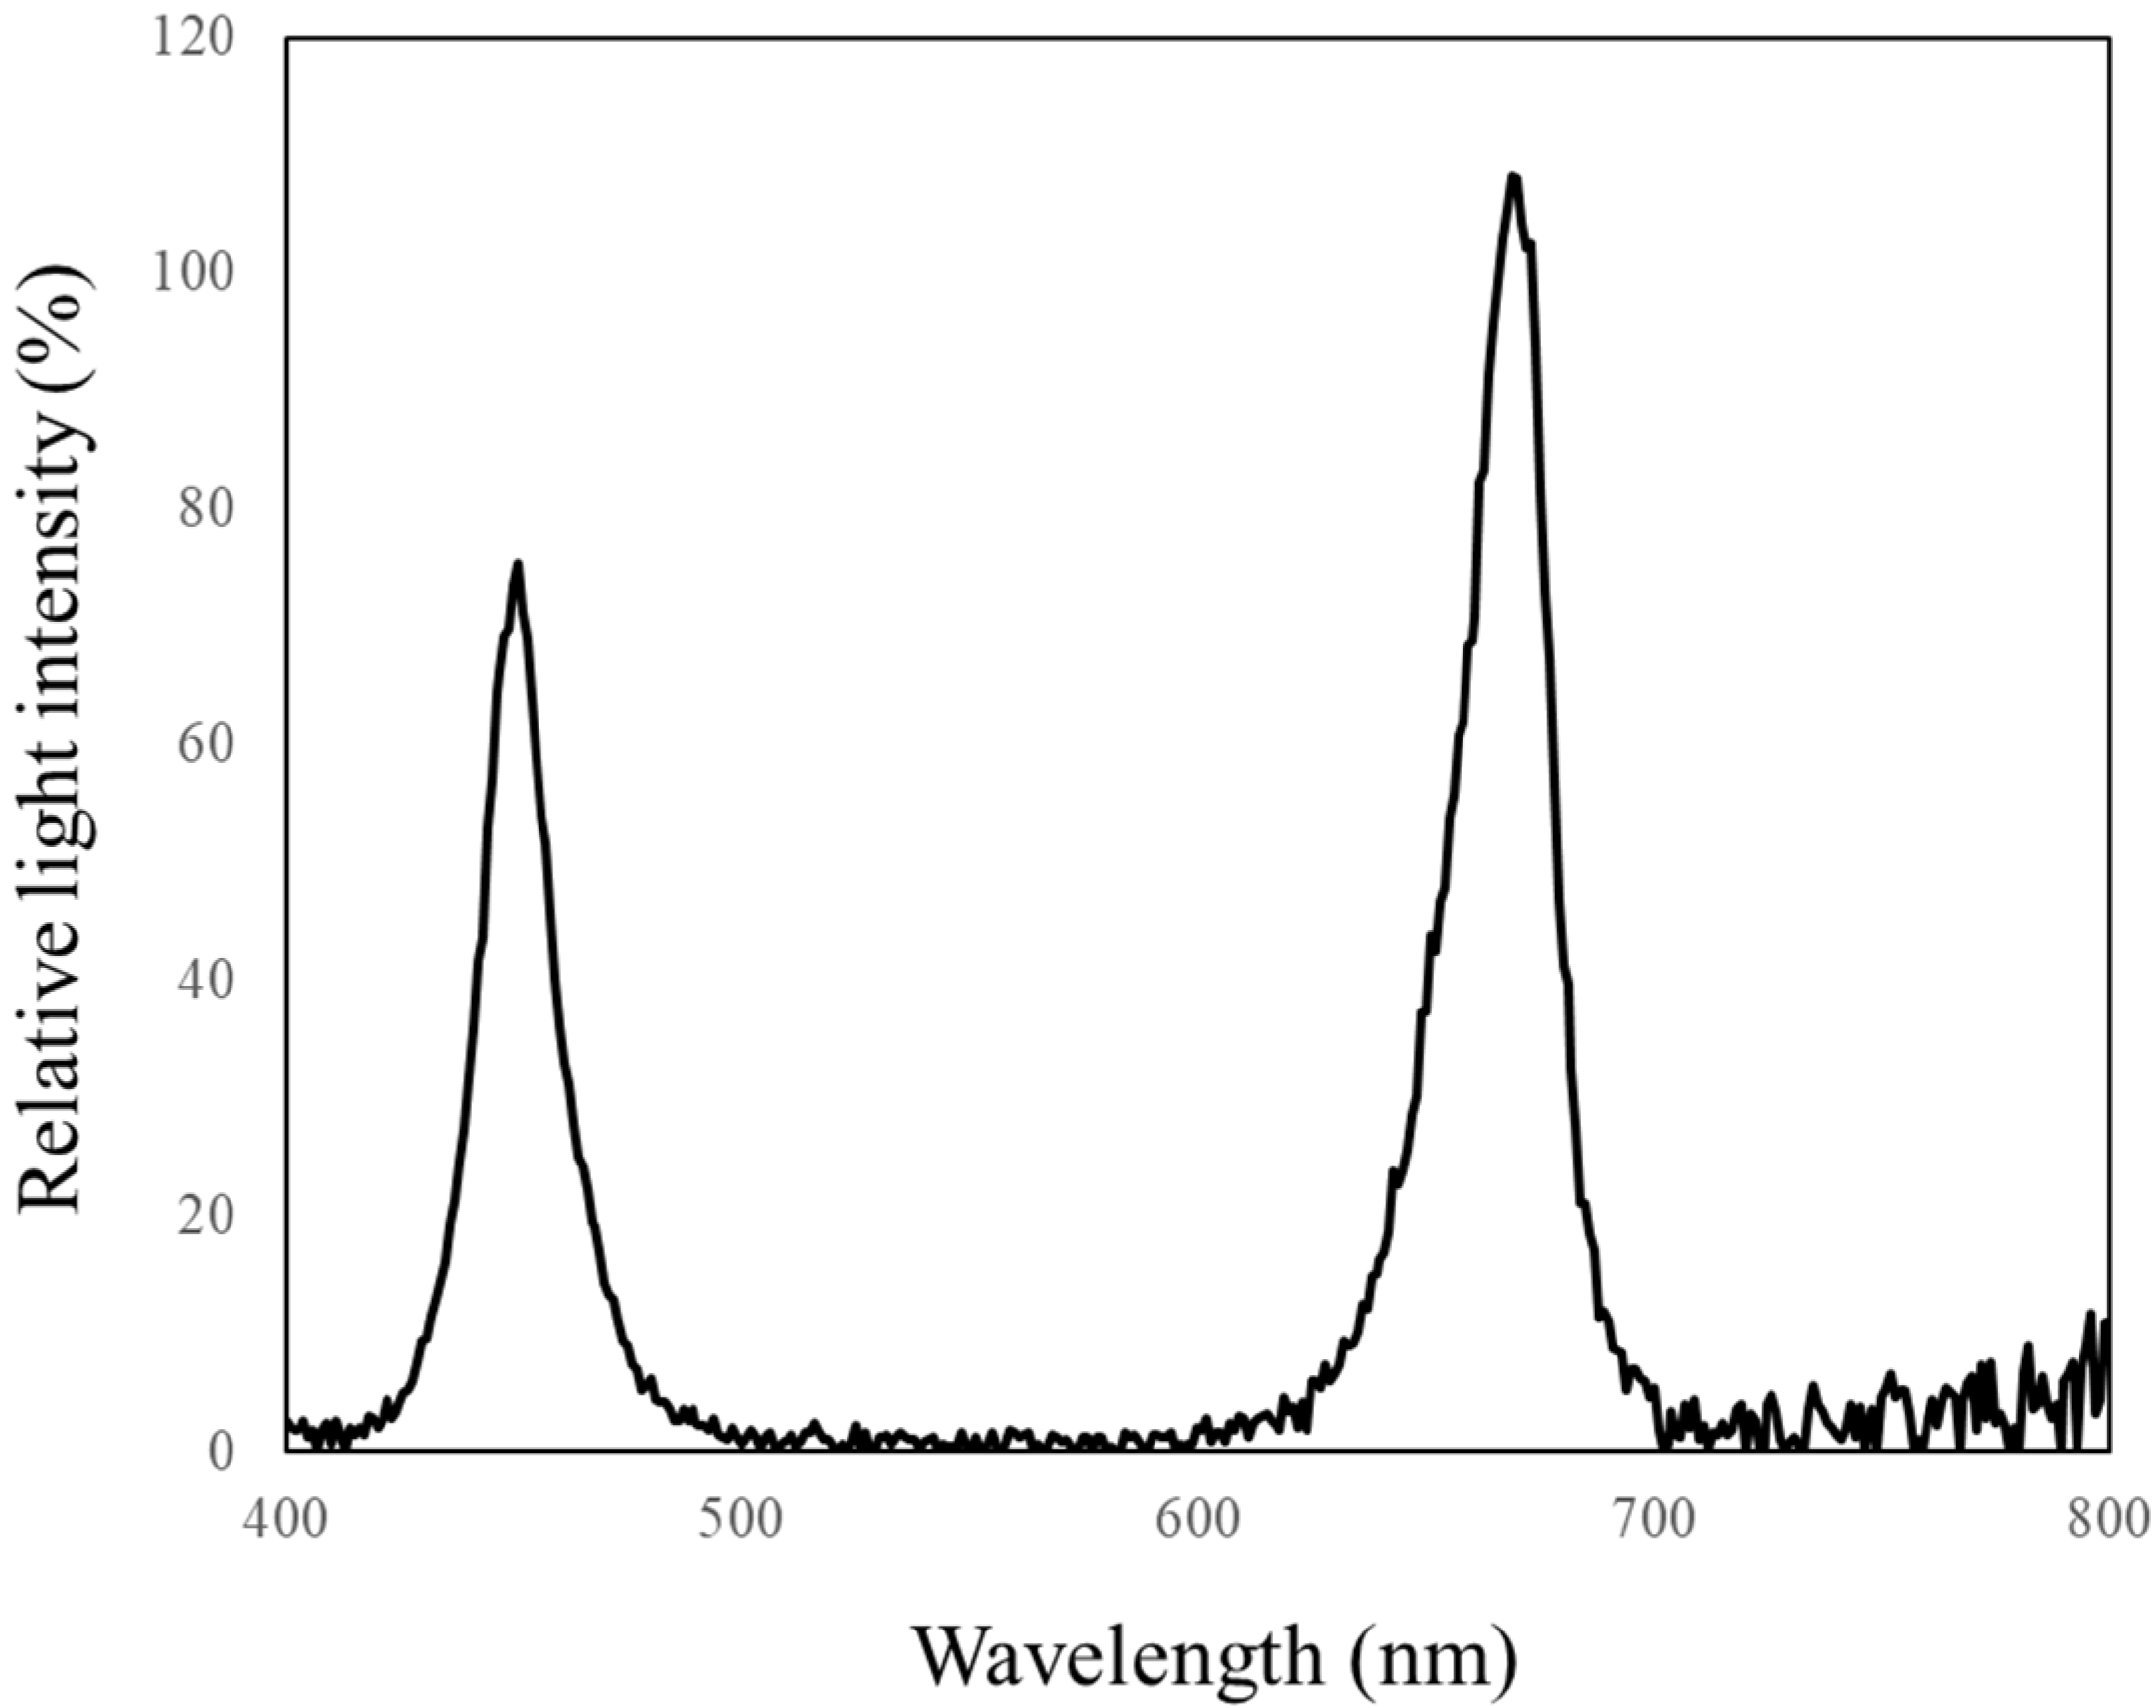
2.1. Plant Materials and Growth Condition

Lettuce (Lactuca sativa L. cv. “Cheongchima”) seeds were germinated by sowing seeds one by one in sponge cubes (2.5 × 2.5 × 2.5 cm). The germinated lettuce was grown under standard cultivation conditions (22 °C, 16 h light/8 h dark, 60% relative humidity) using blue and red LED lights. The LED lights used in the study were 655 nm for red and 437 nm for blue, and were installed approximately 25 cm above the spray hydroponic pot. A spectroradiometer (Avaspec-ULS2048, Avantes, Apeldoorn, The Netherlands) was used to monitor the photosynthetic photon flux density (PPFD) and light spectra (Figure 1, Table 1).
The culture medium is a composition of Hoagland solution [28] with a slightly modified composition. The sulfur-rich conditions are 1 mM KH2PO4, 2 mM NH4NO3, 4 mM Ca(NO3)2·4H2O, 2 mM MgSO4·7H2O, 50 μM H3BO3, and 10 μM MnCl2·4H2O, incubated in Hoagland solution containing 8 μM CuSO4, 8 μM ZnSO4·7H2O, 0.4 μM Na2MoO4·2H2O, 0.1 mM NaCl, and 90 μM FeNaEDTA. The low concentration sulfur treatment involved replacing 2 mM MgSO4 in Hoagland solution with 2 mM MgCl2, substituting the Mg component. In the low concentration sulfur treatment, the total sulfur concentration was 16 μM due to component substitution. The pH of all solutions was adjusted to 6.5.

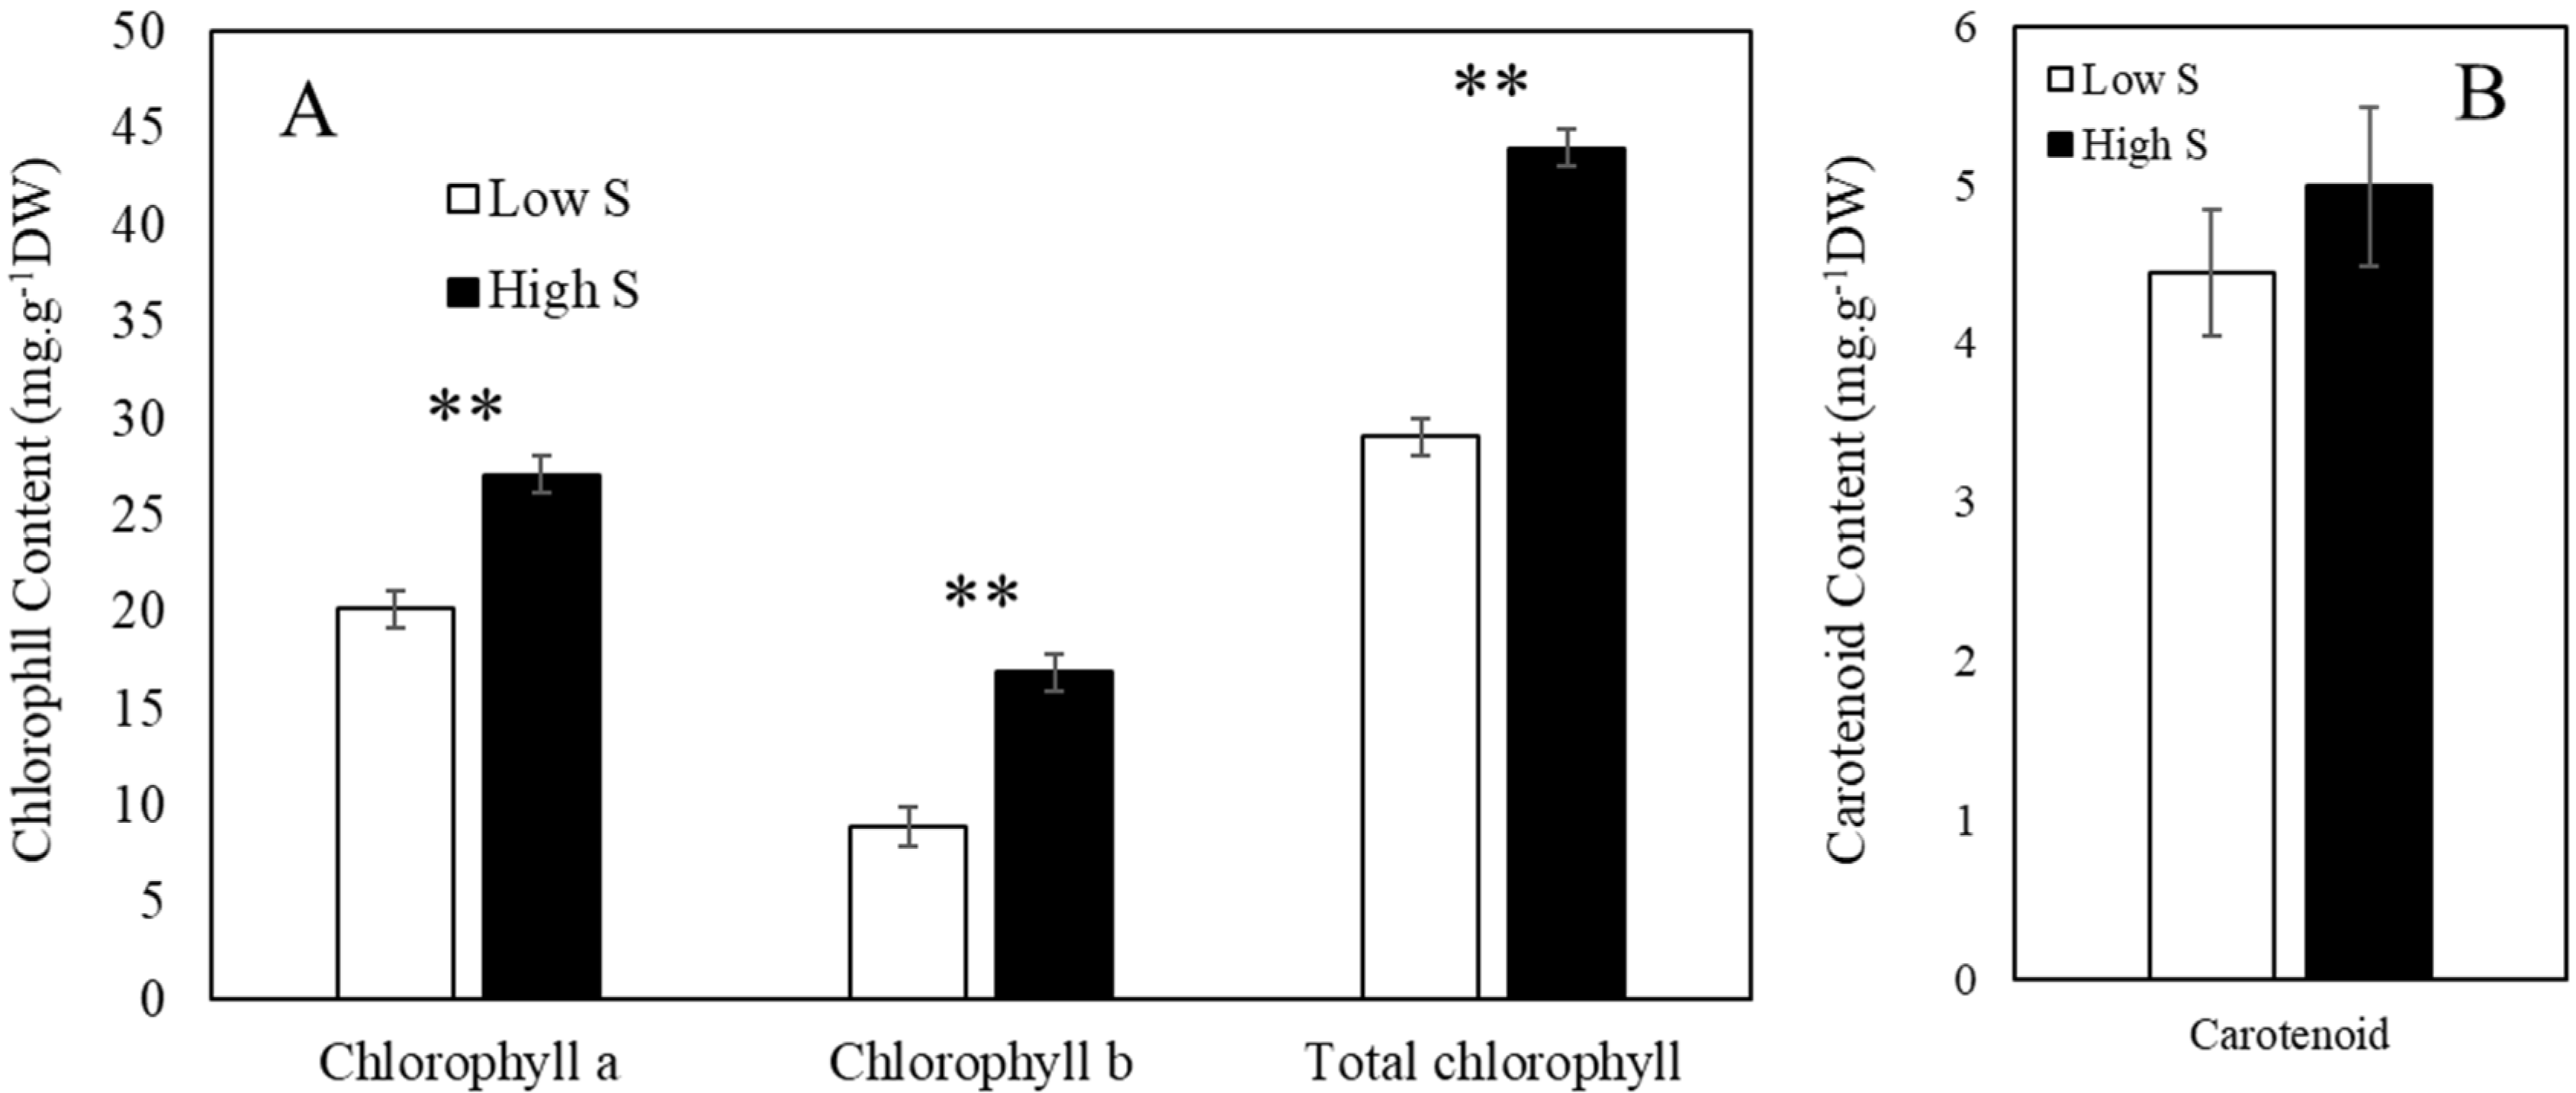
2.2. Analysis of Chlorophyll and Carotenoid Content

The contents of chlorophyll a, chlorophyll b, and carotenoids in lettuce were measured using the method of Lichtenthaler and Buschmann (2001) [29]. After adding a solvent of 50 mL of 95% ethanol to 2 g of sample powder (dried material), it was stirred in a dark place using a magnetic bar for 4 h. After filtering the extract using Whatman No.2 filter paper, a spectrophotometer (Shimadzu UV-1800) was used. Absorbance was measured at 664 nm, 649 nm, and 470 nm, assessing the chlorophyll and carotenoid contents through the following formulas.
Chlorophyll a (mg/mL) = 13.36 × O.D664 − 5.19 × O.D649
Chlorophyll b (mg/mL) = 27.43 × O.D649 − 8.12 × O.D664
Total chlorophyll (mg/mL) = Chlorophyll a + Chlorophyll b
Total carotenoid (mg/mL) = (1000 × O.D470 − 2.13 × Chlorophyll a − 97.63 × Chlorophyll b)/209

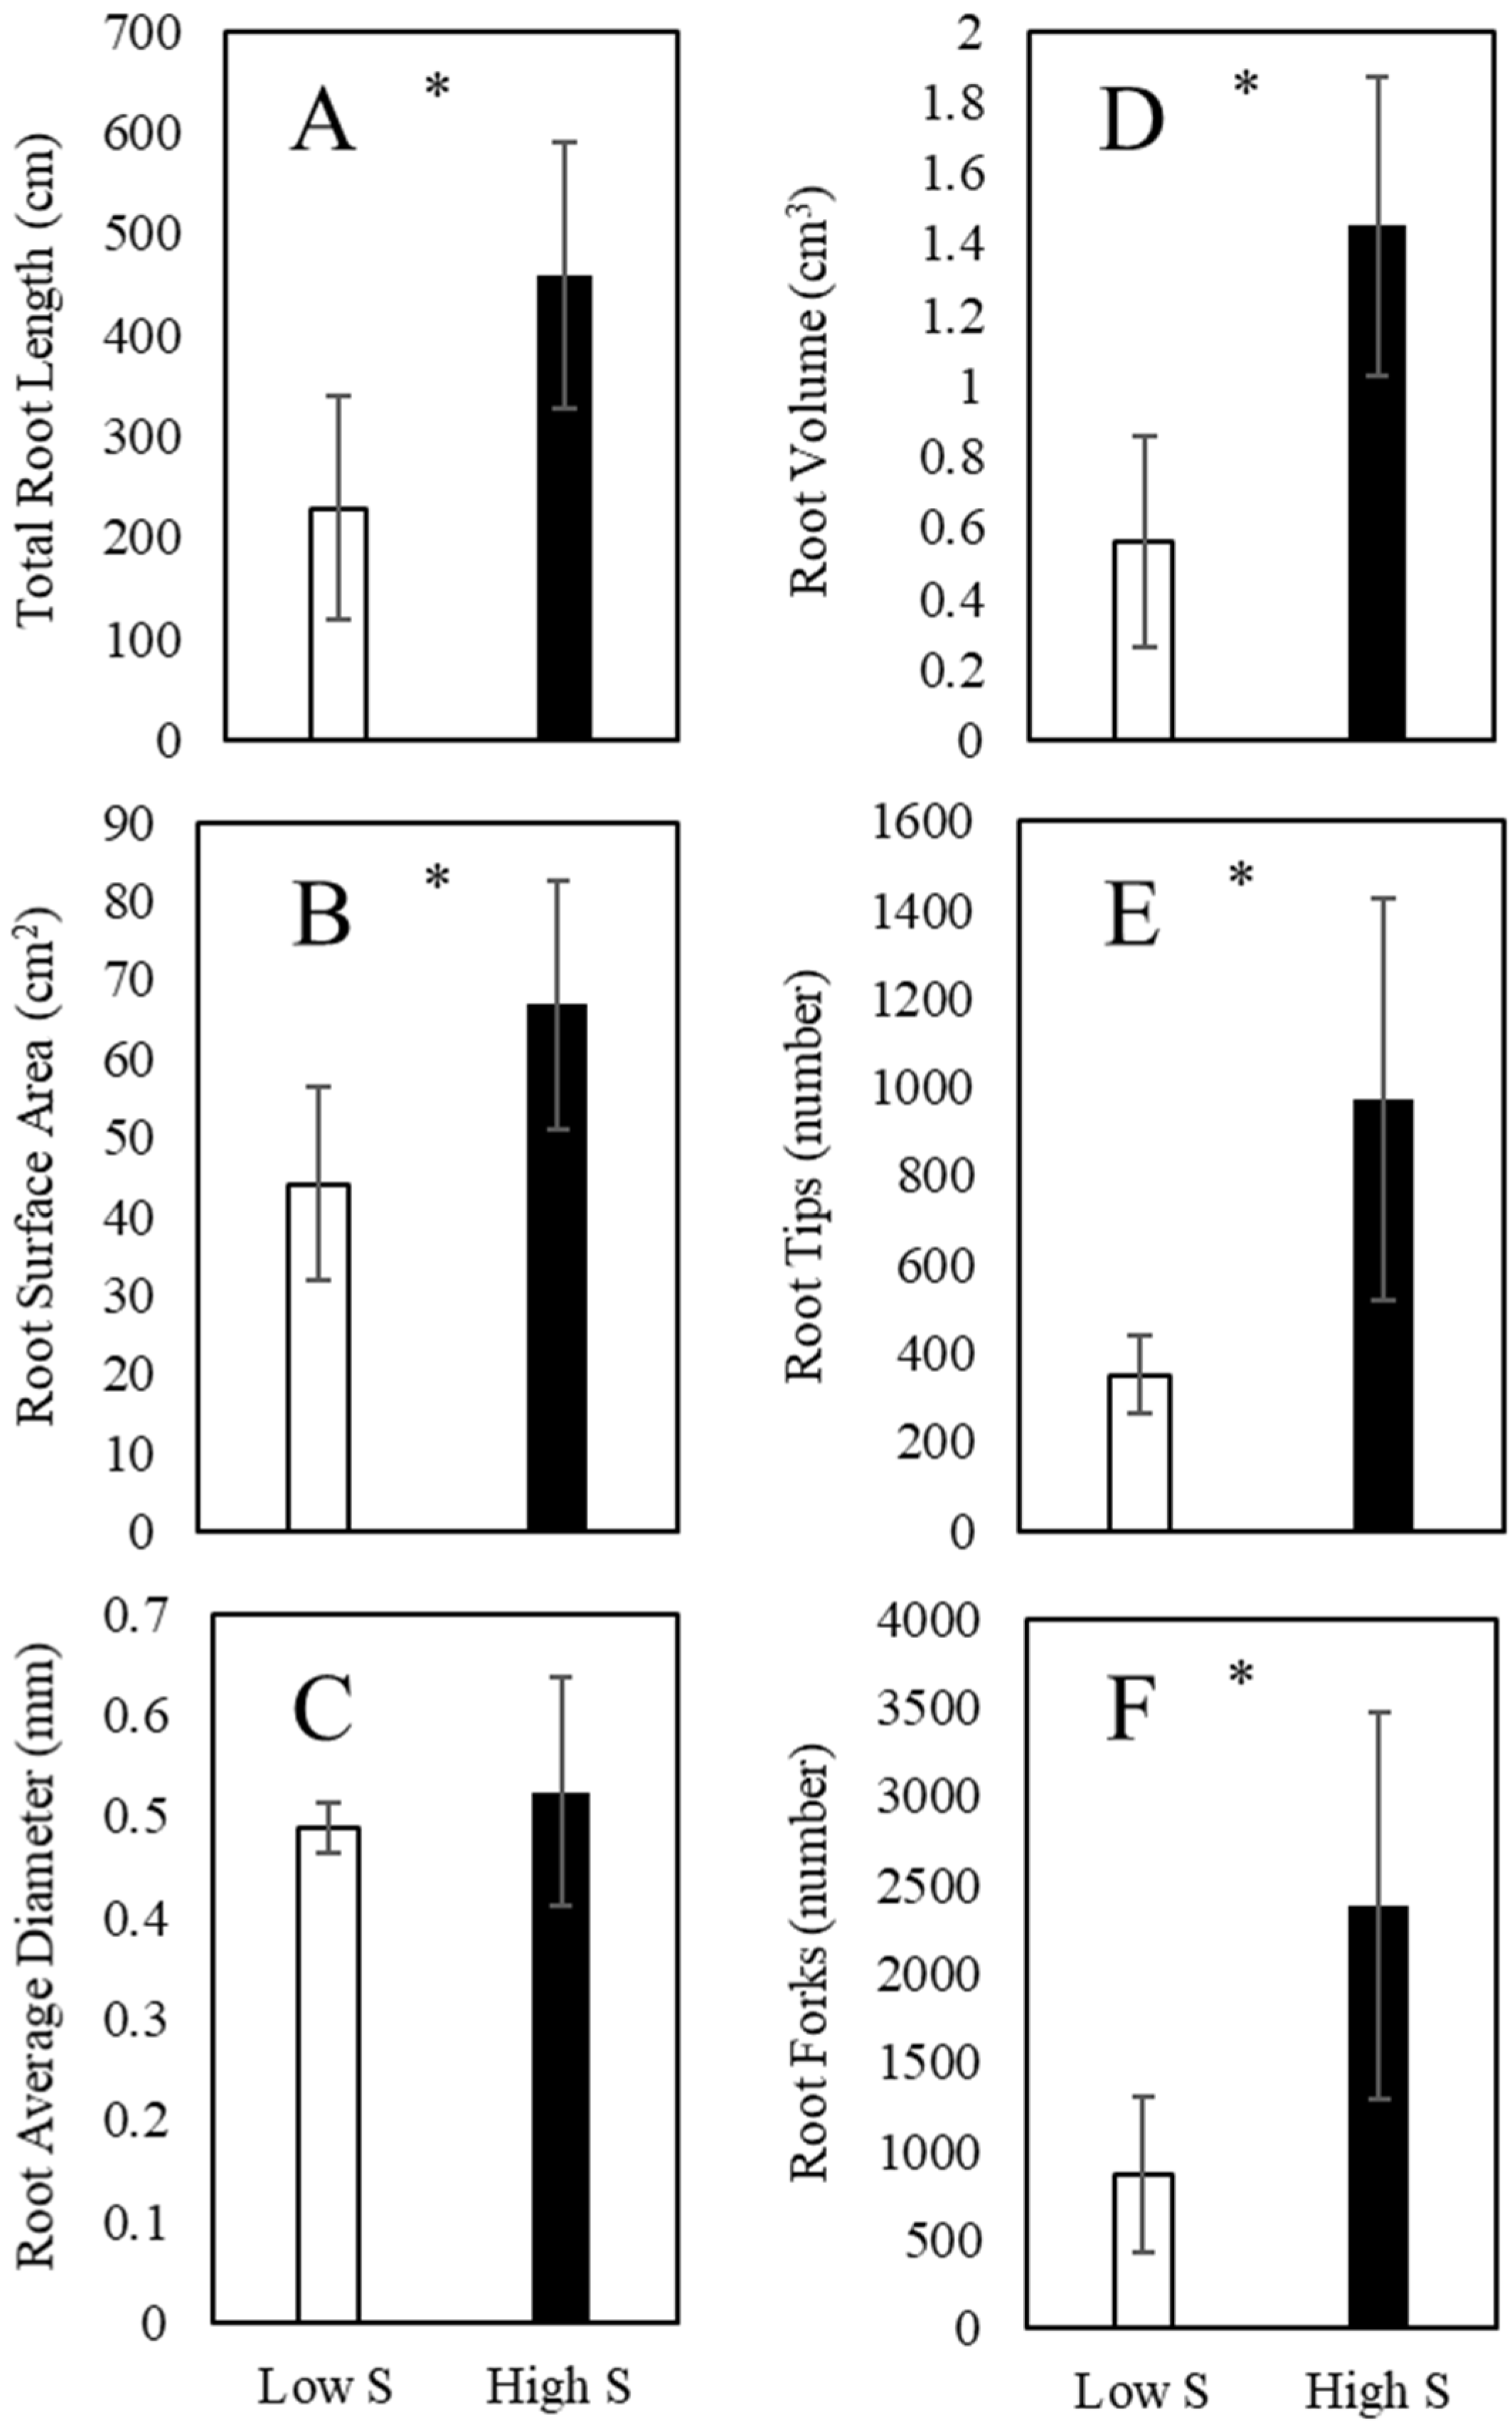
2.3. Root Morphology

To analyze the morphological change of the roots according to sulfur treatment, sampling was performed three weeks after treatment. After the roots were spread as non-overlapping as possible, analysis was performed through the WinRHIZO Pro (Reagent Instruments, Quebec, Canada) program, and the total root length, root surface area, and root diameter were measured.

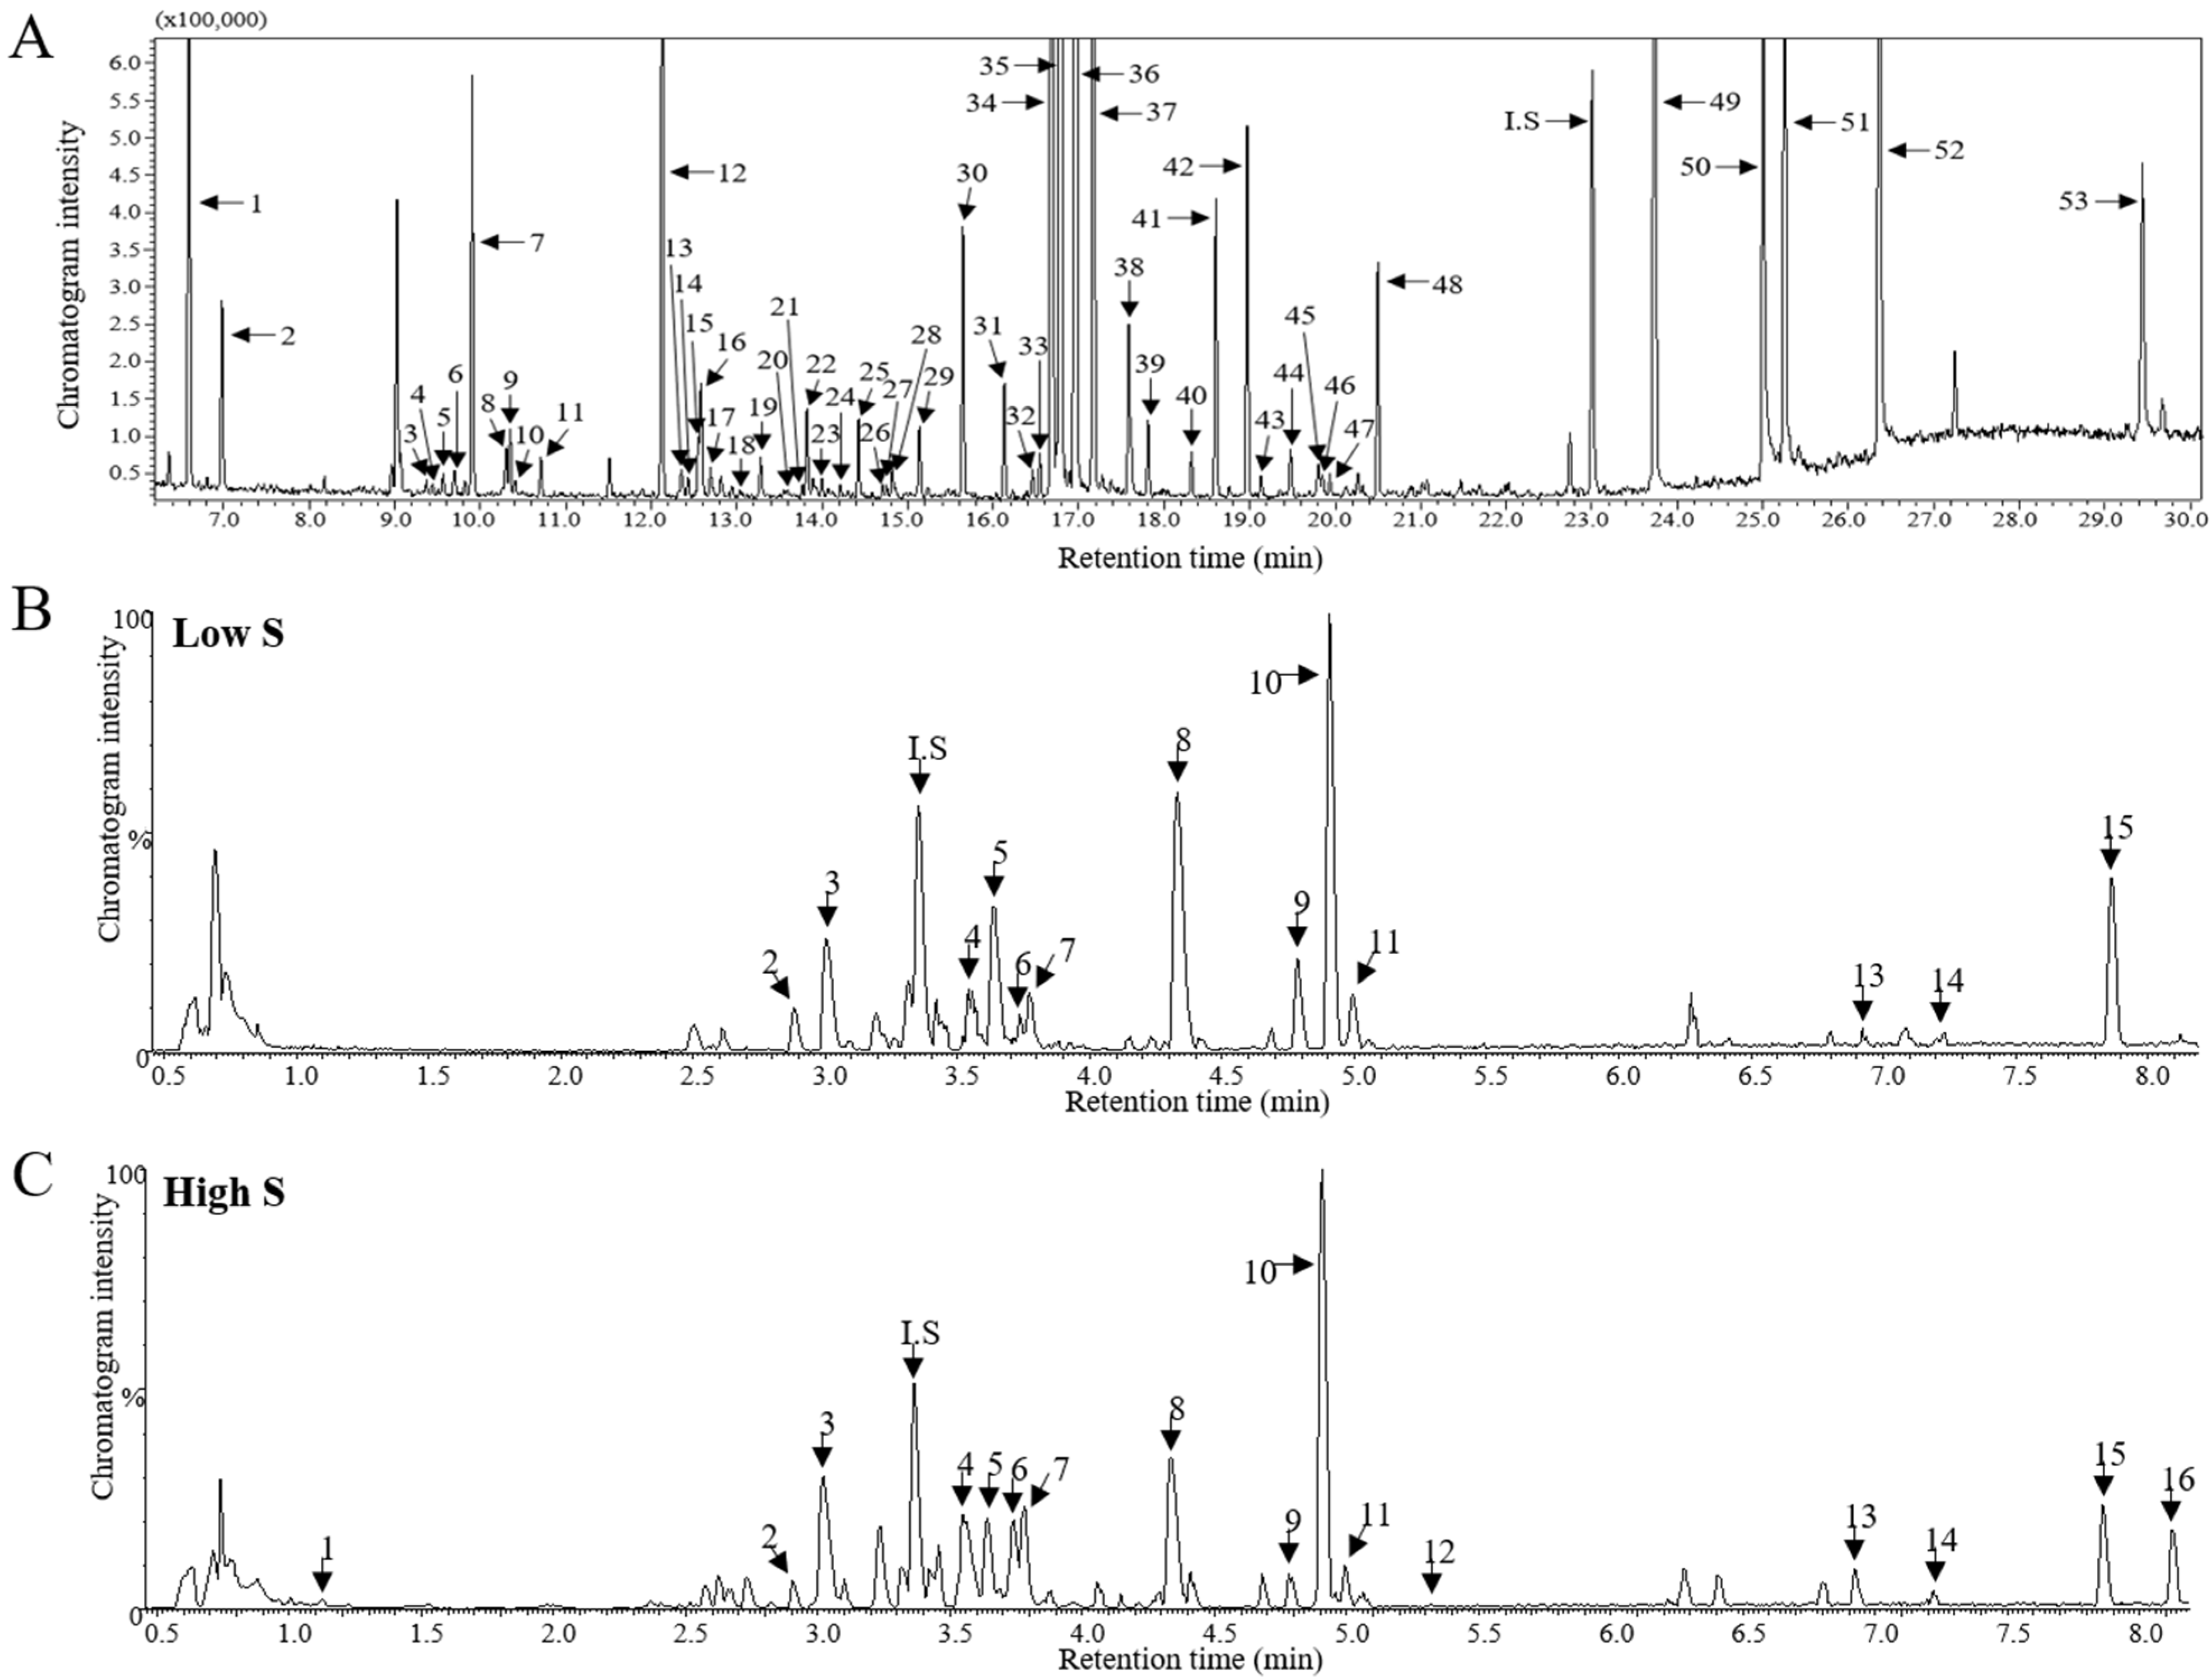
2.4. Analysis of Lettuce Metabolites Using LC-MS

Lettuce metabolite profiles were analyzed using LC-MS as previously described [30] with a minor modification. For metabolite extract, lyophilized lettuce samples were ho-mogenized with 50% aqueous methanol containing terfenadine as an internal standard (IS). After centrifugation, the metabolite extracts were analyzed by UPLC-Q-TOF MS (Xevo G2-S; Waters, Milford, MA, USA) with an Acquity UPLC BEH C18 column (2.1 mm × 100 mm, 1.7 μm; Waters). The extract was injected into the column equilibrated with 99% sol-vent A (distilled water containing 0.1% formic acid) and 1% solvent B (acetonitrile con-taining 0.1% formic acid), and eluted with a gradient of solvent B at a flow rate of 0.35 mL/min and column temperature of 40 °C. The eluted metabolites were analyzed using the Q-TOF MS system with negative electrospray ionization (ESI) mode. Desolvation tem-perature and flow rate were set to 400 °C and 800 L/h, respectively. Sample cone and capil-lary voltages were 40 V and 3 kV, respectively, and source temperature was 100 °C. Leu-cine-enkephalin ([M − H] = 554.2615) was used as a lock mass to correct the mass accuracy of the analyzed metabolites.

2.5. Analysis of Lettuce Metabolites Using GC-MS

Lettuce metabolites were analyzed using GC-MS as previously described [30] with a minor modification. The 50% methanol extracts were completely dried, and then the dried sample extracts were dissolved in methoxyamine hydrochloride (70 μL) in 2% pyridine containing dicyclo-hexyl phthalate as an IS at 37 °C for 90 min. The methoxylated samples were mixed with N, O-bis(trimethylsilyl)trifluoroacetamide (70 μL) with 1% trimethylchlorosilane at 70 °C for 30 min. The derivatized samples were injected into a DB-5ms capillary column (30 m × 0.25 mm, 0.25 µm, Agilent Technologies, Santa Clara, CA, USA) of a GC-2010 plus system (Shimadzu Corp., Kyoto, Japan) at a split ratio of 1:50. Helium as a carrier gas was used at a flow rate of 1 mL/min. The injector temperature was 200 °C. The oven temperature was programmed to rise from 70 °C to 150 °C at 5 °C/min, to 210 °C at 3 °C/min, and to 320 °C at 8 °C/min. The eluents were detected using a GCMS-TQ 8030 MS (Shimadzu) at ion source and interface temperatures of 230 °C and 280 °C, respectively.

2.6. Data Processing

The collected data were aligned using retention time and mass, and normalized using the average mass intensity of each IS. The ChemSpider database in UNIFI, METLIN database, and human metabolome databases were used to identify metabolites analyzed using LC-MS, while the GC-MS-based metabolites were identified by retention indices (RIs) calculated using n-alkanes and the GC-MS database (NIST 11 and Wiley 9 mass spectral libraries).

2.7. Statistical Analysis

Multivariate statistical analysis of lettuce metabolite profiles analyzed using LC-MS and GC-MS was performed using SIMCA-P+ version 12.0.1 (Umetrics, Umeå, Sweden), and the differences in the sample groups were visualized using PLS-DA with four parameters (R2X, R2Y, Q2, and p-value) and the permutation test. All data were statistically analyzed by one-way analysis of variance (ANOVA) with Duncan’s test (p < 0.05) using SPSS 17.0 (SPSS Inc., Chicago, IL, USA).

3. Results and Discussion

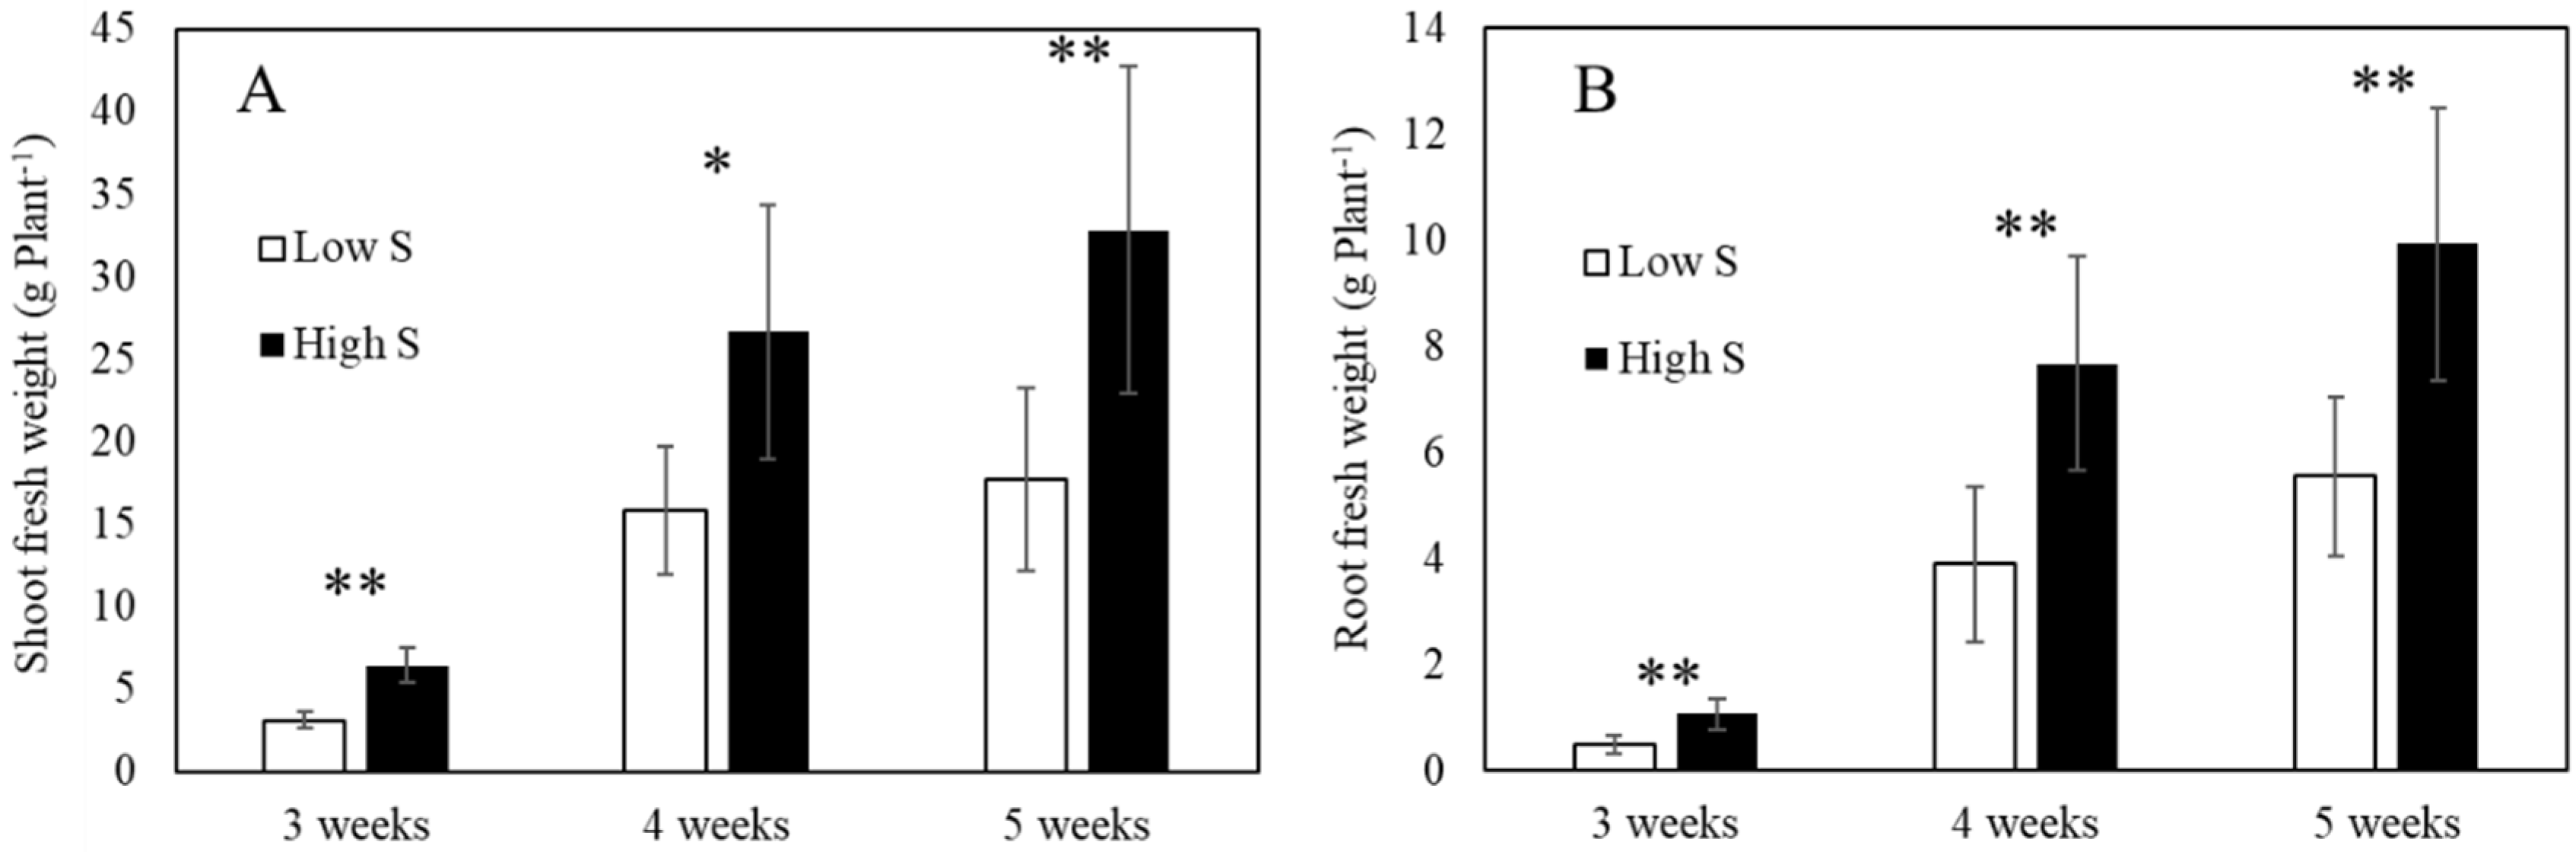
3.1. Lettuce Fresh Weight and Pigment Contents after Sulfur Treatment

One week after germination, lettuce was planted in an LED spray cultivation system, and was treated with a low concentration (16 μM) and a high concentration (2 mM) of sulfur, respectively. The treatment interval of the culture medium with different sulfur concentrations was set to spray every 20 min for 30 s. After examining the fresh weight of the shoot and root from 3 to 5 weeks after the start of spray cultivation under LED lights, the fresh weight of the lettuce treated with the high sulfur concentration was higher than that of the low concentration treatment, and there was a significant difference in both leaves and roots (Figure 2). To analyze the chlorophyll content of lettuce according to the sulfur treatment, it was extracted with ethanol and measured using a spectrophotometer. The chlorophyll content was significantly higher in lettuce treated with a high concentration of sulfur than in lettuce treated with a low concentration of sulfur (Figure 3A). As a result, only the supply amount of sulfur was controlled under the condition of supplying a constant amount of nitrogen, it is thought that nitrogen was not absorbed smoothly due to the interaction between nitrogen and sulfur. Additionally, due to sulfur deficiency, it is possible that there is a structural problem in the iron-sulfur protein that participates in the chlorophyll production process. There is an interaction between the regulation of sulfur and nitrogen trophic metabolism in plants [12]. Nitrogen supply can increase the efficiency of sulfur uptake in plants by inducing the upregulation of genes responsible for sulfur uptake and assimilation [31]. Additionally, sulfur malnutrition affects the utilization of nitrogen in plants. Sulfur deficiency inhibits nitrate uptake and reduces the activity of nitrate reductase, leading to nitrate accumulation and reduced nitrogen utilization in plants [32]. In addition, the content of carotenoids, a functional substance, was also higher in lettuce treated with a high concentration of sulfur, suggesting that sulfur plays an important role in the functional metabolism of lettuce (Figure 3B).

3.2. Root Morphology

The root is the most important organ in a plant, and it efficiently obtains various nutrients and water from the surrounding environment and secretes organic and inorganic substances [33]. An important parameter for the root system is the root surface area that the root explores. In particular, increasing the length and number of root hairs significantly increases the root surface area, which can greatly affect the plant’s absorption of fixed nutrients [34].
Lettuce treated with a high concentration of sulfur showed larger root length and surface area values than lettuce treated with a low concentration of sulfur (Figure 4A,B). Additionally, as a result of analyzing the root volume, several root tips, and some root forks, higher levels were found in the roots of lettuce treated with a high concentration of sulfur than in the roots of lettuce treated with a low concentration of sulfur (Figure 4D–F). However, there was no significant difference in root diameter between the two treatments (Figure 4C). For the specific morphological analysis of the roots, the root diameter was divided into 0.5 mm units. As a result, the root length, surface area, and volume were high in the high-concentration sulfur-treated group. Therefore, it is thought that sulfur had a positive effect on the root development of lettuce and that it also affected the growth of the above-ground part. After scanning images of lettuce roots, the length of the roots was higher in the treatment of high concentrations of sulfur, and secondary and tertiary roots were more developed (data not shown).

3.3. Metabolomic Analysis and PLS-DA Score Plots

The metabolite profiles of lettuce grown with different sulfur concentrations were analyzed using GC-MS (Figure 5A) and LC-MS (Figure 5B,C), and the MS data were statistically analyzed using multivariate statistical analysis. The PLS-DA score plot showed that the sample groups were significantly distinct from each other with good fitting quality parameters (R2X = 0.56 and R2Y = 1.00), good predictability (Q2 = 0.927), and a p-value of 0.015 (Figure 6). To identify metabolites contributing to the separation on the score plot, the importance in the projection (VIP) and p-values of all metabolites were statistically analyzed. A total of 301 metabolites (including MS fragments) were analyzed via LC-MS and GC-MS from lettuce, of which 171 metabolites had a p-value of <0.05 and a VIP of >1.0. Among these metabolites, 38 metabolites, including 12 amino acids, 6 organic compounds, 10 sugars, 5 lipids, and 5 secondary metabolites were identified by LC-MS (Table 2) and GC-MS (Table 3) as major metabolites contributing to the difference between low- and high-concentration sulfur treated lettuce samples, and their fold changes were calculated (Table 2 and Table 3).

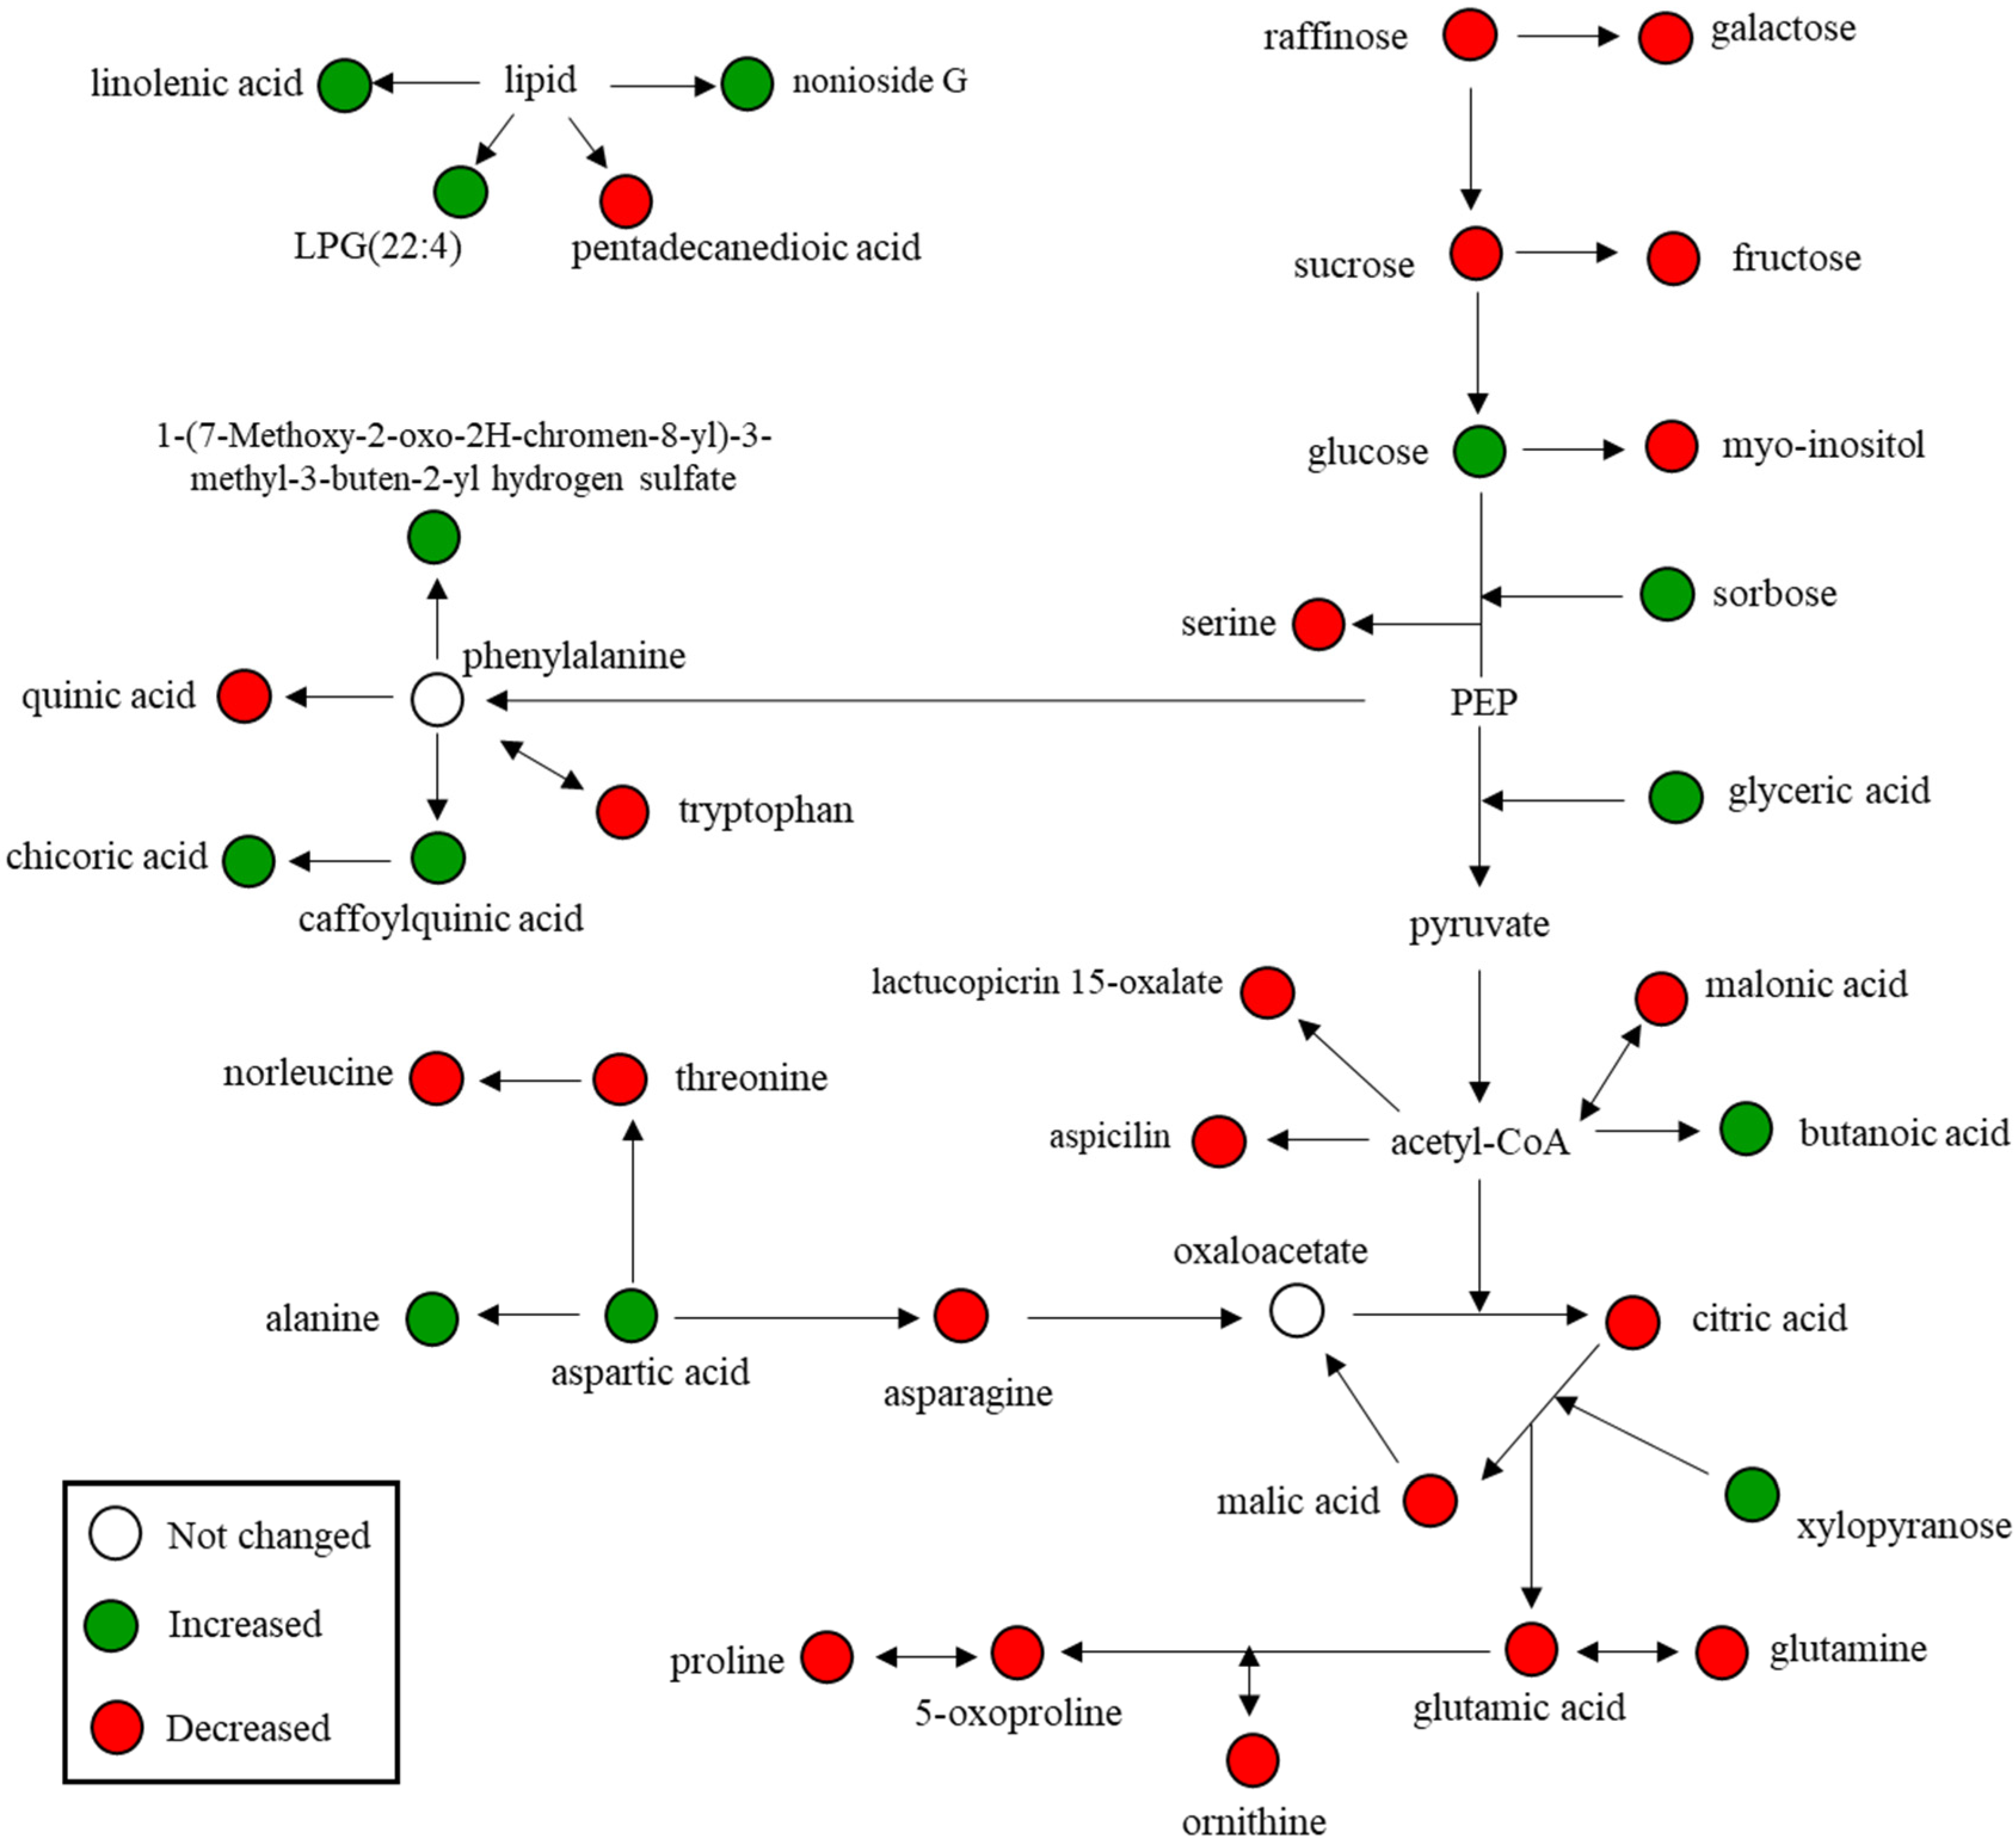
3.4. Relative Abundance of Identified Metabolites and Sulfur Treatment-Related Lettuce Metabolomic Pathway

The levels of most identified lettuce metabolites decreased after the high sulfur concentration treatment, ranging from 2 to 13 times lower than those of the low sulfur concentration treatment, while ornithine, malonic acid, and glutamine were not observed in high sulfur treated lettuce. However, the levels of monosaccharides such as glucose, fructose, galactose, sorbose, glyceric acid, butanoic acid, xylopyranose, Ala, LPG(22:4), and caffeoylquinic acid of high sulfur concentration-treated lettuce were from 2 to 13 times higher than those of the low sulfur concentration-treated one, and Asp was newly generated by high sulfur. Amino acids are known to be important nutrients because of their metabolic functions (primary and secondary). Free amino acids have also been reported with high levels of Glu, Asp, Ser, Val, Ala, Pro, and Gln detected in various vegetable horticultural crops, playing an important role in their taste [35].
High concentrations of sulfur treatment resulted in some changes in free amino acid levels in lettuce; differences in sulfur concentrations negatively or positively affected amino acid levels, as shown in Table 2. Asp, which appears at high levels with the high concentrations of sulfur treatment, is of great nutritional importance in plants because it is involved in the Asp family pathway leading to the biosynthesis of essential amino acids including Lys, Thr, Met, and Ile [36].
Although the role of sulfur in the sensory properties of lettuce is not clear, a certain amount of sulfur nutrients is required for sufficient production [37]. Sulfur deficient conditions affect some regulatory systems of metabolism, such as the catabolism of stored sulfur compounds, and inhibit the synthesis of secondary sulfur metabolites [1,38]. In this way, plants completely rearrange the flow of sulfur metabolism to maintain growth in a low sulfur environment [39]. In plants, primary sulfur metabolism includes the process of sulfur assimilation from sulfate to Cys and the synthesis of Met and glutathione (GSH). Glucosinolate (GSL) metabolism is defined as secondary sulfur metabolism synthesized from Met or Trp [39]. GSH and GSL are the major organic sulfur compounds in plants, and their contents are dramatically reduced under sulfur deficiency conditions. [40,41,42]. In these sulfur-deficient conditions, catabolism genes for GSH and GSL are expressed and function, and the catabolized sulfur is recycled to primary sulfur metabolism [41,43,44]. Sulfur-containing amino acids Met and Cys, do not show significant changes due to their rapid oxidation and instability under sufficient sulfur conditions [22].
Organic acids and water-soluble sugars are important metabolites that influene the taste properties of horticultural crops and affect other sensory properties of fruits and vegetables, including color and aroma [45]. The results of this study showed a synergistic effect on the levels of glucose and fructose for high concentrations conditions of sulfur-treatment, while the levels of sucrose decreased. Glucose is closely related to the perception of sweetness [46].
It has been reported that genes involved in the flavonoid, auxin, and jasmonate biosynthetic pathways are upregulated under sulfur depletion in Arabidopsis thaliana [47]. Secondary metabolites, such as flavonoids, enhance resistance to biological and abiotic stresses in plants [48]. Abdalla et al. (2021) reported the accumulation of flavonoids in green lettuce under sulfur-deficient conditions. Based on the metabolites shown in the results of this study, a lettuce metabolic pathway related to sulfur treatment was proposed (Figure 7). The pathway showed that high sulfur treatment had more of an effect on amino acids and sugar metabolism of lettuce than on secondary metabolism. Therefore, the nutritional content of sulfur in lettuce needs further studies to determine the appropriate application amount for stress resistance, yield, and sensory qualities.

4. Conclusions

Lettuce (Cheongchima variety) was treated with two different sulfur concentrations (16 μM and 2 mM sulfur) in spray hydroponics under LED light, and sulfur deficiency resulted in decreased chlorophyll and carotenoid content. The results showed that the development of the leaf and root of lettuce was adversely affected. In addition, in the metabolite profile, amino acids and monosaccharides, butanoic acid, xylopyranose, aspartic acid, alanine, LPG(22:4), and caffeoylquinic acid were higher in lettuce treated with a high concentration of sulfur than under the condition of sulfur deficiency. Although further studies are needed to evaluate the nutritional quality of lettuce produced with high concentrations of sulfur, this study nevertheless highlights the importance of the sulfur nutrient content of lettuce in physiological and mass-based metabolomic analyses.

Author Contributions

Conceptualization, J.-S.C. and J.-J.L.; Formal analysis, J.-S.C. and H.-J.K.; Investigation, J.-S.C., H.-C.K. and S.-M.Y.; Writing—original draft, J.-S.C.; Writing—review and editing, C.-S.K. and J.-J.L. All authors have read and agreed to the published version of the manuscript.

Funding

This research was funded by Basic Science Research Program through the Ministry of Education of the Republic of Korea [NRF-2015R1D1A1A01059027].

Institutional Review Board Statement

Not applicable.

Informed Consent Statement

Not applicable.

Data Availability Statement

Not applicable.

Acknowledgments

The authors are thankful to Chae-In Na for help in analyzing the characteristics of the lettuce root and to Seung-Jae Hwang and Hee-Sung Hwang for their assistance in analyzing the LED light quality.

Conflicts of Interest

The authors declare no conflict of interest.

References

  1. Takahashi, H.; Kopriva, S.; Giordano, M.; Saito, K.; Hell, R. Sulfur assimilation in photosynthetic organisms: Molecular functions and regulations of transporters and assimilatory enzymes. Annu. Rev. Plant Biol. 2011, 62, 157–184. [Google Scholar] [CrossRef]
  2. Abdalla, M.A.; Meschede, C.A.C.; Mühling, K.H. Selenium foliar application alters patterns of glucosinolate hydrolysis products of pak choi Brassica rapa L. var. Chinensis. Sci. Hortic. 2020, 273, 109614. [Google Scholar] [CrossRef]
  3. Meschede, C.A.C.; Abdalla, M.A.; Mühling, K.H. Sulfur but not nitrogen supply increases the ITC/Nitrile ratio in Pak Choi (Brassica rapa subsp. Chinensis (L.) Hanelt). J. Appl. Bot. Food Qual. 2020, 93, 95–104. [Google Scholar] [CrossRef]
  4. Kopriva, S.; Malagoli, M.; Takahashi, H. Sulfur nutrition: Impacts on plant development, metabolism, and stress responses. J. Exp. Bot. 2019, 70, 4069–4073. [Google Scholar] [CrossRef] [PubMed]
  5. Abdalla, M.A.; Mühling, K.H. Plant-derived sulfur containing natural products produced as a response to biotic and abiotic stresses: A review of their structural diversity and medicinal importance. J. Appl. Bot. Food Qual. 2019, 92, 204–215. [Google Scholar] [CrossRef]
  6. Hawkesford, M.J.; De Kok, L.J. Managing sulphur metabolism in plants. Plant Cell Environ. 2006, 29, 382–395. [Google Scholar] [CrossRef]
  7. Buchner, P. Plant Sulphate Transporters: Co-Ordination of Uptake, Intracellular, and Long-Distance Transport. J. Exp. Bot. 2004, 55, 1765–1773. [Google Scholar] [CrossRef]
  8. Buchner, P.; Stuiver, C.E.E.; Westerman, S.; Wirtz, M.; Hell, R.; Hawkesford, M.J.; De Kok, L.J. Regulation of Sulfate Uptake and Expression of Sulfate Transporter Genes in Brassica Oleracea as Affected by Atmospheric H(2)S and Pedospheric Sulfate Nutrition. Plant Physiol. 2004, 136, 3396–3408. [Google Scholar] [CrossRef]
  9. Etienne, P.; Sorin, E.; Maillard, A.; Gallardo, K.; Arkoun, M.; Guerrand, J.; Cruz, F.; Yvin, J.C.; Ourry, A. Assessment of sulfur deficiency under field conditions by single measurements of sulfur, chloride, and phosphorus in mature leaves. Plants 2018, 7, 37. [Google Scholar] [CrossRef]
  10. McGrath, S.P.; Zhao, F.J.; Withers, P.J.A. Development of Sulphur Deficiency in Crops and Its Treatment; No 379; Fertiliser Society: Petersborough, UK, 1996. [Google Scholar]
  11. Yu, Z.; She, M.; Zheng, T.; Diepeveen, D.; Islam, S.; Zhao, Y.; Zhang, Y.; Tang, G.; Zhang, Y.; Zhang, J. Impact and mechanism of sulphur-deficiency on modern wheat farming nitrogen-related sustainability and gliadin content. Commun. Biol. 2021, 4, 945. [Google Scholar] [CrossRef]
  12. Jobe, T.O.; Zenzen, I.; Rahimzadeh Karvansara, P.; Kopriva, S. Integration of sulfate assimilation with carbon and nitrogen metabolism in transition from C3 to C4 photosynthesis. J. Exp. Bot. 2019, 70, 4211–4221. [Google Scholar] [CrossRef] [PubMed]
  13. Houhou, M.; Joutei, K.A.; Louhalia, S. Biomass production, chlorophyll content, and morphological parameters are affected by sulfur deficiency in Eruca sativa L. Int. J. Ecol. Environ. Sci. 2018, 44, 67–75. [Google Scholar]
  14. Henriet, C.; Aimé, D.; Térézol, M.; Kilandamoko, A.; Rossin, N.; Combes-Soia, L.; Labas, V.; Serre, R.F.; Prudent, M.; Kreplak, J.; et al. Water stress combined with sulfur deficiency in pea affects yield components but mitigates the effect of deficiency on seed globulin composition. J. Exp. Bot. 2019, 70, 4287–4304. [Google Scholar] [CrossRef] [PubMed]
  15. Liu, Z.; Huang, S.; Fan, Y.; Yu, Y.; Wang, Q.; Li, H.; Wan, Y. Sulfur reduces arsenic accumulation in rice shoot by enhancing root retention and altering arsenic metabolism. Chemosphere 2022, 305, 135080. [Google Scholar] [CrossRef]
  16. Zhang, N.; Huang, L.; Zhang, Y.; Liu, L.; Sun, C.; Lin, X. Sulfur deficiency exacerbates phytotoxicity and residues of imidacloprid through suppression of thiol-dependent detoxification in lettuce seedlings. Environ. Pollut. 2021, 291, 118221. [Google Scholar] [CrossRef]
  17. Filipek-Mazur, B.; Tabak, M.; Gorczyca, O.; Lisowska, A. Effect of sulfur-containing fertilizers on the quantity and quality of spring oilseed rape and winter wheat yield. J. Elementol. 2019, 24, 1383–1394. [Google Scholar] [CrossRef]
  18. Carciochi, W.D.; Divito, G.A.; Fernández, L.A.; Echeverría, H.E. Sulfur affects root growth and improves nitrogen recovery and internal efficiency in wheat. J. Plant Nutr. 2017, 40, 1231–1242. [Google Scholar] [CrossRef]
  19. Wilson, T.L.; Guttieri, M.J.; Nelson, N.O.; Fritz, A.; Tilley, M. Nitrogen and sulfur effects on hard winter wheat quality and asparagine concentration. J. Cereal Sci. 2020, 93, 102969. [Google Scholar] [CrossRef]
  20. Nakai, Y.; Maruyama-Nakashita, A. Biosynthesis of sulfur-containing small biomolecules in plants. Int. J. Mol. Sci. 2020, 21, 3470. [Google Scholar] [CrossRef]
  21. Yoshimoto, N.; Saito, K. S-Alk(en)ylcysteine sulfoxides in the genus Allium: Proposed biosynthesis, chemical conversion, and bioactivities. J. Exp. Bot. 2019, 70, 4123–4137. [Google Scholar] [CrossRef]
  22. Abdalla, M.A.; Lentz, C.; Mühling, K.H. Crosstalk between Selenium and Sulfur Is Associated with Changes in Primary Metabolism in Lettuce Plants Grown under Se and S Enrichment. Plants 2022, 11, 927. [Google Scholar] [CrossRef] [PubMed]
  23. Camejo, D.; Frutos, A.; Mestre, T.C.; Pinero, M.D.C.; Rivero, R.M.; Martinez, V. Artificial light impacts the physical and nutritional quality of lettuce. Hortic. Environ. Biotechnol. 2020, 61, 69–82. [Google Scholar] [CrossRef]
  24. Baslam, M.; Pascual, I.; Sanchez-Diaz, M.; Erro, J.; Garcia-Mina, J.M.; Goicoechea, N. Improvement of nutritional quality of greenhouse-grown lettuce by Arbuscular Mycorrhizal fungi is conditioned by the source of phosphorus nutrition. J. Agric. Food Chem. 2011, 59, 11129–11140. [Google Scholar] [CrossRef] [PubMed]
  25. Kim, M.J.; Moon, Y.; Tou, J.C.; Mou, B.; Waterland, N.L.J. Nutritional value, bioactive compounds and health benefits of lettuce (Lactuca sativa L.). J. Food Compos. 2016, 49, 19–34. [Google Scholar] [CrossRef]
  26. Abdalla, M.A.; Sulieman, S.; Mühling, K.H. Regulation of selenium/sulfur interactions to enhance chemopreventive effects: Lessons to learn from Brassicaceae. Molecules 2020, 25, 5846. [Google Scholar] [CrossRef]
  27. Garg, M.; Sharma, N.; Sharma, S.; Kapoor, P.; Kumar, A.; Chunduri, V.; Arora, P. Biofortified crops generated by breeding, agronomy, and transgenic approaches are improving lives of millions of people around the world. Front. Nutr. 2018, 5, 12. [Google Scholar] [CrossRef]
  28. Kane, C.D.; Jasoni, R.L.; Peffley, E.P.; Thompson, L.D.; Green, C.J.; Pare, P. Nutrient solution and solution pH influences on onion growth and mineral content. J. Plant Nutr. 2006, 29, 375–390. [Google Scholar] [CrossRef]
  29. Lichtenthaler, H.K.; Buschmann, C. Chlorophylls and Carotenoids: Measurement and Characterization by UV-VIS Spectroscopy. In Current Protocols in Food Analytical Chemistry; Wrolstad, R.E., Acree, T.E., An, H., Decker, E.A., Penner, M.H., Reid, D.S., Schwartz, S.J., Shoemaker, C.F., Sporns, P., Eds.; John Wiley and Sons: New York, NY, USA, 2001; pp. F4.3.1–F4.3.8. [Google Scholar] [CrossRef]
  30. Kim, B.M.; Lee, H.J.; Song, Y.H.; Kim, H.J. Effect of salt stress on the growth, mineral contents, and metabolite profiles of spinach. J. Sci. Food Agric. 2021, 101, 3787–3794. [Google Scholar] [CrossRef]
  31. Hesse, H.; Nikiforova, V.; Gakiere, B.; Hoefgen, R. Molecular analysis and control of cysteine biosynthesis: Integration of nitrogen and sulphur metabolism. J. Exp. Bot. 2004, 55, 1283–1292. [Google Scholar] [CrossRef]
  32. Prosser, I.M.; Purves, J.V.; Saker, L.R.; Clarkson, D.T. Rapid disruption of nitrogen metabolism and nitrate transport in spinach plants deprived of sulphate. J. Exp. Bot. 2001, 52, 113–121. [Google Scholar] [CrossRef]
  33. Satbhai, S.B.; Ristova, D.; Busch, W. Underground tuning: Quantitative regulation of root growth. J. Exp. Bot. 2015, 66, 1099–1112. [Google Scholar] [CrossRef] [PubMed]
  34. Bates, T.R.; Lynch, J.P. Stimulation of root hair elongation in Arabidopsis thaliana by low phosphorus availability. Plant Cell Environ. 1996, 19, 529–538. [Google Scholar] [CrossRef]
  35. Teranishi, R.; Buttery, R.G.; Shahidi, F. Role of Free Amino Acids and Peptides in Food Taste; ACS Symposium Series; American Chemical Society: Washington, DC, USA, 1989; Flavor Chemistry Chapter 13; pp. 158–174. [Google Scholar]
  36. Galili, G. The aspartate-family pathway of plants: Linking production of essential amino acids with energy and stress regulation. Plant Signal. Behav. 2011, 6, 192–195. [Google Scholar] [CrossRef] [PubMed]
  37. Cuppettz, S.L.; McCluskey, M.M.; Paparozzi, E.T.; Parkhursp, A. Nitrogen and sulfur effects on leaf lettuce quality. J. Food Qual. 1999, 22, 363–373. [Google Scholar] [CrossRef]
  38. Long, S.R.; Kahn, M.; Seefeldt, L.; Tsay, Y.F.; Kopriva, S. Chapter 16 nitrogen and sulfur. In Biochemistry & Molecular Biology of Plants; Buchana, B.B., Gruissem, W., Jones, R.L., Eds.; Wiley Blackwell: Hoboken, NJ, USA, 2015; pp. 746–768. [Google Scholar]
  39. Maruyama-Nakashita, A. Metabolic changes sustain the plant life in low-sulfur environments. Curr. Opin. Plant Biol. 2017, 39, 144–151. [Google Scholar] [CrossRef]
  40. Falk, K.L.; Tokuhisa, J.G.; Gershenzon, J. The effect of sulfur nutrition on plant glucosinolate content: Physiology and molecular mechanisms. Plant Biol. (Stuttg) 2007, 9, 573–581. [Google Scholar] [CrossRef]
  41. Maruyama-Nakashita, A.; Nakamura, Y.; Tohge, T.; Saito, K.; Takahashi, H. Arabidopsis SLIM1 is a central transcriptional regulator of plant sulfur response and metabolism. Plant Cell. 2006, 18, 3235–3251. [Google Scholar] [CrossRef]
  42. Noctor, G.; Queval, G.; Mhamdi, A.; Chaouch, S.; Foyer, C.H. Glutathione. In The Arabidopsis Book; BioOne: Washington, DC, USA, 2011; Volume 9, p. e0142. [Google Scholar] [CrossRef]
  43. Maruyama-Nakashita, A.; Nakamura, Y.; Watanabe-Takahashi, A.; Inoue, E.; Yamaya, T.; Takahashi, H. Identification of a novel cis-acting element conferring sulfur deficiency response in Arabidopsis roots. Plant J. 2005, 42, 305–314. [Google Scholar] [CrossRef]
  44. Aarabi, F.; Kusajima, M.; Tohge, T.; Konishi, T.; Gigolashvili, T.; Takamune, M.; Sasazaki, Y.; Watanabe, M.; Nakashita, H.; Fernie, A.R.; et al. Sulfur deficiency-induced repressor proteins optimize glucosinolate biosynthesis in plants. Sci. Adv. 2016, 2, e1601087. [Google Scholar] [CrossRef]
  45. Abdalla, M.A.; Li, F.; Wenzel-Storjohann, A.; Sulieman, S.; Tasdemir, D.; Mühling, K.H. Comparative metabolite profile, biological activity and overall quality of three lettuce (Lactuca sativa L., Asteraceae) cultivars in response to sulfur nutrition. Pharmaceutics 2021, 13, 713. [Google Scholar] [CrossRef]
  46. Chadwick, M.; Gawthrop, F.; Michelmore, R.W.; Wagstaff, C.; Methven, L.L. Perception of bitterness, sweetness and liking of different genotypes of lettuce. Food Chem. 2016, 197, 66–74. [Google Scholar] [CrossRef] [PubMed]
  47. Nikiforova, V.; Freitag, J.; Kempa, S.; Adamik, M.; Hesse, H.; Hoefgen, R. Transcriptome analysis of sulfur depletion in Arabidopsis thaliana: Interlacing of biosynthetic pathways provides response specificity. Plant J. 2003, 33, 633–650. [Google Scholar] [CrossRef] [PubMed]
  48. Shah, A.; Smith, D.L. Flavonoids in agriculture: Chemistry and roles in, biotic and abiotic stress responses, and microbial associations. Agronomy 2020, 10, 1209. [Google Scholar] [CrossRef]
Figure 1. Relative spectral distributions of the red and blue LED light used in this study.
Horticulturae 08 00734 g001
Figure 2. Effects of high sulfur treatment on the leaf (A) and root (B) fresh weight of lettuce. The data indicate the means± S.E. (n = 5). Asterisks indicate significant differences. * p value < 0.05; ** p value < 0.01.
Horticulturae 08 00734 g002
Figure 3. Changes in chlorophyll (A) and carotenoid (B) content of lettuce leaves were affected by low and high concentration of sulfur treatment in LED spray system for 4 weeks. The data indicate the means ± S.E. (n = 5). Asterisks indicate significant differences. ** p value < 0.01.
Horticulturae 08 00734 g003
Figure 4. Changes in the total root length (A), root surface area (B), average root diameter (C), root volume (D), root tips (E), and root forks (F) of lettuce grown in low and high sulfur concentration under LED spray system. Vertical bars represent the standard deviation of the mean (n = 5). Asterisks indicate significant differences. * p value < 0.05.
Horticulturae 08 00734 g004
Figure 5. Representative chromatogram of metabolite profiles analyzed by GC-MS (A) and ultra-performance liquid chromatography-quadrupole-time-of-flight mass spectrometry (UPLC-Q-TOF MS) profiles (B,C) of lettuce. The GC-MS chromatogram (A) identified metabolites were 1, alanine; 2, oxalic acid; 3, norleucine; 4, proline; 5, 3-decanethiol; 6, 1-undecanol; 7, glyceric acid; 8, 3-propionyloxytridecane; 9, serine; 10, nonanoic acid; 11, threonine; 12, malic acid; 13, methyltrioxitol; 14, phytanic acid; 15, aspartic acid; 16, 5-oxoproline; 17, butanoic acid; 18, threonic acid; 19, hydroxydiisopropylbenzene; 20, asparagine, 2TMS; 21, ornithine; 22, glutamic acid; 23, tartaric acid; 24, xylose; 25, asparagine, 3TMS; 26, xylitol; 27, malonic acid; 28, glutamic acid; 29, glutamine, TMS; 30, glutamine, 3TMS; 31, citric acid; 32, ketoglutaric acid; 33, quinic acid; 34, fructose; 35, sorbose; 36, glucose; 37, galactose; 38, inositol; 39, turanose; 40, psicopyranose; 41, palmitic acid; 42, myo-inositol; 43, gluconic acid; 44, caffeic acid; 45, methyl galactoside; 46, xylopyranose; 47, phosphoric acid; 48, stearic acid; 49, sucrose; 50, oleyl amide; 51, oleamide; 52, benzenepropanoic acid; 53, raffinose. The UPLC-Q-TOF MS chromatogram (B,C) identified metabolites were 1, citric acid; 2, tryptophan; 3, caffeoylquinic acid; 4, chicoric acid; 5, 6-O-acetylisoquercitrin; 6, cynarine; 7, 1-(7-methoxy-2-oxo-2H-chromen-8-yl)-3-methyl-3-buten-2-yl hydrogen sulfate; 8, lactucopicrin 15-oxalate; 9, aspicilin; 10, nonioside G; 11, pinellic acid; 12, glaucarubin; 13, LPG(22:4); 14, LPC(20:5); 15, pentadecanedioic acid; 16, linolenic acid; and IS, internal standard (terfenadine).
Horticulturae 08 00734 g005
Figure 6. Partial least squares discriminant analysis (PLS-DA) score plots of lettuce metabolites using GC-MS and LC-MS. The qualification of the PLS-DA models was evaluated by the goodness of fit measure (R2X and R2Y) and predictive ability (Q2), and cross-validated with a permutation test (n = 200).
Horticulturae 08 00734 g006
Figure 7. Schematic of the lettuce metabolic pathway associated with the sulfur treatment. The metabolites analyzed using LC-MS and GC-MS are shown in color. Green indicates increased metabolites, red indicates decreased metabolites, and the open circles indicate no change.
Horticulturae 08 00734 g007
Table 1. Summary of the spectral qualities tested for the red and blue light (RB) (µmol·m−2·s −1).
LightPPFD *Blue
(400–499 nm)
Green
(500–599 nm)
Red
(600–699 nm)
Far-Red
(700–799 nm)
Red and Blue23270.9 (33.3%)3.6 (1.7%)119.9 (56.3%)13.1 (6.1%)
* PPFD, photosynthetic photon flux density.
Table 2. Identification of lettuce metabolites contributes to the sample groups’ separation based on the PLS-DA score plot for GC-MS analysis and their fold changes.
MetabolitesRT a (min)RI bVIP cp-Value dFold Change
(vs. Low Sulfur)
Alanine6.3610991.073.42 × 10−21.36
Norleucine9.3812881.112.34 × 10−2−1.68
Proline9.4512931.195.20 × 10−3−2.66
Glyceric acid9.9113231.265.84 × 10−52.83
Serine10.3613531.264.42 × 10−5−2.47
Threonine10.7213761.264.30 × 10−5−3.21
Malic acid12.1314811.034.86 × 10−2−1.05
Aspartic acid12.5515141.263.01 × 10−3+ e
5-Oxoproline12.5915161.272.62 × 10−6−11.10
Butanoic acid12.7015251.203.89 × 10−34.33
Ornithine13.7716091.262.13 × 10−3- f
Glutamic acid13.8316141.112.13 × 10−2−1.28
Asparagine14.4316631.268.76 × 10−4−5.37
Malonic acid14.7616901.272.42 × 10−7-
Glutamine15.6617671.269.88 × 10−4-
Citric acid16.1418091.261.69 × 10−5−2.97
Quinic acid16.5618471.053.98 × 10−2−1.32
Fructose16.6918601.262.12 × 10−53.92
Sorbose16.7918691.261.44 × 10−33.84
Glucose16.9718851.204.55 × 10−31.45
Galactose17.1819041.251.37 × 10−41.42
Inositol17.5919441.261.98 × 10−5−1.35
Myo-inositol18.9820801.261.08 × 10−4−1.37
Xylopyranose19.8621711.092.76 × 10−23.09
Phosphoric acid19.9521801.151.18 × 10−2−1.22
Sucrose23.7526201.252.60 × 10−4−1.67
Oleamide25.2728311.151.17 × 10−2−1.74
Raffinose29.4529881.271.87 × 10−6−12.99
a RT, retention time; b RI, retention index; c VIP, variable importance in the projection; d p-values were analyzed by Duncan’s test; e +, newly generated; f -, uncalculated.
Table 3. Identification of lettuce metabolites contributes to the sample groups’ separation based on the PLS-DA score plot for UPLC-Q-TOF MS analysis and their fold changes.
CompoundRT aExact Mass (M-H)MS FragmentsVIP bp-Value cFold Change
(vs. Low Sulfur)
Tryptophan2.90203.0879186, 142, 116, 741.461.15 × 10−2−1.52
Caffeoylquinic acid3.01353.0919191, 179, 1331.515.23 × 10−31.53
Chicoric acid3.56473.0719427, 311, 293, 1791.582.28 × 10−48.32
1-(7-Methoxy-2-oxo-2H-chromen-8-yl)-3-methyl-3-buten-2-yl hydrogen sulfate3.77339.0563175, 961.582.42 × 10−42.84
Lactucopicrin 15-oxalate4.33481.1132409, 257, 1511.392.57 × 10−2−1.49
Aspicilin4.79327.2213211, 1711.551.67 × 10−3−2.59
Nonioside G4.90755.3664681, 561, 161, 1591.497.83 × 10−31.42
LPG(22:4)6.89559.3089277, 1161.522.39 × 10−24.70
Pentadecanedioic acid7.86271.19761991.561.19 × 10−3−1.43
Linolenic acid8.12277.2211144, 1161.583.44 × 10−412.97
a RT, retention time; b VIP, variable importance in the projection; c p-value was analyzed by Duncan’s test. LPC, lysophosphatidylcholine.
Publisher’s Note: MDPI stays neutral with regard to jurisdictional claims in published maps and institutional affiliations.

