
Optimum Nitrogen Application Promotes Sweetpotato Storage Root Initiation


1
School of Health, Medical and Applied Sciences, Central Queensland University, University Drive, Bundaberg 4670, Australia
2
Henderson RDE, Tawonga South 3698, Australia
*
Author to whom correspondence should be addressed.
Horticulturae 2022, 8(8), 710; https://doi.org/10.3390/horticulturae8080710
Submission received: 11 July 2022
/
Revised: 29 July 2022
/
Accepted: 31 July 2022
/
Published: 6 August 2022
(This article belongs to the Topic Plants Nutrients)
Abstract
:Storage root formation of sweetpotato (Ipomoea batatas (L.) Lam) is a complex developmental process relating to the activity of cambium. Little information is available on the relationship between nitrogen (N) application levels and the initiation and development of sweetpotato storage roots (SRs). This study aims to examine how N application rates promoted/inhibited the formation and development of storage roots (SRs) for sweetpotato cultivar ‘Orleans’ during the first 8 weeks after planting. Cuttings were grown in coarse river sand culture supplied with modified Hoagland nutrient solution at four different rates (0 (N0), 50 (N50), 100 (N100) or 200 (N200) mg L−1) of N. The results showed that N100 treatment promoted the formation of primary and secondary cambium, resulting in a significant higher rate of SR formation between 21 and 56 days after transplanting (DAT). Due to the higher N demand after formation of SRs, N200 treatment displayed faster growth, higher N acquisition and the highest efficiency of N use after 35 DAT, but the SR formation rate and SR number per plant remained insignificantly lower than N100 when differentiation of adventitious root was mostly completed (49 DAT), suggesting irreversible an effect of N rate during SR initiation, which eventually affects SR number. The results suggested that the optimal substrate N level for sweetpotato SR initiation is lower than that for following SR growth, which should be considered in the fertilisation scheme.
1. Introduction
Nitrogen is one of the most critical elements for plant growth and optimum yield of crops [1,2,3]. Excessive N application is a serious problem leading to N losses through leaching and evaporating. Suitable N supply is critical for crops to achieve optimum production. The effects of N rates have been studied in various crops and show a fundamental role in increasing productivity of many crops [4,5,6]. In root and tuber crops, it was found that tuber yield reduced under N deficiency [7,8,9]. In comparison, excessively high N supply levels also have negative effects on tuberisation and yield of root and tuber crops [3,10,11].
Sweetpotato (Ipomoea batatas (L.) Lam) is one of the important vegetable crops in Australia [12]. The utilisation of N fertilisation is a major factor that contributes to increases in the production of sweetpotato [3]. Thus, numerous research results in this crop showed that the application of N increases the SR yield. Previous studies on the N requirement of sweetpotato mainly focus on the influence of this element on the final yield of this crop [3,9,13]. Both deficient and excessive N applications have negative effects on yield of sweetpotato [3,13]. High rates of N application may promote the growth of vines rather than SR development [14], leading to low fertiliser efficiency when N is overused. Hence, the use of appropriate N rates is an effective measure to increase the SR yield.
Storage root initiation is the process by which adventitious roots (ARs) differentiate into SRs under proper conditions. This can be observed by root anatomical investigation as early as 13 DAT [15]. The formation and development of SRs is a complex process relating to various steps, including the cessation of root elongation, increase in radial growth, formation of primary and secondary vascular cambia, initiation and development of anomalous and interstitial cambia, and accumulation of starch as well as protein [16,17]. Most SRs were developed from ARs which formed within the first week after transplanting [18]. The maximum number of SRs would be established by week 8 in west Indian cultivars [19] or week 4 in Beauregard cultivar [20]. Examination of SR formation in the early stage of ARs would help to understand the mechanisms that affect this process.
A few previous studies investigated the influence of N on the formation and development of SRs in sweetpotato. As the formation of SRs determines the number of SR per plant, it is one of the main factors affecting the final yield of the crop [21]. High levels of N supply (five times the amount of standard N) suppressed the initiation of SRs, as it affected the balance between cambial development and lignification in roots, which determines the differentiation of ARs into SRs [22]. Wilson detected SR formation in sand culture of two sweetpotato cultivars [23]. The results showed that nitrate N levels from 21 to 105 mg L−1 in sand culture produced tubers and uniformly thickened roots, whereas 210 mg L−1 N treatment produced few tubers. In another study, high rates of fertiliser reduced the number of SRs grown in greenhouse pots [24]. Nitrogen deficiency also inhibited the formation of SRs [25], leading to low number of SRs.
There have been limited studies focusing on the effects of N fertiliser rates on the initiation and development of sweetpotato SRs, and most of them were conducted decades ago. We specifically addressed the following questions: (1) How do N application levels affect SR initiation? (2) How is N acquisition in plants affected by N supply level? The Orleans cultivar was used in this study, as it is one of the popular cultivars in Australia and has consistent yields for early, middle, and late-season plantings [26].
2. Materials and Methods
2.1. Plant Materials and Experimental Conditions
The experiment was conducted in a glasshouse at Bundaberg, Queensland, Australia (24°50′54″ S 152°24′14″ E) from 23 April to 11 June 2018. The averages of daily maximum and minimum temperature during this period inside the glasshouse were 27.8 and 15.7 °C, respectively. The mean daily maximum and minimum relative humidity were 79.4% and 49.3%, respectively. Healthy, uniform cuttings of Orleans used in this study had five fully opened leaves and were at least 20 cm long. Two leaves from the cut ends of cuttings were removed before planting. Black polythene pots (150 mm diameter and 300 mm height) were filled with 4 L of washed river sand as a growth substrate. Three days before transplanting, pots were saturated using tap water. One cutting was transplanted in each pot with two nodes in the sand at about 2 cm deep and three fully recent expanded leaves above sand surface.
2.2. Experimental Design
The experiment was set up in a completed randomised design having four treatments. The treatments consisted of different rates of N supply, being 0, 50, 100 and 200 mg L−1 in nutrient solution (hereafter N0, N50, N100 and N200, respectively) with multiple harvests during the entire experimental period. Each time, six plants were harvested for measurements. Three replicate plants were used for anatomical observations and morphological analysis of the roots, and the other three were used for carbon and nitrogen (CN) analysis. In total, 120 pots were prepared for five harvests over the experiment period (4 treatments × 5 harvests × 6 plants per harvest). Eight additional plants per treatment (32 plants in total) were grown for backup purposes in case of death or abnormal growth.
2.3. Sampling Date
The interval between each harvest was between 10 and 14 days. The first harvest was conducted at 10 days after transplanting (DAT), and then, plants were sampled at 21, 35 and 49 DAT. Plants were dug up carefully to minimise root damage and were washed in tap water to remove all sand. Final harvesting was conducted at 56 DAT for root anatomical study and yield assessment.
2.4. Nutrient Solution Preparation and Application
Hoagland’s modified solution was utilised in this experiment as the only source of nutrients for the plants [27], as the amounts of nutrient in washed river sand and tap water are negligible. The concentration of nutrients in the N-lacking solution was as follows: 195 mg L−1 K, 31 mg L−1 P, 100 mg L−1 Ca, 208 mg L−1 S, 49 mg L−1 Mg, 0.5 mg L−1 B, 0.5 mg L−1 Mn, 0.05 mg L−1 Zn, 0.02 mg L−1 Cu, 0.01 mg L−1 Mo, 2 mg L−1 Fe. Nitrogen in the form of NH4NO3 was then added to the N-lacking nutrient solution to make up the 50, 100 and 200 mg L−1 of N in each solution.
Plants were watered with these solutions to field capacity every two days. Each plant was given the same volume of nutrient solution each time. The amount of nutrient solution for each pot varied from 80 to 150 mL over time depending on plant age and weather condition. During the entire experimental period, the sand moisture was kept at field capacity level by adding tap water into the pots by an automatic water irrigation system. The range of total N received during the experiment was from 169 to 678 mg pot−1 depending on treatments.
2.5. Data Collections and Laboratory Analysis
2.5.1. Anatomical Feature Observations and AR Classifications
Plants were harvested five times at 10, 21, 35, 49 and 56 DAT. In each harvest, three plants from each treatment were dug out carefully to minimise root damages. The number of adventitious roots (ARs) was recorded for each plant. For each sampling time, all ARs from individual plants were serially cross-sectioned using sharp razor blades at around 3–4 cm from the proximal end of root [18]. Thin sections from each root were transferred to deionised water in a petri dish and used for anatomical observation. Toluidine Blue O 0.05% was used to stain the thinnest cross-sections to show the anatomical features [28]. Different colours were generated after staining provided indicators for different anatomical groups. For example, lignified element appears green to blue-green, and thin-wall parenchyma is reddish purple. Sections for all ARs were observed for each plant.
Sections were stained for one minute and rinsed in running water until there was no excessive stain around the sections [29]. Then, they were observed under microscope (Olympus CX31, Olympus Corporation, Tokyo, Japan) to determine anatomical features and imaged (Nikon DS-L2, Nikon Corporation, Tokyo, Japan). Some main anatomical features of roots including protoxylem number, primary and secondary cambium were examined from those photos. The protoxylem number was observed for single AR at 10 DAT and classified into tetrarch, pentarchy, hexarch, and higher polyarch including septarch, octarchy, ennearch and decarch [18,19]. The other features such as initial regular vascular cambium (IRVC), completed regular vascular cambium (RVC), anomalous cambium (AC) and lignified cells (LC) were observed and used for AR classifications. In this study, ARs were classified into SRs, pencil roots (PRs) and lignified roots [18,19,30] based on cambium developments described by Wilson and Lowe [19].
2.5.2. Root Morphological Characteristics
Roots from each plant used for the microscope work were collected individually. They were then bulked with the rest of the root system together for morphological analysis. An Epson Perfection V700 Photo Root Scanner (Seiko Epson, Nagano, Japan) was used to examine root morphological characteristics. The WinRHIZO Pro software (version 2012a; Regent Instruments Inc, Quebec, QC, Canada) was utilised to analyse root images. All roots including SRs were floated in a transparent tray and scanned to acquire images. Where necessary, roots were divided into smaller sections to make sure they could all spread out in the tray. The following characteristics were recorded: total root length (RL), average root diameter (RD), and total root volume (RV).
2.5.3. Biomass and Other SR Parameters
Sweetpotato biomass and SR characteristics from three plants of each treatment were measured in the last harvest at 56 DAT. Storage roots for each plant were separated to measure the length, diameter and fresh weight. Adventitious roots more than 15 mm in diameter were classified as storage roots [31]. The above-ground parts and root systems including SRs were dried separately to constant weight, and data were recorded for each plant.
2.5.4. Nitrogen Acquisition during SR Formation
Four samplings were conducted at 10, 21, 35 and 49 DAT for carbon and nitrogen (CN) analysis. Three plants for each treatment were dug out carefully and washed in tap water. Fresh vine and root samples from these plants were collected separately to dry in an oven (90 °C for 90 min, and then converted to 70 °C) to a constant weight [32] and ground to fine powder. TruMac® Carbon/Nitrogen Analyser (LECO Corporation, St. Joseph, MI, USA) was used to analyse total C and N concentrations in those samples. Total N acquisition was calculated based on N concentration and dry biomass of samples.
Calculation of N recovery efficiency (NRE) was based on N uptake in the control (N0) and fertilised treatments (NFT) and the total amount of N (NF) applied from the planting day to sampling days [33]:
NRE (%) = [(NFT − NO)/NF] × 100
2.6. Statistical Analysis
One-way ANOVA was used to analyse data recorded from each sampling time (SPSS® software version 25; IBM, Armonk, NY, USA). The interactive effects of N levels and sampling times on anatomical root features, morphological characteristics of roots, N acquisition in plants, and the number of initiated SRs utilised two-way ANOVA, as different plants were harvested for each harvest. One-way ANOVA was also used to assess the effect of N treatments for each harvest. Percentage data were arcsine-transformed before analysis. Adventitious root number was transformed using log 10, while other data were square root transformed in SPSS. All the post hoc tests were conducted with Tukey HSD at p < 0.05. SigmaPlot® for windows version 14 (SYSTAT Software, Inc., San Jose, CA, USA) was used to produce graphs.
3. Results
3.1. Anatomical Characteristics of Orleans Roots
Nitrogen levels did not affect the AR count summed from two subterranean nodes of transplants. The total AR number of Orleans varied roughly between 7 and 10 (Table 1). Most AR counts increased in the first three weeks and then slightly decreased before remaining stable from 35 DAT. The two-way ANOVA results showed that there was no significant difference in both the main effect of N levels and interactive effect of N levels × time (p > 0.05).
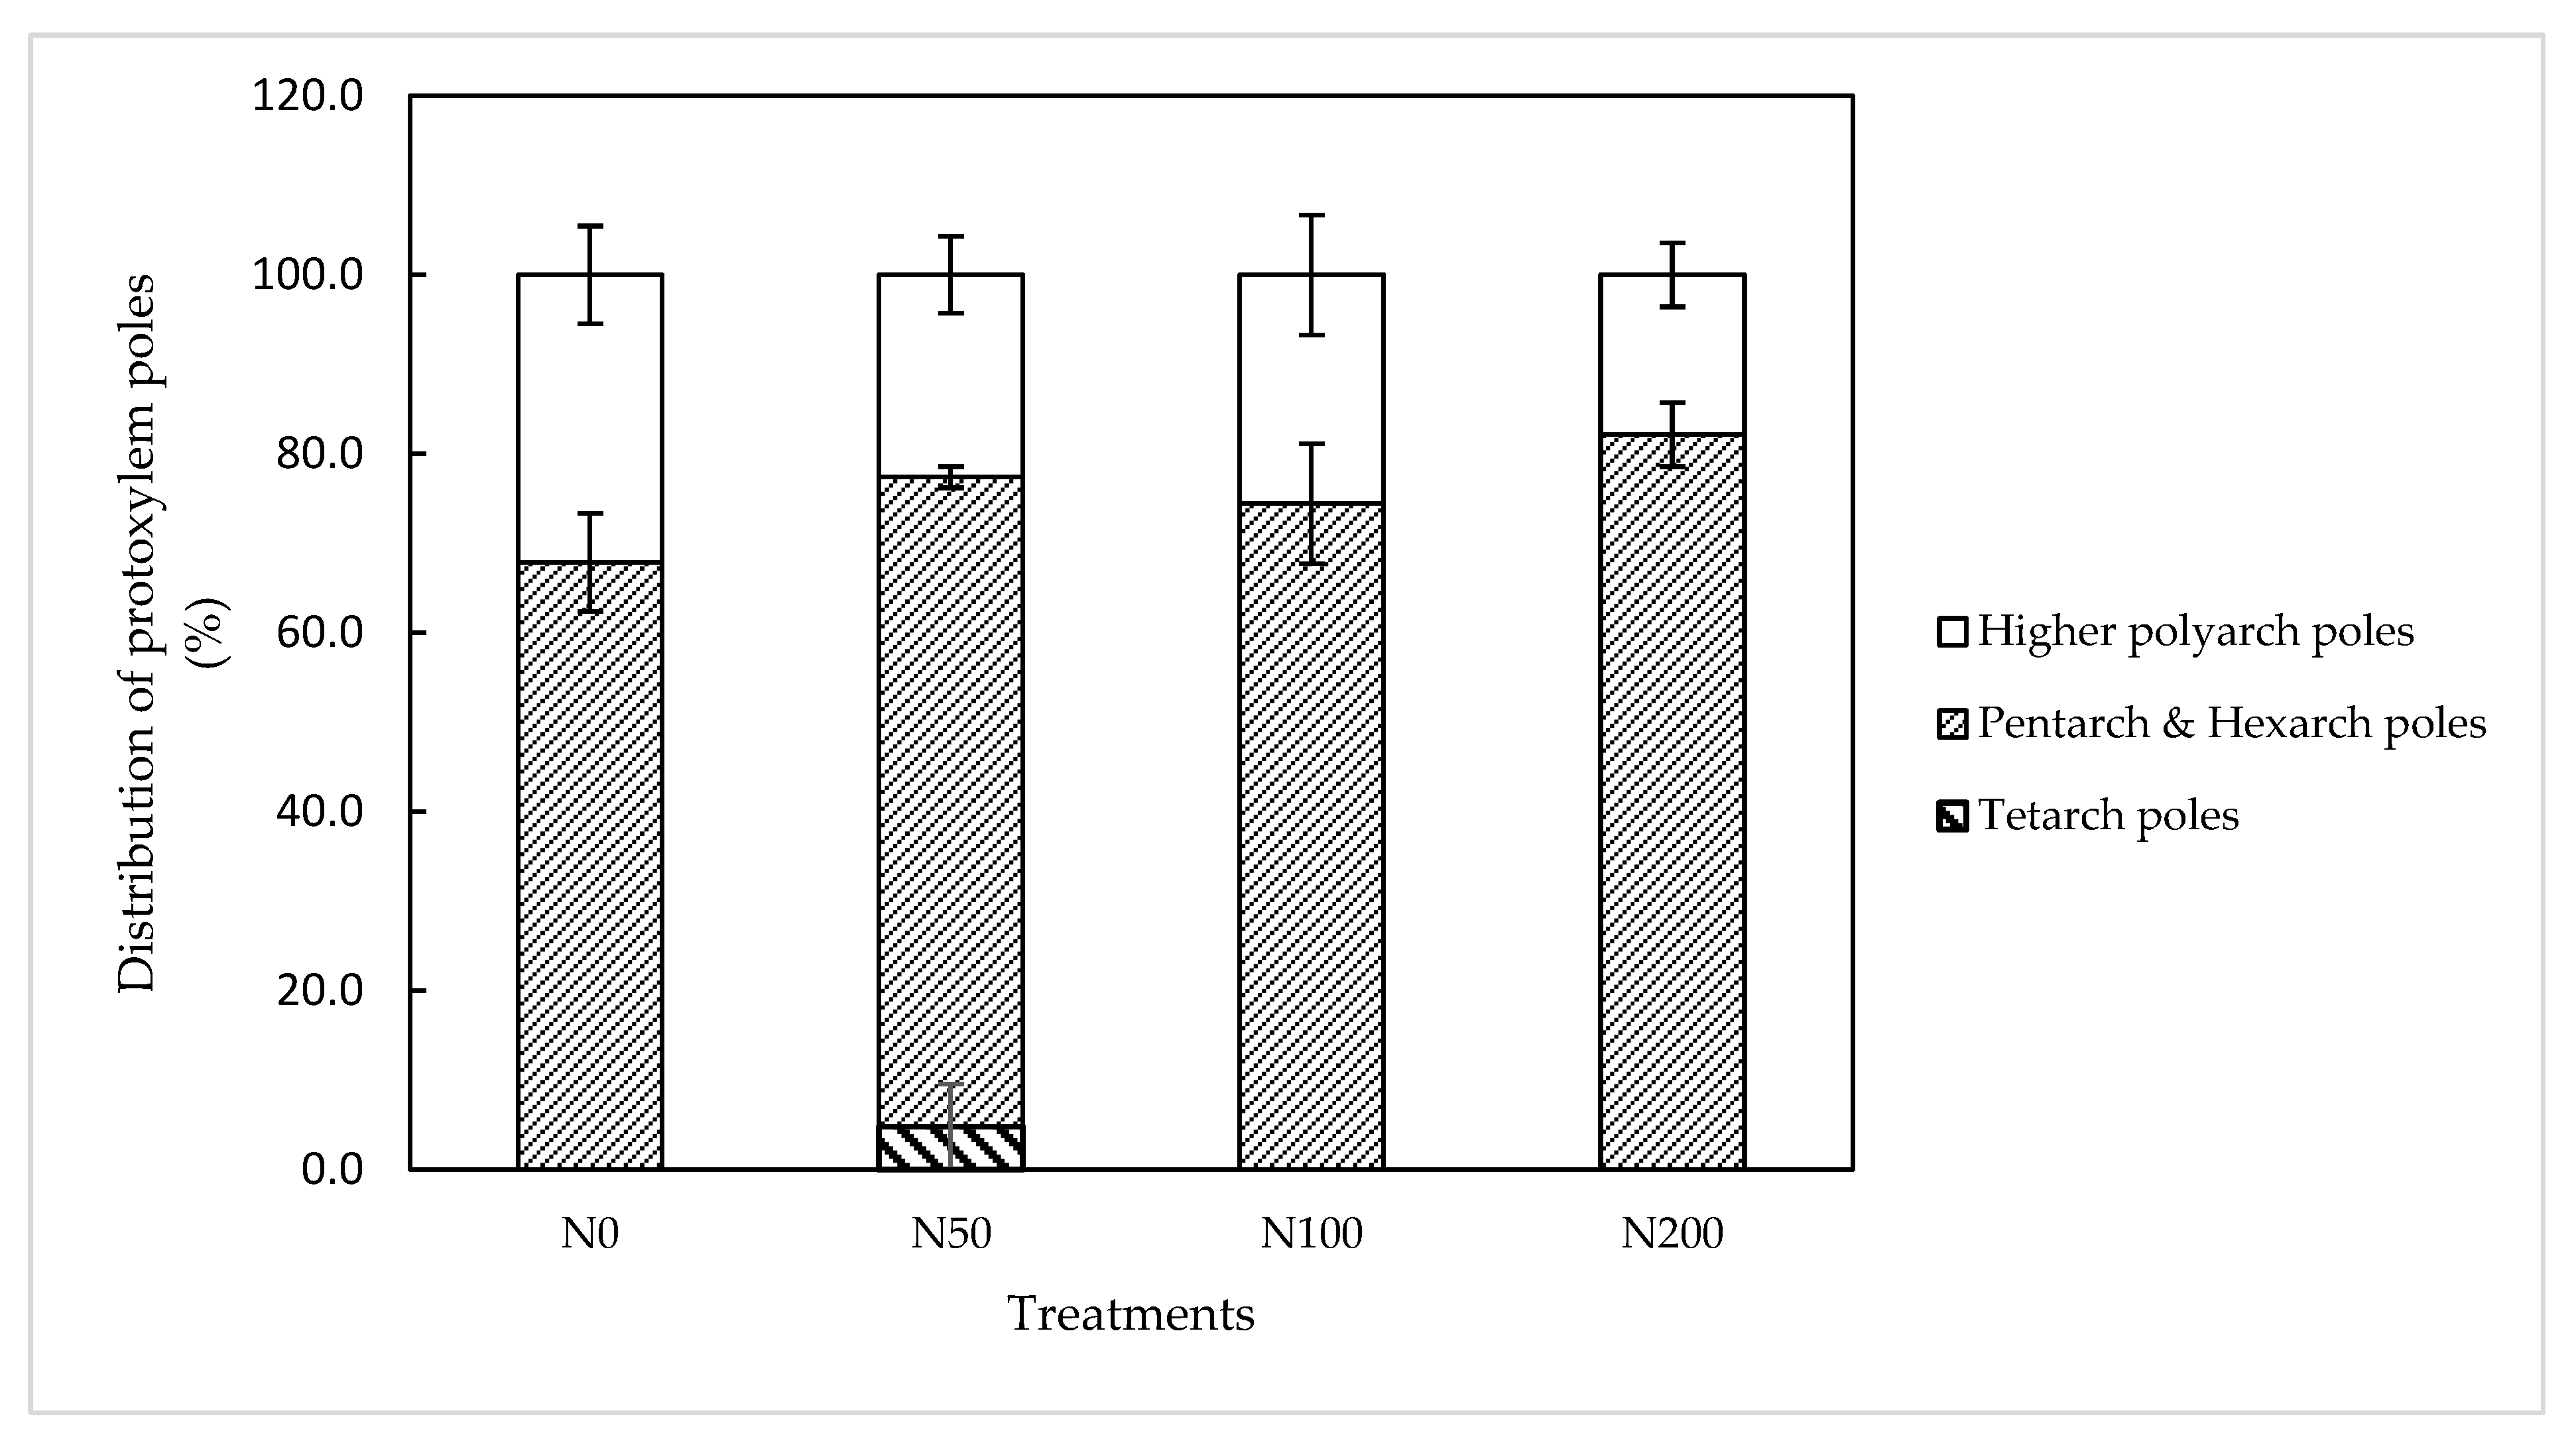
The protoxylem element number in Orleans roots at 10 DAT varied roughly between 4 and 9. The effect of N application levels on the arrangement of the vascular cylinder in roots was not significant. A combination between 68% and 82% of the total ARs at this stage had pentarch and hexarch steles (Figure 1).
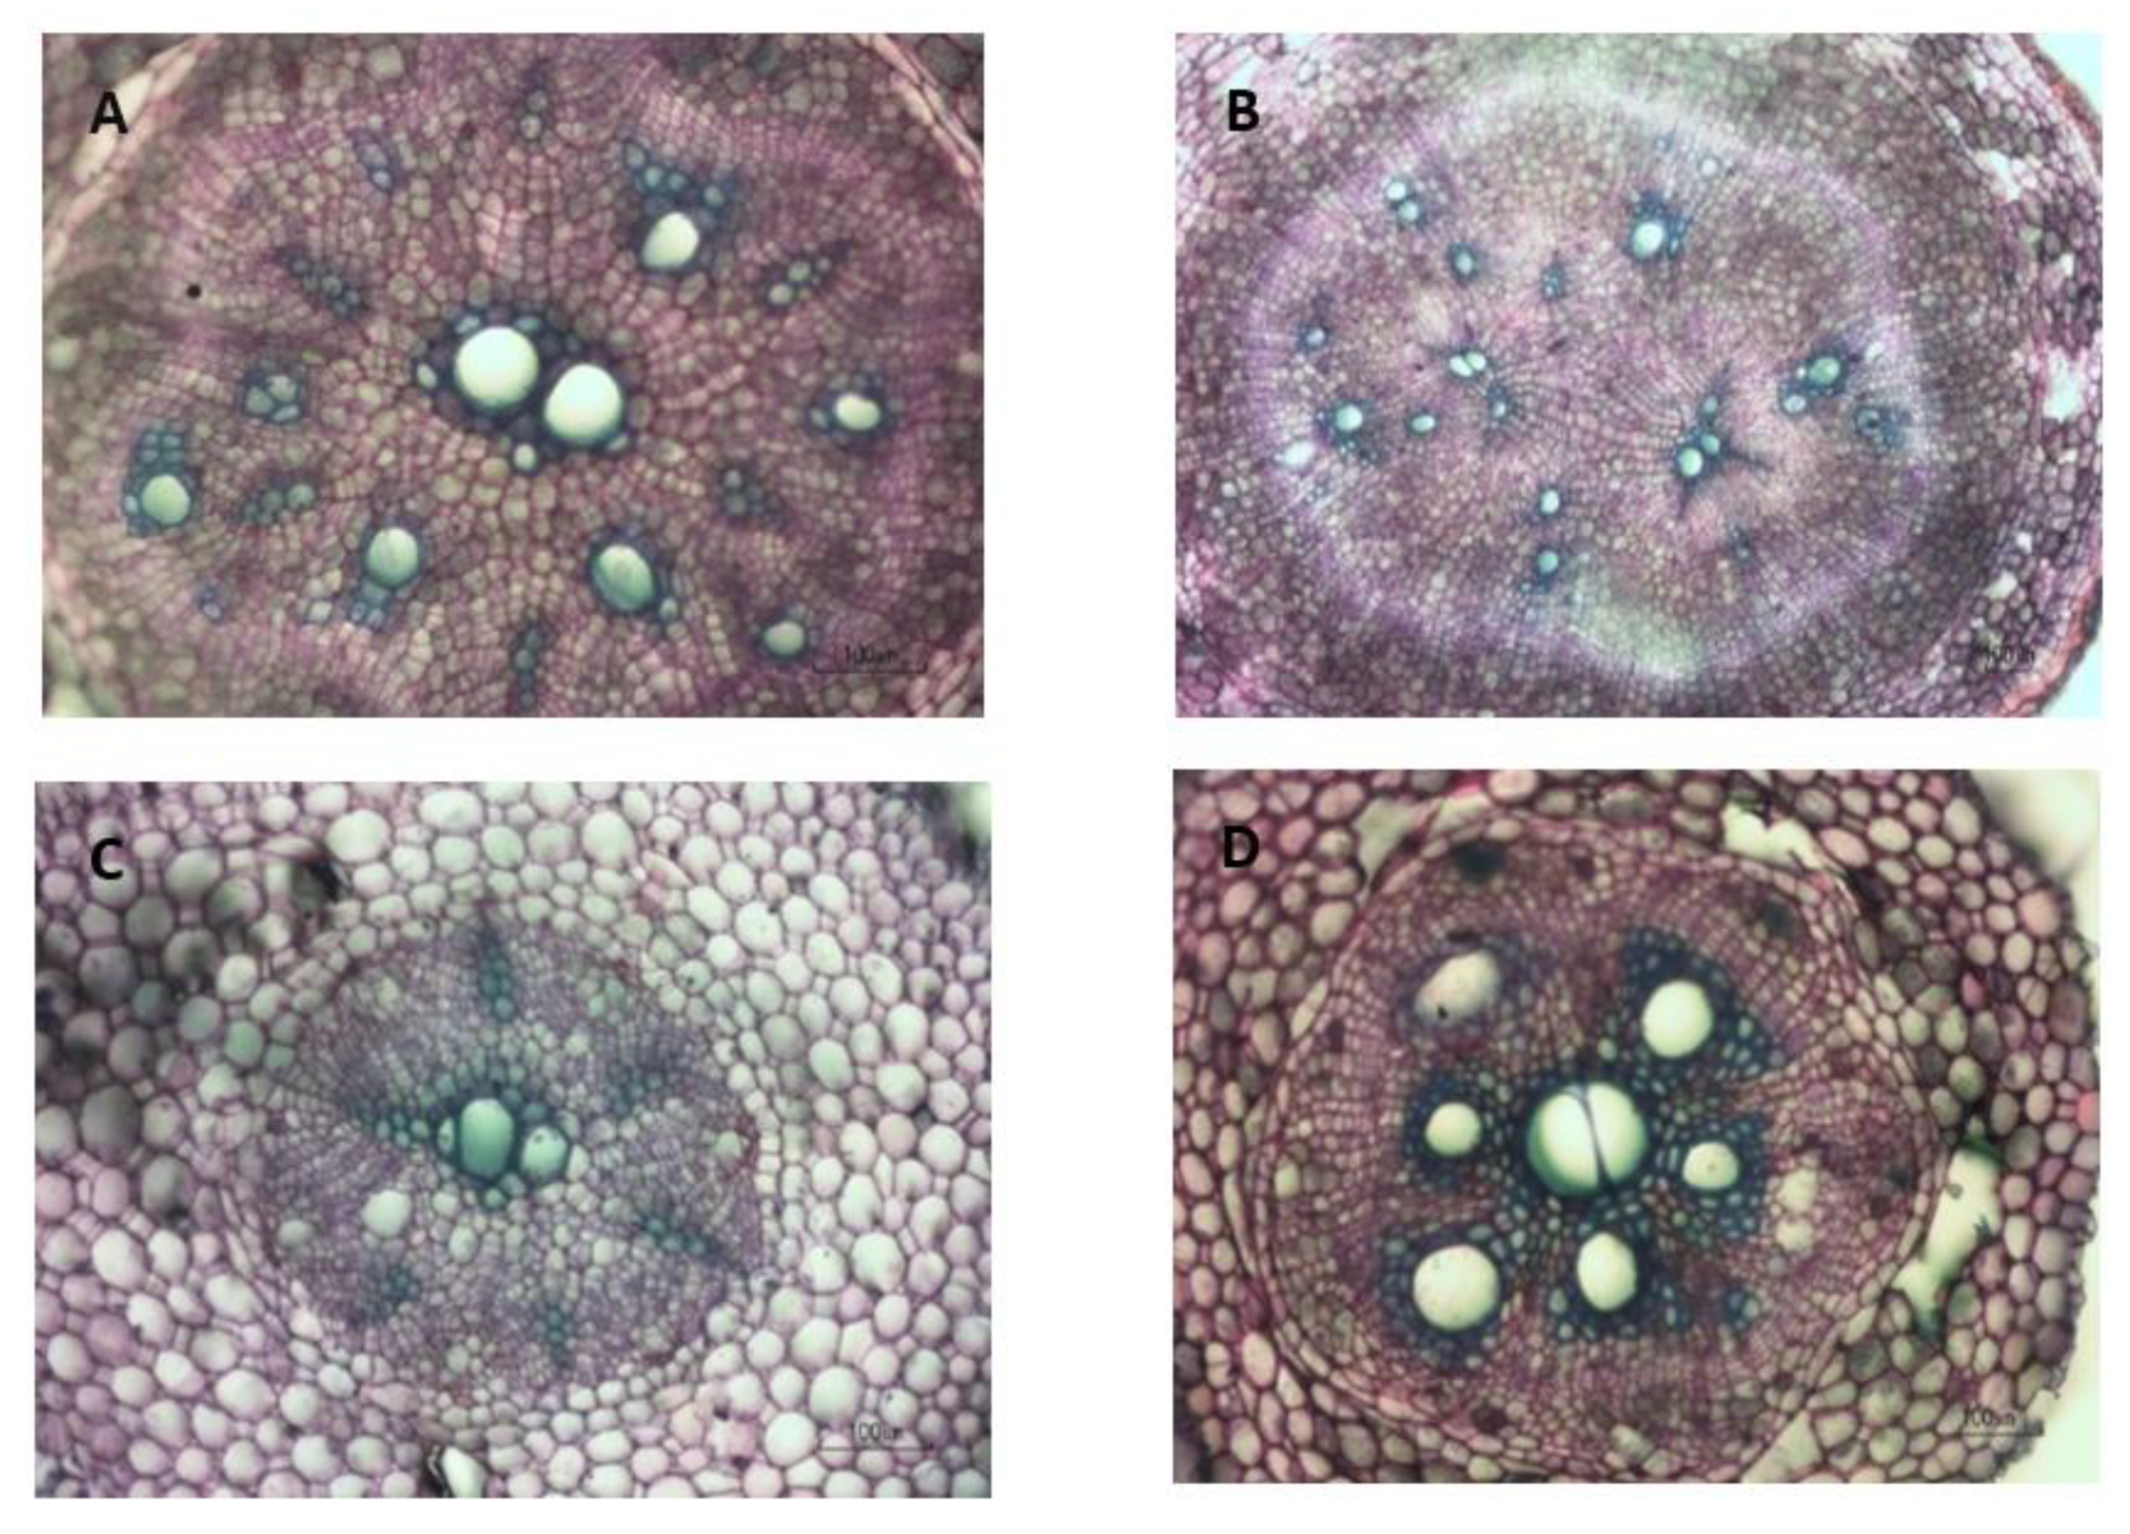
The development of cambia in ARs is described briefly below (See Figure 2). Initiated SRs were ARs with AC encircling the central metaxylem and the primary xylem poles (Figure 3A). For the initiated SRs without the central metaxylem cell, primary cambia were associated with meristematic activity in the pith cells, and AC formed around primary xylem elements (Figure 3B). Adventitious roots were classified as PRs when a strand of lignified tissues joined at least one of the protoxylem points that is connected to the central metaxylem, and some meristematic activity was found around the central metaxylem (Figure 3C). Lignified roots were ARs that developed heavily lignified steles, xylem rays, a broad secondary cortex and limited secondary phloem (Figure 3D). In this study, those roots with more than 50% lignified stele were considered as lignified roots. Therefore, the classification of sweetpotato roots in the early stage was mainly based on the anatomical changes, especially on the cambial development (Figure 3).
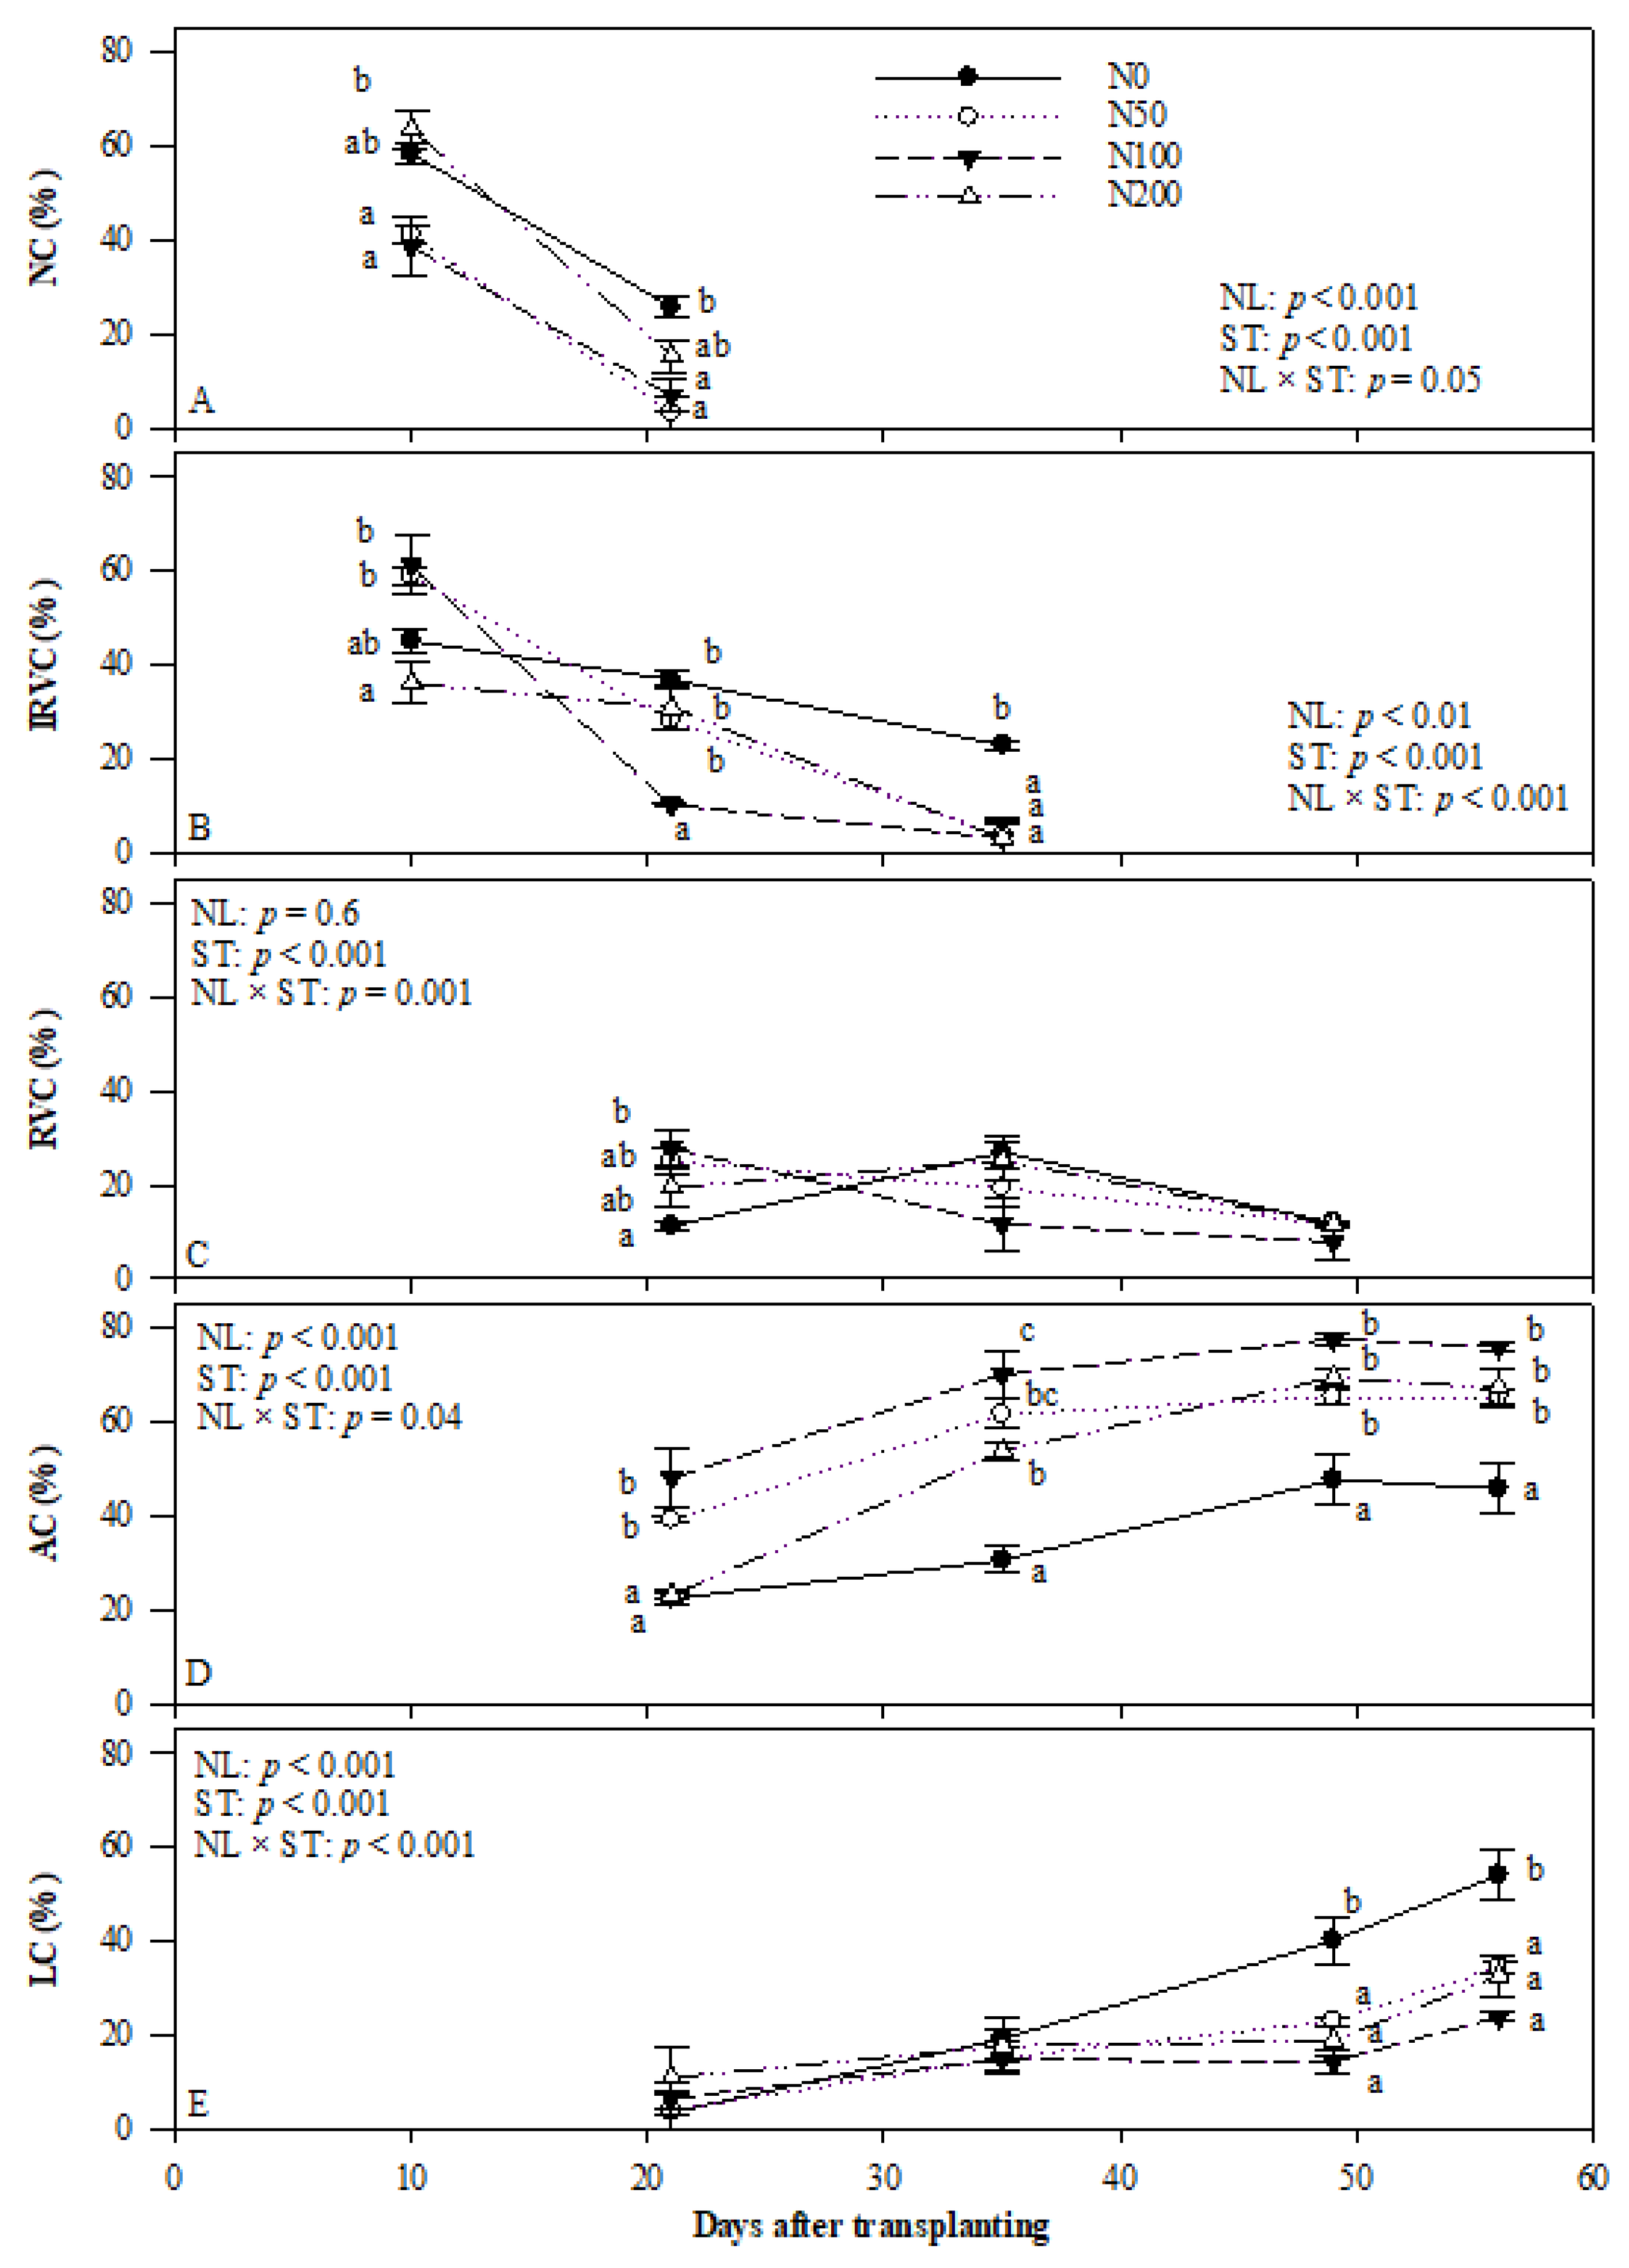
Anatomical features of developing ARs were characterised at 10, 21, 35, 49 and 56 DAT. Adventitious roots without cambium were only observed at 10 and 21 DAT, and IRVC was found in roots at 10, 21 and 35 DAT (Figure 4A,B). The activity of vascular cambium led to the formation of RVC from 21 to 49 DAT (Figure 4C). The other structures, such as AC and LC, were detected from 21 DAT until the last harvesting (Figure 4D,E). These structures appeared sequentially as a natural process of root development.
The nitrogen application levels showed a significant impact on the development of vascular cambium. In the early stage of root growth, N50 and N100 promoted cambium formation by increasing the percentage of root with IRVC development at 10 DAT (Figure 4B). In contrast, N0 and N200 treatments inhibited the initiation of vascular cambium as indicated by significantly lower rate of roots forming IRVC than other treatments. As a result, a higher rate of roots without cambium was observed in those treatments.
The distribution of roots with IRVC and RVC decreased over time (Figure 4B,C). At 10 DAT, a significantly higher rate of roots developing IRVC and RVC was observed in the N50 and N100 treatments. In the next sampling time, N50 and N100 continued to promote cambial activity as higher rates of roots with RVC and AC at 21 DAT (Figure 4C,D).
The distribution of roots with AC formation in all treatments increased until 49 DAT and then remained stable (Figure 4D). The highest percentage of roots with AC development on all sampling dates was observed in the N100 treatment while the control showed the lowest rate. AT 21 DAT, the percentage of roots observed for AC initiation in the N200 treatment was similar to that of control treatment. However, it increased sharply and showed no significant differences with other N treatments at 49 and 56 DAT. Therefore, the N200 treatment delayed the formation of AC at 21 DAT, but after that, it promoted AC development. This pattern indicated that N200 mainly suppressed the development of NC to IRVC and then RVC, but AC development was not negatively impacted. In general, N application increased the rate of roots with AC formation between 21 and 56 DAT.
There were no significant differences among treatments for the percentage of roots with more than 50% LC at 21 and 35 DAT (Figure 4E). However, a significantly higher rate of lignified root in N0 was observed at 49 and 56 DAT.
Therefore, in N0 treatment cambium, formation and development were all inhibited, and lignification was promoted since day 49. However, N50 and N100 treatments enhanced the initiation of vascular cambium and AC throughout SR formation. N200 reduced the formation of procambium during the early stage, but it started to promote the AC from day 35.
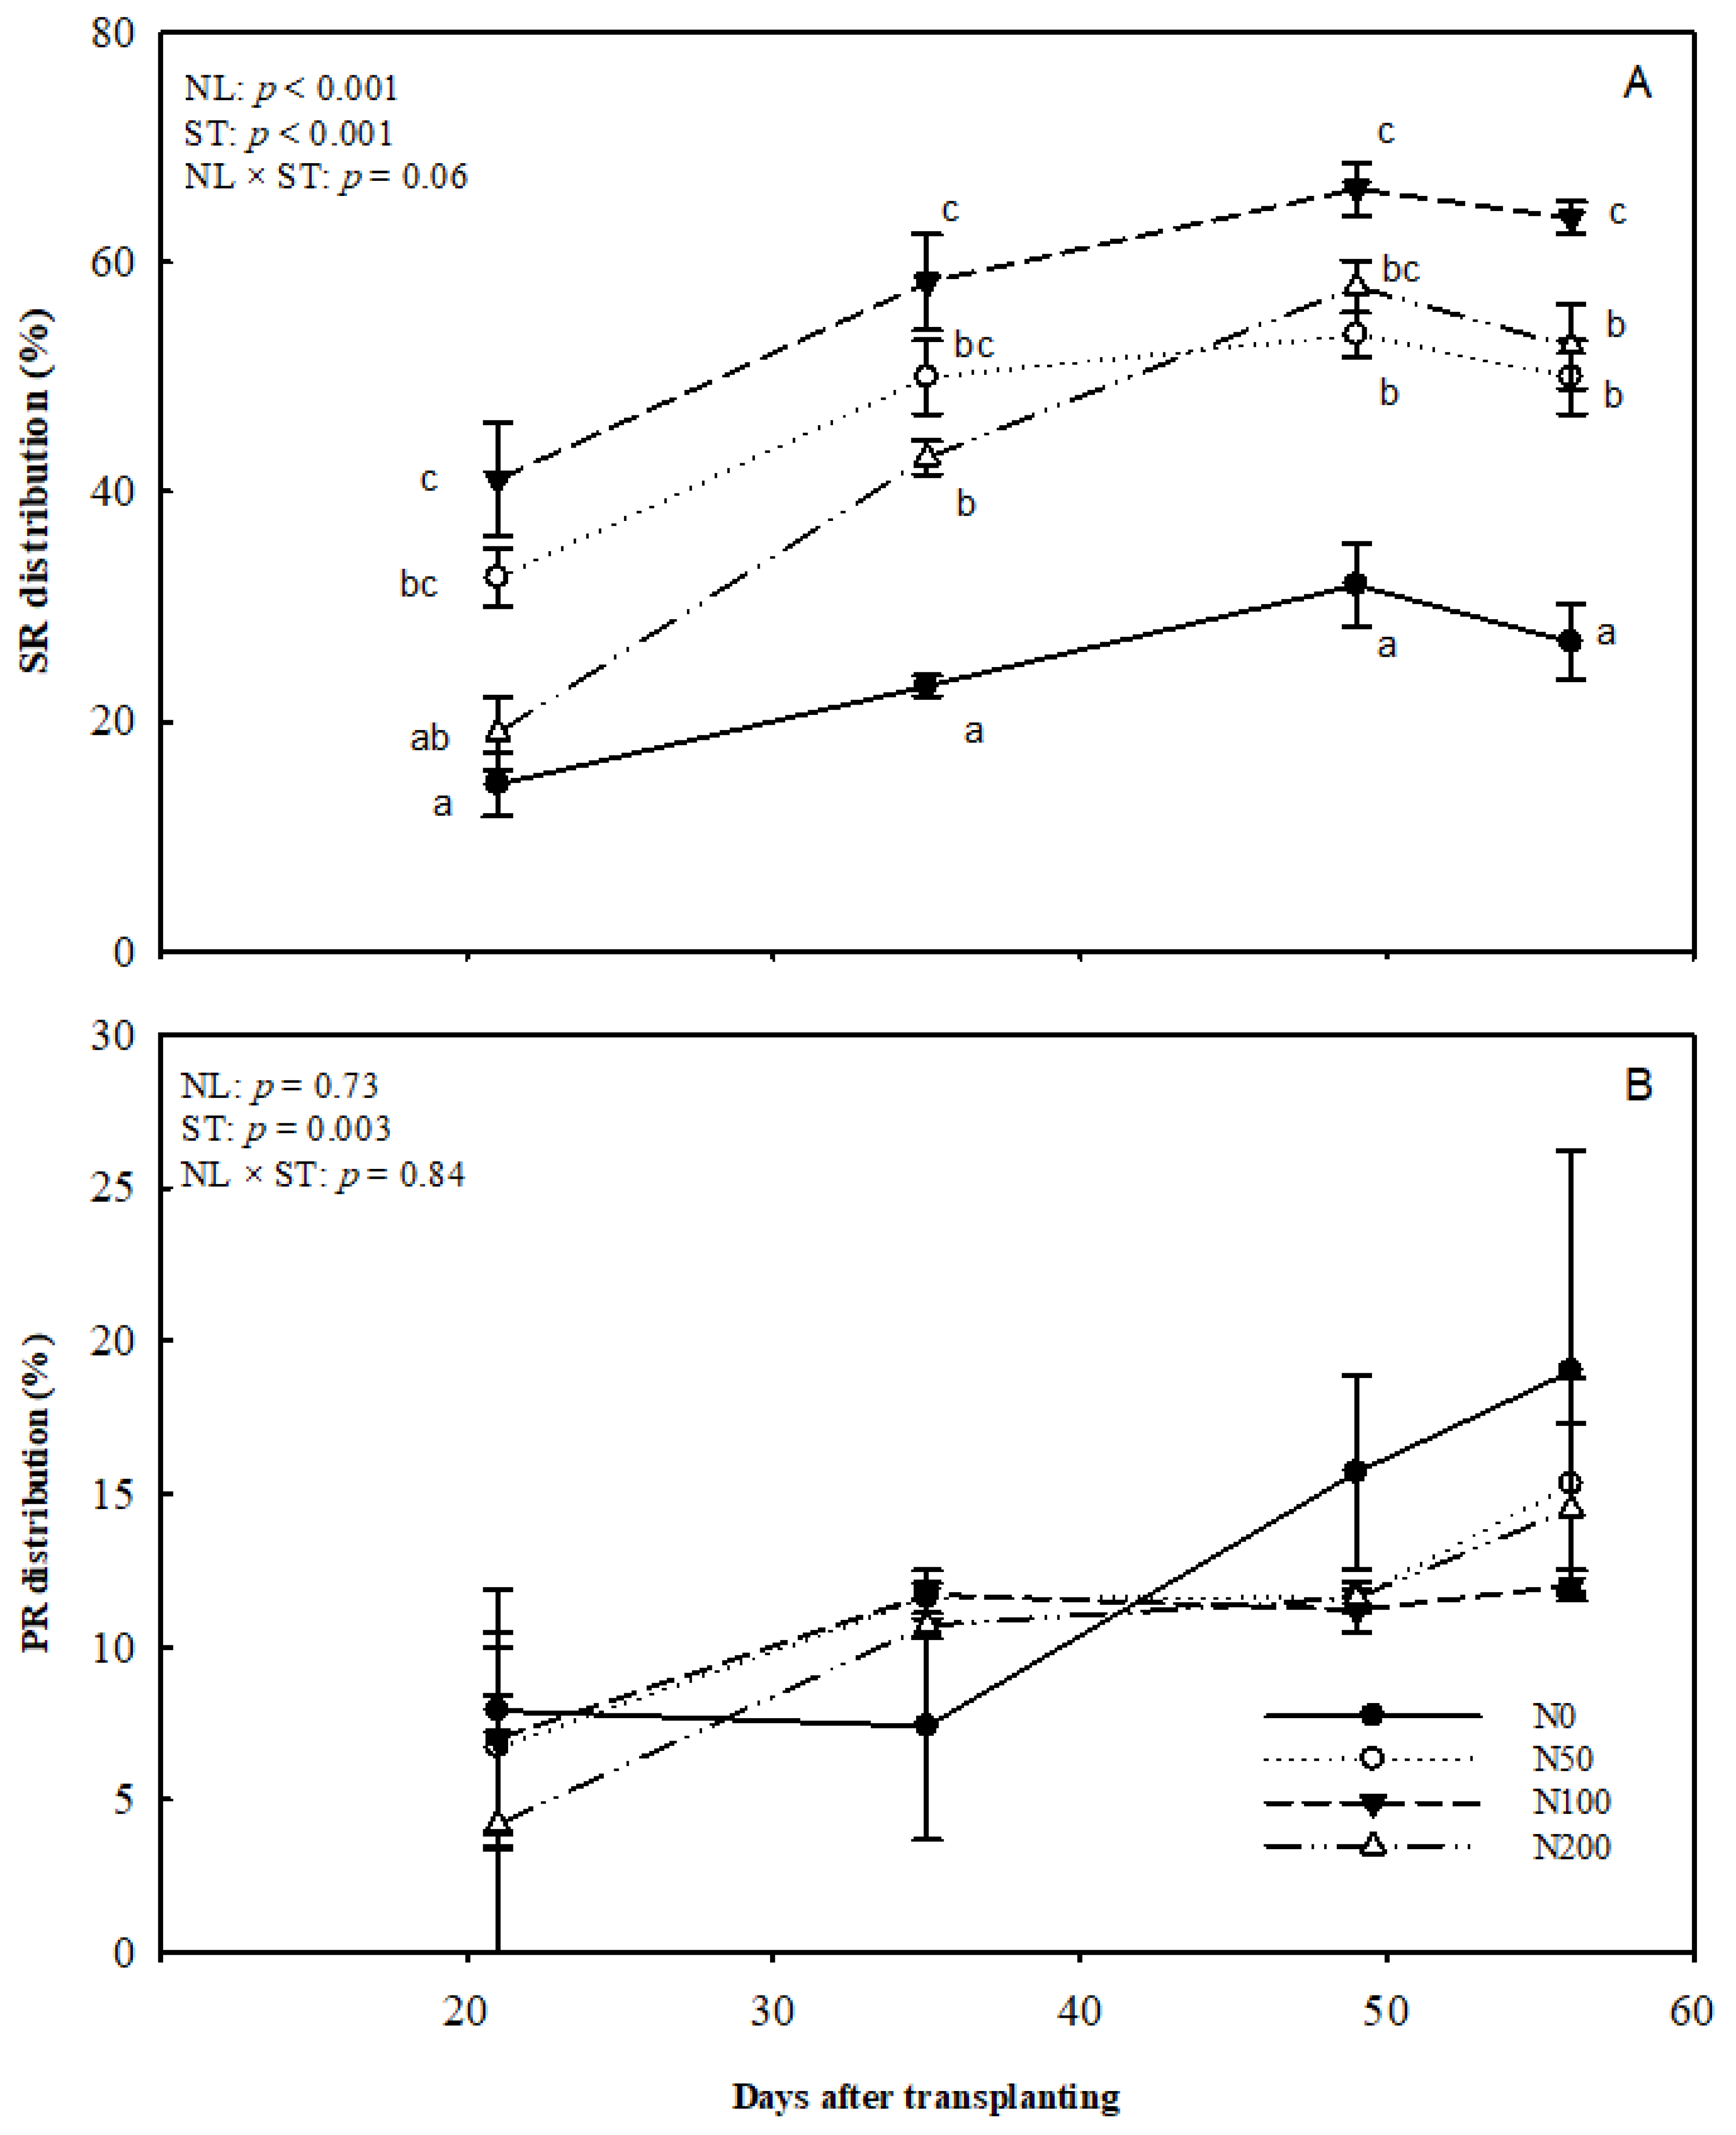
Nitrogen application levels had significant effects on the formation of SRs, with the SR rate increasing over time (Figure 5A). The N100 treatment showed the highest rate of SRs compared to other treatments, and the lowest was observed in the N0 treatment. The N200 treatment had a similar rate of SR to the N0 treatment at 21 DAT, but it increased noticeably and was significantly higher than N0 from day 35. After that, it passed above that of N50. However, the percentage of SR in the N200 treatment was still lower than that for the N100 treatment. Given that most ARs have differentiated to storage, pencil and nutrient roots, the inhibition effect of N200 on SR formation in the early stage (by 10 DAT) appears to have irreversible effects on SR number. The difference in temporal pattern across treatments was marginal statistically (p = 0.06).
The results showed that the difference in the percentage of PRs among N treatments was not statistically significant (Figure 5B). The rate of PRs increased over time and reached the highest rate at final sampling. The main effect of time on PR was significant (p = 0.003).
3.2. Root Morphology during SR Formation, Plant Performances and Fresh Weigh of Sweetpotato Tubers at 8 Weeks after Planting
In general, the total root length (RL) for the whole root system increased over time for N-added treatments, whereas N0 showed a similar trend as 35 DAT and then reduced slightly in the next two observations (Table 1). Significant differences of the total RL were observed among N treatments over the experimental period except for 10 DAT. The N0 treatment showed the lowest average root length, while the N100 and N200 treatments showed the highest average root length. Two-way ANOVA results suggested significant interactive effects of N levels and time on total RL (p < 0.001, Table 2) as the indication of statistically different root length growth trajectory among treatments. Similarly, the total RV followed a similar trend to the total RL with the figures increasing over time, and higher rates of N applications had higher RV.
The average root diameter (RD) was affected by N levels after 35 DAT (Table 2) when more SR was formed. A significant higher of RD were observed at 49 and 56 DAT on N100 and N200 treatments compared to other treatments. At the final sampling time, N200 had the highest RD (largely due to the faster growth of SRs), while N0 had the lowest. The average diameter of roots for each N treatment on different harvesting dates was significantly different.
All N-added treatments showed significantly higher growth parameters (above-ground dry weight and root dry weight) compared to N0 (Table 3). Higher levels of N had higher weights of above-ground and root biomass, as well as larger SRs. The N200 treatment had the highest SR weight at 34.8 g plant−1, although it was not statistically different from that of the N100 treatment.
3.3. Nitrogen Acquisition in Plants during SR Initiation
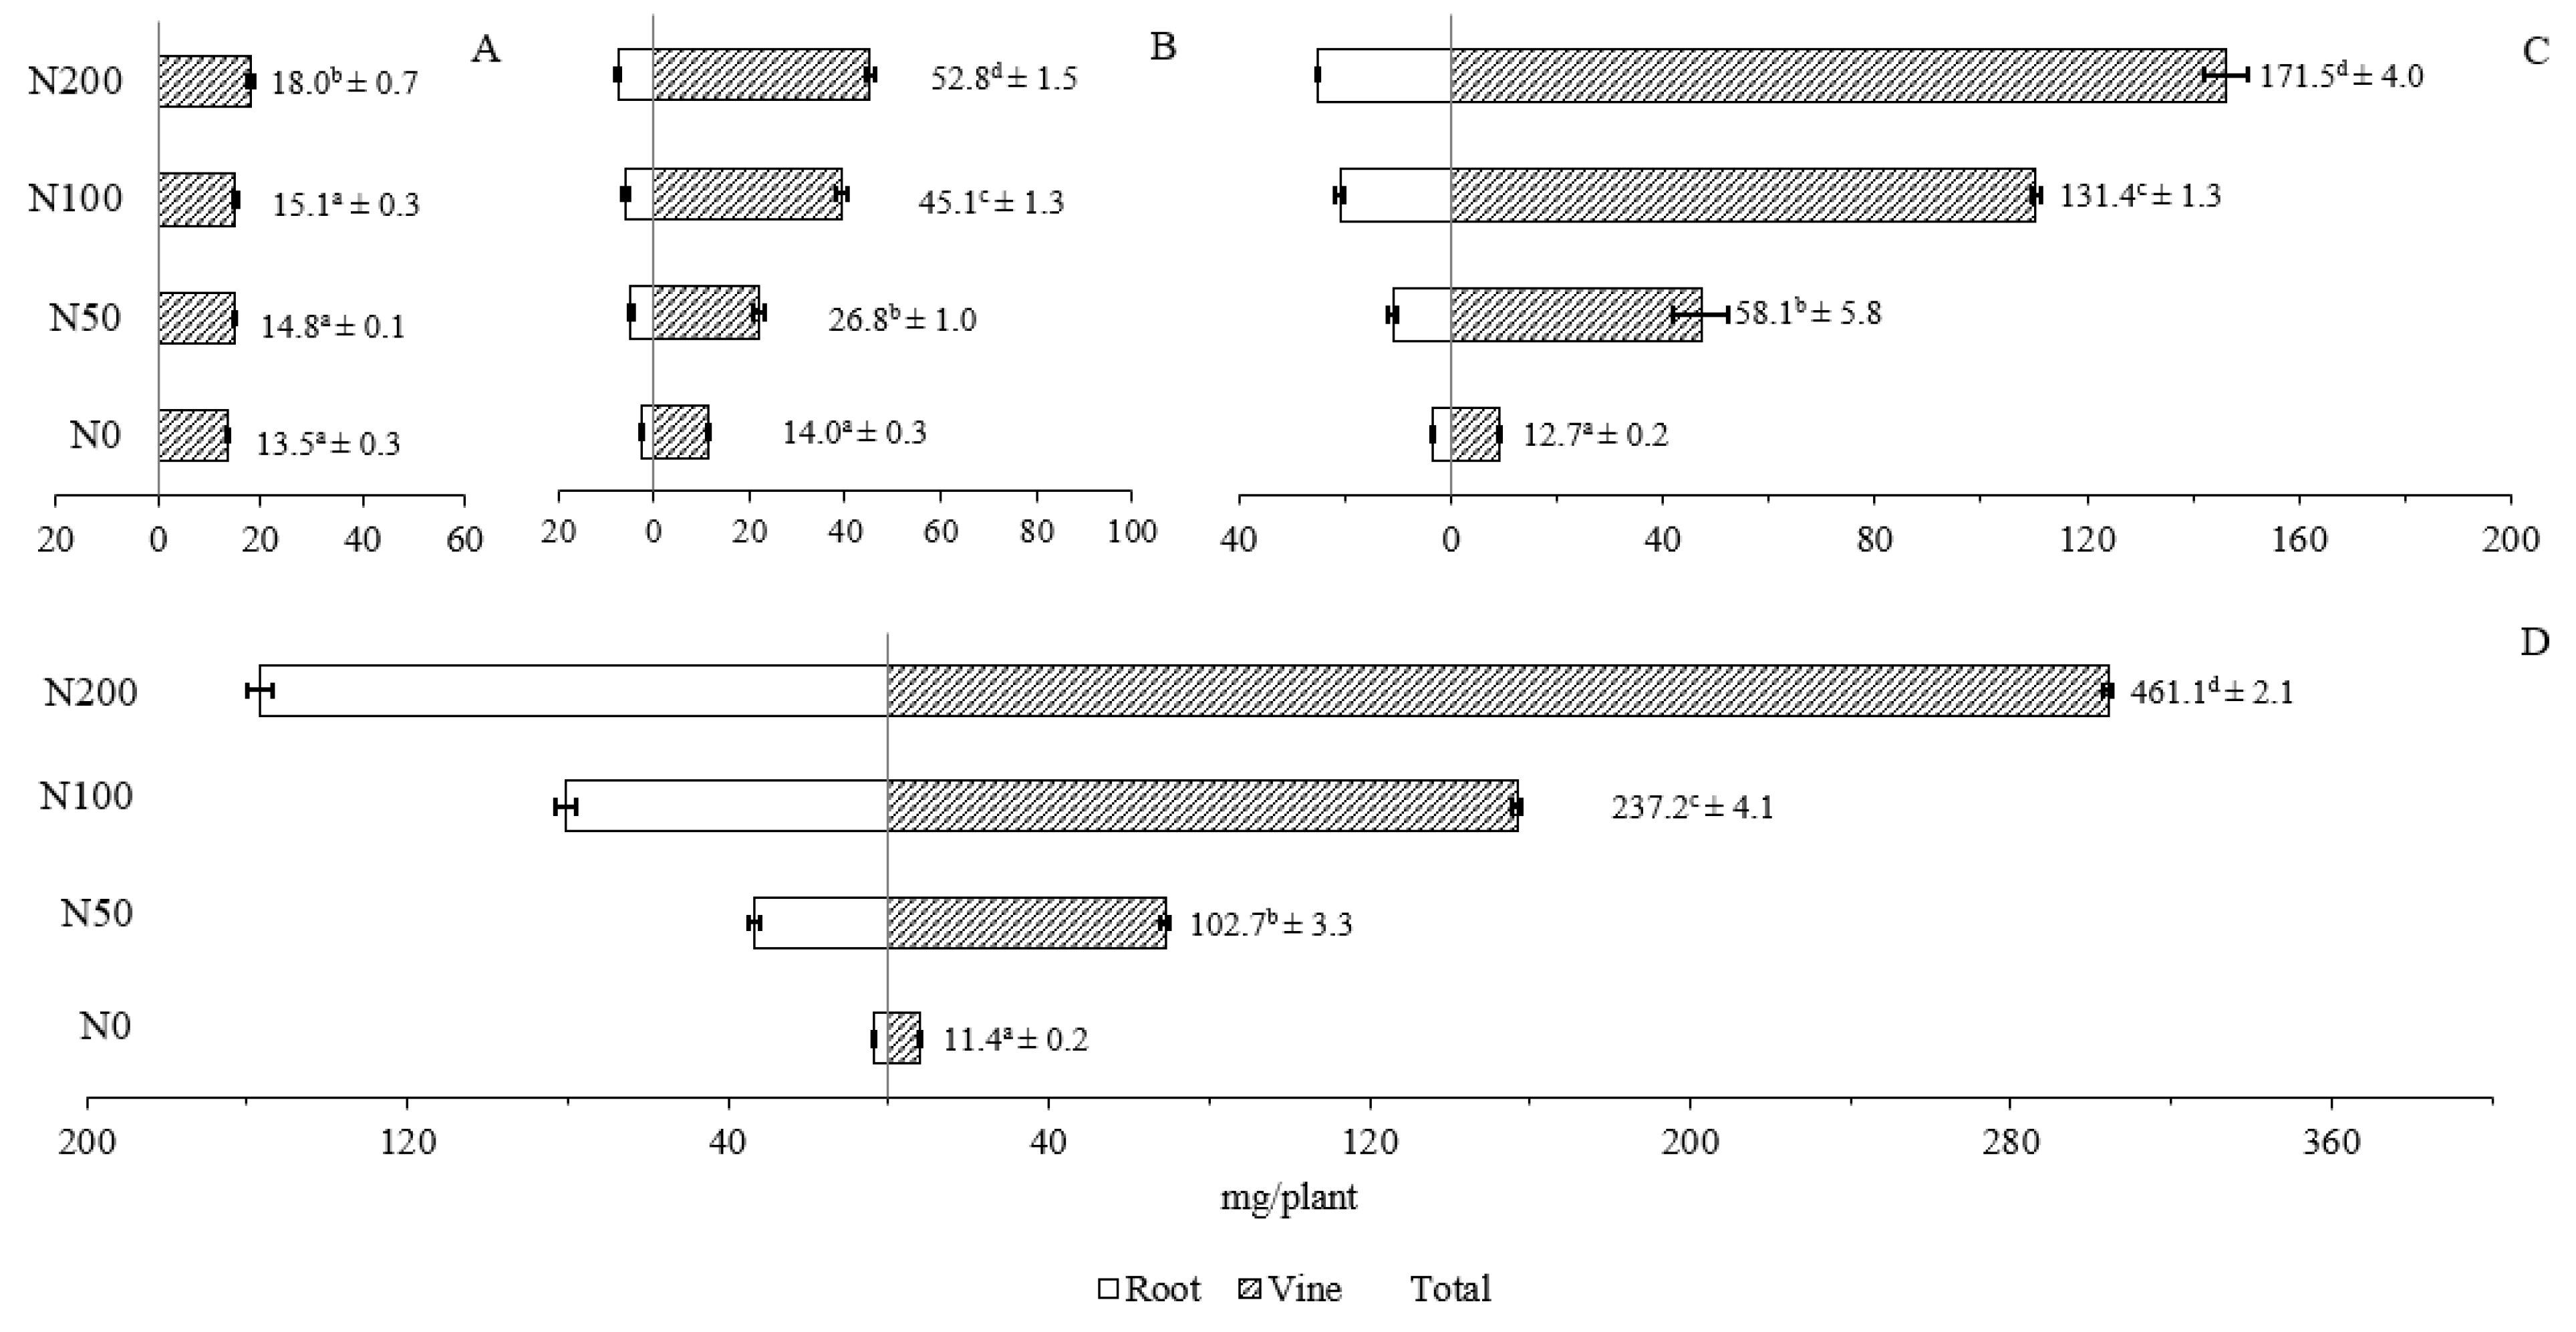
Nitrogen concentration in vines and root was statically different among treatments (p < 0.001). Overall, the concentration of N in all of the N-added treatments increased over the study period while that in the N0 treatment followed an opposite trend (Figure 6A,B). A significantly higher N acquisition in both vine and roots was observed in all N-added treatments compared to N0 on each sampling date (Figure 7).
Nitrogen supply treatments had negative or nil effects on the C:N ratio in the present experiment. N0 treatment showed an increasing trend in the C:N ratios in vines and roots during the growth period, while other treatments had different patterns (Figure 6C,D). In vines, the C:N ratio of the N50 treatment increased in the early stage from 10 to 21 DAT and then decreased until 49 DAT, while N100 and N200 treatments decreased slightly (Figure 6C). In roots, the C:N ratio of the N50 treatment decreased over the experimental period, while that of N100 and N200 treatment remained stable (Figure 6D). At 49 DAT, the N200 treatment had the lowest C:N ratios in both vines and roots. A significantly higher ratio was observed in the N100 treatment and in the N50 compared to the N200 treatment (Figure 6C,D).
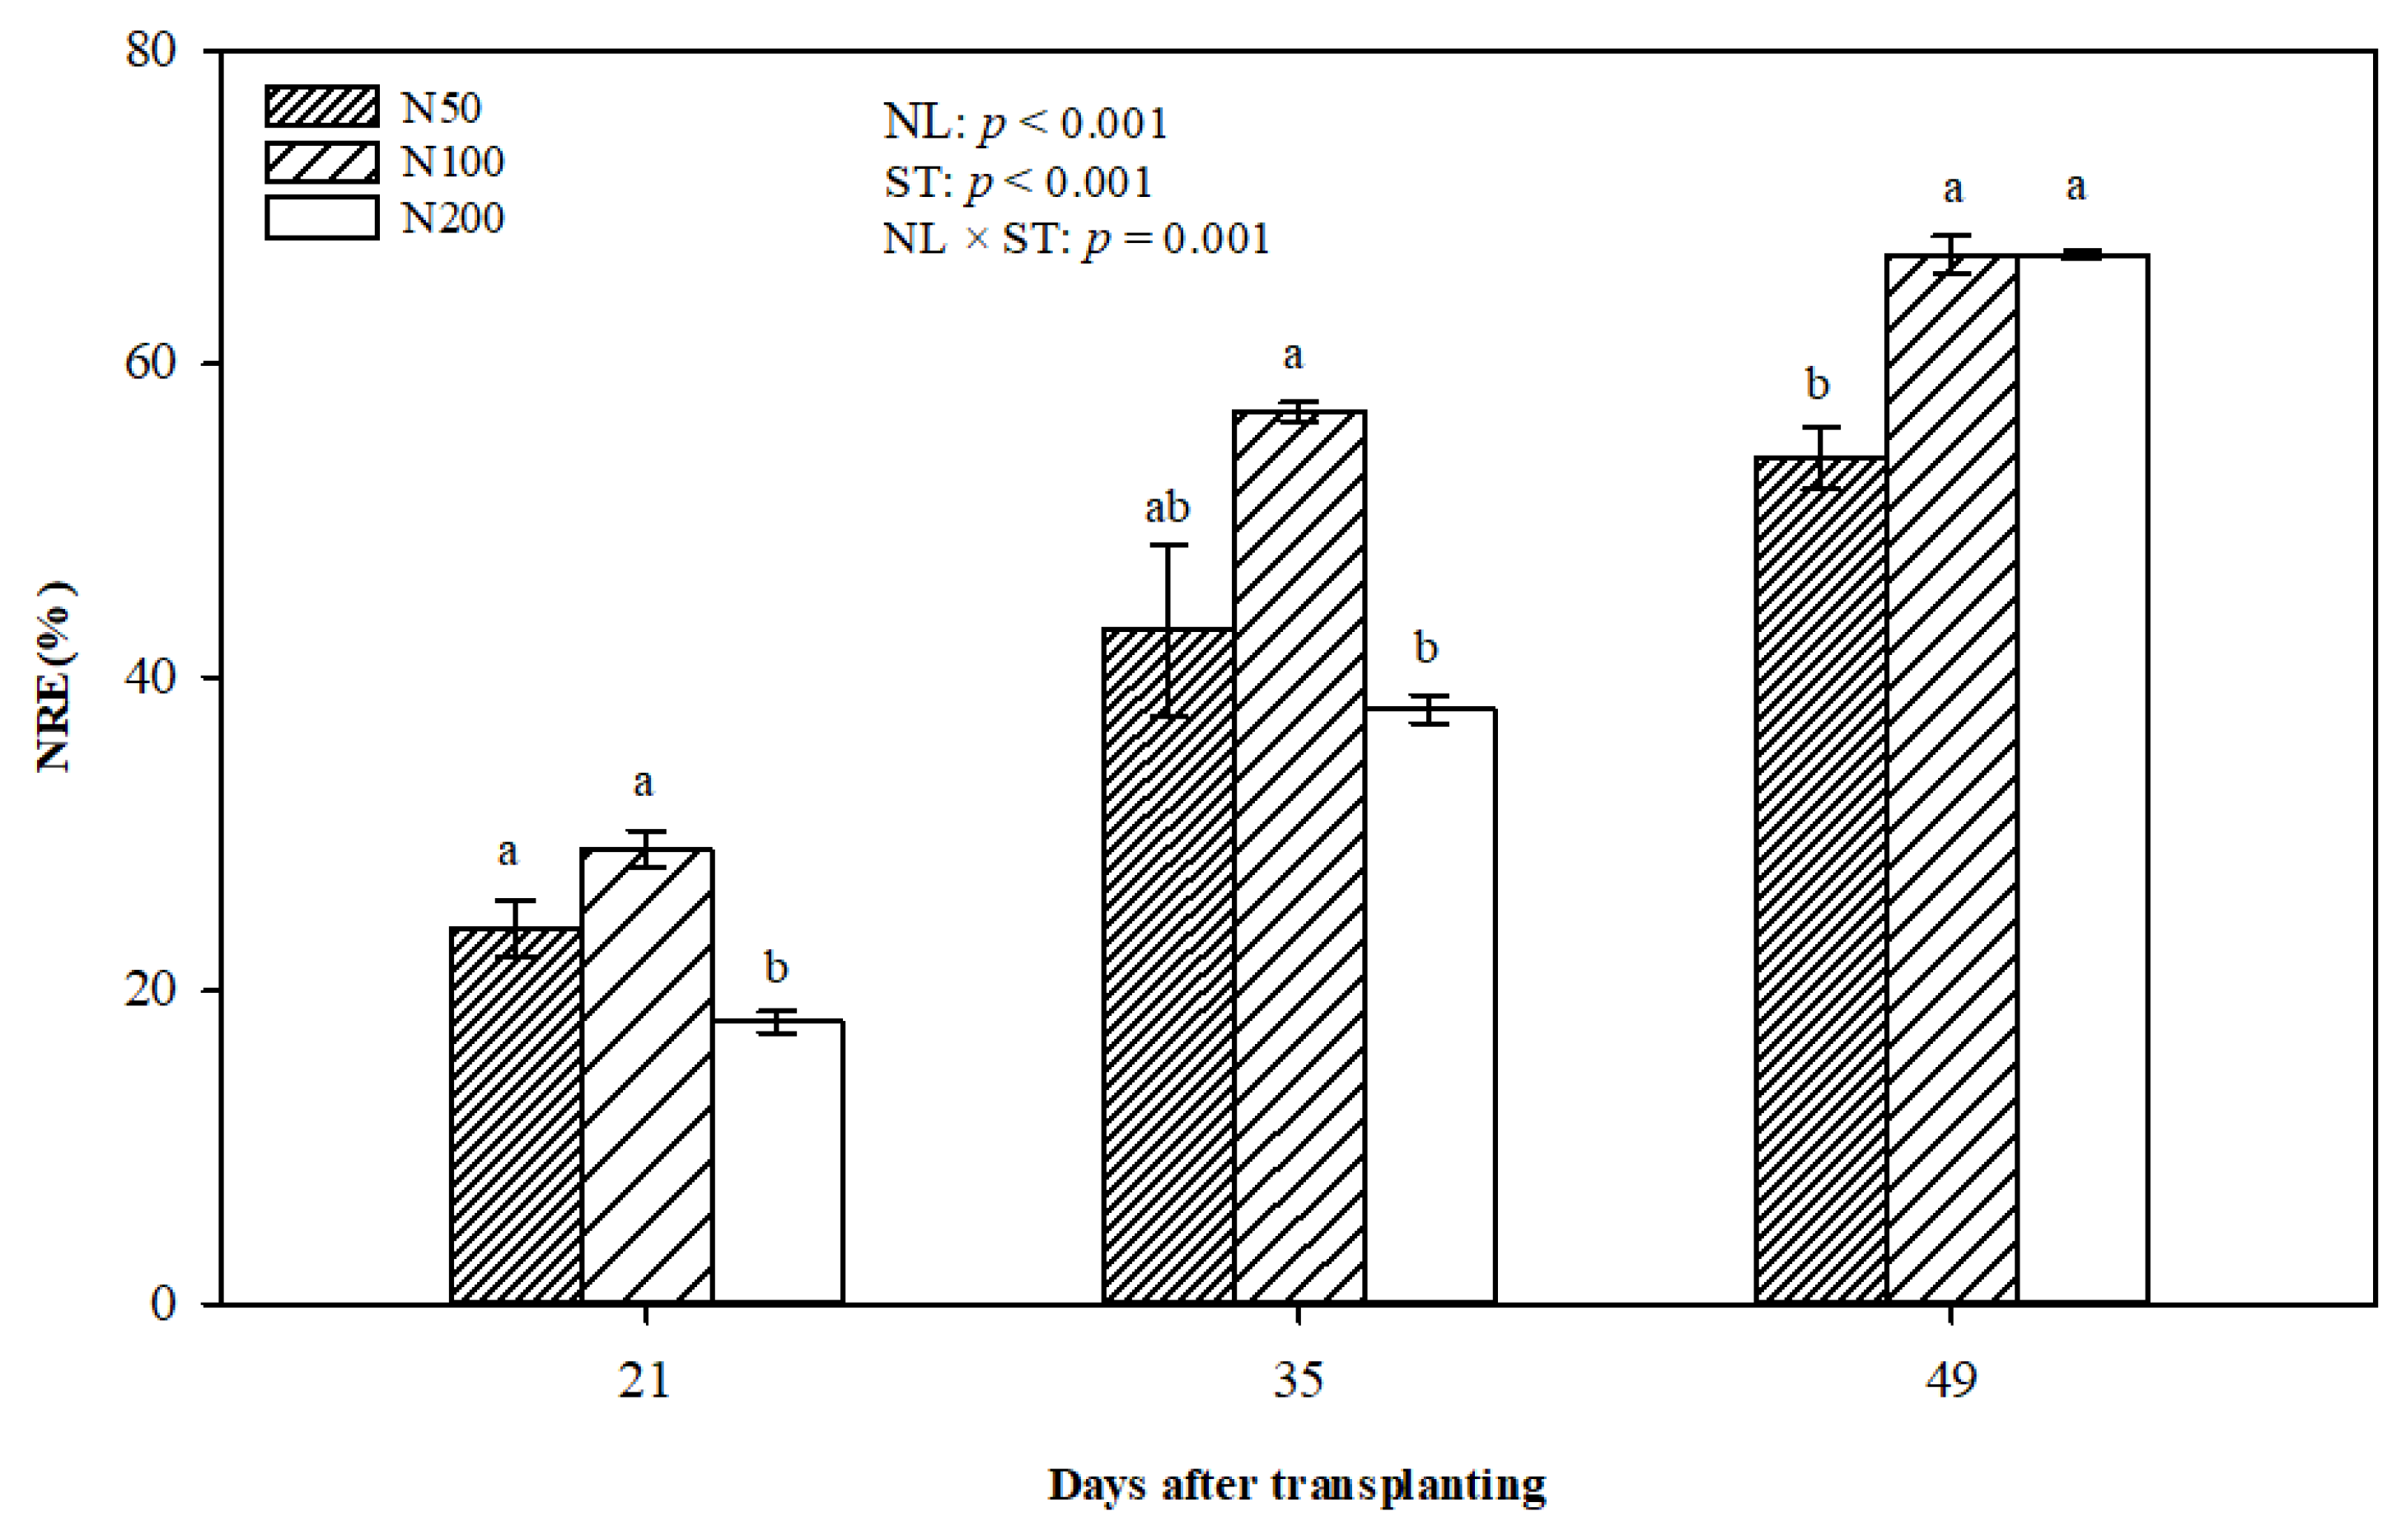
Nitrogen recovery efficiency (NRE) increased over the study period in all treatments with N (Figure 8). The N200 treatment had the lowest NRE when SRs formed (21 and 35 DAT), while N100 had the highest rate on all sampling dates. NRE in the N100 and N200 treatments were the same and were significantly higher than N50 at 49 DAT.
4. Discussions
4.1. Anatomical Root Developments
In a previous study, no difference in the number of AR was found between unfertilised and application of 50 kg N ha−1 [34], and the four nitrate levels of 1–50 mM did not affect the number of roots [35]. The number of ARs increased in the first three week and then decreased. A similar trend was reported in previous studies. The AR number in Beauregard reached a peak at 26 DAT [18]. In another study, Wilson and Lowe documented that the root count of some West Indian sweetpotato cultivars peaked at 14 to 28 DAT and subsequently decreased [19]. Our results in this study are in line with those previously mentioned. The results of the number of ARs in this experiment confirmed that that there was no effect of N levels on this parameter under our experimental conditions.
The number of protoxylem elements in sweetpotato varies between five and ten [18,19] in which 80–90% of them were a combination of pentarch and hexarch or hexarch and septarch, depending on the cultivars [18]. In this experiment, the arrangements of protoxylem elements in ‘Orleans’ ARs were mainly pentarch and hexarch and comprised 72–86% of the total ARs at 10 DAT among different treatments. This result was in line with findings in Beauregard and some West Indian cultivars [18,19].
Anatomically, the ARs first initiate the primary cambia within the parenchymatous region, separating the protoxylem from the protophloem [19]. These cambium cells are connected to form a complete cylinder of cambium which at first is irregular and then develops into a regular cylinder [19,36]. The formation of secondary xylem and phloem gradually form RVC due to the meristematic activities of the vascular cambium [18]. The secondary cambium referred to AC in this study is formed around the protoxylem elements and central cells [19,36]. The appearance of AC is the first sign of SR initiation. Our results suggest that N200 treatments inhibited cambial formation in the early stage of root initiation, with 63.7% of total roots not showing cambial development at 10 DAT. The lower levels of N treatments (N50 and N100) had a higher percentage of roots with cambium development than the others at this stage. Therefore, a low rate of N was required to promote the formation of cambium after transplanting. Furthermore, all N treatments had lower rates of the lignified roots compared to the control at 49 and 56 DAT. After that, a higher N application level appeared to be needed as the plants grew. It has been documented that excessive N application in combination with reduced aeration decreased the activity of cambium and promoted LC [22], as cambial activity is controlled by cytokinin [37], which was demonstrated to be associated with N [38,39]. The present experimental findings indicate that the moderate N supply levels promoted the initiation and development of vascular cambium and inhibited the lignification of roots.
The timing of sweetpotato SR initiation varied from 1 to 13 weeks [17]. These wide variations in SR initiation date may be caused by different experimental conditions and cultivars in these studies. The SR initiation of Orleans was observed at 21 DAT under our experimental conditions, with the appearance of AC in some roots. This is similar with the findings of Villordon et al., who stated that the SR initiation in pots was 19 and 21 DAT for Beauregard and Georgia Jet, respectively [18]. However, a previous report suggested that SR formation started at 42 DAT [40]. A recent study on Beauregard stated that SR formation in greenhouse conditions was observed at 28 DAT [3]. Excessive N application was one of factors that reduced cambium activity and promoted lignification [22]. Our results showed that at 21 DAT, the percentage of roots with AC in N50 and N100 treatments was significantly higher than that of control and N200 treatment. Then, the rate of root with AC development in all treatments increased in the next 14 days. A moderate N application is required for ARs to develop properly into SRs [41]. The maximum rate of initiated SR of Orleans in all treatments peaked at 49 DAT. In line with the present finding, Lowe and Wilson concluded that the maximum SR number was achieved during weeks 7 and 8 after transplanting for most studied cultivars except for I62 [42]. All three treated N levels had higher percentages of initiated SRs than the control. Similarly, application of N in the form of NH4+ or amide at a rate of 60 kg ha−1 significantly increased the number of SRs [43]. Our study indicated that SR initiation date for Orleans would be about 21 DAT, which was not affected by N supply levels, but it could change under different growing conditions.
According to our results, possible mechanisms related to initiation of SRs would involve an optimal rate of N that promotes the formation of cambium, resulting in the thickening of ARs. Matsumoto-Kitano et al. found that the formation of cambium in roots required cytokinin [37]. It has been reported that cytokinin levels in plants, which were reported in response to N nutrients [38,44], controlled the cambial activity [37]. Nitrogen continued to contribute to the activity of these cambial cells in repeated division to form secondary cambium and AC in SRs. Both higher N application levels and lower N supply may have reduced cambial activities, thus producing a limited number of cambium but more lignified stele cells.
4.2. Root Morphology during SR Formation, Plant Performances and Fresh Weight of Tubers at 8 Weeks after Transplanting
Nitrogen application at a rate of 50 kg N ha−1 increased the first-order lateral root and the second-order lateral root length by 78% and 2873%, respectively [34]. Our results showed that N application positively affected all root parameters of Orleans, including total RL, RD and total RV of the root systems, and SRs after 10 DAT nitrogen supplemental treatment started to affect root diameter at 49 DAT, after most SR formed. This may be due to the development of SRs, leading to higher N demand for growth. Our study also confirmed that N supply could improve root growth, and this improvement could be found after day 10 from planting. Nitrogen adding ranges from 100 to 200 mg L−1 in solution would come with more improvement in all root parameters including yield and biomass. Previous studies showed that deficient N supply inhibited the dried weight accumulation of shoots and SRs and subsequently reduced the total biomass of plants [45]. According to Okpara et al., N applied at rates from 40 to 120 kg ha−1 significantly increased dry shoot biomass weight of sweetpotato compared to unfertilised crops [46].
Similarly, Kelm et al. indicated that the application rates of N from 0.4 to 2 g pot−1 increased SR yield of both studied cultivars [47]. In addition, in another experiment, dry-biomass of SRs in a glasshouse increased with increasing N supply from 30 to 230 kg ha−1 [3]. In field conditions, N application at 75 kg ha−1 significantly increased the SR yield, while a higher level at 150 kg N ha−1 had no effect [9]. Hence, the present experiment confirmed the roles of N in producing sweetpotato productivity.
Although high level of N inhibited the formation of SRs in the early stage, it is necessary for the growth of SRs after they are formed. This can be explained by the requirement of N at different developmental stages of sweetpotato. A recent study by Taranet et al. reported that the application of N at 0–230 kg ha−1 had no effect on SR biomass during the first six weeks after transplanting [3]. After that, the treatments with high N application rates (130–260 kg ha−1) showed a rapid increase in the dry SR yield during weeks 6 and 12 after transplanting. Another study in sandy loam soil reported that application of N at either 75 or 150 kg ha−1 reduced the SR number compared to unfertilised crop, but it significantly improved the SR yield of Jishu25 cultivar [9]. Therefore, a moderate level of soil-available N promoted the initiation of SRs. However, SR development required more N, as the higher rate applications improved the SR yield.
4.3. Nitrogen Acquisition in Sweetpotato Plants
Results from this study showed that N application levels influenced the acquisition of N in sweetpotato. In a previous study, application of N at 2, 8 and 14 mg L−1 of nitrate positively increased the acquisition of N in plants [48]. In that study, the N content in the plants treated with 2 mM NO3− was 48 mmol plant−1 while that of the treatment with 14 mM NO3− was 142 mmol plant−1, which was almost three times the difference. Furthermore, in the same experimental conditions, there were differences in the N acquisition among cultivars. Villargarcia et al. observed that with the same supplemental level of N, the Jewel cultivar had a lower N content in plants than MD810 [47]. In another study, deficient N conditions reduced the amount of N accumulated in shoots, roots and SRs of sweetpotato [44]. Therefore, increasing N application rates increased N acquisition, while deficient N application reduced the accumulation of N in plants.
There was an increase in the NRE of Orleans over time, and the N200 treatment had lower values of NRE at 21 and 35 DAT. This confirms that plants did not require much N during the early stage and the amount of N applied could not be efficiently used. In a previous study on two sweetpotato cultivars, Villargarcia et al. suggested that low rates of N application resulted in higher NRE and that the utilisation of N increased over the study period [48]. In a different study, N application levels were negatively related to NRE of wheat [49]. However, NRE of N200 increased at 49 DAT, and N100 and N200 had a similar rate of NRE. A possible reason for this would be that SR developed in a fast growth stage with higher N demand.
Results from our study suggested that sweetpotato required adequate N levels to form SRs. The formation and division of cambial cells into ARs were strongly affected by N supply. Deficient N or a high rate of N inhibited the formation of cambium during SR formation. After that, a high rate of N was likely to improve the SR development. Therefore, moderate N supply levels should be maintained in the soil for a few weeks (5–7 weeks for Orleans cultivar under our experimental conditions) to promote the formation of the most SRs before further application of N fertiliser to boost SR growth. Appling high rates of N fertiliser before or immediately after planting should be avoided because the initiation of SR could be suppressed, and the fertiliser use efficiency will remain low.
5. Conclusions
Our study found that N application levels were associated with cambium development in ARs, which is related to SR initiation of sweetpotato. Application of N at 100 mg L−1 significantly promoted the formation of cambium in young sweetpotato ARs and improved the percentage of initiated SRs. The N100 treatment demonstrated the highest percentage of root with cambium development in the earliest observation and the highest percentage of initiated SRs between 21 and 56 DAT. The N200 treatment inhibited the formation of cambium in the early-stage development of ARs and delayed AC development at 21 DAT. Although the rate of SR formation of the N200 treatment caught up with that of other N treatments from 35 to 49 DAT, it was still significantly lower than that of N100, and this effect is irreversible after most ARs differentiate, suggesting that excessive N application during planting could lead to irreversible negative effects on SR number. However, the highest storage roots growth was observed in the N200 treatment since day 49, despite a lower SR number than in N100. In addition, NRE in N200 was at its lowest at 21 and 35 DAT but was highest at 49 DAT. Insufficient N supply reduced the cambial initiation during the first 10 DAT and suppressed the formation of AC after that, resulting in fewer SR formations. Therefore, sweetpotato cultivar Orleans required different amounts of N supplement for optimal SR formation during certain growing periods after planting. Our study suggests that moderate soil-available N should be maintained for about five weeks to promote the formation of an adequate number of storage roots before further N fertilisation is applied to boost SR growth.
Author Contributions
Conceptualization, H.T.D., Y.L., C.H., P.B. and C.-Y.X.; methodology, H.T.D. and C.-Y.X.; validation, H.T.D. and C.-Y.X.; formal analysis, H.T.D.; investigation, H.T.D.; resources, Y.L.; data curation, H.T.D.; writing—original draft preparation, H.T.D.; writing—review and editing, Y.L., C.H., P.B. and C.-Y.X.; visualization, C.-Y.X.; supervision, C.-Y.X.; project administration, H.T.D.; funding acquisition, H.T.D. and C.-Y.X. All authors have read and agreed to the published version of the manuscript.
Funding
This research was supported by the Central Queensland University and Australian Research Training Program (RTP) scholarship. The APC was funded by Central Queensland University.
Institutional Review Board Statement
Not applicable.
Informed Consent Statement
Not applicable.
Data Availability Statement
Not applicable.
Acknowledgments
The authors would like to thank Professor Arthur Villordon of the LSU Agricultural Center, LA, USA, for assisting with the anatomical root study of this project. We thank the Queensland Department of Agriculture and Fisheries, Bundaberg Research Facility, for providing a greenhouse facility and staff support during the experiment.
Conflicts of Interest
The authors declare no conflict of interest.
References
- Atkinson, C.J.; Fitzgerald, J.D.; Hipps, N.A. Potential mechanisms for achieving agricultural benefits from biochar application to temperate soils: A review. Plant Soil 2010, 337, 1–18. [Google Scholar] [CrossRef]
- Bai, S.H.; Blumfield, T.J.; Xu, Z.; Chen, C.; Wild, C. Soil organic matter dynamics and nitrogen availability in response to site preparation and management during revegetation in tropical Central Queensland, Australia. J. Soils Sediments 2012, 12, 386–395. [Google Scholar] [CrossRef] [Green Version]
- Taranet, P.; Harper, S.; Kirchhof, G.; Fujinuma, R.; Menzies, N. Growth and yield response of glasshouse-and field-grown sweetpotato to nitrogen supply. Nutr. Cycl. Agroecosyst. 2017, 108, 309–321. [Google Scholar] [CrossRef]
- Ali, A.; Choudhry, M.A.; Malik, M.A.; Ahmad, R. Effect of various doses of nitrogen on the growth and yield of two wheat (Triticum aestivum L.) cultivars. Pak. J. Biol. Sci. 2000, 3, 1004–1005. [Google Scholar] [CrossRef] [Green Version]
- Malik, T.H.; Lal, S.B.; Wani, N.R.; Amin, D.; Wani, R.A. Effect of different levels of nitrogen on growth and yield attributes of different varieties of basmati rice (Oryzasativa L.). Int. J. Sci. Technol. Res. 2014, 3, 444–448. [Google Scholar]
- Nadeem, M.A.; Ali, A.; Tahir, M.; Naeem, M.; Chadhar, A.; Ahmad, S. Effect of nitrogen levels and plant spacing on growth and yield of cotton. Pak. J. Life Soc. Sci. 2010, 8, 121–124. [Google Scholar]
- Banjare, S.; Sharma, G.; Verma, S. Potato crop growth and yield response to different levels of nitrogen under Chhattisgarh plains agro-climatic zone. Indian J. Sci. Technol. 2014, 7, 1504. [Google Scholar] [CrossRef]
- Thummanatsakun, V.; Yampracha, S. Effects of interaction between nitrogen and potassium on the growth and yield of cassava. Int. J. Agric. Tech 2018, 14, 2137–2150. [Google Scholar]
- Duan, W.; Zhang, H.; Xie, B.; Wang, B.; Zhang, L. Impacts of nitrogen fertilization rate on the root yield, starch yield and starch physicochemical properties of the sweet potato cultivar Jishu 25. PLoS ONE 2019, 14, e0221351. [Google Scholar] [CrossRef] [Green Version]
- Badr, M.; El-Tohamy, W.; Zaghloul, A. Yield and water use efficiency of potato grown under different irrigation and nitrogen levels in an arid region. Agric. Water Manag. 2012, 110, 9–15. [Google Scholar] [CrossRef]
- Hill, W.A. Effect of nitrogen nutrition on quality of three important root/tuber crops. In Nitrogen in Crop Production; Library of Congress: Washington, WA, USA, 1984; pp. 627–641. [Google Scholar] [CrossRef]
- ASPG. Australian Sweetpotato Industry. Available online: http://www.aspg.com.au/sweetpotato-industry/ (accessed on 10 February 2021).
- Prabawardani, S.; Suparno, A. Water use efficiency and yield of sweetpotato as affected by nitrogen and potassium application. European J. Agric. Sci. 2015, 7, 260–268. [Google Scholar] [CrossRef] [Green Version]
- Nedunchezhiyan, M.; Byju, G.; Jata, S.K. Sweet potato agronomy. Fruit Veg. Cereal Sci. Biotechnol. 2012, 6, 1–10. [Google Scholar]
- Arnold, T.F.; Smith, T.P.; Villordon, A.Q. Improving sweet potato production efficiency. La. Agric. 2013, 56, 14–15. [Google Scholar]
- Desai, D.P. Understanding the genetic basic of storage root formation along with starch and betaacarotene biosynthesis and their inter-relation in sweetpotato. PhD Thesis, University of Natural Resources and Life Sciences, Vienna, Austria, 2008. [Google Scholar]
- Ravi, V.; Indira, P. Crop physiology of sweetpotato. Hortic. Rev. 1999, 23, 277–339. [Google Scholar]
- Villordon, A.Q.; LaBonte, D.R.; Firon, N.; Kfir, Y.; Pressman, E.; Schwartz, A. Characterization of adventitious root development in sweetpotato. HortScience 2009, 44, 651–655. [Google Scholar] [CrossRef]
- Wilson, L.; Lowe, S. The anatomy of the root system in West Indian sweet potato (Ipomoea batatas (L.) Lam.) cultivars. Ann. Bot. 1973, 37, 633–643. [Google Scholar] [CrossRef]
- Gajanayake, B.; Raja Reddy, K.; Shankle, M.W.; Arancibia, R.A.; Villordon, A.O.; Arancibia, R.A.; Shankle, M.W. Quantifying storage root initiation, growth, and developmental responses of sweetpotato to early season temperature. Agron. J. 2014, 106, 1795–1804. [Google Scholar] [CrossRef]
- Ma, J.; Aloni, R.; Villordon, A.; Labonte, D.; Kfir, Y.; Zemach, H.; Schwartz, A.; Althan, L.; Firon, N. Adventitious root primordia formation and development in stem nodes of ‘Georgia Jet’sweetpotato, Ipomoea batatas. Am. J. Bot. 2015, 102, 1040–1049. [Google Scholar] [CrossRef]
- Togari, Y. A study on tuberous root formation in sweet potatoes. Bull. Natl. Agric. Exp. Stn. 1950, 68, 1–96. [Google Scholar]
- Wilson, L.A. Effect of different levels of nitrate-nitrogen supply on early tuber growth of two sweet potato cultivars. Trop. Agr. St. Augustine 1973, 50, 53–54. [Google Scholar]
- Acock, M.C.; Garner, J.O. Effect of fertiliser and watering methods on growth and yields of pot-grown sweet potato genotypes. HortScience 1984, 19, 687–689. [Google Scholar]
- Si, C.; Shi, C.; Liu, H.; Zhan, X.; Liu, Y.; Wang, D.; Meng, D.; Tang, L. Influence of Two Nitrogen Forms on Hormone Metabolism in Potential Storage Roots and Storage Root Number of Sweetpotato. Crop Sci. 2018, 181, 419–428. [Google Scholar] [CrossRef]
- La Bonte, D.R.; Clark, C.A.; Smith, T.P.; Villordon, A.Q. ‘Orleans’ sweetpotato. HortScience 2012, 47, 1817–1818. [Google Scholar] [CrossRef]
- Hoagland, D.R.; Arnon, D.I. The Water-Culture Method for Growing Plants without Soil. Circular. Calif. Agric. Exp. Stn. 1950, 347, 32. [Google Scholar]
- Eguchi, T.; Yoshinaga, M. Effect of application of sucrose and cytokinin to roots on the formation of tuberous roots in sweetpotato (Ipomoea batatas L. Lam). Plant Roots 2008, 2, 7–13. [Google Scholar] [CrossRef] [Green Version]
- O’Brien, T.P.; McCully, M.E. The Study of Plant Structure: Principles and Selected Methods; Termarcarphi Pty: Wantirna, VIC, Australia, 1981; p. 352. [Google Scholar]
- Dong, H.T.; Li, Y.; Brown, P.; Xu, C.-Y. Early nitrogen applications promote the initiation of sweetpotato storage roots. J. Agric. Sci. 2022, 14, 19–38. [Google Scholar] [CrossRef]
- Kays, S.J. The physiology of yield in the sweet potato. In Sweetpotato Products: A Natural Resource for the Tropic; Bouwkamp, J.C., Ed.; CRC Press: Boca Raton, FL, USA, 1985. [Google Scholar]
- Maness, N. Extraction and analysis of soluble carbohydrates. In Plant Stress Tolerance; Sunkar, R., Ed.; Springer: New York, NY, USA, 2010; pp. 341–370. [Google Scholar]
- Zvomuya, F.; Rosen, C.J.; Russelle, M.P.; Gupta, S.C. Nitrate leaching and nitrogen recovery following application of polyolefin-coated urea to potato. J. Environ. Qual. 2003, 32, 480–489. [Google Scholar] [CrossRef]
- Villordon, A.; La Bonte, D.; Firon, N.; Carey, E. Variation in nitrogen rate and local availability alter root architecture attributes at the onset of storage root initiation in ‘Beauregard’ sweetpotato. HortScience 2013, 48, 808–815. [Google Scholar] [CrossRef] [Green Version]
- Kim, S.-H.; Mizuno, K.; Sawada, S.; Fujimura, T. Regulation of tuber formation and ADP-glucose pyrophosphorylase (AGPase) in sweet potato (Ipomoea batatas (L.) Lam.) by nitrate. Plant Growth Regul. 2002, 37, 207–213. [Google Scholar] [CrossRef]
- Artschwager, E. On the anatomy of the sweet potato root, with notes on internal breakdown. J. Agric. Res. 1924, 27, 157–166. [Google Scholar]
- Matsumoto-Kitano, M.; Kusumoto, T.; Tarkowski, P.; Kinoshita-Tsujimura, K.; Václavíková, K.; Miyawaki, K.; Kakimoto, T. Cytokinins are central regulators of cambial activity. Proc. Natl. Acad. Sci. USA 2008, 105, 20027–20031. [Google Scholar] [CrossRef] [PubMed] [Green Version]
- Samuelson, M.E.; Eliasson, L.; Larsson, C.-M. Nitrate-regulated growth and cytokinin responses in seminal roots of barley. Plant Physiol. 1992, 98, 309–315. [Google Scholar] [CrossRef] [PubMed] [Green Version]
- Sattelmacher, B.; Marschner, H. Nitrogen nutrition and cytokinin activity in Solanum tuberosum. Physiol. Plant. 1978, 42, 185–189. [Google Scholar] [CrossRef]
- Onwueme, I.C. The Tropical Tuber Crops: Yams, Cassava, Sweet Potato, and Cocoyams; John Wiley and Sons: Chichester, UK, 1978. [Google Scholar]
- Meyers, S.L.; Arancibia, R.A.; Shankle, M.W.; Main, J.; Gajanayake, B.R.K.R. Sweetpotato Storage Root Initiation. Available online: http://extension.msstate.edu/publications/sweetpotato-storage-root-initiation (accessed on 10 February 2021).
- Lowe, S.; Wilson, L. Comparative analysis of tuber development in six sweet potato (Ipomoea batatas (L.) Lam) cultivars 1. Tuber initiation, tuber growth and partition of assimilate. Ann. Bot. 1974, 38, 307–317. [Google Scholar] [CrossRef]
- Si, C.; Shi, C.; Liu, H.; Zhan, X.; Liu, Y. Effects of nitrogen forms on carbohydrate metabolism and storage-root formation of sweet potato. J. Plant Nutr. Soil Sci. 2018, 181, 419–428. [Google Scholar] [CrossRef] [Green Version]
- Salama, A.M.; Wareing, P.F. Effects of mineral nutrition on endogenous cytokinins in plants of sunflower (Helianthus annuus L.). J. Exp. Bot. 1979, 30, 971–981. [Google Scholar] [CrossRef]
- Osaki, M.; Ueda, H.; Shinano, T.; Matsui, H.; Tadano, T. Accumulation of carbon and nitrogen compounds in sweet potato plants grown under deficiency of N, P, or K nutrients. Soil Sci. 1995, 41, 557–566. [Google Scholar] [CrossRef]
- Okpara, D.A.; Okon, O.E.; Ekeleme, F. Optimizing nitrogen fertilization for production of white and orange-fleshed sweet potato in Southeast Nigeria. J. Plant Nutr. 2009, 32, 878–891. [Google Scholar] [CrossRef]
- Kelm, M.; Brück, H.; Hermann, M.; Sattelmacher, B. The effect of low nitrogen supply on yield and water-use efficiency of sweet potato (Ipomoea batatas L.). In Plant Nutrition; Springer: Berlin/Heidelberg, Germany, 2001; pp. 402–403. [Google Scholar]
- Villagarcia, M.R.; Collins, W.W.; Raper, C.D.J. Nitrate uptake and nitrogen use efficiency of tow sweetpotato genotypes during early stage of storage root formation. J. Am. Soc. Hortic. Sci. 1998, 123, 814–820. [Google Scholar] [CrossRef] [Green Version]
- Haile, D.; Nigussie, D.; Ayana, A. Nitrogen use efficiency of bread wheat: Effects of nitrogen rate and time of application. J. Soil Sci. Nutr. 2012, 12, 389–410. [Google Scholar]
Figure 1.
Distribution of protoxylem poles in Orleans AR at 10 DAT; the error bars indicate the standard error of the mean value.
Figure 1.
Distribution of protoxylem poles in Orleans AR at 10 DAT; the error bars indicate the standard error of the mean value.

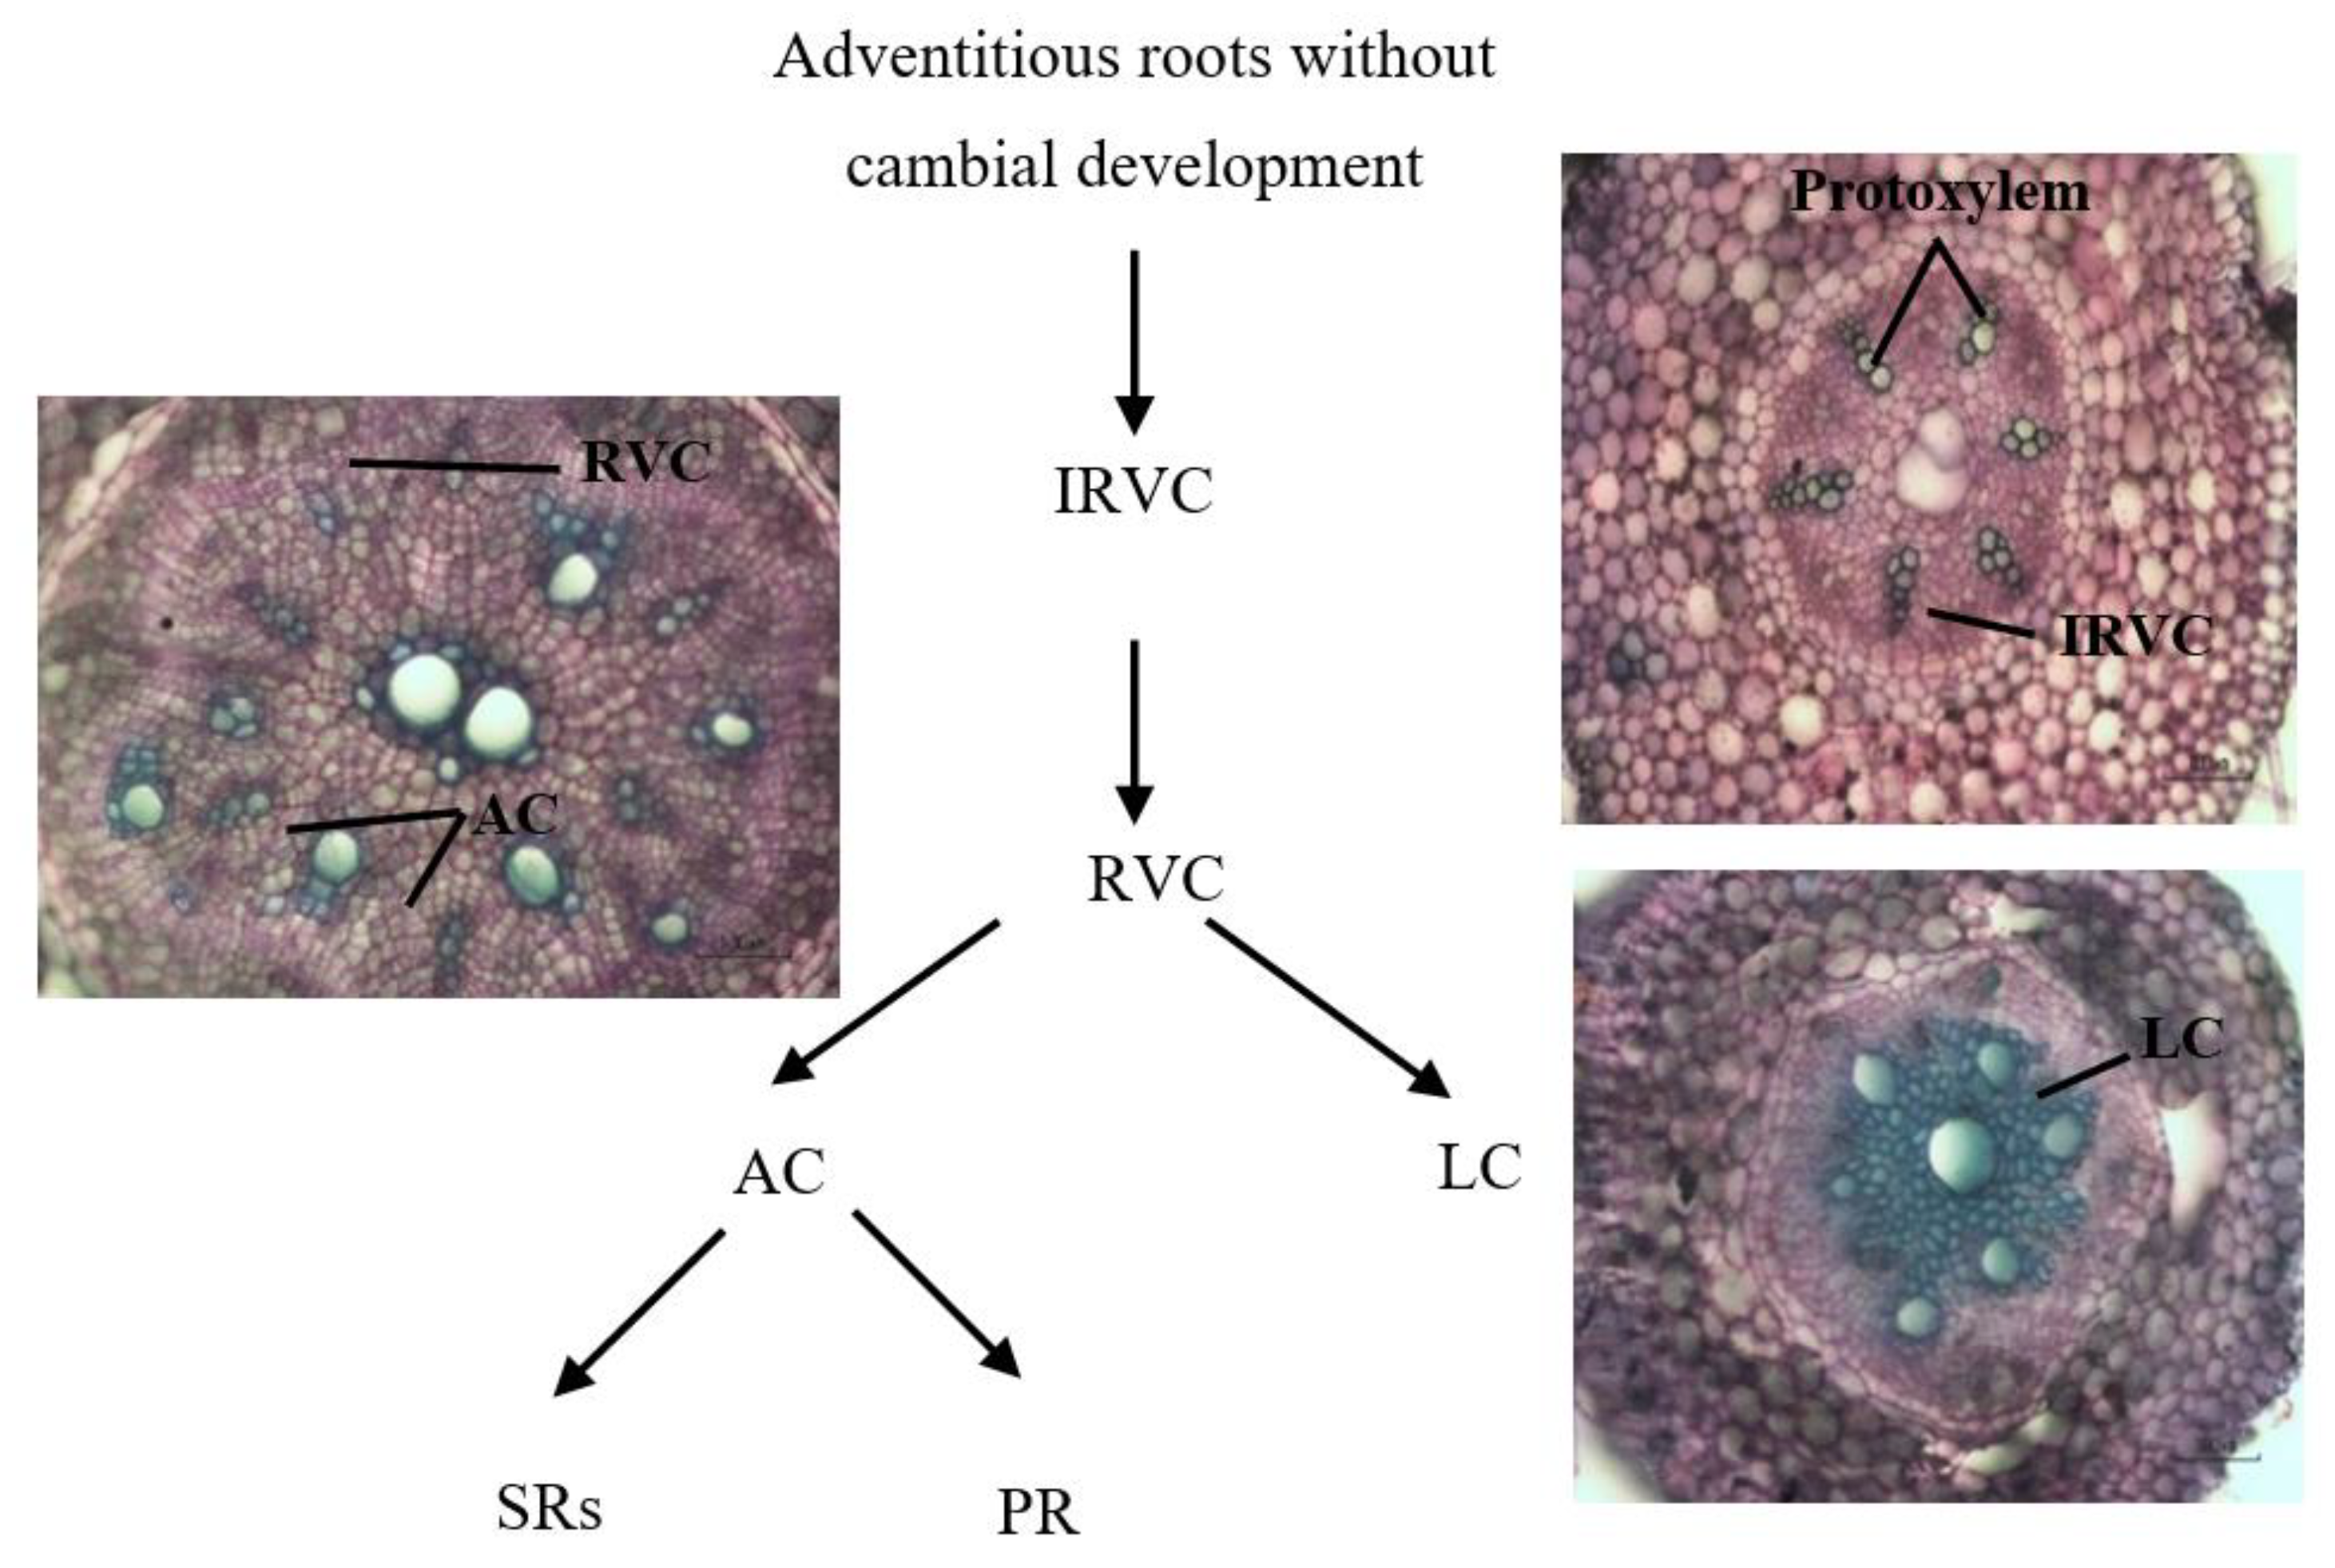
Figure 2.
Cambial development stages to form different types of roots based on descriptions of Wilson and Lowe [19]. Abbreviations: IRVC, initial regular vascular cambium; RVC, regular vascular cambium; AC, anomalous cambium; LC, lignified cells; SRs, storage roots; PRs, pencil roots.
Figure 2.
Cambial development stages to form different types of roots based on descriptions of Wilson and Lowe [19]. Abbreviations: IRVC, initial regular vascular cambium; RVC, regular vascular cambium; AC, anomalous cambium; LC, lignified cells; SRs, storage roots; PRs, pencil roots.

Figure 3.
Transverse sections of Orleans ARs at 21 DAT. (A) AR with appearance of AC around the central metaxylem and xylem poles will develop into SR. (B) AR without the central metaxylem; AC appearing around xylem poles will develop into SR. (C) AR with one of protoxylem poles joined with the central metaxylem and limited AC developed around protoxylem poles and the central metaxylem will develop into PR. (D) AR with more than 50% of stele cell lignification (green colour) will develop into lignified root.

Figure 4.
Effects of N supply levels on anatomical features of roots during SR formation. (A) no cambium distribution; (B) initial regular vascular cambium distribution; (C) regular vascular cambium distribution; (D) anomalous cambium distribution and (E) lignified cell distribution. Data were arcsine transformed before analysis, and original data are presented in the graph. Two-way ANOVA results, including effect of NL, ST, and interactive effect of NL by ST, are shown. Different letters on single sampling dates indicate significant difference (p < 0.05). Abbreviations: NC, no cambium; IRVC, initial regular vascular cambium; RVC, complete regular vascular cambium; AC, anomalous cambium; LC, lignified cells; NL, N level; ST, sampling time.

Figure 5.
Effects of N supply levels on SR and PR formation over time. (A) Distribution of initiated SRs. (B) Distribution of PRs. Data were arcsine transformed before analysis, and original data are presented in the graph. Two-way ANOVA results, including effect of NL, ST, and interactive effects of NL by ST are shown. Different letters on single sampling dates indicate significant difference (p < 0.05). Abbreviations: NL, N level; ST, sampling time.

Figure 6.
N concentration in sweetpotato and C/N ratio as affected by N supply levels. (A) Values of N concentration in vines. (B) N concentration in roots. (C) C:N ratio in vine and (D) C:N ratio in roots. Two-way ANOVA results, including effect of NL, ST, and interactive effects of NL by ST, are shown. Different letters on single sampling dates indicate significant difference (p < 0.05). Abbreviations: NL, N level; ST, sampling time.

Figure 7.
Effects of N treatments on the acquisition of N (mg/plant) in vine and root at (A) 10; (B) 21; (C) 35 and (D) 49 DAT. The x-axis represents N acquisition, and the y-axis represents the treatments. Numbers are mean values of total N acquisition of the whole plant (vine + root) followed by standard error. Different letters on single sampling dates indicate significant difference (p < 0.05).

Figure 8.
The effects of N supply levels on NRE in sweetpotato during SR formation. Values are presented as mean ± standard error. Two-way ANOVA results, including effect of NL, ST, and interactive effects of NL by ST, are shown. Different letters on single sampling dates indicate significant difference (p < 0.05). Abbreviations: NRE, nitrogen recovery efficiency; NL, N level; ST, sampling time.


Table 1.
The effects of N supply levels on the number of ARs per plant in different sampling times.
| Treatment | 10 DAT | 21 DAT | 35 DAT | 49 DAT | 56 DAT | ANOVA |
|---|---|---|---|---|---|---|
| N0 | 7.3 ± 0.3 | 9.0 ± 0.6 | 8.7 ± 0.3 | 8.3 ± 0.3 | 8.7 ± 0.3 | NL: p = 0.71 |
| N50 | 7.3 ± 0.3 | 9.3 ± 0.7 | 8.7 ± 0.3 | 8.7 ± 0.3 | 8.7 ± 0.3 | ST: p < 0.001 |
| N100 | 7.7 ± 0.3 | 9.7 ± 0.3 | 8.7 ± 0.7 | 9.0 ± 0.6 | 8.3 ± 0.3 | NL × ST: p = 0.88 |
| N200 | 7.3 ± 0.7 | 8.7 ± 0.3 | 9.3 ± 0.3 | 8.7 ± 0.3 | 9.0 ± 0.6 | |
| Average | 7.4 ± 0.2 | 9.0 ± 0.3 | 8.8 ± 0.3 | 8.6 ± 0.2 | 8.7 ± 0.3 | |
| p value | 0.802 | 0.574 | 0.642 | 0.743 | 0.743 |
The number of ARs was log-transformed before analysis, and the original data are presented in the table as mean ± standard error (SE). Abbreviations: DAT, days after transplanting; NL, N level; ST, sampling time.
Table 2.
Effect of N supply levels on the total RL, RD and RV of ‘Orleans’ on different sampling dates.
Table 2.
Effect of N supply levels on the total RL, RD and RV of ‘Orleans’ on different sampling dates.
| Treatment | 10 DAT | 21 DAT | 35 DAT | 49 DAT | 56 DAT | ANOVA | |
|---|---|---|---|---|---|---|---|
| RL (cm) | N0 | 257 ± 16 | 363 a ± 26 | 424 a ± 26 | 352 a ± 23 | 272 a ± 20 | NL: p < 0.001) |
| N50 | 257 ± 22 | 602 b ± 44 | 846 b ± 117 | 774 b ± 39 | 755 b ± 31 | ST: p < 0.001) | |
| N100 | 233 ± 12 | 524 b ± 16 | 1014 b ± 15 | 1020 c ± 56 | 1034 c ± 44 | NL × ST: p < 0.001 | |
| N200 | 260 ± 20 | 504 b ± 42 | 861 b ± 46 | 1025 c ± 45 | 1189 c ± 31 | ||
| p value | 0.69 | 0.01 | <0.001 | <0.001 | <0.001 | ||
| RD (mm) | N0 | 0.99 ± 0.02 | 0.73 ± 0.02 | 0.69 ± 0.02 | 0.69 a ± 0.01 | 0.70 a ± 0.01 | NL: p < 0.001) |
| N50 | 1.02 ± 0.03 | 0.71 ± 0.01 | 0.70 ± 0.01 | 0.72 a ± 0.01 | 0.73 ab ± 0.01 | ST: p < 0.001) | |
| N100 | 1.02 ± 0.06 | 0.74 ± 0.01 | 0.74 ± 0.01 | 0.77 ab ± 0.03 | 0.76 b ± 0.02 | NL × ST: p = 0.37 | |
| N200 | 1.05 ± 0.07 | 0.76 ± 0.03 | 0.74 ± 0.01 | 0.83 b ± 0.01 | 0.85 c ± 0.01 | ||
| p value | 0.83 | 0.23 | 0.09 | <0.001 | <0.001 | ||
| RV (cm3) | N0 | 1.7 ± 0.1 | 3.2 a ± 0.1 | 4.5 a ± 0.2 | 3.4 a ± 0.2 | 3.1 a ± 0.2 | NL: p < 0.001) |
| N50 | 1.8 ± 0.1 | 5.5 b ± 0.2 | 9.7 b ± 0.5 | 11.3 b ± 0.5 | 11.7 b ± 0.5 | ST: p < 0.001) | |
| N100 | 2.1 ± 0.2 | 6.1 b ± 0.3 | 14.1 c ± 0.3 | 17.4 c ± 0.4 | 18.2 c ± 0.5 | NL × ST: p < 0.001 | |
| N200 | 2.1 ± 0.2 | 6.0 b ± 0.2 | 13.1 c ± 0.3 | 20.9 c ± 0.6 | 23.2 d ± 0.5 | ||
| p value | 0.12 | <0.001 | <0.001 | <0.001 | <0.001 |
Data were square root transformed before analysis, and the original values are presented in the table as mean ± standard error. Different letters within columns indicate significant difference (p < 0.05). Abbreviations: ADT, days after transplanting; RL, root length; RD, root diameter; RV, root volume; NL, N level; ST, sampling time.
Table 3.
Effect of N supply levels on dry plant biomass, SR length, SR diameter and fresh SR weight at 56 DAT.
Table 3.
Effect of N supply levels on dry plant biomass, SR length, SR diameter and fresh SR weight at 56 DAT.
| Treatment | ADW (g/Plant) | RDW (g/Plant) | SRL (mm) | SRD (mm) | FSRW (g/Plant) |
|---|---|---|---|---|---|
| N0 | 1.1 a ± 0.1 | 0.5 a ± 0.1 | 51.2 a ± 3.1 | 4.2 a ± 0.4 | 4.3 a ± 0.8 |
| N50 | 3.3 b ± 0.2 | 2.0 b ± 0.1 | 92.0 b ± 5.0 | 5.7 b ± 0.1 | 17.9 b ± 0.9 |
| N100 | 5.9 c ± 0.3 | 3.6 c ± 0.2 | 108.5 b ± 12.2 | 7.8 bc ± 0.7 | 27.5 bc ± 2.1 |
| N200 | 9.3 d ± 0.2 | 6.0 d ± 0.3 | 120.8 b ± 7.4 | 8.2 c ± 0.4 | 34.8 c ± 2.2 |
| p value | <0.001 | <0.001 | 0.001 | 0.001 | <0.001 |
Values are presented as mean ± standard error. Different letters within columns indicate significant difference (p < 0.05). Abbreviations: ADW, above-ground dry weight; RDW, root dry weight; SRL, storage root length; SRD, storage root diameter; FSRW, fresh storage root weight.
Publisher’s Note: MDPI stays neutral with regard to jurisdictional claims in published maps and institutional affiliations. |
© 2022 by the authors. Licensee MDPI, Basel, Switzerland. This article is an open access article distributed under the terms and conditions of the Creative Commons Attribution (CC BY) license (https://creativecommons.org/licenses/by/4.0/).
Share and Cite
MDPI and ACS Style
Dong, H.T.; Li, Y.; Henderson, C.; Brown, P.; Xu, C.-Y. Optimum Nitrogen Application Promotes Sweetpotato Storage Root Initiation. Horticulturae 2022, 8, 710. https://doi.org/10.3390/horticulturae8080710
AMA Style
Dong HT, Li Y, Henderson C, Brown P, Xu C-Y. Optimum Nitrogen Application Promotes Sweetpotato Storage Root Initiation. Horticulturae. 2022; 8(8):710. https://doi.org/10.3390/horticulturae8080710
Chicago/Turabian StyleDong, Hong Tham, Yujuan Li, Craig Henderson, Philip Brown, and Cheng-Yuan Xu. 2022. "Optimum Nitrogen Application Promotes Sweetpotato Storage Root Initiation" Horticulturae 8, no. 8: 710. https://doi.org/10.3390/horticulturae8080710
Note that from the first issue of 2016, this journal uses article numbers instead of page numbers. See further details here.