
From Laboratory to Field: The Effect of Controlling Oscillations in Temperature on the Growth of Crops


1
Tainan District Agricultural Research and Extension Station, Tainan 71246, Taiwan
2
Department of Bio-Industrial Mechatronics Engineering, National Chung Hsing University, 250 Kuokuang Road, Taichung 40227, Taiwan
*
Author to whom correspondence should be addressed.
Horticulturae 2022, 8(8), 708; https://doi.org/10.3390/horticulturae8080708
Submission received: 28 June 2022
/
Revised: 2 August 2022
/
Accepted: 4 August 2022
/
Published: 5 August 2022
(This article belongs to the Topic Crop Ecophysiology: From Lab to Field)
Abstract
:Crops are grown in natural conditions. Environmental factors such as temperature, humidity, and light irradiance have a regular pattern. A grower chamber is usually used to test the effect of environmental factors on the crops. If crops were cultivated under fixed environmental conditions, the results would be different from that for plants that are grown in a natural environment. Limits in the capability of an apparatus mean that most studies use a fixed temperature, a fixed relative humidity, or a fixed light intensity. In an accumulated temperature study, Pak choi and strawberry were used to compare the difference between fixed and oscillating temperature conditions in a growth chamber. There were three temperature patterns: the high-temperature (HVT) oscillation pattern (day: 22–32 °C; night: 19–25 °C), low-temperature (LVT) oscillation pattern (day: 21–29 °C; night: 19–23 °C), and the fixed temperature (CT) regime (day: 25 °C; night: 22 °C). The light intensity was 80 μmol∙m−2s−1. The environments used for the Pak choi experiments were the HVT oscillation pattern, the CT pattern, and the inside air temperature for a net house. The strawberries had three treatments: the HVT and LVT oscillation patterns, and the CT pattern. The fresh weight of total plants, the leaf area, the leaf number, and the chlorophyll content were measured for the two crops. For strawberries, the fresh weight of the leaves and the Brix value were measured. The experimental results show that there is a significant difference in the growth characteristics for these three regimes. The results of the growth characteristics of Pak choi and strawberry for an oscillating temperature are better than those for a fixed temperature environment with a statistically significant difference. For the biological and agricultural experiments, an oscillating temperature in the growth chamber realistically simulates a natural environment.
1. Introduction
Environmental factors such as temperature, humidity, and light irradiance have a regular pattern in a natural environment. When crops are cultivated at a fixed temperature, a fixed relative humidity, or a fixed light intensity, the results may be different from those for growth in a natural environment. The limits in the capability of apparatus mean that most studies use fixed conditions [1]. Some experiments measure physiological characteristics for a short period [2].
In recent years, environmental changes have become more significant due to climate change. To prevent environmental factors from harming crop yields, farmers use protected cultures extensively. These include rain protection, insect-screening houses, and greenhouses. Rapid technological changes mean that cultivation facilities with control systems are more common and that the accuracy of temperature control systems is also increasing. Indoor cultivation allows for the control of growth factors for plants, but the cost of protected cultures is much greater than that for natural fields. A control mechanism for crops must be economical.
Living things grow in natural environments that change between day and night, and seasonally, and natural systems periodically adjust to the pace of nature [3]. Most organisms feature a circadian rhythm, such as the peristaltic movement of a cow’s stomach and the sleep clock of the human body. Animals and plants grow in an environment that conforms to their endogenous rhythm, so growth is optimal. The photosynthesis, respiration, and assimilation of crops interact with each other because each has a cycle [4,5,6].
Although daytime and nighttime temperatures are different, the growth rate should be the same for the same average temperature. Hennessey and Field [7] showed that a constant environment is an adverse condition for growth. The effect of temperature in photosynthesis is also a natural logarithmic function, similar to the respiration rate and the relative growth rate. For the same conditions of day and night temperature accumulation, the effects of oscillations in the temperature and constant temperature on the photosynthesis rate of plants are not the same [8].
Inayama and Murakami [9,10] confirmed that managing nighttime oscillations at temperature t is more effective than maintaining a constant temperature and proposed the concept of a split night temperature regime. The effect of oscillating temperatures was studied by Gagnon and Dansereau [11].
Recently, the physiological characteristics of a crop have been used for greenhouse environmental control. Germination, vegetative growth, and reproductive growth require different environments. Inayama and Murakami [9,10] proposed the concept of four-stage management of an oscillating temperature for fruit vegetables, whereby the day was divided into different sections for different temperatures. Nkansah and Ito [12] showed that plant growth requires oscillating temperatures, not fixed temperatures.
Some studies showed that the growth of plants is the same as the endogenous rhythm of the plants themselves. Dodd et al. [13] showed that, if plants grow well when an oscillating photoperiod conforms to their endogenous cycle, the photosynthesis rate, growth rate, and survival rate increase. The endogenous rhythmic response of plant physiology and the changes in natural environmental factors (temperature, humidity, and light quantity) are similar to a sine wave [14].
Plants that grow in a photoperiod that conforms to endogenous rhythms have better physiological responses [15,16,17]. Environmental factors such as temperature and light quantity are also mobilized according to the cycle of endogenous rhythms to give plants better physiological responses [14,18]. Yan and Hunt [19] proposed an equation to model the temperature response for plants using only cardinal temperatures and used real data for six crops to validate the model.
To determine the growth characteristics of plants at an oscillating temperature and a constant temperature, an oscillation temperature pattern curve based on natural conditions is established and the physiological response characteristics of plants are observed. This study uses Pak choi and strawberry as experimental crops to determine the effect of temperature patterns on plants.
2. Materials and Methods
2.1. Growth Chamber with Oscillating Temperature
Oscillations in the temperature environment were controlled using a temperature growth chamber (Qingsheng Technology Co., Taipei, Taiwan). The specifications of the control range were a temperature of 15–30 °C, relative humidity of 55–85 %, a plant light intensity of 0~120 μmol/m2-s, and CO2 at 400~3000 ppm.
This growth chamber simulates the oscillating pattern for temperature and light intensity. The climate conditions were pre-defined and programmed, and the controlling environment curves were displayed directly.
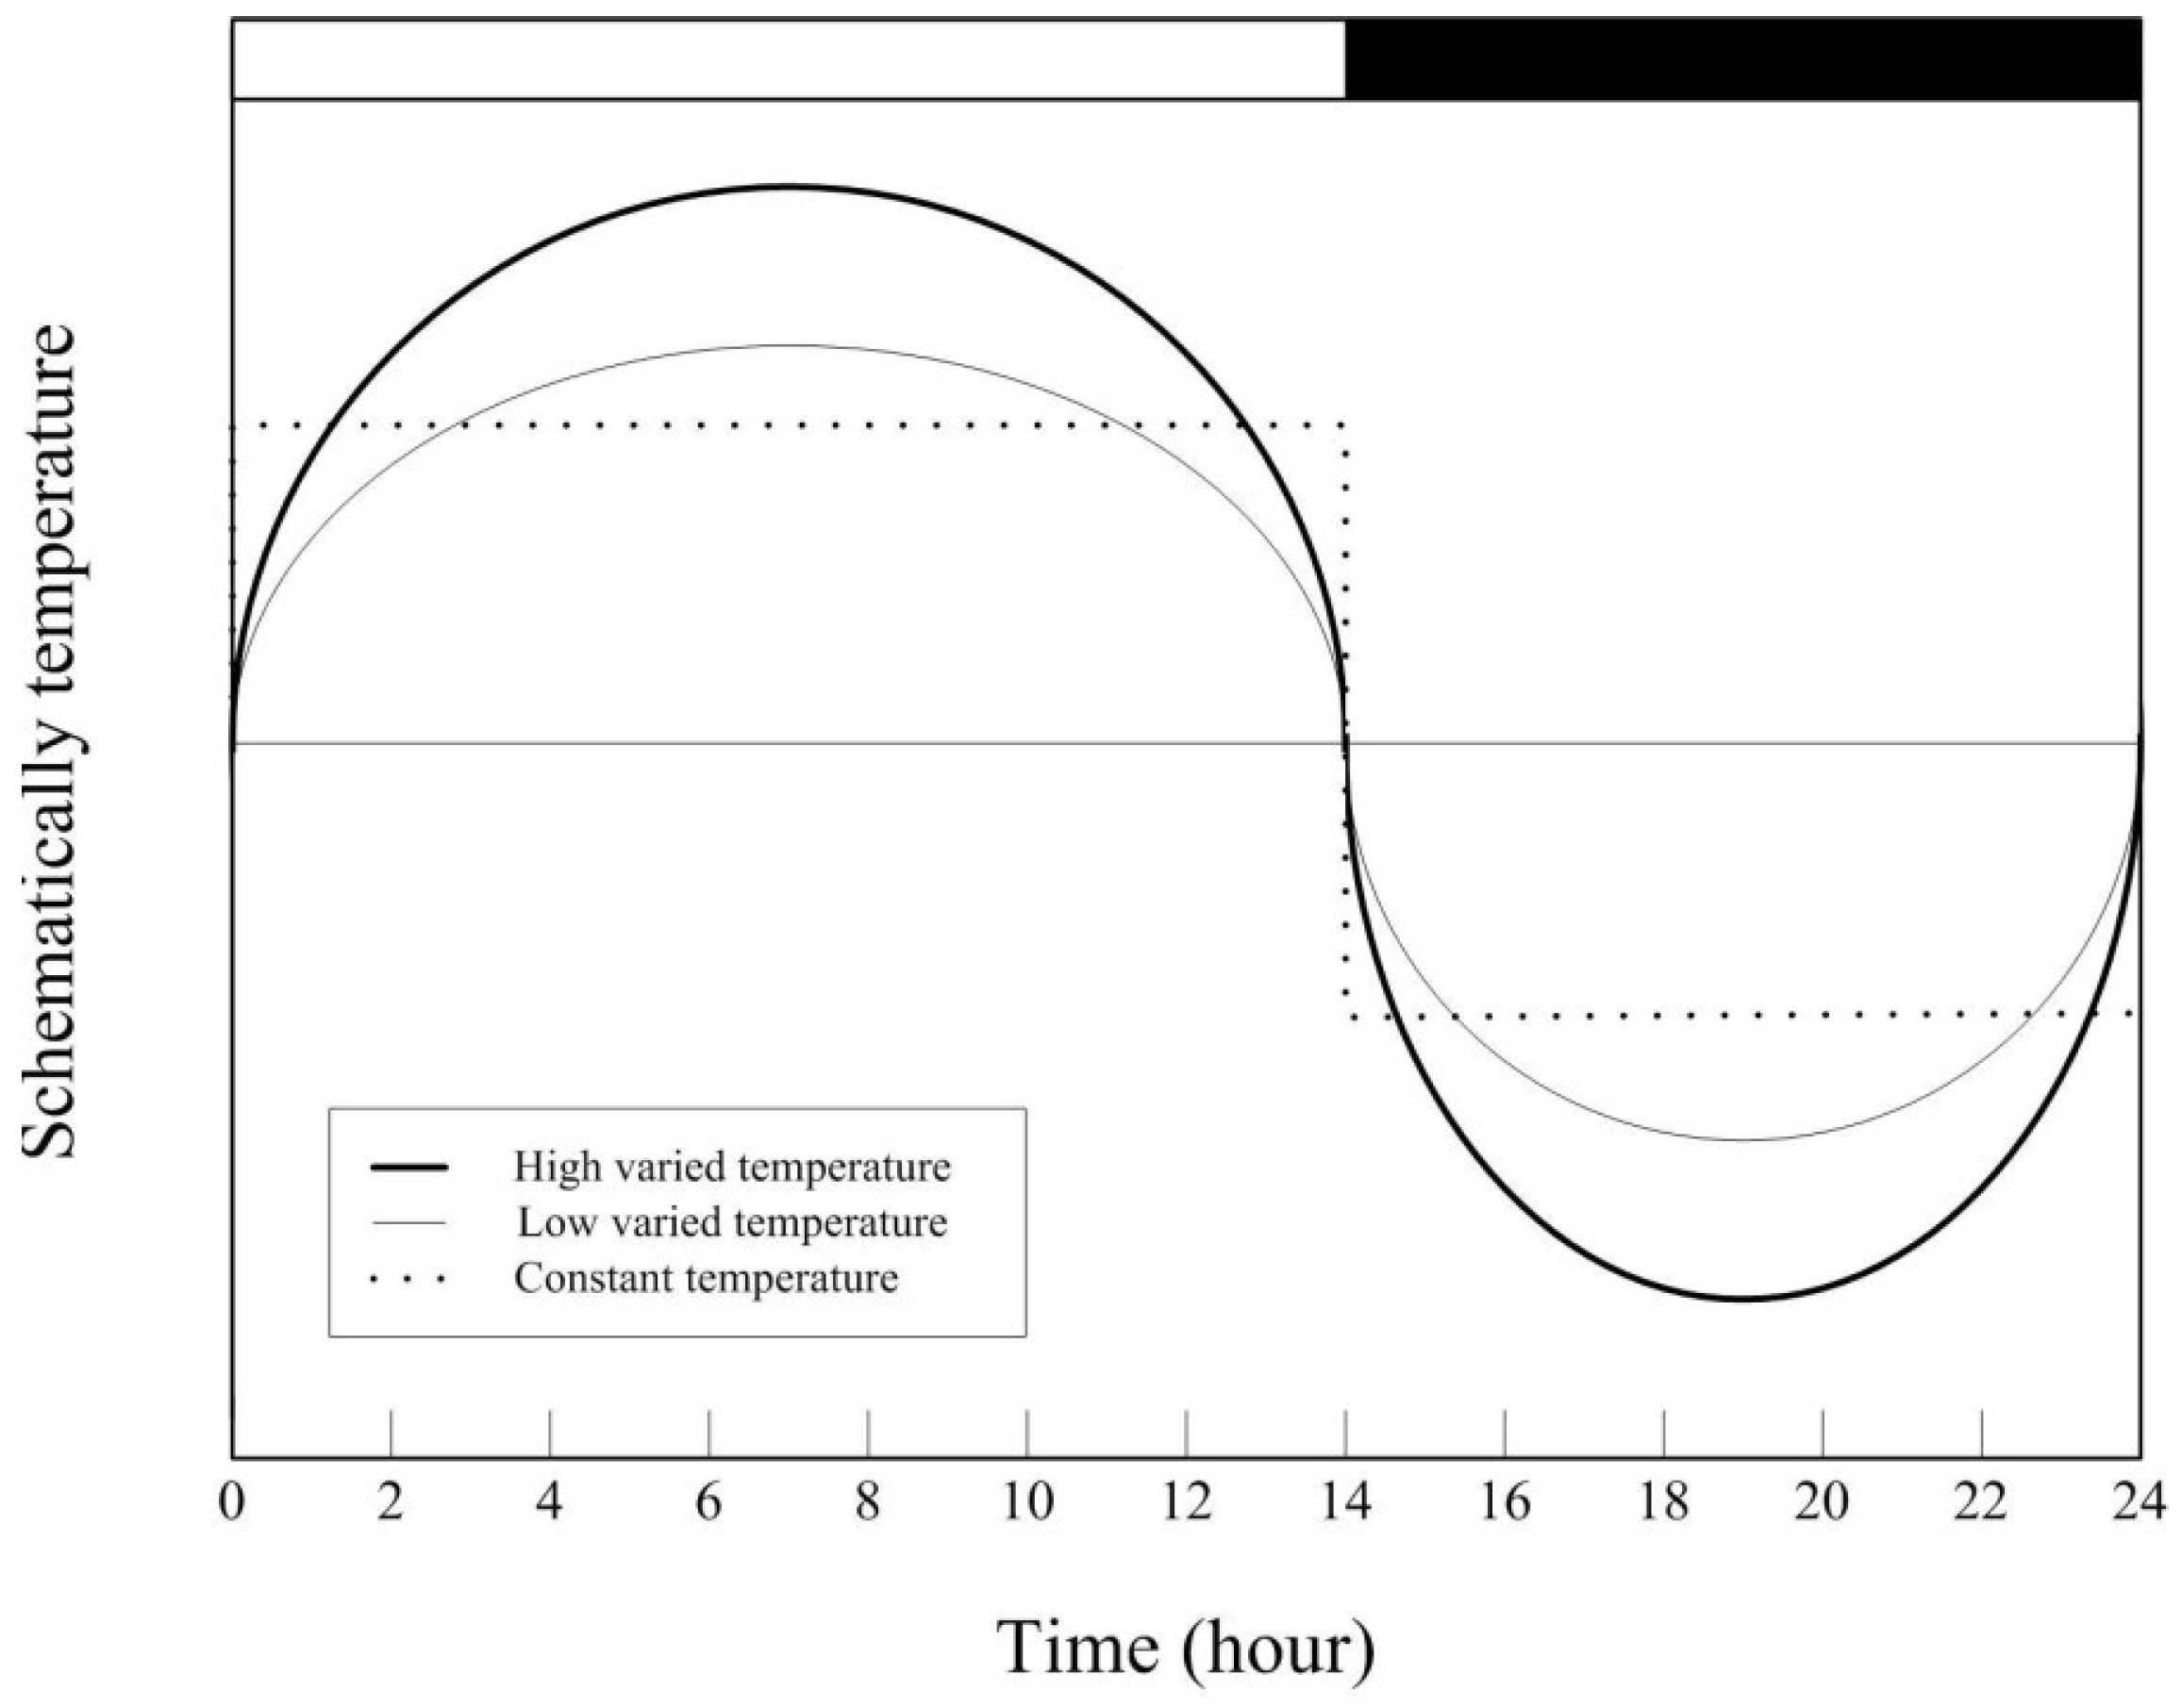
Three environments with the same temperature accumulation were established. Temperature accumulation was used to describe the cumulative effect of temperature over time. Temperature accumulation was calculated as the average temperature per hour minus the base temperature and accumulated by adding each hour’s value. The schematical temperature distribution is shown in Figure 1.
The high-temperature (HVT) oscillation pattern maintained a daytime temperature of 22~32 °C and a nightly temperature of 19~25 °C. The low-temperature (LVT) oscillation pattern maintained a daytime temperature of 21~29 °C and a nightly temperature of 18~23 °C. To maintain the same temperature accumulation, the scope of the HVT and LVT was assumed as 11 °C (range 22–32 °C) and 9 °C (range 21–29 °C). The fixed temperature (CT) regime maintained a daytime temperature of 25 °C and a nightly temperature of 22 °C. The amount of light for these experiments was 80 μmol m−2 s−1. The actual temperature distributions of the three settings are presented in Figure 2.
2.2. Testing Procedure
Three environments were used for the Pak choi experiments: a high-temperature (HVT) oscillation pattern, the fixed temperature (CT) pattern, and the inside air temperature for a net house.
The variety of the Pak choi was Nongyou Sanfeng No. 2, and the seedlings were grown in pure culture soil in an 8 × 12 3.8 cm deep seedling tray. After germination, they were transplanted into a 7.6 cm black pot. The medium consisted of organic matter culture soil mixed with pearl stone and vermiculite in a ratio of 10:1:1.The Pak choi was planted one plant in one pot. There were twelve pots. That is, there were twelve replicates for each treatment.
All three treatments used the same variety, substrate, fertilizer, and watering techniques. However, the samples were placed in growth chambers (HVT and CT) and inside of a net house.
The strawberries were divided into three groups for treatment using a high-temperature (HVT) oscillation pattern, a low-temperature (LVT) oscillation pattern, and a fixed temperature (CT) pattern. The variety of the strawberry was Fengxiang (Fragaria×ananassa). The strawberries were grown in pots 16 cm wide, 60 cm long, and 10 cm deep. Each treatment had two pots, with eight strawberries per pot. The medium was the same as that of Pak choi.
The fertilizer was Hyponex No. 2, and the rate of N-P2O5-K2O was 20-20-20. It was diluted 3000 times and was applied once a week. Water was added every two days to each pot to maintain 60–70% water content. The volume of water per irrigation was nearly 40% volume of the pot. The water content was measured with a WET 150 Meter (Delta-T Devices, UK).
After harvesting, the growth characteristics of the Pak choi including the total leaf area, the indexed chlorophyll, the leaf number, the fresh weight, and the dry weight were measured. The fresh weight includes the weight for the aerial part and the underground part.
The growth characteristics of the strawberry including the leaf area, the leaf number, the leaf length, the flowering status, and the fresh weight of the mature leaves and the Brix value were measured. The leaf area of the strawberries was measured randomly from clipped mature leaves. The number of leaves and the length of the leaves were measured regularly.
The weight of the plants was measured using an electronic balance (BX 320H, SHIMADZU, Tokyo, Japan). After drying in an oven (DO-452, YSC) at 50 °C for 48 h, the dry weight was measured as the weights of the samples did not change. The leaf area was measured after harvesting using a leaf area meter (LI-3000A, LI-COR). The indexed chlorophyll (SPAD) was measured using a non-destructive chlorophyll meter (SPAD-502, MINOLTA). The chlorophyll meter determined the relative amount of current chlorophyll in leaves by measuring the light transmittance coefficients of the leaves in special two-wavelength ranges in a 2 × 3 mm area of the leaf. The chlorophyll in the leaves absorbs light, and the transmittance was measured at these specific wavelengths. Then, the chlorophyll was calculated with the calibration equation according to the amount of light transmitted by the leaves.
The number of leaves was counted before the leaf area measurement. For strawberries, the length of the leaves was measured using a digital ruler (CARMA). The Brix value was measured using a Brix meter (Pocket Refractometer PAL-1, ATAGO).
2.3. Specifications of the Equipment
2.3.1. Electronic Balance (BX 320H, SHIMADZU, Kyoto, Japan)
The electronic balance has a 320 g max, a 0.001 g resolution, a 0.001 g readability, a 300 g calibration weight, and 5–40 °C temperature.
2.3.2. Leaf Area Meter (LI-3000A, LI-COR Inc., Lincoln, NE, USA)
The resolution was 1 mm2 and the accuracy was ±2% for samples smaller than 50 cm2. The maximum length was 100 cm, and the maximum thickness was 8 mm.
2.3.3. Chlorophyll Meter (SPAD-502, MINOLTA, Osaka, Japan)
The chlorophyll meter had an accuracy of ±1 SPAD, a repeatability within ±0.3 SPAD, and repeatability of ±0.5 SPAD. The specimens were limited to a maximum thickness of 1.2 mm.
2.3.4. Digital Vernier Caliper (CARMA, Taipei, Taiwan)
The resolution was 0.01 mm.
2.3.5. Brix Meter (Pocket Refractometer PAL-1, ATAGO, Tokyo, Japan)
The measurement range was 0.0~53.0 Brix% (g/100 mL), and the temperature range was 10~40 °C. The resolution was 0.1 Brix%, and the accuracy was ±0.2 Brix%.
2.3.6. Soil Water Content Meter (WET 150 Meter (Delta-T Devices, UK)
The measurement range was 5–100% volume in the temperature range −20~50 °C. The resolution was 0.1%, and the accuracy was ±3.0%.
2.4. Statistical Methods
This experiment used SPSS 20 (IBM® SPSS Statistic 20) and EXCEL 2007 (Microsoft® Office Excel 2007) for statistical analysis. For each growth characteristic of each treatment, an ANOVA was used to test whether there were significant differences between the various treatments, and then, post hoc tests were used to determine the differences between the treatments.
Before the ANOVA test, a homogeneous test was performed to test whether the amount of variation in the treatments was equal. If the variance was equal, Turkey’s HSD test was used for the post hoc test. For the three temperature regimes for strawberries, the final number of samples for the various physiological characteristics was not equal to the Scheffé test used.
3. Results
3.1. Pak Choi
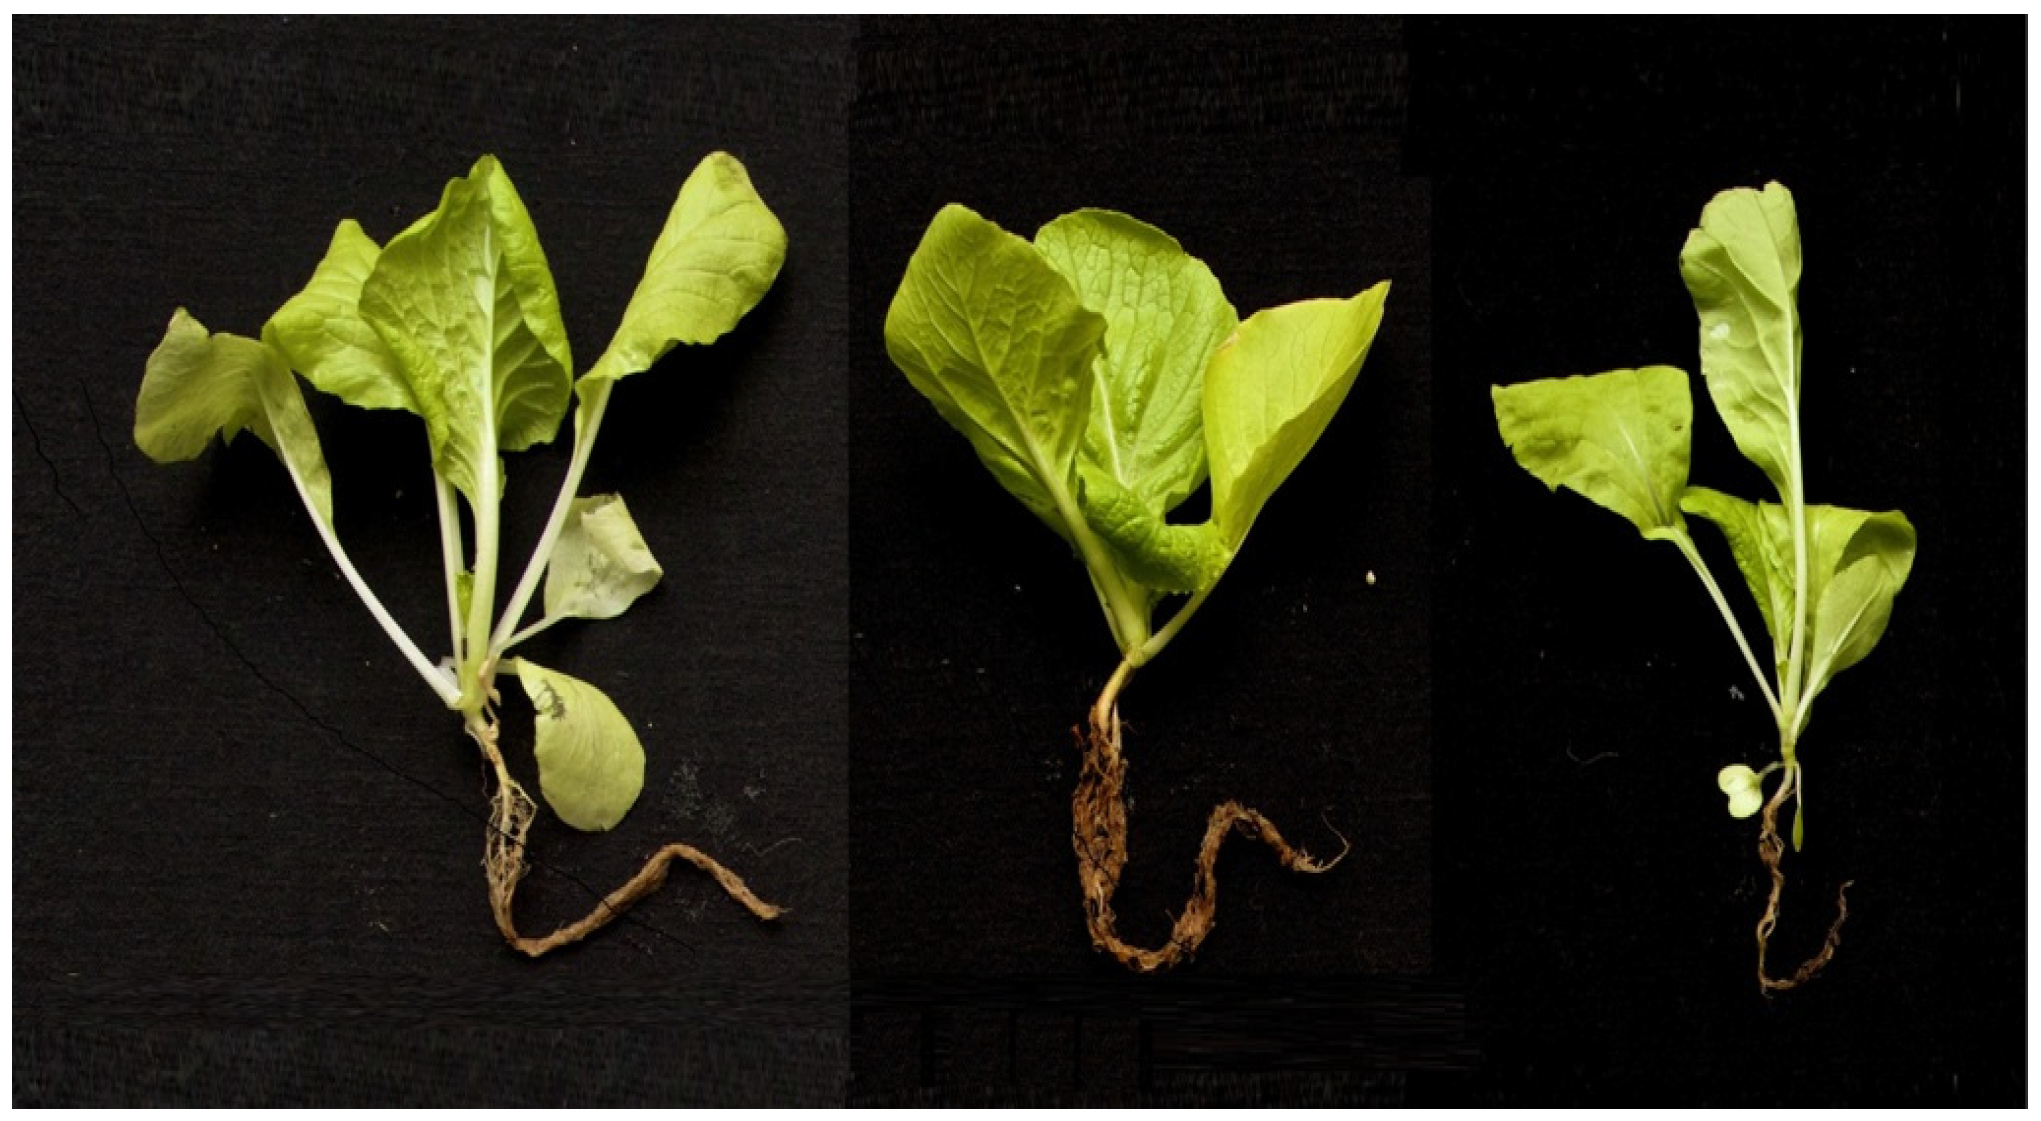
Pak choi was tested over 30 days. The growth state for 17 days is shown in Figure 3. In terms of appearance, a high oscillation temperature gives the best results in the total fresh weights, the leaf area, and the leaf number, and the constant temperature group is the smallest.
The results of the study of growth characteristics are shown in Figure 4, Figure 5 and Figure 6. The length of the error bar is proportional to the standard error of the mean.
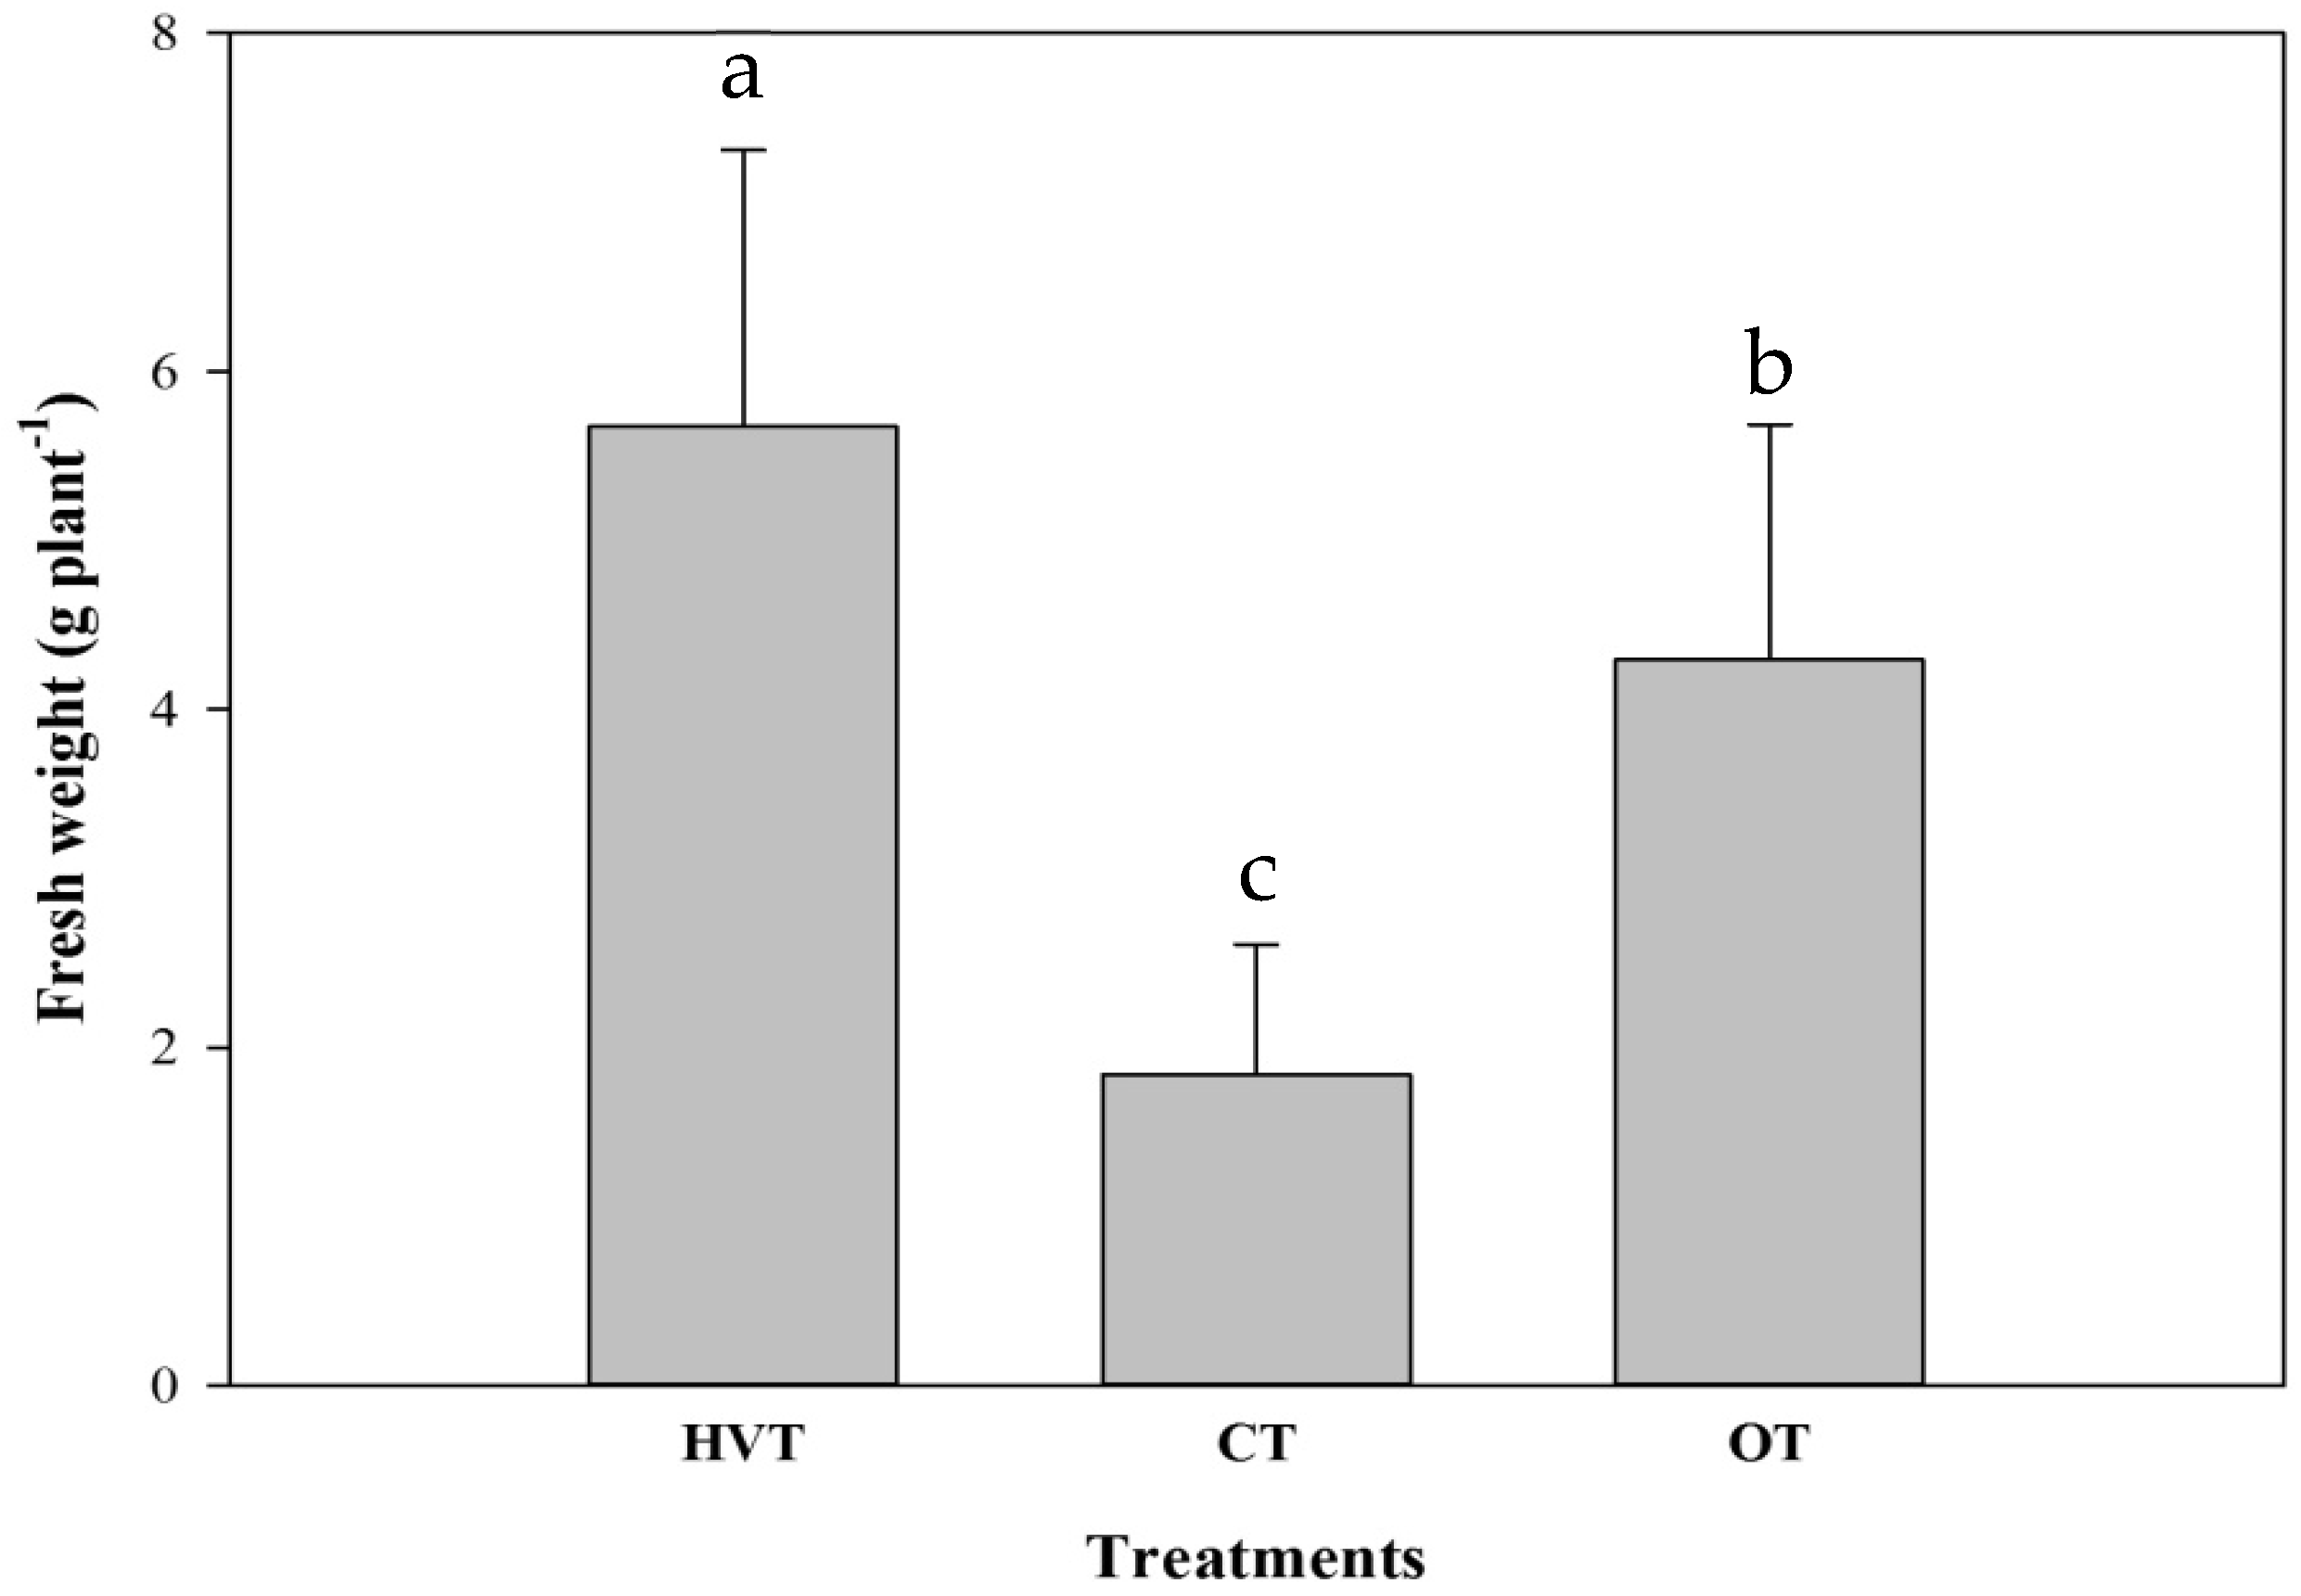
A comparison of the average fresh weights of whole plants is shown in Figure 4. The results of the ANOVA are significantly different (F(2, 33) = 26.004, p < 0.001). In multiple comparisons, Turkey’s HSD test is significantly different for each sample at the 95% confidence level. The order of the average values is oscillating temperature (5.672 g) > net house (4.293 g) > constant temperature cultivation (1.837 g).
A comparison of the fresh weight of the above-ground part and the fresh weight of the underground part is shown in Table 1. The results for the analysis of variance show a significant difference (F(2, 33) = 27.655, p < 0.001); (F (2, 33) = 33.994, p < 0.001). For multiple comparisons, Turkey’s HSD test is significantly different for each sample with a 95% confidence level. The order of the average fresh weight of aboveground parts is high oscillation temperature (5.351 g) > net house (3.620 g) > constant temperature (1.780 g). The order of the average fresh weight of underground parts is net house (0.673 g) > oscillating temperature (0.321 g) > constant temperature (0.157 g). The fresh weight of the underground parts (roots) is greatest for growth in the net house, and the fresh weight of the aboveground parts (leaves) is greatest for the high oscillation temperature group. The constant temperature group has poor results.
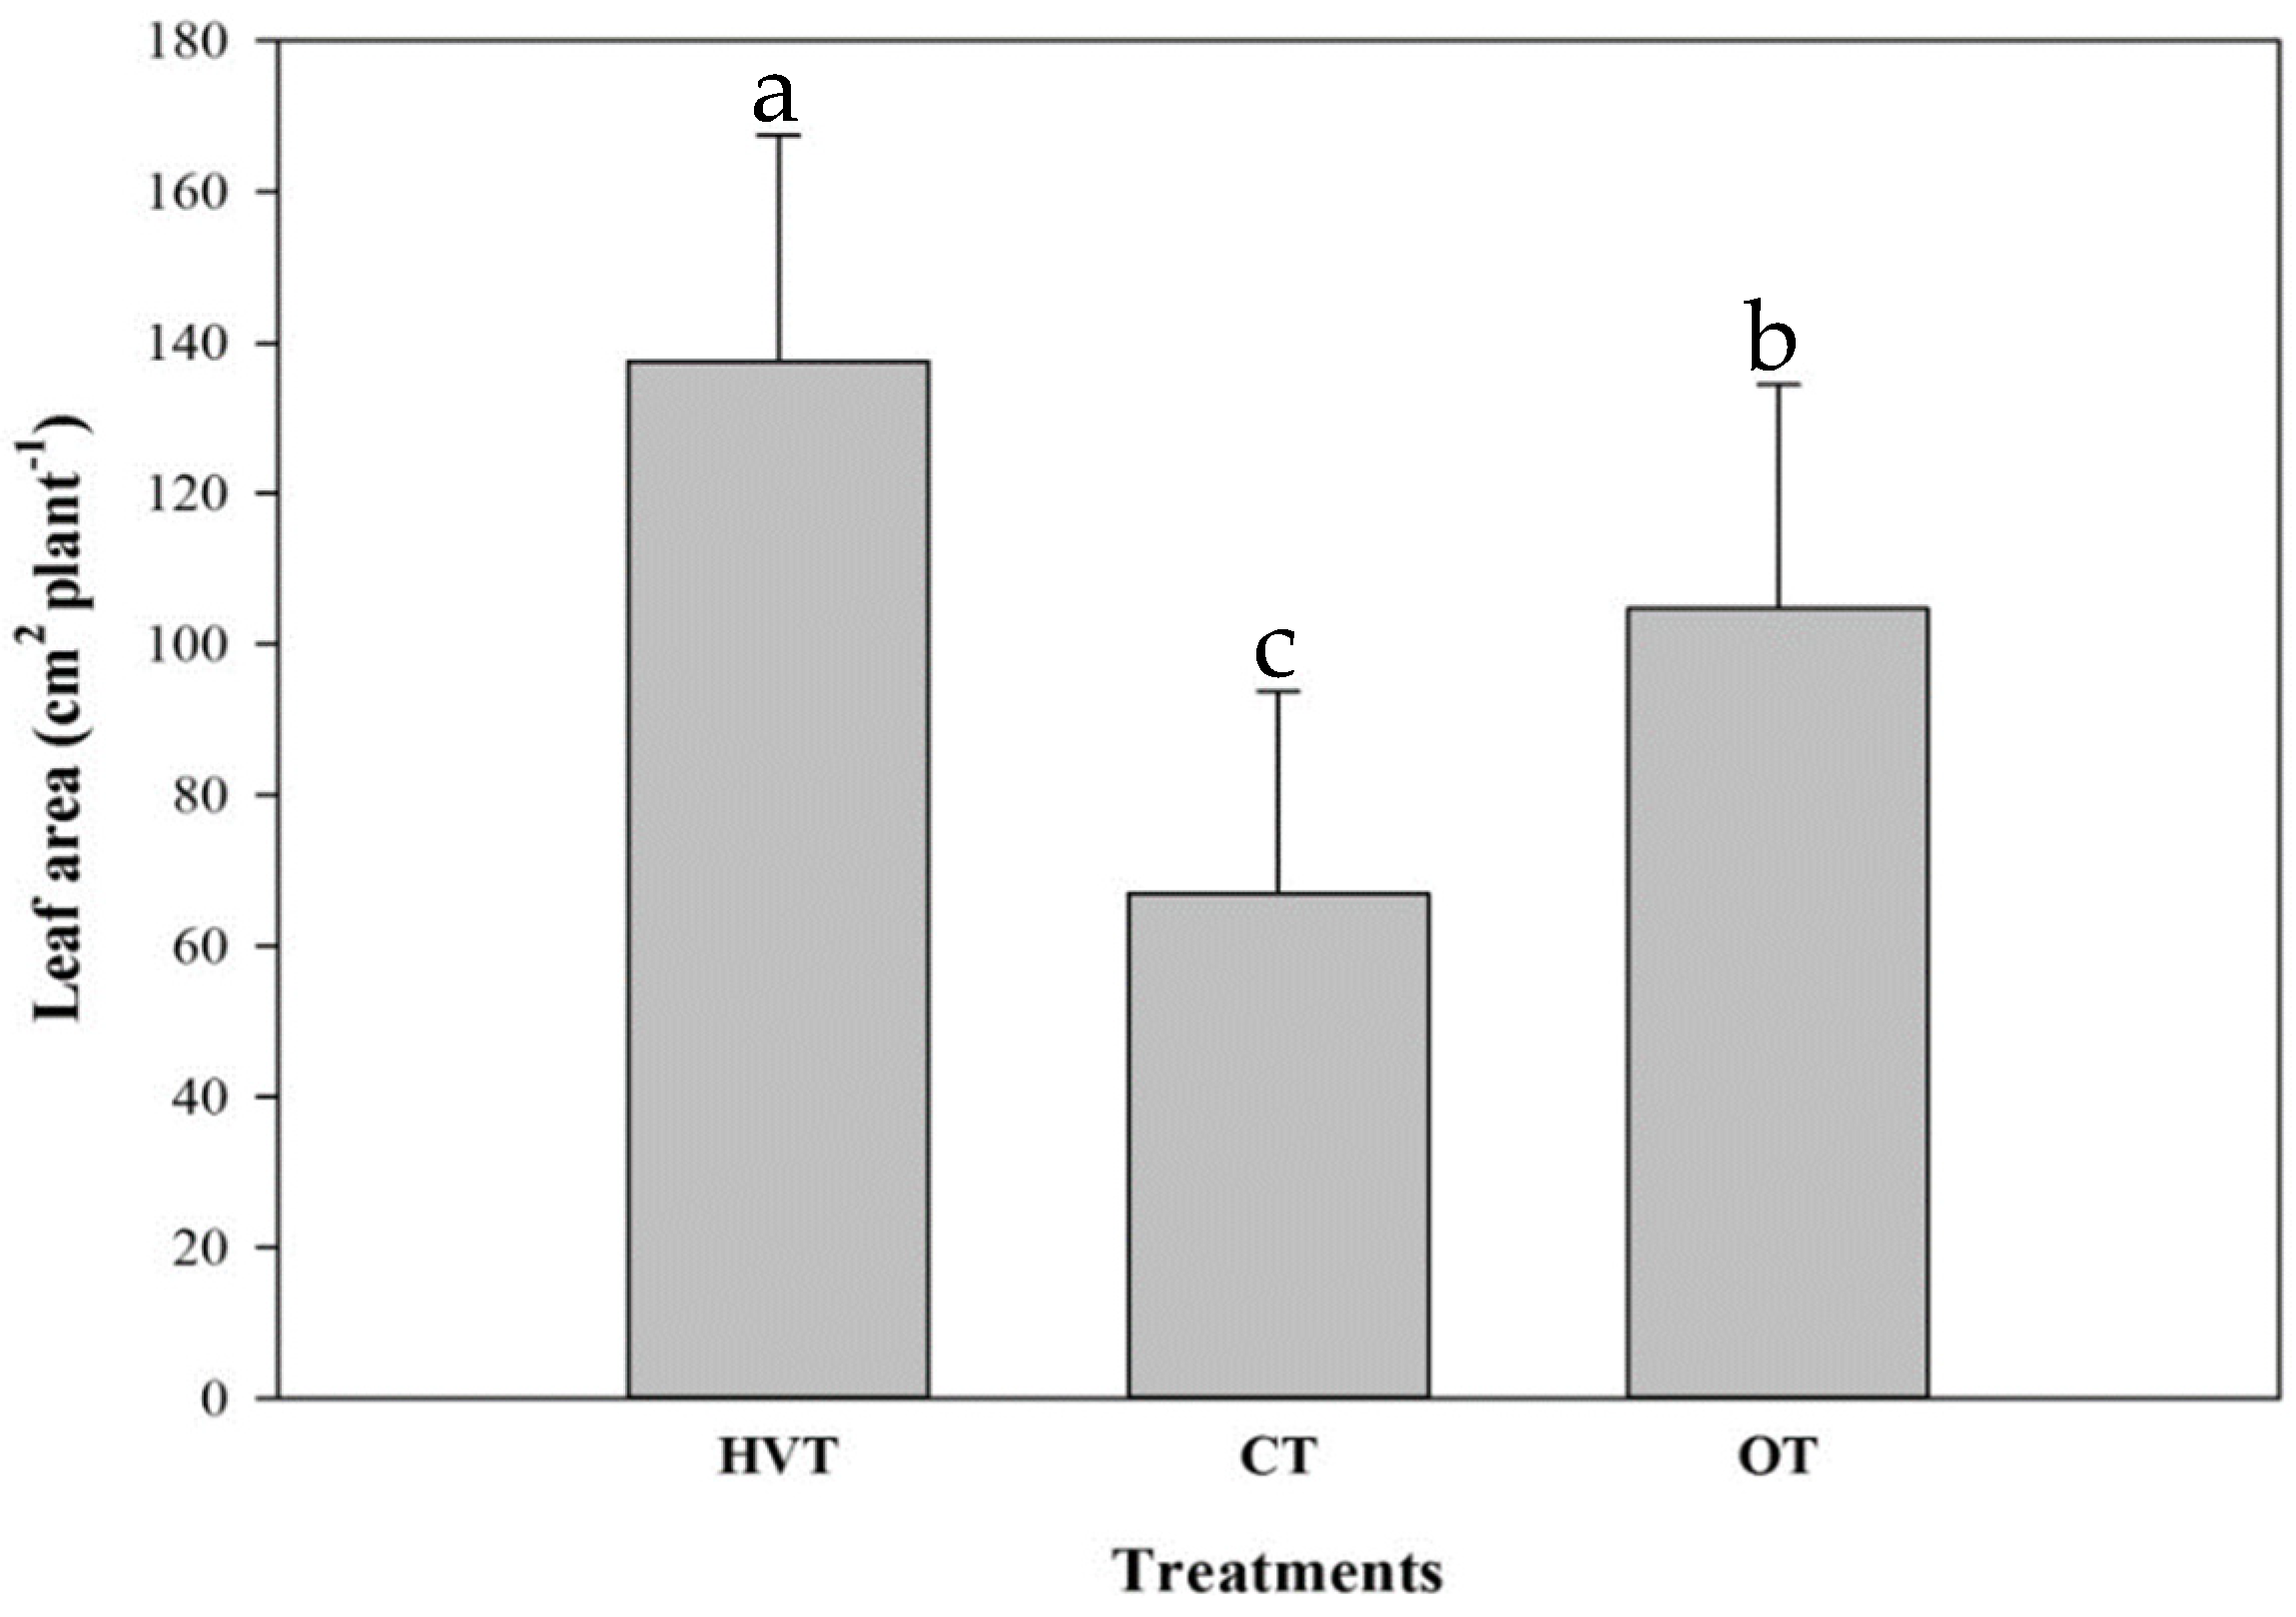
A comparison of the average leaf area is shown in Figure 5. The results for the analysis of variance are all significantly different (F(2, 33) = 18.001, p < 0.001). For multiple comparisons, Turkey’s HSD test is significantly different for each sample at the 95% confidence level. The order of the average leaf area value is high oscillation temperature (137.613 cm2) > net house (104.723 cm2) > constant temperature (66.983 cm2).
A comparison of the chlorophyll content index is shown in Figure 6. The analysis of variance results shows a significant difference (F(2180) = 13.578, p < 0.001). However, for multiple comparisons, the measurements for Turkey’s HSD test show that there is no significant difference between the constant temperature group and the high oscillation temperature group at the 95% confidence level. The net house growth group is significantly different from the other two groups. The order of the average value is net house (13.687 SPAD) > high oscillation temperature (10.164 SPAD) > constant temperature (9.856 SPAD).
To compare the number of leaves, the results of the analysis of variance show no significant difference (F(2, 33) = 2.025, p = 0.305).
The temperature has a significant effect on the growth of plants [20]. During the experiment, a roof of shading nets was used to reduce solar irradiation and the surrounding was open. There was no wind resistance. The internal temperature of the net house was almost the same as that of the ambient environment. The distribution of ambient temperatures is shown in Figure 7.
Pak choi grows well between 20 and 25 °C. During this experimental period, the daily average temperature of the outdoor group was 28.6 °C, and the highest average temperature was 33.4 °C. At this time, the external environment at the experimental site was no longer suitable for the growth of Pak choi, so the growth conditions for the net house group were lower than those for the high oscillation temperature group. The fresh weight of the roots is also affected by the high temperature in the soil, which promotes the growth and development of roots, so the fresh weight of the roots is greatest for the net house group.
The fresh weight of the entire plant, the fresh weight of the leaves, and the leaf area are best for the high oscillation temperature group, and the results for the constant temperature group are the worst. The fresh weight of roots is the best for the net house group. The chlorophyll content index is similar for the high oscillation temperature group and the constant temperature group and best for the net house group.
3.2. Strawberry
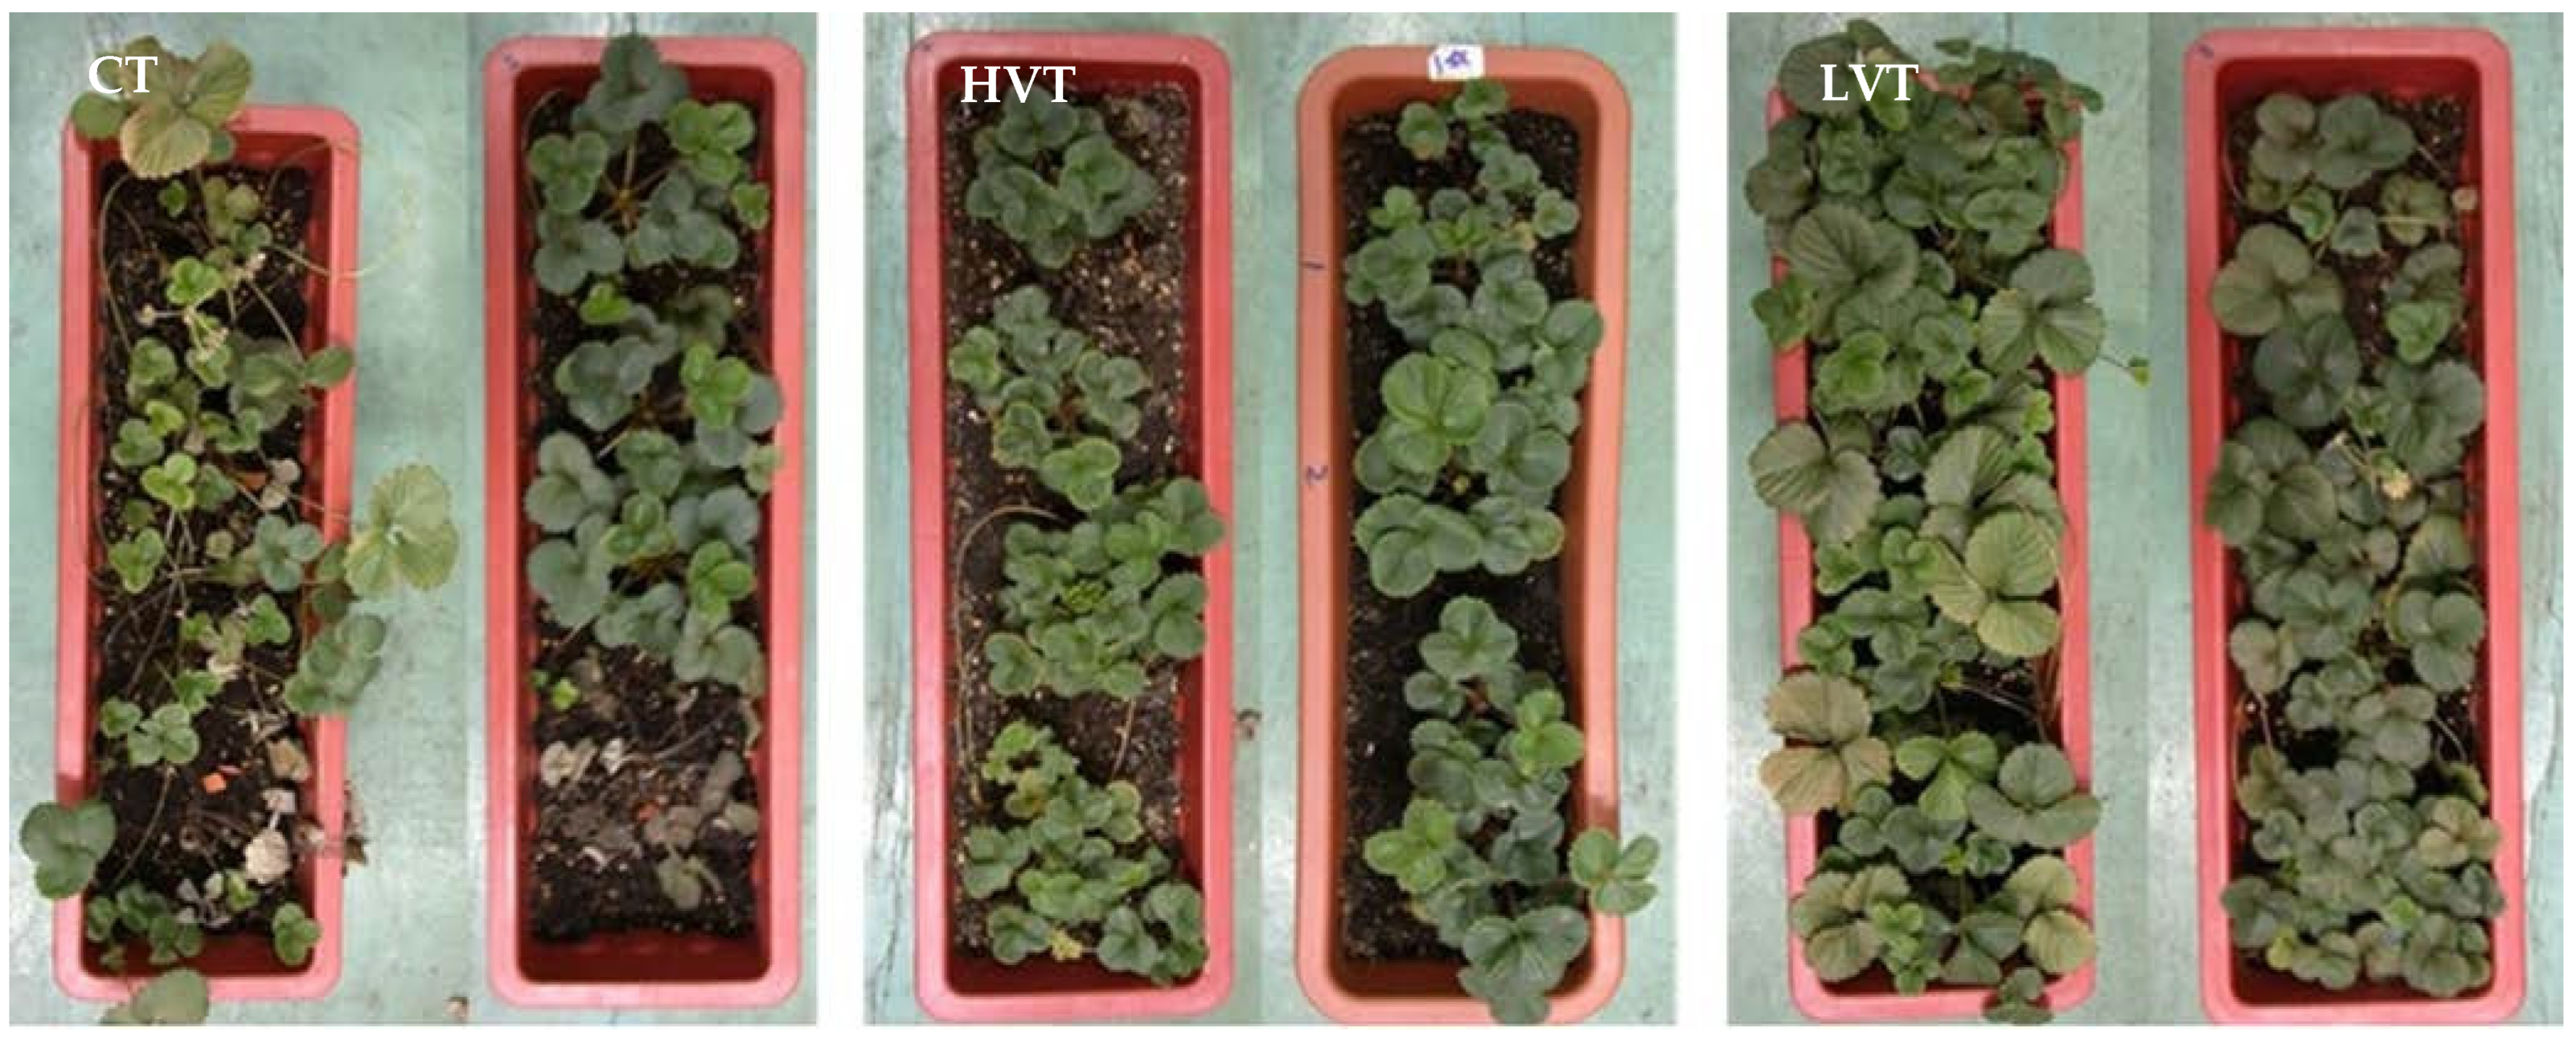
The strawberry experiment lasted from 10/1 to 5/24 of the following year, for a total of 6 months. The growth state for the treatment groups is shown in Figure 8. In terms of appearance, cultivation using an oscillating temperature gives the best results and the constant temperature cultivation group grows the least. The results for the growth characteristics are shown in Figure 9, Figure 10, Figure 11 and Figure 12.
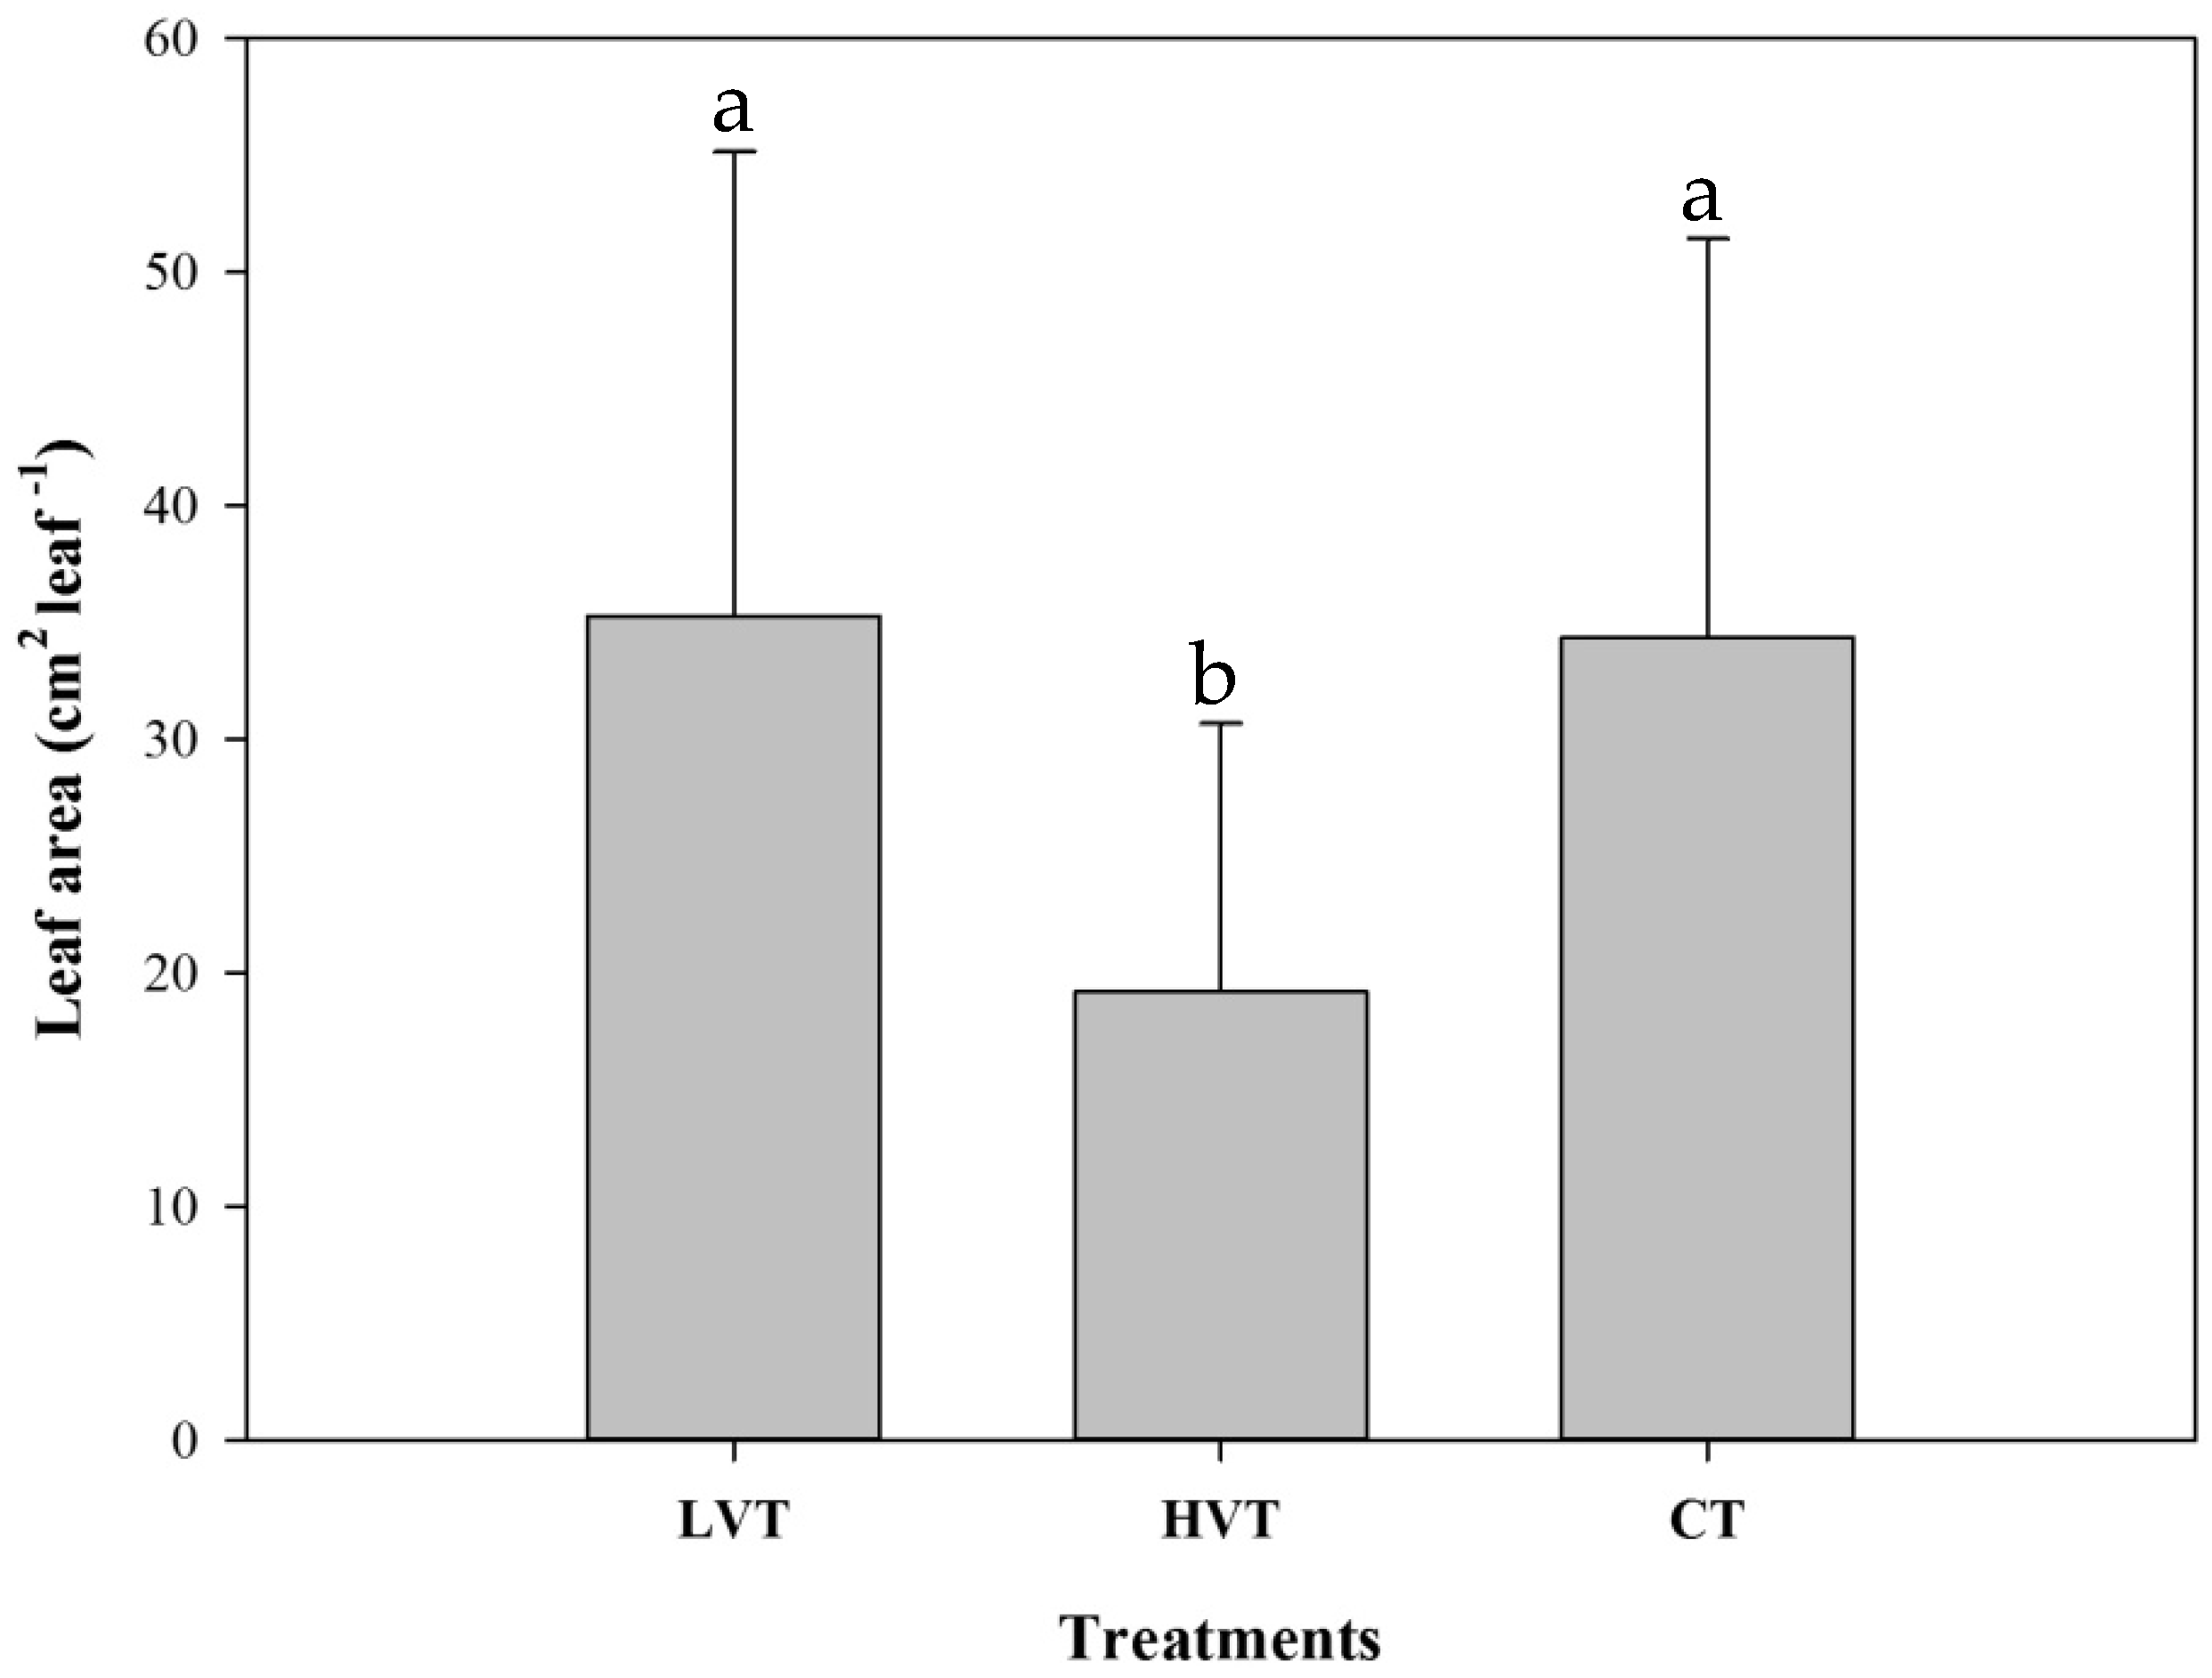
A comparison of the average leaf area is shown in Figure 9. The analysis of variance results are significantly different (F(2, 91) = 10.369, p < 0.001). For multiple comparisons, the Scheffé test shows there is a significant difference between the high oscillation temperature and the other two groups at the 95% confidence level. The order of the average value is low temperature oscillation (35.286 cm2) > constant temperature (34.370 cm2) > high oscillation temperature (19.193 cm2).
The results of the analysis of variance for comparing the number of leaves show no significant difference (F(2, 21) = 2.811, p = 0.083). The order of the average value is low oscillation temperature (7.875 pieces) > constant temperature (7 pieces) > high oscillation temperature (6.125 pieces). However, there is no significant difference in the results.
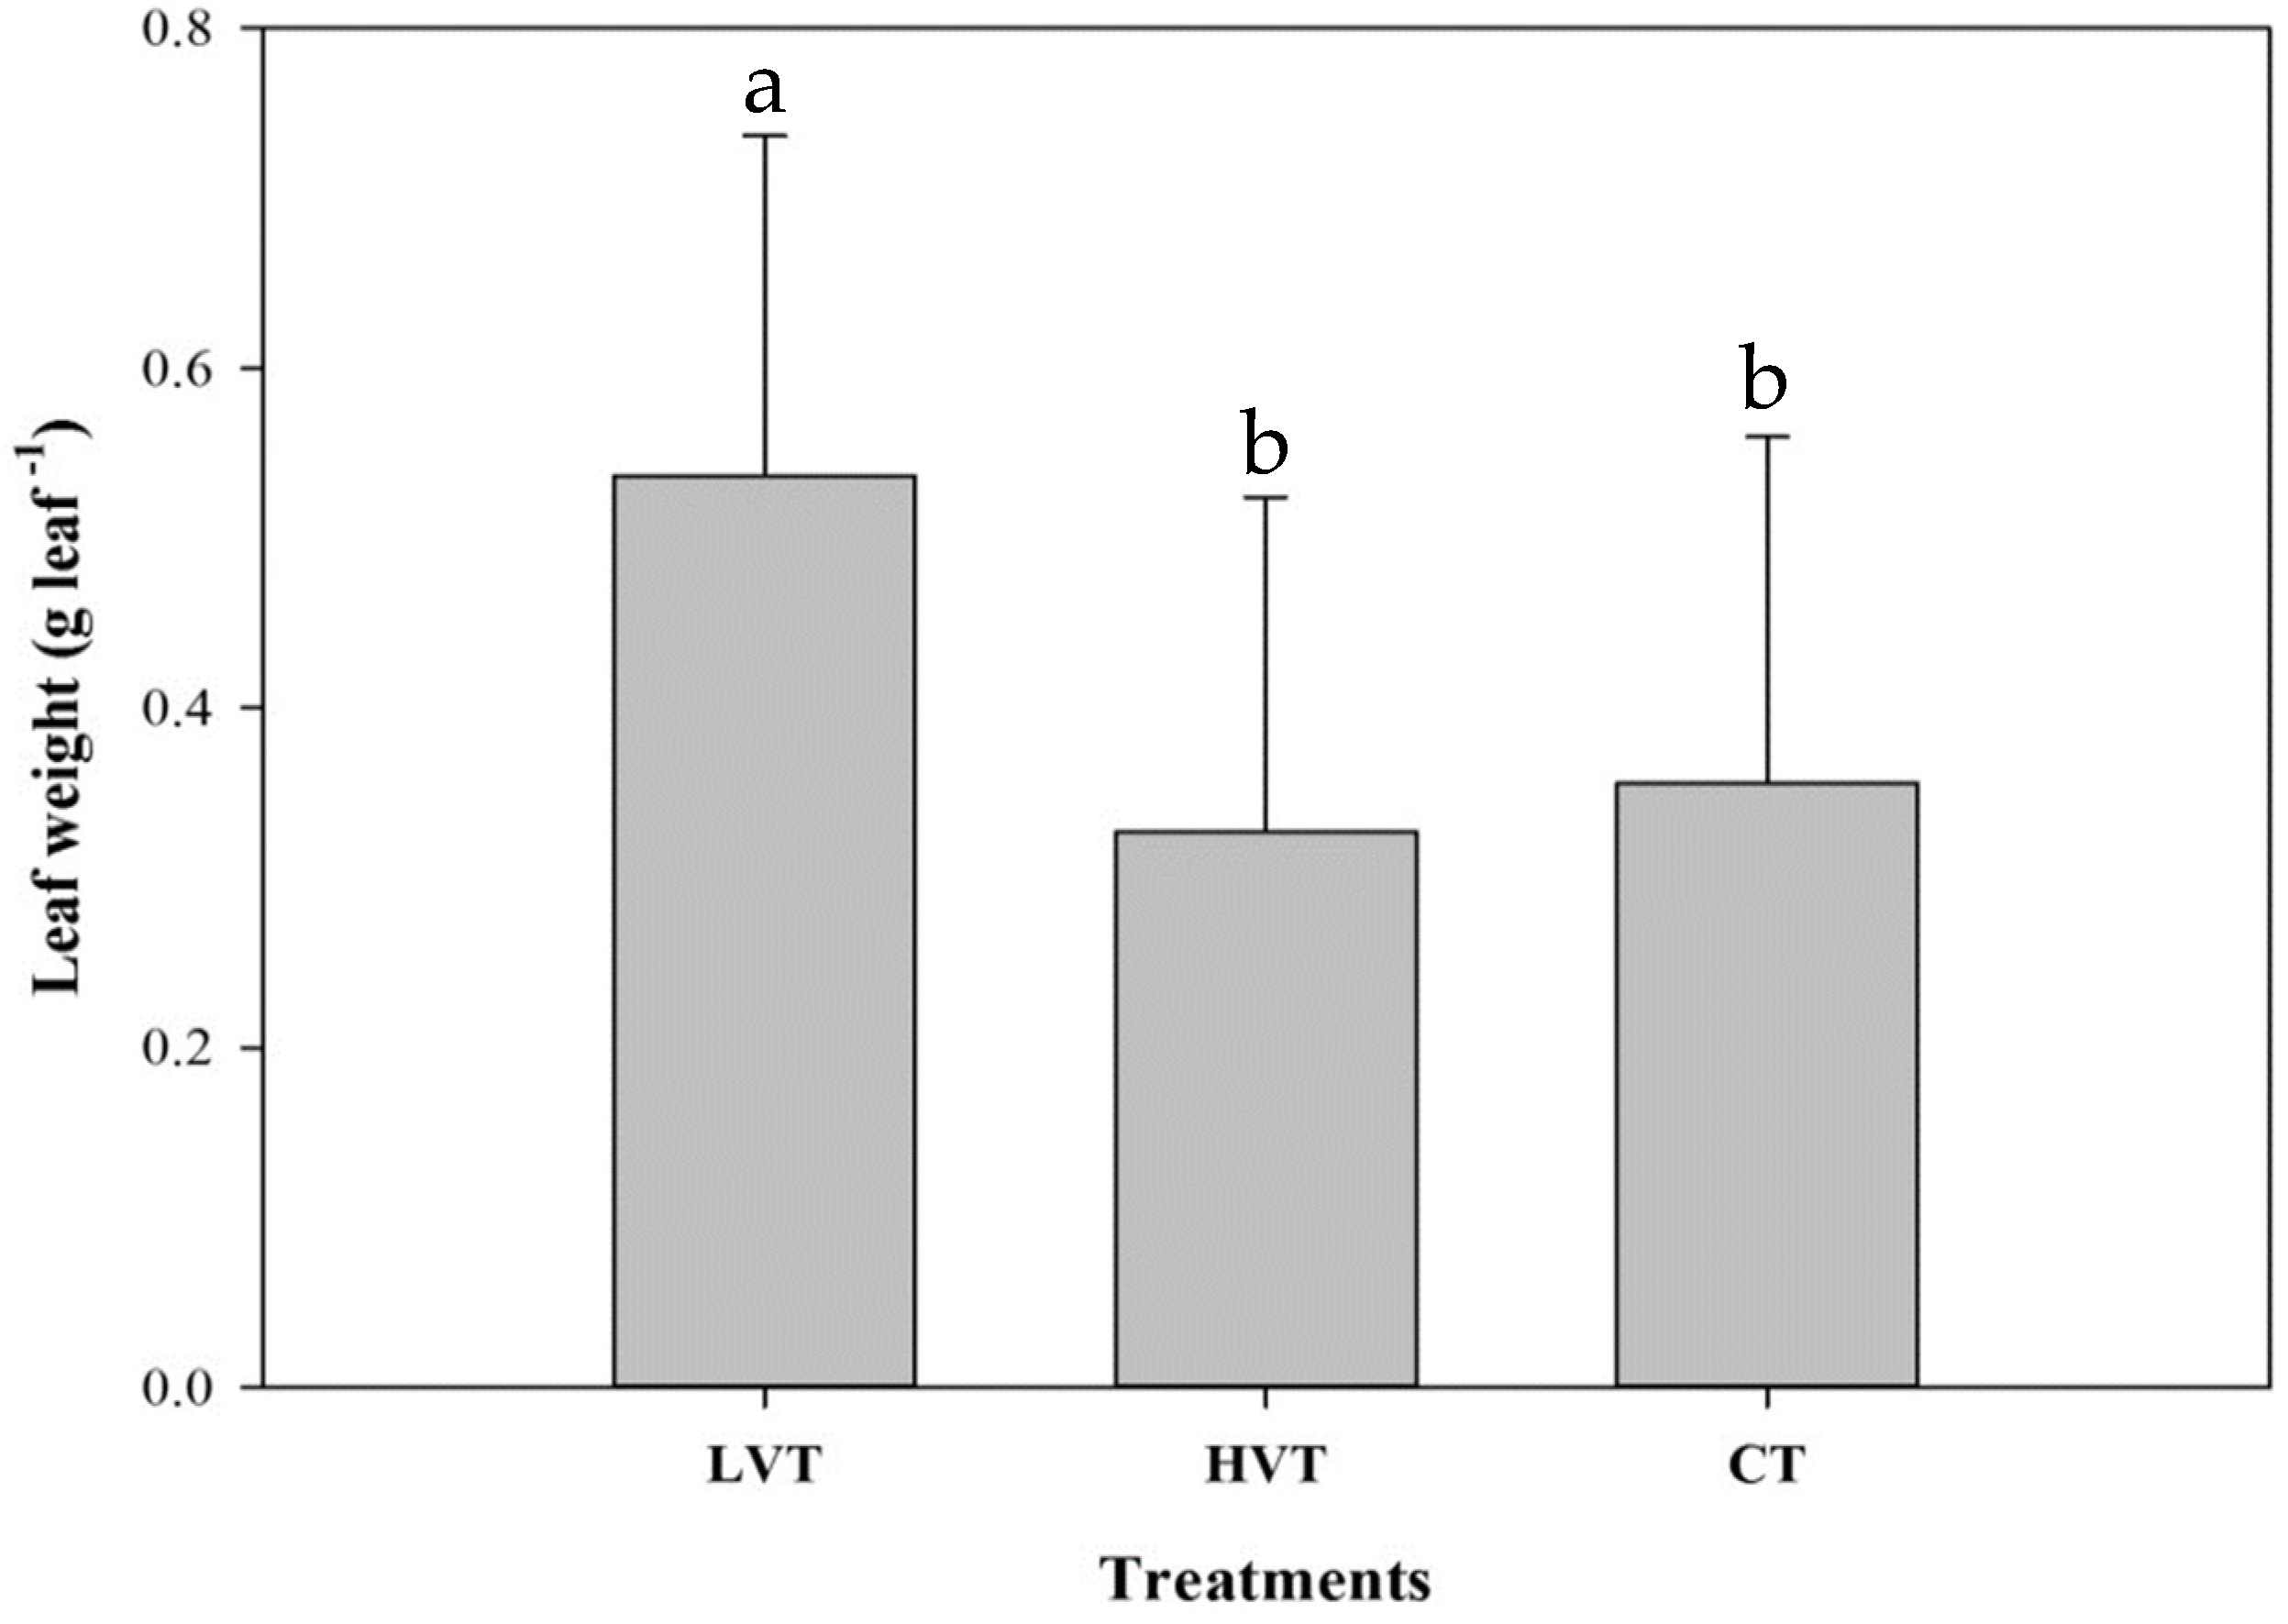
A comparison of average leaf weights is shown in Figure 10. The results of the analysis of variance show that there is a significant difference (F(2, 73) = 8.103, p < 0.001). However, for multiple comparisons, the Scheffé test shows that there is no significant difference between the constant temperature and the high oscillation temperature groups at the 95% confidence level, and the low oscillation temperature group is significantly different from the other two groups. The order of the average values is low oscillation temperature (0.537 g) > constant temperature (0.356 g) > high oscillation temperature (0.327 g).
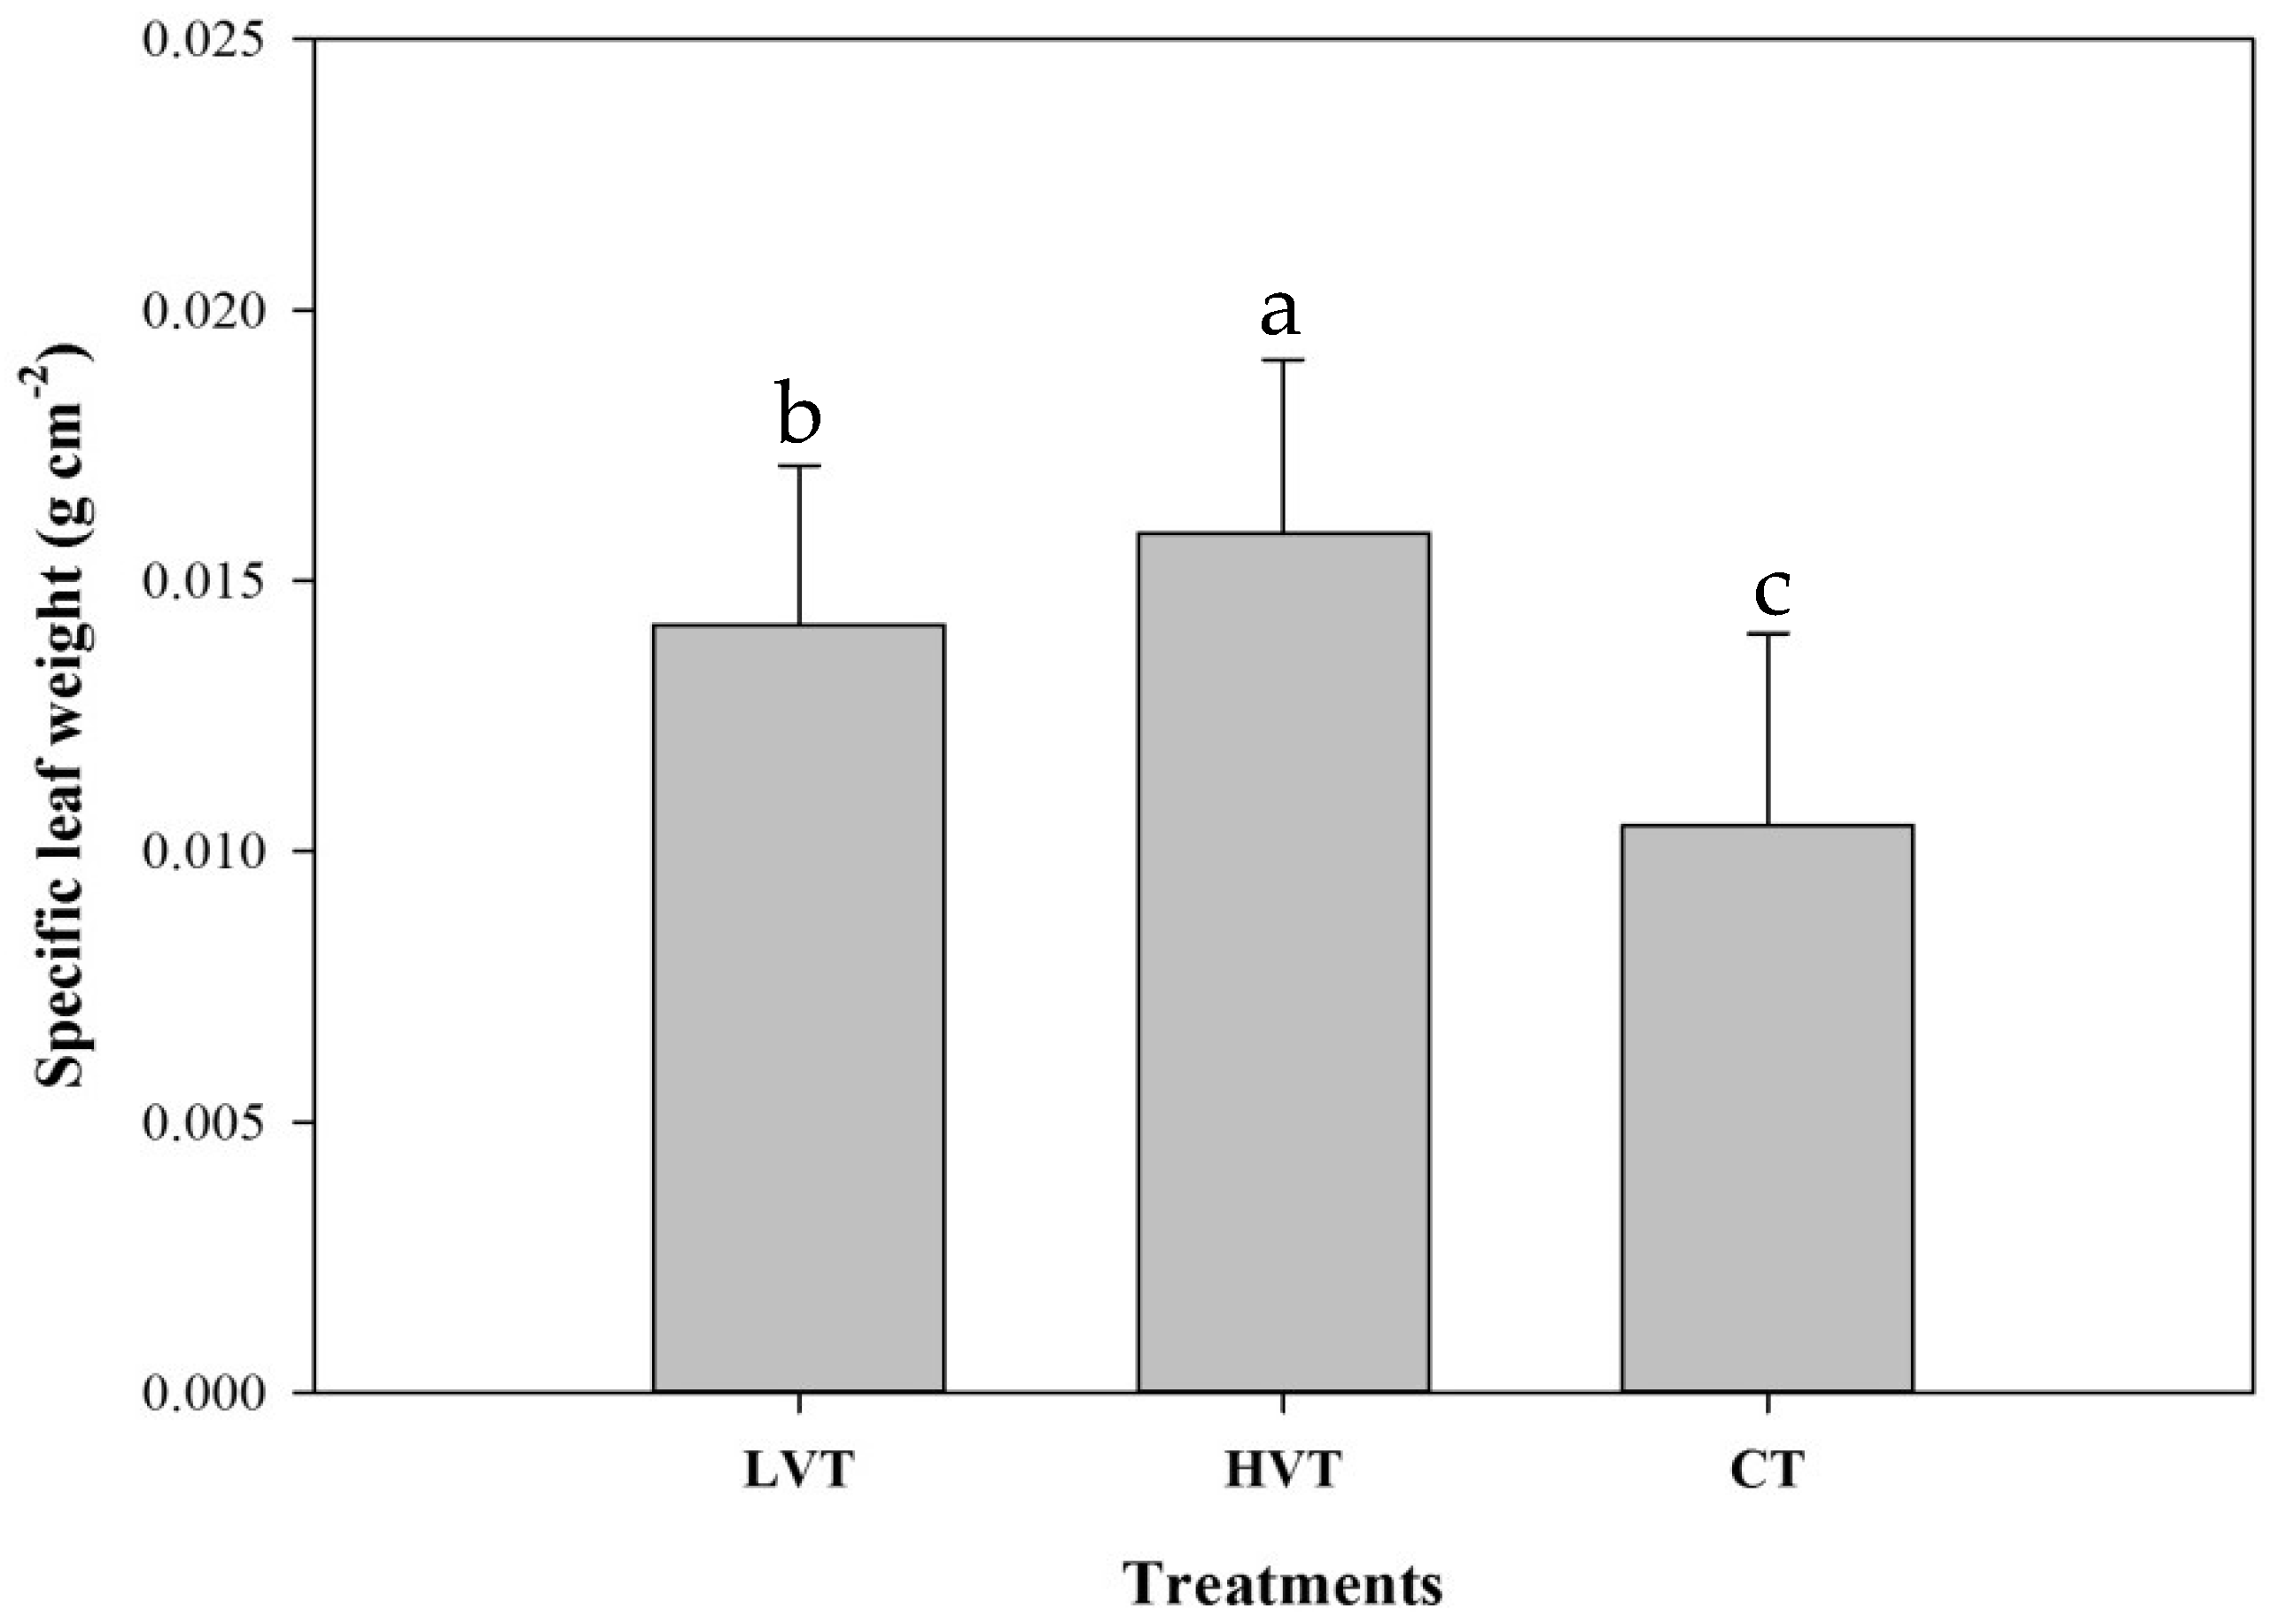
A comparison of average leaf specific weight is shown in Figure 11. The results of the analysis of variance show a significant difference (F(2, 73) = 18.781, p < 0.001). For multiple comparisons, the Scheffé test shows that there is a significant difference for each sample at the 95% confidence level. The order of the average value is high oscillation temperature (0.016 g/cm2) > low oscillation temperature (0.014 g/cm2) > constant temperature cultivation (0.010 g/cm2).
A comparison of the interval that is required to generate new leaves is shown in Figure 12. The analysis of variance results are significantly different (F(2, 82) = 4.319, p = 0.016). For multiple comparisons, there is a significant difference between the highly oscillating temperature and the low oscillation temperature at the 95% confidence level, as verified by the Scheffé test. The order of the average value is low oscillation temperature (20.923 days) > constant temperature (17.391 days) > high oscillation temperature (14.806 days).
Only two treatments (HVT and LVT) result in the development of fruit. No fruits were present in the sample that was grown using a constant temperature (CT), possibly because the nighttime temperature is higher.
The results for the fresh fruit Brix are not significantly different (F(1, 47) = 1.580, p = 0.215). There was no significant difference between fresh fruit weight (F(1, 53) = 3.562, p = 0.065). There were no significant differences between fresh fruit weights and fresh fruit Brix for the HVT and LVT groups.
In terms of vegetative growth, the leaf area was the smallest for the high temperature group. In terms of leaf weight, the low temperature and variable temperature cultivation groups were the heaviest. The leaf specific weight value was obtained by dividing the leaf weight by the leaf area. Leaf specific weight is an indicator of whether plants experience water stress [21].
Li et al. [21] found that hybrid rice has a heavier leaf weight if it is grown in areas with higher temperatures. Mustard (Brassica napus) seedlings also have a larger leaf density if they are grown in a higher-temperature environment [22]. This result is similar to that for strawberries in the high-temperature oscillation regime. However, Wassner and Ravetta [23] showed that Compositae plants that are grown in growth chambers with day and night temperatures of 25/20 °C have smaller leaf specific weights than those that are grown at 15/10 °C. This experiment used a constant temperature environment.
During the intervals to generate new leaves, less time is required to generate the next leaf in the high-temperature oscillation regime, but there was no significant difference in the number of leaves for the three groups, possibly because leaf growth was faster and aging was also faster in the high-temperature oscillation regime. The plants had a faster growth rate and metabolism in the high-temperature oscillation regime.
In terms of leaf length, leaf width, and flowering, a high oscillation temperature delayed the time for growth termination and a high degree of growth was maintained. The high oscillation temperature group had a smaller leaf area, lighter leaves, higher leaf specific weight, and smaller time intervals for generating a new leaf. The low oscillation temperature group had a longer time interval for generating a new leaf and heavier leaves. The constant temperature group had a longer time interval for generating a new leaf, lighter leaves, and smaller leaf specific weight. Due to the high night temperature, no fruits were harvested in the constant temperature treatment.
Somers et al. [24] studied both long and short circadian rhythms in Arabidopsis and found that plants for which the surroundings and clock cycles match each other have more chlorophyll, fix more carbon, grow faster, and grow better than unmatched plants. The results of this study support this conclusion.
The experimental results for Pak choi and strawberries show that temperature oscillation produces better growth characteristics than a constant temperature environment. Recently, an RNA-seq (and/or qRT-PCR) analysis has been used to identify the genes related to phenotypic traits and to provide new insights into the molecular mechanism [25,26,27,28,29]. This technique could be applied for further study of the effect of temperature oscillations on the growth characteristics of crops.
4. Conclusions
A grower chamber is usually used to study the effect of environmental factors on the crops and provides fixed temperature and light intensity. In this study, a novel growth chamber was used to control modules where the temperature was oscillated. Three treatments were applied in the same accumulated temperature study: high-temperature (HVT) oscillation conditions (day: 22–32 °C; night: 19–25 °C), low-temperature (LVT) oscillation conditions (day: 21–29 °C; night: 19–23 °C) and a constant temperature (CT) (day: 25 °C; night: 22 °C). The experiments using Pak choi featured the HVT, CT, and inside conditions of a net house. The experiments using strawberries featured the HVT, LVT, and CT conditions. The results of this study are listed as follows:
For Pak choi, the fresh weight of the entire plant, the fresh weight of the leaves, and the leaf area were best for the high-temperature oscillation treatment. The constant temperature treatment environment gave the poorest results. The chlorophyll content index of leaves in the net house group had the highest index. For strawberries, the high oscillation temperature group had a smaller leaf area, lighter leaves, higher leaf specific weight, and smaller time intervals for generating a new leaf. The low oscillation temperature group had a longer time interval for generating a new leaf and heavier leaves. There was no significant difference between the fresh fruit weight and the fresh fruit Brix for the HVT and LVT groups.
The experimental results for two crops show that temperature oscillation gives better growth characteristics than a constant temperature environment. The effect of the temperature oscillation may be explained by circadian regulation [30]. Temperature oscillation for the vegetable experiment is recommended when performing experiments on the effects of environmental factors on the growth of vegetables and other crops. The effect of temperature oscillation could be identified by the molecular mechanism and could be further studied with an RNA-seq (and/or qRT-PCR) analysis.
Author Contributions
Conceptualization, J.-W.W. and C.C.; methodology, C.C.; software, C.C.; validation, J.-W.W. and C.C.; formal analysis, J.-W.W.; investigation, C.C.; resources, C.C.; data curation, J.-W.W.; writing—original draft preparation, J.-W.W.; writing—review and editing, and C.C.; visualization, J.-W.W.; supervision, and C.C.; project administration, and C.C.; funding acquisition, and C.C. All authors have read and agreed to the published version of the manuscript.
Funding
This research received no external funding.
Data Availability Statement
Not applicable.
Acknowledgments
The authors thank the Ministry of Science and Technology of the Republic of China for financially supporting this research under Contract No. MOST -109-2313-B-005-038.
Conflicts of Interest
The authors declare no conflict of interest.
References
- Hall, D.O.; Scurlock, J.M.O.; Bolhar-Nordenkampf, H.R.; Leegood, R.C.; Long, S.P. Photosynthesis and Production. In A Changing Environment: A Field and Laboratory Manual, 1st ed.; Chapman & Hall, Inc.: London, UK, 1993. [Google Scholar]
- Field, C.; Berry, J.A.; Mooney, H.A. A portable system for measuring carbon dioxide and water vapour exchange of leaves. Plant Cell Environ. 1982, 5, 179–186. [Google Scholar] [CrossRef]
- Refinetti, R. Circadian Physiology, 2nd ed.; CRC Press: Boca Raton, FL, USA, 2006. [Google Scholar]
- Taiz, L.; Zeiger, E. Plant Physiology, 5th ed.; Sinauer Associates, Inc.: Sunderland, UK, 2010. [Google Scholar]
- Lawlor, D.W.; Fock, D.H. Photosynthesis, respiration, and carbon assimilation in water-stressed maize at two oxygen concentrations. J. Exp. Bot. 1978, 29, 579–593. [Google Scholar] [CrossRef]
- Turpin, D.H.; Elrifi, I.R.; Birch, D.G.; Weger, H.G.; Holmes, J.J. Interactions between photosynthesis, respiration, and nitrogen assimilation in microalgae. Can. J. Bot. 1988, 66, 2083–2097. [Google Scholar] [CrossRef]
- Hennessey, T.L.; Field, C.B. Circadian rhythms in photosynthesis: Oscillations in carbon assimilation and stomatal conductance under constant Conditions. Plant Physio. 1991, 96, 831–836. [Google Scholar] [CrossRef] [PubMed] [Green Version]
- Bernacchi, C.J.; Pimentel, C.; Long, S.P. In vivo temperature response functions of parameters required to model RuBP-limited photosynthesis. Plant Cell Environ. 2003, 26, 1419–1430. [Google Scholar] [CrossRef]
- Inayama, M.; Murakami, T. Physiological studies on optimal environment in growing of the vegetable crops under the g1ass- and plastic-houses. l. Temperature analysis for growing cucumber. Bull. Chiba-Ken Agric. Exp. Stn. 1970, 10, 62–72. [Google Scholar]
- Inayama, M.; Murakami, T. Physiological studies on optimal environment in growing of the vegetable crops under the g1ass- and plastic-houses II. Effect of light experience on the management of day and night temperature in fruit vegetables. Bull. Chiba-Ken Agric. Exp. Stn. 1975, 16, 31–42. [Google Scholar]
- Gagnon, S.; Dansereau, B. Temperature and duration of pretreatment effects on growth and development of Geraniums. HortScience 1991, 27, 216–217. [Google Scholar] [CrossRef]
- Nkansah, G.O.; Ito, T. Effect of air and root-zone temperatures on physiological characteristics and yield of heat-tolerant and non heat-tolerant tomato cultivars. J. Jpn. Soc. Hortic. Sci. 1995, 64, 315–320. [Google Scholar] [CrossRef] [Green Version]
- Dodd, A.; Salathia, N.; Hall, A.; Kévei, E.; Tóth, R.; Nagy, F.; Hibberd, J.M.; Millar, A.J.; Webb, A.A.R. Plant circadian clocks increase photosynthesis, growth, survival, and competitive advantage. Science 2005, 309, 630–633. [Google Scholar] [CrossRef] [Green Version]
- Fredeen, A.L.; Hennessey, T.L.; Field, C.B. Biochemical correlates of the circadian rhythm in photosynthesis in Phaseolus vulgaris. Plant Physiol. 1991, 97, 415–419. [Google Scholar] [CrossRef] [PubMed] [Green Version]
- Wilkins, M.B. Circadian rhythms: Their origin and control. New Phytol. 1992, 121, 347–375. [Google Scholar] [CrossRef]
- Webb, A.A.R. The physiology of circadian rhythms in plants. New Phytol. 2003, 160, 281–303. [Google Scholar] [CrossRef] [Green Version]
- McClung, C.R. Circadian rhythms in plant: A millennial view. Physiol. Plant. 2000, 109, 359–371. [Google Scholar] [CrossRef] [Green Version]
- Jones, H.G. Plants and Microclimate a Quantitative Approach to Environmental Plant Physiology, 3rd ed.; Cambridge University Press: Cambridge, UK, 2013; pp. 167–171. [Google Scholar]
- Yan, W.; Hunt, L.A. An equation for modelling the temperature response of plants using only the cardinal temperatures. Ann. Bot. 1999, 84, 607–614. [Google Scholar] [CrossRef] [Green Version]
- Gent, M.P.N.; Enoch, H.Z. Temperature dependence of vegetative growth and dark respiration: A mathematical model. Plant Physio. 1983, 71, 562–567. [Google Scholar] [CrossRef] [Green Version]
- Li, G.; Xue, L.; Gu, W.; Yang, C.; Wang, S.; Ling, Q.; Qin, X.; Ding, Y. Comparison of yield components and plant type characteristics of high-yield rice between Taoyuan, a ‘special eco-site’ and Nanjing, China. Field Crops Res. 2009, 112, 214–221. [Google Scholar] [CrossRef]
- Qaderi, M.M.; Kurepin, L.V.; Reid, D.M. Effects of temperature and watering regime on growth, gas exchange and abscisic acid content of canola (Brassica napus) seedlings. Environ. Exp. Bot. 2012, 75, 107–113. [Google Scholar] [CrossRef]
- Wassner, D.F.; Ravetta, D.A. Temperature effects on leaf properties, resin content, and composition in Grindelia chiloensis (Asteraceae). Ind. Crops Prod. 2005, 21, 155–163. [Google Scholar] [CrossRef]
- Somers, D.E.; Devlin, P.F.; Kay, S.A. Phytochromes and cryptochromes in the entrainment of the Arabidopsis circadian clock. Science 1998, 282, 1488–1490. [Google Scholar] [CrossRef] [Green Version]
- Zhang, L.; Xu, B.; Wu, T.; Yang, Y.; Fan, L.; Wen, M.; Sui, J. Transcriptomic profiling of two Pak Choi varieties with contrasting anthocyanin contents provides an insight into structural and regulatory genes in anthocyanin biosynthetic pathway. BMC Genom. 2017, 18, 288. [Google Scholar] [CrossRef] [PubMed] [Green Version]
- Zhang, L.; Xu, B.; Wu, T.; Wen, M.X.; Fan, L.X.; Feng, Z.Z.; Paoletti, E. Transcriptomic analysis of Pak Choi under acute ozone exposure revealed regulatory mechanism against ozone stress. BMC Plant Boil. 2017, 17, 236. [Google Scholar] [CrossRef] [Green Version]
- Wu, X.; Zhu, Z.B.; Chen, J.H.; Huang, Y.F.; Liu, Z.L.; Zou, J.W.; Cui, J. Transcriptome analysis revealed pivotal transporters involved in the reduction of cadmium accumulation in pak choi (Brassica chinensis L.) by exogenous hydrogen-rich water. Chemosphere 2019, 216, 684–697. [Google Scholar] [CrossRef] [PubMed]
- Wu, H.; Song, X.; Lyu, S.; Ren, Y.; Liu, T.; Hou, X.; Zhang, C. Integrated analysis of Hi-C and RNA-Seq reveals the molecular mechanism of autopolyploid growth advantages in Pak Choi (Brassica rapa ssp. chinensis). Front. Plant Sci. 2022, 13, 905202. [Google Scholar] [CrossRef] [PubMed]
- Zhu, B.; Wang, K.; Liang, Z.; Zhu, Z.; Yang, J. Transcriptome analysis of glutathione response: RNA-Seq provides insights into balance between antioxidant response and glucosinolate metabolism. Antioxidants 2022, 11, 1322. [Google Scholar] [CrossRef]
- Dodd, A.; Kusakina, N.; Hall, J.A.; Gould, P.D.; Hanaoka, M. The circadian regulation of photosynthesis. Photosynth. Res. 2014, 119, 181–190. [Google Scholar] [CrossRef]
Figure 1.
The temperature for the two oscillation patterns and fixed temperature with the same accumulated temperature.
Figure 1.
The temperature for the two oscillation patterns and fixed temperature with the same accumulated temperature.

Figure 2.
The actual temperature for the two oscillation patterns and the fixed temperature regime with the same accumulated temperature. LVT is the low-temperature oscillation pattern, HVT is the high-temperature oscillation pattern, and CT is a constant temperature condition.
Figure 2.
The actual temperature for the two oscillation patterns and the fixed temperature regime with the same accumulated temperature. LVT is the low-temperature oscillation pattern, HVT is the high-temperature oscillation pattern, and CT is a constant temperature condition.

Figure 3.
Growth of Pak choi for each treatment. On the right is the high-temperature (HVT) oscillation pattern, in the middle is the fixed temperature (CT) regime, and on the left is the inside temperature conditions of a net house.
Figure 3.
Growth of Pak choi for each treatment. On the right is the high-temperature (HVT) oscillation pattern, in the middle is the fixed temperature (CT) regime, and on the left is the inside temperature conditions of a net house.

Figure 4.
The mean fresh weight of whole plants for Pak choi for each treatment. The numeric values of the fresh weight were the average of the samples. Means followed by the same letter are not significantly different (p < 0.05, Tukey multiple comparison tests). HVT is the high-temperature oscillation pattern, CT is the fixed temperature regime, and OT is the inside temperature of a net house. The length of the error bar is proportional to the standard error of the mean.

Figure 5.
The average leaf area for Pak choi for each treatment. Means followed by the same letter are not significantly different (p < 0.05, Tukey multiple comparison tests). HVT is the high-temperature oscillation pattern, CT is the fixed temperature regime, and OT is the inside temperature of a net house.

Figure 6.
Average indexed chlorophyll content for Pak choi for each treatment. Means followed by the same letter are not significantly different (p < 0.05, Tukey multiple comparison tests). HVT is the high-temperature oscillation pattern, CT is the fixed temperature regime, and OT is the inside temperature of a net house.

Figure 7.
The atmospheric temperature is from 6/10 to 7/10 in Taichung (Taichung weather stations).

Figure 8.
Growth conditions for strawberries for each treatment. HVT is the high varied temperature condition treatment, LVT is the low varied temperature condition treatment, and CT is the constant temperature treatment.
Figure 8.
Growth conditions for strawberries for each treatment. HVT is the high varied temperature condition treatment, LVT is the low varied temperature condition treatment, and CT is the constant temperature treatment.

Figure 9.
The average leaf area for strawberries for each treatment. Means followed by the same letter are not significantly different (p < 0.05, Scheffé test). LVT is the low-temperature oscillation pattern, HVT is the high-temperature oscillation pattern, and CT is the fixed temperature regime.
Figure 9.
The average leaf area for strawberries for each treatment. Means followed by the same letter are not significantly different (p < 0.05, Scheffé test). LVT is the low-temperature oscillation pattern, HVT is the high-temperature oscillation pattern, and CT is the fixed temperature regime.

Figure 10.
The average leaf weight for strawberries for each treatment. Means followed by the same letter are not significantly different (p < 0.05, Scheffé test). LVT is the low-temperature oscillation pattern, HVT is the high-temperature oscillation pattern, and CT is the fixed temperature regime.

Figure 11.
The average leaf specific weight for strawberry for each treatment. Means followed by the same letter are not significantly different (p < 0.05, Scheffé test). LVT is the low-temperature oscillation pattern, HVT is the high-temperature oscillation pattern, and CT is the fixed temperature regime.

Figure 12.
Time intervals for generating new leaves for strawberries for each treatment. Means followed by the same letter are not significantly different (p < 0.05, Scheffé test). LVT is the low-temperature oscillation pattern, HVT is the high-temperature oscillation pattern, and CT is the fixed temperature regime.


Table 1.
Average and standard deviation of the fresh weight for Pak choi for each treatment.
| Treatments | |||
|---|---|---|---|
| Parts | Fresh Weight (g) | ||
| HVT 1 | CT 2 | OT 3 | |
| Shoot | 5.35 ± 1.51 a | 1.78 ± 0.75 c | 3.62 ± 1.15 b |
| Root | 0.32 ± 0.16 b | 0.17 ± 0.03 c | 0.67 ± 0.27 a |
| |||
| |||
| |||
Means within a row followed by the same letter are not significantly different (p < 0.05, Tukey multiple comparison tests).
Publisher’s Note: MDPI stays neutral with regard to jurisdictional claims in published maps and institutional affiliations. |
© 2022 by the authors. Licensee MDPI, Basel, Switzerland. This article is an open access article distributed under the terms and conditions of the Creative Commons Attribution (CC BY) license (https://creativecommons.org/licenses/by/4.0/).
Share and Cite
MDPI and ACS Style
Wang, J.-W.; Chen, C. From Laboratory to Field: The Effect of Controlling Oscillations in Temperature on the Growth of Crops. Horticulturae 2022, 8, 708. https://doi.org/10.3390/horticulturae8080708
AMA Style
Wang J-W, Chen C. From Laboratory to Field: The Effect of Controlling Oscillations in Temperature on the Growth of Crops. Horticulturae. 2022; 8(8):708. https://doi.org/10.3390/horticulturae8080708
Chicago/Turabian StyleWang, Jhih-Wei, and Chiachung Chen. 2022. "From Laboratory to Field: The Effect of Controlling Oscillations in Temperature on the Growth of Crops" Horticulturae 8, no. 8: 708. https://doi.org/10.3390/horticulturae8080708
Note that from the first issue of 2016, this journal uses article numbers instead of page numbers. See further details here.