Article

Effects of Light Intensity and Temperature on the Photosynthesis Characteristics and Yield of Lettuce

1
Key Laboratory of Modern Agricultural Equipment and Technology, Ministry of Education, Jiangsu University, Zhenjiang 212013, China
2
College of Biology and Environment, Nanjing Forestry University, Nanjing 210037, China
*
Author to whom correspondence should be addressed.
Horticulturae 2022, 8(2), 178; https://doi.org/10.3390/horticulturae8020178
Submission received: 13 January 2022 / Revised: 19 February 2022 / Accepted: 20 February 2022 / Published: 21 February 2022

Abstract

:
Lettuce is an important vegetable in horticulture, but information about the interactive effects of light and temperature on its photosynthetic characteristics was inadequate. This work investigated the effects of three temperatures (15/10 (T15), 23/18 (T23), and 30/23 °C (T30)) and five light treatments (100 (P100), 200 (P200), 350 (P350), 500 (P500), and 600 μmol·m−2·s−1 (P600)) on the light–response curves, chlorophyll content, and yield of lettuce. The results showed that the maximum photosynthetic rate, light saturation point, chlorophyll content, and yield of lettuce were all the highest at T23 compared with T15 and T30 under different light intensities. Under the same temperature conditions, the photosynthesis capacity and yield of lettuce in the P350 and P500 treatments at T15, P350, P500, and P600 treatments at T23 and P500, and P600 treatments at T30 were larger than other light treatments. The results suggested that temperature play had a more pronounced influence on photosynthesis and yield in lettuce, but the appropriate levels of light intensity improved its potential photosynthetic capacity and yield under different temperature conditions.

1. Introduction

Photosynthesis provides energy and organic matter for growth and development, and determines the yield of the crop. Light and temperature are the main factors affecting crop photosynthesis process. They effect the activities of photosynthetic carbon assimilation enzymes, the photoactive opening of stomata, the metabolites accumulation, and pigment composition of cells [1,2,3,4,5,6]. High and low values of temperatures and light intensity usually exert adverse effects on plant photosynthesis, resulting in a considerably reduction of plant yield [2,4,7,8,9,10,11]. In addition, light and temperature do not independently affect the photosynthesis and growth property of crops, but have a complementary and mutually exciting relationship [6,12].
Lettuce is the main cultivated leafy vegetable in greenhouses and plant factory, and often used as a model crop to study plant response to the controlled environment [13,14,15,16]. This plant has many desirable properties for cultivation in a controlled environment, such as its short growth cycle, low energy demands, and a high and stable yield [17,18]. In lettuce, the effect of light intensity or temperature on lettuce photosynthetic characteristics and growth has been discussed widely [19,20,21,22,23,24]. However, the interaction of light and temperature have been rarely concerned. In the earlier studies, Knight et al. described the influence of light intensity (444 and 889 μmol·m−2 s−1) and temperature (25 and 20 °C) on the productivity of two cultivars of leaf lettuce. Leaf dry mass of both cultivars was highest under the high light intensity/warm temperature regime and lowest under the low light intensity/cool temperature regime [25]. Galieni et al. evaluated the impact of low light on lettuce growth and physiology in two different growing seasons. In contrast, the lettuce treated with low light in the low-temperature growing season had a lower relative growth rate and a higher leaf area, while in the high-temperature growing season, the stomatal conductance was reduced more by the low-light treatment [26]. Some researchers have found that simultaneous increases of light intensity and temperature within feasible range could facilitate lettuce’s growth and nutritional values largely [27]. These studies indicate that light intensity and temperature co-regulated the lettuce’s growth and development, and their reasonable combination increases better for lettuce growth. However, these studies are insufficient to establish lettuce growth models to optimize the light and temperature environment in the greenhouse.
The ligh—response curves describe the relationship between photosynthetic rate and photosynthetic photon flux density (PPFD) as analytical tools, which is widely used for the physiological characterization of gas exchange at the leaf level. They may represent useful criteria for controlling the environment and are required tools for simulation models designed to predict potential plant behavior in response to environmental conditions [28,29,30,31]. Hence, the objectives of this research were to compare the parameters of the light–response curves at different growth periods of lettuce under the interaction of light intensity and temperature and to understand the mechanism of the effects of light intensity and temperature on photosynthesis during lettuce growth. These results would provide theoretical background for the combinational regulation of light intensity and temperature to improve production of lettuce cultivated in greenhouse and plant factories.

2. Materials and Methods

2.1. Plant Materials and Growth Conditions

Experiments were conducted in an artificial climatic chamber in Jiangsu University in China. The climate chamber had two cultivation shelves, each comprising three layers. Artificial light sources were installed at the top of each layer. Red–blue light-emitting diode (LED) arrays (DR/W120; Philips Lighting Inc., Maarheeze, The Netherlands) and fluorescent lamps (T5-28; Nonghui Biotechnology Co., Ltd., Shanghai, China) were used as light sources. Both types of light sources exhibited energy aggregation areas at approximately 440 and 650 nm. Romaine lettuce (L. sativa L.) was selected as the experimental plant. Uniformized seedlings of romaine lettuce at 3-leaf stage were transplanted into individual plastic pot (15.5 cm [d] × 13 cm [h]) filled with vinegar residue, peat, and vermiculite at a ratio of 2:1:1 (v:v:v). One seedling was planted in each pot.
Experiments were arranged in three batches as follows: Experiment 1: 30/25 °C (26 September 2015 to 25 October 2015); Experiment 2: 23/18 °C (10 April 2016 to 09 May 2016); and Experiment 3: 15/10 °C (05 December 2016 to 05 January 2017). Each experimental set comprised five light intensity levels of 100, 200, 350, 500, and 600 μmol·m−2·s−1, which were achieved by combining varying numbers of LED and fluorescent lamps on each layer of the cultivation shelves. The treatments P100, P200, P350, P500, and P600 represent 100, 200, 350, 500, and 600 μmol·m−2·s−1, respectively. The treatments T15, T23, and T30 represent 15/10, 23/18, and 30/25 °C (light/dark), respectively. Each level of light treatment housed 28 samples with the planting space 20 × 20 cm.

2.2. Light–Response Curves Measurements

Light–response curves were developed using a LI-6400XT portable photosynthesis system (Li-Cor Inc., Lincoln, Nebraska, USA) with a red–blue LED light source (6400-02B) at weeks 2, 3, 4, and 5 after transplantation. Three plants were used per treatment, and the sixth fully expanded leaves were selected for measurements. To avoid the effect of environmental fluctuations on gas-exchange measurements, all measurements were taken in another artificial climatic chamber with a PPFD at the leaf surface of 600 μmol·m−2·s−1, relative humidity of 60–70% and temperature consistent with the actual processing temperature. The chlorophyll content of the leaf was measured via the SPAD value before measuring the light–response curve, which was determined using a SPAD-502 portable chlorophyll meter (KONICA MINOLTA, Osaka, Japan). Light–response curves were measured using the PPFD of 1200, 1100, 1000, 800, 600, 500, 350, 200, 120, 50, and 0 μmol·m−2·s−1 at T15 and T23; 1000, 800, 600, 500, 400, 300, 200, 150, 50, 20, and 0 μmol·m−2·s−1 at T30 between 08:30 and 16:30 h. The flow rate was 500 μmol·s−1 and the ambient CO2 concentration was adjusted to 400 μmol·s−1 inside the Li-Cor leaf chamber. The light–response curves were fitted by a modified rectangular hyperbolic model [32]:
P N = α 1 β · PPFD 1 + γ · PPFD PPFD R D
where PN is the net photosynthetic rate, α is the initial slope of the light–response curve or apparent quantum efficiency (AQY), β and γ are coefficients independent of the PPFD (dimensionless), and RD is the dark respiration rate. The light-saturated net photosynthetic rate (PNmax), light saturation point (LSP), and light compensation point (LCP) were given by the following formulae:
P Nmax = α ( β + γ β γ ) 2 R D
LSP = ( β + γ ) / β 1 γ
LCP = α γ β ( γ R D α ) 2 4 α β R D 2 α β

2.3. Yield Measurements

At the end of each experiment, lettuce plants were harvested and the fresh weights of the above-ground parts under different temperature and light intensity treatments were determined using an electronic analytical balance with an accuracy of 0.1 mg.

2.4. Statistical Analysis

Results were expressed as the mean ± SD of three replicates in each of three individuals. Data were analyzed using two-way analysis of variance (ANOVA) using SPSS 20 software. Multiple comparisons between treatment means were conducted using the least significant difference (LSD) test. All the model parameters were evaluated with a nonlinear regression using OriginPro 8 software. Graphs and tables were constructed using Microsoft Excel 2017.

3. Results

3.1. Light–Response Curves

Light–response curves were well fitted by the modified rectangular hyperbolic model as indicated by a correlation coefficient R2, which were more than 0.993 and they showed synchronous changes under different light treatments with the same temperature for all four treatment times (Figure 1). In the range of 0–200 μmol·m−2·s−1, there was no significant difference in the PN among the five light intensity treatments. Above 200 μmol·m−2·s−1, different degrees of separation of the curves of PN in all treatments occur. Two-way ANOVA revealed that AQY, PNmax, RD, LSP, and LCP were closely related to light, temperature, and the two interactions at all determined times (Table 1).

3.2. Light–Response Curves Parameters

3.2.1. Apparent Quantum Efficiency (AQY)

Under all light treatments, the values at T15 were significantly lower than those at T23 and T30 at all determined times (Figure 2A–C). Within a given temperature, there were significant differences in AQY among all light treatments. At T15, AQY in the P350 and P500 treatments were higher than those of other light intensity treatments within 4 weeks after transplanting, but AQY in the P100 treatment exceeded them at week 5. The lowest AQY was obtained at P600 at all determined times (Figure 2A). At T23, the AQY in the P350, P500, and P600 treatments maintained high levels during the treatment period (Figure 2B). At T30, AQY in the P350, P500, and P600 treatments were greater than those in the P100 and P200 treatments within week 3, while AQY in the P100 and P200 treatment exceeded them at weeks 4 and 5 (Figure 2C).

3.2.2. Maximum Photosynthetic Rate (PNmax)

For any given light intensity, PNmax at T23 were highest followed those at T30 and T15 at all determined times (Figure 2D–F). Under all the three temperature conditions, PNmax was the lowest in the P100 treatment and the second lowest in the P200 treatment at every measurement time. At T15, PNmax in the P350 and P500 treatments increased first and then decreased with time, reaching the maximum at week 4, while the PNmax in the P100, P200, and P600 treatments increased gradually with time. PNmax in the P350 and P500 treatments were significantly higher than those in other light treatments during the treatment period (Figure 2D). At T23, the PNmax values in all light treatments increased first and then decreased with time, of which in the P350, P500, and P600 treatments reached the maximum at week 3, and others reached the maximum at week 4. PNmax in the P350 treatment was significantly greater than those in the P500 and P600 treatments at weeks 2 and 3, while no significant differences were observed among those in the P350, P500, and P600 at weeks 4 and 5 (Figure 2E). At T30, the PNmax values in the P500 and P600 treatments showed a decreasing trend with time, while those in the P350 treatment increased first and then decreased with time, reaching the maximum at week 3, and those in P100 and P200 showed an increasing trend with time. PNmax in the P500 treatment was highest, followed by that in the P600 treatment within 4 weeks of transplanting, while there were no significant differences among those in the P350, P500, and P600 at week 5 (Figure 2F).

3.2.3. Dark Respiration Rate (RD)

As with PNmax, RD at T23 were highest followed those at T30 and T15 in all light intensity treatments at all determined times (Figure 2G–I). At T15, RD in the P350 and P500 treatments maintained high levels during the treatment period, while the lowest RD values appeared in the P100 treatment at weeks 2 and 3, and in the P600 treatment at week 4 and 5 (Figure 2G). At T23, the RD values in the P350 treatment were significantly greater than those in other treatments within 4 weeks of transplanting, followed by those in the P500 treatment, and there were no significant differences among those in the P350, P500, and P600 treatment at week 5 (Figure 2H). At T30, the highest RD values were obtained in the P500 and P600 treatments at all determined times (Figure 2I). At T23 and T30, the lowest and second lowest RD values all occurred under P100 and P200.

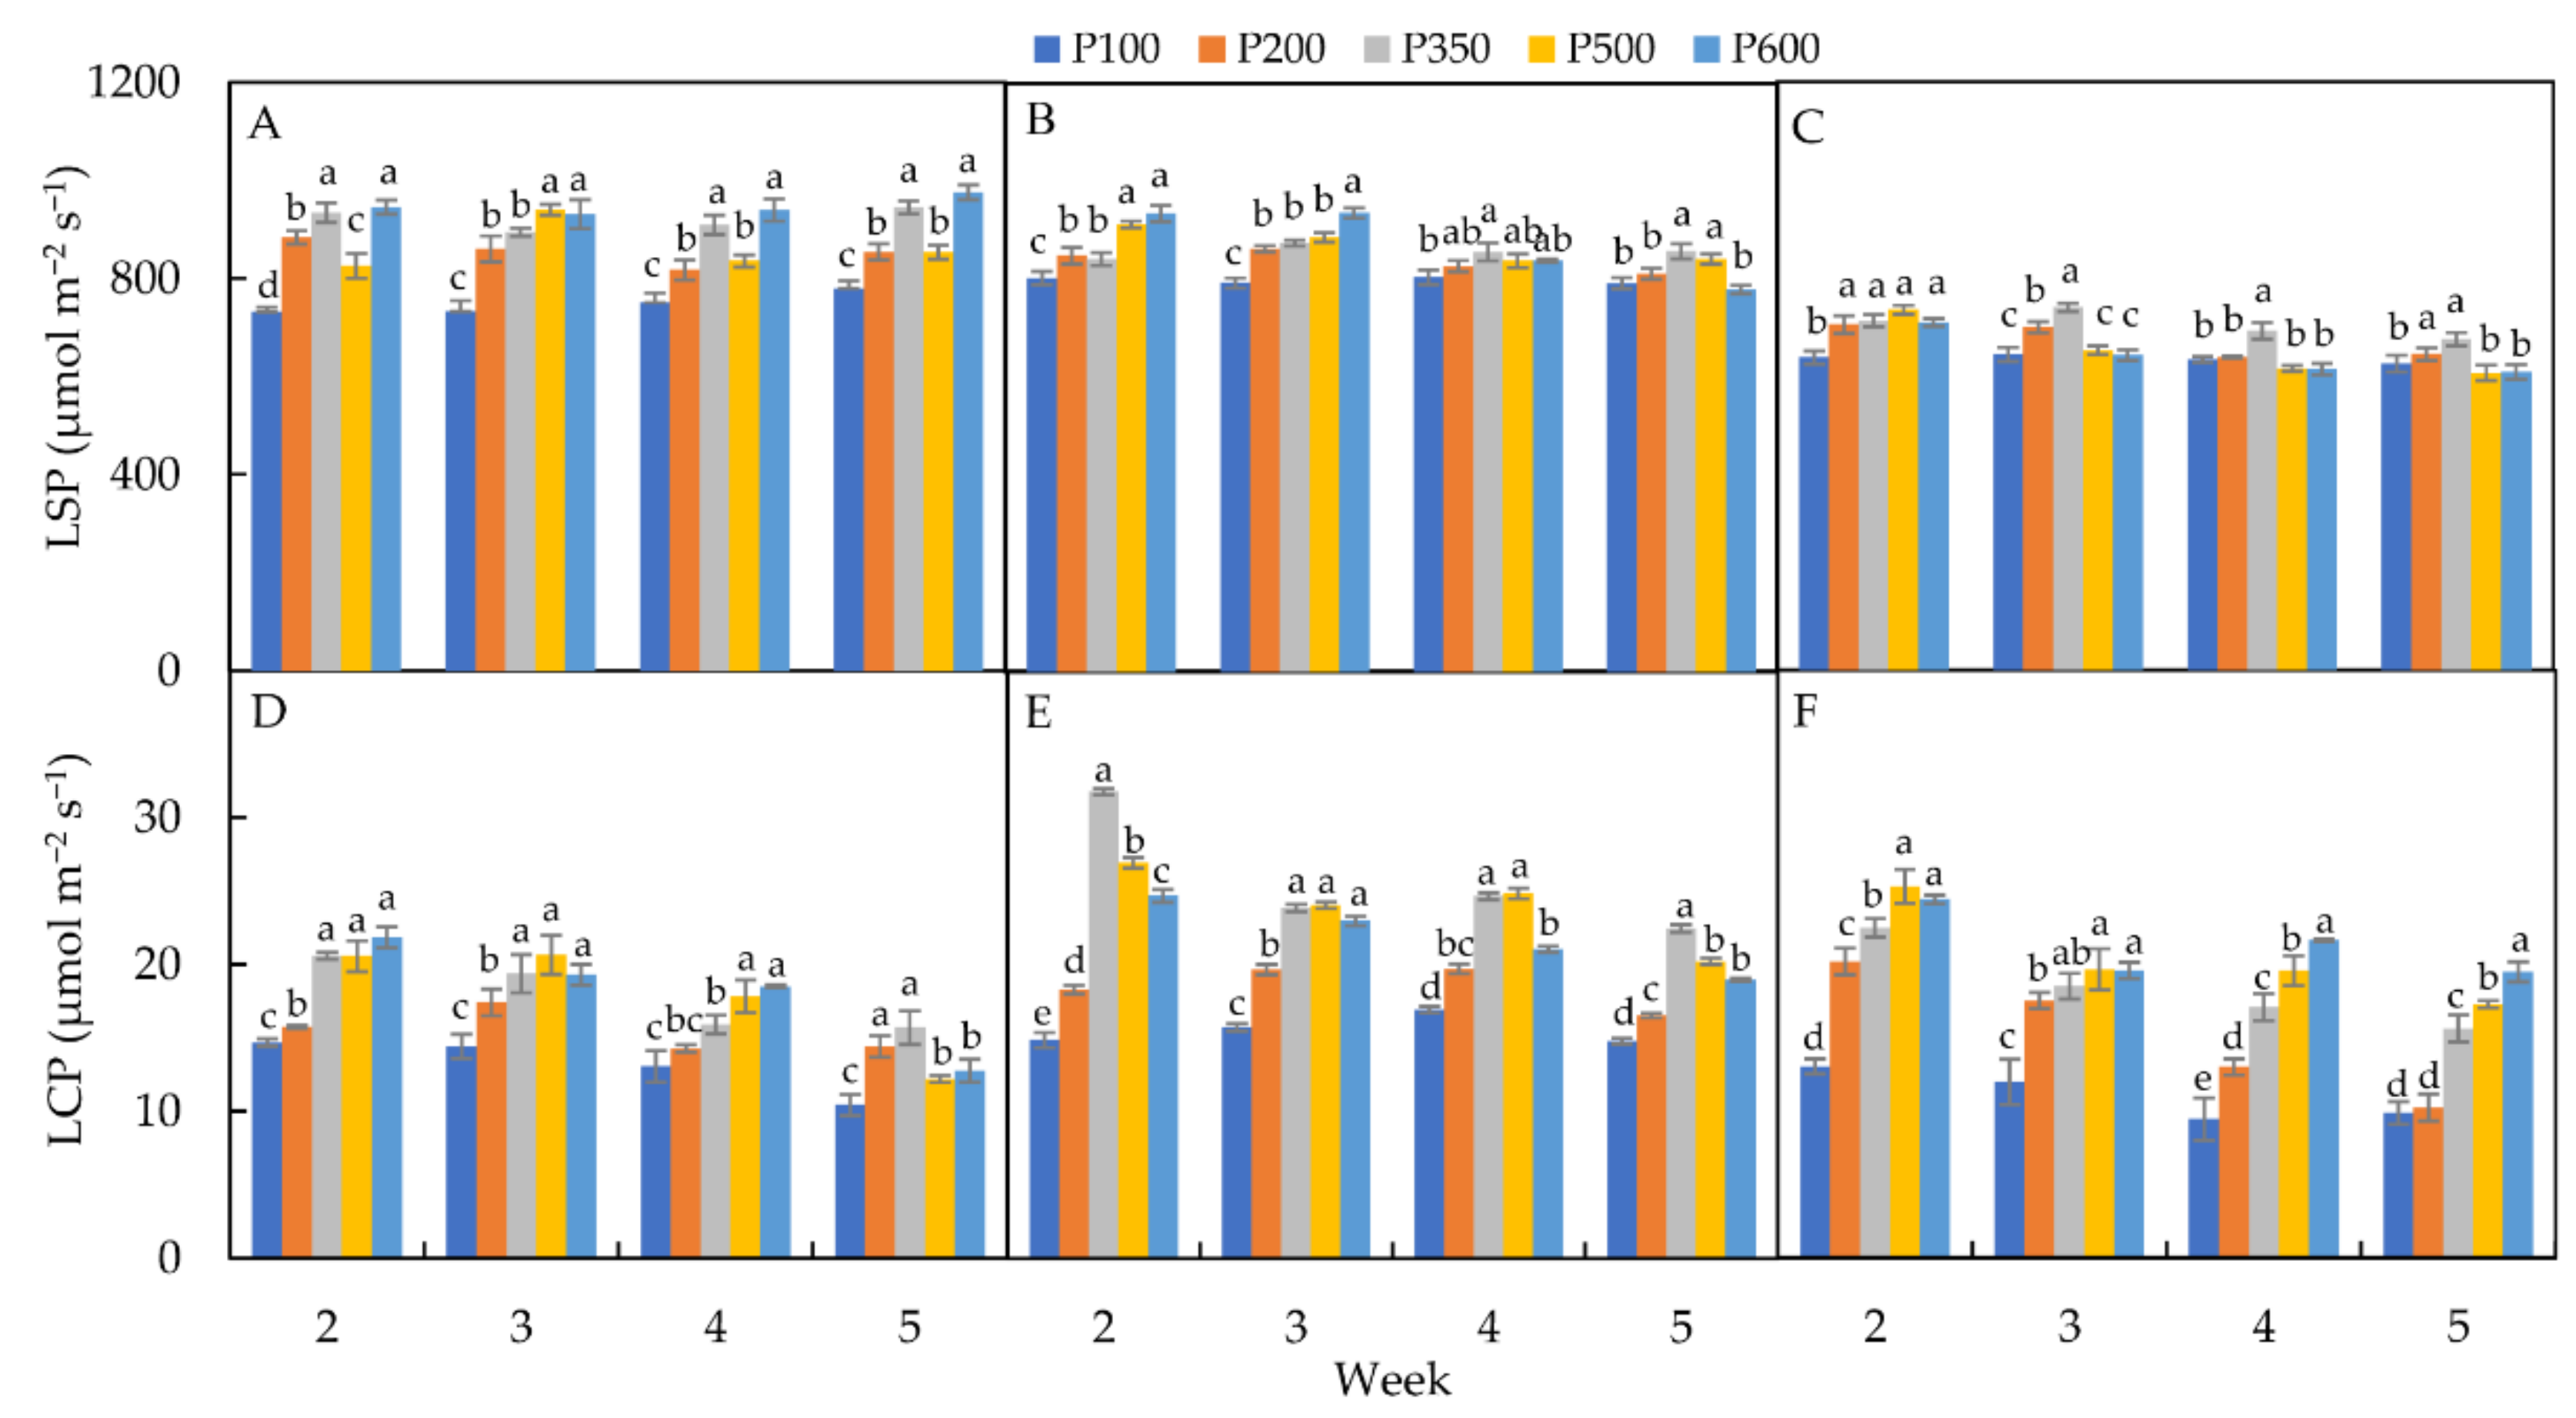
3.2.4. Light-Saturation Point (LSP)

In all light-treated plants, the LSP values at T30 were lower than those at T15 and T23 at all determined times (Figure 3A–C). At T15, the lowest LSP values during the treatment period occurred under P100. Despite the apparent fluctuations over time, the LSP values under P200, P350, P500, and P600 maintained high levels (Figure 3A). At T23, LSP increased in a light intensity-dependent manner at weeks 2 and 3, while it increased firstly and then decreased with increasing of light intensity at weeks 4 and 5. The highest value was observed in lettuce plants that were grown under P350, and there was no significant difference in LSP among other light intensities at week 5 (Figure 3B). At T30, there were no significant differences in LSP among the P200, P350, P500, and P600 treatments at week 2, but after that, LSP in the P350 was significantly higher than those in other light treatment (Figure 3C).

3.2.5. Light-Compensation Point (LCP)

For any given light intensity, LCP at T23 were highest followed those at T30 and T15 at all determined times (Figure 3D–F). At T15, the lowest LCP values occurred under P100 at all determined times. There were no significant differences in LCP among the P350, P500, and P600 treatment at weeks 2 and 3, but LCP in the P500 and P600 decreased significantly over time, which were significantly lower than that in P350 and P200 treatment at week 5 (Figure 3D). LCP in the P350 and P500 treatments maintained high levels at T23 (Figure 3E). At T30, the highest LCP values were obtained in the P500 and P600 treatments at all determined times (Figure 3F). At T23 and T30, the lowest and second lowest LCP values all occurred under P100 and P200, respectively.

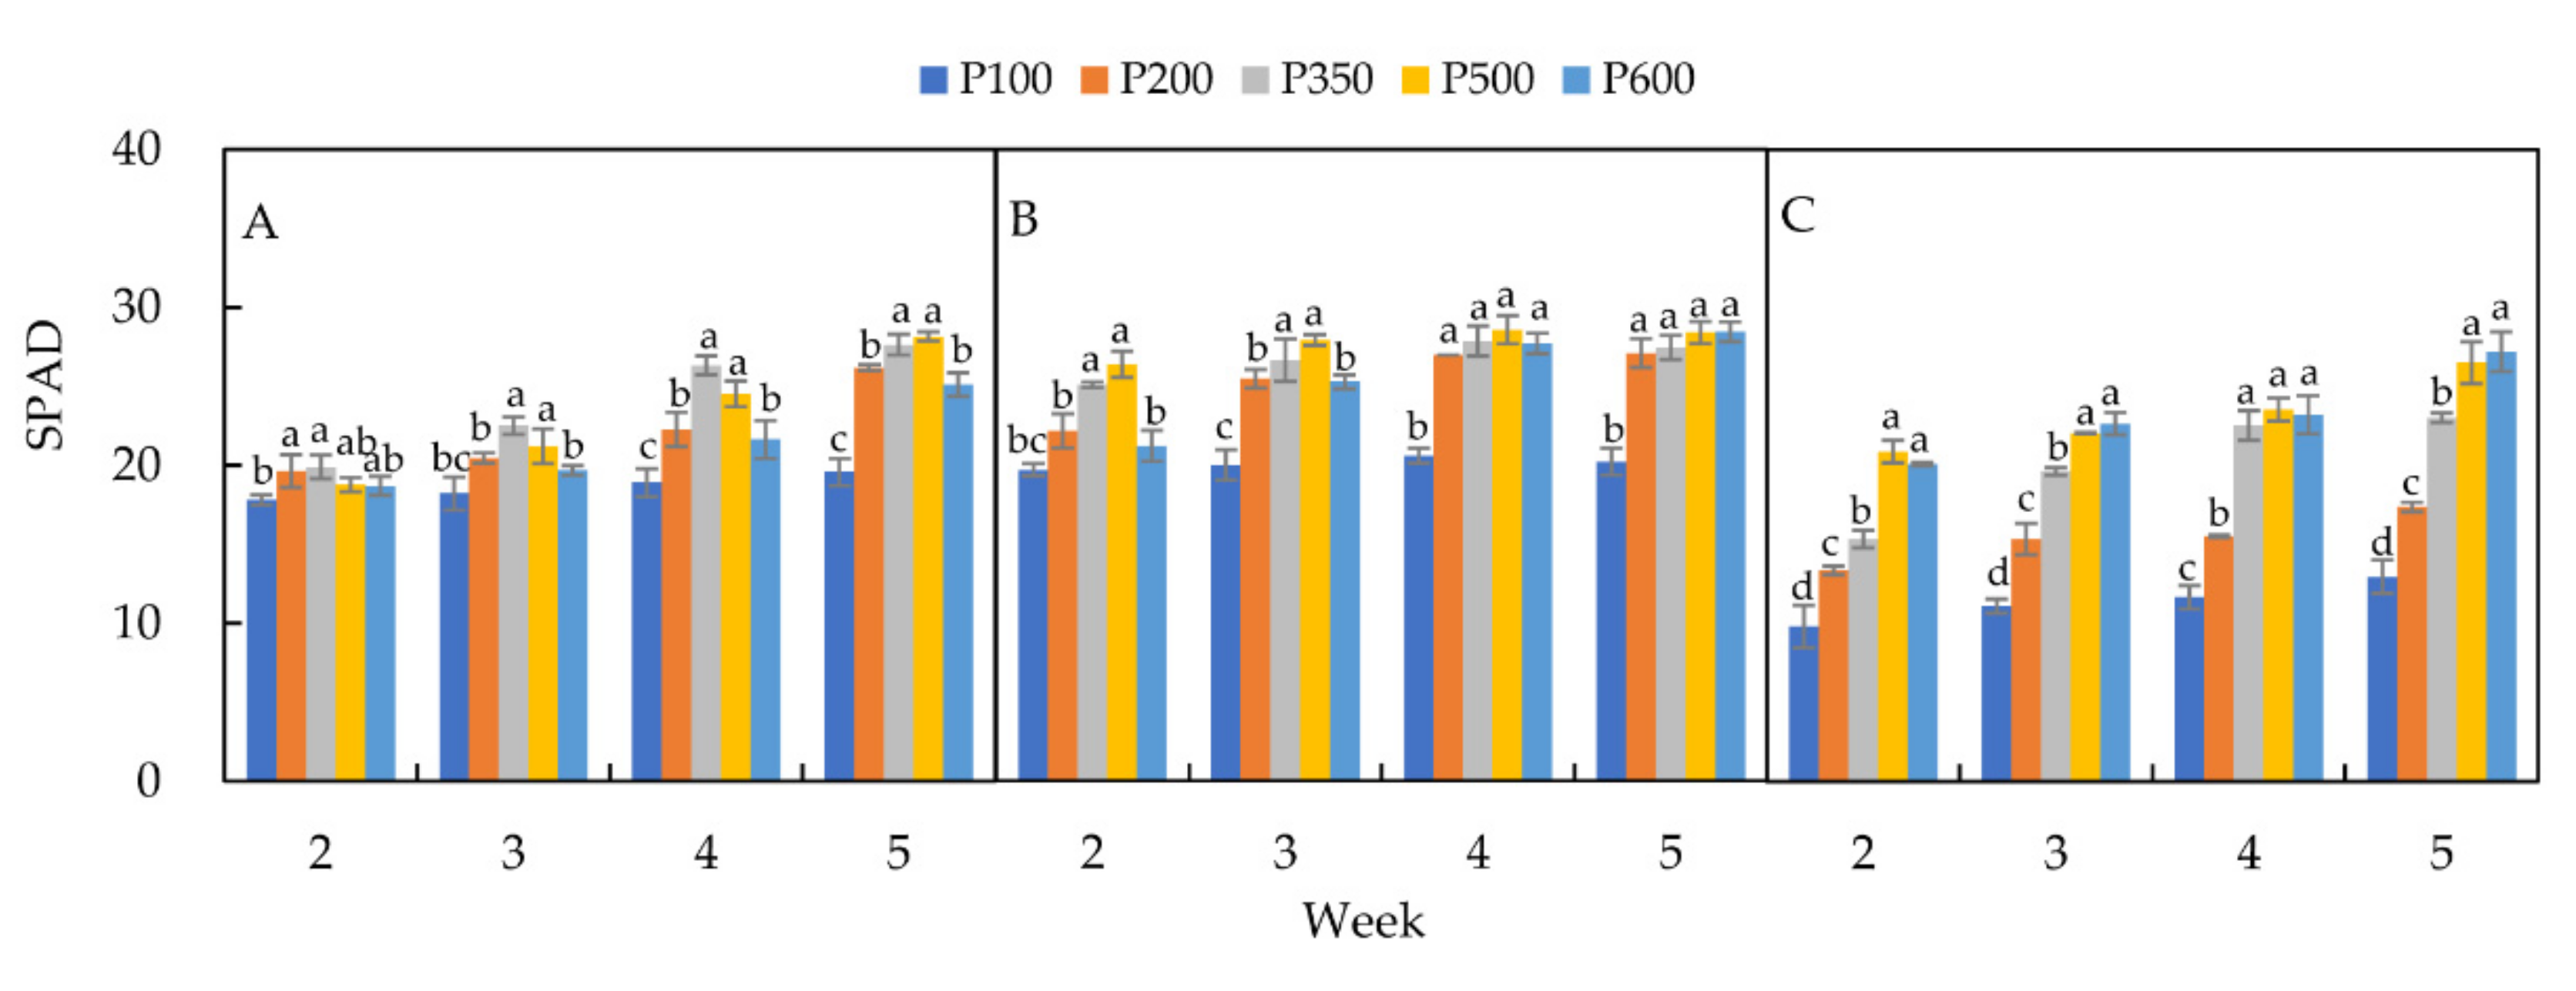
3.3. Chlorophyll Content (SPAD)
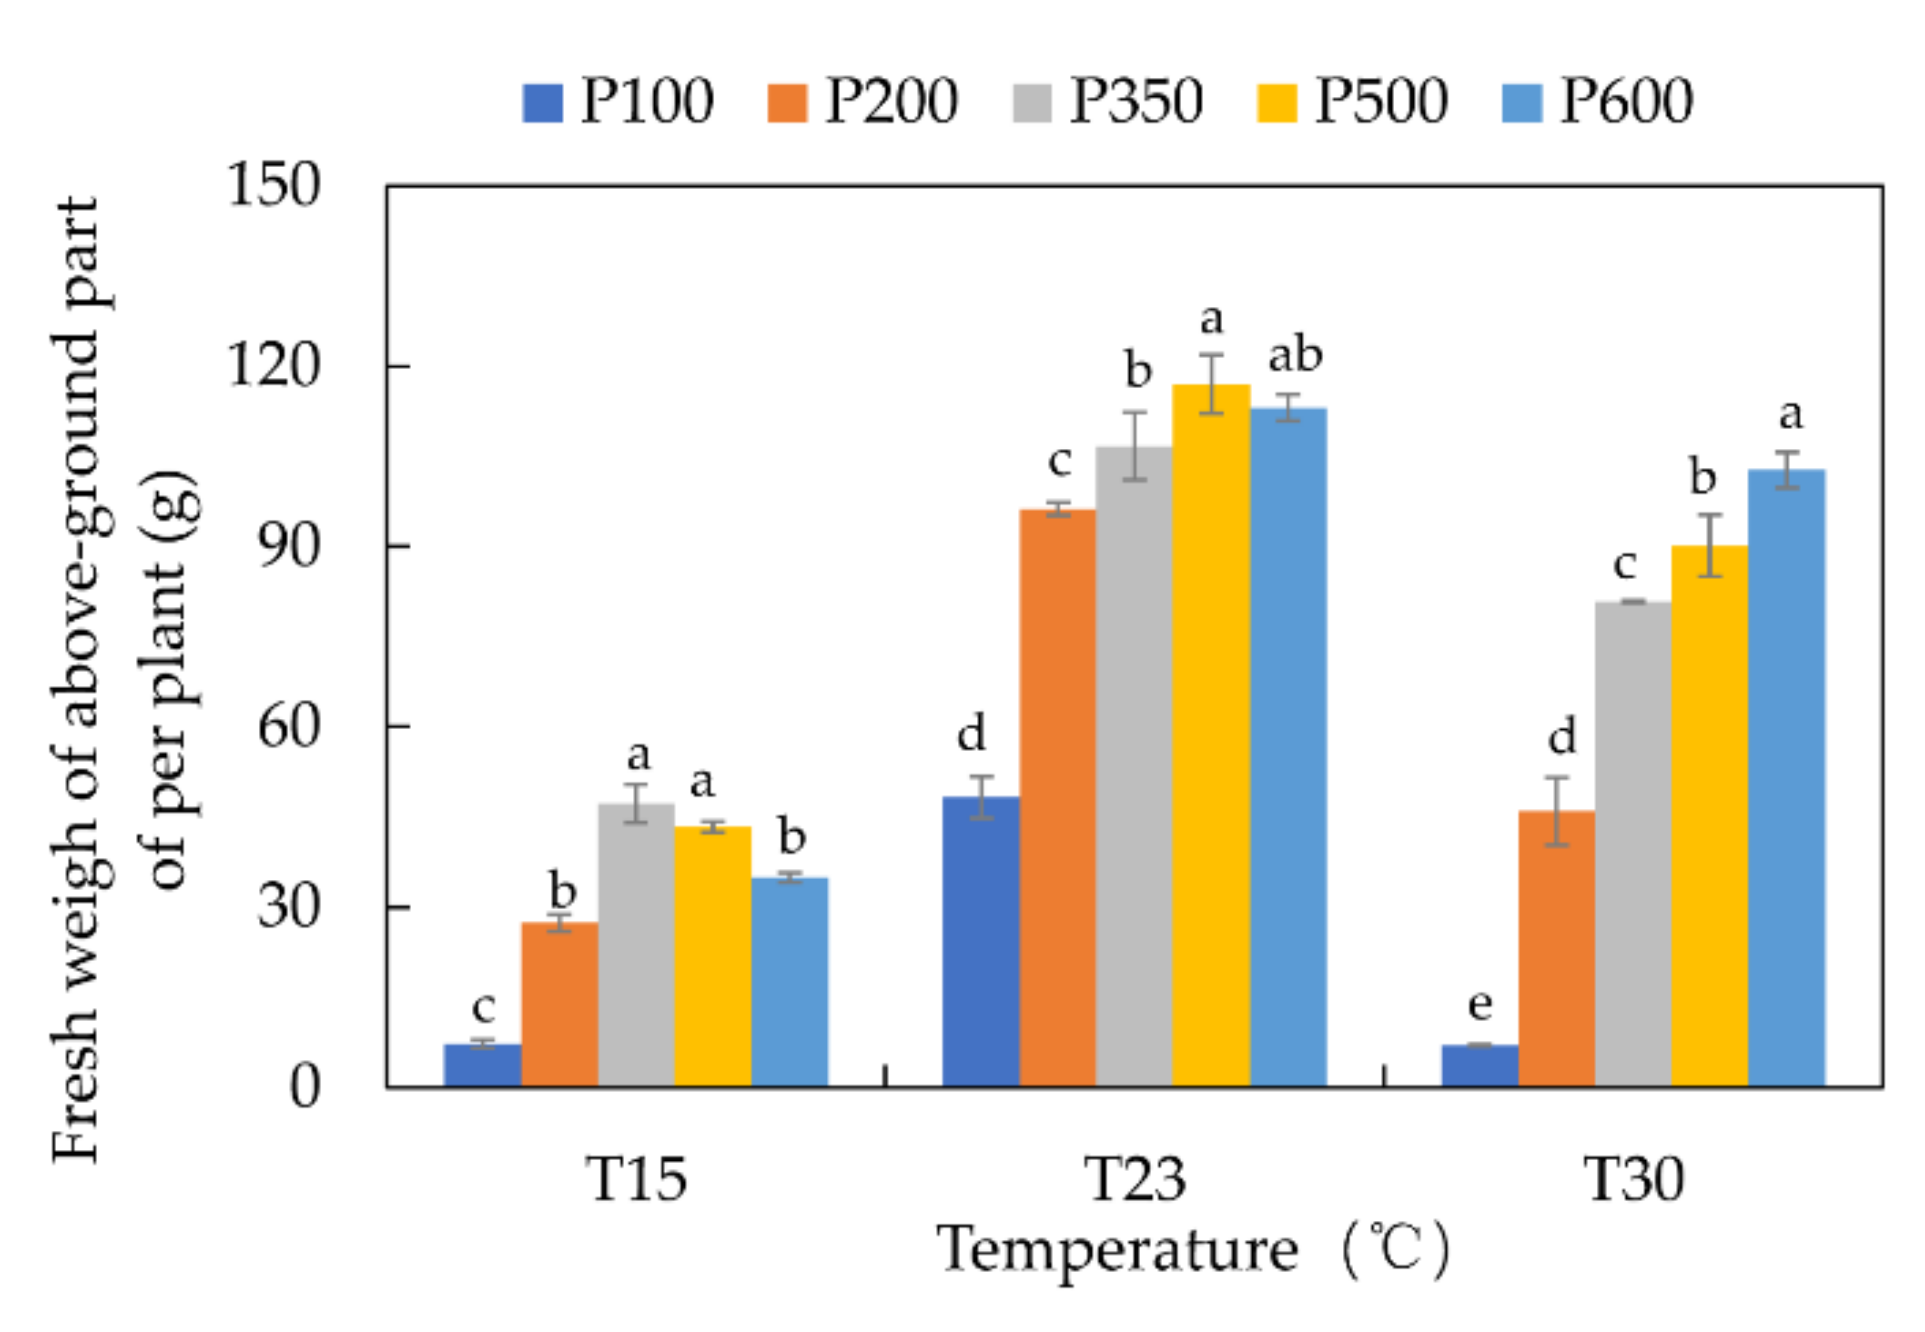
SPAD was significantly (p < 0.05) affected by temperature, light intensity and their interaction at the four determined times (Figure 1). Under all light treatments, the lowest SPAD values occurred at T30 (Figure 4A–C). Under all temperature regimes, the lowest SPAD was observed in the P100 treatment. At T15, the SPAD values in the P350 and P500 treatments were significantly higher than P200 and P600 from week 3 to week 5. At T23, the SPAD values in the P350 and P500 treatment were significantly higher than P200 and P600 at weeks 2 and 3, and there were no significant differences among the P200, P350, P500, and P600. At T30, lettuce in the P500 and P600 treatments had a higher and significantly different SPAD compared with the P350 and P200 treatment during the treatment time.

3.4. Yield

As shown in Figure 5, there were significant differences among the yield of lettuce grown under light and temperature treatment groups. The yield was highest at T23 followed by T30 and T15 under all light treatments. Under all temperature regimes, the lowest and the second lowest yield occurred under P100 and P200, respectively. At T15, the yield at P350 was the highest, followed by P500. Compared with P600, the yield at P350 and P500 exhibited an enhancement of 35.28% and 24.20%, respectively. At T23, the yields were highest at P500 and P600, and they were slightly higher than those at P350. The yields at P350 and P500 were 9.66% and 5.99%, respectively, compared with P600. At T30, the yield increased with the increase of light intensity, and there were significant differences in yield among all the light intensities. The yield at P600 and P500 increased by 27.02% and 11.49%, respectively, compared with P350.

4. Discussion

The current study showed that temperature, light, and their interaction had significant effect on the photosynthesis process, chlorophyll content, and yield of lettuce. Among the three temperature levels in all light conditions, the lettuce grown at T23 had higher PNmax and LSP that characterized a strong photosynthetic capacity and adaptability to higher light intensity conditions. Previous studies have confirmed that photosynthesis is a heat-sensitive process and it has been shown that photosystem II is the most heat-sensitive component of the photosynthetic machinery [33]. Lettuce grown at T23 apparently exhibited a higher ratio of opened photosystem II and higher photochemical efficiency, which contributed to better maintenance of photosynthesis rate than plants under T15 and T23, resulting in a higher yield. Plants no longer accumulate organic matter when the light intensity is lower than the LCP. The RD value reflects the plant’s consumption of photosynthetic products. Both the LCP and RD were enhanced by the T23 treatment compared to the T15 and T30 treatments, indicating that a great photosynthetic capacity was accompanied by the increase of the consumption of photosynthetic products, resulting in a wasteful use of resources [34]. AQY is an estimate of a plant utilization capacity for the low light intensity. In our study, the T15 treatment increased AQY and decreased RD of lettuce in all the light conditions, suggesting that lettuce plants in the low temperature maintained the balance of materials and energy metabolism by the enhancement of low light intensity utilization capacity and the relatively efficient use of resources [35,36]. Leaf chlorophyll content strongly affect leaf photosynthetic capability and yield of plants. The leaf SPAD value has been used as a useful indicator of leaf chlorophyll content [37,38]. The mean SPAD values ranged from <10 to >30, indicating significant variation in chlorophyll content, due to the temperature and light intensity treatments. Compared to T15 and T23, the lowest SPAD values of lettuce cultured at T30 demonstrated a significant reduction in leaf chlorophyll content of lettuce, due to the high temperature treatment. It is in support of pioneer studies which reported reduction in chlorophyll content due to high temperature stress in various crop species [39,40]. The decline in chlorophyll content as indicated by SPAD may be a result of indirect effects on photosynthetic capacity of the leaf, which reduced the yield at T30. In addition, the T30 treatment reduced the adaptability of lettuce to higher light intensity conditions as characterized by the lowest LSP.
The light intensity played an important role on the photosynthetic performance of the lettuce grown at different temperature conditions. Low light intensity may reduce the activity of carbon photosynthetic assimilation enzymes and limit the assimilation of plant carbon, thereby reducing effective quantum yield of photosystem II photochemistry [7,8]. Therefore, plants growing under low light intensity usually show low photosynthetic efficiency and biomass [7,19,41]. This pattern was observed in this study, as lettuce grown in the P100 and P200 treatment had the lower PNmax, LSP and yield compared other light intensity treatments under all the temperature conditions during the determined time. In addition, lettuce grown in the P100 and P200 treatments had the relatively lower LCP and RD that may indicate a survival mechanism based on resource conservation by reducing the respiratory carbon loss. That was consistent with the findings in spinach and wheat exposure to low light intensity [42]. At T15, the lettuce grown in the P350 and P500 treatments had a higher photosynthesis capacity and a wider light-adaptability of photosynthetic apparatus as characterized by the higher AQY, PNmax, LSP, and SPAD, and the strongest photosynthesis capacity was obtained at week 4. Under the low temperature condition, the photosystem’s activation of lettuce, in the P350 and P500 treatments, could be improved to generate sufficient ATP and NADPH to be used for CO2 fixation in the biochemical processes, leading to higher photochemical efficiency [43]. Compared with P350 and P500, the lettuce in the P600 treatment had the lower AQY, PNmax, SPAD, and yield during the determined time. This finding showed that high light with low temperature caused a decrease of chlorophyll content and photosynthesis efficiency. The light intensity of P600 may exceed the optional light intensity range required by lettuce plants, and plants grown under high light intensities could not use all the energy absorbed by their photosynthetic apparatus. This excessive absorption of energy reduced the efficiency of photosystem II, cause photoinhibition of photosynthesis. At T23, the AQY and PNmax values revealed that the lettuce grown in the P350, P500, and P600 treatments had higher low light-harvesting efficiency and photosynthesis capacity during the treatment period, and the strongest photosynthesis capacity was obtained at week 3. The high light intensity utility of lettuce leaves increased with light intensity at weeks 2 and 3 as reflected by LSP. However, from week 4 to week 5, the LSP value in the P600 treatment decreased and significantly lower than that in the P350 and P500 treatments, implying that the lettuce in the P600 treatment did not adapt to high light conditions in later growth stages. It suggested that the stronger light intensity was necessary for optimum growth of lettuce, but the light intensity did not have to be too strong in later growth stages, for example, stronger than 500 μmol·m−2·s−1 under cultivation temperature of 23 °C conditions. The lettuce in the P500 treatment shared similar levels of LSP, PNmax, and SPAD with that in the P350 treatment, but exhibited remarkably lower levels of LCP and RD. All these findings may be the reasons that the yield in the P500 was significantly higher than that in the P350 and P600 at T23. At T30, the P500 and P600 treatments promoted the accumulation of chlorophyll content and improved the potential photosynthesis capacity in lettuce plants as reflected as higher SPAD and PNmax, which can be attributed to better CO2 fixation and carbon assimilation. Although the LSP, RD, and LCP values showed that the high light utility decreased with time, accompanied by higher consumption of photosynthetic products, the yields in the P500 and P600 were significantly higher than other intensity treatments. The reason for the high consumption of photosynthetic products maybe that a high photosynthesis capacity requires large amounts of photosynthetic enzymes that incur large maintenance costs. Additionally, the PNmax of lettuce grown in the P500 and P600 decreased greatly from week 4 to week 5, which decreased by 24.03% and 23.03%, respectively, indicating that under high temperature, lettuce growth in high light intensity was difficult to maintain the potential photosynthesis capacity at high temperature in later growth stages. In later growth stages, the lettuce grown in the P350 treatment showed more flexibility to maintain their photosynthesis capacity under high temperature, because the PNmax and LSP were higher and LCP and RD were lower. It suggested that in later growth stages, the light intensity should be moderate to adapt to the high temperature environment for lettuce, for example, 350 μmol·m−2·s−1 under cultivation temperature of 30 °C conditions.

5. Conclusions

In conclusion, temperature played a more important role in lettuce photosynthesis and growth than light intensity, and the cultivation temperature should be paid attention first, and then the light intensity in the actual production of lettuce. Besides, close interactions between light and temperature play important roles in the growth and development of lettuce. The feasible light range for lettuce’s photosynthesis and yield is different under different temperature. Light intensity of 350–500 μmol·m−2·s−1 is recommended at low temperatures (15 °C). Light intensity of 350–600 μmol·m−2·s−1 is recommended at medium temperatures (23 °C). The range of 500 to 600 μmol·m−2·s−1 is a recommendable light intensity for lettuce grown at high temperatures (30 °C). In addition, in the late growth stage, the light intensity should be appropriately reduced for the lettuce grown under medium and high temperature conditions. The current study indicates that a reasonable combination of both light intensity and temperature could be used to obtain optimal lettuce photosynthesis performance and yield in greenhouse and plant factory. However, the photosynthetic capacity of leaves at different position of plant varies greatly during their development, and the photosynthetic rate of juvenile and adult leaves are significantly different. Hence, in order to formulate the more precise environmental control strategy, further studies are required to investigate the interaction of light intensity and temperature on the leaves of different leaf age and position.

Author Contributions

Methodology, investigation, data curation, analysis, and writing—original draft preparation, J.Z.; conceptualization and supervision, P.L.; validation and writing—review and editing, and funding acquisition, J.W. All authors have read and agreed to the published version of the manuscript.

Funding

The research was supported by the National Science Fund subsidized project (32171896), and was funded by the Priority Academic Program Development of Jiangsu Higher Education Institutions (PADP).

Institutional Review Board Statement

Not applicable.

Informed Consent Statement

Not applicable.

Data Availability Statement

Not applicable.

Acknowledgments

Thanks to every member of our project team.

Conflicts of Interest

The authors declare no conflict of interest.

References

  1. Ahmed Hesham, A.; Tong, Y.; Yang, Q. Optimal Control of Environmental Conditions Affecting Lettuce Plant Growth in a Controlled Environment with Artificial Lighting: A Review. S. Afr. J. Bot. 2020, 130, 75–89. [Google Scholar] [CrossRef]
  2. Chen, J.-W.; Kuang, S.-B.; Long, G.-Q.; Yang, S.-C.; Meng, Z.-G.; Li, L.-G.; Chen, Z.-J.; Zhang, G.-H. Photosynthesis, light energy partitioning, and photoprotection in the shade-demanding species Panax notoginseng under high and low level of growth irradiance. Funct. Plant Biol. 2016, 43, 479. [Google Scholar] [CrossRef] [PubMed]
  3. Fu, W.; Li, P.; Wu, Y.; Tang, J. Effects of Different Light Intensities on Anti-Oxidative Enzyme Activity, Quality and Biomass in Lettuce. Hortic. Sci. 2012, 39, 129–134. [Google Scholar]
  4. Allen, D.J.; Ort, D.R. Impacts of chilling temperatures on photosynthesis in warm-climate plants. Trends Plant Sci. 2001, 6, 36–42. [Google Scholar] [CrossRef]
  5. Dufault, R.J.; Ward, B.; Hassell, R.L. Dynamic relationships between field temperatures and romaine lettuce yield and head quality. Sci. Hortic. 2009, 120, 452–459. [Google Scholar] [CrossRef]
  6. Ou, L.J.; Wei, G.; Zhang, Z.Q.; Dai, X.Z.; Zou, X.X. Effects of low temperature and low irradiance on the physiological characteristics and related gene expression of different pepper species. Photosynthetica 2015, 53, 85–94. [Google Scholar] [CrossRef]
  7. Branco, M.C.D.S.; de Almeida, A.-A.F.; Dalmolin, A.; Ahnert, D.; Baligar, V.C. Influence of low light intensity and soil flooding on cacao physiology. Sci. Hortic. 2017, 217, 243–257. [Google Scholar] [CrossRef]
  8. Zheng, Y.; Mai, B.; Wu, R.; Feng, Y.; Sofo, A.; Ni, Y.; Sun, J.; Li, J.; Xu, J. Acclimation of Winter Wheat (Triticum Aestivum, Cv. Yangmai 13) to Low Levels of Solar Irradiance. Photosynthetica 2011, 49, 3. [Google Scholar] [CrossRef]
  9. Ruelland, E.; Zachowski, A. How plants sense temperature. Environ. Exp. Bot. 2010, 69, 225–232. [Google Scholar] [CrossRef]
  10. Pan, J.; Guo, B. Effects of Light Intensity on the Growth, Photosynthetic Characteristics, and Flavonoid Content of Epimedium pseudowushanense B.L. Guo. Molecules 2016, 21, 1475. [Google Scholar] [CrossRef] [Green Version]
  11. Percival, G. The Use Of Chlorophyll Fluorescence To Identify Chemical And Environmental Stress In Leaf Tissue Of Three Oak (Quercus) Species. Arboric. Urban For. 2005, 31, 215–227. [Google Scholar] [CrossRef]
  12. Yan, N.; Xu, X.-F.; Wang, Z.-D.; Huang, J.-Z.; Guo, D.-P. Interactive effects of temperature and light intensity on photosynthesis and antioxidant enzyme activity in Zizania latifolia Turcz. plants. Photosynthetica 2013, 51, 127–138. [Google Scholar] [CrossRef]
  13. Li, Q.; Kubota, C. Effects of supplemental light quality on growth and phytochemicals of baby leaf lettuce. Environ. Exp. Bot. 2009, 67, 59–64. [Google Scholar] [CrossRef]
  14. Hang, T.; Lu, N.; Takagaki, M.; Mao, H. Leaf area model based on thermal effectiveness and photosynthetically active radiation in lettuce grown in mini-plant factories under different light cycles. Sci. Hortic. 2019, 252, 113–120. [Google Scholar] [CrossRef]
  15. Wang, H.; Sánchez-Molina, J.A.; Li, M.; Berenguel, M.; Yang, X.T.; Bienvenido, J.F. Leaf Area Index Estimation for a Greenhouse Transpiration Model Using External Climate Conditions Based on Genetics Algorithms, Back-Propagation Neural Networks and Nonlinear Autoregressive Exogenous Models. Agric. Water Manag. 2017, 183, 107–115. [Google Scholar] [CrossRef]
  16. Zaidi, M.; Murase, H.; Honami, N. Neural Network Model for the Evaluation of Lettuce Plant Growth. J. Agric. Eng. Res. 1999, 74, 237–242. [Google Scholar] [CrossRef]
  17. Křístková, E.; Doležalová, I.; Lebeda, A.; Vinter, V.; Novotná, A. Description of Morphological Characters of Lettuce (Lactuca sativa L.) Genetic Resources. Sci. Hortic. 2008, 35, 113–129. [Google Scholar] [CrossRef] [Green Version]
  18. Mou, B. Lettuce. In Vegetables I: Asteraceae, Brassicaceae, Chenopodicaceae, and Cucurbitaceae; Prohens, J., Nuez, F., Eds.; Springer: New York, NY, USA, 2008; pp. 75–116. [Google Scholar]
  19. Fu, W.; Li, P.; Wu, Y. Effects of different light intensities on chlorophyll fluorescence characteristics and yield in lettuce. Sci. Hortic. 2012, 135, 45–51. [Google Scholar] [CrossRef]
  20. Fallovo, C.; Rouphael, Y.; Cardarelli, M.; Colla, G.; Rea, E.; Battistelli, A.; Colla, G. Yield and Quality of Leafy Lettuce in Response to Nutrient Solution Composition and Growing Season. J. Food Agric. Environ. 2009, 7, 456–462. [Google Scholar]
  21. Ghorbanzadeh, P.; Aliniaeifard, S.; Esmaeili, M.; Mashal, M.; Azadegan, B.; Seif, M. Dependency of Growth, Water Use Efficiency, Chlorophyll Fluorescence, and Stomatal Characteristics of Lettuce Plants to Light Intensity. J. Plant Growth Regul. 2021, 40, 2191–2207. [Google Scholar] [CrossRef]
  22. Kang, J.H.; KrishnaKumar, S.; Atulba, S.L.S.; Jeong, B.R.; Hwang, S.J. Light intensity and photoperiod influence the growth and development of hydroponically grown leaf lettuce in a closed-type plant factory system. Hortic. Environ. Biotechnol. 2013, 54, 501–509. [Google Scholar] [CrossRef]
  23. Wheeler, T.; Hadley, P.; Ellis, R.; Morison, J. Changes in growth and radiation use by lettuce crops in relation to temperature and ontogeny. Agric. For. Meteorol. 1993, 66, 173–186. [Google Scholar] [CrossRef]
  24. Yan, Z.; He, D.; Niu, G.; Zhai, H. Evaluation of growth and quality of hydroponic lettuce at harvest as affected by the light intensity, photoperiod and light quality at seedling stage. Sci. Hortic. 2019, 248, 138–144. [Google Scholar] [CrossRef]
  25. Knight, S.L.; Mitchell, C.A. Stimulation of lettuce productivity by manipulation of diurnal temperature and light. Sci. Hortic. 1983, 18, 462–463. [Google Scholar]
  26. Galieni, A.; Stagnari, F.; Speca, S.; Pisante, M. Leaf traits as indicators of limiting growing conditions for lettuce (Lactuca sativa). Ann. Appl. Biol. 2016, 169, 342–356. [Google Scholar] [CrossRef]
  27. Chen, Z.; Jahan, M.S.; Mao, P.; Wang, M.; Liu, X.; Guo, S. Functional growth, photosynthesis and nutritional property analyses of lettuce grown under different temperature and light intensity. J. Hortic. Sci. Biotechnol. 2021, 96, 53–61. [Google Scholar] [CrossRef]
  28. Noda, H.; Muraoka, H.; Washitani, I. Morphological and Physiological Acclimation Responses to Contrasting Light and Water Regimes in Primula sieboldii. Ecol. Res. 2004, 19, 331–340. [Google Scholar] [CrossRef]
  29. Wang, A.; Zhang, Q.; Fan, D.; Lu, C. Photosynthetic light and CO2 utilization and C4 traits of two novel super-rice hybrids. J. Plant Physiol. 2006, 163, 529–537. [Google Scholar] [CrossRef]
  30. Avola, G.; Cavallaro, V.; Patanè, C.; Riggi, E. Gas exchange and photosynthetic water use efficiency in response to light, CO2 concentration and temperature in Vicia faba. J. Plant Physiol. 2008, 165, 796–804. [Google Scholar] [CrossRef]
  31. Xu, W.Z.; Deng, X.P.; Xu, B.C. Effects of water stress and fertilization on leaf gas exchange and photosynthetic light-response curves of Bothriochloa ischaemum L. Photosynthetica 2013, 51, 603–612. [Google Scholar] [CrossRef]
  32. Ye, Z.P.; Yu, Q. A coupled model of stomatal conductance and photosynthesis for winter wheat. Photosynthetica 2008, 46, 637–640. [Google Scholar] [CrossRef]
  33. Mihaljević, I.; Lepeduš, H.; Šimić, D.; Vuletić, M.V.; Tomaš, V.; Vuković, D.; Dugalić, K.; Teklić, T.; Babojelić, M.S.; Zdunić, Z. Photochemical efficiency of photosystem II in two apple cultivars affected by elevated temperature and excess light in vivo. S. Afr. J. Bot. 2020, 130, 316–326. [Google Scholar] [CrossRef]
  34. Zhang, Q.; Zhang, T.-J.; Chow, W.S.; Xie, X.; Chen, Y.-J.; Peng, C.-L. Photosynthetic characteristics and light energy conversions under different light environments in five tree species occupying dominant status at different stages of subtropical forest succession. Funct. Plant Biol. 2015, 42, 609–619. [Google Scholar] [CrossRef] [PubMed]
  35. Thomashow, M.F. PLANT COLD ACCLIMATION: Freezing Tolerance Genes and Regulatory Mechanisms. Annu. Rev. Plant Biol. 1999, 50, 571–599. [Google Scholar] [CrossRef] [PubMed] [Green Version]
  36. Hikosaka, K.; Ishikawa, K.; Borjigidai, A.; Muller, O.; Onoda, Y. Temperature acclimation of photosynthesis: Mechanisms involved in the changes in temperature dependence of photosynthetic rate. J. Exp. Bot. 2006, 57, 291–302. [Google Scholar] [CrossRef] [Green Version]
  37. Loh, F.C.W.; Grabosky, J.; Bassuk, N.L. Using the SPAD 502 Meter to Assess Chlorophyll and Nitrogen Content of Benjamin Fig and Cottonwood Leaves. HortTechnology 2002, 12, 682–686. [Google Scholar] [CrossRef] [Green Version]
  38. Ling, Q.; Huang, W.; Jarvis, P. Use of a SPAD-502 meter to measure leaf chlorophyll concentration in Arabidopsis thaliana. Photosynth. Res. 2011, 107, 209–214. [Google Scholar] [CrossRef] [Green Version]
  39. Sharma, L.; Priya, M.; Bindumadhava, H.; Nair, R.; Nayyar, H. Influence of high temperature stress on growth, phenology and yield performance of mungbean [Vigna radiata (L.) Wilczek] under managed growth conditions. Sci. Hortic. 2016, 213, 379–391. [Google Scholar] [CrossRef]
  40. Patriyawaty, N.R.; Rachaputi, R.C.; George, D. Physiological mechanisms underpinning tolerance to high temperature stress during reproductive phase in mungbean (Vigna radiata (L.) Wilczek). Environ. Exp. Bot. 2018, 150, 188–197. [Google Scholar] [CrossRef] [Green Version]
  41. Pires, M.V.; Almeida, A.-A.F.; Figueiredo, A.L.; Gomes, F.P.; Souza, M.M. Photosynthetic characteristics of ornamental passion flowers grown under different light intensities. Photosynthetica 2011, 49, 593–602. [Google Scholar] [CrossRef]
  42. Noguchi, K. Effects of Light Intensity and Carbohydrate Status on Leaf and Root Respiration. In Plant Respiration: From Cell to Ecosystem; Lambers, H., Ribas-Carbo, M., Eds.; Springer: Dordrecht, The Netherlands, 2005; pp. 63–83. [Google Scholar]
  43. Kaiser, E.; Morales, A.; Harbinson, J.; Heuvelink, E.; Prinzenberg, A.E.; Marcelis, L. Metabolic and diffusional limitations of photosynthesis in fluctuating irradiance in Arabidopsis thaliana. Sci. Rep. 2016, 6, 31252. [Google Scholar] [CrossRef] [PubMed]
Figure 1. The light–response curves at different light intensity and temperature treatments at week 2 (AC), 3 (DF), 4 (GI), and 5 (JL) after transplanting. PN—net photosynthetic rate. Left side (A,D,G,J), middle (B,E,H,K), and right side (C,F,I,L) represented T15, T23, and T30, respectively. Mean values with standard error of mean (n = 3).
Horticulturae 08 00178 g001
Figure 2. Apparent quantum efficiency (AQY) (AC), maximum photosynthetic rate (PNmax) (DF), dark respiration rate (RD) (GI) under different temperature and light conditions. Mean values with standard error of mean (n = 3). Left side (A,D,G), middle (B,E,H), and right side (C,F,I) represented T15, T23, and T30, respectively. Letters indicate significant differences at p < 0.05 according to the LSD test.
Horticulturae 08 00178 g002
Figure 3. Light-saturation point (LSP) (AC) and light-compensation point (LCP) (DF) under different temperature and light conditions. Mean values with standard error of mean (n = 3). Left side (A,D), middle (B,E), and right side (C,F) represented T15, T23, and T30, respectively. Letters indicate significant differences at p < 0.05 according to the LSD test.
Horticulturae 08 00178 g003
Figure 4. Chlorophyll content (SPAD) under different temperature and light conditions. Mean values with standard error of mean (n = 3). (AC) represented T15, T23, and T30, respectively. Letters indicate significant differences at p < 0.05 according to the LSD test.
Horticulturae 08 00178 g004
Figure 5. Fresh weight of above-ground part of per plant of lettuce under different temperature and light treatments. Mean values with standard error of mean (n = 3). Letters indicate significant differences at p < 0.05 according to the LSD test.
Horticulturae 08 00178 g005
Table 1. The analysis of variance for the effects of light, temperature, and their interactions on apparent quantum efficiency (AQY), light-saturated net photosynthetic rate (PNmax), dark respiration rate (RD), light saturation point (LSP), light compensation point (LCP) and chlorophyll content (SPAD) in lettuce. *—significant at p < 0.05; **—significant at p < 0.01; df—degree of freedom.
EffectWeekdfAQYPNmaxRDLSPLCPSPAD
Light24************
34************
44************
54************
Temperature22************
32************
42************
52************
Light × Temperature28************
38***********
48************
58************
Publisher’s Note: MDPI stays neutral with regard to jurisdictional claims in published maps and institutional affiliations.

