Article

An Analysis of the Impact of Logistics Processes on the Temperature Profile of the Beginning Stages of a Blueberry Supply Chain

by
Petré Steynberg
,
Leila L. Goedhals-Gerber
* and
Esbeth van Dyk
Department of Logistics, Stellenbosch University, Matieland 7602, South Africa
*
Author to whom correspondence should be addressed.
Horticulturae 2022, 8(12), 1191; https://doi.org/10.3390/horticulturae8121191
Submission received: 18 November 2022 / Revised: 3 December 2022 / Accepted: 6 December 2022 / Published: 13 December 2022
(This article belongs to the Collection New Challenges in Productivity of Berry Fruits)

Abstract

:
Blueberries are highly perishable and temperature sensitive. The main purpose of the study was to determine whether logistics processes in the beginning stages of the blueberry supply chain have an influence on the temperature profiles and quality of the fruit further downstream. Temperature trials were conducted on three farms in the Gauteng and three in the Western Cape provinces of South Africa. Observations were made, and iButton® temperature monitoring devices were used to record ambient temperatures experienced by blueberries from harvesting until after forced cooling in the cold store. Descriptive statistics were used to analyse the temperature data. The results showed poor adherence to protocols and a large number of temperature and chilling injury spikes and breaks. Many trials did not reach pre-cooling and forced cooling protocol temperatures within the required time. Quality reports indicated that pallets were downgraded owing to cartons being underweight, probably as a result of moisture loss, and other quality defects such as collapsed berries and mould. By minimizing the breach of protocols and improving the beginning stages of the blueberry supply chain, a better-quality product will be ensured, thus reducing costs, food loss and food waste.

1. Introduction

1.1. Background

South Africa has a well-established fruit export industry, accounting for approximately 35% of agricultural exports and valued at $3.3 billion [1]. The majority of the fruit exports comprise citrus, deciduous and subtropical fruit, but exotic fruit types have become more popular in recent years [2]. Blueberries are especially sought-after owing to their health benefits. Farmers in South Africa seized this market opportunity, leading to an increase in production from 11,700 tons in the 2018/2019 season to 31,520 tons in the 2021/2022 season [3,4].
Blueberries are highly perishable and temperature sensitive, requiring adherence to strict temperature protocols in the export cold chain to maintain fruit quality. Company X is a leading player in the export of blueberries from South Africa. They have conducted research along the cold chain of blueberries in the past and identified specific concerns regarding the beginning stages of the cold chain and the logistical processes followed. Company X requested that this research be conducted. The purpose of this research was to investigate whether different logistics processes in the beginning stages of the blueberry supply chain, from harvesting to the cold store, have an influence on the temperature profiles and quality of the fruit further downstream in the cold chain.

1.2. Cold Chain

Kitinoja [5] and Ndraha et al. [6] (p. 13) define a cold chain as “the uninterrupted handling of perishable products within a low temperature environment in order to maintain the quality and safety of the products. Effectively, the cold chain starts with the postharvest steps of the value chain including harvesting, collection, packing, processing, storage, transport and marketing up until it reaches the final consumer”.
Fresh fruit and vegetables often have to be disposed of owing to bruising, moisture loss, and decay [7] (p. 35) and [8] (p. 627). Many of these losses can be prevented by maintaining the cold chain [9] (p. 23) and [10] (p. 1950). The benefits that proper cooling provides to perishables are listed in Table 1.
The rate of decay increases significantly as temperature increases. For example, Kitinoja [5] found that the rate of microbial growth and water loss doubled for each increase of 10 °C. Therefore, the importance of an effective cold chain cannot be overstated. However, many factors, such as poorly designed refrigeration equipment, the position of products in the containers, and poor cold chain management practices, can cause temperature fluctuations in the cold chain [6] (p. 19).
Ripening and senescence continue after harvest, as the produce is metabolically active. An inadequate cold chain could thus cause a loss in quality or the outbreak of foodborne pathogens, resulting in food waste and financial losses [11]. Postharvest activities, therefore, need to be managed effectively. Fortunately, new postharvest treatments have been developed that enable the industry to deliver produce with high nutritional value and sensory quality [11].

1.3. Blueberry Cold Chain

As the blueberry industry in South Africa is still young, postharvest activities need to be evaluated to improve its cold chain. The main stages in a typical cold chain are shown in Figure 1. For this study, the focus was on the initial stages, namely harvesting, land transportation, pre-cooling, and cold storage (forced cooling), as indicated in red. The aim was to investigate whether previously identified weaknesses are also present in the blueberry cold chain, and if so, what remedial actions could be taken to improve fruit quality and reduce spoilage. The initial stages of the blueberry supply chain, from harvesting until the berries have been force-cooled in the cold store, are illustrated in Figure 2 and described in greater detail below.
Although the pre-cooling phase is technically the starting point of the cold chain, harvesting practices affect the initial temperature and quality of the blueberries.
The ripening period from the first berry to the last for all blueberry varieties is four to six weeks [14]. Blueberries are picked at the 85–90% blue stage for export via sea freight and 100% blue stage for export via air freight and the domestic market [15,16]. Blueberry harvesting can, therefore, last several days or even weeks, depending on the fruit’s maturity and climatic conditions. Company X created colour cards for each of their blueberry varieties to assist pickers and inspectors. In addition, firmness (durofel) and sugar (brix) tests are used to determine the fruit’s maturity and select suitable export markets [16]. If the berries are harvested prematurely, the flavour will be inferior, and shrivelling could occur. If the berries are too ripe, the fruit will become soft, mealy, and flavourless soon after harvest [17]. Harvesting can take place in the morning or during the day, depending on the weather. Company X prefers not to harvest or handle blueberries if moisture is present on the berries or when the temperature exceeds 30 °C [16].
Blueberries are picked and placed into one-litre buckets. When the buckets are full, they are emptied into crates on the quality control (QC) table. Empty buckets and crates used for harvesting should not lie in the sun prior to use, as they could transfer their heat to the berries. The QC tables and harvested produce should also be kept in the shade. Van Hoorn [18] found that the temperature of the produce in trays in the shade is 5–6 °C below the ambient air temperature. After inspection, the crates are labelled and stacked for transport to the cold room on the farm.
Blueberries should be transported to the cold room within one hour after harvesting. The sooner the field heat can be reduced through pre-cooling, the better the fruit quality can be preserved. The crates are transported on tractor-trailers covered with shade netting and should be offloaded in a shaded area at the cold room, especially if there is a queue of tractor-trailers to be offloaded.
In the cold room, the crates are immediately stacked onto pallets and then pre-cooled to 6 °C [16]. The cooled pallets are loaded in an airlock onto a refrigerated truck for transport to the packhouse. An airlock is also used during delivery at the packhouse. The cold room, truck, and packhouse are all maintained at 6 °C. At the packhouse, the blueberries are graded and inspected for compliance with market criteria, packaged in cartons, and palletised. Once the pallets have been approved by the Perishable Products Export Control Board [19], they are placed in the cold room until they can be transported by refrigerated truck to the cold store. At the cold store, forced-air cooling is applied until the fruit pulp temperature is 0 °C. As blueberries are very delicate and perishable, the fruit pulp temperature has to be reduced to 0 °C within six hours after harvesting [19].

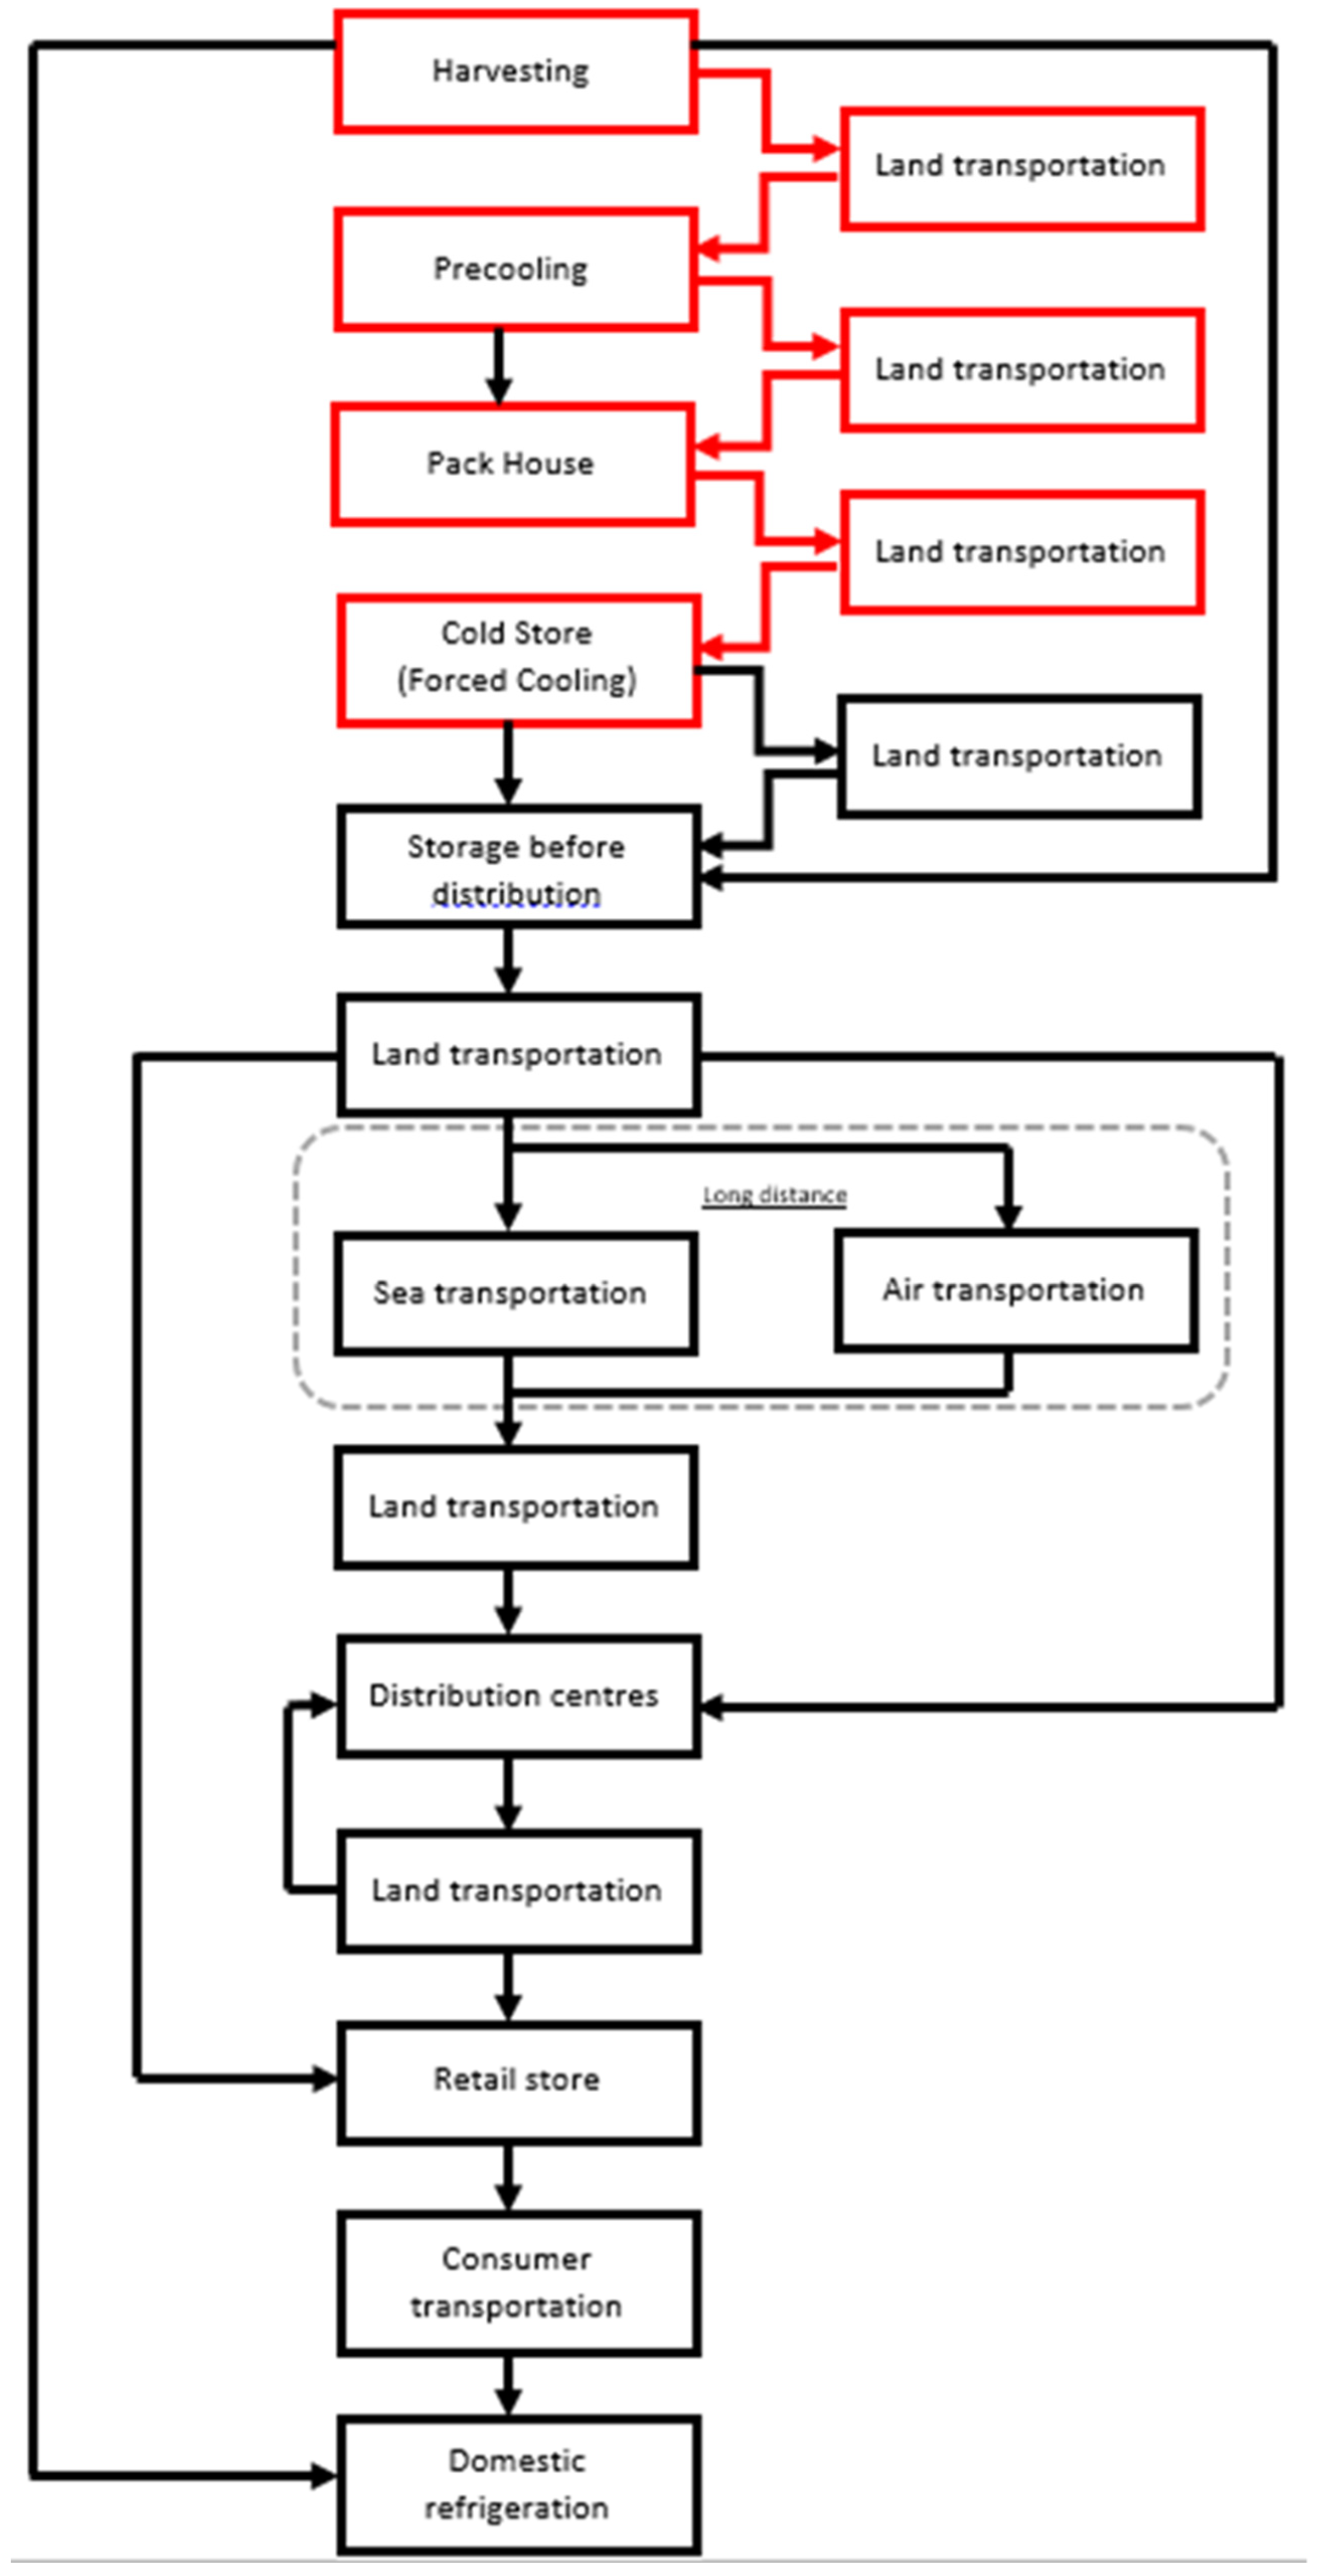
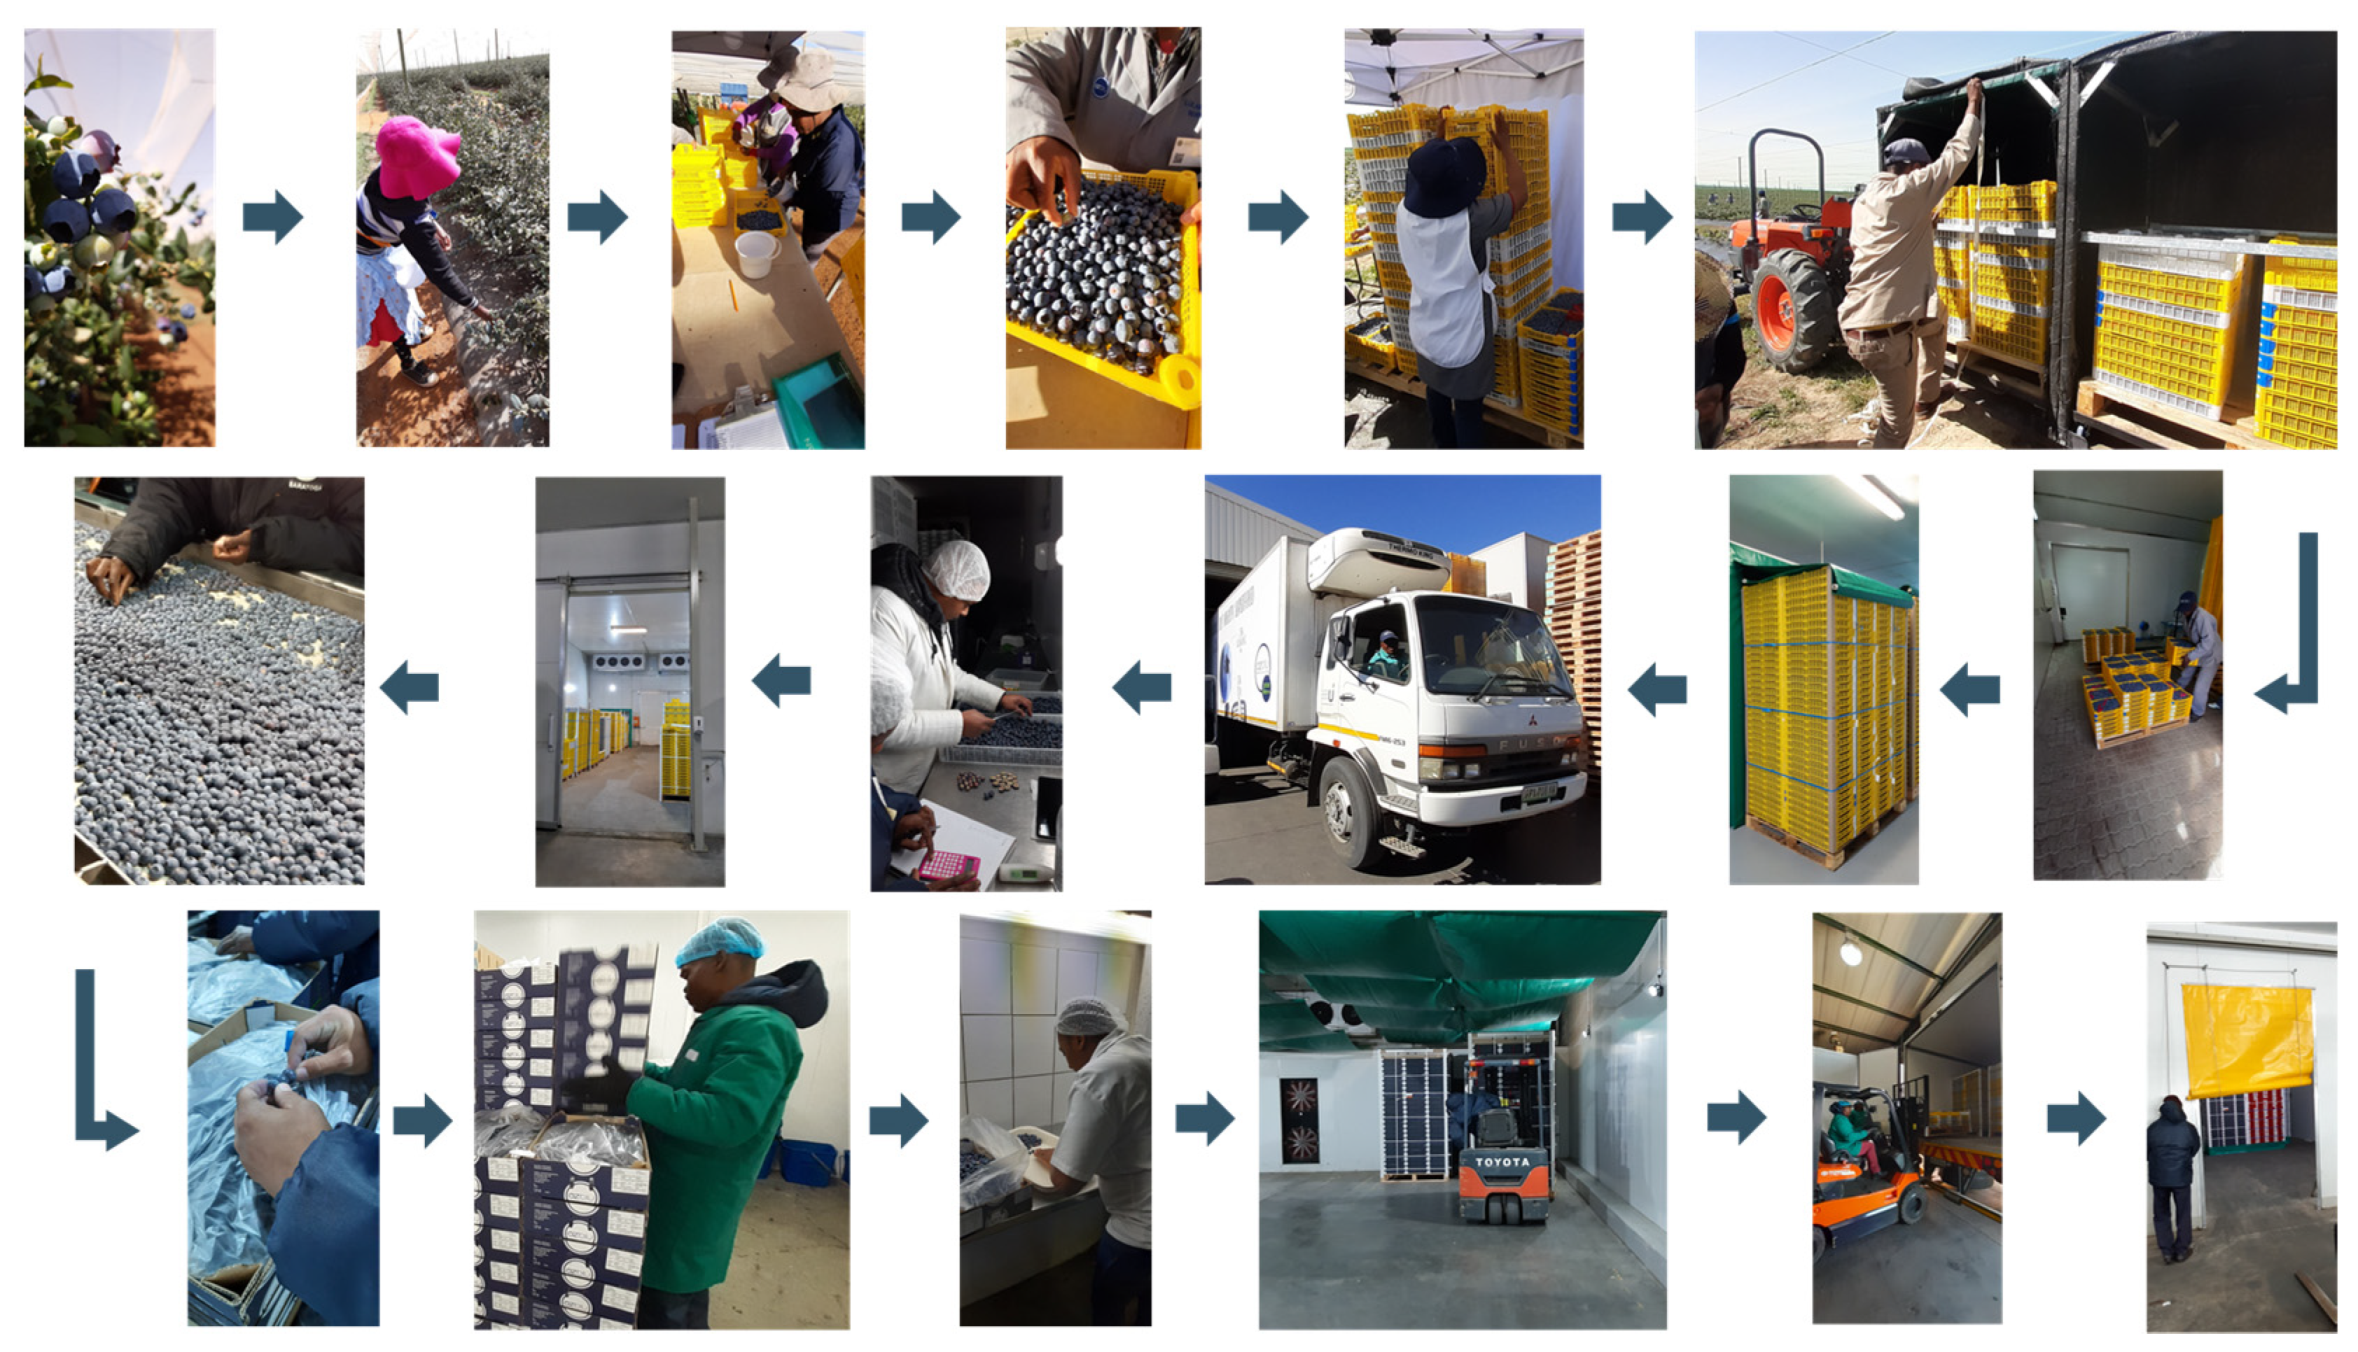
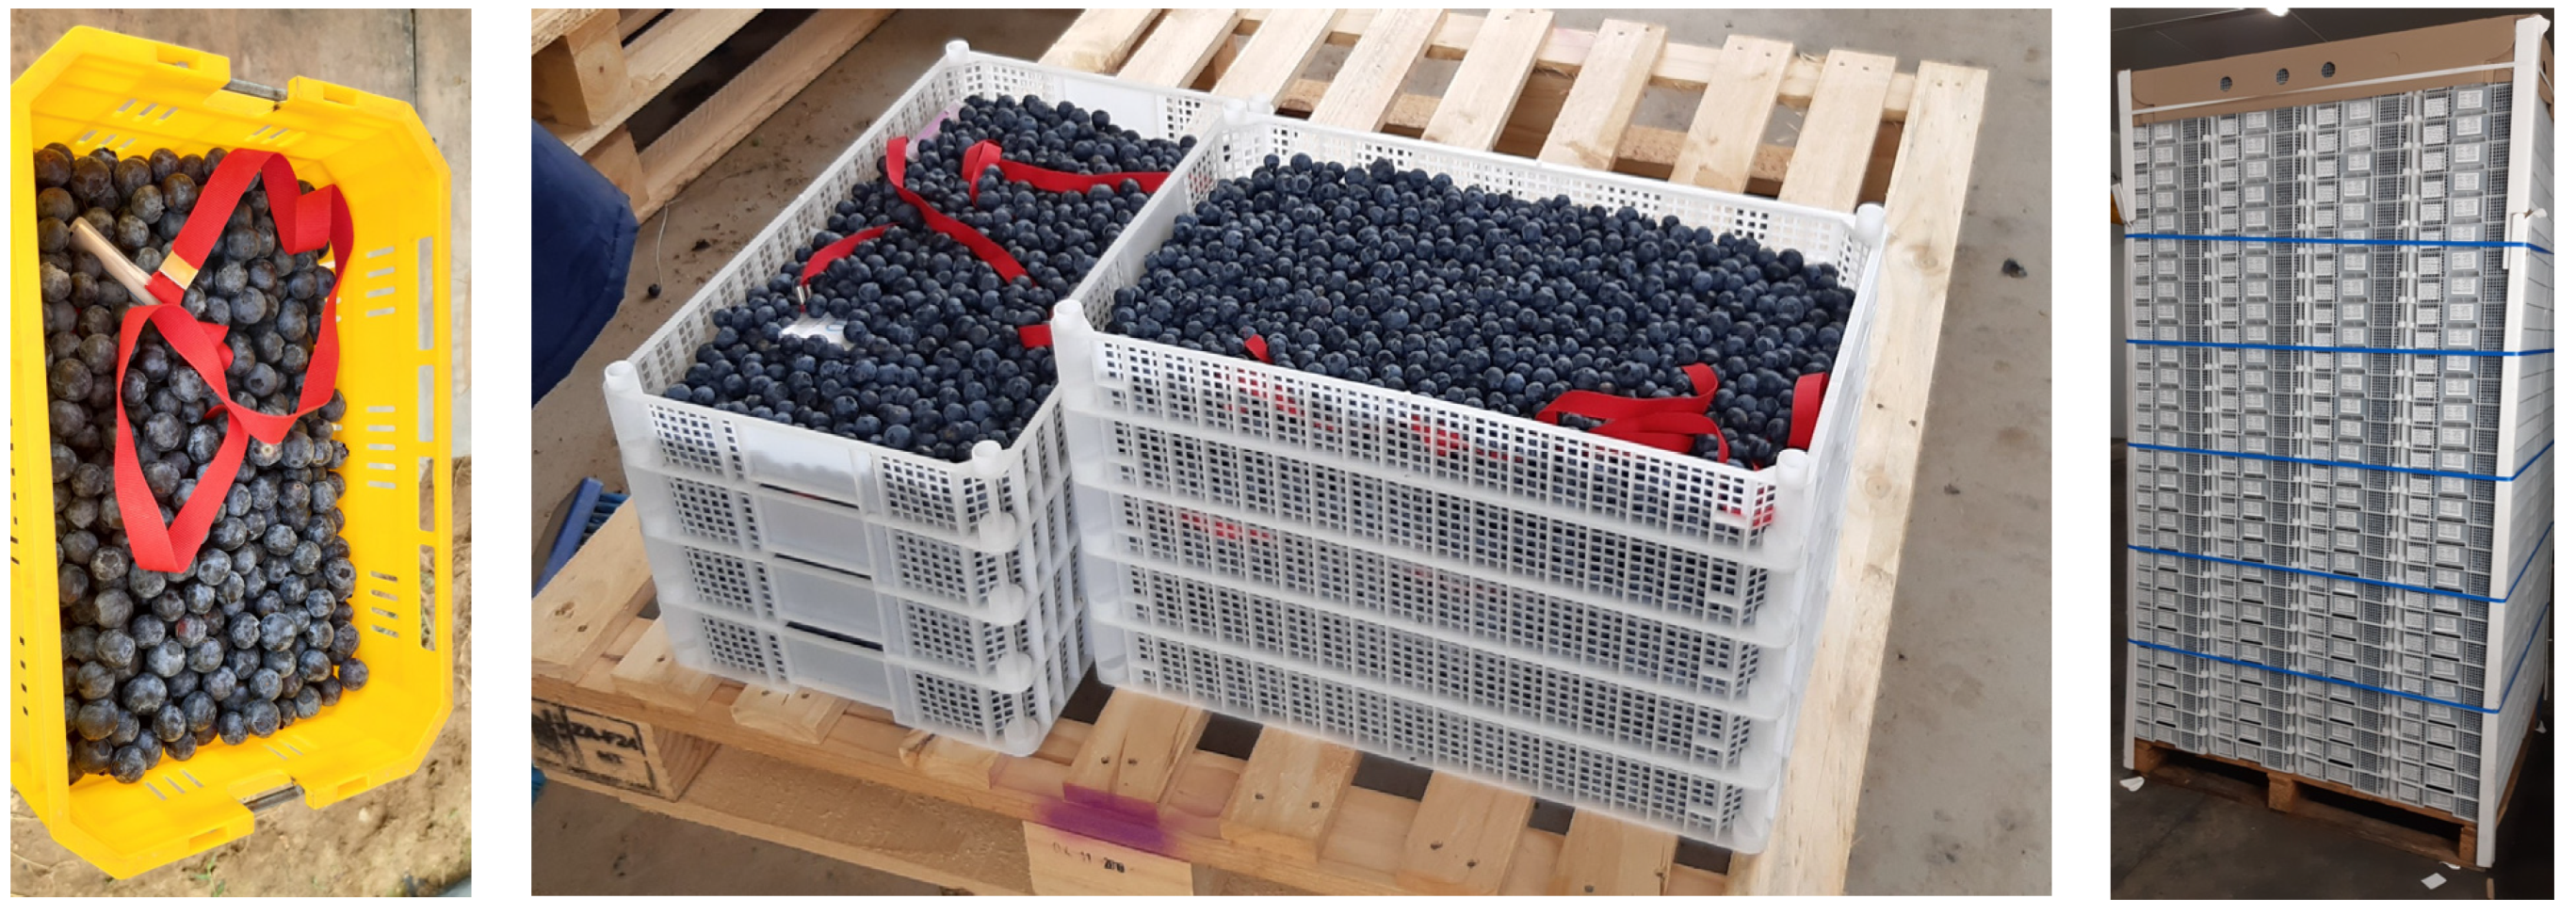
1.4. Handling Methods and Transportation Systems

Harvesting and post-harvest handling can easily cause loss of bloom wax on blueberries, which in turn reduces the nutritional quality, accelerates the loss of water, and increases the rate of decay [20]. Blueberries, therefore, have to be handled with the utmost care. Another example of poor post-harvest handling is the lack of sufficient pre-cooling after harvest, resulting in loss of quality and shelf life [21].
Temperatures are often poorly managed during transportation of perishables, leading to deterioration and food waste [21,22]. Variations in temperature along the cold chain can cause condensation on the berries, which can result in the growth of spoilage microorganisms and pathogens. Vigneault et al. [22] report that the proper use of refrigerated containers could reduce spoilage from 40% to 5%. Refrigeration, food safety, and food waste are closely linked [12].
This research investigated varying handling techniques for the initial stages of the blueberry export cold chain. These include loading, offloading, and transporting blueberries from the orchards to the centralised packhouse. All six farms harvest their blueberries by hand; however, they use different technologies to pre-cool their blueberries. The blueberries are transported to a centralised packhouse for three of the six farms, after which the blueberries are packaged and subsequently transported to a centralised cold store. However, the remaining three farms only transport the blueberries once, as the packhouse and the cold store are located at the same site.

1.5. Temperature Spikes and Temperature Breaks

A perpetual temperature profile was defined by [23] as “an uninterrupted series of refrigerated production, storage and distribution activities, which maintain a desired low temperature range”. Although many cold chains aim to achieve a perpetual temperature profile, not many are successful.
Each perishable product has ideal handling and storage temperatures for different steps in the cold chain. Non-adherence to these protocols causes temperature deviations that negatively affect the product quality [24]. These temperature deviations are called temperature spikes or temperature breaks, depending on the severity of the deviation. The definitions for temperature spikes and temperature breaks are product-specific, as some products are more susceptible to chilling injury or heat injury than others.
Much of the information regarding the blueberry cold chain is kept confidential, as the blueberry industry in South Africa is still young and highly competitive; thus, the table grape cold chain was used as a benchmark. However, blueberries are more susceptible to fluctuations in temperature than table grapes. The following definitions were therefore adopted for this study, based on the definitions by [23] for table grapes:
  • A temperature break is defined as “any rise in temperature of 2 °C above the product-appropriate set point, for longer than 30 min”.
  • When the temperature falls below −1.5 °C for longer than 30 min, it is regarded as a chilling injury break (blueberries freeze at approximately −2 °C [25].
  • When the temperature rises above the established 2 °C or falls below the −1.5 °C barrier, but this does not last longer than 30 min, it is defined as a temperature spike or chilling injury spike, respectively.
The damage caused by temperature deviations is cumulative; therefore, recurring temperature spikes can be just as harmful to the fruit as one long temperature break [23].

1.6. Quality Assurance and Control

In the fruit cold chain, quality control involves a broad range of factors, such as internal and external fruit quality, traceability, timely delivery, and end customer satisfaction [26] In this study, the emphasis is on ensuring that the fruit is of a high quality and meets the internal and external fruit quality requirements of the export markets. The PPECB conducts all the necessary phytosanitary and fruit quality inspections. The fruit export industry adheres to “Good Agricultural Practices” during production and harvest and “Good Hygienic Practices” in the packhouses and other stages of handling fruit to ensure that both the environment and produce are clean and free from contamination.

1.7. Purpose of the Study

Previous studies identified weaknesses such as temperature variations in numerous steps along food cold chains, including pre-cooling, loading and road transportation, handling and storage at the port of departure, display at retailers, and storage in domestic refrigerators [12,27,28,29,30].
The main purpose of the study was to determine whether different logistics processes implemented, specifically in the beginning stages of the blueberry supply chain, from harvesting until the cold store, have an influence on the temperature profiles and quality of the fruit further downstream in the supply chain.

1.8. Contribution

The quality of blueberries can be negatively affected by deviations in temperature. This is because a rise in temperature leads to an escalation in the natural degrading process of perishable products, a reduction in the fruits’ relative shelf-life, and an increase in the percentage loss of fruit per day [5]. Therefore, the researchers are of the opinion that the temperature deviations measured during the initial stages of the blueberry supply chain could have been reduced (or even avoided) if protocols were adhered to more precisely. This research showed that these temperature fluctuations contributed to pallets of blueberries being downgraded on arrival at the overseas destination.
In addition, one of the main reasons that pallets were downgraded was due to the pallets being underweight on arrival at the overseas destination. Kitinoja [5] and James and James [10] showed that maintaining a good cold chain reduces transpiration, as blueberries start losing moisture directly after harvest. Therefore, a well-maintained cold chain reduces the occurrence of moisture loss, which results in less shrivelling. Van Amerongen [31] states that cooling by means of forced-air cooling reduces moisture loss and extends the shelf-life of blueberries. In addition, maintaining a relative humidity of 90–95% at an optimum temperature further contributes to the reduction of moisture loss. This research shows that applying pre-cooling and forced-air cooling efficiently and effectively, combined with a well-maintained relative humidity and proper cold chain management, could significantly decrease the loss of moisture experienced by blueberries.
By minimizing the breach of protocols and improving the beginning stages of the blueberry supply chain, a better-quality product will be ensured, thus reducing costs, food loss, and food waste.

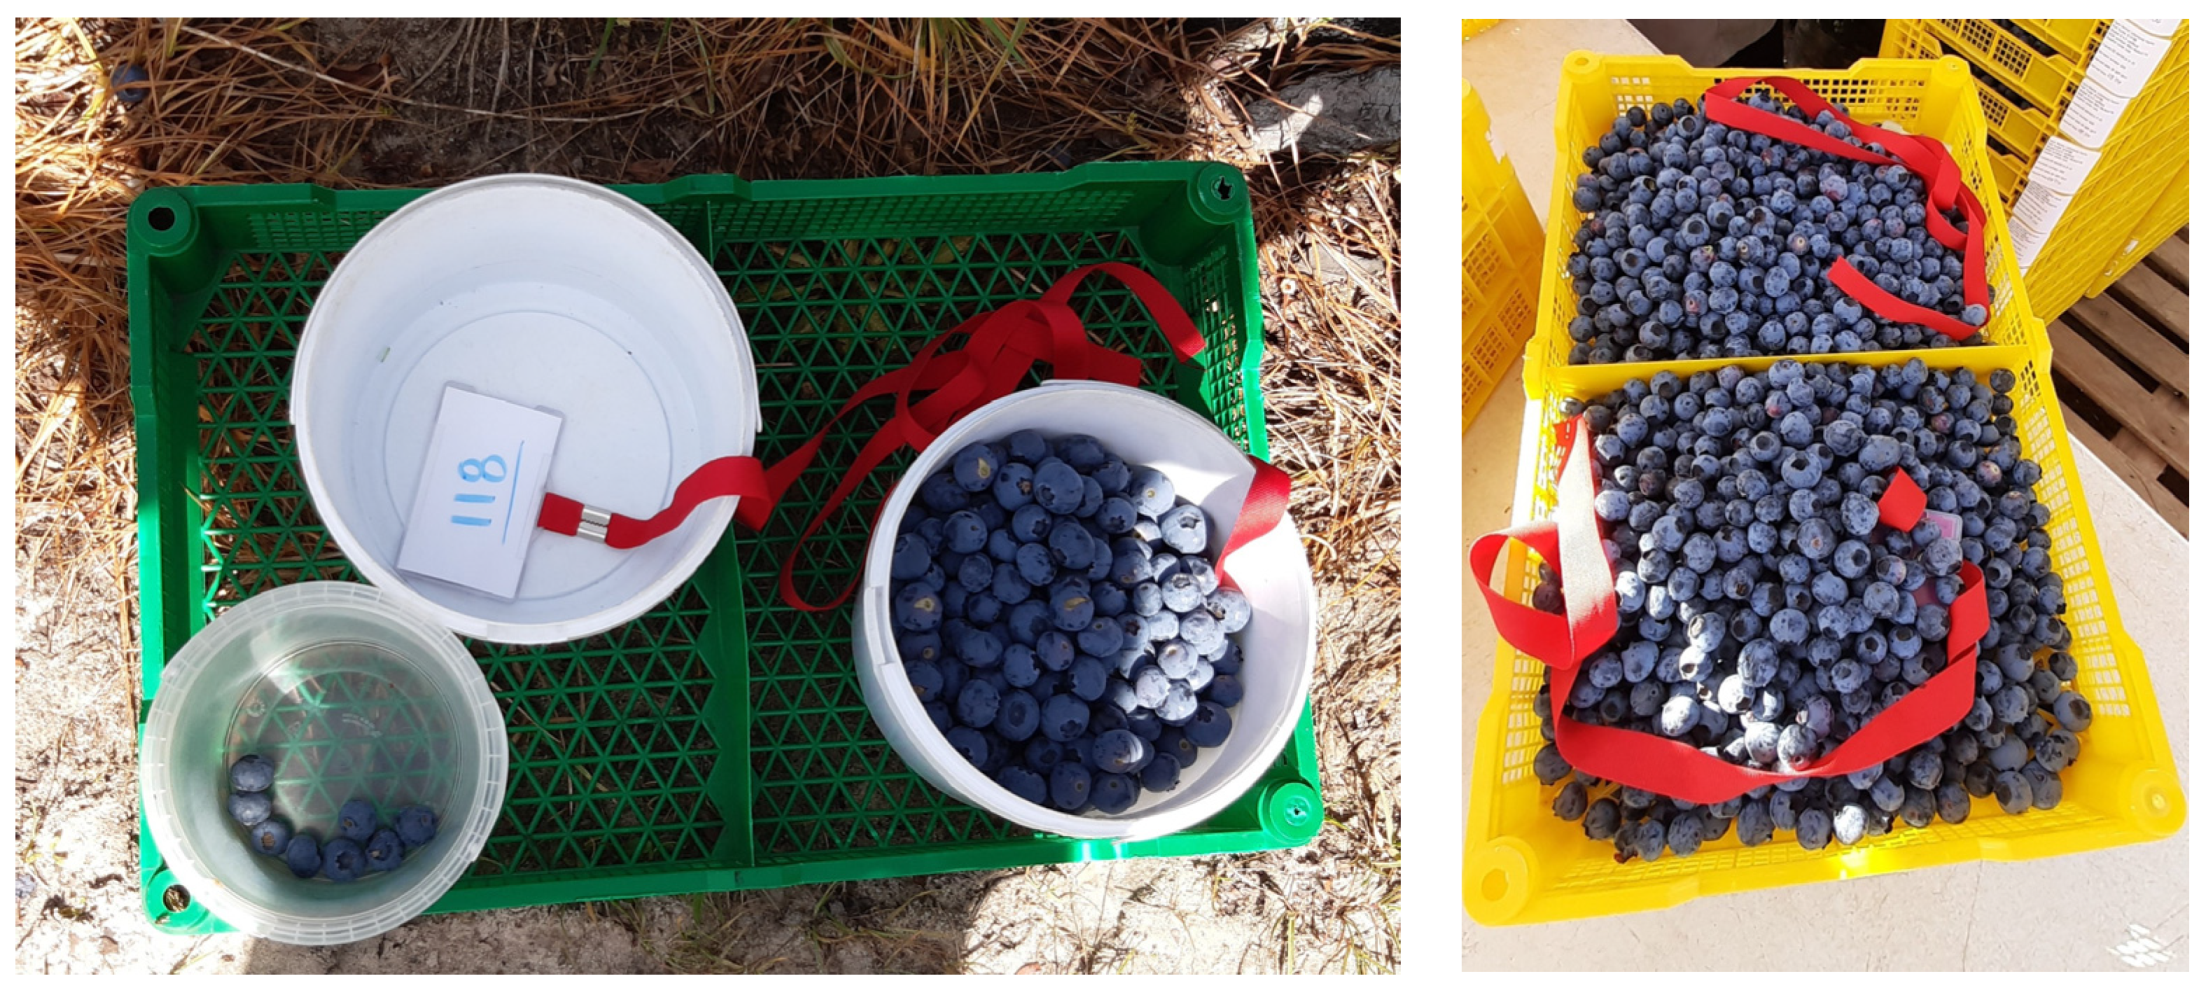
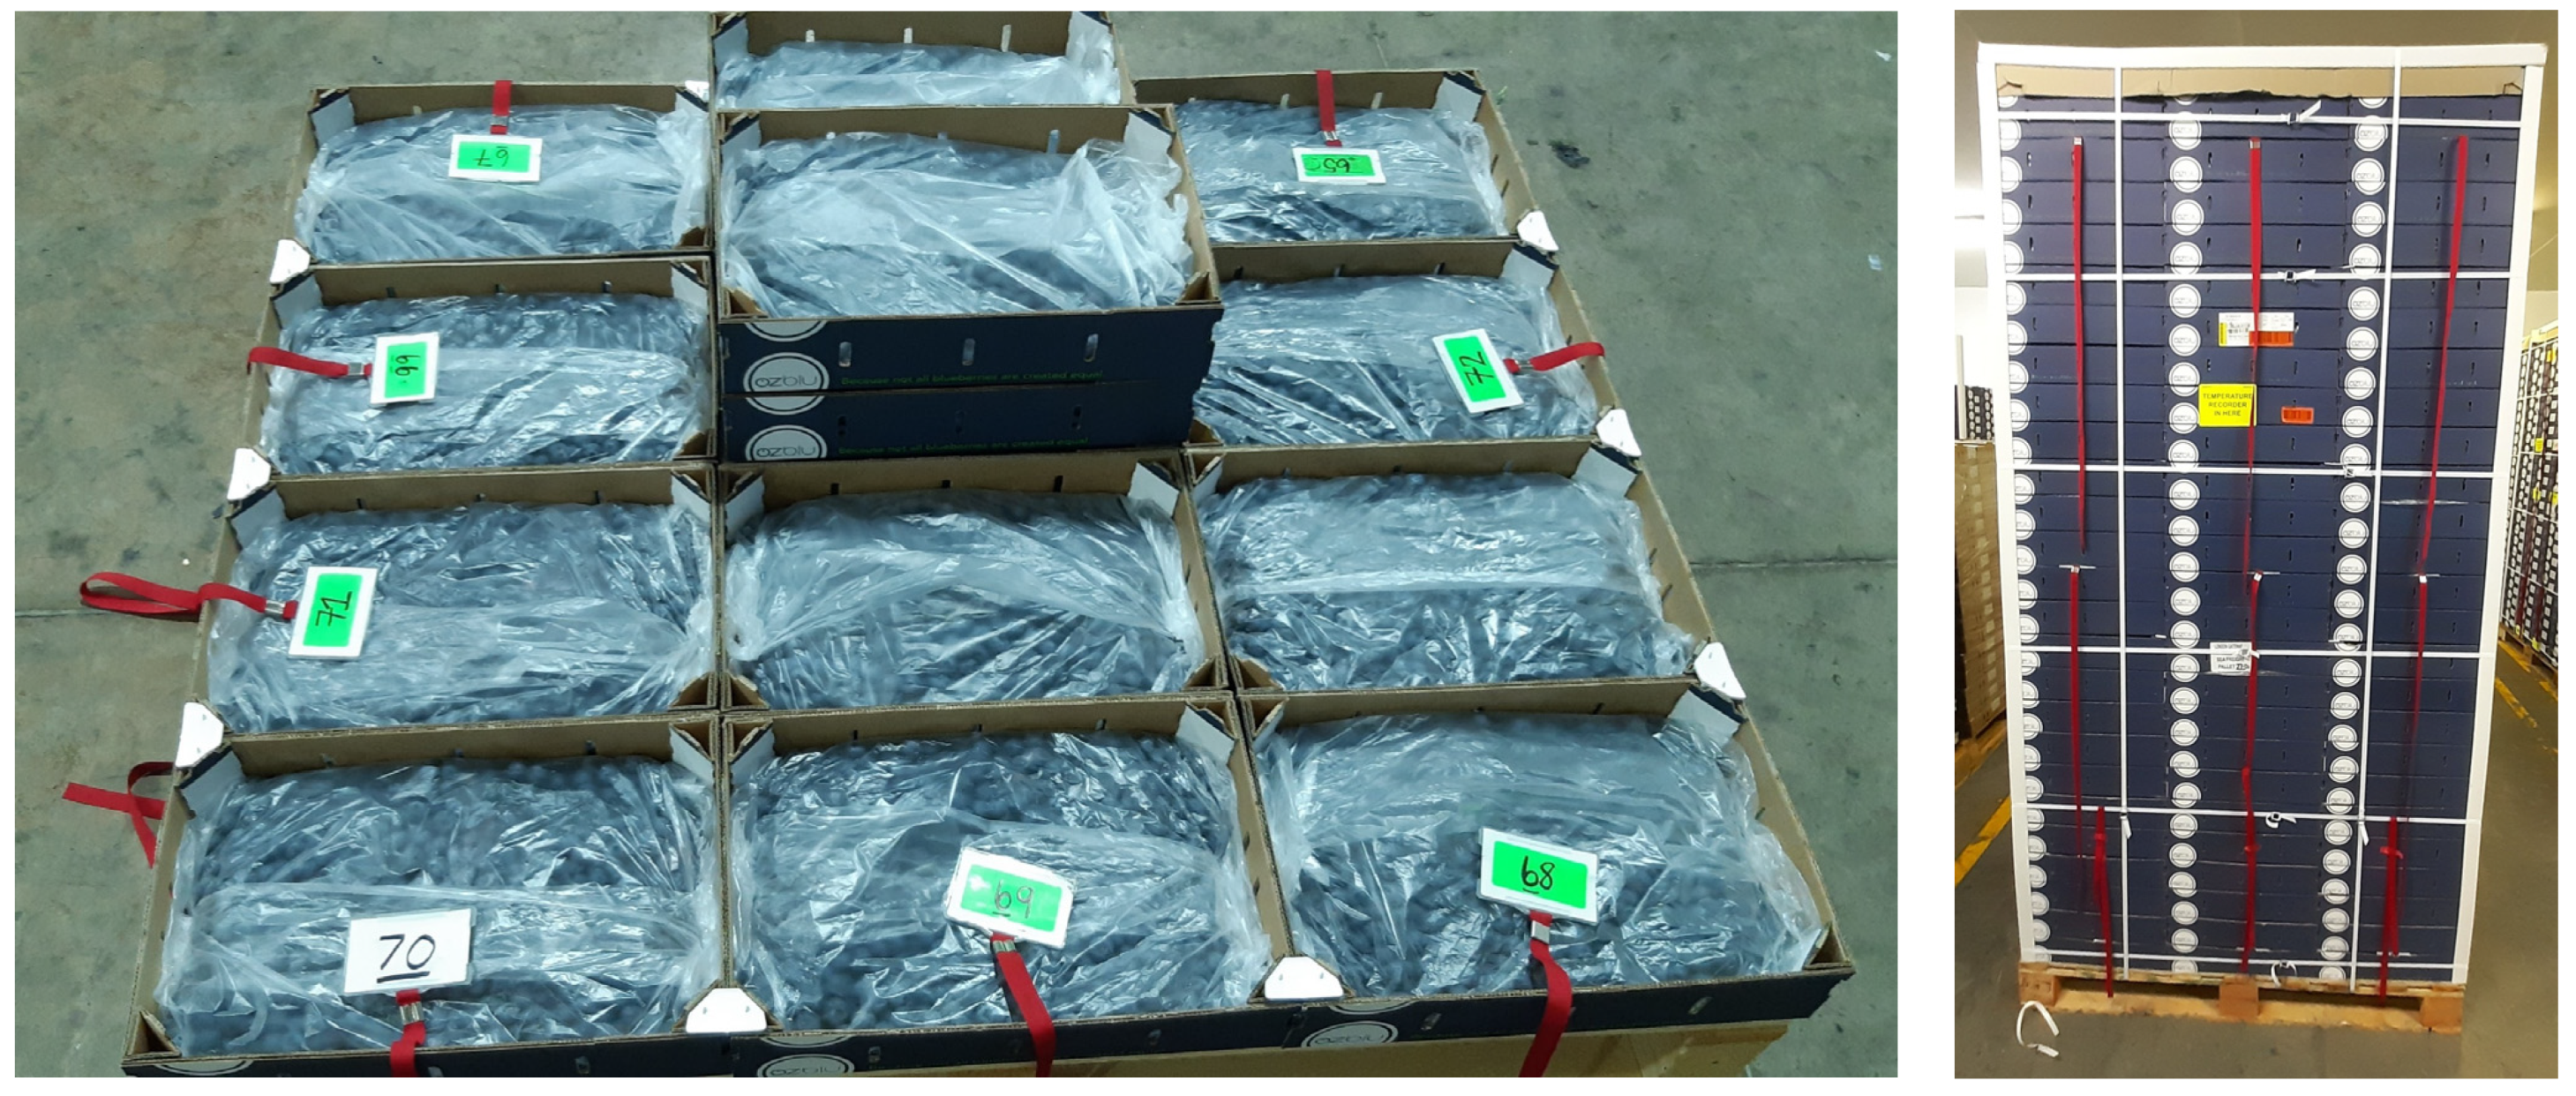
2. Materials and Methods

Secondary data was collected through a comprehensive literature review. Primary qualitative data was gathered through observations and semi-structured interviews during site visits to blueberry farms, packhouses, and cold stores. Questionnaires were sent to those who could not be interviewed in person, including international blueberry experts. Quantitative data was collected using iButton® (iButtonLink Technology, Whitewater, WI, USA) temperature monitoring devices to record the ambient temperatures to which the blueberries were exposed. Temperature trials were conducted on three farms each in the Gauteng and Western Cape provinces of South Africa. The three farms in the Western Cape (Farms A, B, and C) are located between 43 km and 120 km from the combined packhouse and cold store. The three farms in Gauteng (Farms D, E, and F) are all located approximately 140 km from the packhouse, which is located 5.6 km from the cold store. Each farm uses different cooling systems and harvesting methods.
The number of iButtons® required to collect sufficient data was determined through a power analysis. The analysis indicated that 54 iButtons® were required per farm. Three trials starting at different times were conducted on each farm, namely an Early Morning, Late Morning, and Afternoon trial, using 18 iButtons® per trial.
Each iButton® was attached to a numbered card with a long red ribbon for easy retrieval. During harvesting, the iButtons® were placed in one-litre buckets amongst the blueberries, except on Farm C, where a different procedure was followed. The iButtons® were transferred with the berries into crates on the quality control (QC) tables (Figure 3). In the packhouse, the iButtons® were removed from the crates and then placed in cartons on the bottom, middle, and top levels of the pallets (Figure 4). The iButtons® were finally removed at the cold store after forced cooling had been applied.
On Farm C, field packing is used, which eliminates the packhouse step. Lugs are used for harvesting instead of one-litre buckets. iButtons® were placed amongst the berries in the lugs during harvesting and transferred into 4 kg trays at the QC table, before pallets were built with the trays (Figure 5). The iButtons® were finally removed at the cold store after forced cooling had been applied.
Descriptive statistics were used to analyse the temperature data. Excel, Statistica, and Tableau (Microsoft Excel, Microsoft 365, Seattle, WA, USA, STATISTICA 13.5, TIBCO Software, Palo Alto, CA, USA Tableau, Tableau Desktop—2020.2, Seattle, WA, USA) were used to analyse and visualise the data and results.

3. Results

3.1. Temperature Spikes and Temperature Breaks

Owing to limited funding, some second-hand iButtons® were used in addition to new iButtons®, resulting in a few malfunctioning, possibly due to reaching the end of their battery life. The number of iButtons® from which data could be retrieved for each trial is shown in Table 2.
The trials on Farm D had to be repeated due to a technical error with the starting time of the iButtons®. Nevertheless, the data from the first set of trials were still usable.
The number of temperature spikes and breaks as well as the number of chilling injury spikes and breaks recorded per farm and per stage are shown in Table 3 and Table 4, respectively. In total, 638 temperature spikes, 242 temperature breaks, 345 chilling injury spikes, and 27 chilling injury breaks were recorded. The majority of the temperature spikes were recorded on Farms B, D1, and E, while a moderate number of temperature spikes were also recorded on the other farms. Temperature breaks were recorded on all the farms, ranging from very few to a moderate number. The majority of the chilling injury spikes were recorded on Farm A, while a few chilling injury spikes and breaks were recorded on Farm C.
The majority of the temperature and chilling injury spikes and a moderate number of temperature and chilling injury breaks were recorded during the forced cooling stage. A moderate to large number of temperature spikes and breaks were also recorded during the harvest and transportation and packhouse stages and a moderate number of temperature spikes during the transportation to forced cooling stage.
Four areas of concern that contributed to the occurrence of temperature and chilling injury spikes and breaks were identified and are discussed below.

3.1.1. Concern 1: High Harvesting Temperatures

During some of the Late Morning and Afternoon trials, the daytime temperature exceeded the maximum allowed harvesting temperature of 30 °C (Cold Chain Specialist, 2019). The researchers observed one-litre buckets and empty crates lying in the sun, sometimes on a steel table, before being used. In one instance, the temperature of a one-litre bucket was measured as 38.1 °C after it had been left in the sun over lunch. Sometimes crates with berries were put in the sun instead of the shade. On one farm, the gazebo over the QC table had been broken due to strong wind, leaving the steel table in full sun—a temperature of 47.7 °C was recorded.
More temperature spikes and breaks were recorded during the Late Morning and Afternoon trials than during the Early Morning trials. This was expected, as the maximum daytime temperature is normally recorded over lunchtime.
Farm F used a refrigerated trailer to transport the blueberries from the orchard to the cold room. This meant that the berries were being cooled while waiting to be transported and resulted in fewer temperature spikes and breaks being recorded on Farm F.

3.1.2. Concern 2: Inconsistent Temperatures during the Packhouse Stage

The protocol stipulates a temperature of 6 °C should be maintained inside the holding room, packing room, and cold room. The pallets are offloaded from the refrigerated truck into the holding room, where they are weighed and the berries are inspected and the fruit pulp temperature measured. Some of the holding rooms were not maintained at 6 °C. A temperature of 8.3 °C was measured in one of the holding rooms after the truck had been offloaded, which resulted in temperature spikes and breaks. However, after the doors of the holding room were closed, the temperature dropped to 5 °C within two minutes.
Some of the packing rooms were also not maintained at 6 °C; temperatures ranging from 9.2 °C to 9.7 °C were measured in packing rooms, and maximum temperatures of 18.2 °C and 13.7 °C were recorded in the fruit crates during the Afternoon trials before the blueberries were packed into cartons.
The trials from Farm A experienced chilling injury spikes and breaks while waiting in the cold room to be transported to the cold store. Minimum temperatures of −1.8 °C and −2.2 °C were recorded.

3.1.3. Concern 3: Transportation to Forced Cooler

In the Western Cape, no transport is required form the packhouse to the cold store (forced cooler), as they are at the same location. In Gauteng, temperature spikes were recorded during loading of the pallets at the packhouse as well as during offloading at the cold store for some of the trials. The airlock system at the packhouse did not fit the refrigerated truck used for transporting pallets to the cold store. In addition, the main doors of the holding room were left open one evening while pallets were being loaded, allowing warm air to enter the holding room, resulting in temperature spikes. The holding room should be maintained at 6 °C.
At the cold store, pallets should be offloaded through an airlock into a cold room, which is kept at 6 °C. One evening, pallets were offloaded outside in an ambient temperature of 22.3 °C and placed in a holding room instead of a cold room, resulting in temperature spikes being recorded. The following morning, pallets were offloaded through the airlock into a cold room, from where they were moved to the forced cooling room. No temperature spikes were recorded this time.

3.1.4. Concern 4: Inconsistent Temperatures during the Forced Cooling Stage

The majority of the temperature deviations were recorded during the forced cooling stage, namely 419 temperature spikes, 42 temperature breaks, 328 chilling injury spikes, and 25 chilling injury breaks. Temperature spikes and breaks were recorded simultaneously. Temperature deviations occurred in waves, caused by the defrost cycles of the refrigeration equipment [16] (Cold Chain Specialist, 2019). In the case of fruit from Farm C, temperature spikes and breaks were recorded in the pallets of the Early Morning trial, which were already in the forced cooling tunnel when pallets from the Late Morning and Afternoon trials were added. As Farm C uses field packing, the berries were in crates instead of cartons and were therefore more susceptible to temperature fluctuations.
Most of the chilling injury spikes occurred at the beginning of the forced cooling stage for the trials from Farm A. These could be as a result of the low temperatures in the cold room, as discussed above in Concern 3: Inconsistent temperatures during the Packhouse stage.
The temperature at which the pallets arrive at the cold store could potentially impact the temperature when the Forced Cooling stage commences. In the Western Cape, pallets that arrived at the cold store cooled, caused chilling injury spikes and chilling injury breaks, whereas in Gauteng, pallets that arrived at the cold store cooled, resulting in temperature spikes and temperature breaks. A possible reason for this could be that the forced cooling applied in the Western Cape is more intense than that of Gauteng, as was evident from the time and stage that the forced cooling was achieved, as discussed in the next section. Defrosting cycles of the refrigeration equipment are a major concern that needs to be addressed in both the Western Cape and Gauteng.

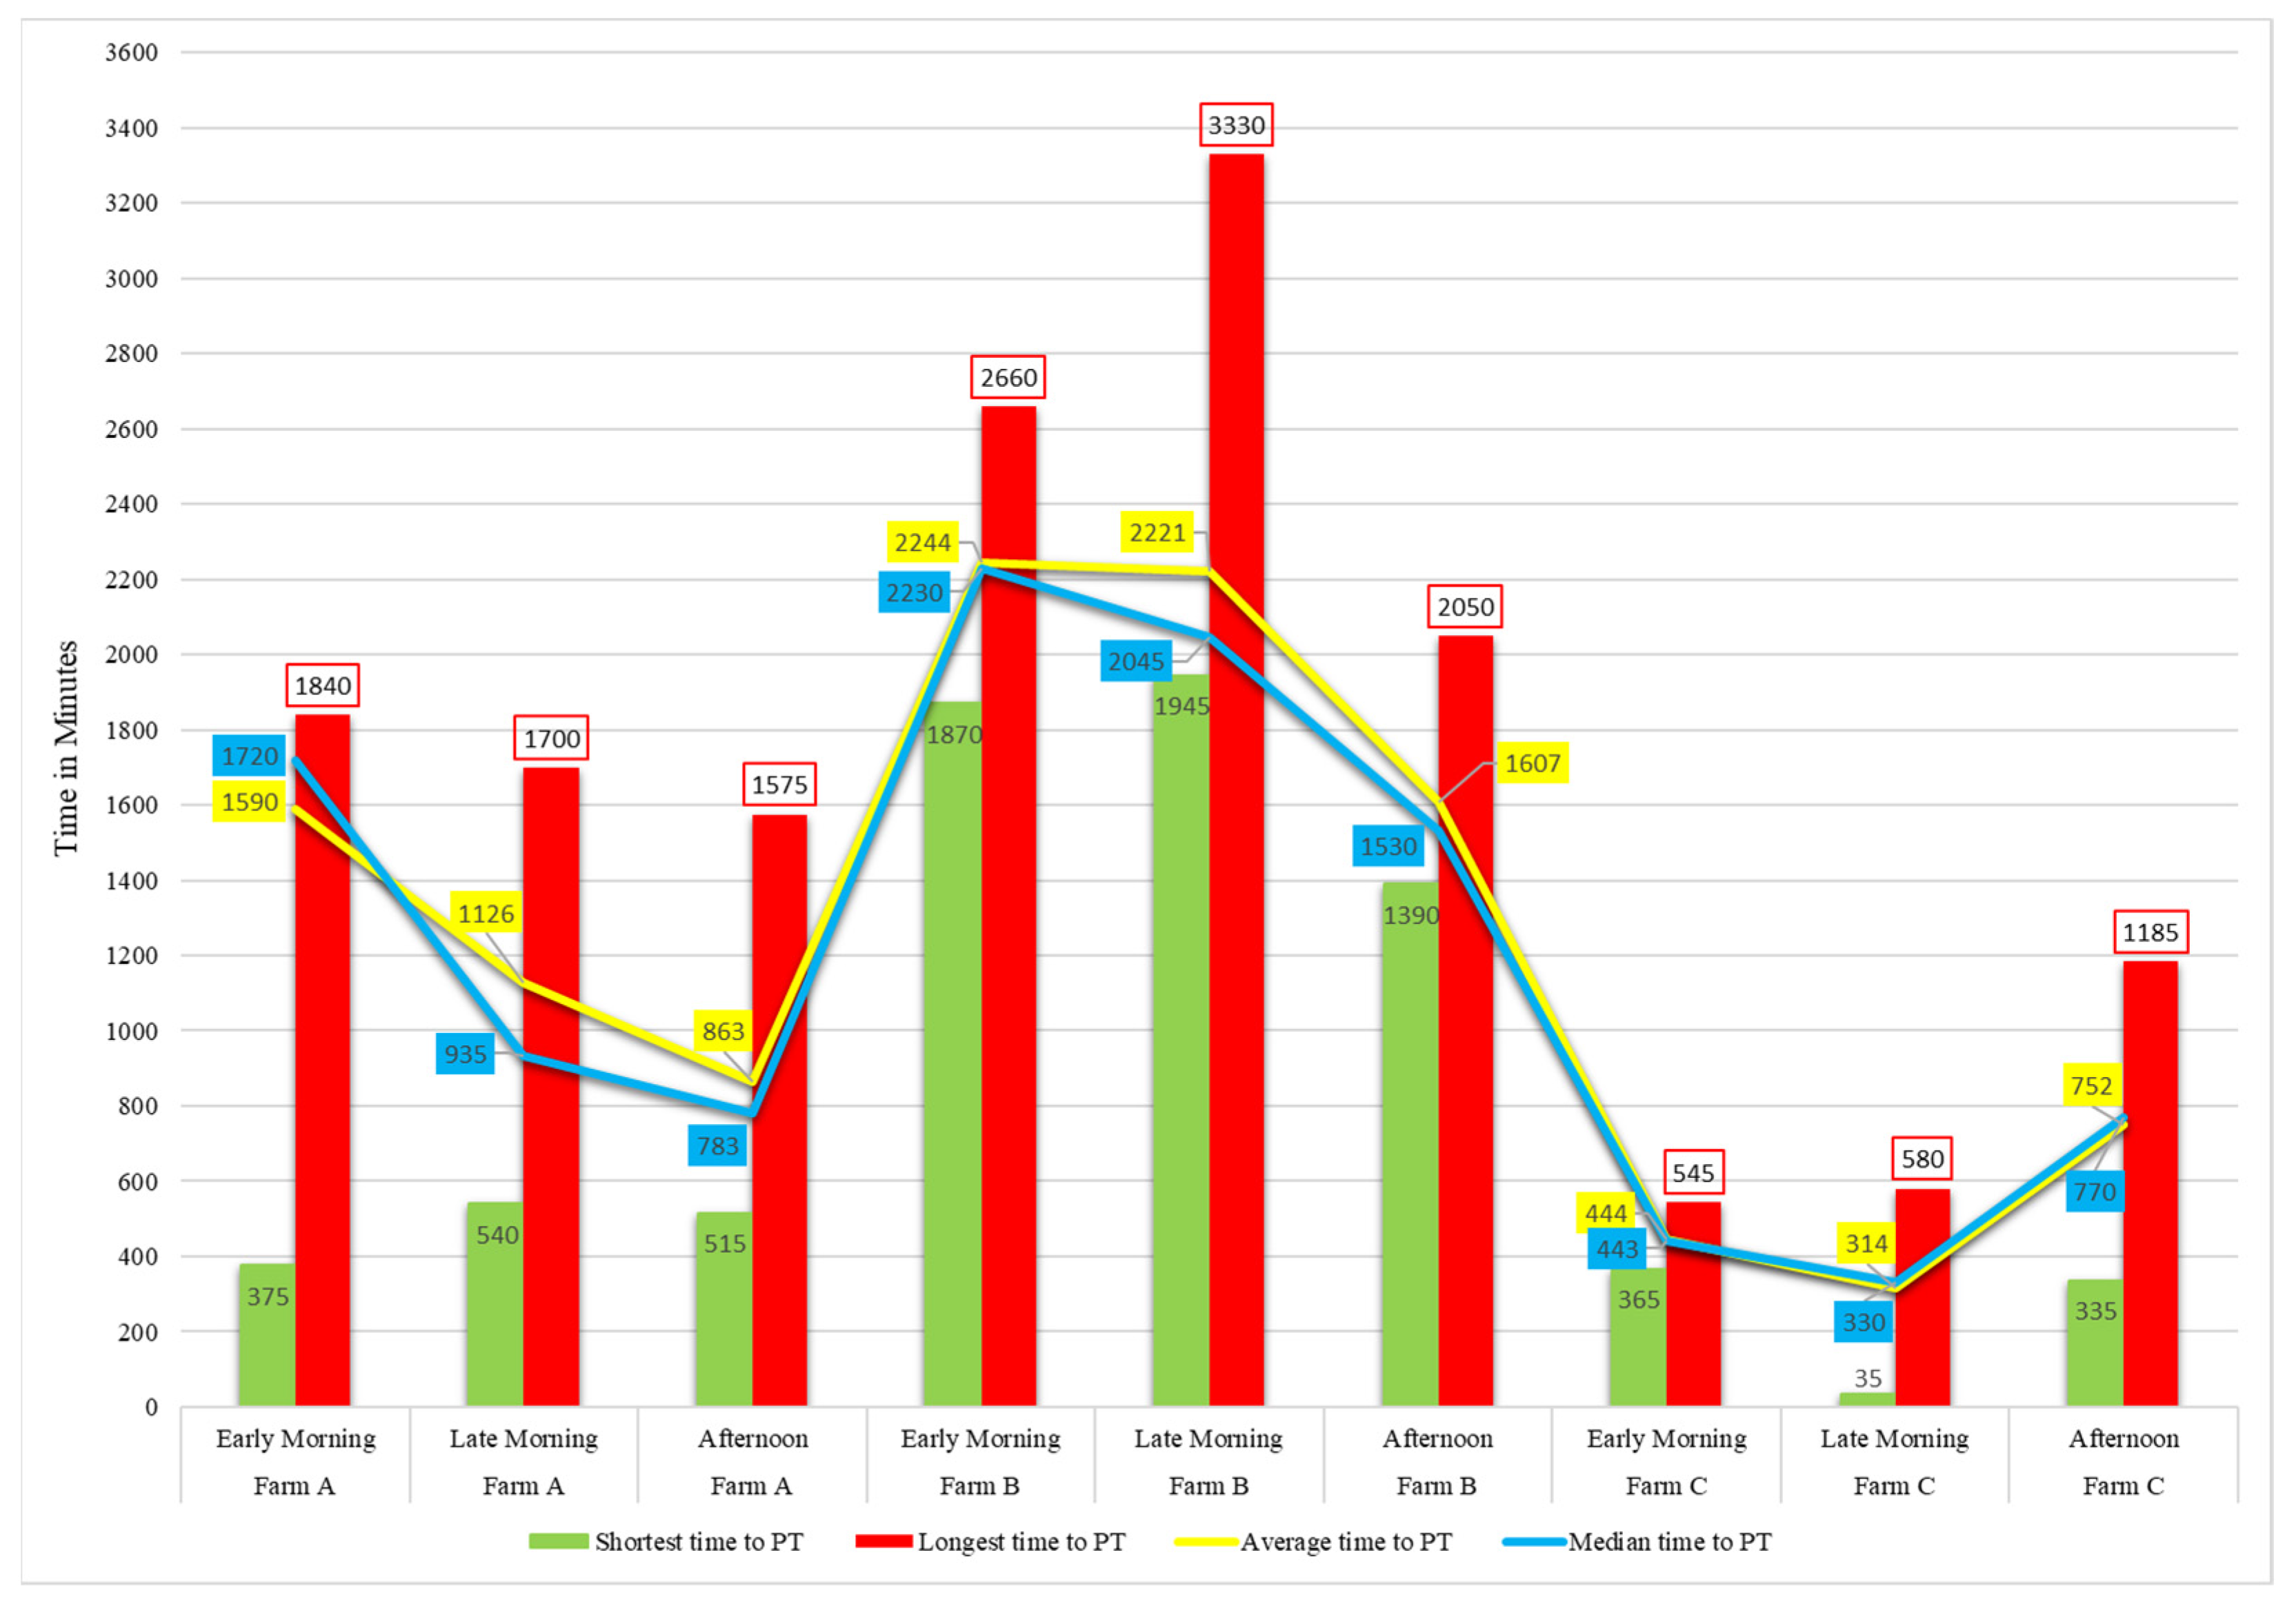
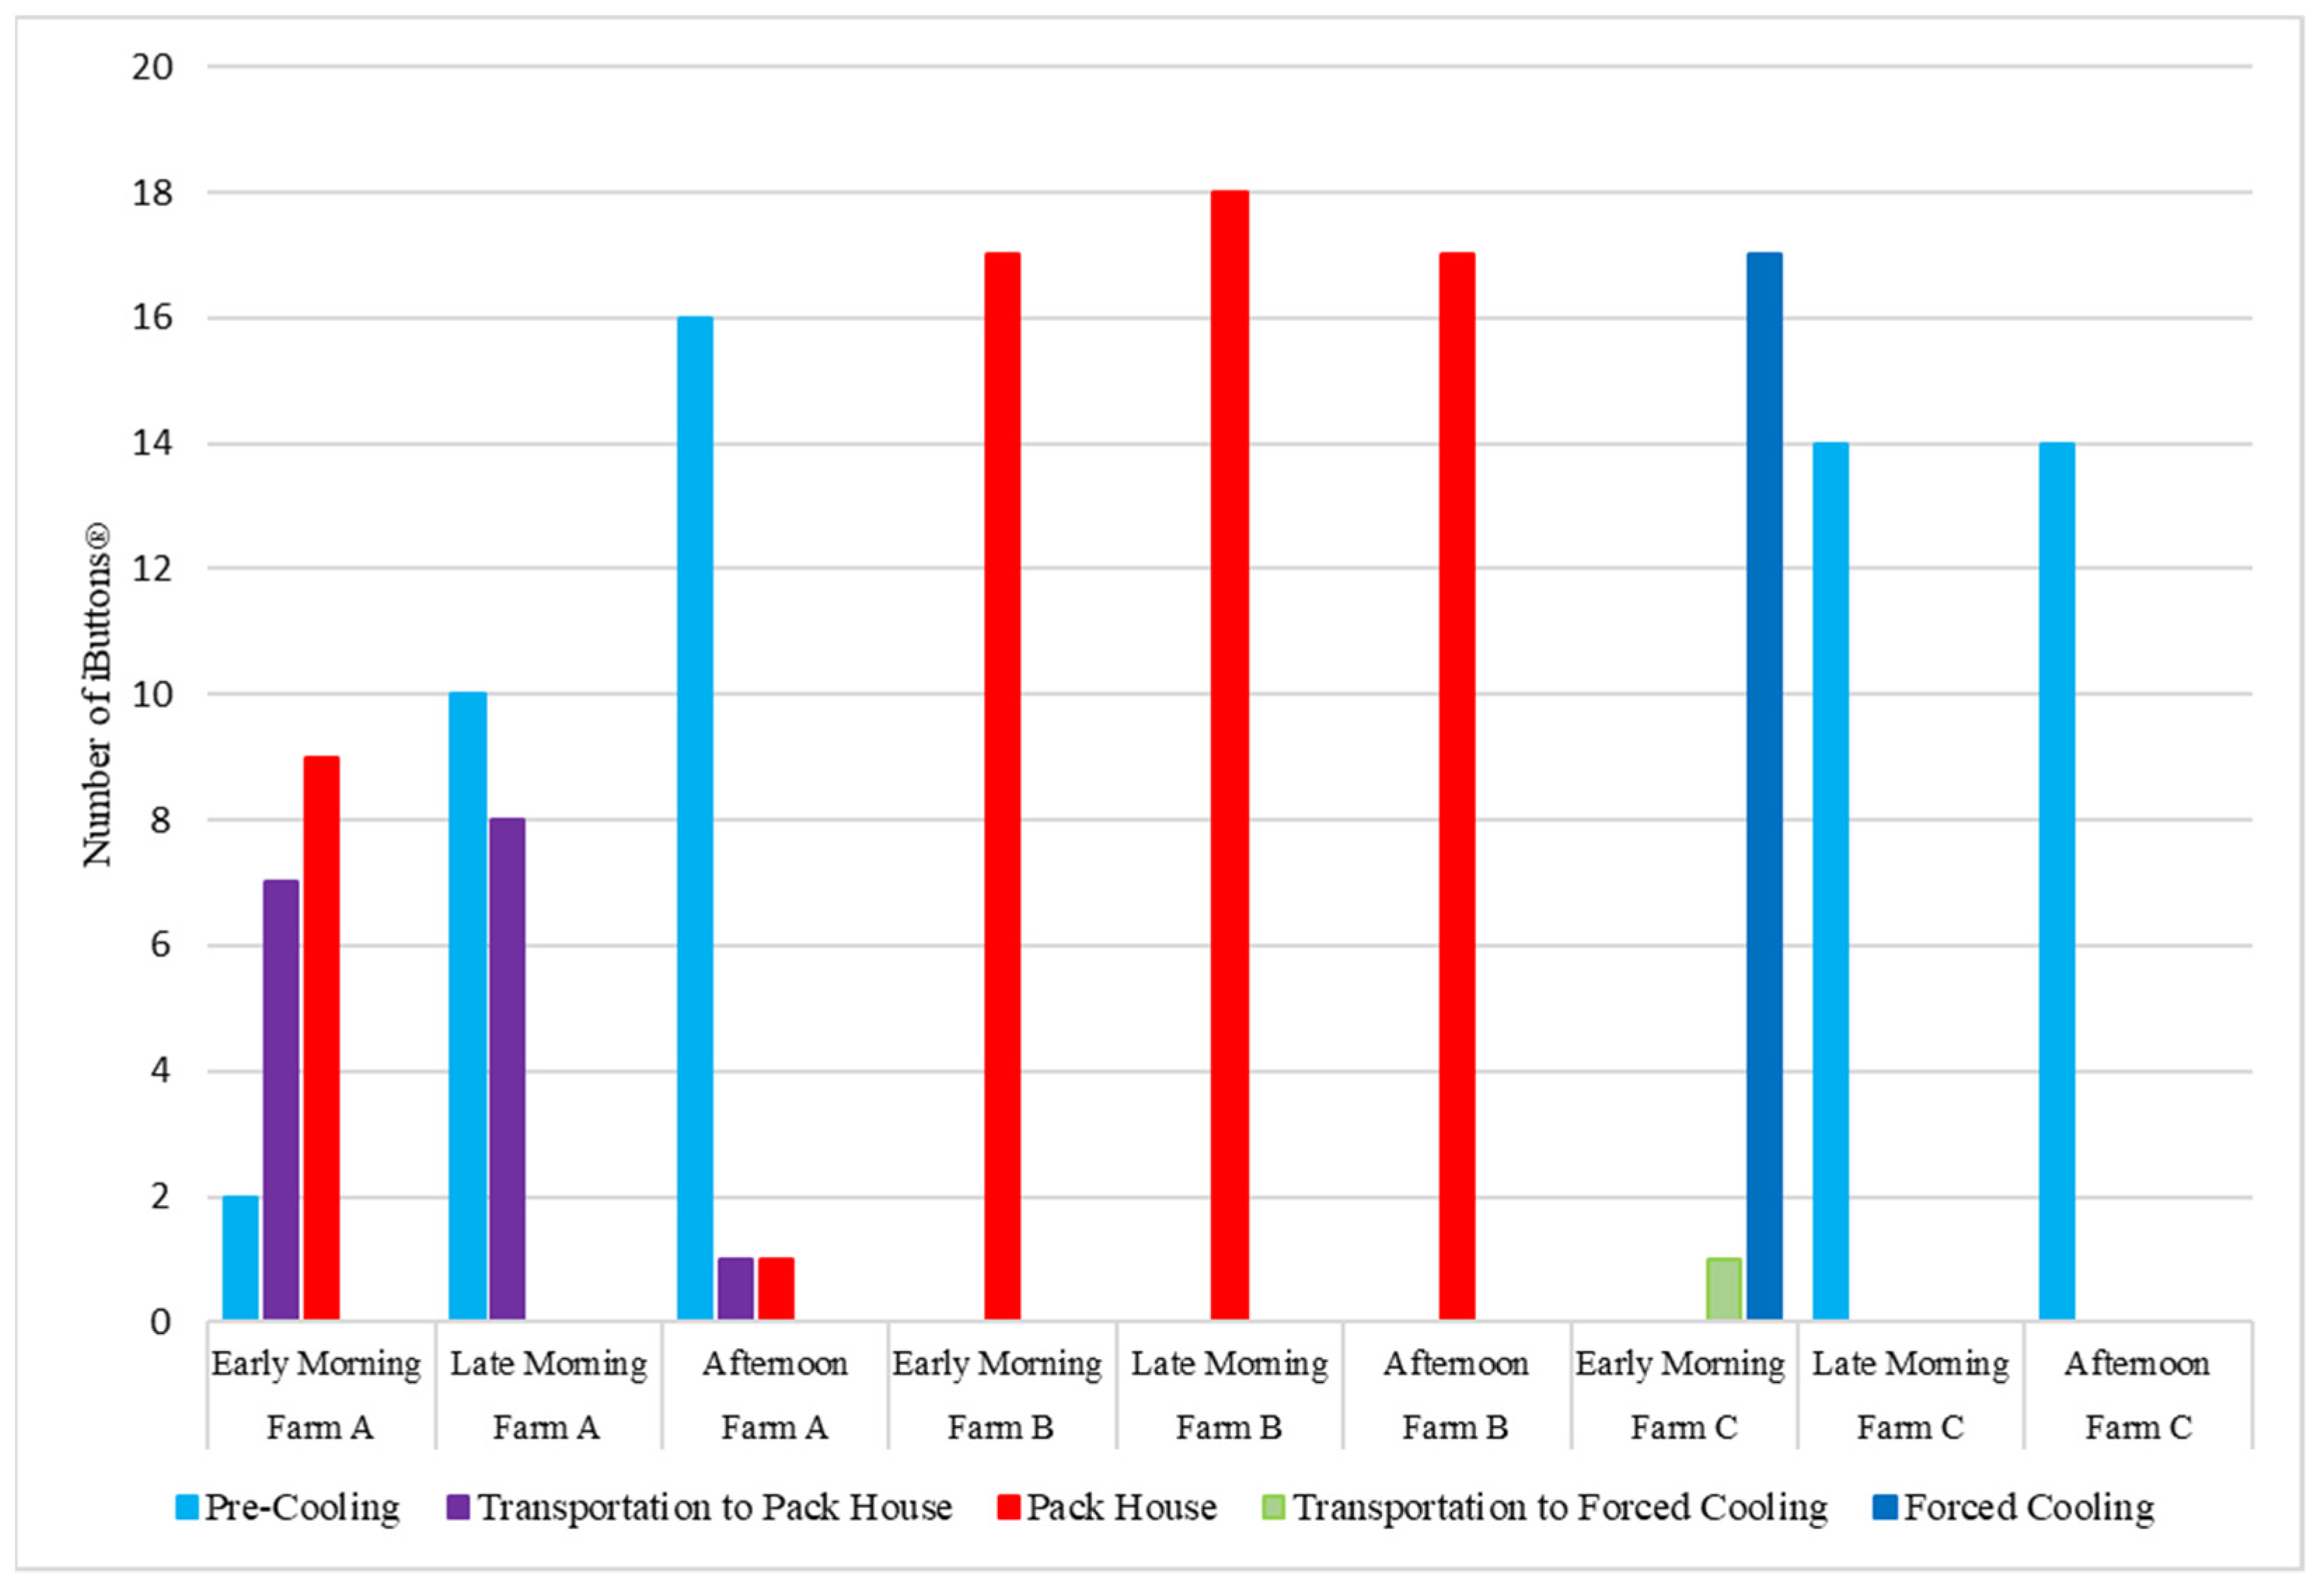
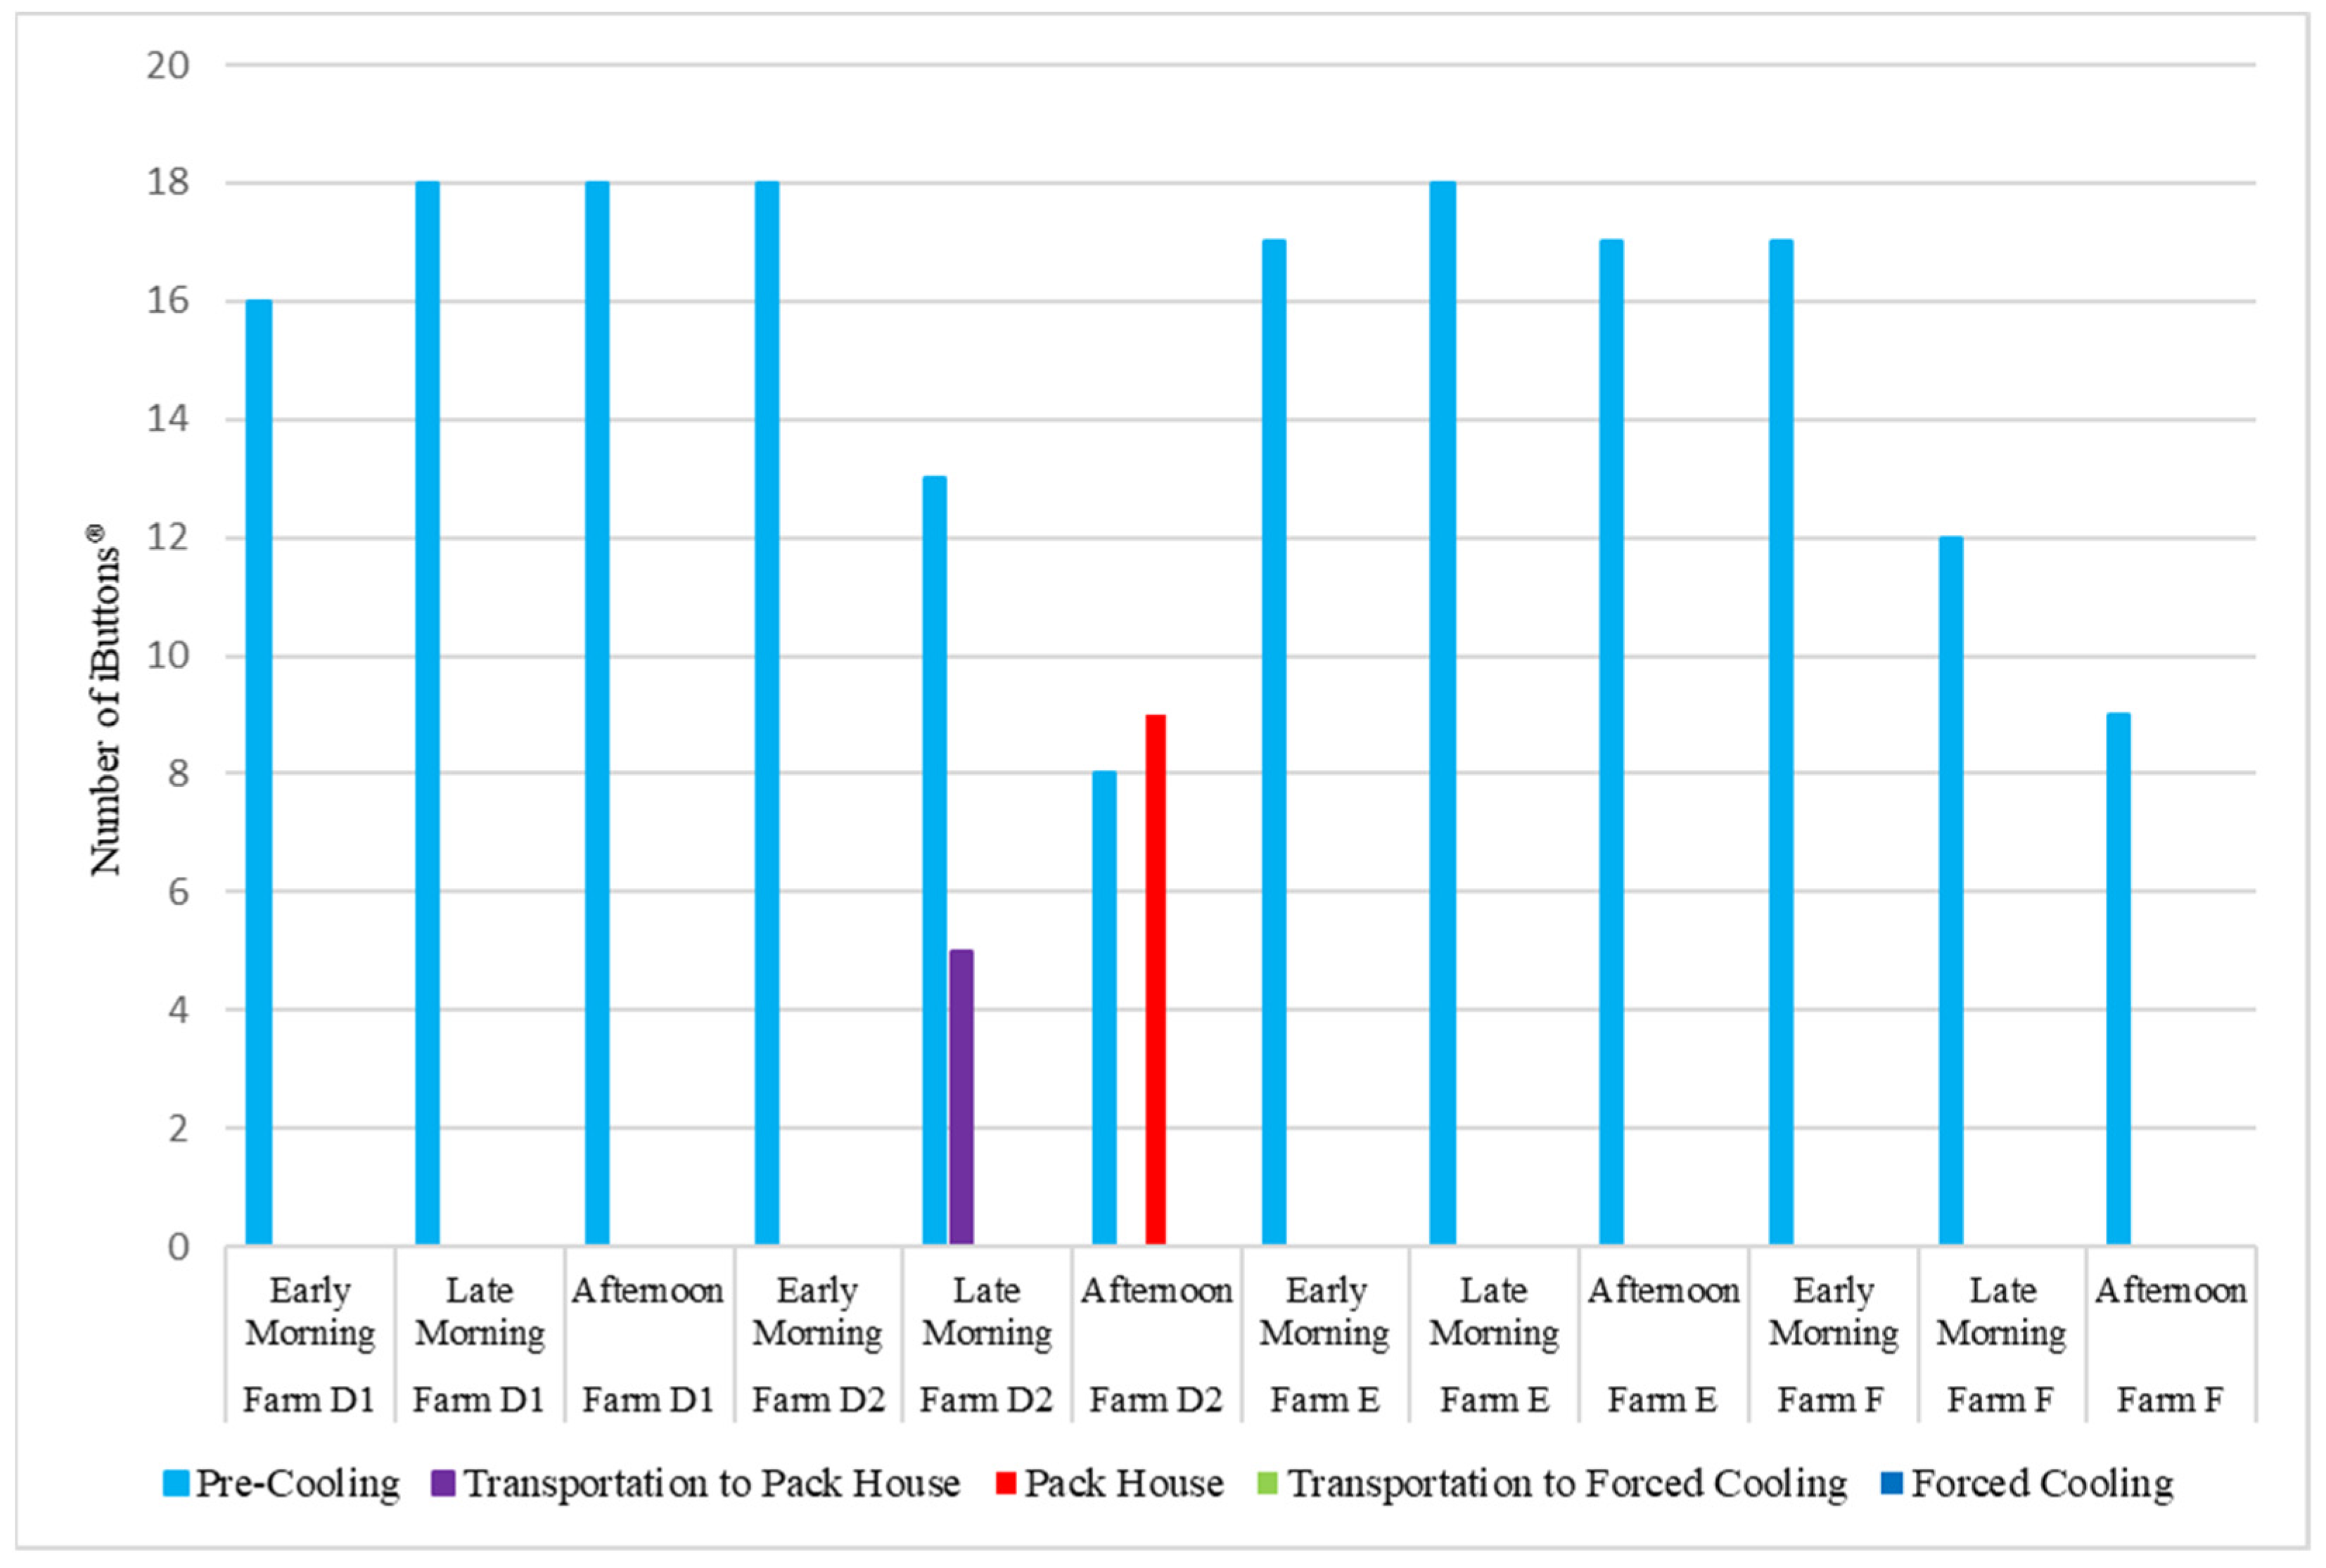
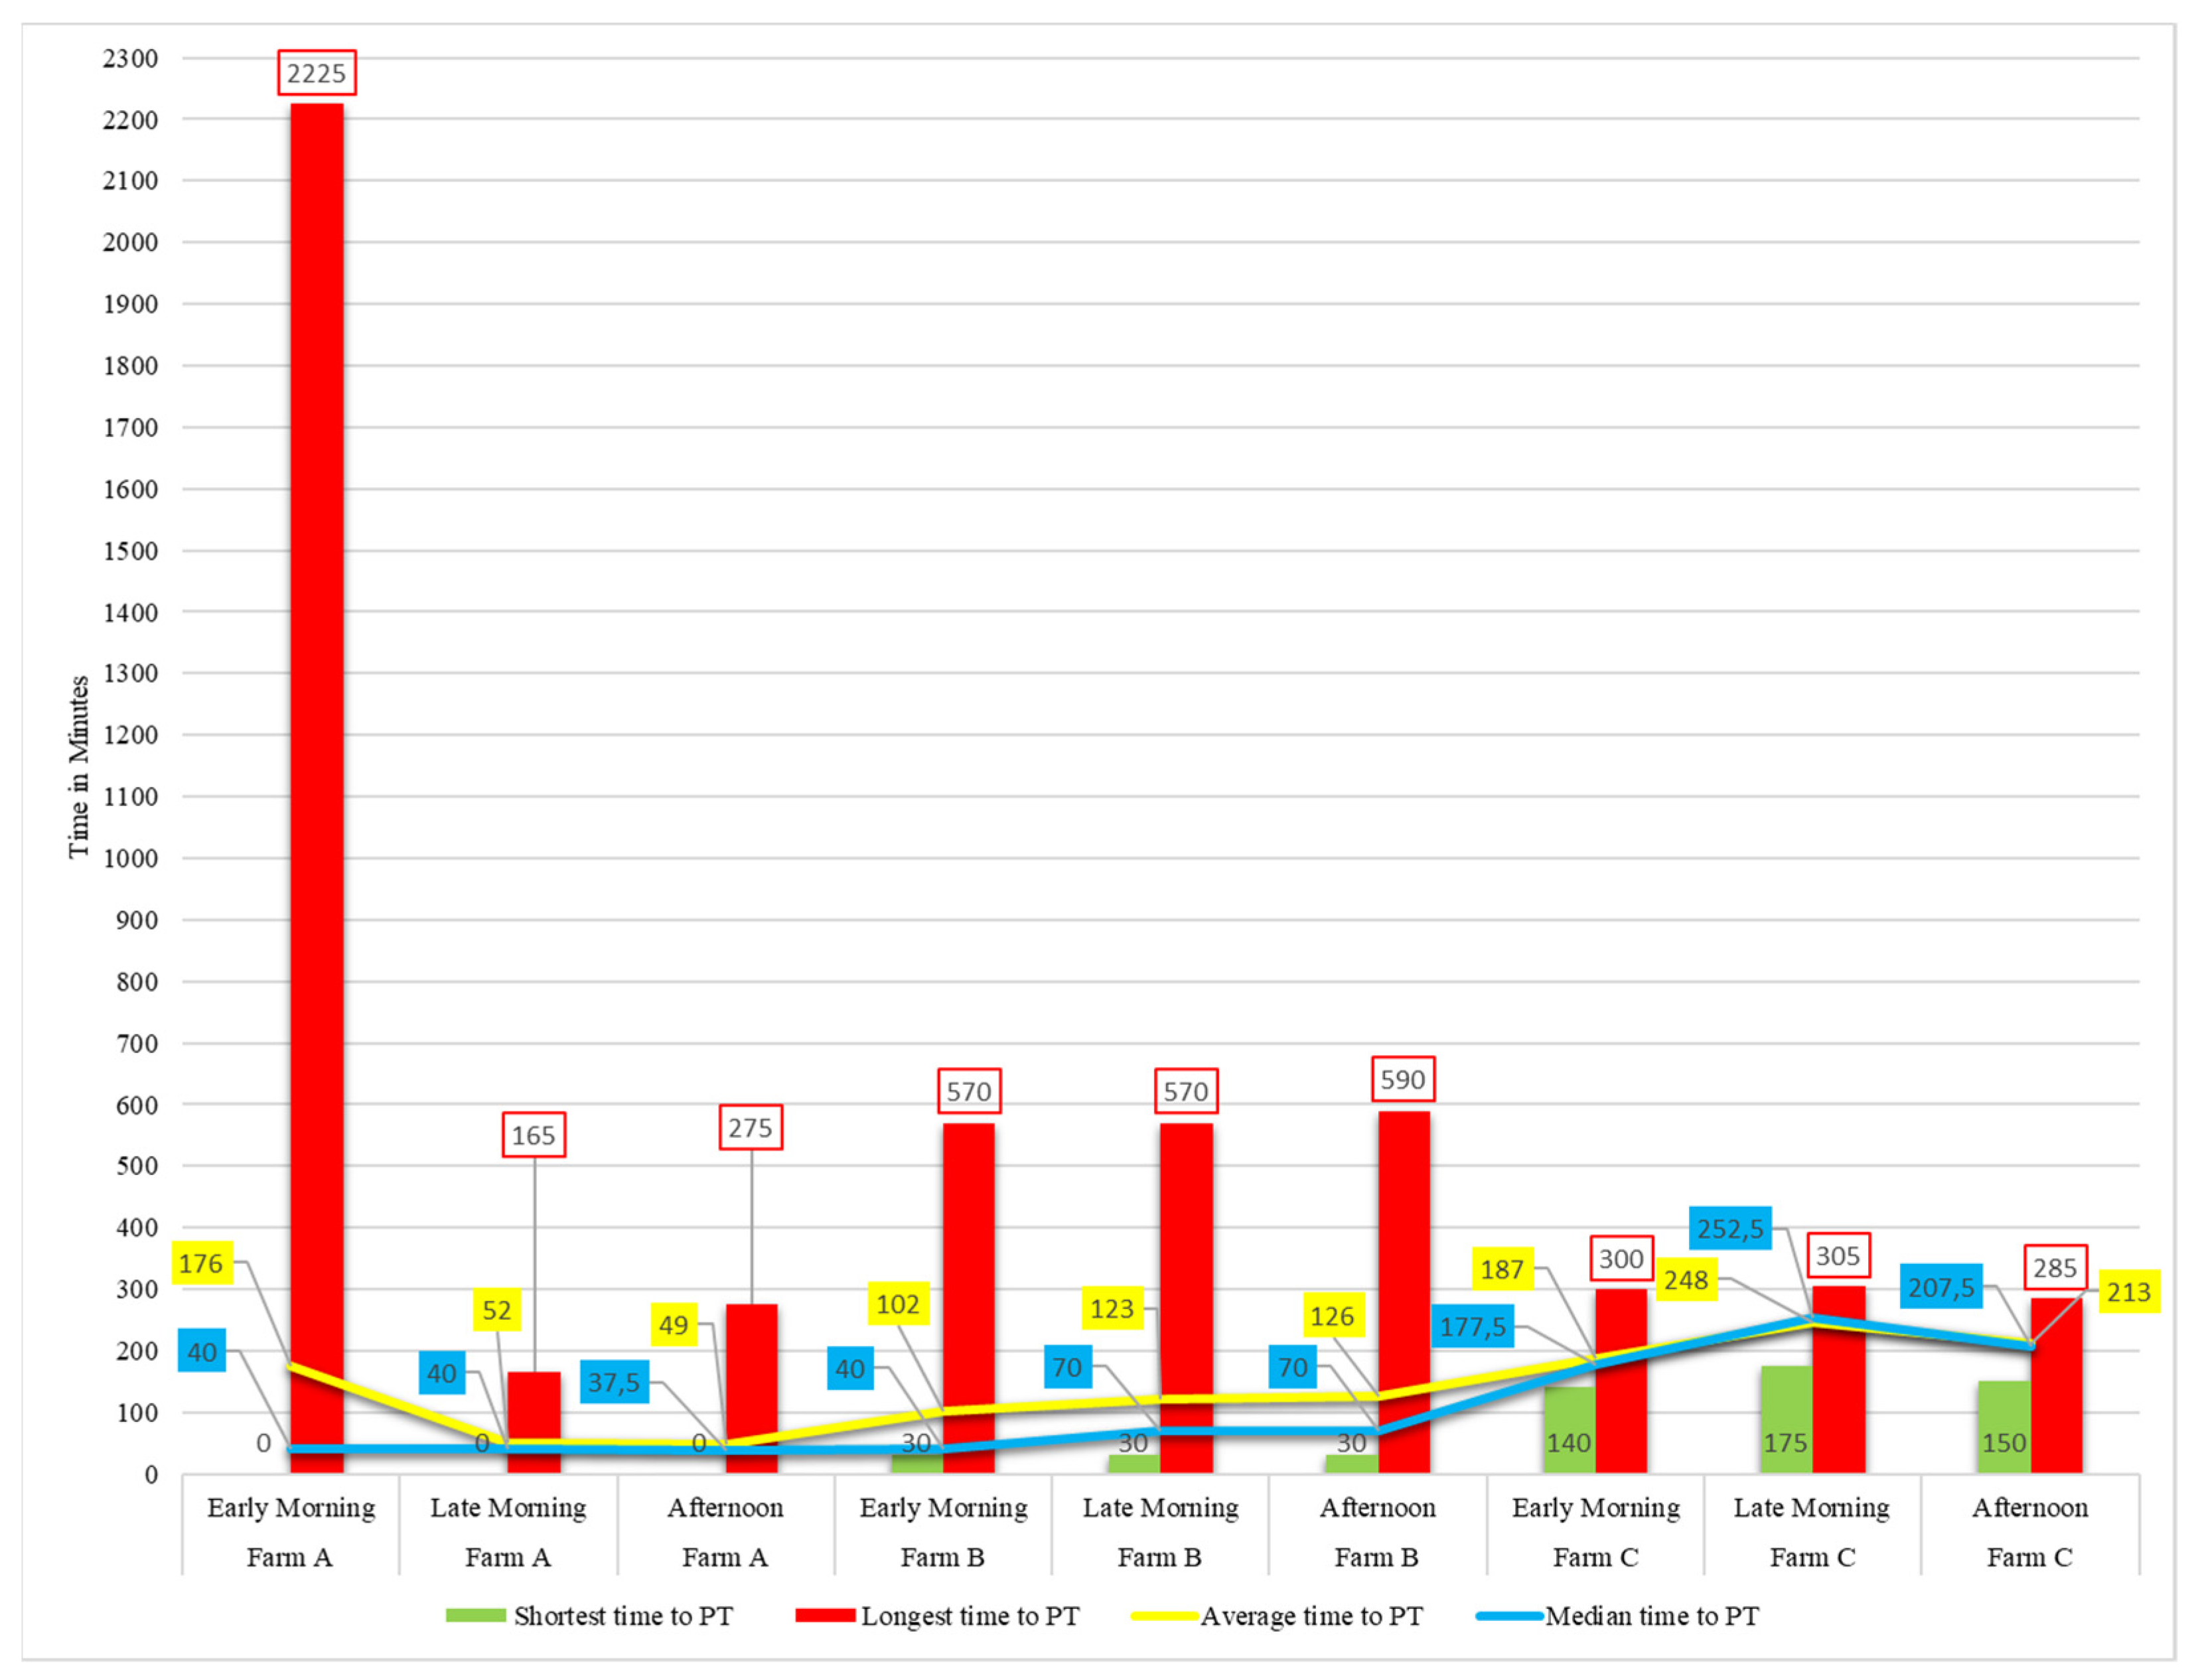
3.2. Time and Stage at Which Protocol Temperature Was Reached—Pre-Cooling

To remove the field heat, the blueberries should be cooled to the protocol temperature (PT) of 6 °C within 300 min (five hours) during the pre-cooling stage. Figure 6 and Figure 7 show the shortest, longest, average, and median times in minutes to reach the protocol temperature during each trial for farms in the Western Cape and Gauteng, respectively. None of the farms in the Western Cape managed to reach the protocol temperature within the required time, based on their average and median times, whereas in Gauteng, Farms E and F always managed to reach the protocol temperature within the required time.
Figure 8 and Figure 9 show the stage during which the protocol temperature was finally reached for farms in the Western Cape and Gauteng, respectively; ideally, this should be during the pre-cooling stage. On the Western Cape farms, the protocol temperature was not reached during the pre-cooling stage in many instances and often was only reached during the packhouse stage (for example, on Farm B). On Gauteng farms, the protocol temperature was always reached during pre-cooling, except during the two trials on Farm D.
Gauteng farms had three rooms at the precooling facility, namely a cold room where the pallets were built, a room where precooling was applied, and a holding room where the cooled pallets were kept until they could be transported to the packhouse. This setup enabled good cold chain management. The farms in the Western Cape did not have three separate rooms, resulting in temperature spikes and breaks.

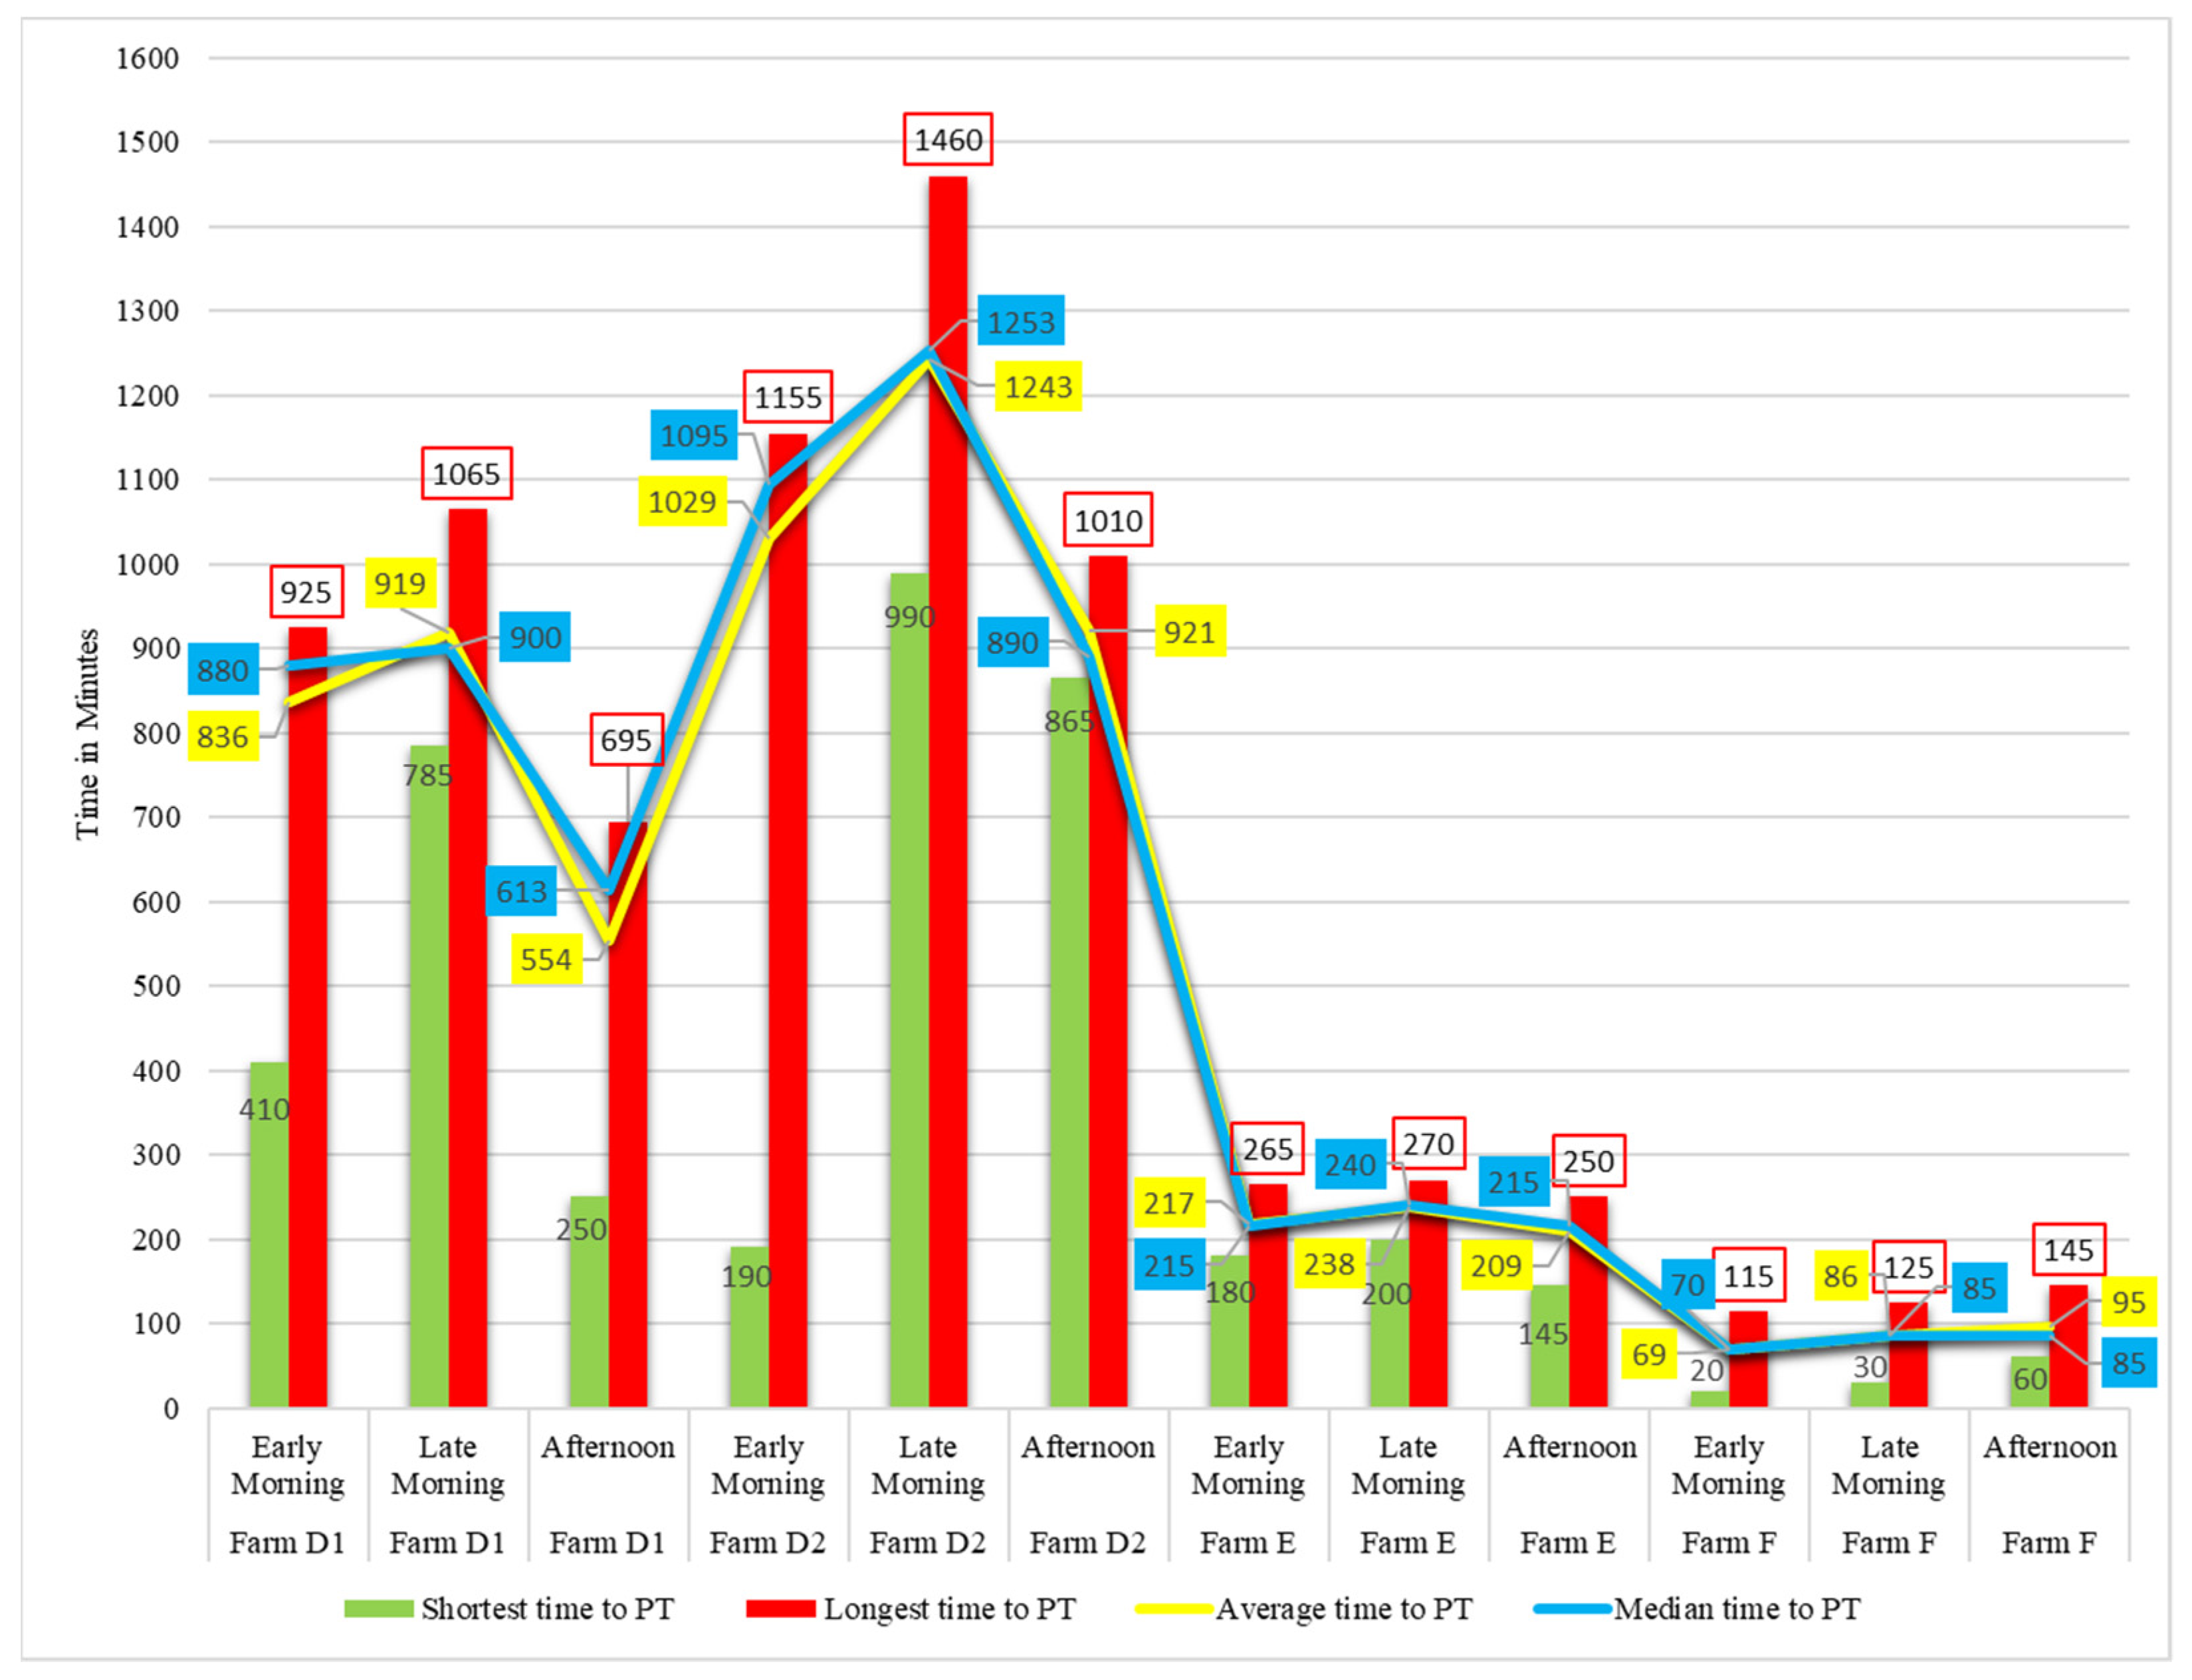
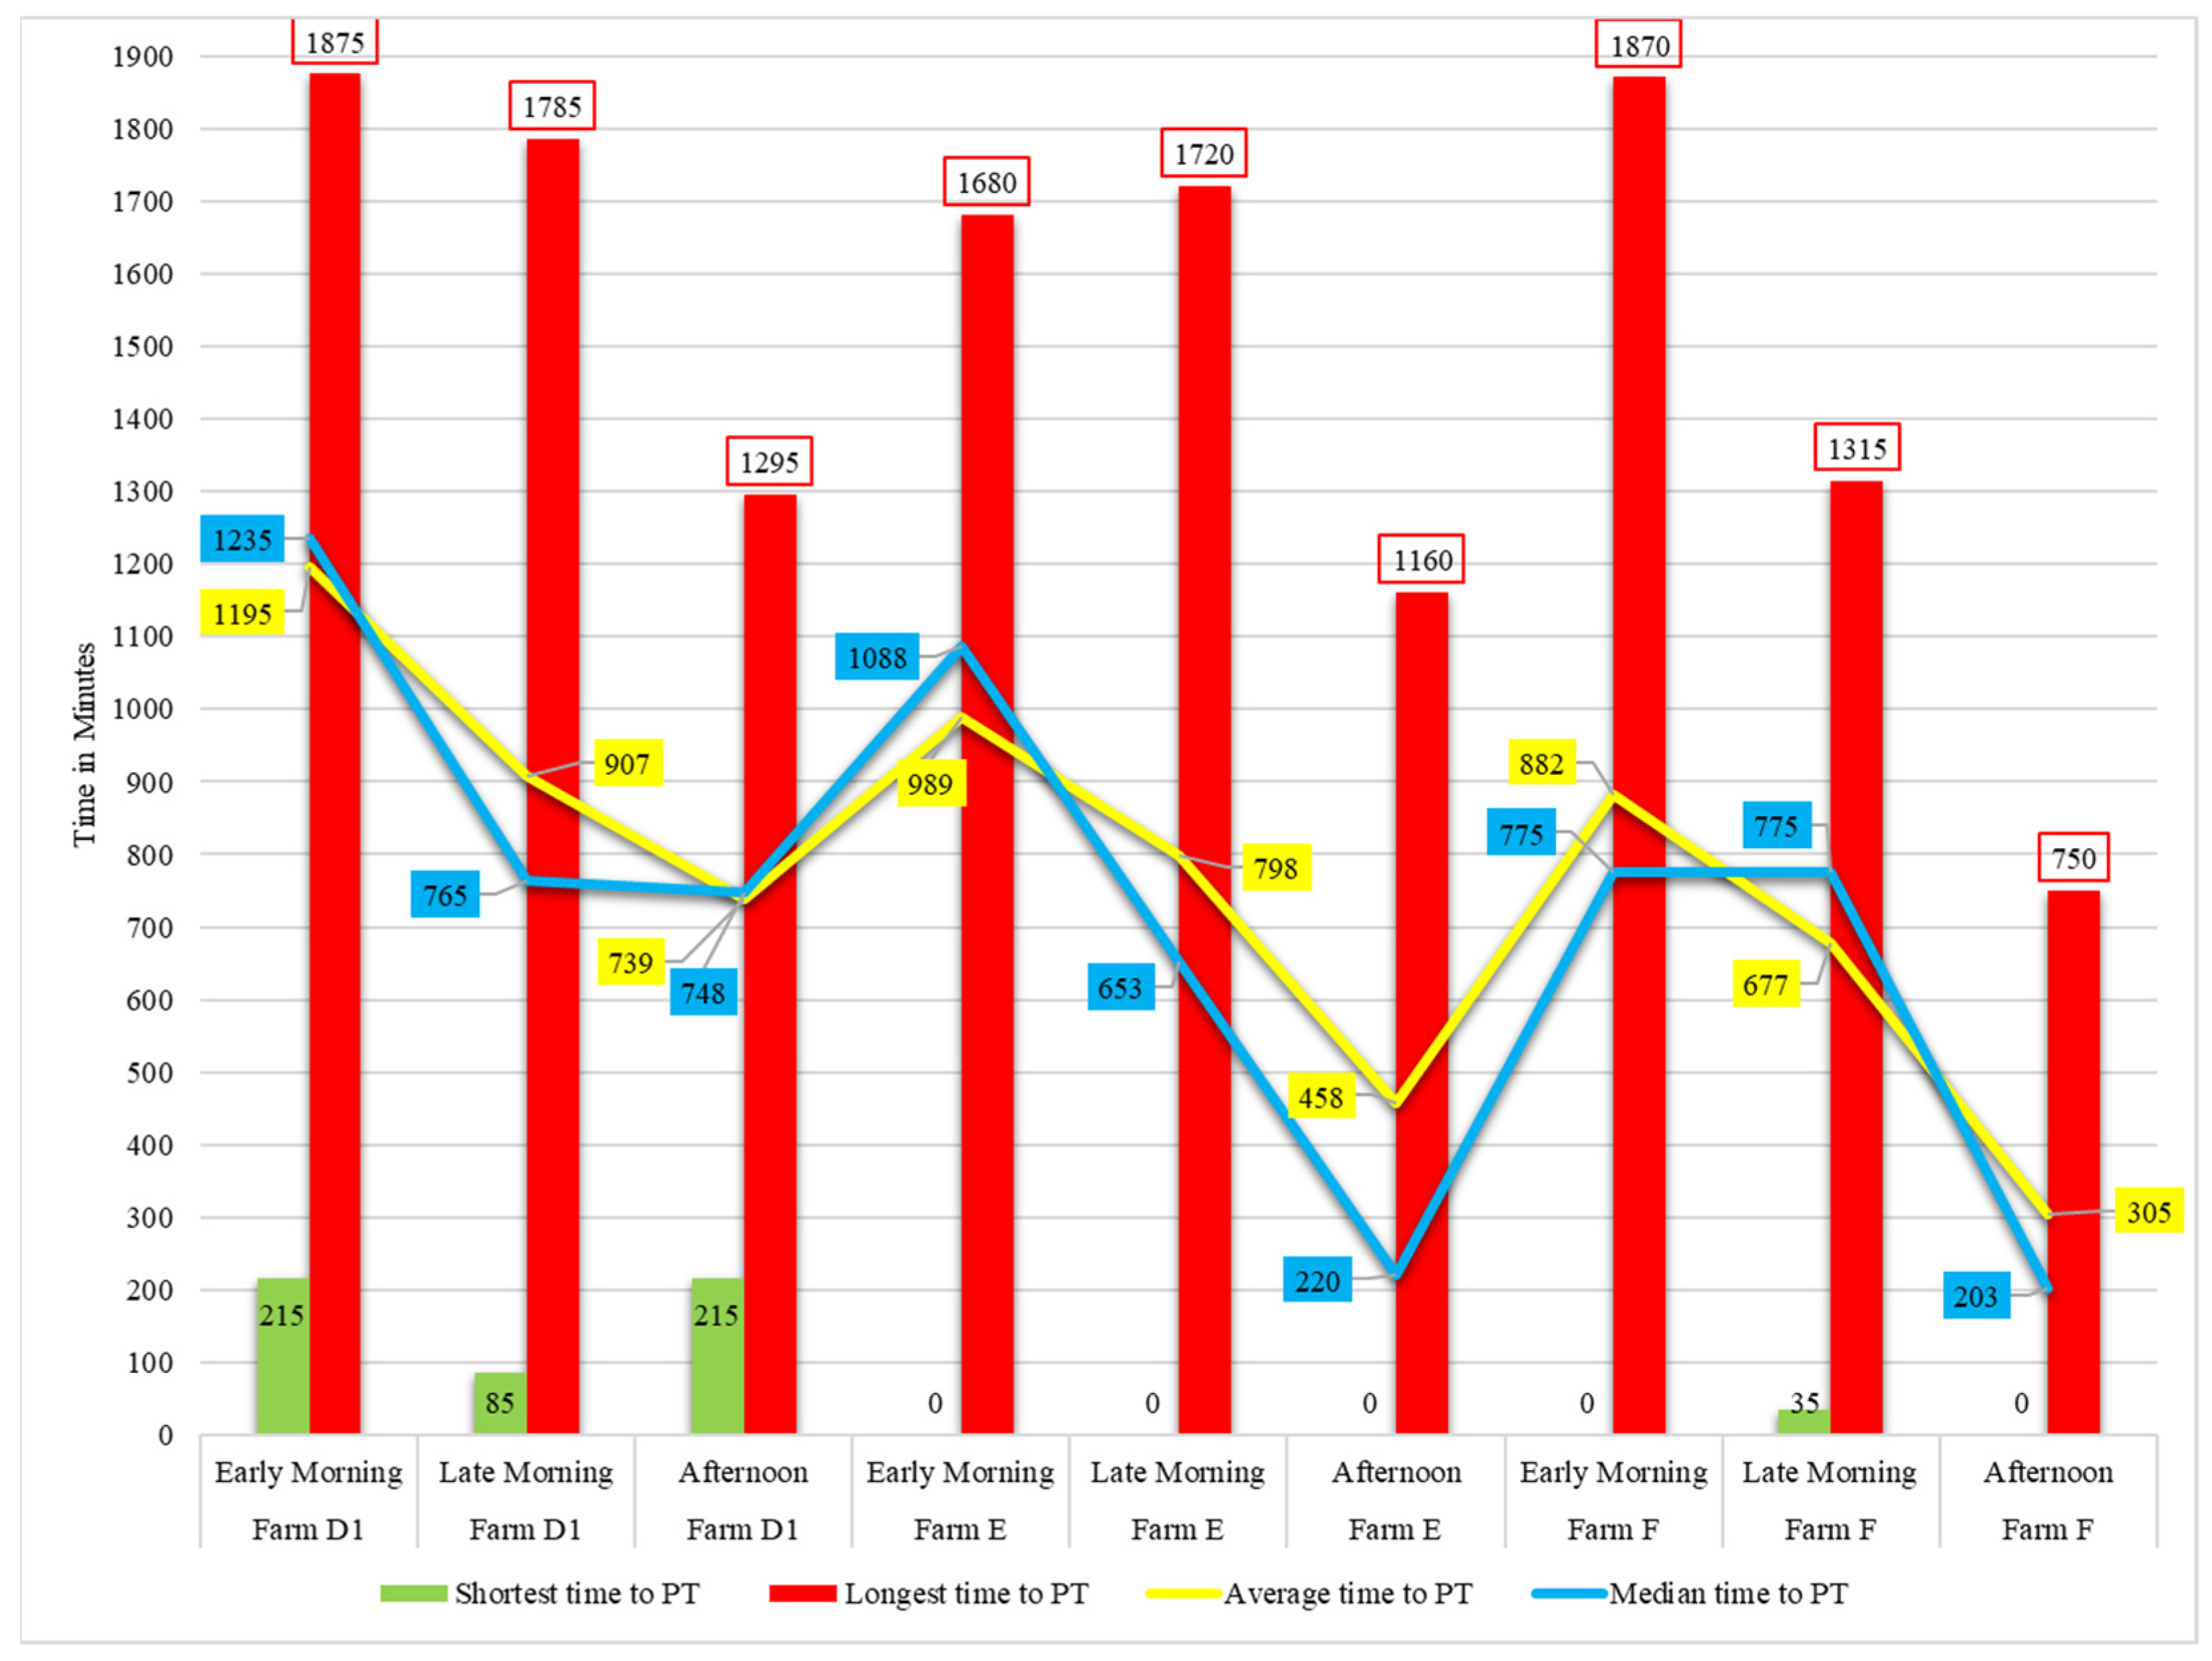
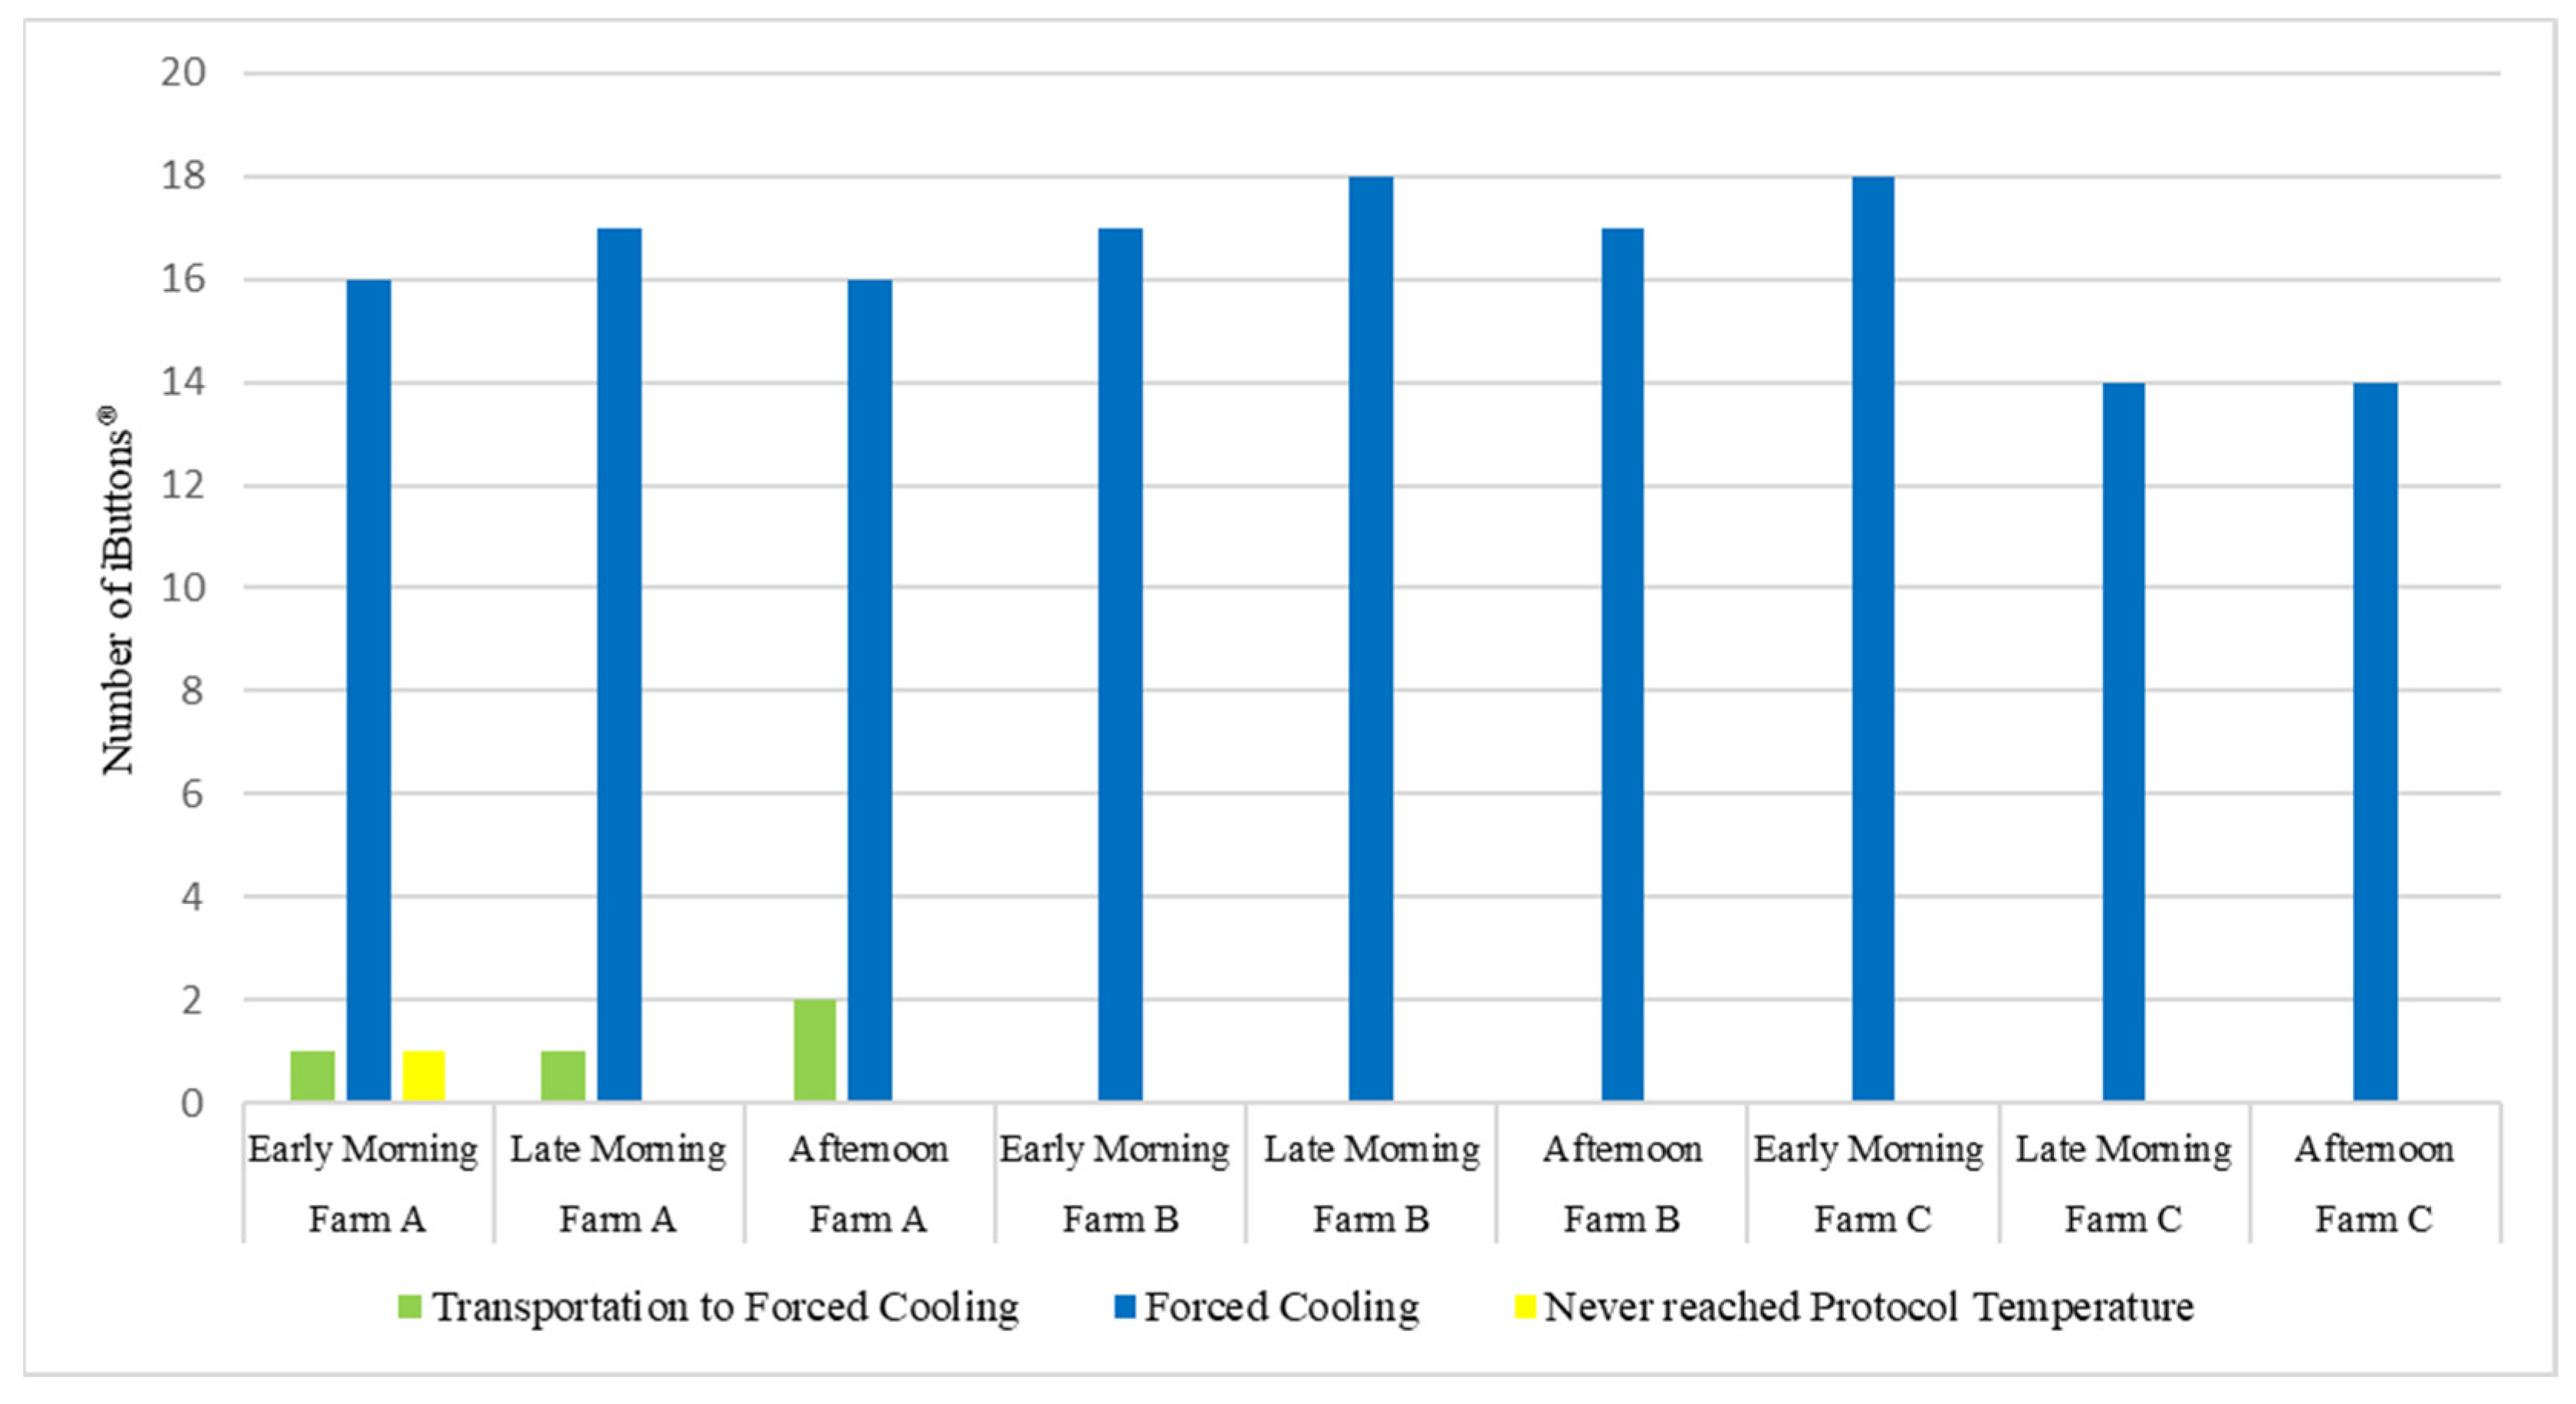
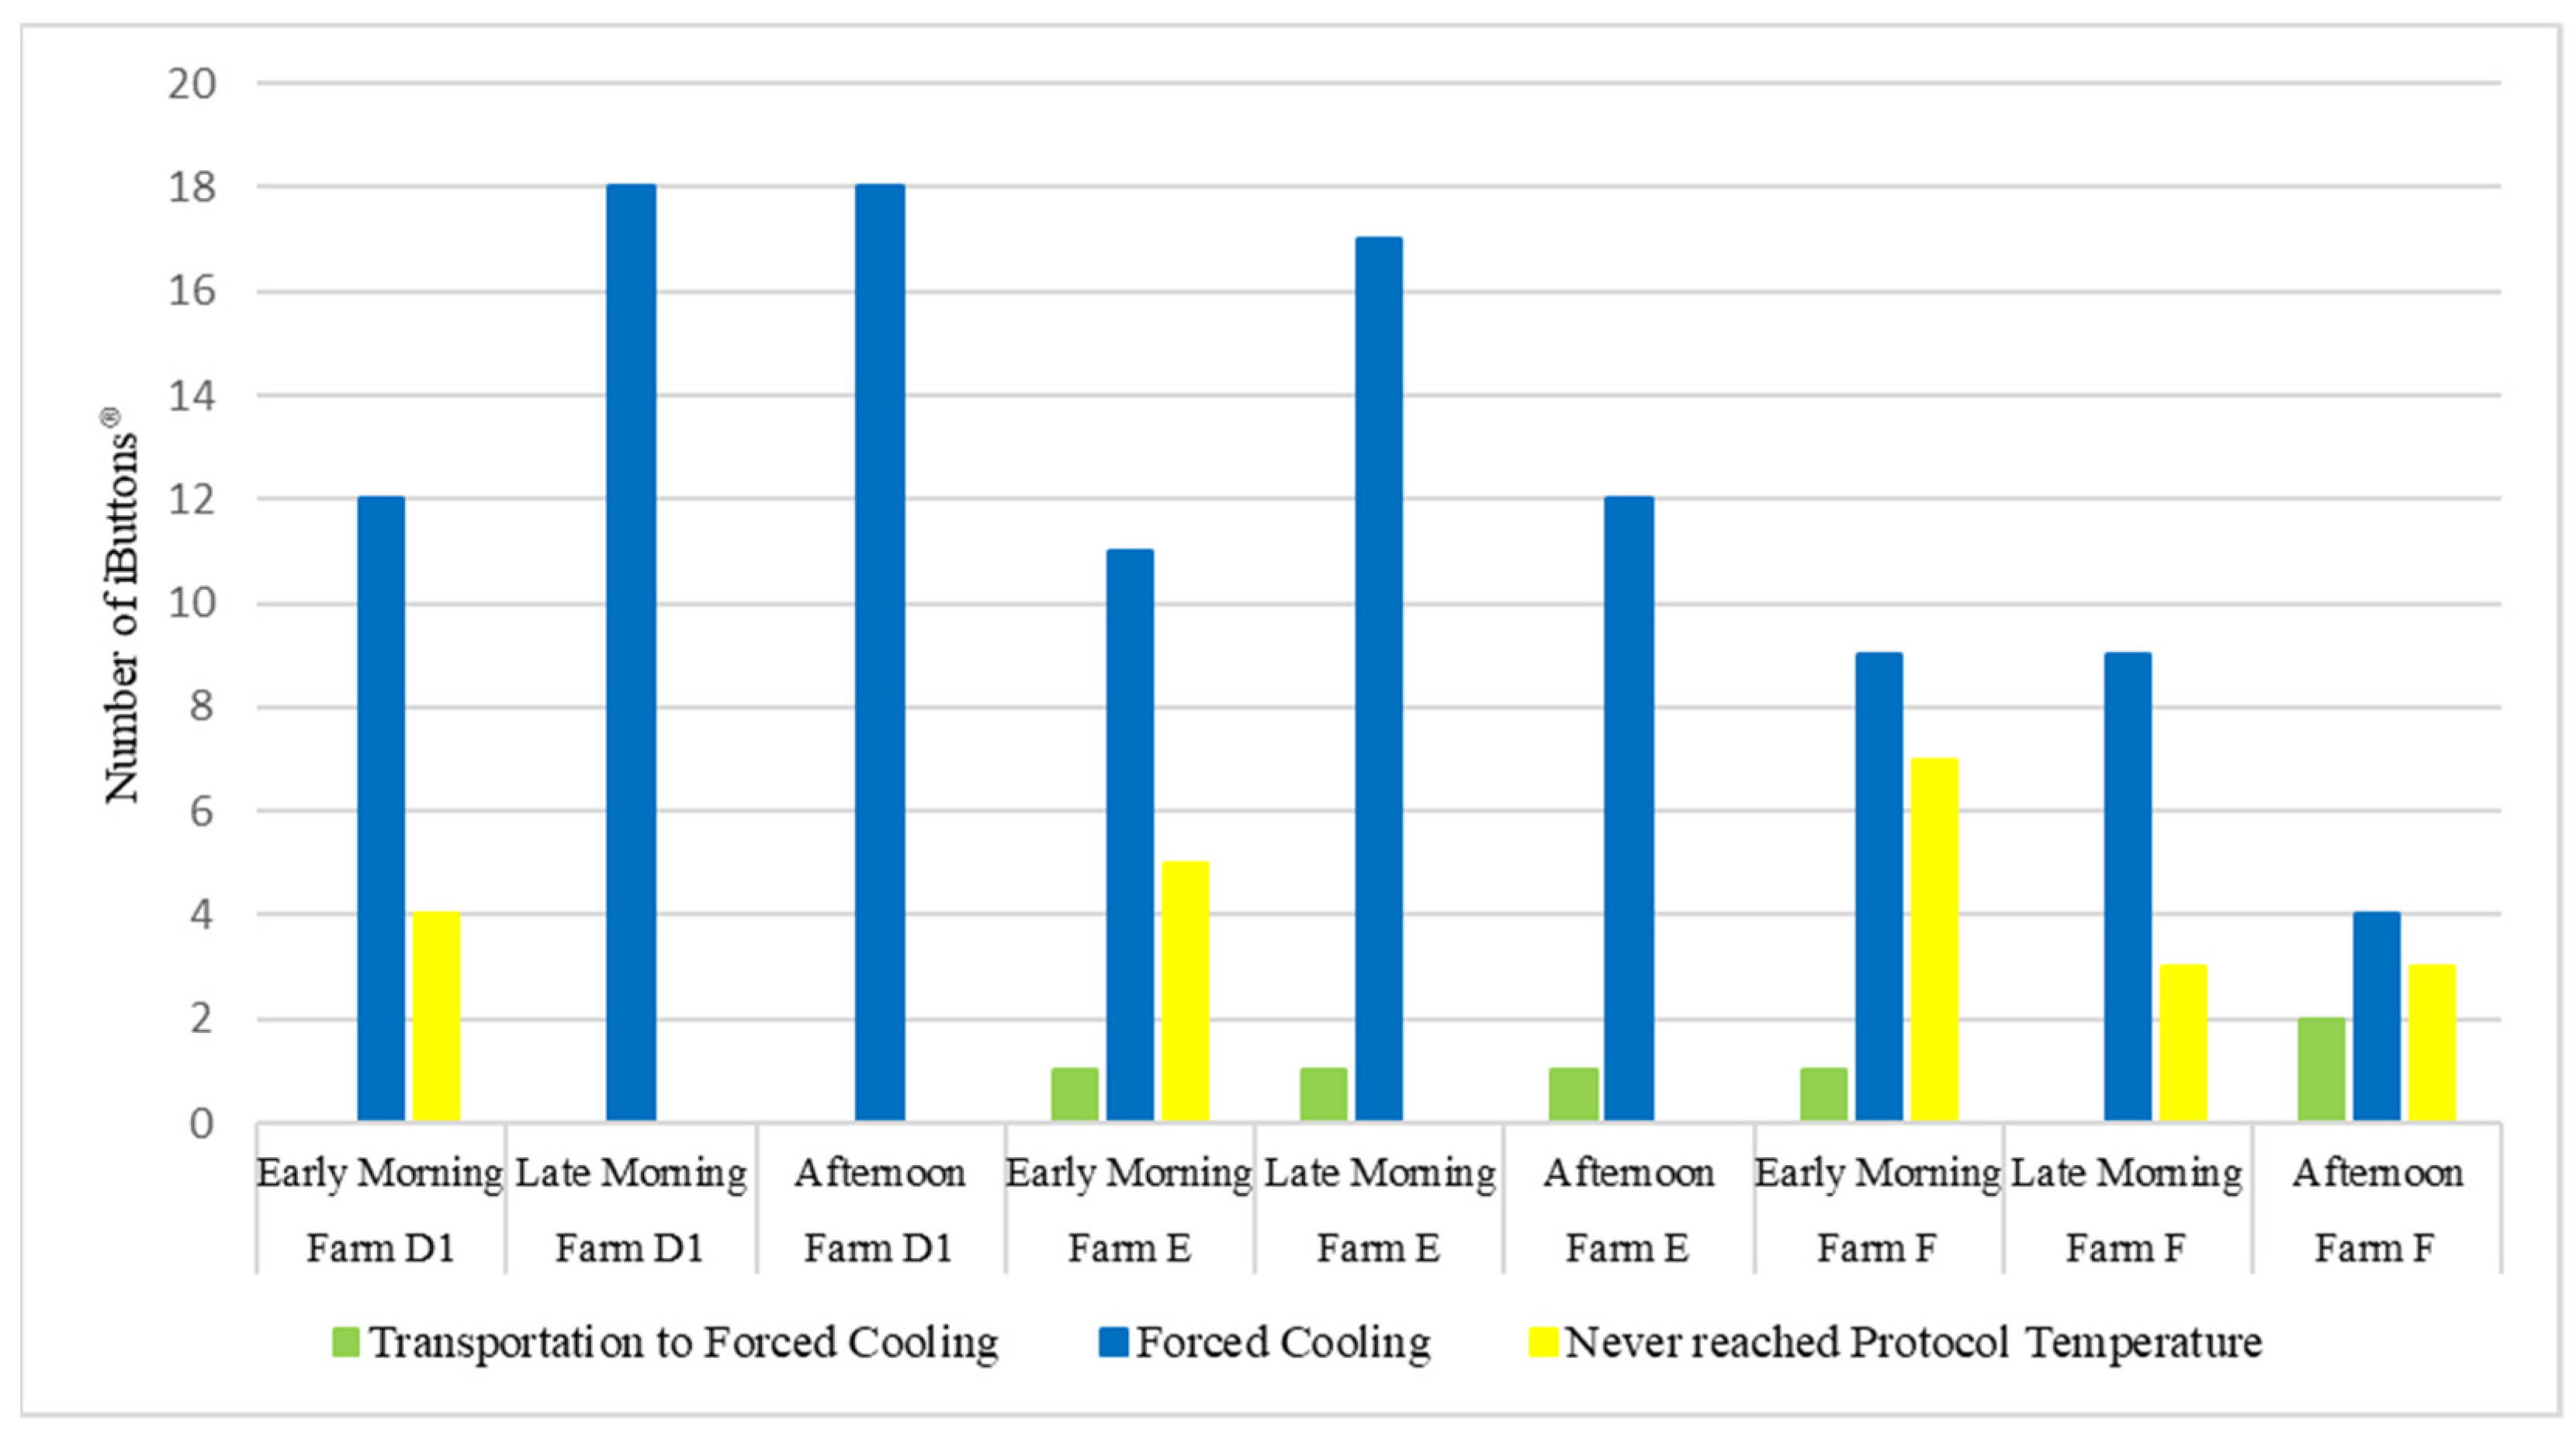
3.3. Time and Stage at which Protocol Temperature Was Reached—Forced Cooling

Blueberries should be cooled to the protocol temperature (PT) of 0 °C within 600 min (ten hours) during the forced-cooling stage. This slows down the respiration rate to preserve the fruit quality during the journey to the export market. Figure 10 and Figure 11 show the shortest, longest, average, and median times in minutes to reach the protocol temperature during each trial for farms in the Western Cape and Gauteng, respectively. Figure 11 does not include Farm D2, as these trials ended at the packhouse stage.
Figure 12 and Figure 13 show the stage during which the protocol temperature was finally reached for farms in the Western Cape and Gauteng, respectively; ideally, this should be during the forced-cooling stage.
All the trials on farms in the Western Cape reached the protocol temperature within the required time, except for the Early Morning trial on Farm A, where one iButton® never recorded 0 °C. On the Gauteng farms, the average and median times to reach the protocol temperature were within the required time for only two trials, namely Farm E Afternoon and Farm F Afternoon. Several iButtons® never reached the protocol temperature during the Early Morning trials on the Gauteng farms, as well as the Late Morning and Afternoon trials on Farm F.
Both in the Western Cape and Gauteng farms, more than 200 temperature spikes were recorded at each of the two forced cooling facilities, probably as a result of the defrosting cycles of the refrigeration equipment. In addition, more chilling injury spikes were recorded in the Western Cape facility, probably because the berries were cooled to approximately 0 °C instead of maintained at 6 °C in the cold room of the packhouse, before being transported to the forced cooling facility.
Table 5 demonstrates that none of the farms provided efficient and effective cooling during both the Pre-cooling and Forced Cooling stages for the trials conducted, which may result in quality issues being evident on the quality reports.

3.4. Logistical Processes Used and Protocols Not Followed

To improve the management of the initial stages of the blueberry cold chain, best practises were identified amongst the trials from the six farms, which can be used as benchmarks by Company X.
Best practices for the Harvest and Transportation stage were found on Farms D, E, and F. Amongst all the farm trials, the shortest time for this stage was on Farm D. Farm D covered the road with peach pips to reduce dust on the blueberries. Farm F used a refrigerated trailer in the field and for transport to the cold room. Farm E had the best cold room facilities and procedures.
Farm E should serve as the benchmark for the Pre-Cooling stage, as no temperature spikes or breaks were recorded there. In addition, the fruit pulp temperature of 6 °C was reached within the required time of 300 min (5 h) and during the pre-cooling stage. Therefore, all the protocols were adhered to.
The Gauteng leg of the Transportation to Packhouse stage was identified as the benchmark, as no temperature spikes or breaks were recorded there. This is likely owing to the airlock loading bays that reduce the occurrence of deviations from protocol temperature.
Far fewer temperature spikes and breaks were recorded during the Packhouse stage in the Western Cape than in Gauteng, as protocols were better adhered to in the Western Cape packhouse. However, temperatures could be controlled better and protocols adhered to more strictly. As Farm C used field packing, it skipped the packhouse stage and thereby significantly reduced the time spent during the beginning stages of the blueberry cold chain.
In the Western Cape, the packhouse is located next to the forced cooling facility so there is no Transportation to Forced Cooling stage, which is ideal and should therefore be the benchmark.
As the Forced Cooling stage in the Western Cape was the most efficient and effective, it was identified as the benchmark. However, the defrosting cycles in the Western Cape as well as the Gauteng facility need to be investigated as they caused numerous temperature spikes.

3.5. Quality Control Reports

Upon arrival at the overseas destination, pallets are graded according to a colour scaling system based on samples taken. Table 6 shows the four colours, namely green, amber, red, and black (reject), used to depict the condition of a pallet and a description of what each colour represents.
Fruit pulp temperatures were measured during the grading process. Minimum temperatures of 3.3 °C, 1.9 °C, and 2.3 °C and maximum temperatures of 3.8 °C, 4.2 °C, and 4.0 °C were recorded for pallets from Farm A, D, and E, respectively. As blueberries were cooled to 0 °C during the Forced Cooling stage, this implies that temperature spikes and breaks occurred during stages further down the cold chain.
The pallets from Farms A, D, and E were downgraded from “Green” to “Amber” because of the boxes being underweight. If these boxes had not been underweight, the pallets from Farms A, D, and E would have been classified as “Green”, since their total defects recorded were below 5%.
Both pallets from Farm C were graded as “Red Fail”. The fail defects for both pallets were because of underweight trays. Both pallets recorded total defects of more than 10%, which contributed to these pallets being classified as “Red”. The minor defects detected were linked to stalks being attached to the blueberries as well as shrivelled and soft blueberries. Furthermore, the major defects revealed were linked to mould being present on some blueberries and collapsed blueberries.
A pallet from Farm E logged total defects of 5.1%, which resulted in the grading of “Amber”. The minor defects detected for the pallet were due to stalks being attached to the blueberries and soft blueberries, while the major defects detected were linked to collapsed blueberries.
Both pallets from Farm F were graded as “Amber”. The reasons for downgrading the pallets from “Green” to “Amber” were linked to the boxes being underweight and the presence of isolated mould on the blueberries.
No quality control reports were received for the pallets associated with the trials conducted on Farm B.
A possible reason for cartons being underweight could be moisture loss. Moisture loss could result from insufficient cooling and temperature fluctuations in the beginning stages of the blueberry supply chain (see Table 1). In addition, relative humidity was not controlled, further contributing to moisture loss (Van Amerongen, 2021).

4. Conclusions

The results showed poor adherence to protocols and a large number of temperature and chilling injury spikes and breaks. The temperature spikes and breaks were mostly recorded during the harvesting and transportation, packhouse, and forced cooling stages, while the majority of the chilling injury spikes and breaks occurred during the forced cooling stage.
Additional infrastructure would be required to reduce the risk of temperature deviations from protocol. This includes more tractor-trailers to reduce the turnaround time between the field and cold room, gazebos for the QC tables, shaded areas for offloading at the cold room, forced-air pre-cooling systems, separate refrigerated rooms for building of pallets, pre-cooling and holding of pallets after pre-cooling, and loading bays with airlock systems. The defrosting cycles at the forced cooling facility should be reprogrammed to reduce the occurrence of temperature and chilling injury spikes and breaks.
It is also imperative that all employees and other actors in the blueberry cold chain be educated on the impact of temperature on the quality and shelf life of blueberries and the importance of proper cold chain management and the adherence to protocols.
The main limitation of the study was the available funding for purchasing temperature monitoring devices.

Author Contributions

Conceptualization, L.L.G.-G.; methodology, P.S. and L.L.G.-G.; validation, L.L.G.-G. and E.v.D.; formal analysis, P.S.; investigation, P.S.; writing—original draft preparation, P.S., L.L.G.-G. and E.v.D.; writing—review and editing, L.L.G.-G. and E.v.D.; visualization, P.S.; supervision, L.L.G.-G. All authors have read and agreed to the published version of the manuscript.

Funding

This research was funded by the Guangdong Science and Technology Planning Project (2021A0505030049), the Laboratory of Lingnan Modern Agriculture Project (NT2021004), the Guangdong Basic and Applied Basic Research Foundation (2020A1515110731), the Guangdong Provincial Special Fund for Modern Agriculture Industry Technology Innovation Teams, Department of Agriculture and Rural Affairs of Guangdong Province (2022KJ109), Key-Area Research and Development Program of Guangdong Province (2018B020202005) and the Earmarked Fund for CARS (CARS-31).

Data Availability Statement

Not applicable.

Acknowledgments

The authors would like to thank Company X for providing us with the opportunity to conduct the research. Furthermore, we would like to thank Farms A, B, C, D, E, and F for allowing us the opportunity to conduct trials on their premises.

Conflicts of Interest

The authors declare no conflict of interest.

References

  1. Fresh Produce Exporters’ Forum, General Information—FPEF South Africa. Available online: https://www.fpef.co.za/general-information/ (accessed on 17 November 2022).
  2. Dodgson, L. Blueberries: Can One Cup a Day Lead to a Healthier Heart. 2015. Available online: https://www.independent.co.uk/life-style/health-and-families/health-news/blueberries-can-one-cup-day-lead-healthier-heart-9968391.html (accessed on 17 November 2022).
  3. African News Agency. SA Blueberry Output Rises to 18,000 Tons. 2020. Available online: https://www.iol.co.za/business-report/economy/sa-blueberry-output-rises-to-18000-tons-47332591 (accessed on 17 November 2022).
  4. Botha, L. Farmers Losing Farms as Price of Blueberries Falls. Farmer’s Weekly. 2022. Available online: https://www.farmersweekly.co.za/agri-news/south-africa/farmers-losing-farms-as-price-of-blueberries-falls/ (accessed on 17 November 2022).
  5. Kitinoja, L. White Paper on the Use of Cold Chains for Reducing Food Losses in Developing Countries. 2013. Available online: http://www.postharvest.org/Cold_chains_PEF_White_Paper_13_03.pdf (accessed on 17 November 2022).
  6. Ndraha, N.; Hsiao, H.; Vlajic, J.; Yang, M.; Lin, H.V. Time-temperature abuse in the food cold chain: Review of issues, challenges, and recommendations. Food Control 2018, 89, 12–21. [Google Scholar] [CrossRef] [Green Version]
  7. Kitinoja, L.; AlHassan, H. Identification of appropriate postharvest technologies for small scale horticultural farmers and marketers in sub-Saharan Africa and South Asia—Part 1. Postharvest losses and quality assessments. Acta Hortic. 2012, 934, 31–40. [Google Scholar] [CrossRef] [Green Version]
  8. Ray, R.; Ravi, V. Post harvest spoilage of sweet potato in tropics and control measures. Crit. Rev. Food Sci. Nutr. 2005, 45, 623–644. [Google Scholar] [CrossRef] [PubMed]
  9. Ahmad, M.S.; Siddiqui, M.W. Factors affecting postharvest quality of fresh fruits. In Postharvest Quality Assurance of Fruits: Practical Approaches for Developing Countries; Springer: Berlin/Heidelberg, Germany, 2015; pp. 7–32. [Google Scholar]
  10. James, S.J.; James, C. The food cold-chain and climate change. Food Res. Int. 2010, 43, 1944–1956. [Google Scholar] [CrossRef]
  11. Mahajan, P.V.; Caleb, O.J.; Singh, Z.; Watkins, C.B.; Geyer, M. Postharvest treatments of fresh produce. Philos. Trans. R. Soc. A Math. Phys. Eng. Sci. 2014, 372, 20147. [Google Scholar] [CrossRef] [PubMed] [Green Version]
  12. Mercier, S.; Villeneuve, S.; Mondor, M.; Uysal, I. Time-Temperature Management Along the Food Cold Chain: A Review of Recent Developments. Compr. Rev. Food Sci. Food Saf. 2017, 16, 647–667. [Google Scholar] [CrossRef] [PubMed] [Green Version]
  13. Steynberg, D.P. A Temperature Profile of the Beginning Stages of a Blueberry Supply Chain. MCom Thesis, Stellenbosch University, Stellenbosch, South Africa, 2021. Available online: https://scholar.sun.ac.za/handle/10019.1/123978 (accessed on 17 November 2022).
  14. Greeff, M. Blueberry Growing in South Africa: An Introduction. 2003. Available online: http://www.orchman.com/BlueberrygrowinginSA.html (accessed on 17 November 2022).
  15. Eck, P.; Gough, R.E.; Hall, I.V.; Spiers, J.M. Blueberry Management. In Small Fruit Crop Management; Galetta, G.J., Himelrick, D.G., Eds.; Prentice Hall: Hoboken, NJ, USA, 1990; pp. 273–333. [Google Scholar]
  16. Cold Chain Specialist. Product Manager (West Cape, South Africa). Personal Communication, 21 May 2019. [Google Scholar]
  17. Kader, A.A.; Rolle, R.S. The Role of Post-Harvest Management in Assuring the Quality and Safety of Horticultural Produce. 2004. Available online: https://www.fao.org/3/y5431e/y5431e.pdf (accessed on 17 November 2022).
  18. Van Hoorn, A.T. Optimisation of Blueberry Postharvest Handling and Storage. MScAgric Thesis, Stellenbosch University, Stellenbosch, South Africa, 2004. [Google Scholar]
  19. PPECB. 2018. Available online: https://ppecb.com/wp-content/uploads/2018/05/Fresh-Food-Trade-SA-2018.pdf (accessed on 17 November 2022).
  20. Chu, W.; Gao, H.; Chen, H.; Fang, X.; Zheng, Y. Effects of cuticular wax on the postharvest quality of blueberry fruit. Food Chem. 2018, 239, 68–74. [Google Scholar] [CrossRef]
  21. Jedermann, R.; Nicometo, M.; Uysal, I.; Lang, W. Reducing food losses by intelligent food logistics. Philos. Trans. R. Soc. A Math. Phys. Eng. Sci. 2014, 372, 20130302. [Google Scholar] [CrossRef] [PubMed] [Green Version]
  22. Vigneault, C.; Thompson, J.; Wu, S.; Hui, K.P.C.; Leblanc, D.I. Transportation of fresh horticultural produce. Postharvest Technol. Hortic. Crops 2009, 2, 1–24. [Google Scholar]
  23. Freiboth, H.W.; Goedhals-Gerber, L.; Van Dyk, F.E.; Dodd, M.C. Investigating the temperature breaks in the summer fruit export cold chain: A case study. J. Transp. Supply Chain. Manag. 2013, 7, a99. [Google Scholar] [CrossRef] [Green Version]
  24. Thompson, J.F. ‘Storage systems’. In Postharvest Technology of Horticulture Crops, Agriculture and Natural Resources; Kader, A.A., Ed.; University of California: Los Angeles, CA, USA, 2002; pp. 113–128. [Google Scholar]
  25. Boyette, M.; Estes, E.; Mainland, C.M.; Cline, B. Forced-Air Cooling Packaged Blueberries. 1996. Available online: https://eurekamag.com/research/002/845/002845206.php (accessed on 17 November 2022).
  26. Jraisat, L.E.; Sawalha, I.C. Quality control and supply chain management: A contextual perspective and a case study. Supply Chain Manag. 2013, 18, 194–207. [Google Scholar] [CrossRef]
  27. Jevšnik, M.; Hlebec, V.; Raspor, P. Food safety knowledge and practices among food handlers in Slovenia. Food Control 2008, 19, 12. [Google Scholar] [CrossRef]
  28. Goedhals-Gerber, L.L.; Haasbroek, L.; Freiboth, H.; Van Dyk, F.E. An analysis of the influence of logistics activities on the export cold chain of temperature sensitive fruit through the Port of Cape Town. J. Transp. Supply Chain. Manag. 2015, 9, 201. [Google Scholar] [CrossRef]
  29. Goedhals-Gerber, L.L.; Khumalo, G. Identifying temperature breaks in the export cold chain of navel oranges: A Western Cape case. Food Control 2020, 110, 107013. [Google Scholar] [CrossRef]
  30. Goedhals-Gerber, L.L.; Fedeli, S.; Van Dyk, F.E. Identifying temperature breaks in pome fruit export cold chains from South Africa to the Netherlands: A Western Cape case. J. Transp. Supply Chain. Manag. 2021, 15, 11. [Google Scholar] [CrossRef]
  31. Van Amerongen. Blueberry Storage. 2021. Available online: https://www.van-amerongen.com/en/blueberry-storage (accessed on 30 November 2022).
Figure 1. Overview of the main steps in a typical cold chain. Source: adapted from [12].
Horticulturae 08 01191 g001
Figure 2. Blueberry Export Cold Supply Chain. Source: [13].
Horticulturae 08 01191 g002
Figure 3. iButtons® in one-litre buckets during harvesting and in crates at QC station. Source: [13].
Horticulturae 08 01191 g003
Figure 4. iButtons® placed in cartons during building of pallets at the packhouse. Source: [13].
Horticulturae 08 01191 g004
Figure 5. iButtons® in lugs during harvest, iButtons® in trays at QC tables, and a completed pallet. Source: [13].
Horticulturae 08 01191 g005
Figure 6. Time in minutes to reach PT = 6 °C on Western Cape farms. Source: [13].
Horticulturae 08 01191 g006
Figure 7. Time in minutes to reach PT = 6 °C on Gauteng farms. Source: [13].
Horticulturae 08 01191 g007
Figure 8. Stage during which PT = 6 °C was reached on Western Cape farms. Source: [13].
Horticulturae 08 01191 g008
Figure 9. Stage during which PT = 6 °C was reached on Gauteng farms. Source: [13].
Horticulturae 08 01191 g009
Figure 10. Time in minutes to reach PT = 0 °C on Western Cape farms. Source: [13].
Horticulturae 08 01191 g010
Figure 11. Time in minutes to reach PT = 0 °C on Gauteng farms. Source: [13].
Horticulturae 08 01191 g011
Figure 12. Stage during which PT = 0 °C was reached on Western Cape farms. Source: [13].
Horticulturae 08 01191 g012
Figure 13. Stage during which PT = 0 °C was reached on Gauteng farms. Source: [13].
Horticulturae 08 01191 g013
Table 1. Benefits that cooling provides to perishable products.
Reduces respiration—lessens perishability
Reduces transpiration—lessens moisture loss and shrivelling
Reduces ethylene production—slows ripening
Increases resistance to ethylene action
Decreases activity and growth of micro-organisms
Reduces browning and loss of texture, flavour, and nutrients
Delays ripening and natural senescence
Source: Adapted from [5,10].
Table 2. Number of iButtons® retrieved with usable data for each trial conducted on the farms.
No. of iButtons®Farm AFarm BFarm CFarm D1Farm D2Farm EFarm F
Early Morning18171816181717
Late Morning18181418181812
Afternoon1817141817179
Totals54524652535238
Source: [13].
Table 3. Number of temperature and chilling injury spikes and breaks recorded per farm.
Farm AFarm BFarm CFarm D1Farm D2Farm EFarm F
Temperature spikes50162481264413078
Temperature breaks437745177359
Chilling injury spikes3200250000
Chilling injury breaks40212000
Source: [13].
Table 4. Number of temperature and chilling injury spikes and breaks recorded per stage.
Temperature SpikesTemperature BreaksChilling Injury SpikesChilling Injury Breaks
Harvest and transportation479200
Pre-cooling21100
Transportation to packhouse5400
Packhouse12391172
Transportation to forced cooling42200
Forced cooling4194232825
Totals 63824234527
Source: [13].
Table 5. Farm scores for effectiveness and efficiency of pre-cooling and forced cooling.
FarmABCDEF
Pre-Cooling (Rating out of 3)ZZ--X, Y, ZX, Y
Forced Cooling (Rating out of 3)XX, YX, Y---
Total score2/63/62/60/63/62/6
Where:
X = All trials for the farm reached the protocol temperature within the protocol time provided
Y = All trials for the farm reached the protocol temperature during the required protocol stage
Z = Not a single temperature spike, temperature break, chilling injury spike, or chilling injury break was recorded during the stage
X, Y and Z are equivalent to 1 point each
Source: [13].
Table 6. The four colour categories used to grade the final QC outcome of a pallet.
ColourDescription of colour scale
GREEN
  • Each parameter is within specification and total defects are below 5%.
  • Minimal sorting will be required to meet customer specifications.
AMBER
  • One or more of the set parameters are out of specification and/or total defects found are between 5% and 10%.
  • Sorting will be required to meet customer specifications; depending on the severity of/or the defect(s) found, the pallet may be downgraded to be sold locally.
RED
  • Total defects found are above 10% per sample.
  • A second QC is to be conducted before finalizing the QC report.
  • Sorting will be required to meet customer specifications; depending on the severity of/or the defect(s) found, the pallet may be downgraded to be sold locally.
REJECT
  • Fruit will be rejected and may be sent for freezing or dumped, depending on the severity of other defects.
Source: [13].
Publisher’s Note: MDPI stays neutral with regard to jurisdictional claims in published maps and institutional affiliations.

