Article

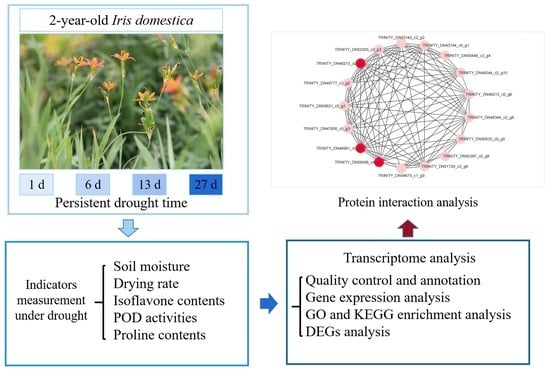
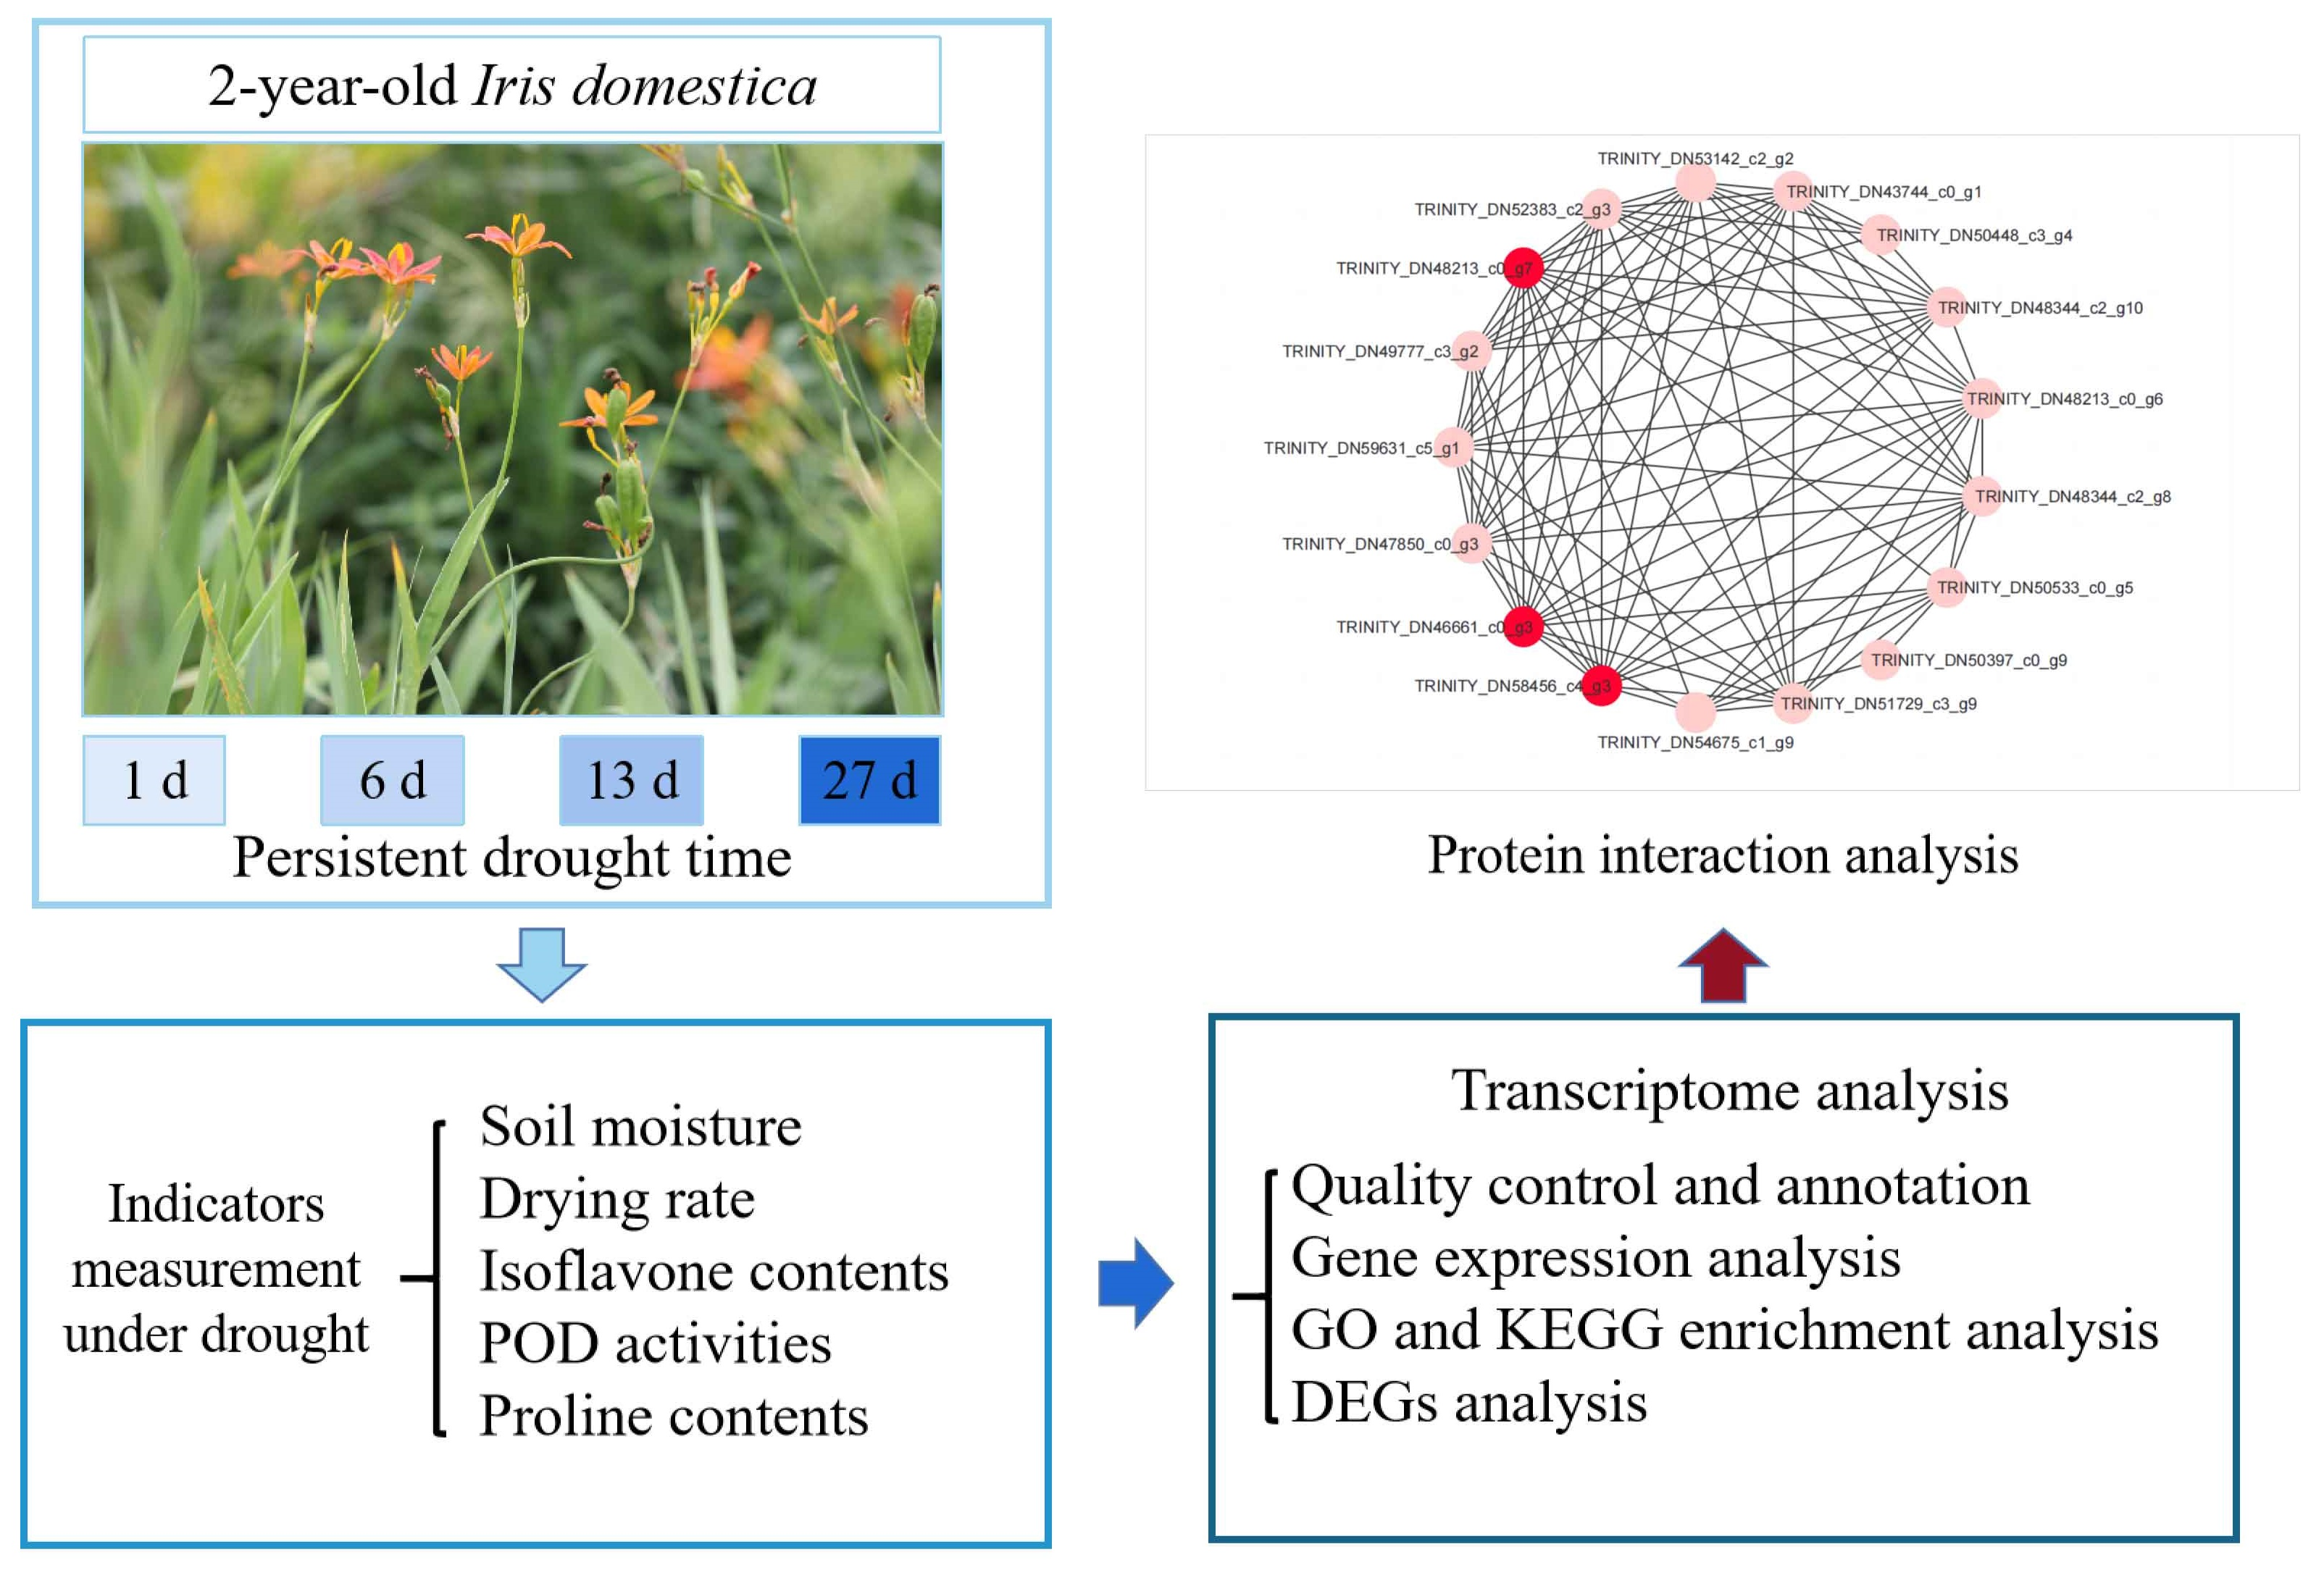
Root Physiological Changes and Transcription Analysis of Iris domestica in Response to Persistent Drought

Cultivation Base of State Key Laboratory for Ecological Restoration and Ecosystem Management of Jilin Province and Ministry of Science and Technology, Chinese Medicinal Materials, Jilin Agricultural University, Changchun 130118, China
*
Authors to whom correspondence should be addressed.
Horticulturae 2022, 8(12), 1162; https://doi.org/10.3390/horticulturae8121162
Submission received: 12 October 2022 / Revised: 7 November 2022 / Accepted: 18 November 2022 / Published: 7 December 2022
(This article belongs to the Topic Tolerance to Drought and Salt Stress in Plants)

Abstract

:
Iris domestica is a popular gardening plant. Although the species is considered tolerant to drought, its growth and development are often affected by drought conditions. Therefore, revealing the regulatory mechanisms of drought tolerance in this species will aid in its cultivation and molecular breeding. In this study, morpho-physiological and transcriptome analyses of the roots of I. domestica plants were performed under persistent drought conditions. Peroxidase activity, proline content, and tectoridin content increased under sustained drought conditions. Transcriptome analysis showed that the roots of I. domestica seedlings respond to drought mainly by regulating the expression of drought-resistant genes and biosynthesis of secondary metabolites. This study provides basic data for identifying drought response mechanisms in Iris domestica.

Graphical Abstract

1. Introduction

Drought is a global problem that also restricts the development of the planting industry, including the cultivation of Chinese medicinal materials [1,2]. Occasional drought threats have greatly affected the production and output of Chinese herbal medicines while reducing economic income [3]. The study of plants, particularly medicinal plants, and their physiological responses to water deficit is of great theoretical significance and has important practical implications. Root water uptake under drought conditions is insufficient to compensate for the loss of water owing to transpiration [4], which greatly restricts the growth and development of plants [5,6,7,8]. Plants have evolved various morphological, physiological, biochemical, and molecular strategies in response to drought stress [9,10]. Among these are the increased activity of protective enzymes (peroxidase, POD) and accumulation of osmolytes such as proline [11,12]. For example, Yang et al. found that the concentration of osmotic regulators and the activities of protective enzymes in Bupleurum chinensis were increased on the 12th and 20th days of drought [13]. These changes are associated with the expression of drought-induced functional and regulatory genes, which facilitates the adaptation of plants to drought [14,15]. In particular, the expression of VP, POD, and LEA genes improves the drought resistance of plants [16,17,18]. Moreover, recent studies have indicated that some transcription factors (TFs), such as WRKY, NAC, MYB, bZIP, bHLH, and ERF, can improve the drought tolerance of plants [19,20]. Transcriptome sequencing technology can be used to identify and analyze the functional regulatory genes in medicinal plants at the omics level, thus laying a foundation for the screening of superior varieties and molecular marker-assisted breeding [21].
Iris domestica (L.) Goldblatt & Mabb. (syn. Belamcanda chinensis [L.] DC.) is a perennial herb in the Iridaceae family that is widely distributed in China. The species is highly adaptable, drought-tolerant, and has a strong root system [22]. The elegant flower shape and high isoflavone content of this species contribute to its ornamental and medicinal value. In recent years, research on I. domestica has mainly focused on chemical identification, medicinal value, efficacy in traditional Chinese medicine, and species origin. However, few studies have explored the physiological resistance of the species to environmental stress. Previous studies have shown that I. domestica has high drought tolerance [23]; however, the molecular mechanisms involved in the root drought response are unclear. In the present study, we aimed to examine the response of I. domestica roots to drought and reveal the mechanisms of drought resistance of this species. The results will facilitate the screening of high-quality drought-resistant germplasm resources.

2. Materials and Methods

This study was conducted at the Medicinal Plant Cultivation and Physiological and Ecological Practice Teaching Base (D08) of Jilin Agricultural University (Changchun, China). To maintain consistent experimental conditions (humidity, temperature, and light), all of the experiments were conducted in D08 with a natural photoperiod for approximately 12 h light, average humidity: 67.81%, average high temperature: 28 °C, and average low temperature: 21 °C.
Dried mature I. domestica seeds were collected at the Medicinal Botanical Garden (Jilin Agricultural University, Jilin, China) in October 2017 and planted in seeding pots in April 2018. One month later, approximately 5 cm tall, one-year-old plants from D08 were selected and transplanted into plant pots (14.5 cm high, inner diameter 20.5 cm; three plants per pot) also located in D08, and each was filled with approximately 4 kg of soil substrate. Each pot was placed in the ground, with the edge of the pot protruding from the ground. The soil physicochemical properties were as follows: 248 mg kg−1 available nitrogen, 17 mg kg−1 available phosphorus, 140 mg kg−1 available potassium, and a pH of 7.187. Normal field management (including weeding twice weekly and watering 150 mL daily) was performed throughout the experiment. Twelve pots, each containing three individual two-year-old plants, were used in this study. The plants were irrigated daily with 150 mL of water from 17:00 to 18:00 for four months. On day one of the fifth month, drought conditions were initiated and irrigation was stopped. Soil water content was recorded with a HH2 Soil Moisture Meter (Delta-T Devices Ltd., Cambridge, UK). The instrument probe was inserted half the depth of the pot and the soil moisture content was measured in three different parts of the pot. Root samples were collected on days 1 (control), 6, 13, and 27 of the drought experiment. Three pots were sampled each time and each pot contained three plants with similar growth patterns.
The roots were rinsed with tap water and surface moisture was removed using filter paper. The fresh weight (FW) of the roots was measured. To measure dry weight (DW), the roots were oven dried at 100 °C for 30 min initially and then at 60 °C until they reached a constant weight. The drying rate was calculated according to the formula: Drying rate = DW/FW × 100%. The dried roots powder (0.1000 g) were placed in a conical flask (50 mL) with 25 mL of 75% methanol solution. After ultrasonic treatment (frequency 40 kHz, temperature 25 °C) for 30 min, centrifugation at 3000× g rpm min−1 for 10 min, and filtration, the filtrate was fixed to 25 mL. The final volume was filtered by a 0.22 µm membrane and analyzed by high-performance liquid chromatography (HPLC). Five isoflavones were determined according to the methodology of Zhu et al. [24], with measurements taken from three pots, each containing three plants. The standard regression equations of tectorigenin, tectoridin, irigenin, iridin, and irisflorentin were Y = −8 × 10⁻⁶ + 0.0001X (R2 = 0.9999), Y = 0.0001 + 0.0002X (R2 = 0.9997), Y = −0.005 + 0.0002X (R2 = 0.9996), Y = −0.0004 + 0.0003X (R2 = 0.9999), and Y = −0.002 + 0.0002X (R2 = 0.9999), respectively.
The crude extract from 0.50 g fresh samples was extracted with solvent (phosphate buffer solution for POD, and sulfosalicylic acid for Pro test). A microplate reader (Spectra Max 190, Molecular Devices, San Jose, CA, USA) was used to determine absorbance. POD activities and Pro content were analysed with Peroxidase assay kit, Proline assay kit (Nanjing Jiancheng Bioengineering Institute, Nanjing, China), respectively.
Based on the obtained physiological parameters, samples collected at days 1, 13, and 27 were used for transcriptome analysis. Samples from day 6 were not included because they exhibited little change in soil moisture. Total RNA was extracted from root samples using an RNAprep Pure Plant Plus Kit (TianGen Biotech, Beijing, China) following the manufacturer’s instructions. Total RNA was qualified and quantified using a Bioanalyzer 2100 and RNA 1000 Nano LabChip Kit (Agilent Technologies, Santa Clara, CA, USA) with RNA integrity number >7.0. Poly(A) RNA was subjected to two rounds of purification from total RNA (5 μg) using poly-T oligo-attached magnetic beads. Following purification, the mRNA was fragmented into small pieces using divalent cations under elevated temperatures. The cleaved RNA fragments were reverse-transcribed to create the final cDNA library in accordance with the protocol for the mRNA-Seq sample preparation kit (Illumina, San Diego, CA, USA). The average insert size for the paired-end libraries was 300 bp (±50 bp). Paired-end sequencing was conducted on an Illumina NovaSeq 6000 platform (LC Sciences, Houston, TX, USA) following the vendor’s recommended protocol.
Cutadapt and Perl in-house scripts were used to trim adapter sequences and low-quality and undetermined bases. Sequence quality (Q20, Q30, and GC content) of the clean data was verified using FastQC (http://www.bioinformatics.babraham.ac.uk/projects/fastqc/) accessed on 14 May 2021. All downstream analyses were based on high-quality clean data. De novo assembly of the transcriptome was performed using Trinity 2.4.0 [25]. Trinity groups transcripts into clusters based on the shared sequence content. Such a transcript cluster is very loosely referred to as “gene”. The longest transcript in the cluster was selected as the “gene” sequence (i.e., unigene).
All assembled unigenes were aligned against the non-redundant (Nr) protein (http://www.ncbi.nlm.nih.gov/) accessed on 14 May 2021, Gene Ontology (GO) (http://www.geneontology.org) accessed on 14 May 2021, SwissProt (http://www.expasy.ch/sprot/) accessed on 14 May 2021, Kyoto Encyclopedia of Genes and Genomes (KEGG) (http://www.genome.jp/kegg/) accessed on 14 May 2021, and eggNOG (http://eggnogdb.embl.de/) accessed on 14 May 2021 databases using DIAMOND with an E-value threshold of <0.00001 [26]. The Salmon method was used to determine the expression levels of unigenes by calculating the transcripts per million [27]. Gene expression levels were calculated and normalized using the trimmed mean of M values. Differentially expressed unigenes were selected by statistical significance (p < 0.05) and log2 (fold change) >1 or <−1 using the R package edgeR [28].
Total RNA was extracted according to the method described above. cDNA was synthesized by quantitative reverse transcription PCR (qRT-PCR), as previously described [10]. PCR was then performed in an Mx 3000 P instrument (Agilent Technologies) using SYBR Premix Ex TaqTM II (Takara Biomedical Technology Co., Ltd., Beijing, China). The 20 μL qRT-PCR reaction volumes contained 1 μL template, 1 μL of upstream and downstream primers (10 μM each), 7 μL RNase-Free d2H2O, and 10 μL of SYBR Premix Ex TaqII. The cycling protocol consisted of the initial denaturation step at 95 °C for 30 s, followed by 40 cycles at 95 °C for 5 s, 55 °C for 30 s, and 72 °C for 30 s. Relative transcript expression was assessed using the 2−ΔΔCT method and the EF1-β gene as the reference [29,30,31]. Three independent replicates were prepared for each treatment. The primers used for qRT-PCR are presented in File S1 (Supplementary Materials).
Statistical analysis of the physiological data was conducted using SPSS 20.0 (SPSS Inc., Chicago, IL, USA). Significant differences among treatments were determined using one-way ANOVA and Duncan’s multiple comparison analysis (p < 0.05). Simple graphs and enriched circle plots were drawn by Origin 2018 software and OmicShare tools, a free online platform for data analysis (https://www.omicshare.com/tools) accessed on 7 November 2021.

3. Results

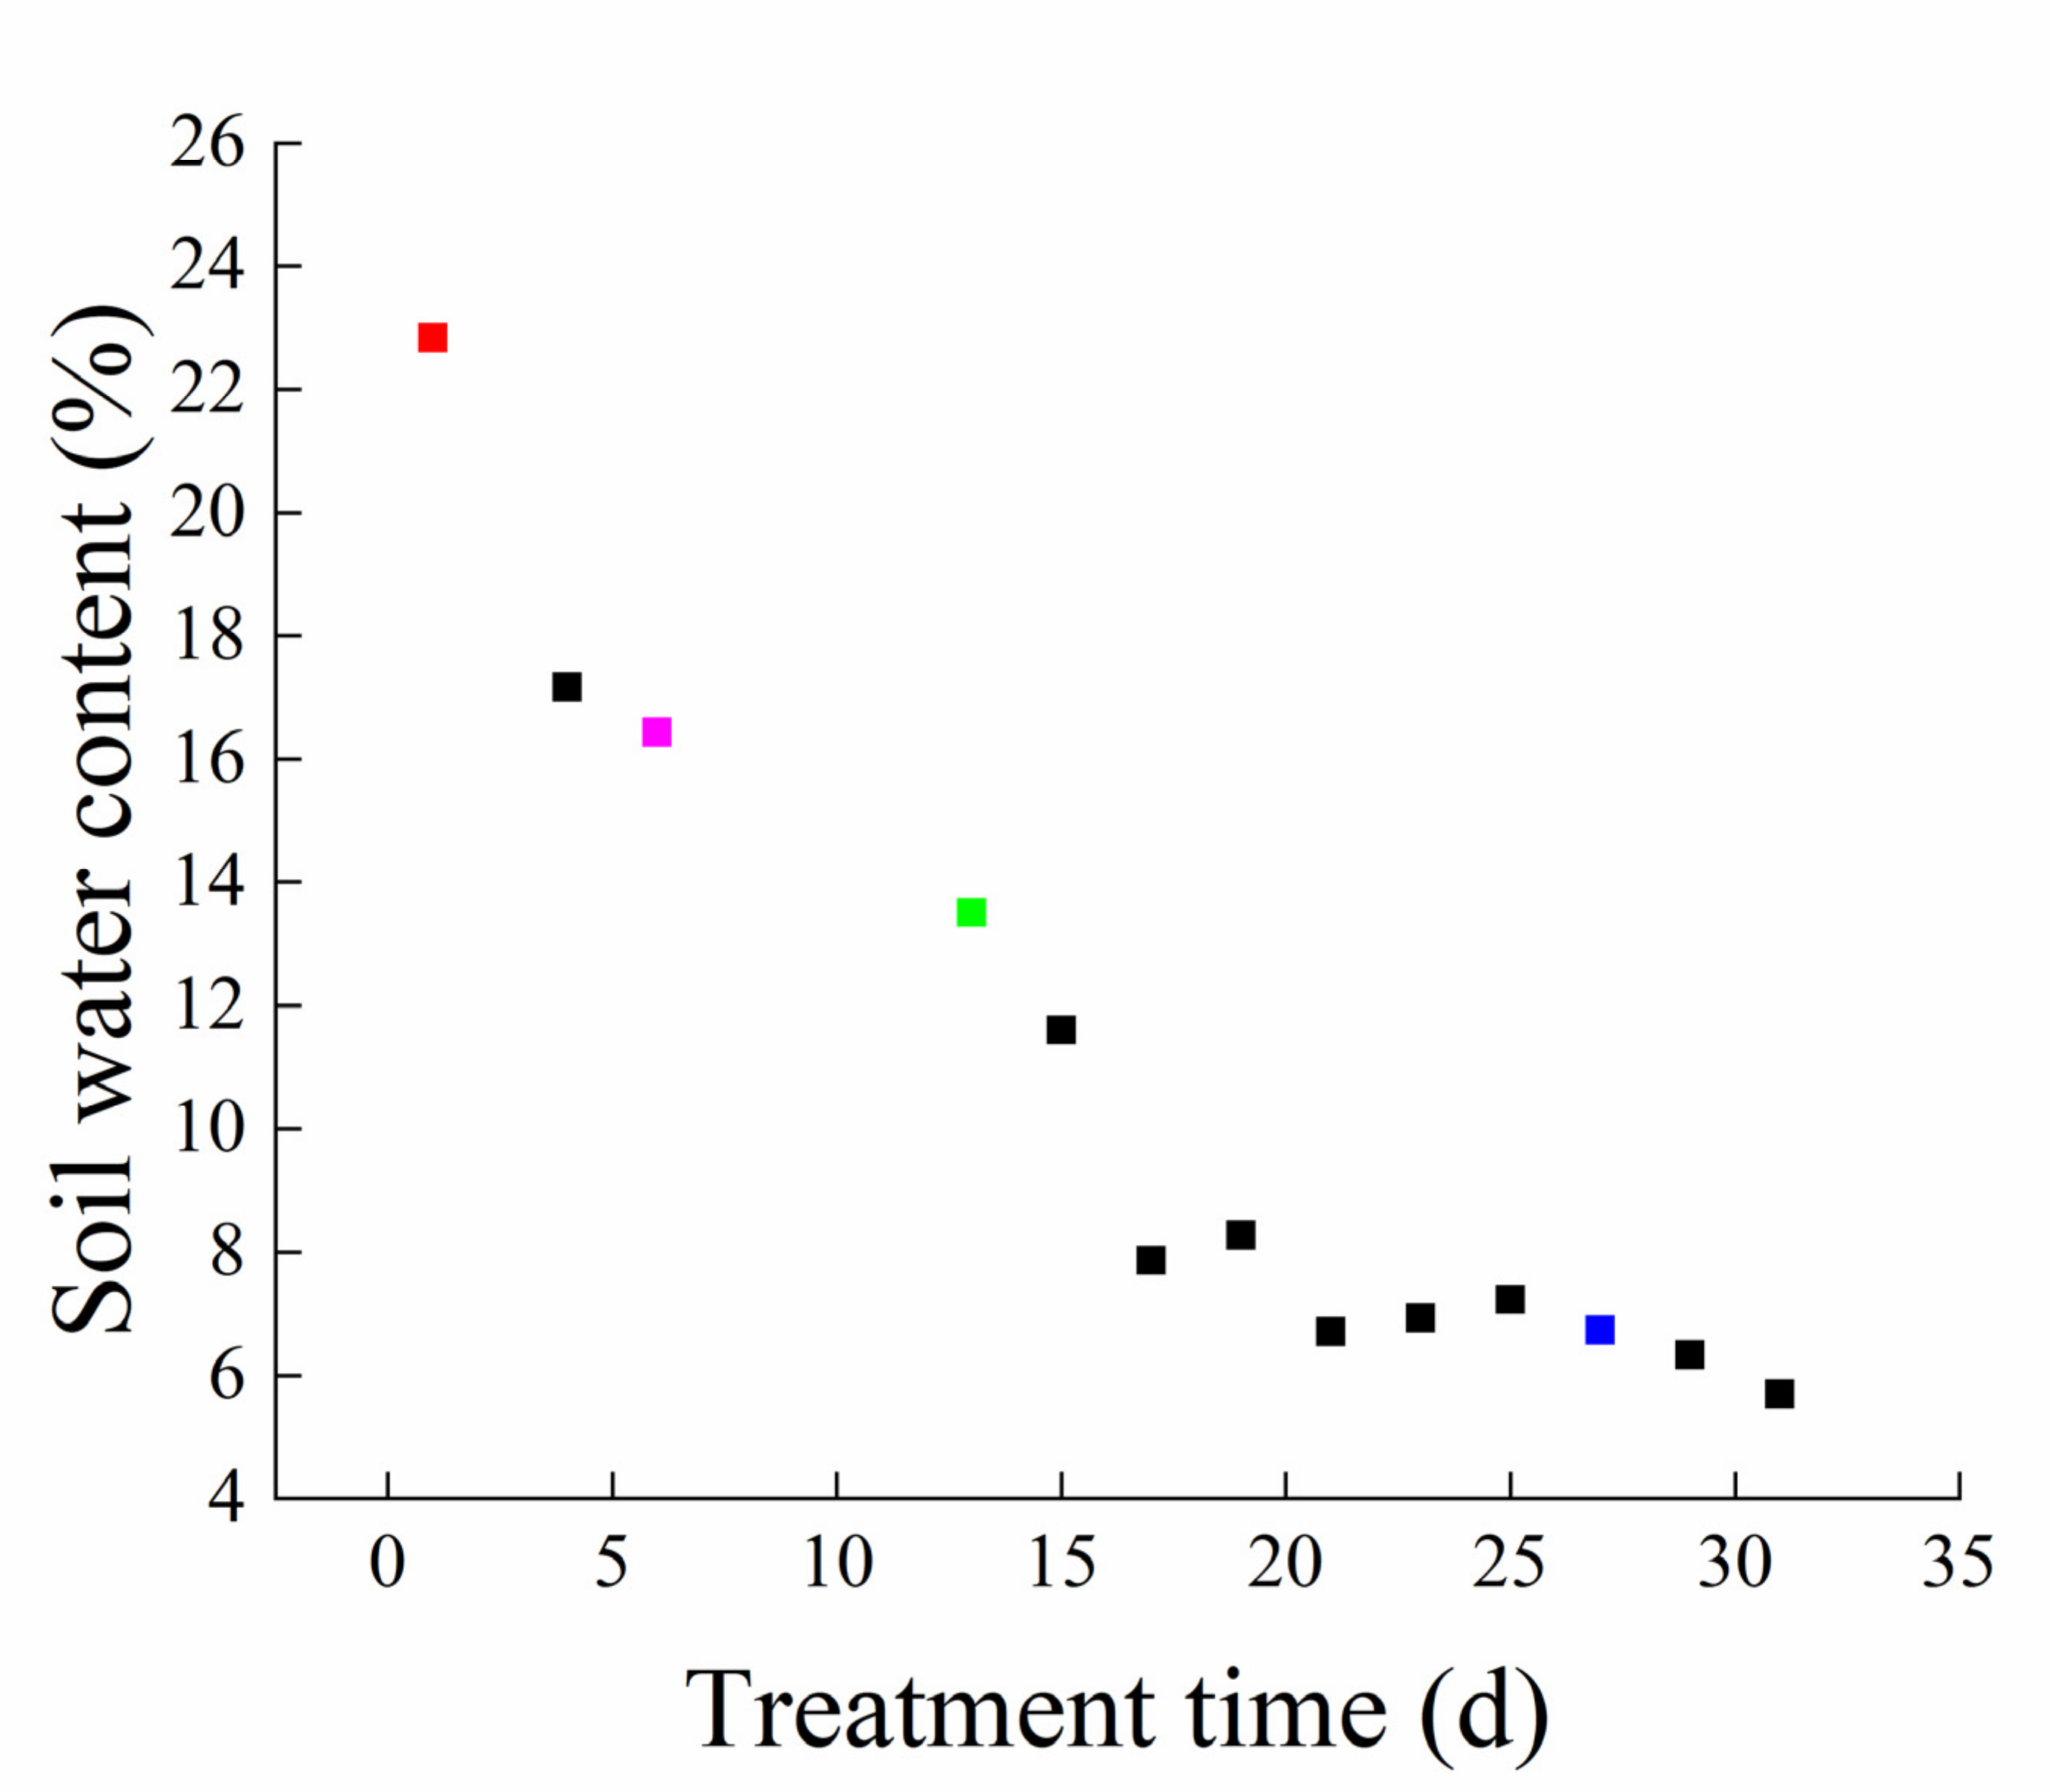
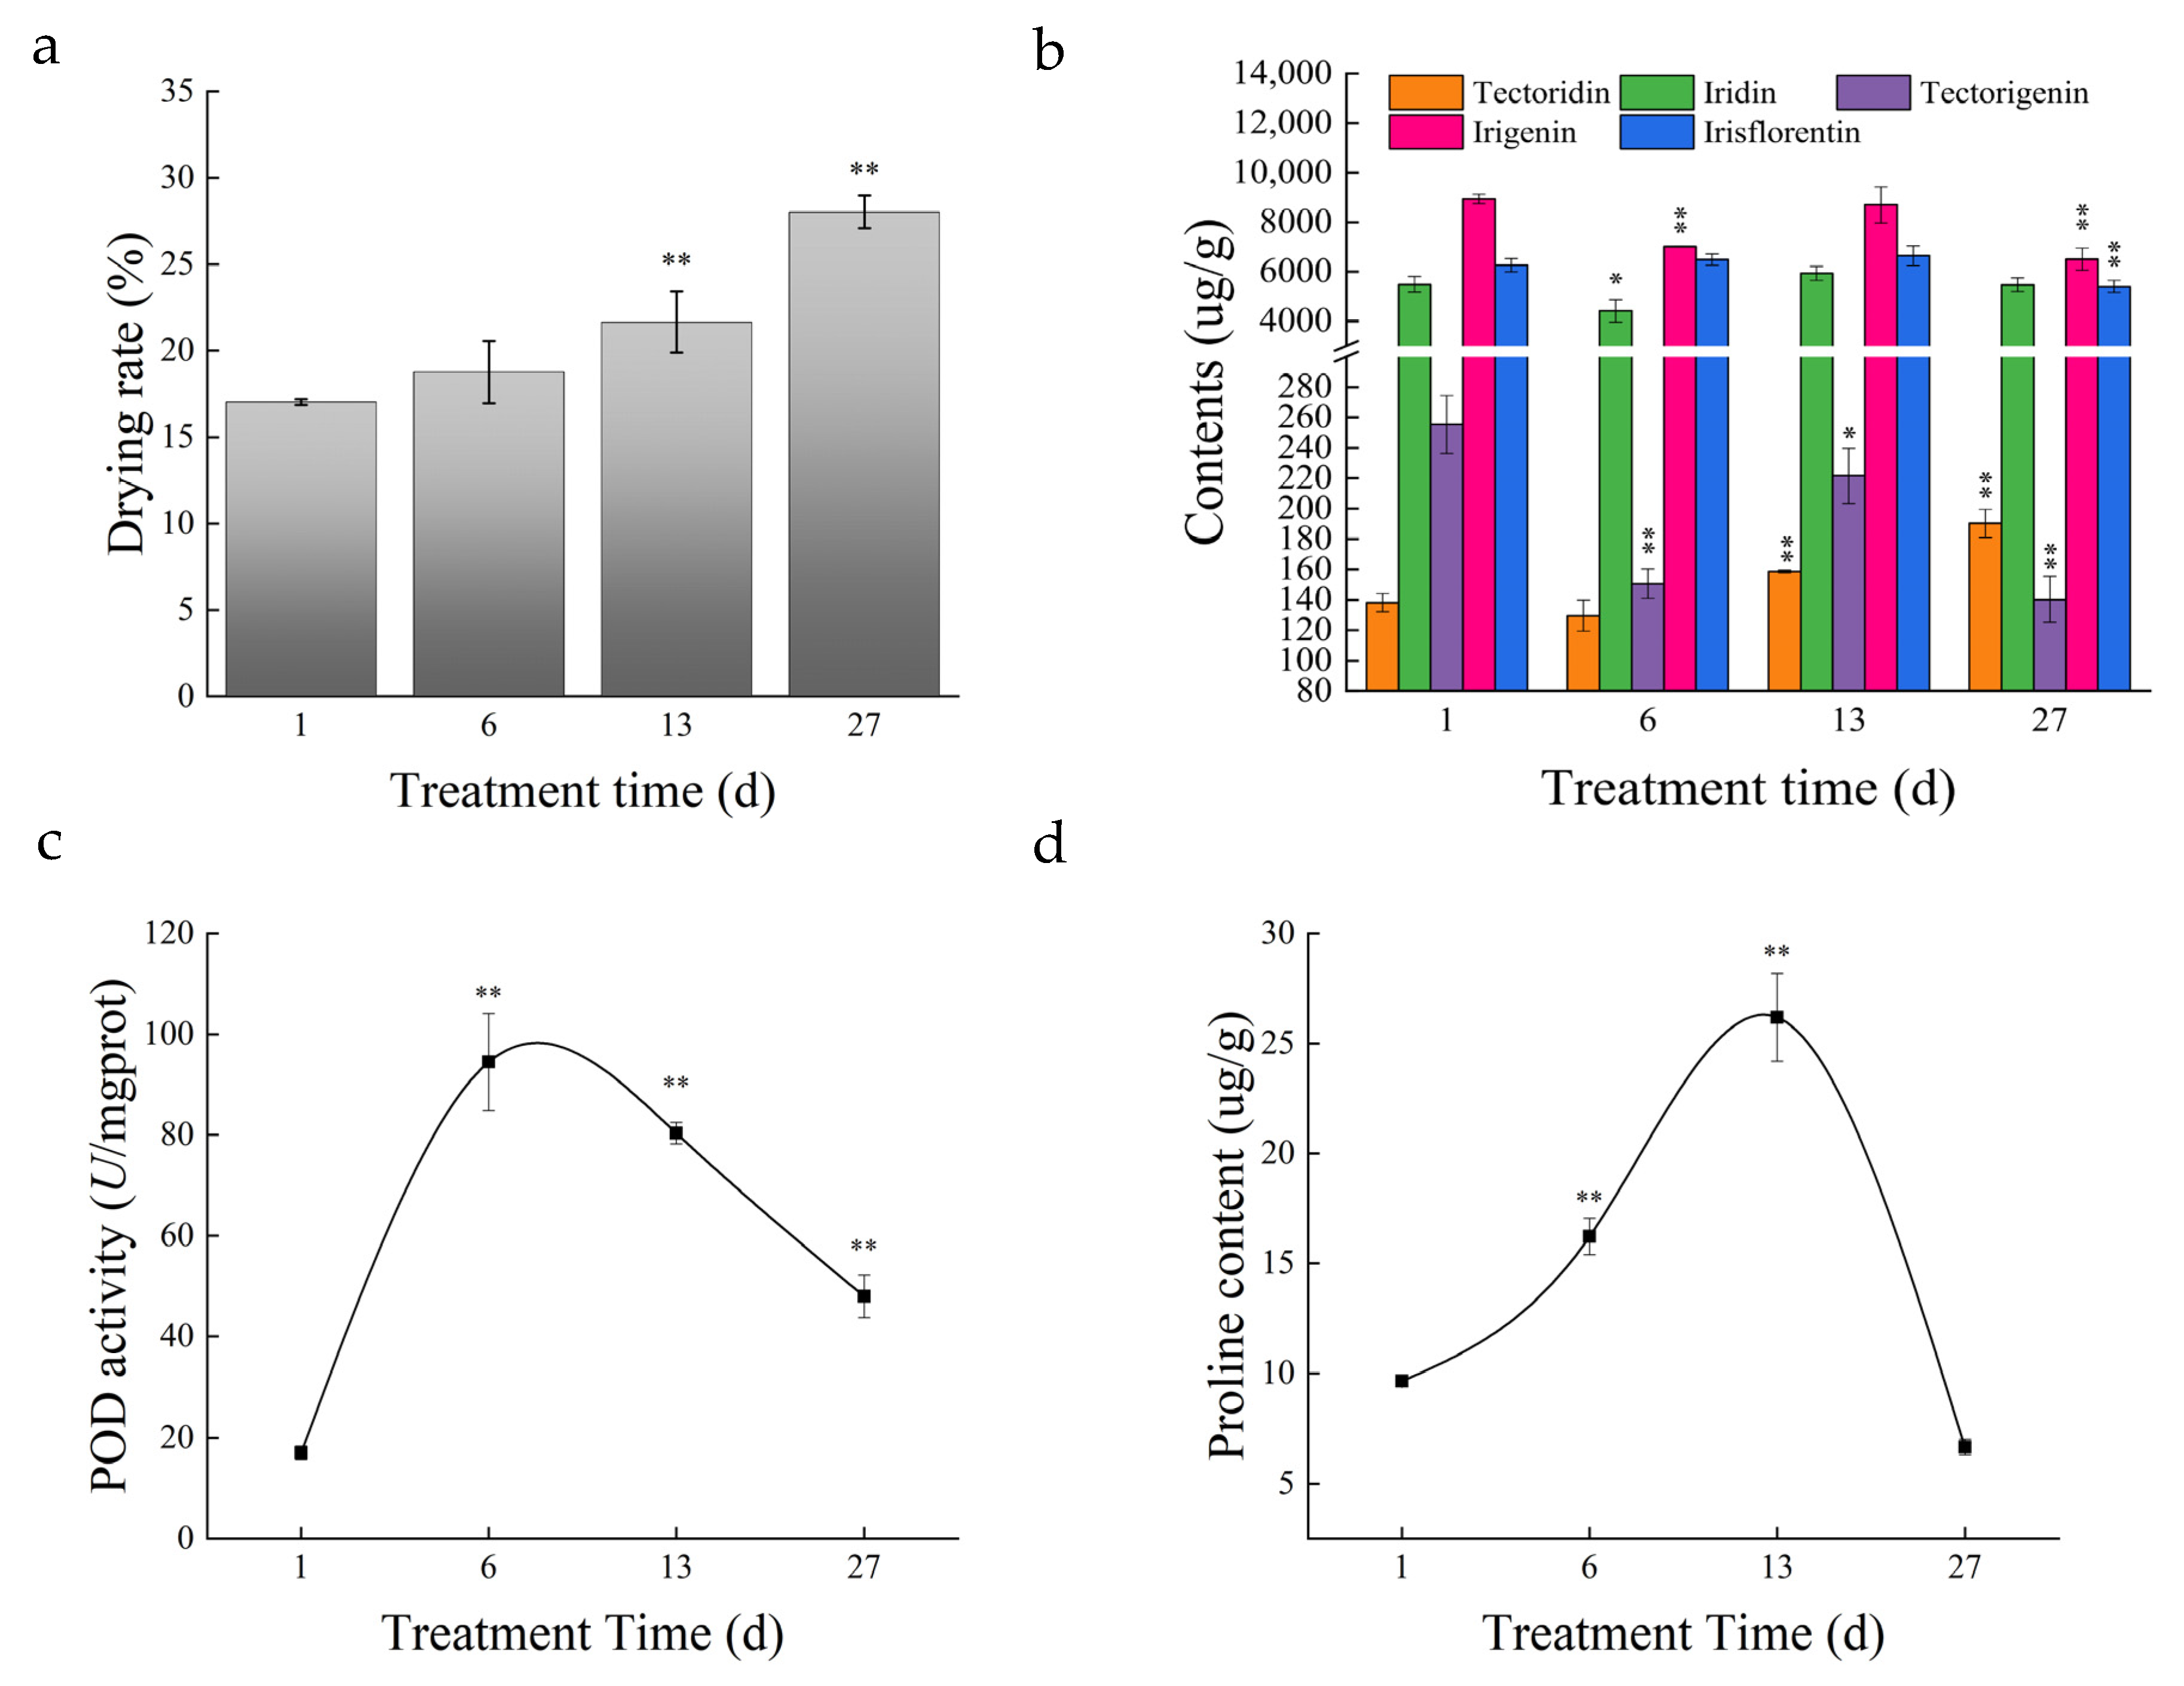
3.1. Soil Water Content and Root Physiological Characteristics

To understand the responses to drought stress in I. domestica, plants were initially irrigated with 150 mL water daily until the drought simulation, after which point irrigation was interrupted for 27 days. The soil water content during the experiment decreased from 22.83% to 5.7%; the decrease was initially sharp and then became gradual (Figure 1).
The drying rate of the roots showed an upward trend and was significantly higher (p < 0.01) at day 13 (21.66%) than at day 1 (17.03%) (Figure 2a). The content of five isoflavones was measured in the roots. Drought conditions were not conducive to the accumulation of iridin, tectorigenin, irigenin, and irisflorentin, but rather contributed to the accumulation of tectoridin, which was significantly higher at day 13 than at day 1 (Figure 2b). The POD activity and proline content in the roots increased from day 6 in response to drought, and were both significantly higher than those at day 1 (p < 0.01; Figure 2c,d).

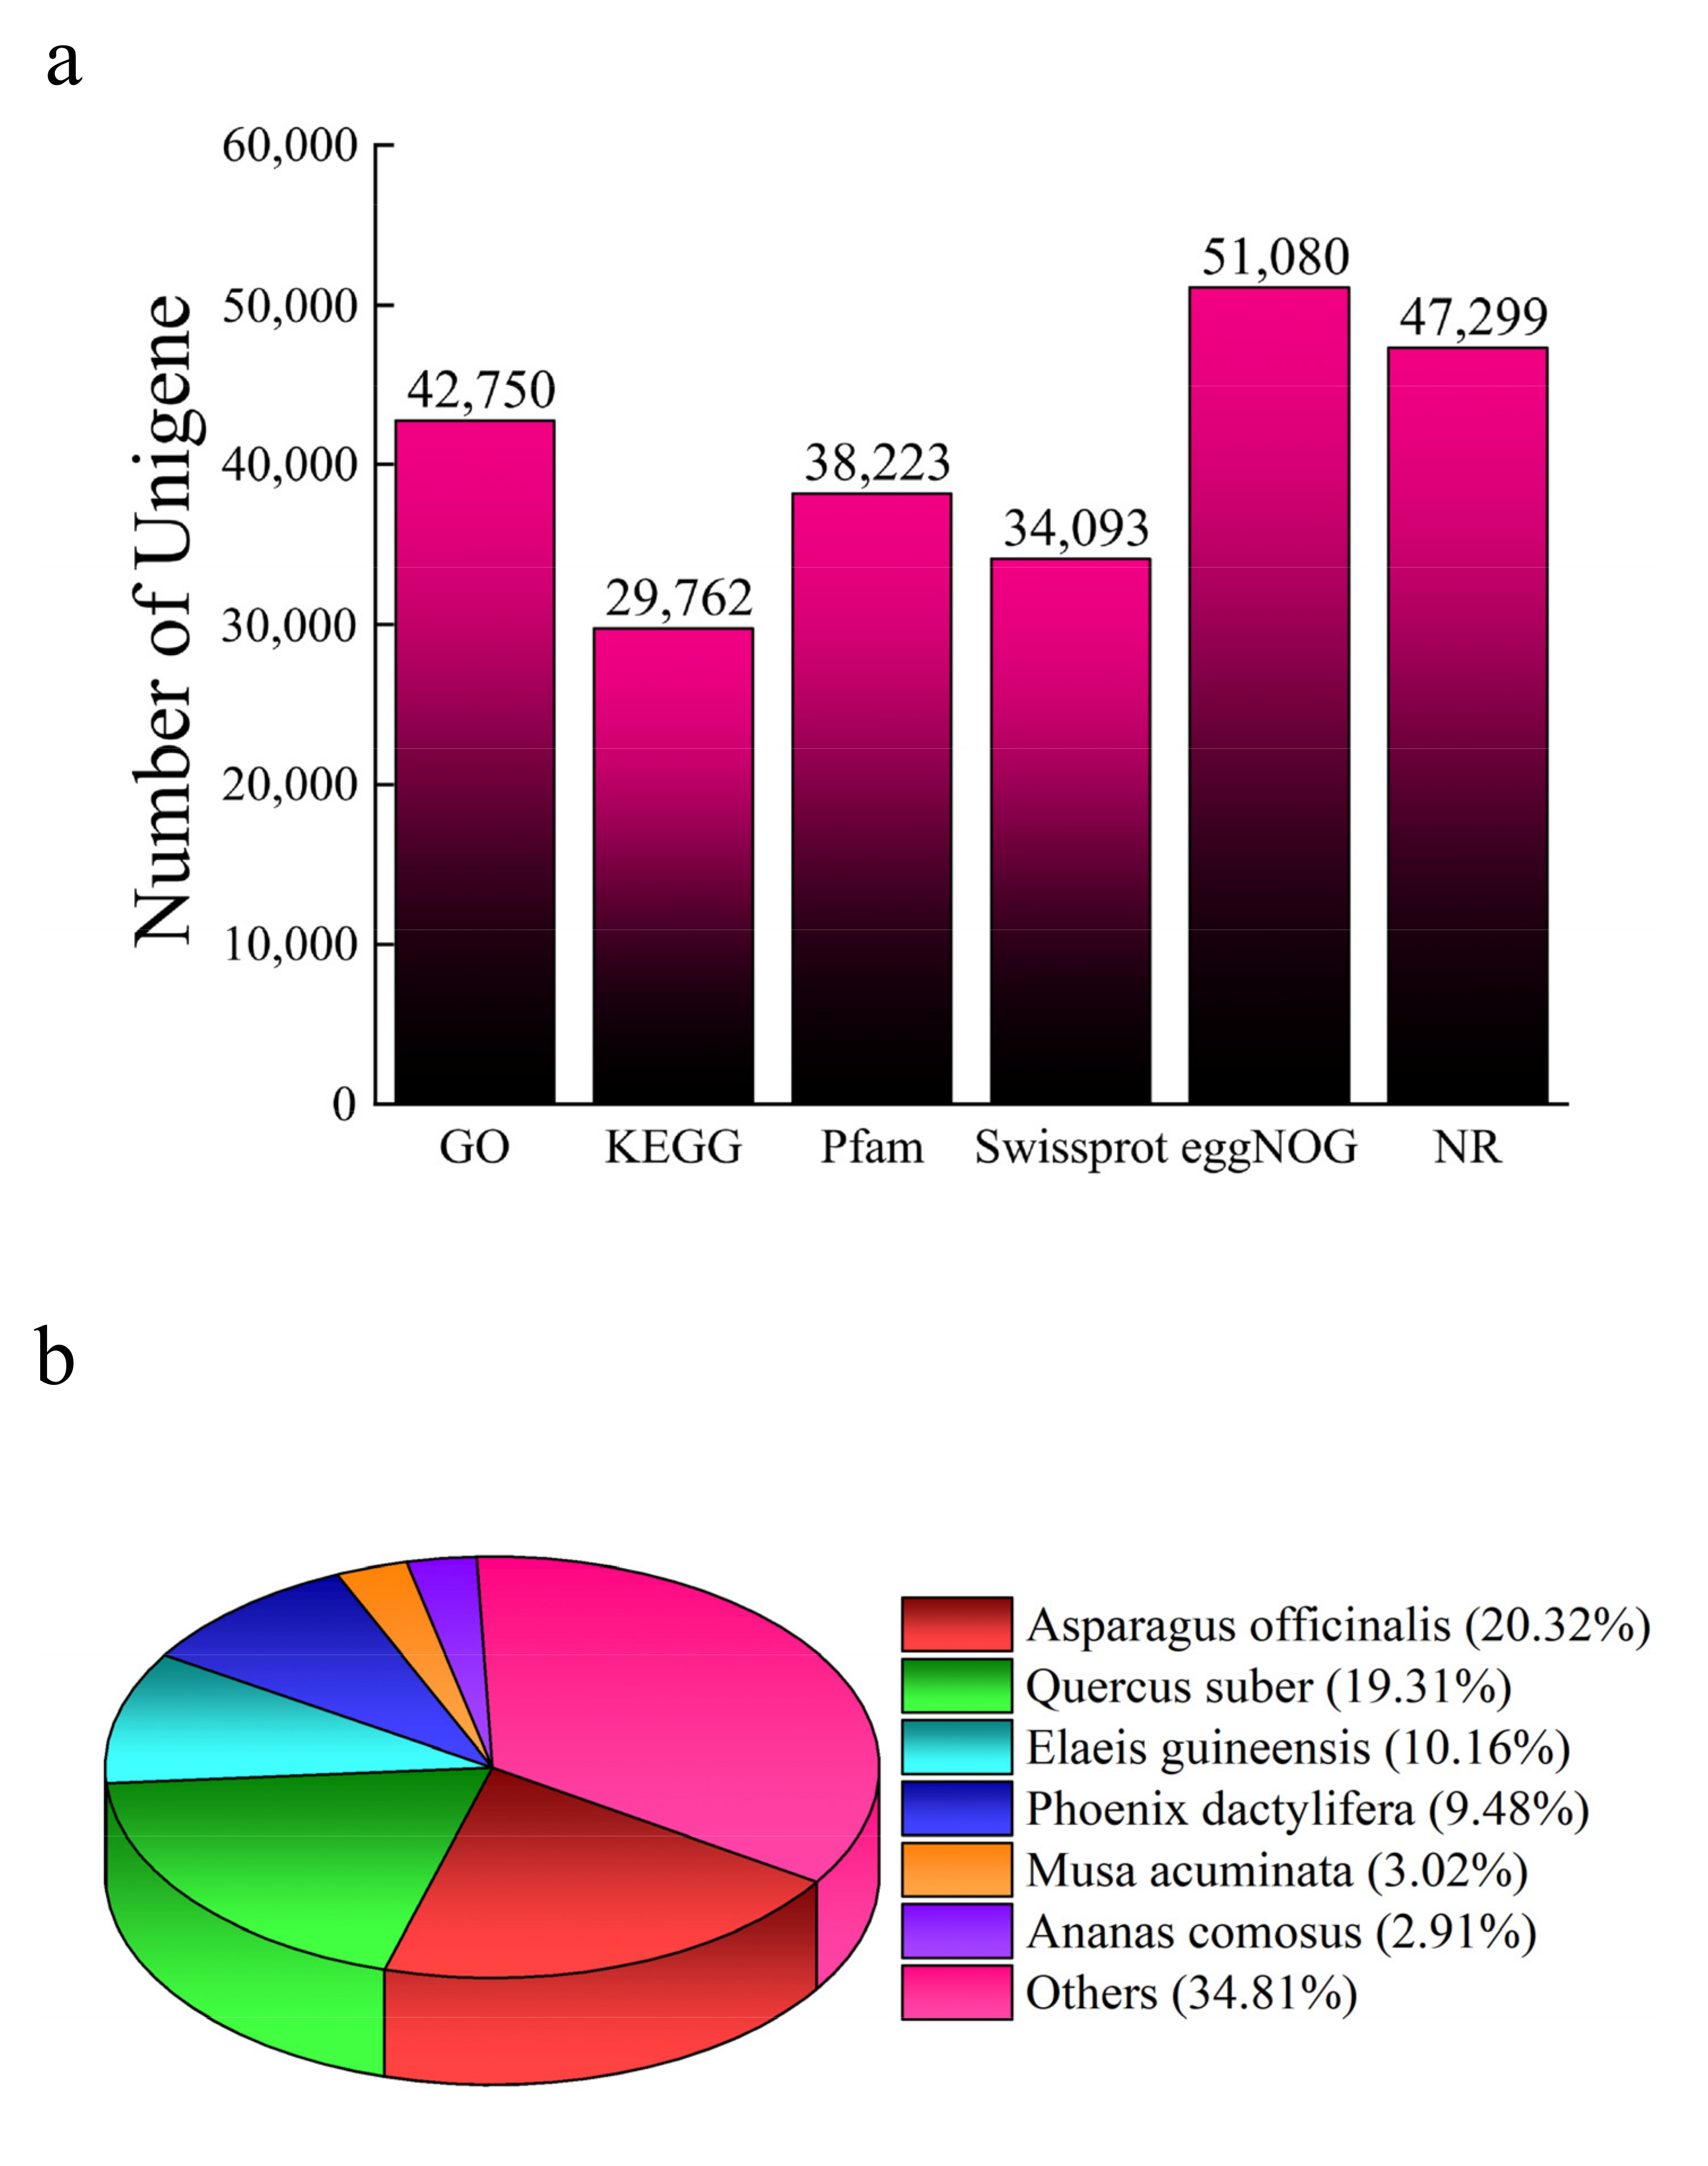
3.2. Quality Control and Annotation

In total, 133.28 GB valid reads were obtained from the transcriptome data. The proportion of Q30 was greater than 94% and the GC content ranged from 47.26% to 53.42%, indicating good data sequencing quality. After assembly, 116,612 unigenes were obtained with an average length of 368 bp. The highest functional annotation rate was obtained using eggNOG (43.80%), followed by the NR database (40.56%) and KEGG (25.52%). The unigenes matched the sequences from the genomes of Asparagus officinalis, Quercus suber, Elaeis guineensis, Phoenix dactylifera, Musa acuminata, Ananas comosus, and other species (Figure 3; Supplementary Materials, File S2).

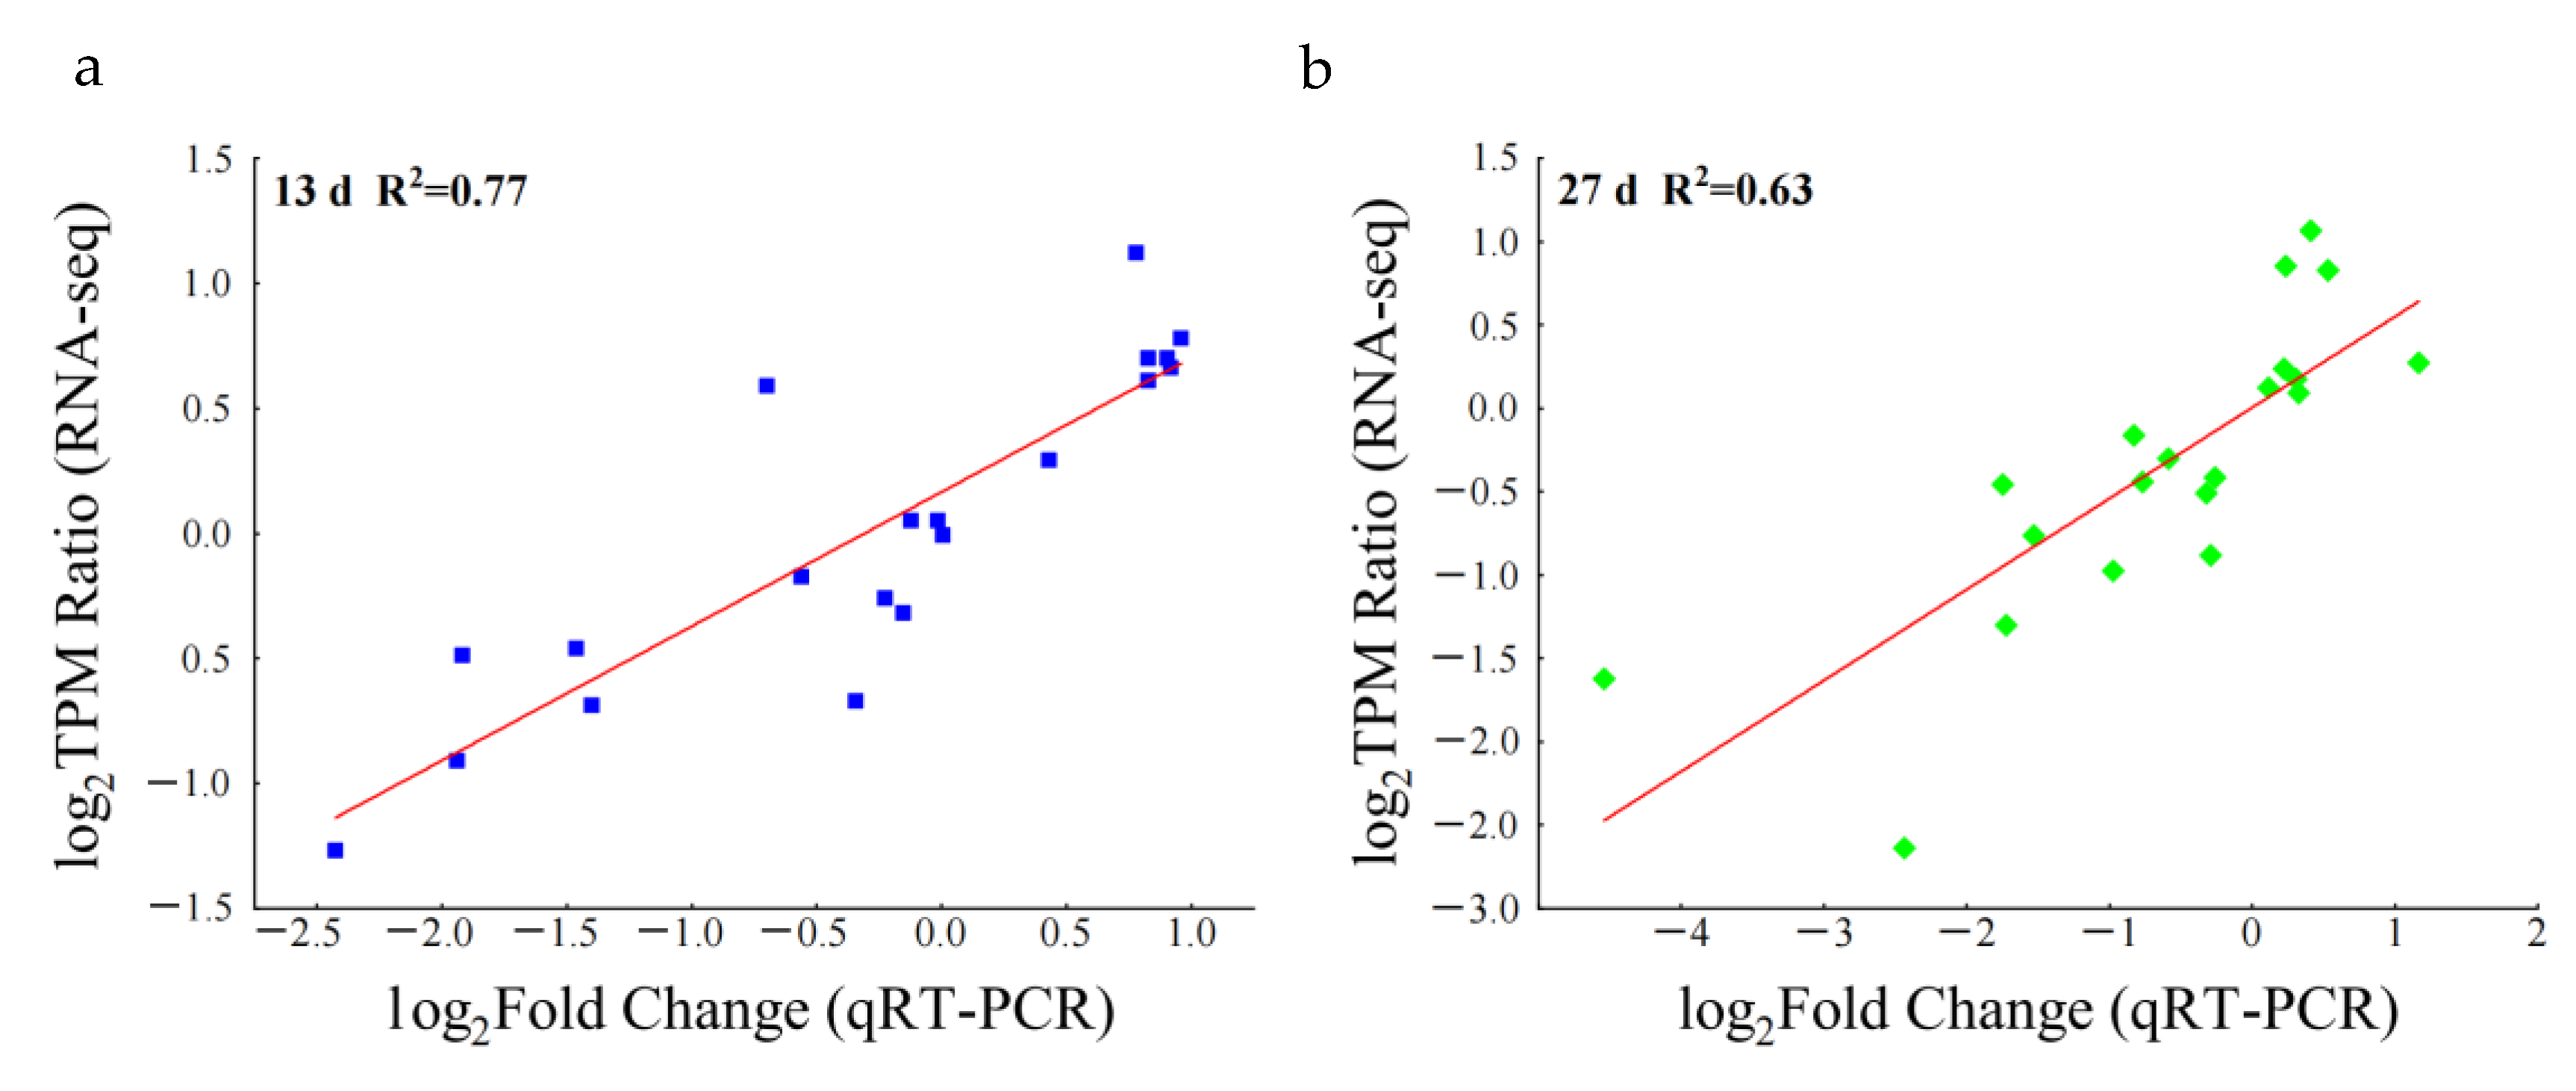
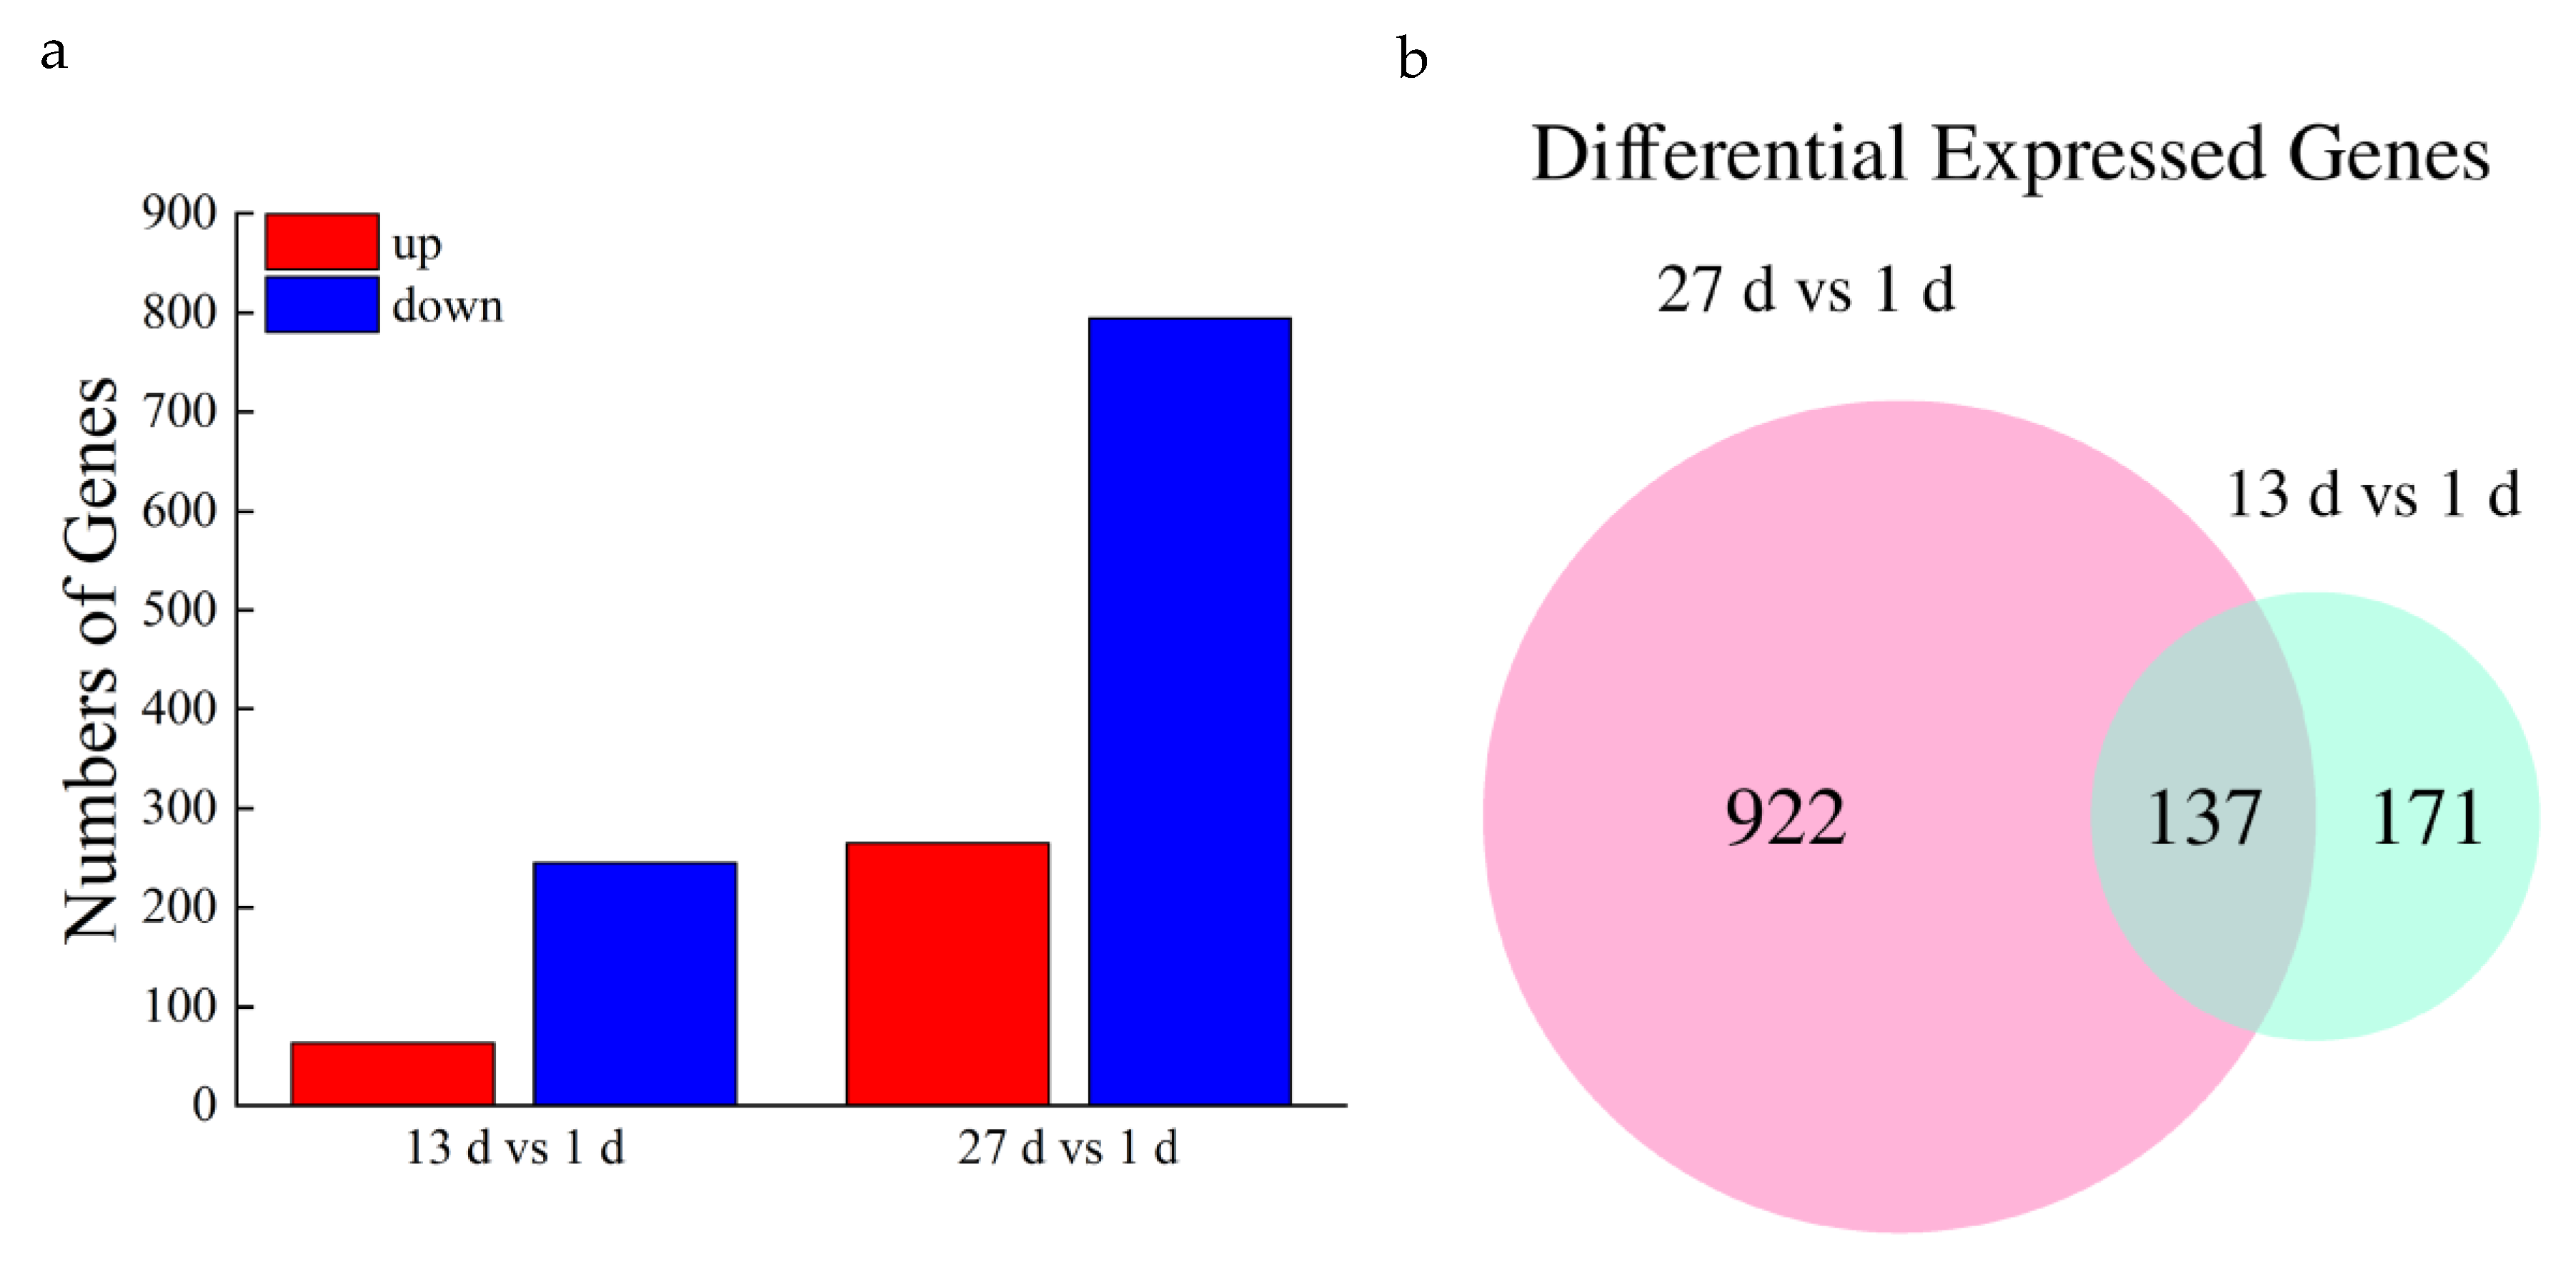
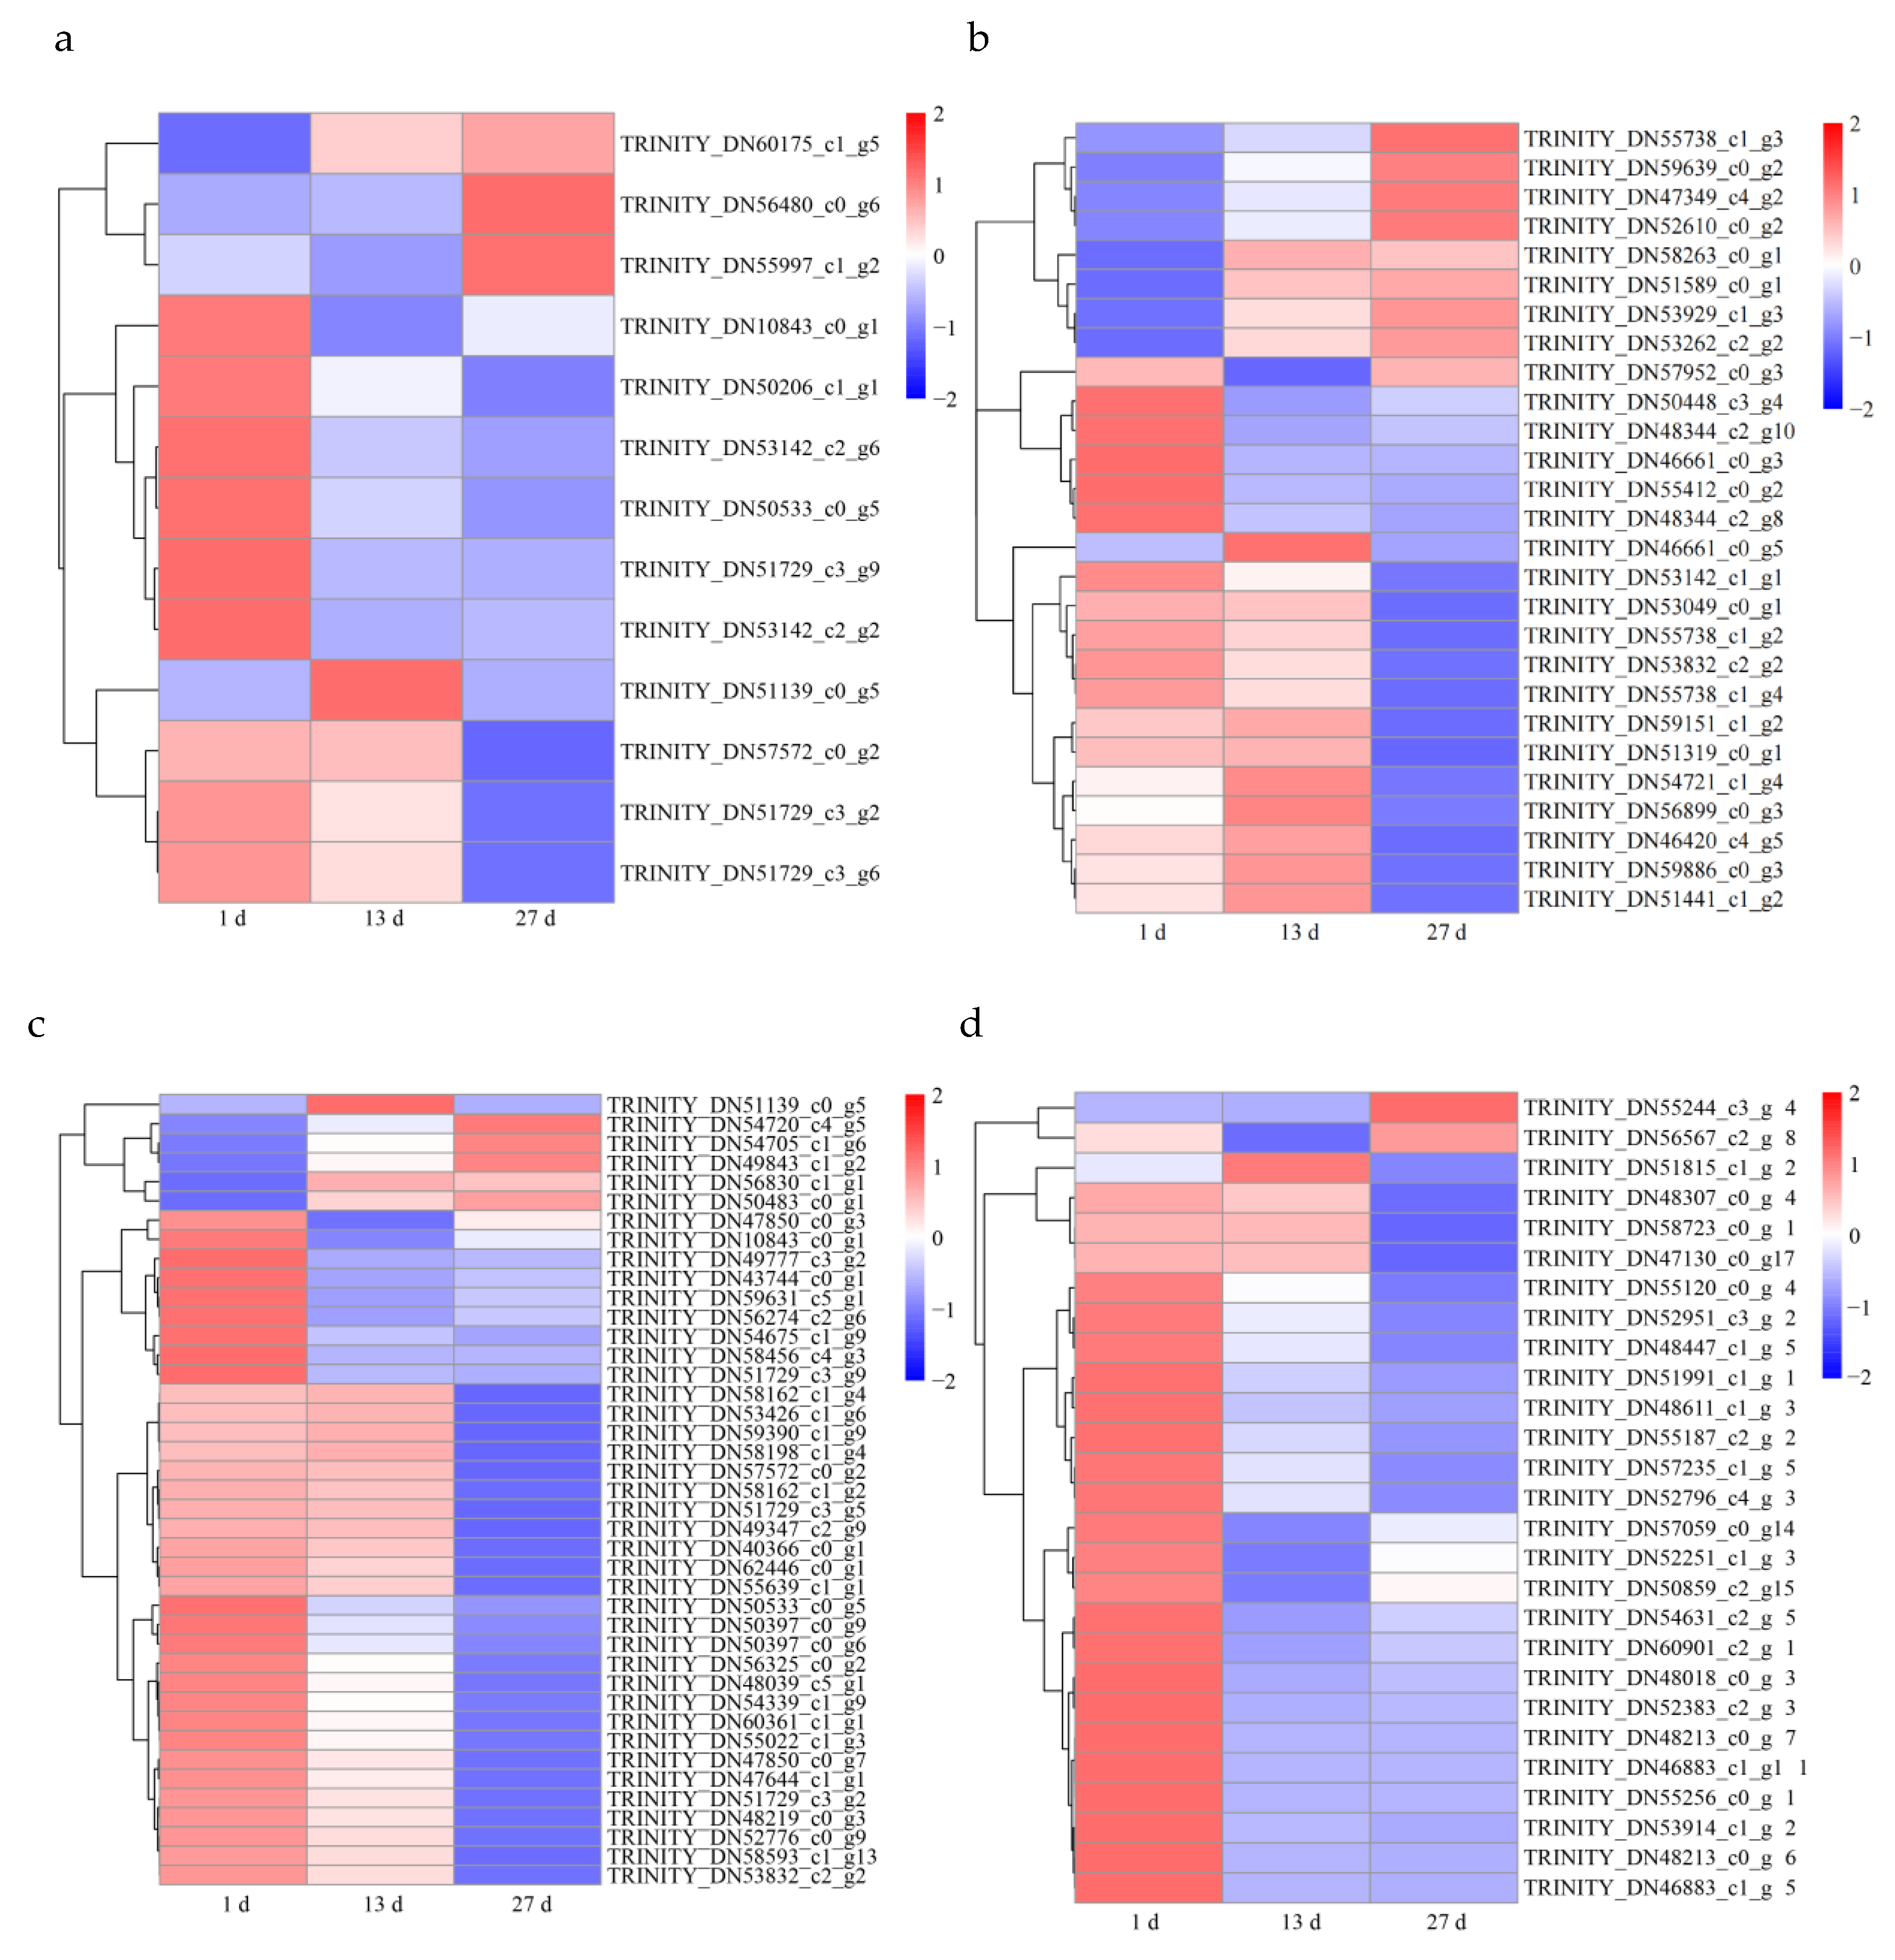
3.3. Gene Expression Analysis

Twenty genes were randomly selected to verify the transcriptome sequencing results by qRT-PCR; a strong positive correlation was determined between the results of RNA sequencing and qRT-PCR. The correlation coefficient for day 13 versus day 1 (R2 = 0.77) and day 27 versus day 1 (R2 = 0.63) indicates the reliability of the transcriptome sequencing data (Figure 4).
In total, 252,522 transcripts were obtained from sequencing libraries. We found 1230 unigenes that were differentially expressed in the root samples during the drought period. The number of differentially expressed genes (DEGs) gradually increased over time; 308 and 1059 DEGs were detected at 13 and 27 d of drought treatment, respectively. Of those, 63 and 265 DEGs were upregulated and 245 and 794 DEGs were downregulated, respectively. The differential expression of the genes varied at different time points (Figure 5a) under the drought conditions.
The common unigenes at different physiological stages were presented using a Venn diagram (Figure 5b). Compared with day 1, a total of 137 genes were significantly differentially co-expressed at days 13 and 27 of root water stress. These co-expressed genes may be related to the moisture deprivation response. Additionally, a large number of genes that respond to drought stress were induced at day 27 (Figure 5b).

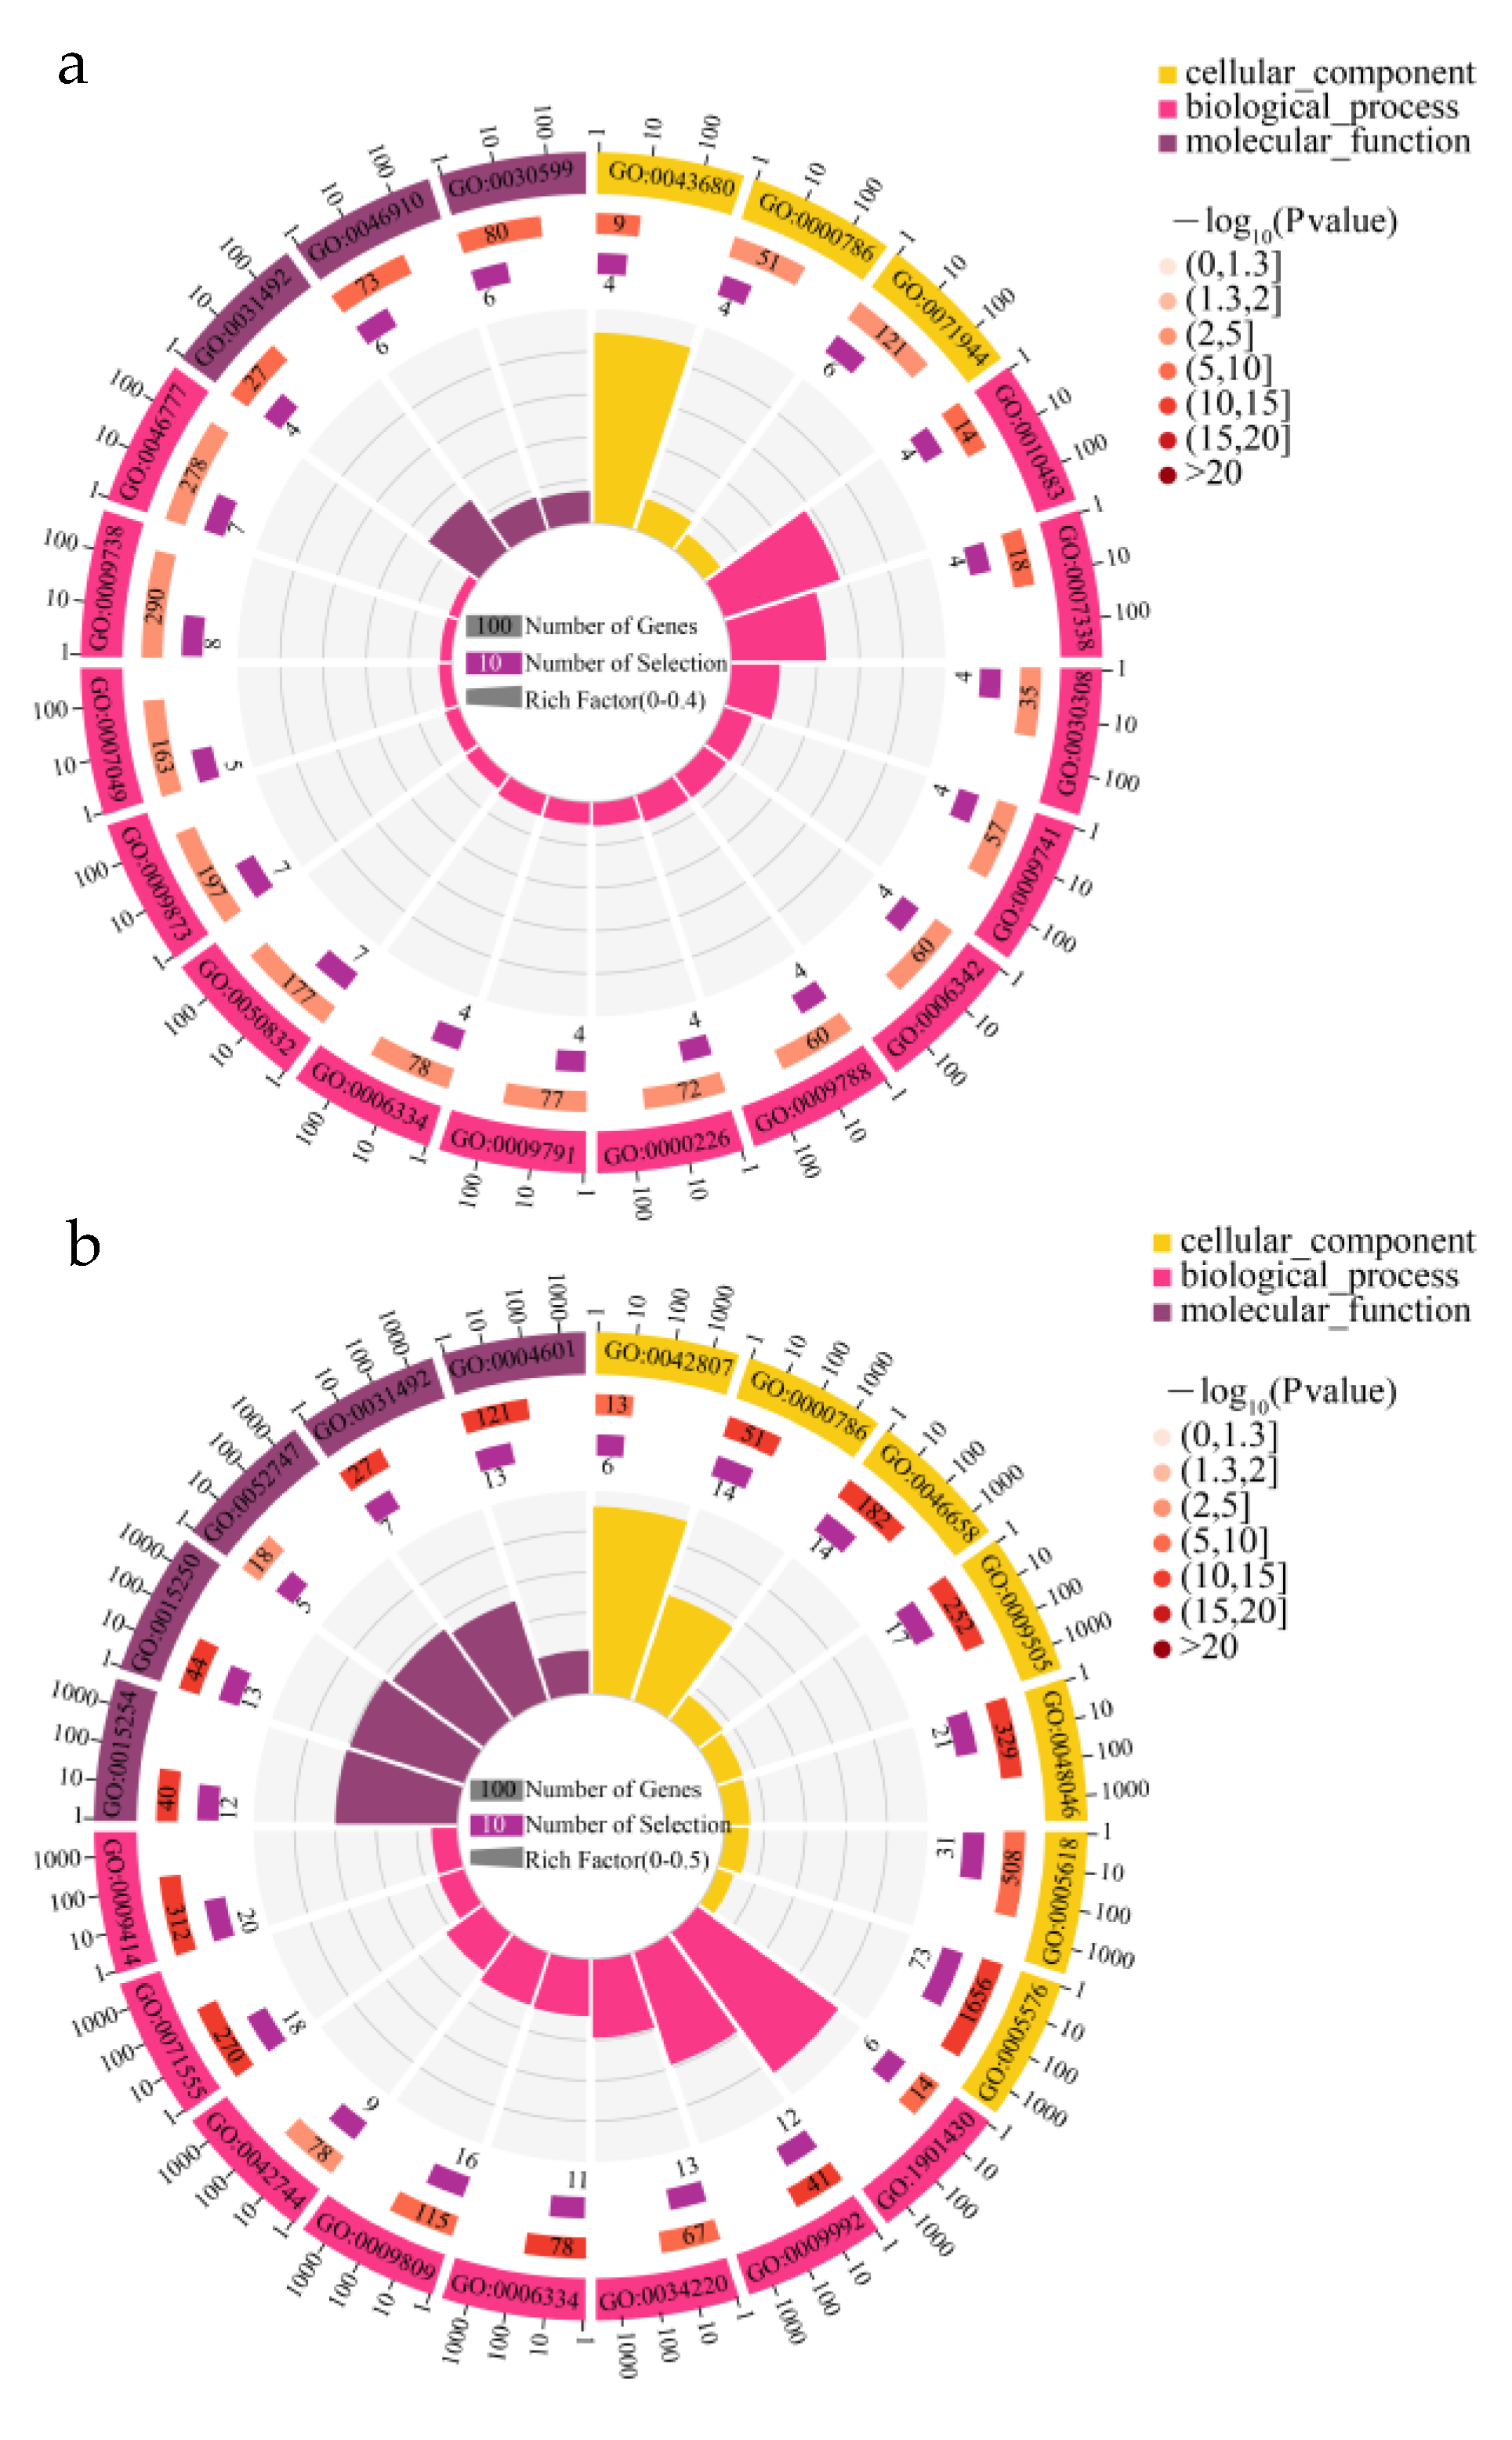
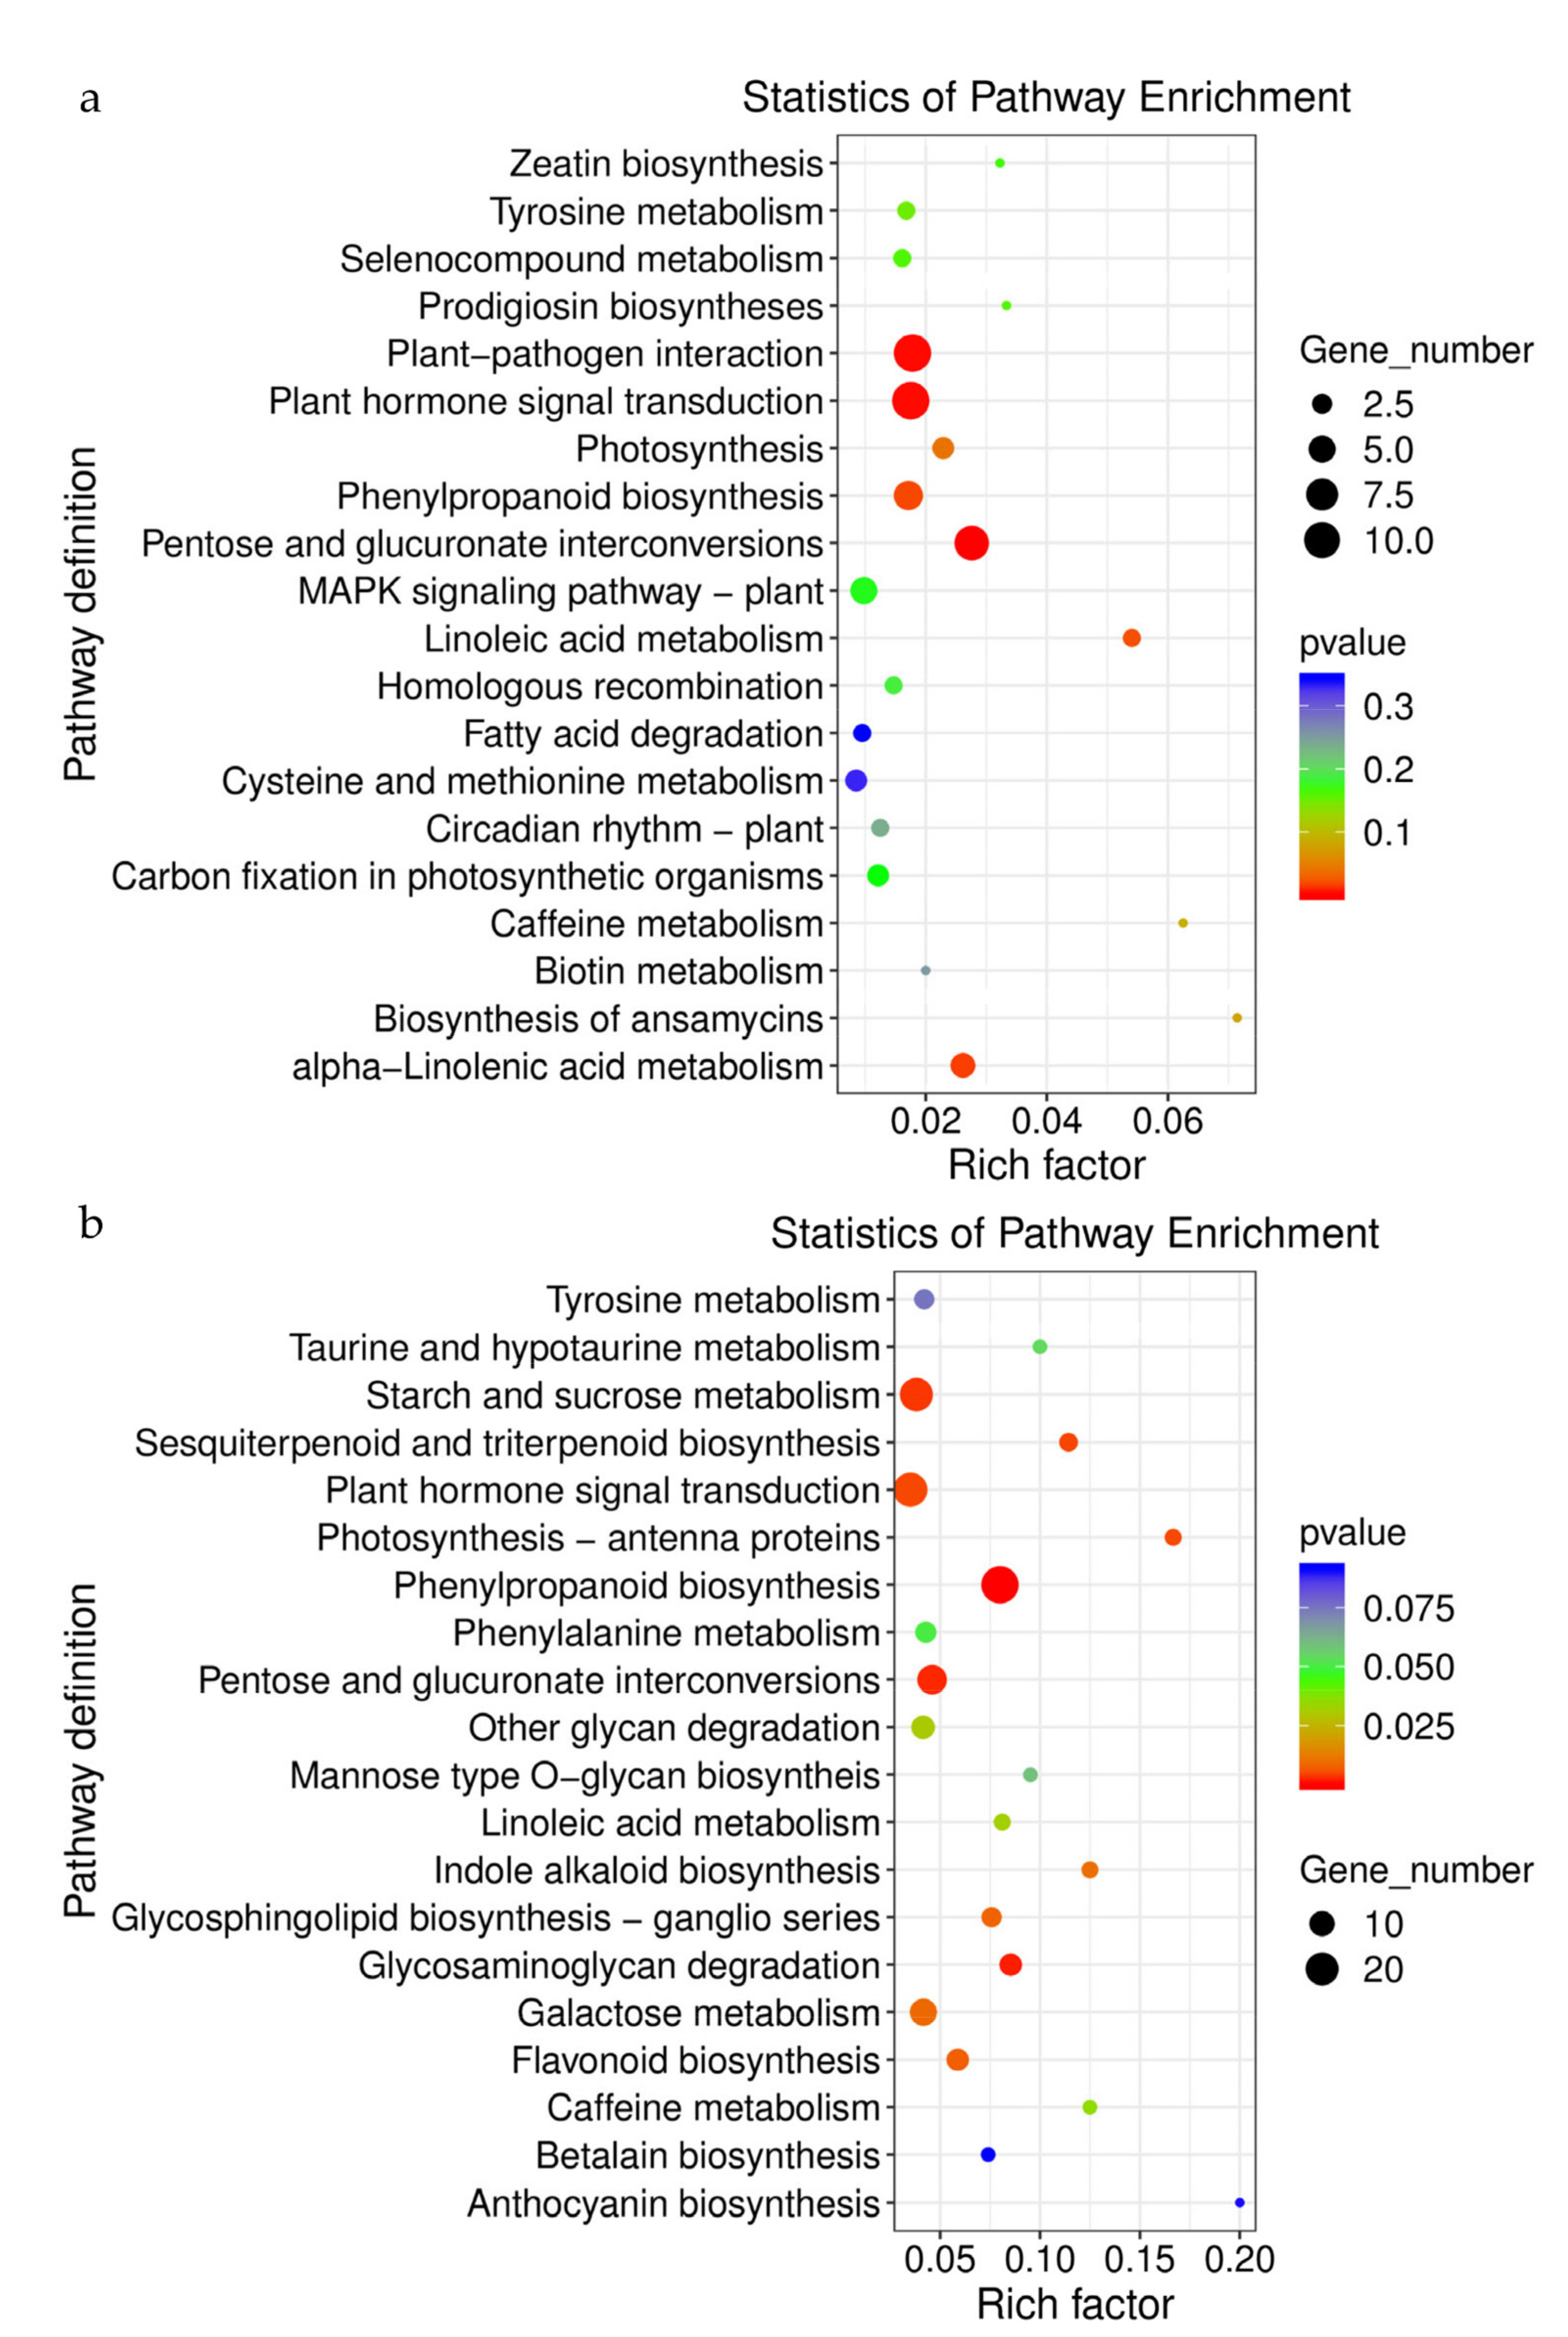
3.4. GO and KEGG Enrichment Analysis

To identify the major biological processes that are expressed under drought conditions, we performed GO enrichment analysis of DEGs at three physiological stages using a false discovery rate < 0.05 as the threshold value. Based on the GO enrichment results, the 20 most significant accessions were selected to explain the physiological changes. In roots, the terms “nucleosome”, “nucleosome assembly”, and “nucleosomal DNA binding” were enriched at day 13 and further enriched at day 27 compared with day 1, suggesting root adaptability in response to drought. At day 13, the abundantly enriched GO terms were “protein autophosphorylation”, “abscisic acid-activated signaling pathway”, “ethylene-activated signaling pathway”, “cell periphery”, and “pectinesterase inhibitor activity”, whereas the special terms “extracellular region”, “cell wall”, “response to water deprivation”, “apoplast”, “lignin biosynthetic process”, and “peroxidase activity” were enriched in the roots at day 27 (Figure 6; Supplementary Materials, File S3).
According to the KEGG pathway enrichment analysis, 191 DEGs were involved in 18 different pathways at day 1. In addition, 46 DEGs were annotated in seven different pathways at day 13 and 145 DEGs were annotated in 15 different pathways at day 27. In these root pathways, phenylpropanoid biosynthesis, alanine, aspartate, and glutamate metabolism, as well as protein processing in the endoplasmic reticulum, were enriched in the upregulated DEGs throughout all treatment periods; the enriched pathways of downregulated DEGs were pentose and glucuronate interconversions, plant hormone signal transduction, phenylpropanoid biosynthesis, linoleic acid metabolism, and caffeine metabolism. Additionally, in the roots, plant hormone signal transduction and arginine and proline metabolism were enriched in all treatments; the number of DEGs gradually increased with the increasing treatment time. Additionally, we found that plant hormone signal transduction was the most enriched pathway in root genes, revealing their important role in water deficiency (Figure 7; Supplementary Materials, File S4).

3.5. DEGs Related to Water Deprivation and Oxidative Stress

Seventeen genes identified by GO analysis responded to water deprivation, including pyrophosphate-energized vacuolar membrane proton pump (VP), late embryogenesis abundant protein (LEA), and alcohol dehydrogenase 1 (ADH). With the prolongation of drought time, the expression of the VP gene (TRINITY_DN60175_c1_g5) increased gradually (3.89-fold at day 13 and 4.99-fold at day 27 compared with that on day 1), while the expression of ADH (TRINITY_DN50206_c1_g1) decreased slowly (−3.95-fold at day 13 and −6.45-fold at day 27 compared with that on day 1). Interestingly, LEA (TRINITY_DN56480_c0_g6) was upregulated (3.37-fold at day 27 compared with day 1), while its expression at day 13 was not significantly upregulated (p > 0.05).
Several antioxidant genes, such as those encoding thioredoxin (3 genes) and POD (8 genes), were also identified. Compared with day 1, one thioredoxin gene (TRINITY_DN55997_c1_g2) was upregulated 2.78-fold and the others were downregulated. Similar to the thioredoxin gene, all POD genes were predicted to be downregulated; this was the case, with one notable exception, POD gene (TRINITY_DN51139_c0_g5), which was upregulated 4.85-fold at day 13 (Figure 8a). These results suggest that different genes encoding for the same protein may play different roles in plants.

3.6. Expression of Genes Involved in Metabolism and Biosynthesis

Several metabolic and biosynthetic processes were activated under drought conditions, such as the “starch and sucrose metabolism” pathway (map00500) and “secondary metabolite biosynthetic pathway” (GO:0044550). Many genes involved in the starch synthase process were upregulated; ISA3 (TRINITY_DN47349_c4_g2) was upregulated 4.23-fold at 27 d. More genes at 13 d were upregulated than at 27 d, but the fold change of DEGs was greater at 27 d. In addition, genes encoding endoglucanase, glucan endo-1,3-beta-glucosidase, and plasmodesmata callose-binding protein were downregulated at 13 and 27 d (Figure 8b).
Many DEGs were associated with secondary metabolism. GO and KEGG enrichment identified 74 DEGs involved in secondary metabolism (Supplementary Materials, File S4). Among these, the transcription levels of 41 genes related to phenylpropanoid biosynthesis pathways were affected by drought stress (Figure 8c).

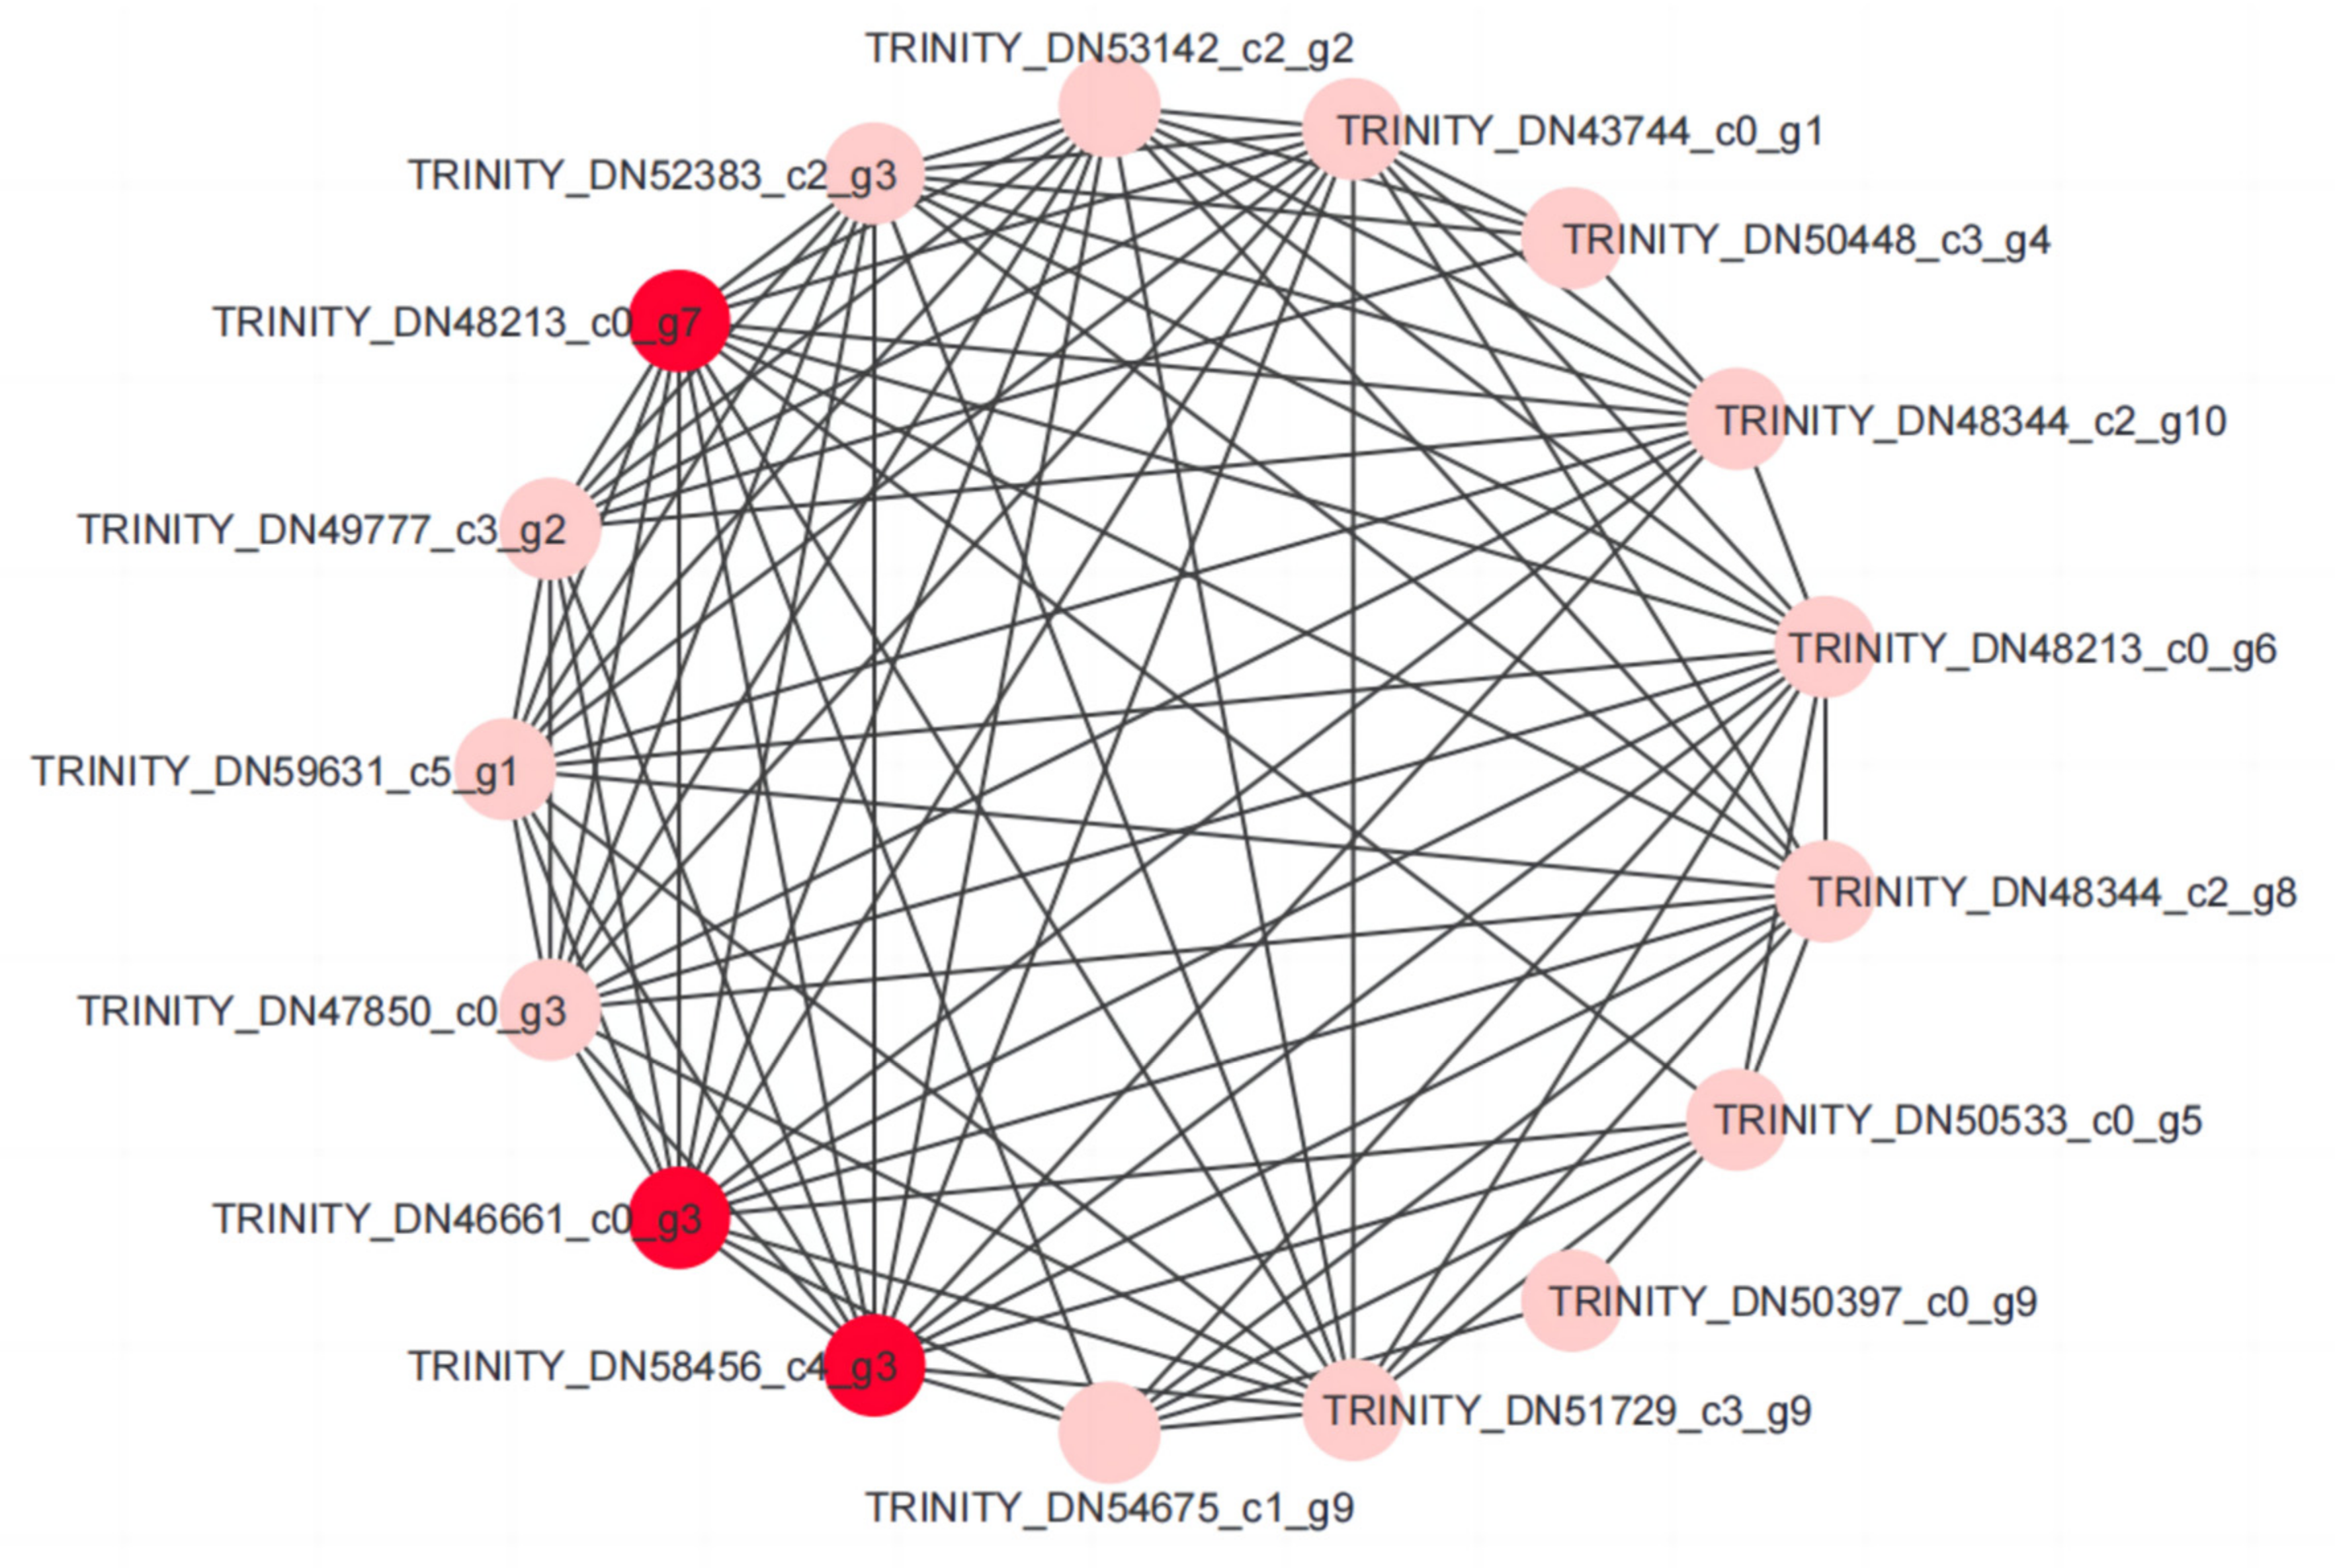
3.7. Transcription Factors Responding to Drought Stress

We identified 27 TFs, comprising WRKY (8), NAC (5), MYB (5), bZIP (1), bHLH (4), and ERF (4). On day 13 versus day 1 and day 27 versus day 1, 7 and 24 TFs were identified, respectively. Interestingly, the number of downregulated genes was greater than that of upregulated genes; only one gene was upregulated (TRINITY_DN51815_c1_g2) at 13 d and two genes were upregulated (TRINITY_DN55244_c3_g4 and TRINITY_DN56567_c2_g8) at 27 d compared with day 1 of the experiment. In addition, the four TFs of the WRKY family (TRINITY_DN48213_c0_g7, TRINITY_DN48213_c0_g6, TRINITY_DN57059_c0_g14, and TRINITY_DN52383_c2_g3) were differentially expressed in both 13 d versus 1 d and 27 d versus 1 d; these transcripts were possibly related to drought tolerance (Figure 8d; Supplementary Materials, File S5).

4. Discussion

Plant responses to drought are complex. The plant root system absorbs water from soil and is the first organ to perceive a decrease in soil water potential, triggering complex water stress response mechanisms to alleviate water stress. To cope with drought, plants increase the activity of protective enzymes such as POD, accumulate solutes to adjust the osmotic potential in cells, and elevate secondary metabolites; however, the understanding of drought resistance of I. domestica is incomplete. In this study, we analyzed the characteristic I. domestica response to drought at the physiological level and used transcriptome sequencing to analyze the molecular basis of the response.
The drying rate, as the ratio of DW to FW, is directly proportional to the economic value of the I. domestica crop. The drying rate of roots increases under drought conditions. In our study, the drying rate of the roots increased as drought conditions progressed, which has been attributed to the capacity of the roots with larger biomass to absorb soil moisture [32]. Plants produce a large quantity of reactive oxygen species (ROS) under adverse conditions (such as drought), which leads to oxidative stress [33]. Plants possess antioxidant enzymes and systems, such as POD enzymes, that eliminate ROS [34]. The relatively high POD activity throughout the drought experiment and the significantly higher levels at day 6 than at day 1 (p < 0.01) corroborated the role of POD in ROS scavenging and cell membrane structure protection in I. domestica. Consistent with POD enzyme activities, the genes encoding POD were induced by drought. These results were in accordance with those reported by Yang et al. [35]. In addition, secondary polyphenol metabolites in plants can also scavenge ROS [36,37,38,39]. Drought stress increases the content of isoflavones such as tectoridin, which may be related to the removal of ROS in I. domestica [40,41]. Drought is not conducive to the accumulation of other isoflavones, which may be because of isoflavone transformation or their transport across tissues [42]. We identified genes related to the biosynthesis of phenylpropanoid, which often contains polyphenolic structures [43].
To gain a deeper understanding of the drought resistance of I. domestica, we performed mRNA sequencing. First, we validated our transcriptome results using qRT-PCR technology, with the correlation coefficient for day 13 versus day 1 (R2 = 0.77) and day 27 versus day 1 (R2 = 0.63). The correlation was not very high, which may be due to differences in experimental principles and techniques. We found similarities with other studies, in which the correlation coefficients were 0.80 and 0.83 for Epichloë gansuensis and Arachis hypogaea L., respectively, suggesting that our sequencing results were relatively reliable for further information mining. Additionally, we identified several genes related to water deprivation and oxidative stress. Vacuolar proton pyrophosphatases play important roles in drought resistance. The VP gene from Ammopiptanthus nanus was strongly induced by dehydration [44] and its ectopic expression significantly enhanced the drought tolerance of transgenic maize [16]. Transformation of the Arabidopsis VP gene conferred strong drought tolerance in alfalfa [45]. Taken together, these results indicate that VP is involved in plant resistance to drought. Another gene, LEA, was significantly upregulated in I. domestica, and similar observations were reported for Phaseolus vulgaris [46] and Lepidium apetalum [47]. Transcriptional regulation of plant stress resistance genes is an important approach by which plants cope with unfavorable external environments [48,49].
Transcription factors can specifically combine with the cis-acting elements of the target genes to regulate downstream stress resistance genes. Currently, TF families, including bHLH, WRKY, NAC, MYB, ERF, and bZIP families, are well known for their role in plant stress tolerance [50]. Following the GO and KEGG enrichment analyses, protein–protein interaction analysis of DEGs and TFs was performed to identify the key genes involved in the drought tolerance of I. domestica. These structural genes may be regulated by WRKY51 TF (TRINITY_DN48213_c0_g7). This TF family is reportedly involved in the plant response to abiotic stress; Wang et al. (2013) confirmed that the expression of WRKY51 was upregulated by drought stress [51]. Therefore, WRKY51 may play an important role in the I. domestica drought response. In addition, glucan endo-1,3-beta-glucosidase (TRINITY_DN46661_c0_g3) and CYP81B57 (TRINITY_DN58456_c4_g3) may contribute to drought tolerance in this species (Figure 9).

5. Conclusions

In this study, we investigated the physiological changes and performed a transcription analysis of I. domestica roots in response to persistent drought by naturally reducing the soil water content. A total of 1230 DEGs were established in the root samples during the drought period. GO and KEGG enrichment analysis results showed that these DEGs mainly involve water deprivation, oxidative stress, metabolism, biosynthesis, and TFs responding to drought stress. Further analyses of the DEGs and TFs revealed that WRKY51 (TRINITY_DN48213_c0_g7), glucan endo-1,3-beta-glucosidase (TRINITY_DN46661_c0_g3), and CYP81B57 (TRINITY_DN58456_c4_g3) were hub genes involved in the drought stress response of I. domestica. Although these functional genes were successfully screened in this study, their gene function was not verified. Therefore, future studies should focus on the function of these genes under drought conditions. Overall, this study provides basic data for identifying drought response mechanisms in I. domestica.

Supplementary Materials

The following supporting information can be downloaded at https://www.mdpi.com/article/10.3390/horticulturae8121162/s1, File S1: Primer information for qRT-PCR. File S2: Clean data and assembly stats for Iris domestica. File S3: GO enrichment of DEGs under different stages of drought stress. File S4: KEGG enrichment of DEGs at different stages of drought stress. File S5: Transcription factor families.

Author Contributions

Conceptualization, Z.L., C.L., M.H. and L.Y.; Formal analysis, Q.A.; Funding acquisition, M.H. and L.Y.; Investigation, Q.A., Y.S. and A.D.; Visualization, Q.A.; Writing-original draft, Q.A.; Writing-review and editing, C.L. All authors have read and agreed to the published version of the manuscript.

Funding

This research was funded by the Modern Agricultural Industrial Technology System Project (CARS-21) and the Science and Technology Development Plan Project of Jilin Province (20210204184YY).

Data Availability Statement

The datasets for this study are available in this manuscript and the Supplementary Materials.

Acknowledgments

We would like to thank Meng Zhang, and Ping Di for assisting in completing the experiment.

Conflicts of Interest

The authors declare no conflict of interest.

References

  1. Kleinwächter, M.; Selmar, D. Influencing the product quality by applying drought stress during the cultivation of medicinal plants. In Physiological Mechanisms and Adaptation Strategies in Plants under Changing Environment; Springer: Berlin/Heidelberg, Germany, 2014; pp. 57–73. [Google Scholar]
  2. Yang, X.; Lu, M.; Wang, Y.; Wang, Y.; Liu, Z.; Chen, S. Response mechanism of plants to drought stress. Horticulturae 2021, 7, 50. [Google Scholar] [CrossRef]
  3. Pant, P.; Pandey, S.; Dall’Acqua, S. The influence of environmental conditions on secondary metabolites in medicinal plants: A literature review. Chem. Biodivers. 2021, 18, e2100345. [Google Scholar] [CrossRef] [PubMed]
  4. Banks, J.M.; Percival, G.C.; Rose, G. Variations in seasonal drought tolerance rankings. Trees 2019, 33, 1063–1072. [Google Scholar] [CrossRef] [Green Version]
  5. Luo, L.; Xia, H.; Lu, B. Crop breeding for drought resistance. Front. Plant Sci. 2019, 10, 314. [Google Scholar] [CrossRef]
  6. Li, P.; Zhu, Y.; Song, X.; Song, F. Negative effects of long-term moderate salinity and short-term drought stress on the photosynthetic performance of Hybrid Pennisetum. Plant Physiol. Biochem. 2020, 155, 93–104. [Google Scholar] [CrossRef]
  7. Ors, S.; Ekinci, M.; Yildirim, E.; Sahin, U.; Turan, M.; Dursun, A. Interactive effects of salinity and drought stress on photosynthetic characteristics and physiology of tomato (Lycopersicon esculentum L.) seedlings. S. Afr. J. Bot. 2021, 137, 335–339. [Google Scholar] [CrossRef]
  8. Widuri, L.I.; Lakitan, B.; Sakagami, J.; Yabuta, S.; Kartika, K.; Siaga, E. Short-term drought exposure decelerated growth and photosynthetic activities in chili pepper (Capsicum annuum L.). Ann. Agric. Sci. 2020, 65, 149–158. [Google Scholar] [CrossRef]
  9. Shinozaki, K.; Yamaguchi-Shinozaki, K. Gene networks involved in drought stress response and tolerance. J. Exp. Bot. 2006, 58, 221–227. [Google Scholar] [CrossRef] [Green Version]
  10. Cheng, L.; Han, M.; Yang, L.; Li, Y.; Sun, Z.; Zhang, T. Changes in the physiological characteristics and baicalin biosynthesis metabolism of Scutellaria baicalensis Georgi under drought stress. Ind. Crop. Prod. 2018, 122, 473–482. [Google Scholar] [CrossRef]
  11. Bozin, B.; Mimica-Dukic, N.; Samojlik, I.; Goran, A.; Igic, R. Phenolics as antioxidants in garlic (Allium sativum L., Alliaceae). Food Chem. 2008, 111, 925–929. [Google Scholar] [CrossRef]
  12. Mittler, R.; Zilinskas, B.A. Regulation of pea cytosolic ascorbate peroxidase and other antioxidant enzymes during the progression of drought stress and following recovery from drought. Plant J. 1994, 5, 397–405. [Google Scholar] [CrossRef] [PubMed]
  13. Yang, L.; Yang, L.; Yang, X.; Zhang, T.; Lan, Y.; Zhao, Y.; Han, M.; Yang, L. Drought stress induces biosynthesis of flavonoids in leaves and saikosaponins in roots of Bupleurum chinense DC. Phytochemistry 2020, 177, 112434. [Google Scholar] [CrossRef] [PubMed]
  14. Noble, A.J.; Weon, S.Y. Effect of progressive drought stress on physio-biochemical responses and gene expression patterns in wheat. 3 Biotech 2021, 11, 440. [Google Scholar]
  15. He, C.; Du, Y.; Fu, J.; Zeng, E.; Park, S.; White, F.; Zheng, J.; Liu, S. Early Drought-Responsive genes are variable and relevant to drought tolerance. G3 2020, 10, 1657–1670. [Google Scholar] [CrossRef] [PubMed] [Green Version]
  16. Yu, H.; Qu, J.; Guo, X.; Li, L.; Zhang, X.; Yang, Q.; Lu, Y.; Li, W.; Fu, F. Overexpression of vacuolar H+-pyrophosphatase (H+-PPase) gene from Ammopiptanthus nanus enhances drought tolerance in maize. J. Agron. Crop Sci. 2021, 208, 633–644. [Google Scholar] [CrossRef]
  17. Wei, T.; Wang, Y.; Xie, Z.; Guo, D.; Chen, C.; Fan, Q.; Deng, X.; Liu, J.H. Enhanced ROS scavenging and sugar accumulation contribute to drought tolerance of naturally occurring autotetraploids in Poncirus trifoliata. Plant Biotechnol. J. 2019, 17, 1394–1407. [Google Scholar] [CrossRef] [Green Version]
  18. Aduse Poku, S.; Nkachukwu Chukwurah, P.; Aung, H.H.; Nakamura, I. Over-expression of a melon Y3SK2-type LEA gene confers drought and salt tolerance in transgenic tobacco plants. Plants 2020, 9, 1749. [Google Scholar] [CrossRef]
  19. Hussain, S.S.; Kayani, M.A.; Amjad, M. Transcription factors as tools to engineer enhanced drought stress tolerance in plants. Biotechnol. Progr. 2011, 27, 297–306. [Google Scholar] [CrossRef]
  20. Joshi, R.; Wani, S.H.; Singh, B.; Bohra, A.; Dar, Z.A.; Lone, A.A.; Pareek, A.; Singla-Pareek, S.L. Transcription factors and plants response to drought stress: Current understanding and future directions. Front. Plant Sci. 2016, 7, 1029. [Google Scholar] [CrossRef] [Green Version]
  21. Liu, H.; Shi, J.; Wu, M.; Xu, D. The application and future prospect of RNA-Seq technology in Chinese medicinal plants. J. Appl. Res. Med. Aromat. Plants 2021, 24, 100318. [Google Scholar] [CrossRef]
  22. Anderson, N.O. Breeding for dwarf, winter-hardy Iris domestica, blackberry lily (Iridaceae). Acta Hortic 2018, 1263, 275–282. [Google Scholar] [CrossRef]
  23. Yang, X.; Guo, S.; Feng, M.; Lai, X.; Shang, J. Effects of drought stress and re-watering on the characteristics of photosynthesis and chlorophyll fluorescence of blackberry lily. Acta Agric. Univ. Jiangxiensis 2018, 40, 525–532. [Google Scholar]
  24. Zhu, Y.; Pu, B.Q.; Xie, G.Y.; Tian, M.; Xu, F.Y.; Qin, M.J. Dynamic changes of flavonoids contents in the different parts of rhizome of Belamcanda chinensis during the thermal drying process. Molecules 2014, 19, 10440–10454. [Google Scholar] [CrossRef] [Green Version]
  25. Grabherr, M.G.; Haas, B.J.; Yassour, M.; Levin, J.Z.; Thompson, D.A.; Amit, I.; Adiconis, X.; Fan, L.; Raychowdhury, R.; Zeng, Q. Full-length transcriptome assembly from RNA-Seq data without a reference genome. Nat. Biotechnol. 2011, 29, 644–652. [Google Scholar] [CrossRef] [PubMed] [Green Version]
  26. Buchfink, B.; Xie, C.; Huson, D.H. Fast and sensitive protein alignment using DIAMOND. Nat. Methods 2015, 12, 59–60. [Google Scholar] [CrossRef] [PubMed]
  27. Patro, R.; Duggal, G.; Love, M.I.; Irizarry, R.A.; Kingsford, C. Salmon provides fast and bias-aware quantification of transcript expression. Nat. Methods 2017, 14, 417–419. [Google Scholar] [CrossRef] [PubMed] [Green Version]
  28. Robinson, M.D.; Mccarthy, D.J.; Smyth, G.K. EdgeR: A Bioconductor package for differential expression analysis of digital gene expression data. Bioinformatics 2010, 26, 139–140. [Google Scholar] [CrossRef] [Green Version]
  29. Livak, K.J.; Schmittgen, T.D. Analysis of relative gene expression data using real-time quantitative PCR and the 2−ΔΔCT Method. Methods 2001, 25, 402–408. [Google Scholar] [CrossRef]
  30. Bertini, L.; Proietti, S.; Focaracci, F.; Canini, F.; Bravo, L.A.; Rabert, C.; Caruso, C. Identification and validation of new reference genes for accurate quantitative reverse transcriptase-PCR normalization in the Antarctic plant Colobanthus quitensis under abiotic stress conditions. Polar Biol. 2021, 44, 389–405. [Google Scholar] [CrossRef]
  31. Ai, Q.; Liu, C.; Han, M.; Yang, L. Selection and Verification of Reference Genes for qRT-PCR Analysis in Iris domestica under Drought. Phyton-Int. J. Exp. Bot. 2022, 91, 2537–2548. [Google Scholar] [CrossRef]
  32. Zlatev, Z.; Lidon, F.C. An overview on drought induced changes in plant growth, water relations and photosynthesis. Emir. J. Food Agric. 2012, 24, 57. [Google Scholar]
  33. Wang, S.; Liang, D.; Li, C.; Hao, Y.; Ma, F.; Shu, H. Influence of drought stress on the cellular ultrastructure and antioxidant system in leaves of drought-tolerant and drought-sensitive apple rootstocks. Plant Physiol. Biochem. 2012, 51, 81–89. [Google Scholar] [CrossRef]
  34. Terzi, R.A.A.K. Drought stress tolerance and the antioxidant enzyme system. Acta Biol. Cracov. Bot. 2006, 48, 89–96. [Google Scholar]
  35. Yang, L.; Zhao, Y.; Zhang, Q.; Cheng, L.; Han, M.; Ren, Y.; Yang, L. Effects of drought-re-watering-drought on the photosynthesis physiology and secondary metabolite production of Bupleurum chinense DC. Plant Cell Rep. 2019, 38, 1181–1197. [Google Scholar] [CrossRef]
  36. Huang, L.Q.; Guo, L.P. Secondary metabolites accumulating and geoherbs formation under enviromental stress. China J. Chin. Mater. Med. 2007, 32, 277–280. [Google Scholar]
  37. Al-Gabbiesh, A.; Selmar, D.; Kleinwächter, M. Influencing the contents of secondary metabolites in spice and medicinal plants by deliberately applying drought stress during their cultivation. Jordan J. Biol. Sci. 2015, 8, 1–10. [Google Scholar] [CrossRef] [Green Version]
  38. Gao, S.; Wang, Y.; Yu, S.; Huang, Y.; Liu, H.; Chen, W.; He, X. Effects of drought stress on growth, physiology and secondary metabolites of Two Adonis species in Northeast China. Sci. Hortic.-Amst. 2020, 259, 108795. [Google Scholar] [CrossRef]
  39. Xin, J.; Sun, C.; Li, G.; Li, G.; Chen, G. Effects of progressive drought stress on the physiology, antioxidative enzymes and secondary metabolites of Radix Astragali. Acta Physiol. Plant. 2015, 37, 262. [Google Scholar]
  40. Qin, M.J.; Liang, J.W.; Liu, J.; Zhao, J.; Dian, Y.G. Scavenging effects on radicals of isoflavones from rhizome of Belamcandae Chinensis. Chin. Tradit. Herb. Drugs 2003, 34, 640–641. [Google Scholar]
  41. Xie, G.Y.; Zhu, Y.; Shu, P.; Qin, X.Y.; Wu, G.; Wang, Q.; Qin, M.J. Phenolic metabolite profiles and antioxidants assay of three Iridaceae medicinal plants for traditional Chinese medicine “She-gan” by on-line HPLC–DAD coupled with chemiluminescence (CL) and ESI-Q-TOF-MS/MS. J. Pharmaceut. Biomed. 2014, 98, 40–51. [Google Scholar] [CrossRef]
  42. Zhang, X.; Zhu, Y.; Ye, J.; Ye, Z.; Zhu, R.; Xie, G.; Zhao, Y.; Qin, M. Iris domestica (iso) flavone 7-and 3′-O-Glycosyltransferases Can be Induced by CuCl2. Front. Plant Sci. 2021, 12, 107. [Google Scholar] [CrossRef] [PubMed]
  43. Tsuchiya, H. Anesthetic agents of plant origin: A review of phytochemicals with anesthetic activity. Molecules 2017, 22, 1369. [Google Scholar] [CrossRef] [PubMed] [Green Version]
  44. Yu, H.Q.; Han, N.; Zhang, Y.Y.; Tao, Y.; Chen, L.; Liu, Y.P.; Zhou, S.F.; Fu, F.L.; Li, W.C. Cloning and characterization of vacuolar H+-pyrophosphatase gene (AnVP1) from Ammopiptanthus nanus and its heterologous expression enhances osmotic tolerance in yeast and Arabidopsis thaliana. Plant Growth Regul. 2017, 81, 385–397. [Google Scholar] [CrossRef]
  45. Su, J.H.; Bai, T.H.; Wang, F.; Bao, A.K. Overexpression of Arabidopsis H+-pyrophosphatase improves the growth of alfalfa under long-term salinity, drought conditions and phosphate deficiency. Czech J. Genet. Plant 2019, 55, 156–161. [Google Scholar] [CrossRef]
  46. Colmenero-Flores, J.M.; Campos, F.; Garciarrubio, A.; Covarrubias, A.A. Characterization of Phaseolus vulgaris cDNA clones responsive to water deficit: Identification of a novel late embryogenesis abundant-like protein. Plant Mol. Biol. 1997, 35, 393–405. [Google Scholar] [CrossRef] [PubMed]
  47. Yang, Q.L.; Lu, H.; Zhou, Q.; Xie, H.T.; Li, J.Y.; Chen, Z.Y.; Han, S.C.; Zhao, H.P.; Zhao, H.X. Analysis of LEA protein family members in Lepidium apetalum seeds and the expression of LaLEA1 in seedlings in response to abiotic stresses. Biol. Plant. 2020, 64, 211–219. [Google Scholar] [CrossRef] [Green Version]
  48. Chen, W.; Yao, Q.; Patil, G.B.; Agarwal, G.; Deshmukh, R.K.; Lin, L.; Wang, B.; Wang, Y.; Prince, S.J.; Song, L.; et al. Identification and comparative analysis of differential gene expression in soybean leaf tissue under drought and flooding stress revealed by RNA-Seq. Front. Plant Sci. 2016, 7, 1044. [Google Scholar] [CrossRef]
  49. Jin, J.; Zhang, H.; Kong, L.; Gao, G.; Luo, J. PlantTFDB 3.0: A portal for the functional and evolutionary study of plant transcription factors. Nucleic Acids Res. 2014, 42, D1182–D1187. [Google Scholar] [CrossRef] [Green Version]
  50. Zhu, Y.; Liu, Q.; Xu, W.; Zhang, J.; Wang, X.; Nie, G.; Yao, L.; Wang, H.; Lin, C. De novo assembly and discovery of genes that involved in drought tolerance in the common vetch. Int. J. Mol. Sci. 2019, 20, 328. [Google Scholar] [CrossRef]
  51. Wang, R.; Wu, H.; Zhang, M.; Ni, Z.; Sun, Q. Cloning, characterization and transgenic function analysis of wheat (Triticum aestivum L.) TaWRKY51 gene. J. Agric. Biotechnol. 2013, 21, 1019–1027. [Google Scholar]
Figure 1. Changes in soil moisture under persistent drought. Red, pink, green, and blue squares represent 0 d, 6 d, 13 d, and 27 d samples, respectively.
Horticulturae 08 01162 g001
Figure 2. Drying rate (the ratio of dry weight to fresh weight) (a), isoflavone contents (b), POD activities (c), and Proline (d) of roots in I. domestica (* indicates a significant correlation at the 0.05 level, ** indicates a significant correlation at the 0.01 level).
Horticulturae 08 01162 g002
Figure 3. Unigenes annotated in different databases (a) and distributed into different species (b).
Horticulturae 08 01162 g003
Figure 4. Correlation between RNA-seq and qRT-PCR results of samples collected at days 13 (a) and 27 (b). X-axis denoted Log2 (the ratio of qRT-PCR) using the method 2−ΔΔCt to calculate the relative expression level. Y-axis represented the TPM values in RNA-Seq data. Each square in the figure (a,b) represents the amount of gene expression.
Horticulturae 08 01162 g004
Figure 5. Histogram (a) and Venn diagram (b) of differentially expressed genes.
Horticulturae 08 01162 g005
Figure 6. GO analysis of differential gene: 13 d vs. 1 d (a) and 27 d vs. 1 d (b).
Horticulturae 08 01162 g006
Figure 7. KEGG enrichment of differential gene: 13 d vs. 1 d (a) and 27 d vs. 1 d (b).
Horticulturae 08 01162 g007
Figure 8. Heatmap diagram of differentially expressed genes (DEGs): peroxide and thioredoxin (a); glucose metabolism (b); secondary metabolites (c); transcription factors (d).
Horticulturae 08 01162 g008
Figure 9. Construction of protein–protein interaction network model of drought-tolerant candidate genes in I. domestica by Cytoscape software. The red circles are hub genes.
Horticulturae 08 01162 g009
Publisher’s Note: MDPI stays neutral with regard to jurisdictional claims in published maps and institutional affiliations.

