Article

Research on Real-Time Automatic Picking of Ground-Penetrating Radar Image Features by Using Machine Learning

1
School of Electrical and Mechanical Engineering, Lingnan Normal University, Zhanjiang 524048, China
2
College of Engineering, South China Agricultural University, Guangzhou 510642, China
*
Author to whom correspondence should be addressed.
Horticulturae 2022, 8(12), 1116; https://doi.org/10.3390/horticulturae8121116
Submission received: 4 November 2022 / Revised: 22 November 2022 / Accepted: 24 November 2022 / Published: 28 November 2022
(This article belongs to the Special Issue Application of Smart Technology and Equipment in Horticulture)

Abstract

:
Hard foreign objects such as bricks, wood, metal materials, and plastics in orchard soil can affect the operational safety of garden machinery. Ground-Penetrating Radar (GPR) is widely used for the detection of hard foreign objects in soil due to its advantages of non-destructive detection (NDT), easy portability, and high efficiency. At present, the degree of automatic identification applied in soil-oriented foreign object detection based on GPR falls short of the industry’s expectations. To further enhance the accuracy and efficiency of soil-oriented foreign object detection, we combined GPR and intelligent technology to conduct research on three aspects: acquiring real-time GPR images, using the YOLOv5 algorithm for real-time target detection and the coordinate positioning of GPR images, and the construction of a detection system based on ground-penetrating radar and the YOLOv5 algorithm that automatically detects target characteristic curves in ground-penetrating radar images. In addition, taking five groups of test results of detecting different diameters of rebar inside the soil as an example, the obtained average error of detecting the depth of rebar using the detection system is within 0.02 m, and the error of detecting rebar along the measuring line direction from the location of the starting point of GPR detection is within 0.08 m. The experimental results show that the detection system is important for identifying and positioning foreign objects inside the soil.

1. Introduction

GPR has the advantages of a fast and simple detection process and good detection performance, and it is widely used as a tool for underground soil foreign matter detection [1,2,3], road health detection [4,5], bridge quality inspection [6], and archaeological surveys [7,8], among other areas in detection experiments.
Since GPR is often disturbed by factors such as noise and reflected waves from other materials on the ground’s surface during the detection process [9,10,11], and since raw GPR radar images rarely provide geometric information about buried target objects, these factors are not conducive to enabling researchers to judge and interpret the geometry and specific burial location of hard foreign objects in GPR images [12,13]; thus, a major component of interpreting GPR images relies on complex data processing and the professional research experience of researchers for interpretation [14]. However, when a large number of GPR data are involved and the GPR data need to be interpreted and recognized in real-time, human interpretation of GPR data may have reduced recognition efficiency and be prone to misclassification and omission [15], so it is important to explore a method to automate the detection of underground foreign objects. Therefore, it is necessary to explore a method with which to automate the detection of targets in practical engineering applications [16]. Some researchers have proposed the use of neural networks to automatically detect and identify the features of targets detected in GPR images, which are specifically parabolic in shape [17], and to discriminate the presence of foreign bodies within the soil shown in the images by means of deep-learning algorithms so as to identify the target features in GPR images [18]. Li et al. [19] demonstrated desirable detection results in a detection task involving 2D GPR image data using a deep-learning network framework.
In the last decade, some researchers have started to use deep-learning methods to automatically identify feature parts in GPR images [20,21,22,23], especially in the field of using machine learning methods to automatically identify the characteristic curves of reinforcements in ground-penetrating radar images [24,25,26]. Comparing several deep-learning neural network frameworks, the algorithm based on the YOLO series neural network framework is faster in terms of detection, and Li implemented the YOLOv3 algorithm for the real-time pattern recognition of GPR images using the TensorFlow framework developed by Google [27]. Compared with the YOLOv3 algorithm and YOLOv4 algorithm, the YOLOv5 algorithm has also made significant progress with respect to small data sets, and the models trained using the YOLOv5 algorithm have superior robustness to better distinguish the feature parts in GPR images [28].
Therefore, in order to further improve the accuracy of the GPR systems’ detection of foreign matter in soil and the efficiency of real-time detection, in this study, a detection system based on ground-penetrating radar and the YOLOv5 algorithm that automatically detects the target characteristic curve in ground-penetrating radar images is built, and the YOLOv5 network framework is used to detect the feature curve of the GPR pictures and accurately locate the target after detection, which achieves real-time detection in GPR pictures and the accurate localization of soil-situated foreign objects in GPR pictures.

2. Materials and Methods

2.1. GPR Image Data Set Production

When the electromagnetic waves emitted from the GPR-transmitting antenna are propagated in a soil medium, the [10] electromagnetic waves will be reflected and refracted when they encounter foreign matter in soil with different electromagnetic characteristics from the soil medium. Therefore, in the GPR image, the foreign matter in soil is specifically shown as a parabolic feature. According to this target feature, we use the labelImg annotation tool to label the GPR images with the target.
Although different foreign objects are not exactly the same on the image due to their different material sizes, most of them are parabolic features with downward openings and some of them are non-parabolic features. Therefore, we use two types of labels to label parabolic features and non-parabolic features [29], and do not distinguish between them in terms of size and material used to label the target feature areas of interest in GPR images, as shown in Figure 1.
The dataset we used includes 295 GPR images with a total of 1679 tags, as shown in Figure 2. In addition, these tags will be divided into training set, validation set, and test set in the ratio of 7:2:1.

2.2. Real-Time Detection of GPR Image Targets Based on YOLOv5

Compared with other classic target detection algorithms, YOLOv5 is built on the PyTorch framework, with simpler support, easier deployment, and fewer model parameters, so it can be deployed on mobile devices, embedded devices, etc. It is the engineering version of the YOLO family of algorithms [30,31]. Since the experiment we conducted concerns fixing the GPR system on an all-terrain vehicle and performing background calculations through the upper computer, which should have good detection performance while ensuring real-time target detection, we decided to use the YOLOv5 network model. According to the size of this GPR image target detection dataset, we used the YOLOv5s network model in the sixth version of YOLOv5 release.
The basic framework of YOLOv5 version 6 can be divided into 4 parts: Input, Backbone, Neck, and Head. The Input part enriches the dataset by data augmentation to improve the robustness and generalization of the network model. The Backbone part mainly consists of Conv, C3, and SPPF modules for feature extraction. FPN + PANet is used in the Neck to aggregate the image features at that stage. The Head network performs target prediction and passes the predicted output, and its specific network structure is shown in Figure 3.

2.3. Evaluation of GPR Image Detection Model Based on YOLOv5 Algorithm

2.3.1. Evaluation Metrics of the Target Detection Algorithm

Judging the detection effectiveness of target detection algorithms usually requires evaluating some quantitative evaluation metrics so as to determine the algorithm’s merit from an objective perspective. To quantify the effectiveness of the YOLOv5 algorithm for GPR image target detection, we chose some commonly used metrics to evaluate the model, which include accuracy (P), recall (R), average precision (AP), F1 score, inference time, and model size.
These metrics are defined as follows:
P = T P F P + T P
R = T P F N + T P
A P = 0 1 P R d R
F 1 = 2 P · R P + R
where TP is the number of correctly detected targets, FP is the number of non-targets that the detector considers to be targets, and FN is the number of non-targets that the detector considers to be targets.
Generally, the precision rate (P) is the detection accuracy of the target detector at an IoU of 0.5, which is the proportion of correct targets detected by the target detector to all detected targets, the recall rate (R) is the recall rate of the target detector at an IoU of 0.5, which is the proportion of correct targets detected by the target detector to all targets in the data set. While precision and recall are mutually exclusive to some extent, i.e., high recall has lower precision and low recall has higher precision, in order to balance the indicators of recall rate and accuracy rate, we more often use average precision (AP). AP is the area of the PR curve in the range of 0–1, compared to single precision and recall, AP reflects the sum of precision at different recall rates and better expresses the detection performance of the detector.

2.3.2. Performance Comparison of Different Target Detection Algorithms in GPR Image Detection

We divided the data set processed according to Section 2.1, i.e., 295 GPR images, into training set, verification set, and test set corresponding to a ratio of 7:2:1, and trained the sets on a GPU server with a graphics card of Tesla V100 using the YOLOv5s network model in YOLOv5 version 6 mentioned in Section 2.2 with 300 epoch iterations.
We also compared other excellent target detectors such as Faster-RCNN and SSD in the same training scenario to verify that the YOLOv5 algorithm is more suitable for GPR real-time detection experiments. Due to the small number of samples of non-parabolic features, the detection results of parabolic features are quasi in this paper to compare the detection performance of each detector. The comparison results are shown in Table 1.
As can be found in Table 1, the YOLOv5 network model has a detection accuracy of 89.3%, a recall of 70.6%, an average accuracy of 80.5%, an F1 score of 0.65, an inference time of 11 ms per frame, and a model size of 13.7 MB.
For the Faster RCNN algorithm, YOLOv5 algorithm has 12.1% less recall, but a 39.4% higher detection accuracy, 9% higher average accuracy, and 0.03 higher F1 score; notably, its inference time is 43.9 ms faster, and its model size is reduced by 94.3 MB. Through data comparison, it can be seen that YOLOv5 algorithm is more suitable for the real-time requirements of GPR than the Faster RCNN algorithm.
The YOLOv5 algorithm is also 1.4 ms slower than the SSD algorithm in terms of inference time, but it also meets the real-time requirements of the GPR detection system, and the YOLOv5 algorithm has a 2.8% higher detection accuracy, 31.4% higher recall, 20.1% higher average accuracy, 0.11 higher F1 score, and, most importantly, a 77.4 MB smaller model size. The data comparison shows that the YOLOv5 algorithm is more suitable for in-vehicle system deployment than the SSD algorithm, and it presents fewer false detections and omissions.
Overall, the detection speed of our YOLOv5 algorithm meets the requirement of real-time detection and has more balanced recall and accuracy compared with classical algorithms such as Faster RCNN and SSD; therefore, we obtain better detection performance in the target detection task of GPR images, and there are fewer errors and misses, which can better meet the needs of GPR image target detection in real-time. This means that we have better detection performance in GPR image target detection tasks, and fewer false and missed detections.

2.3.3. Comparison of the Effectiveness of Different Target Detection Algorithms in GPR Image Detection

We use YOLOv5 algorithm and Faster RCNN, SSD algorithm to detect GPR images and compare their effectiveness in detecting subsurface soil-situated foreign objects, including their correct recognition rate, missed detection rate, and false detection rate. The following 
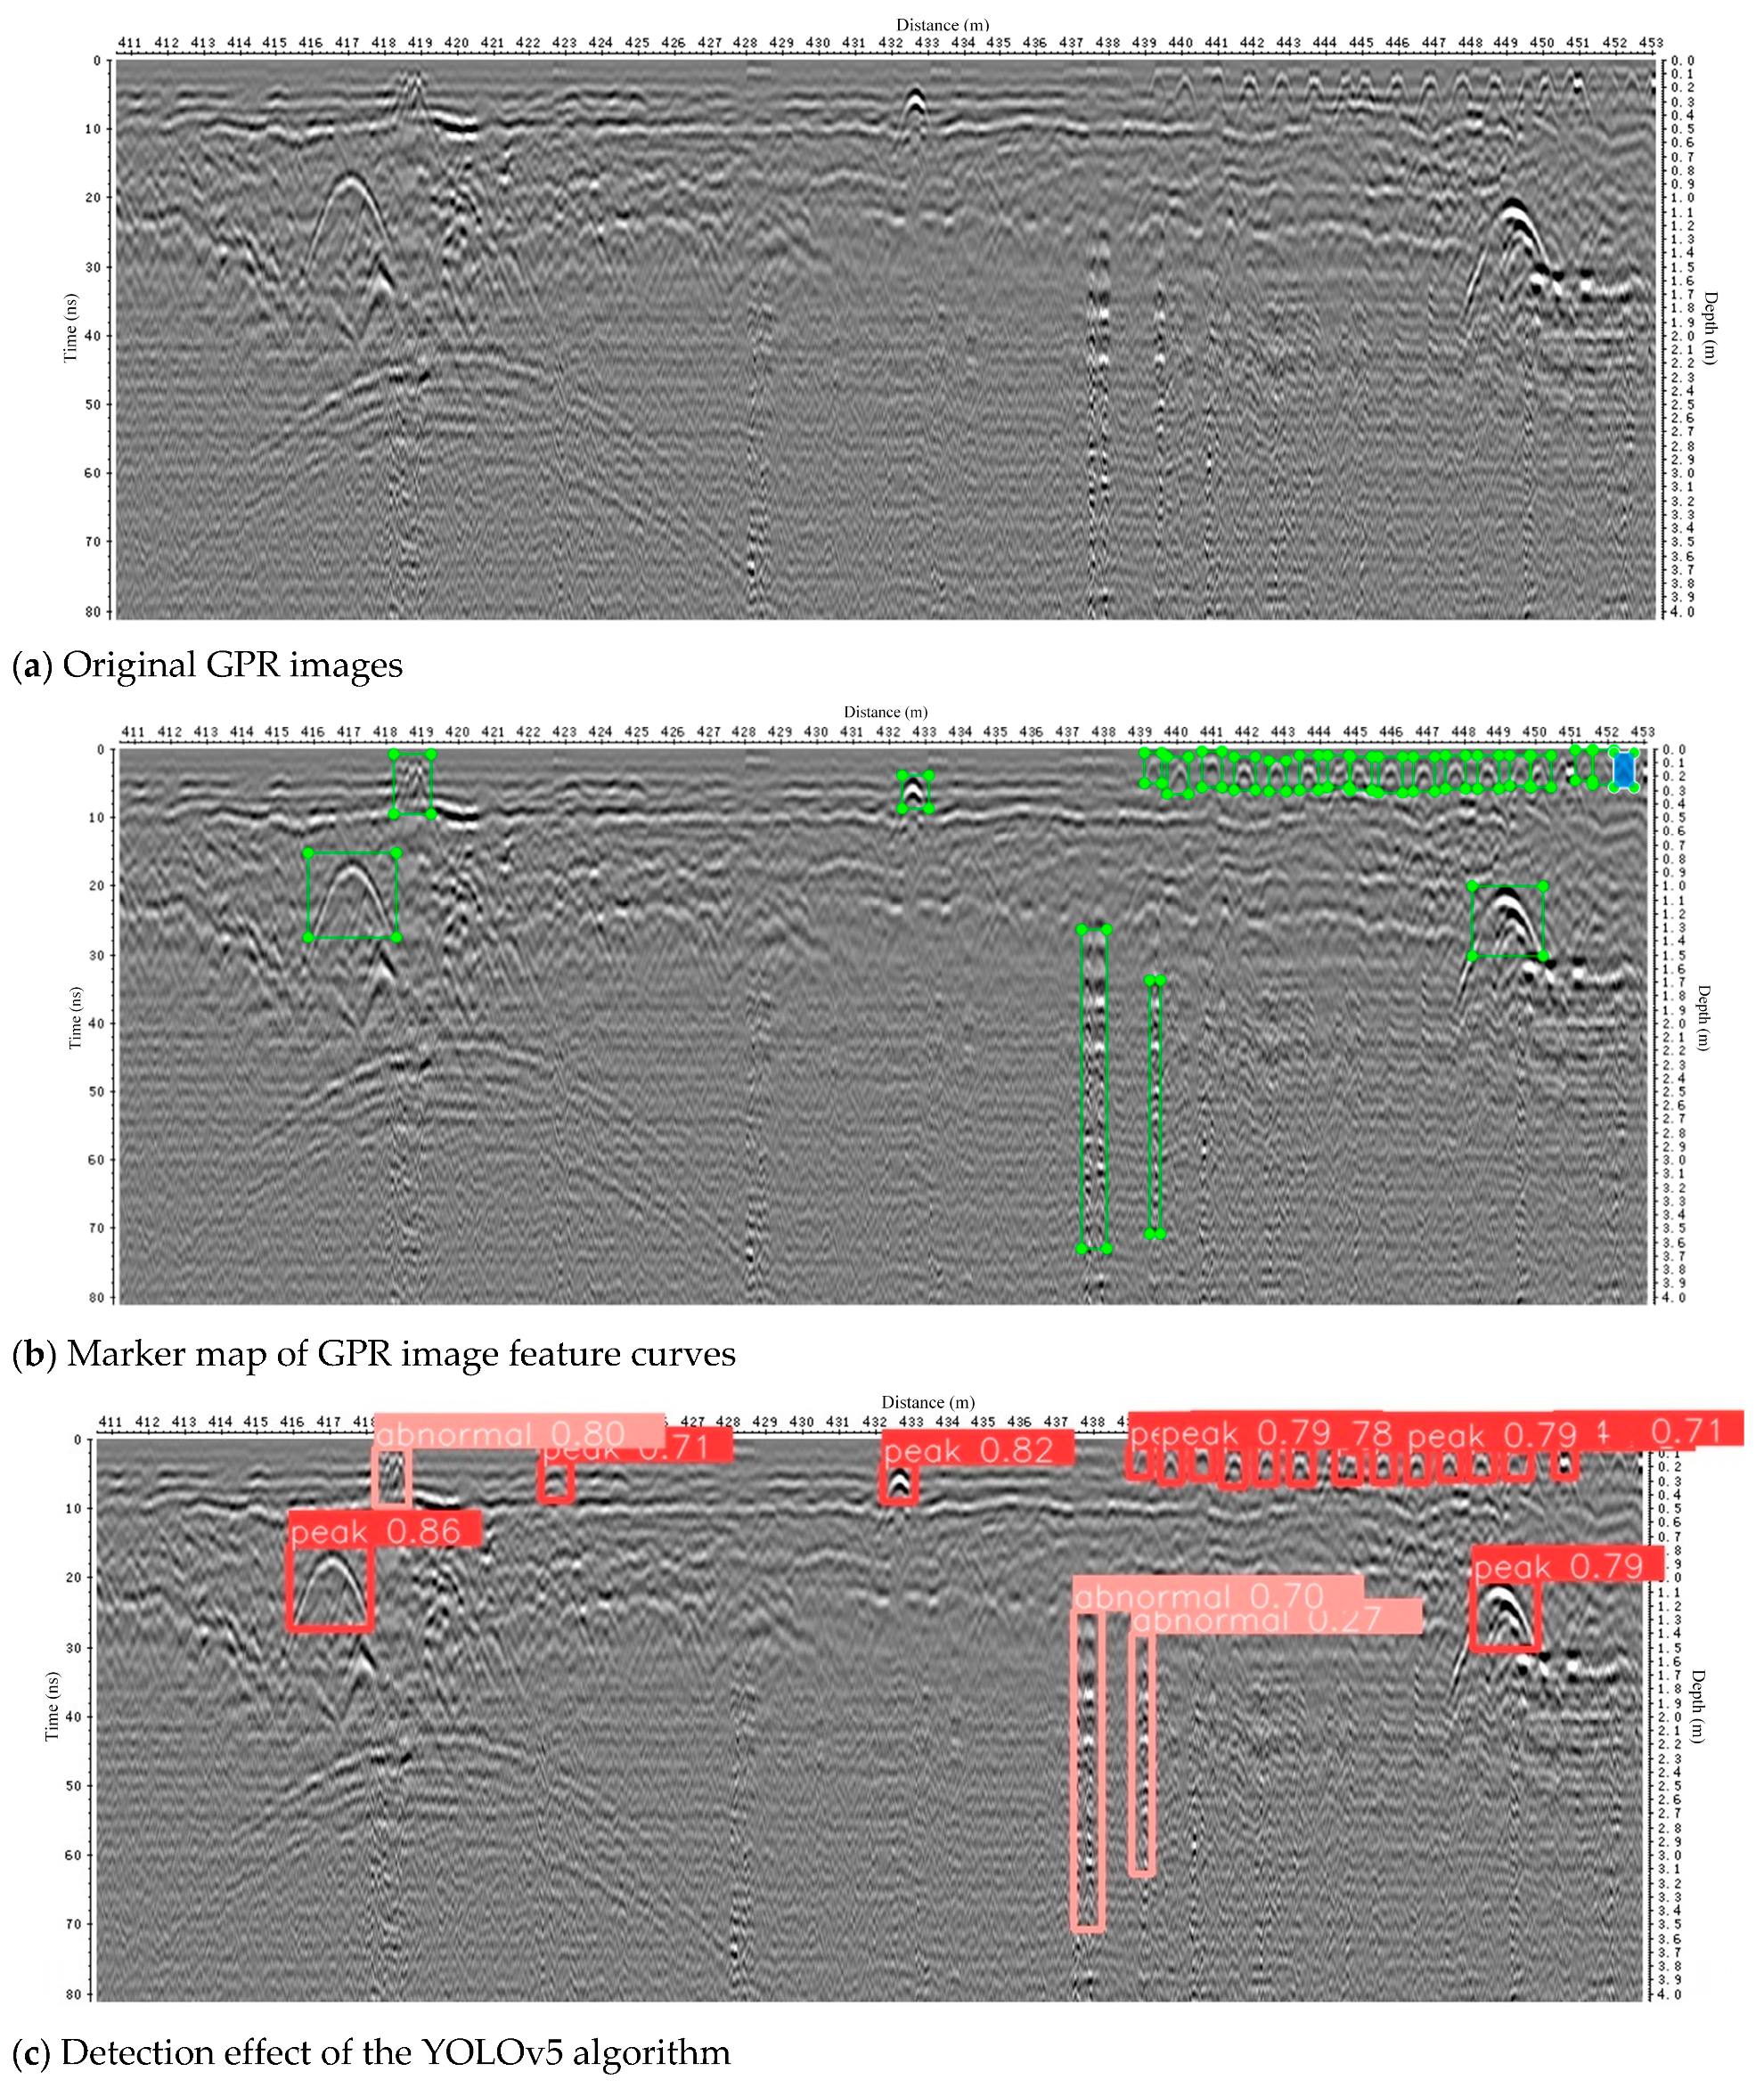
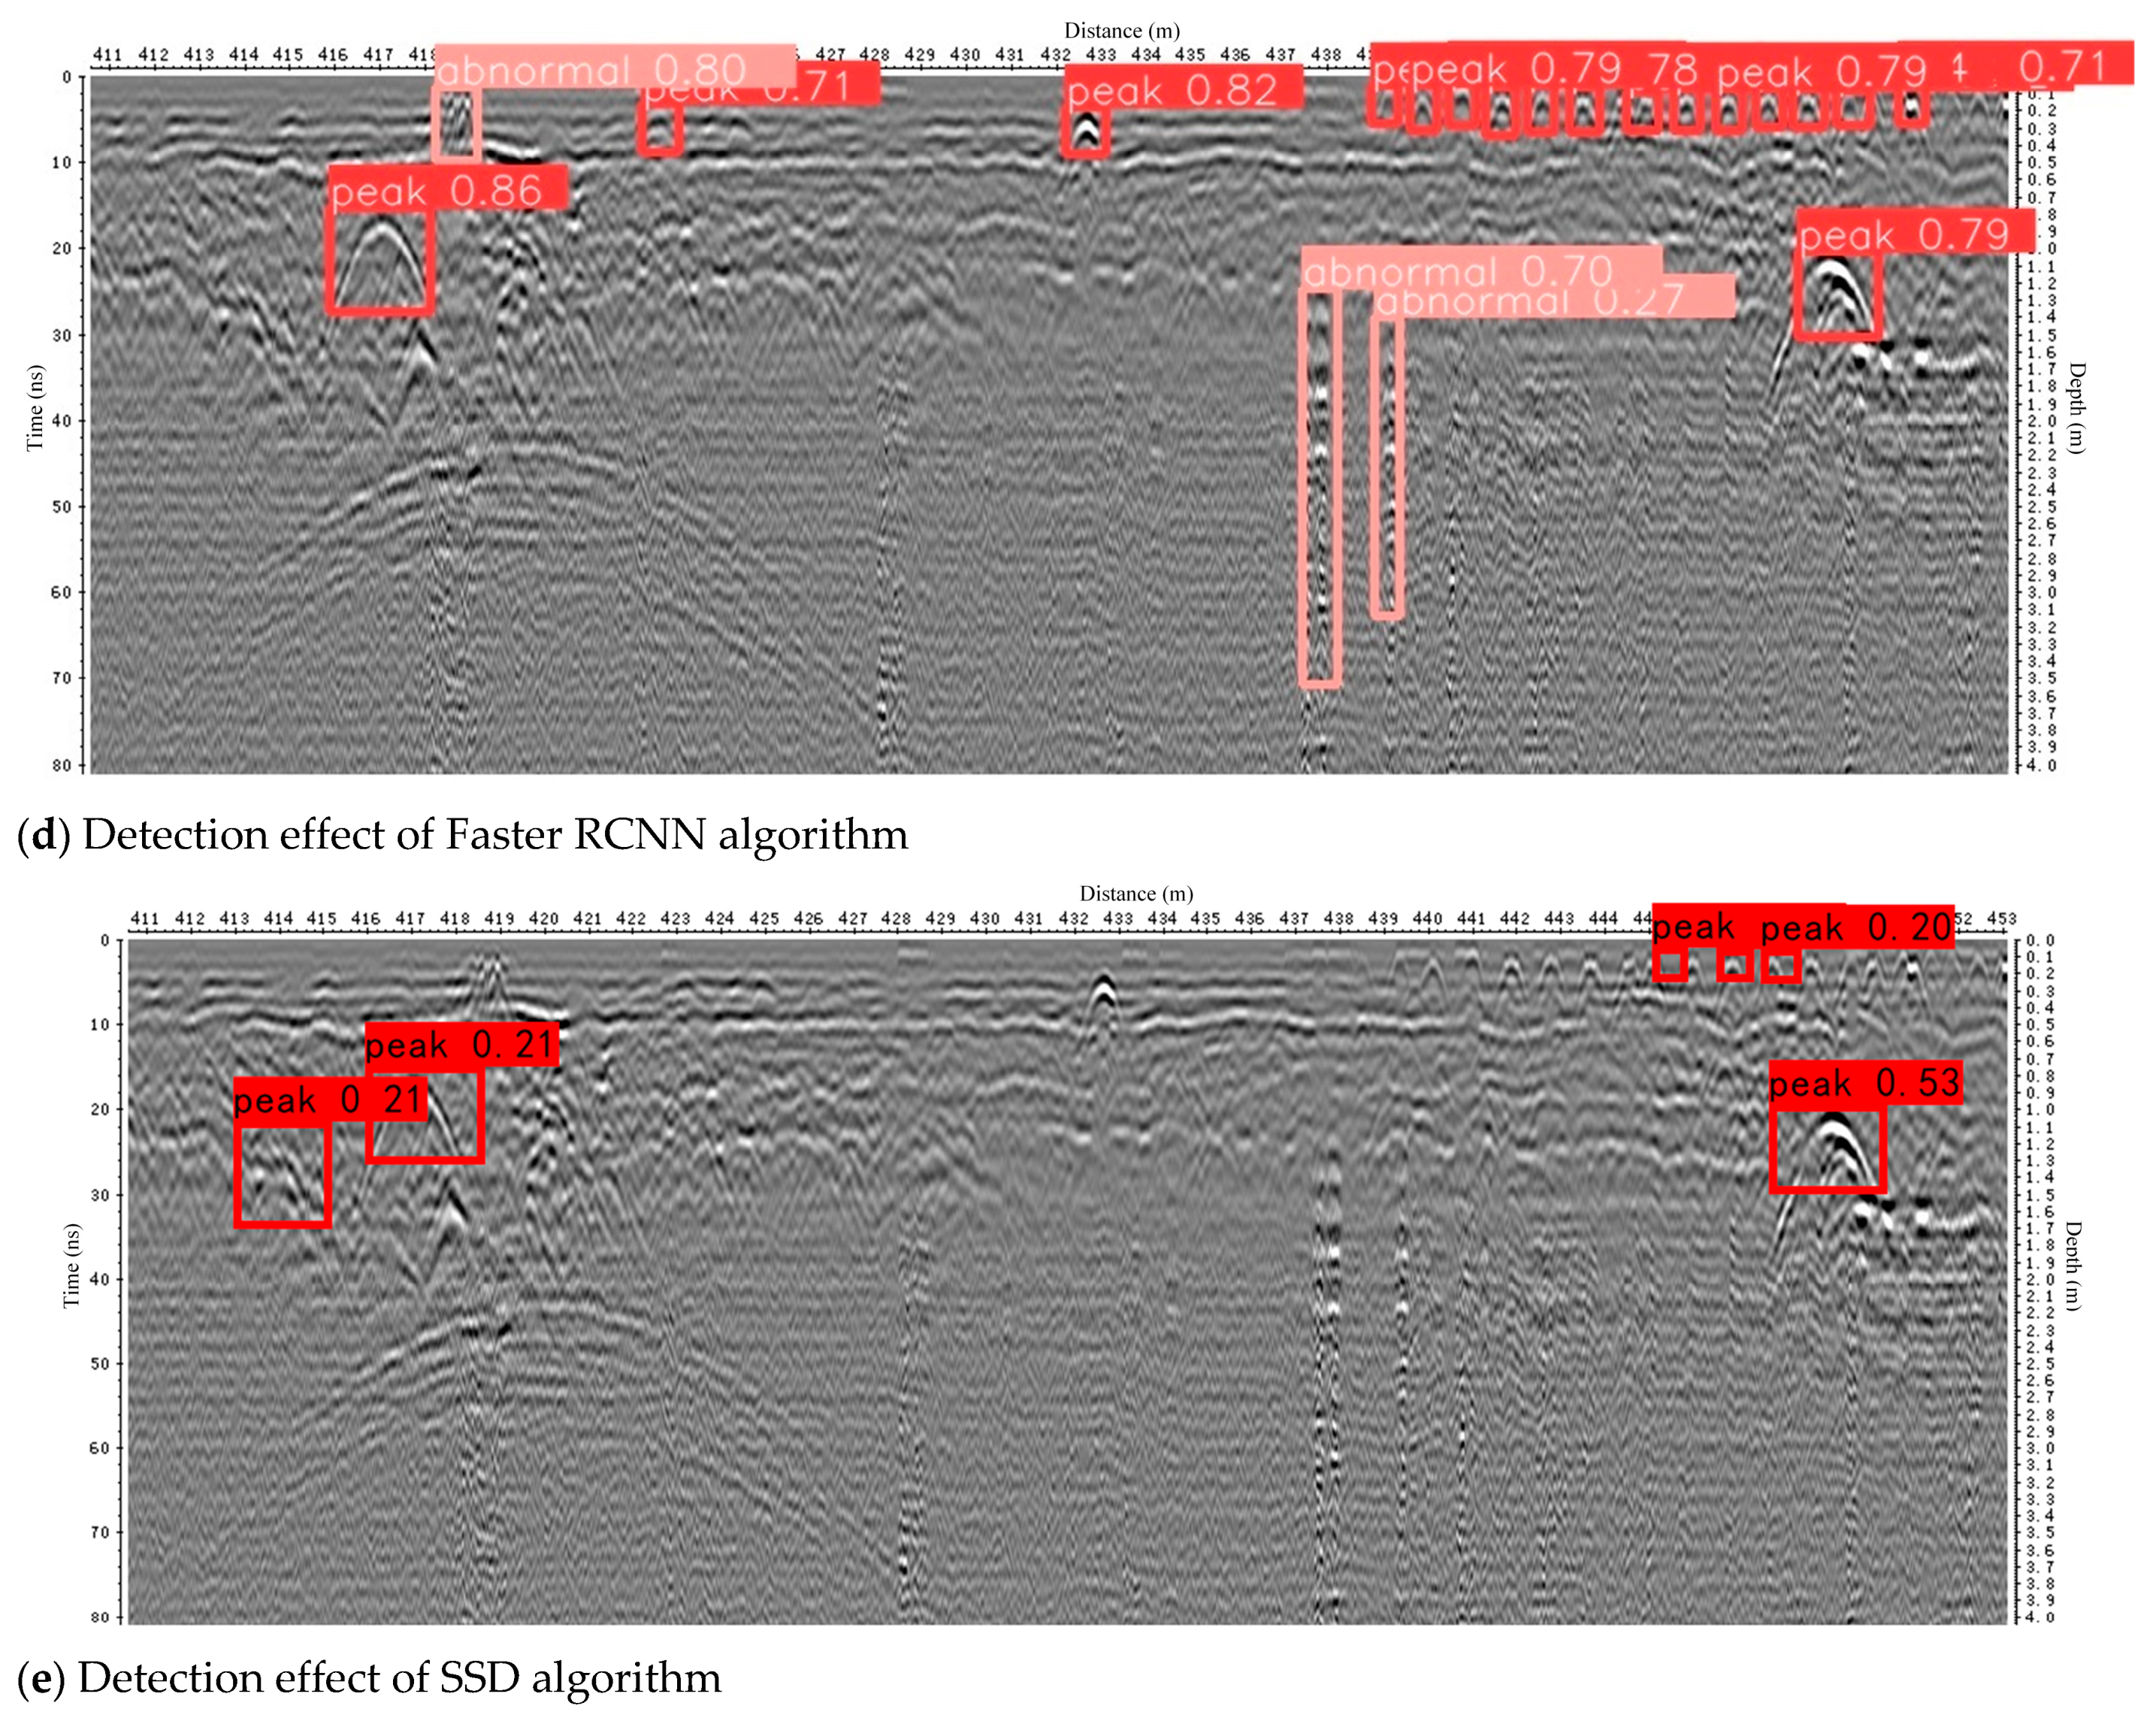
Figure 4 comparison chart shows the effectiveness of YOLOv5 algorithm and the other two target detection algorithms in actual detection. In Figure 4, (a) is the original GPR image, (b) is the marker map of the GPR image feature curves, (c) is the detection effect of YOLOv5 algorithm, (d) is the detection effect of Faster RCNN algorithm, and (e) is the detection effect of SSD algorithm.
In Figure 4, there are several small parabolic features, two large parabolic features, and three non-parabolic features in the GPR image. Regarding the leakage phenomenon, the YOLOv5 algorithm detected the two large parabolic features, three non-parabolic features, and most of the small parabolic features. The Faster RCNN algorithm detected two large parabolic features and most of the small parabolic features but missed two non-parabolic features. The SSD algorithm detected two large parabolic features but missed three non-parabolic features and some small parabolic features were missed. In terms of misdetection, the YOLOv5 algorithm misidentifies a background feature as a small parabolic feature, the Faster RCNN algorithm misidentifies a non-parabolic feature as a parabolic feature, and the SSD misidentifies a background feature as a parabolic feature.
Overall, the YOLOv5 algorithm and the other two algorithms were able to detect most of the parabolic and non-parabolic features, and although the Faster RCNN algorithm had a higher confidence level for the target foreign matter features, the YOLOv5 algorithm had better regression accuracy for the GPR image-based target foreign matter compared to the other two target detection algorithms. The center of the upper border of the detection frame is roughly near the parabolic feature vertex, which means that the detected subsurface soil-situated foreign objects’ position on the image coordinates can be roughly determined by the detection frame with better regression accuracy, which provides a certain theoretical basis for our research on the precise location of soil-situated foreign bodies.

2.4. Building an Automatic Parabola Extraction and Detection System for Ground-Penetrating Radar Images Based on YOLOv5 Algorithm

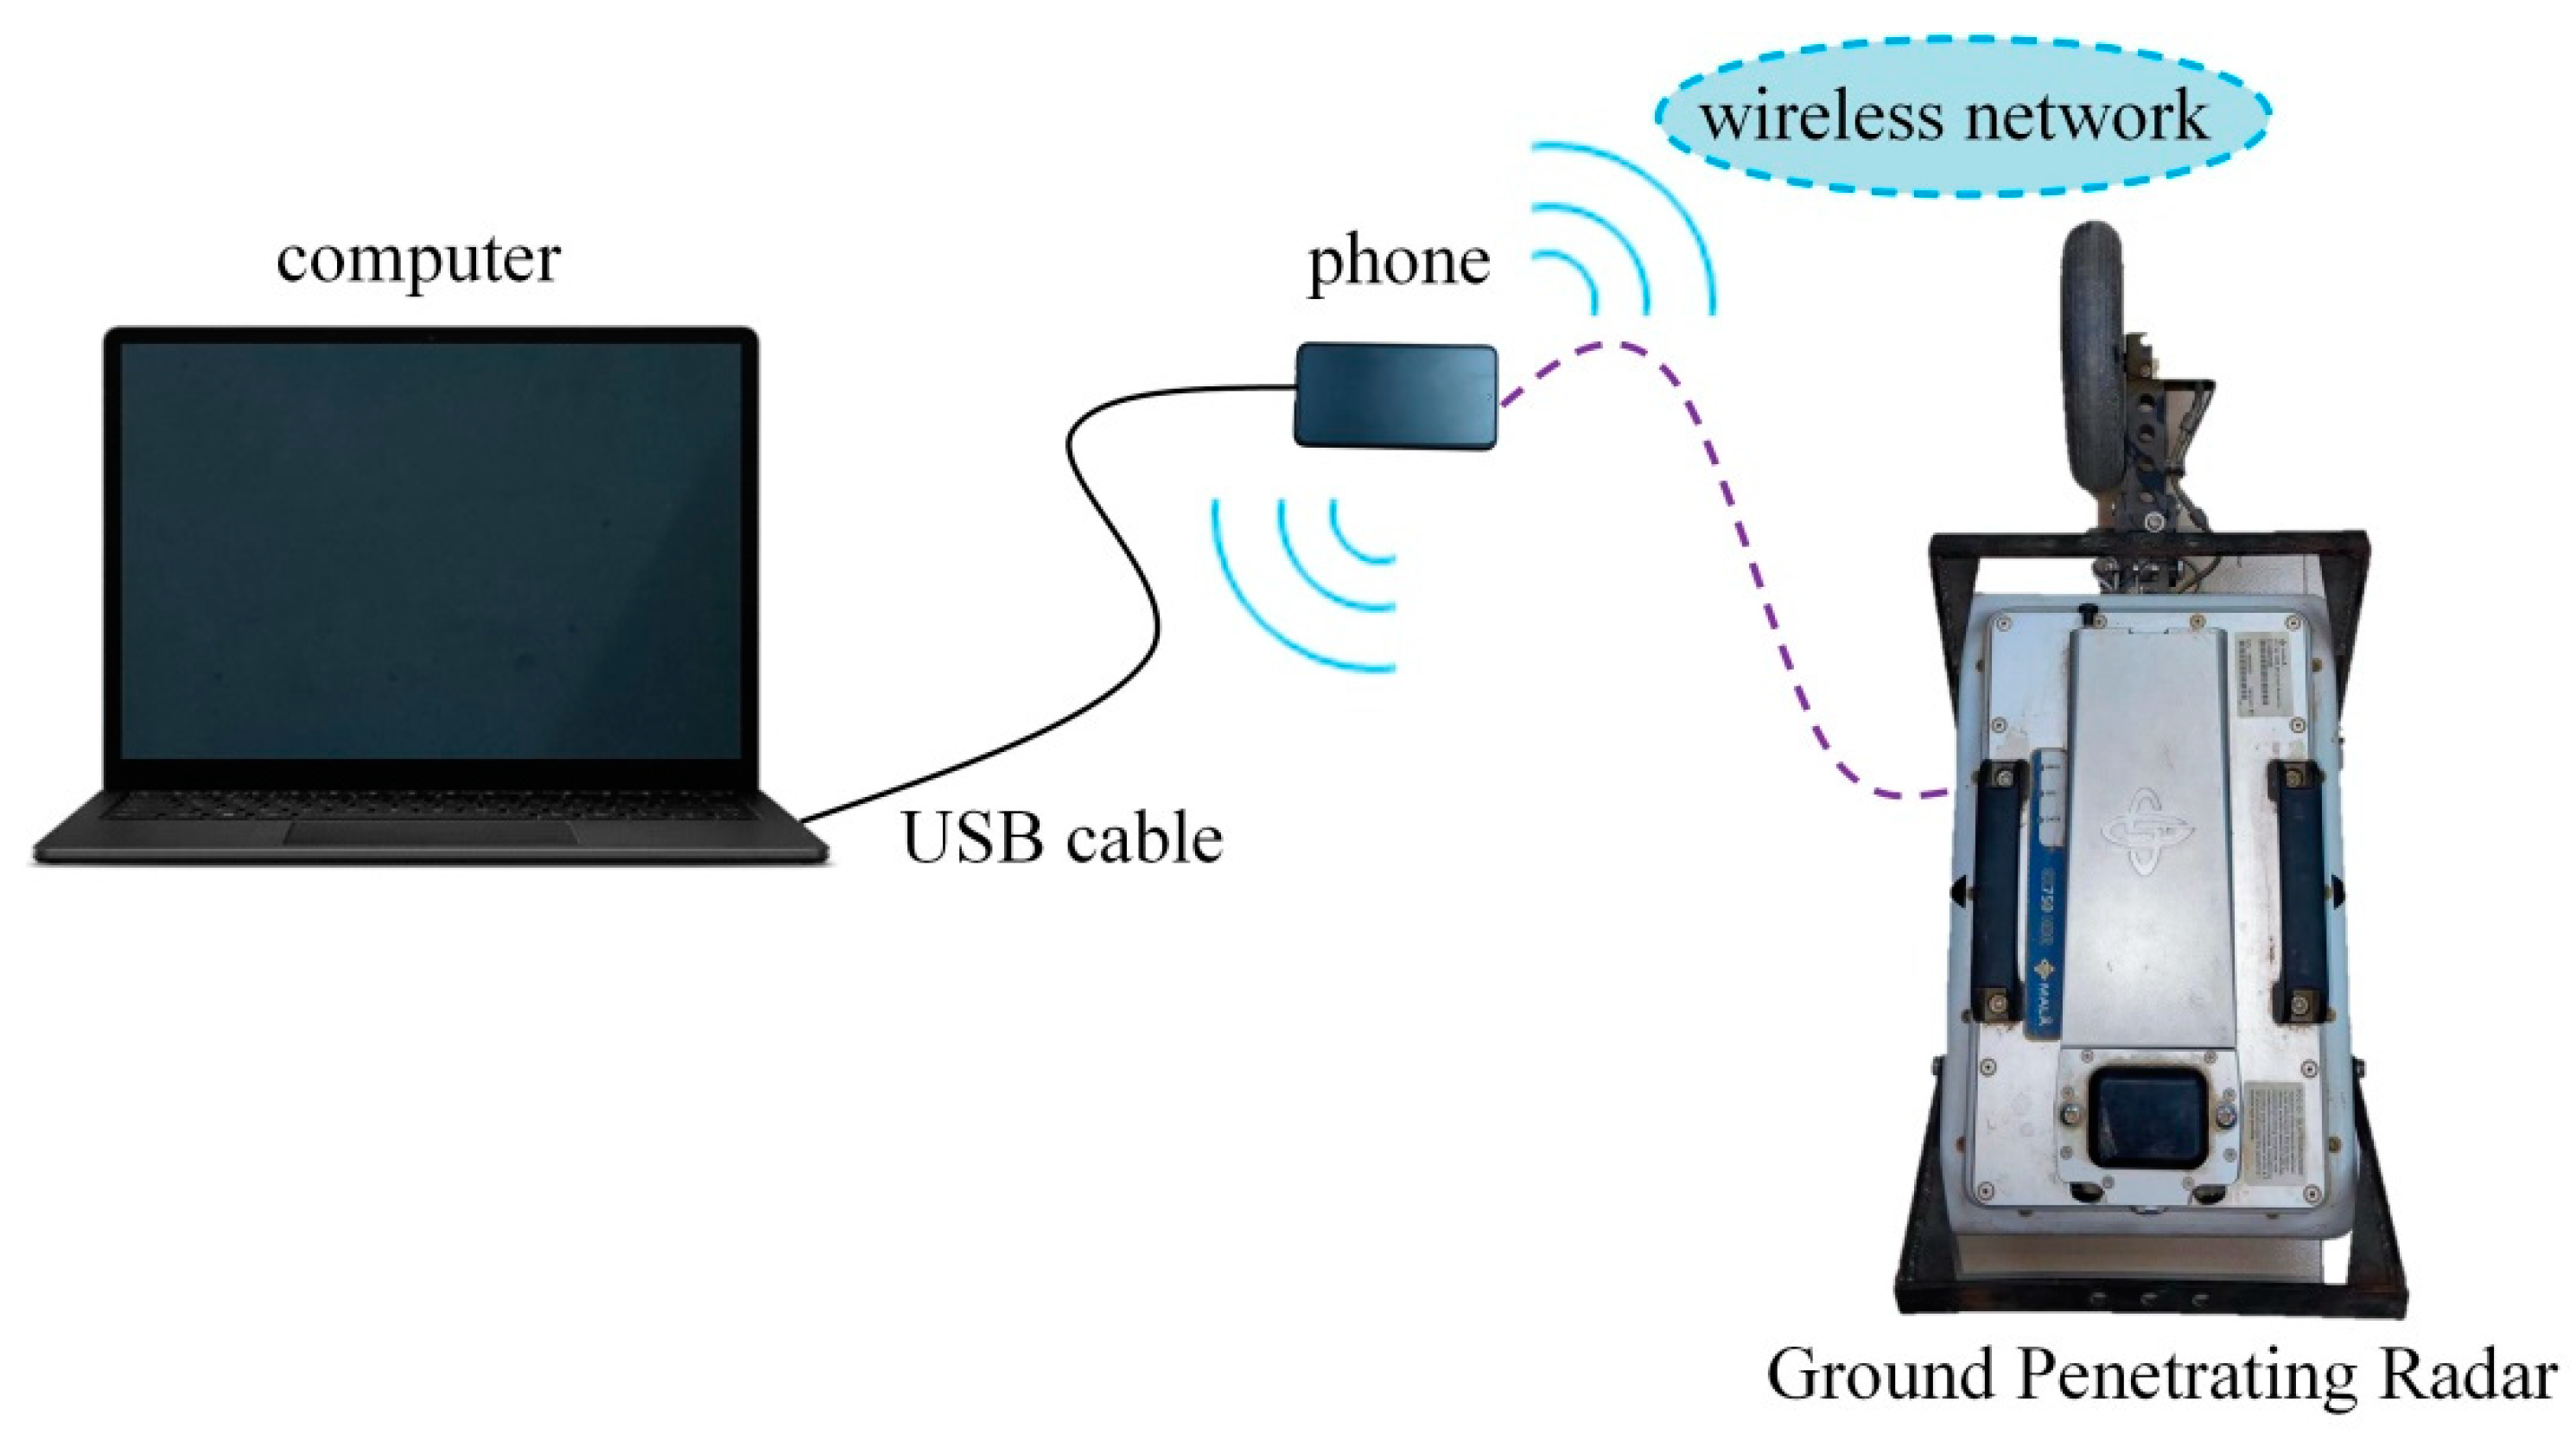
In order to improve the accuracy and efficiency of identifying target objects in GPR images, we use a machine learning algorithm to automatically extract the foreign object feature curves of the ground-penetrating radar image in real time. The hardware components of the indoor real-time detection system built in this study include the GPR instrument, laptop, Android cell phone, and data cable; the software components include the GPR instrument equipped with MALA Controller software and YOLOv5 network structure. The GPR real-time detection system was built as shown in Figure 5.
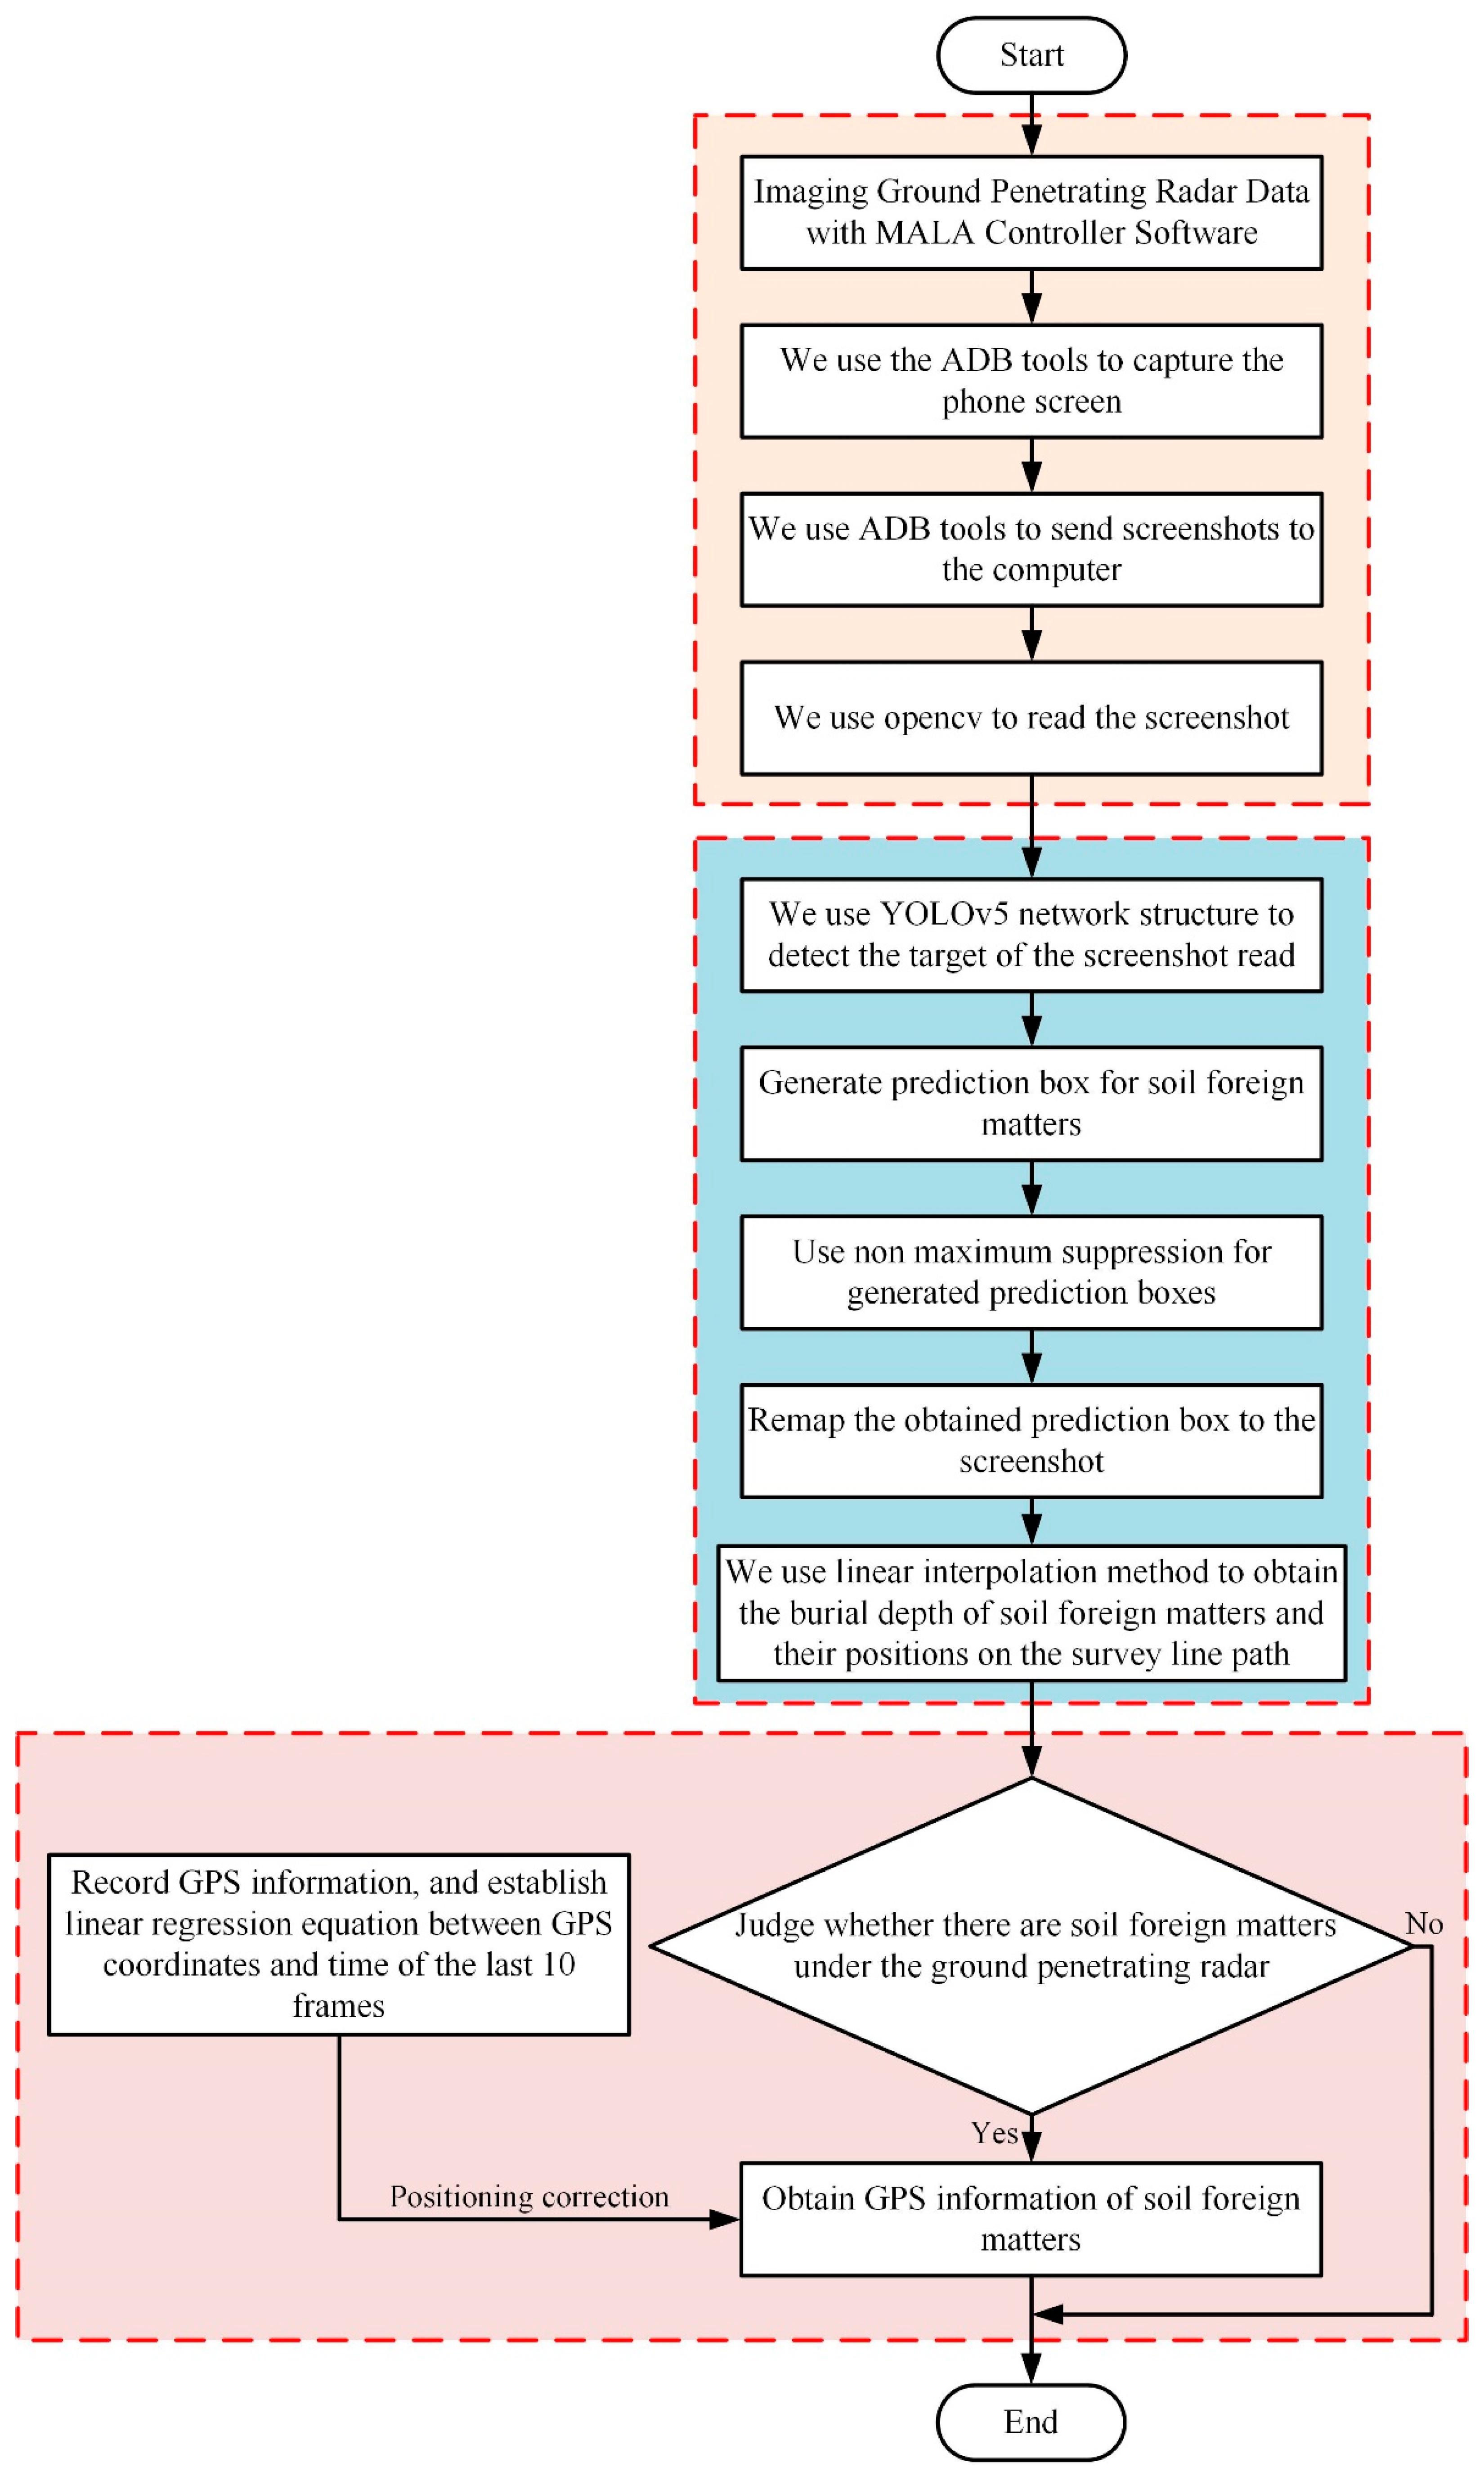
According to the entire process of detecting the target by the ground-penetrating radar, we built a ground-penetrating radar image target feature curve automatic extraction detection system based on the ground-penetrating radar and YOLOv5 algorithms using artificial intelligence technology to achieve complex data-processing; reconstruct the GPR image coordinates; ascertain the target objects’ buried location information, GPS information, and other parameters of the acquisition process; and perform real-time rapid detection and identification of target characteristic curves of GPR images obtained during the detection process. The detection and recognition process of the constructed automatic extraction and detection system of the target characteristic curves of ground-penetrating radar images is shown in Figure 6.
In our experiments, we use MALA Controller software to image the GPR data, and the cell phone screen is read through the Android Debug Bridge (ADB) in order to obtain GPR images in real time. After acquiring the GPR images, the image pixel coordinates are re-established by finding the imaging section of the GPR image on the cell phone screen. The burial depth of the soil-situated foreign objects is obtained by using the linear interpolation method. Then, the value of the horizontal coordinate of the ground location in the GPR image is screenshotted, and the value of the horizontal coordinate in the GPR image is identified by using the OCR algorithm. Consequently, the position obtained using the linear interpolation method and the starting point position identified by OCR are summed. Finally, the positions obtained by the linear interpolation and the starting point positions identified by OCR are summed to obtain the distance positions of hard foreign objects in the GPR images along the measuring line in the detection process.
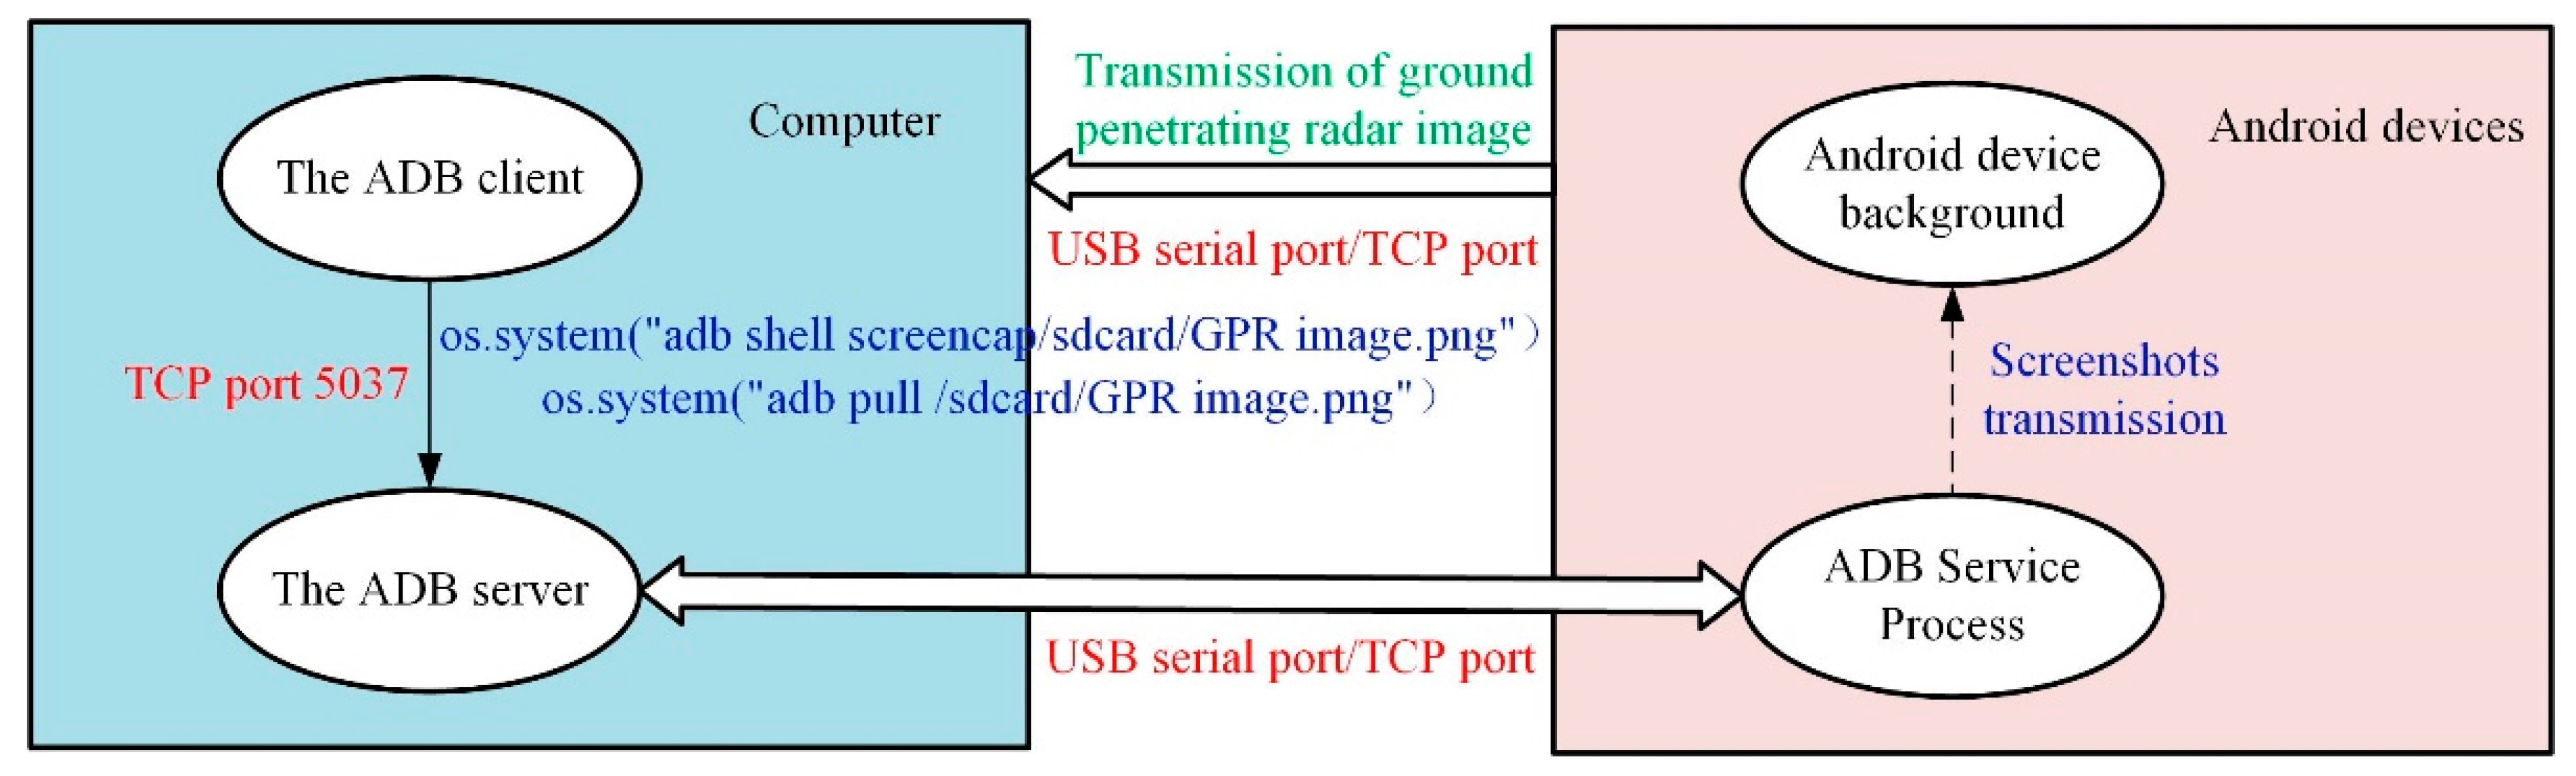
We acquire the GPR images by continuously reading the MALA Controller software interface in real time with the Android Debug Bridge (ADB), a development tool used for communication between computers and Android devices, which consists of three components: client (ADB client), server (ADB server), and service process (ADBD). The client (ADB client) runs on the computer and is used to send commands to the server (ADB server); the server (ADB server) runs on the computer as a client of the service process (ADBD) and is used to send commands to the Android device; the service process (ADBD) runs on the Android device and is used to execute commands on the Android device.
We first send the command os.system(“adb shell screencap/sdcard/radar picture.png”) to the computer client (ADB client) to communicate with the server (ADB server) through TCP port 5037; then, the server (ADB server) will communicate with the Android device through USB serial port or TCP. At this time, the service process (ADBD) will intercept the screen of the Android device in real time so as to obtain the GPR images recorded by the running MALA Controller software and store them in the memory card of the Android device. Similarly, the computer client (ADB client) sends the command os.system(“adb pull/sdcard/radar image.png”) to transfer the GPR image stored in the memory card of the Android device to the computer. The above operation realizes the real-time acquisition of GPR images. The principle of real-time acquisition of GPR images is shown in Figure 7.
During the test, the GPR system uses a trigger wheel to control the triggering of the GPR pulse, transmitting and receiving an electromagnetic wave pulse every step. MALA Controller software communicates with the GPR, and the MALA Controller updates the image every time the GPR receives a new pulse, while the ABD tool takes continuous screenshots of the cell phone screen, thus realizing real-time data acquisition of the whole detection process of GPR.

2.5. Indoor Testing Based on the Detection System

We conducted indoor detection experiments in the Key Laboratory of Agricultural Machinery and Equipment of the Ministry of Education, which was built on common farmland soil platform in the south of China. The soil platform has dimensions of 6 m in length, 2 m in width, and 1.5 m in depth, and contains a batch of ferrous experimental materials, such as steel bars and iron plate materials. The high-dynamic GPR MALA GX750 HDR instrument was selected to detect the target objects buried inside the soil. In order to achieve real-time detection, we used MALA Controller, a cell phone software developed by MALA, to assist us to understand and interpret the detection results more intuitively, as well as obtain the GPR image data in real time.
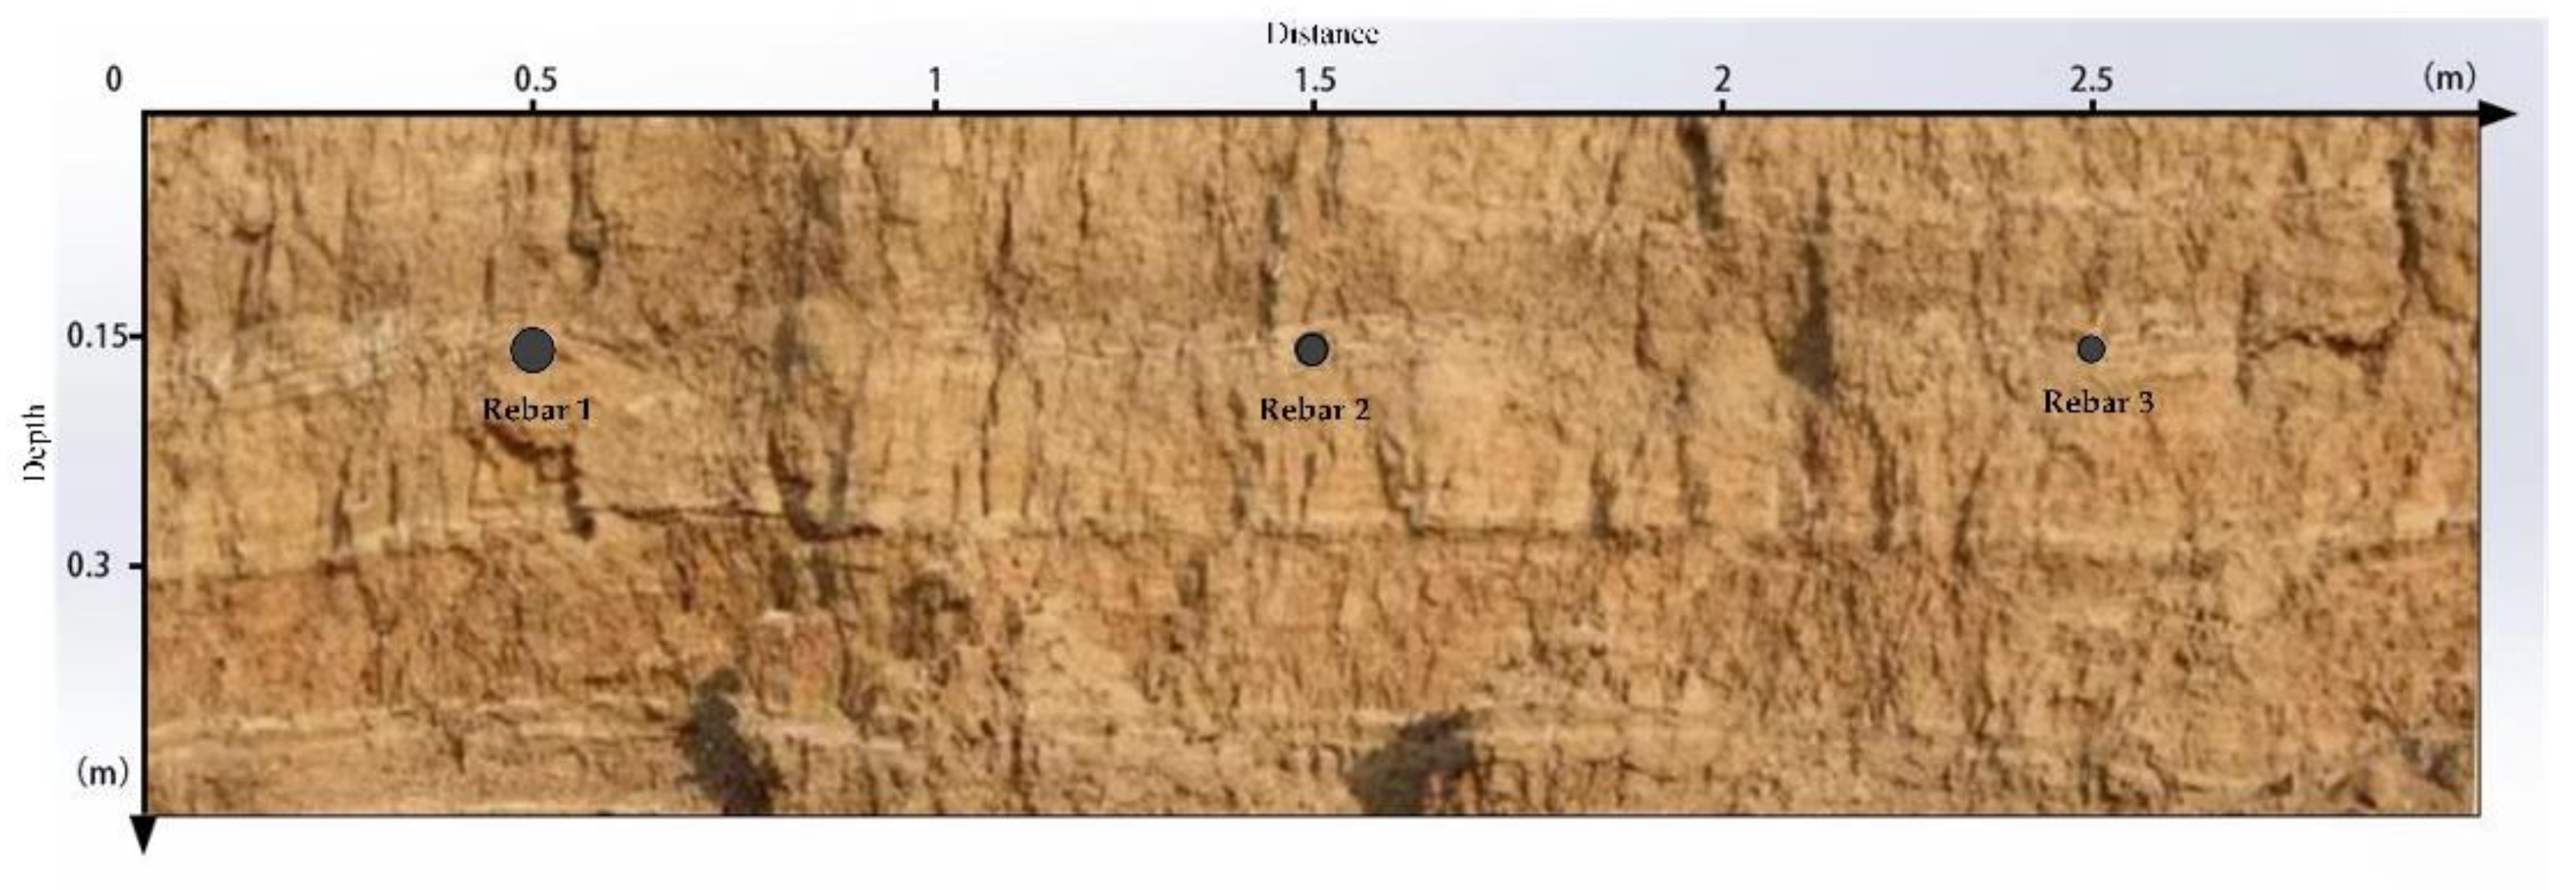
In the soil platform in the Key Laboratory of Agricultural Machinery and Equipment of the Ministry of Education in the south, we used rebar as an example, whose diameters were 5 cm, 4 cm, and 3 cm, with lengths of 15 cm. The depth of the rebar was 15 cm, and the buried positions were 50 cm, 150 cm, and 250 cm from the starting point; the specific buried positions of the rebar are shown in Figure 8.
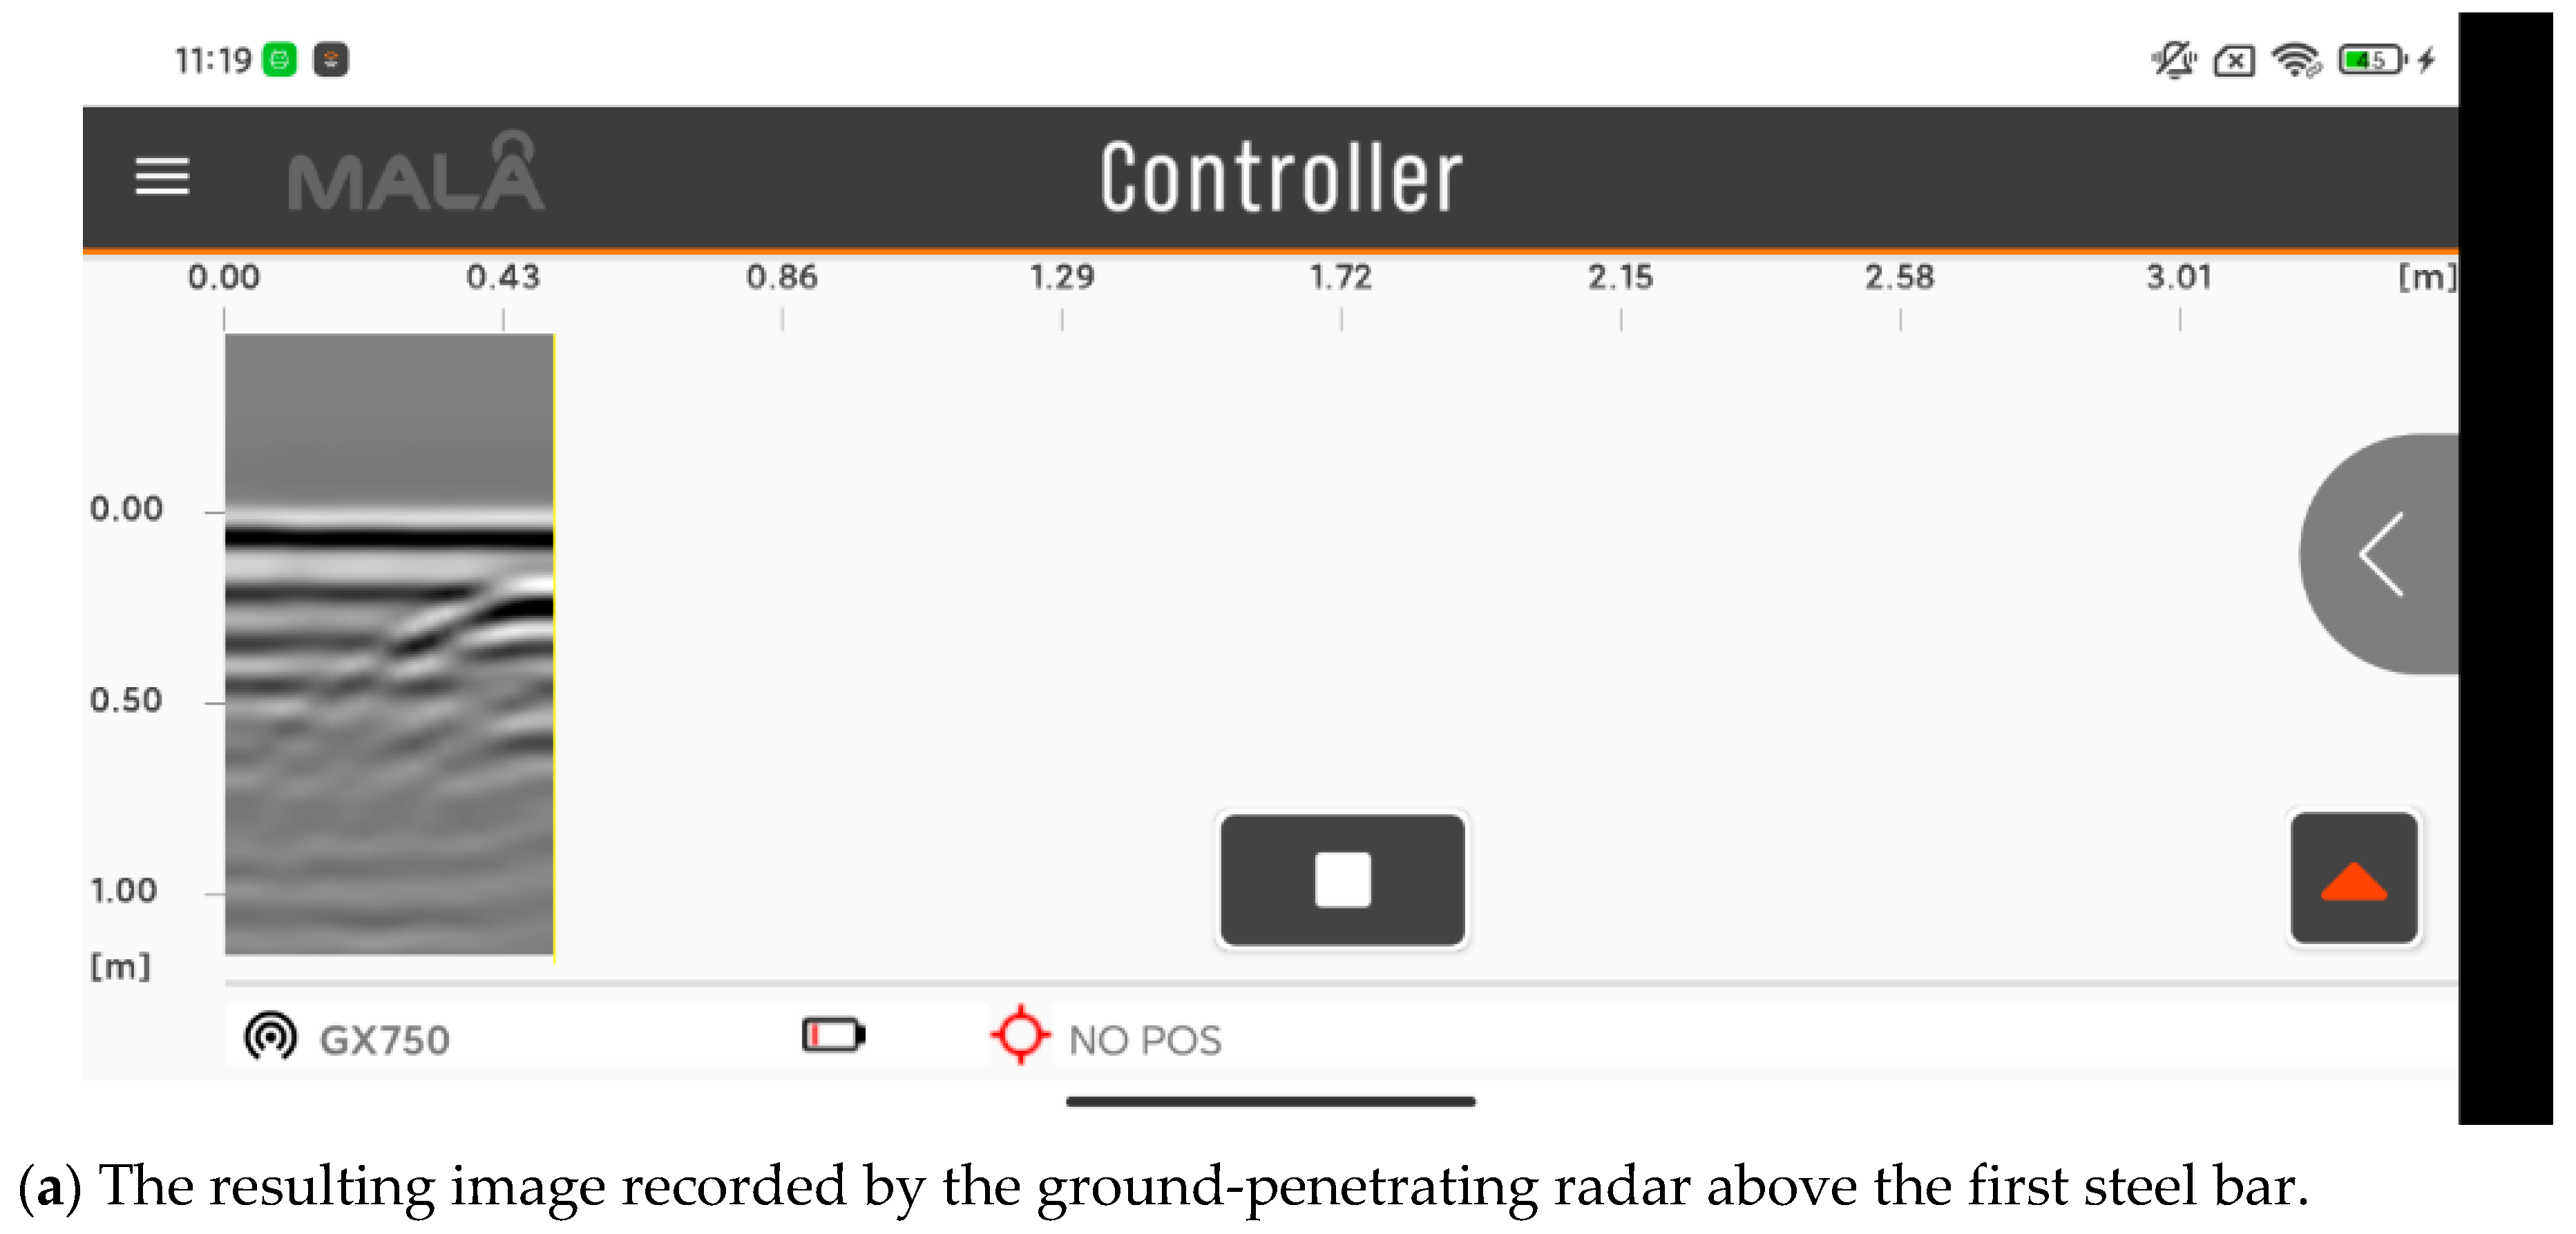
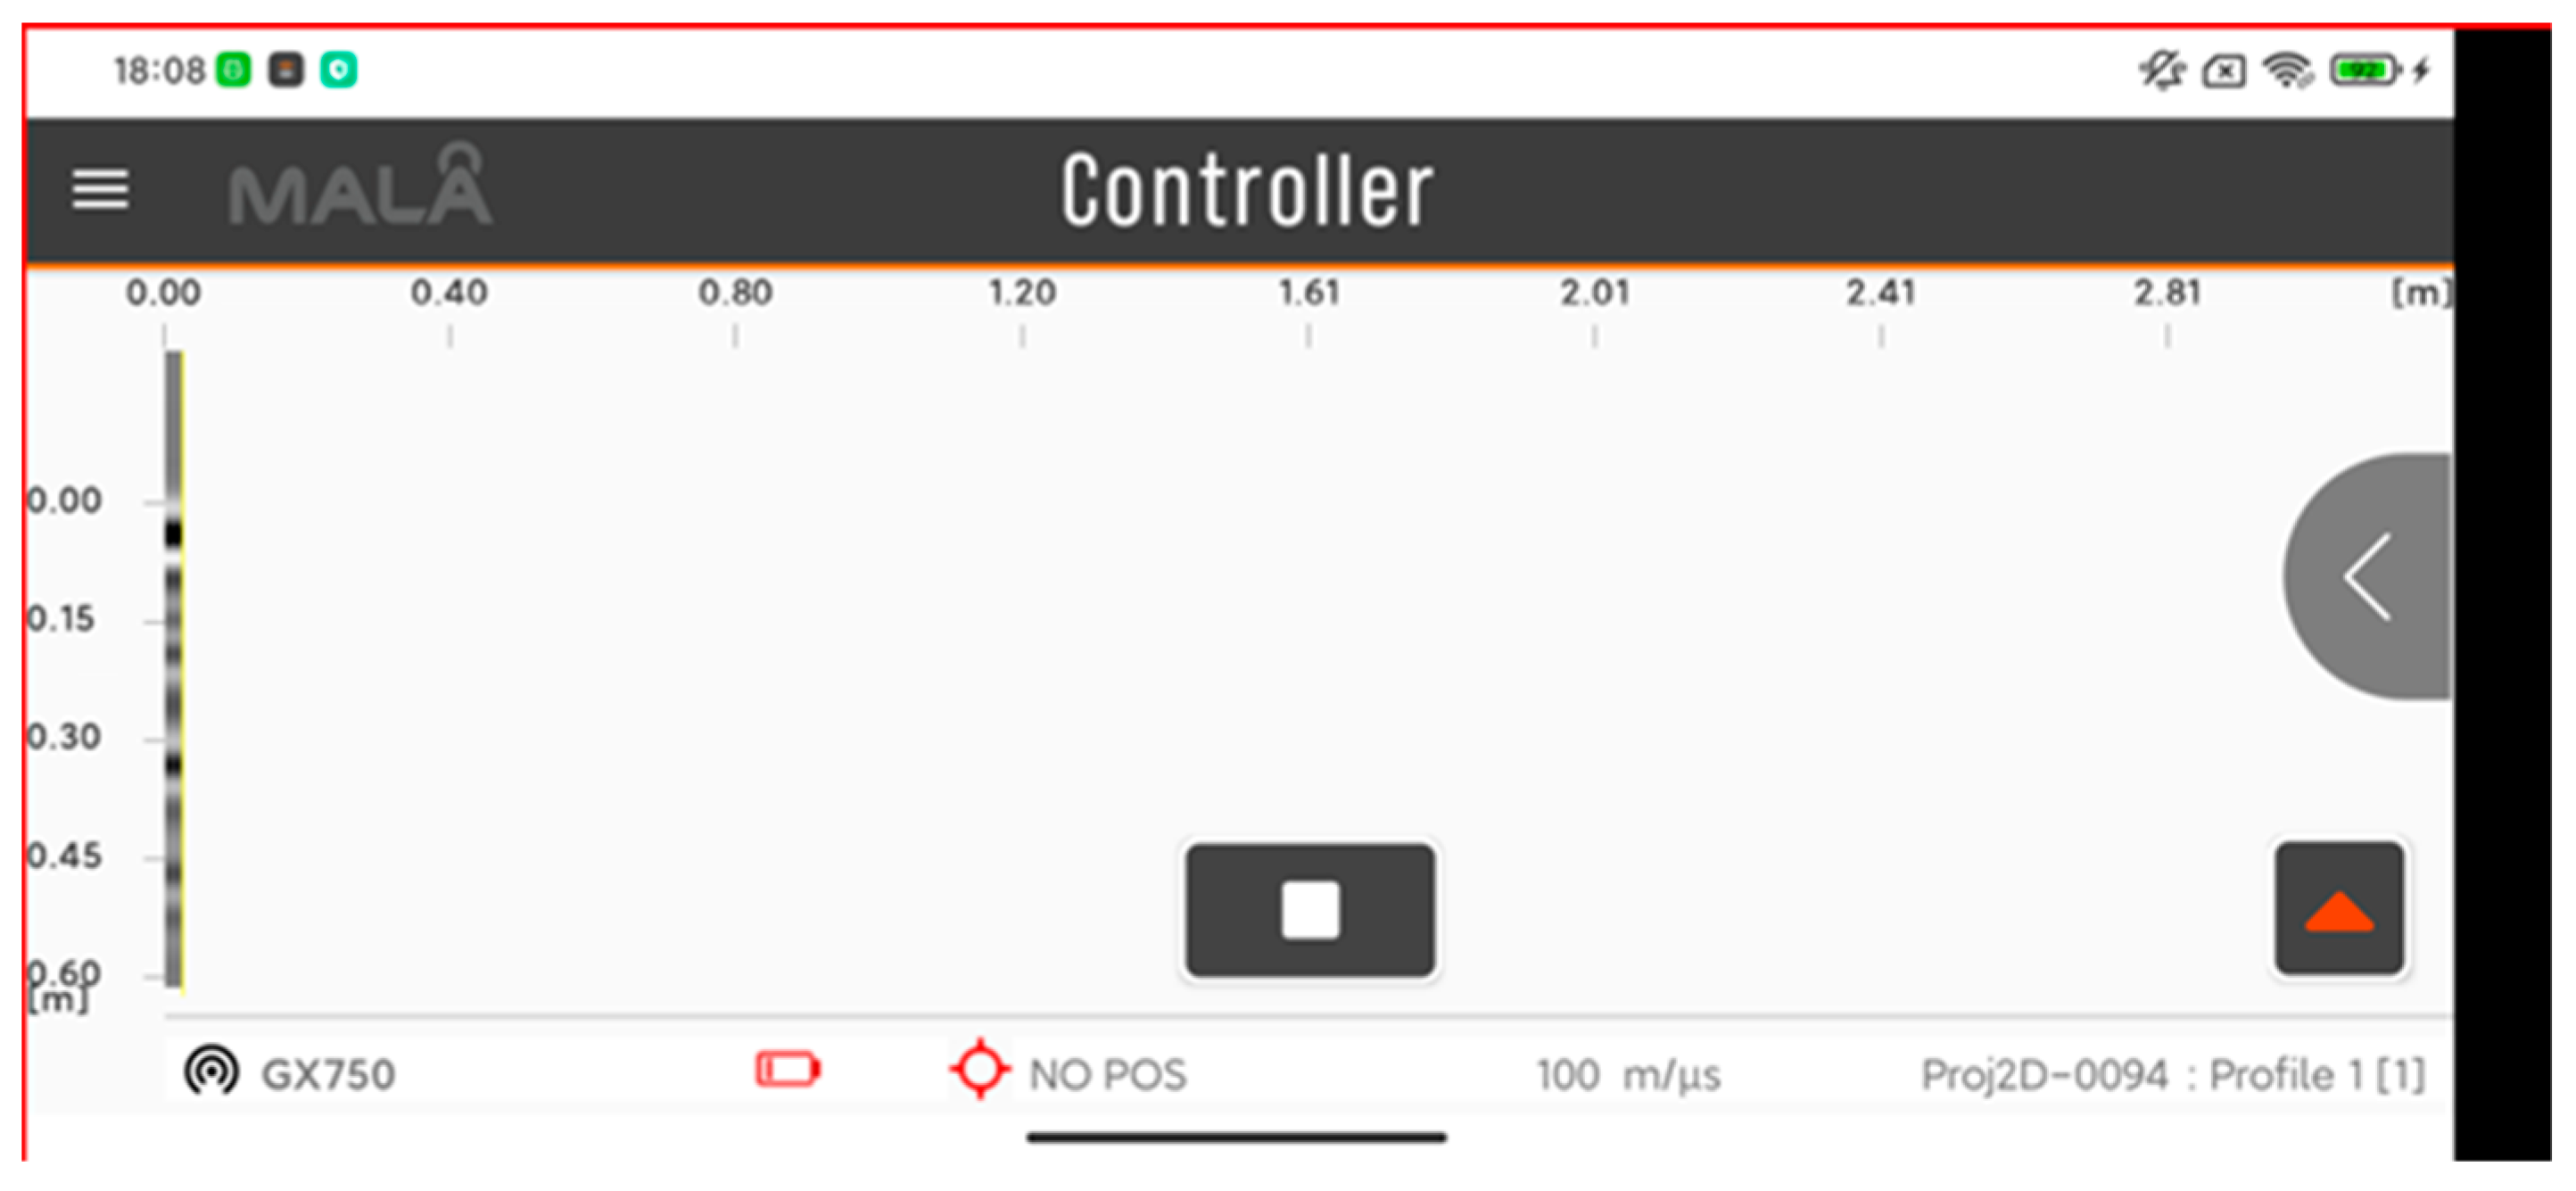
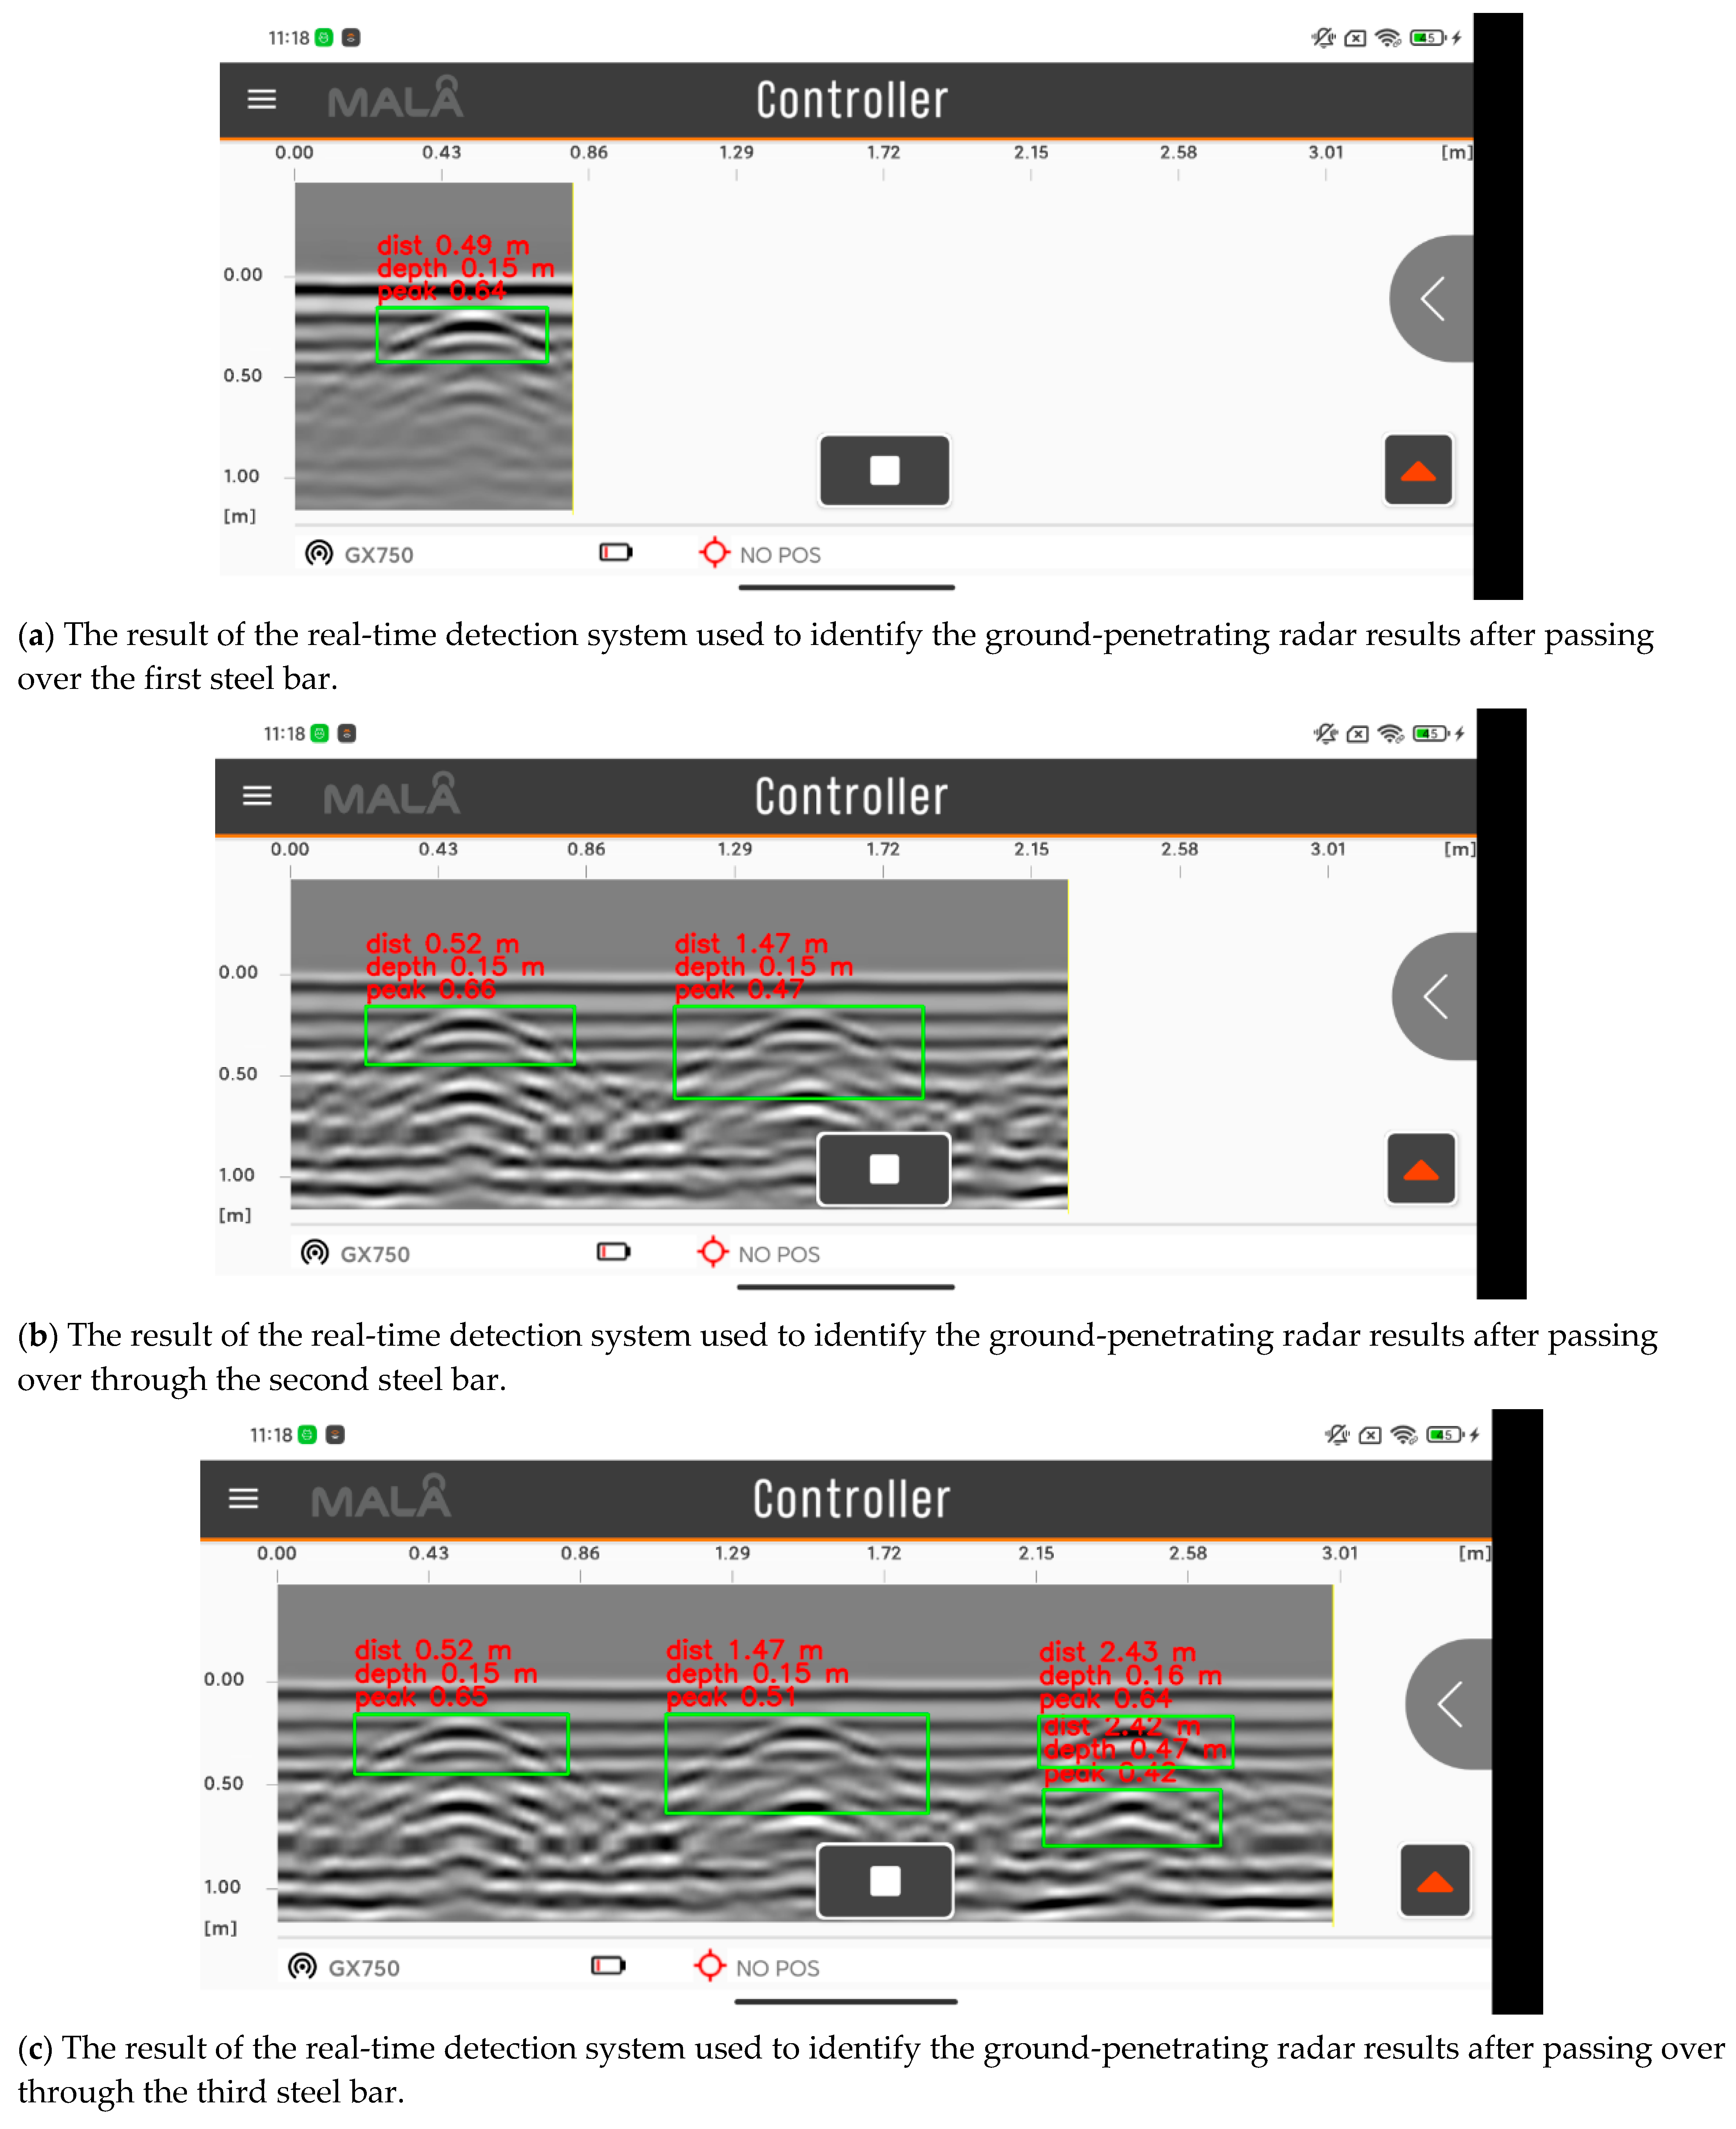
We obtained the GPR image data recorded by MALA Controller software in real time by taking screenshots of the cell phone screen with the ABD tool, and part of this process is shown in Figure 9. Figure 9a shows a screenshot of the computer reading the interface of the MALA Controller software when the GPR instrument scans above the position of the first piece of rebar; 
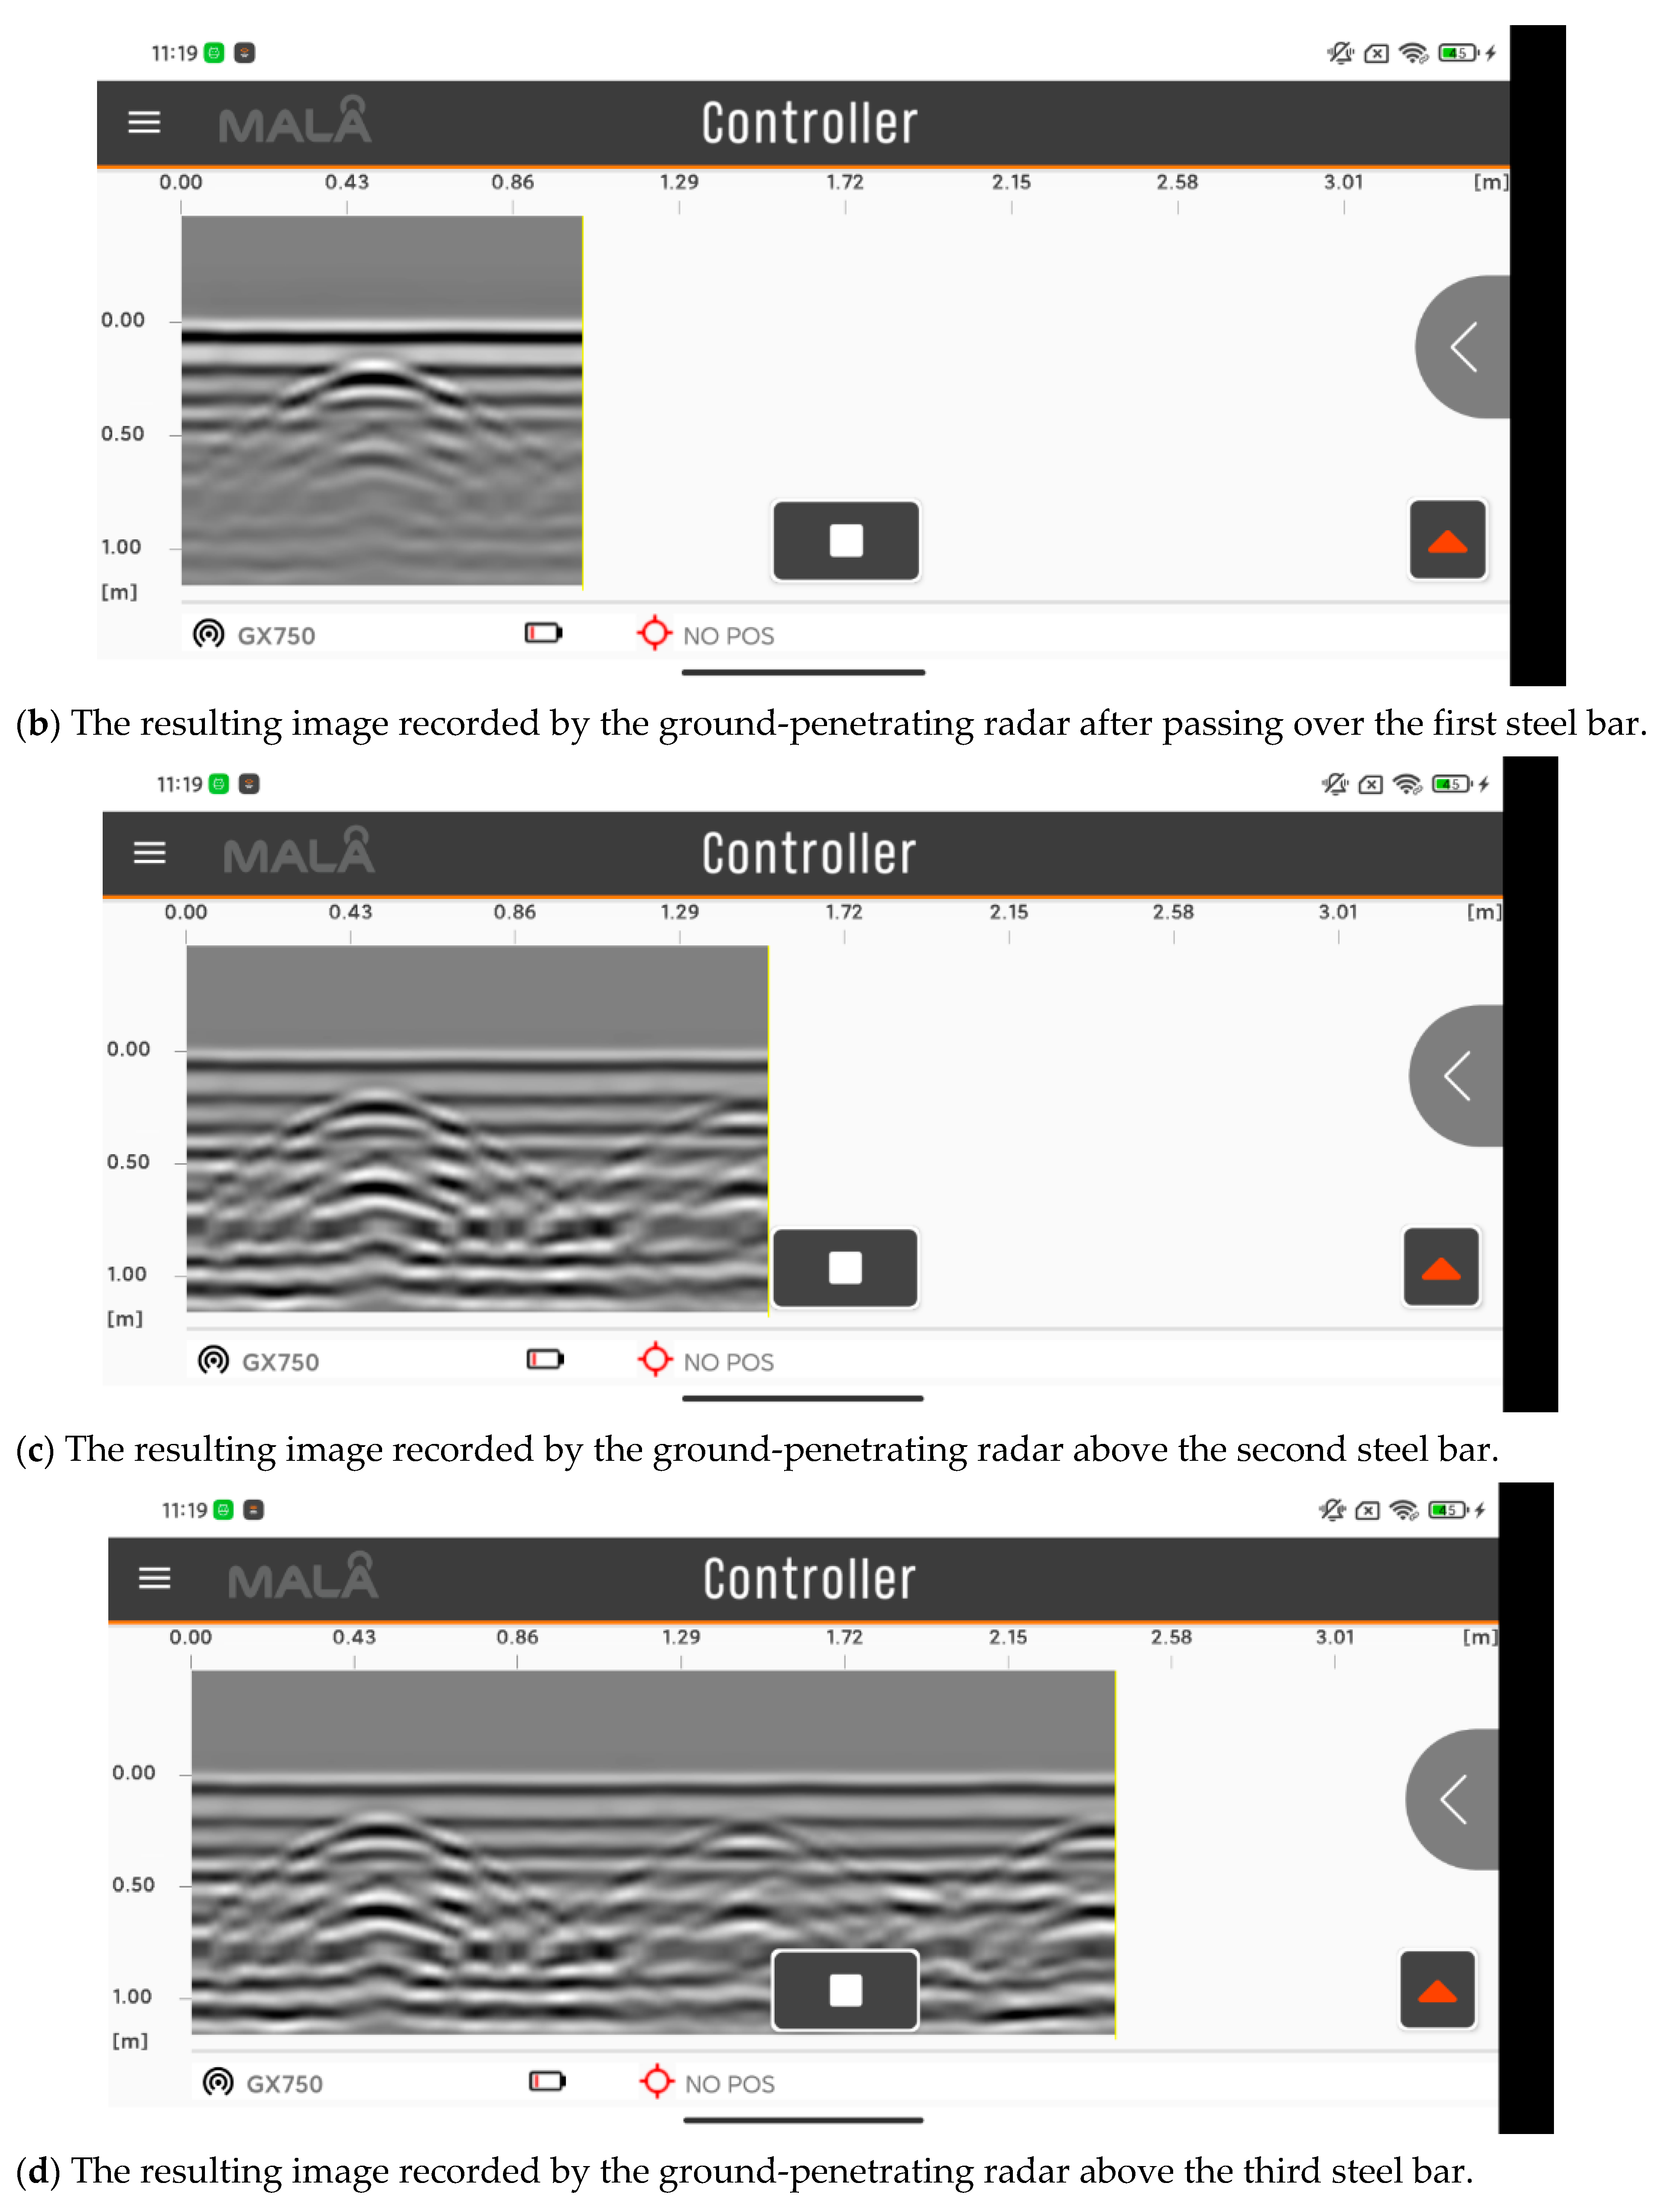
Figure 9b shows a screenshot of the computer reading the interface of MALA Controller software when the GPR instrument has completely passed the buried position of the first piece of rebar, but before reaching the buried position of the second piece of rebar; Figure 9c is a screenshot of the computer reading the MALA Controller software interface when the GPR instrument reaches the top of the second piece of rebar; Figure 9d is a screenshot of the computer reading the MALA Controller software interface when the GPR instrument reaches the top of the third piece of rebar; and 
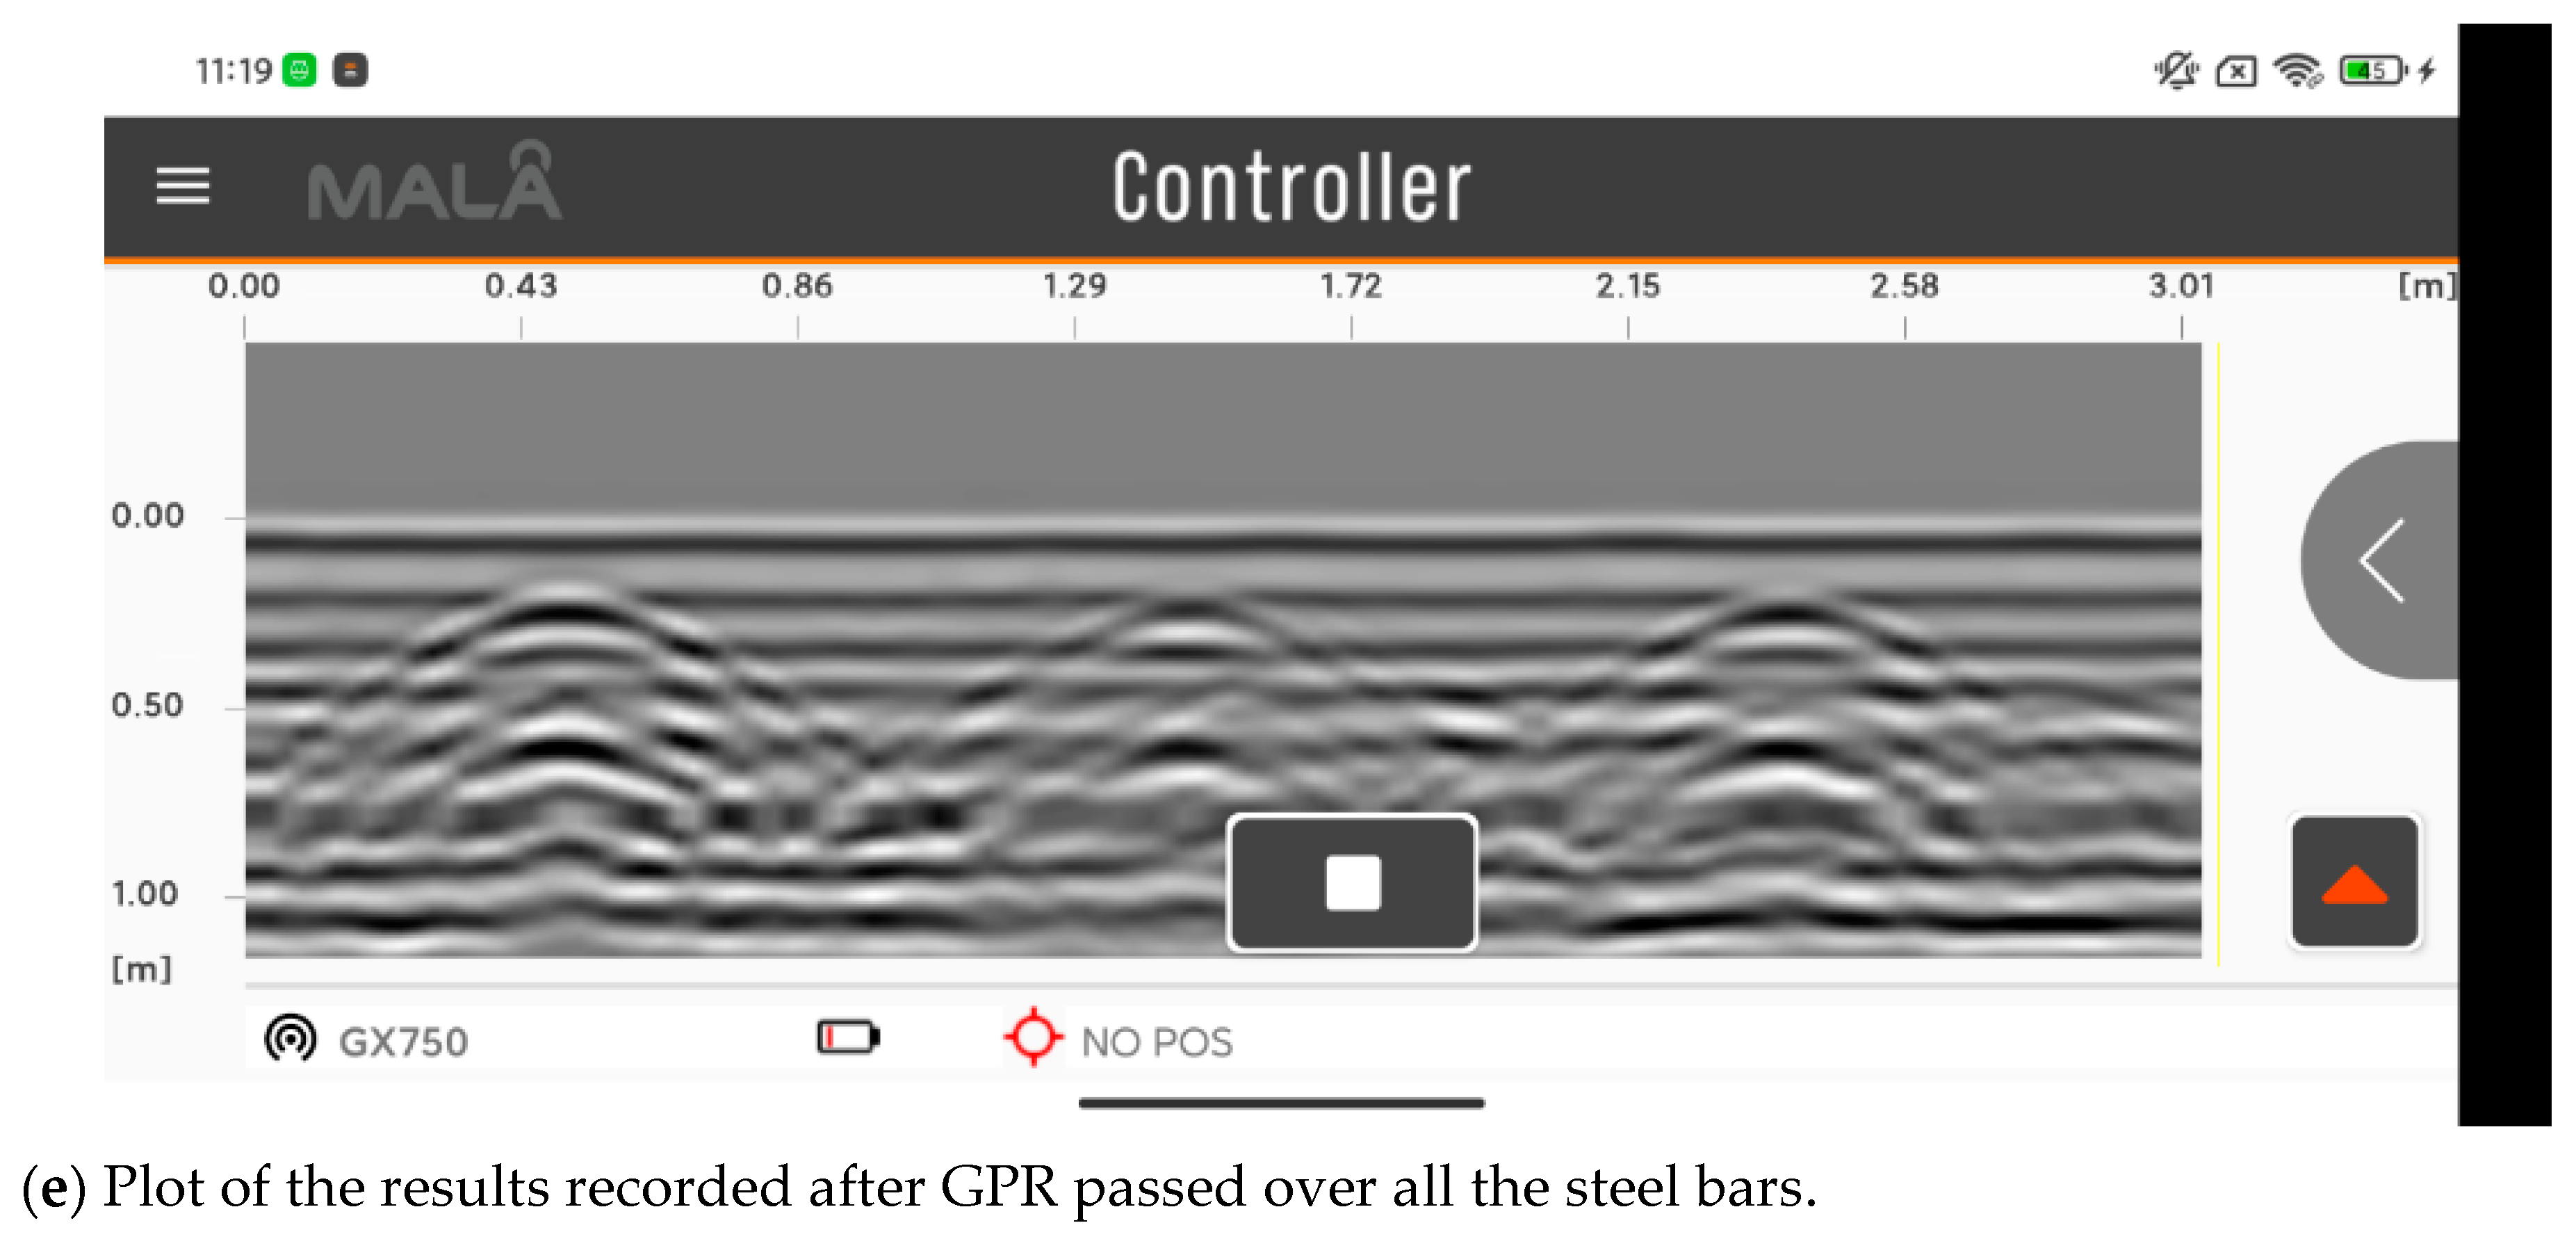
Figure 9e is a screenshot of the computer reading the MALA Controller software interface when the GPR instrument has completely crossed the buried position of the third piece of rebar. A screenshot of MALA Controller software interface is shown in Figure 9e.
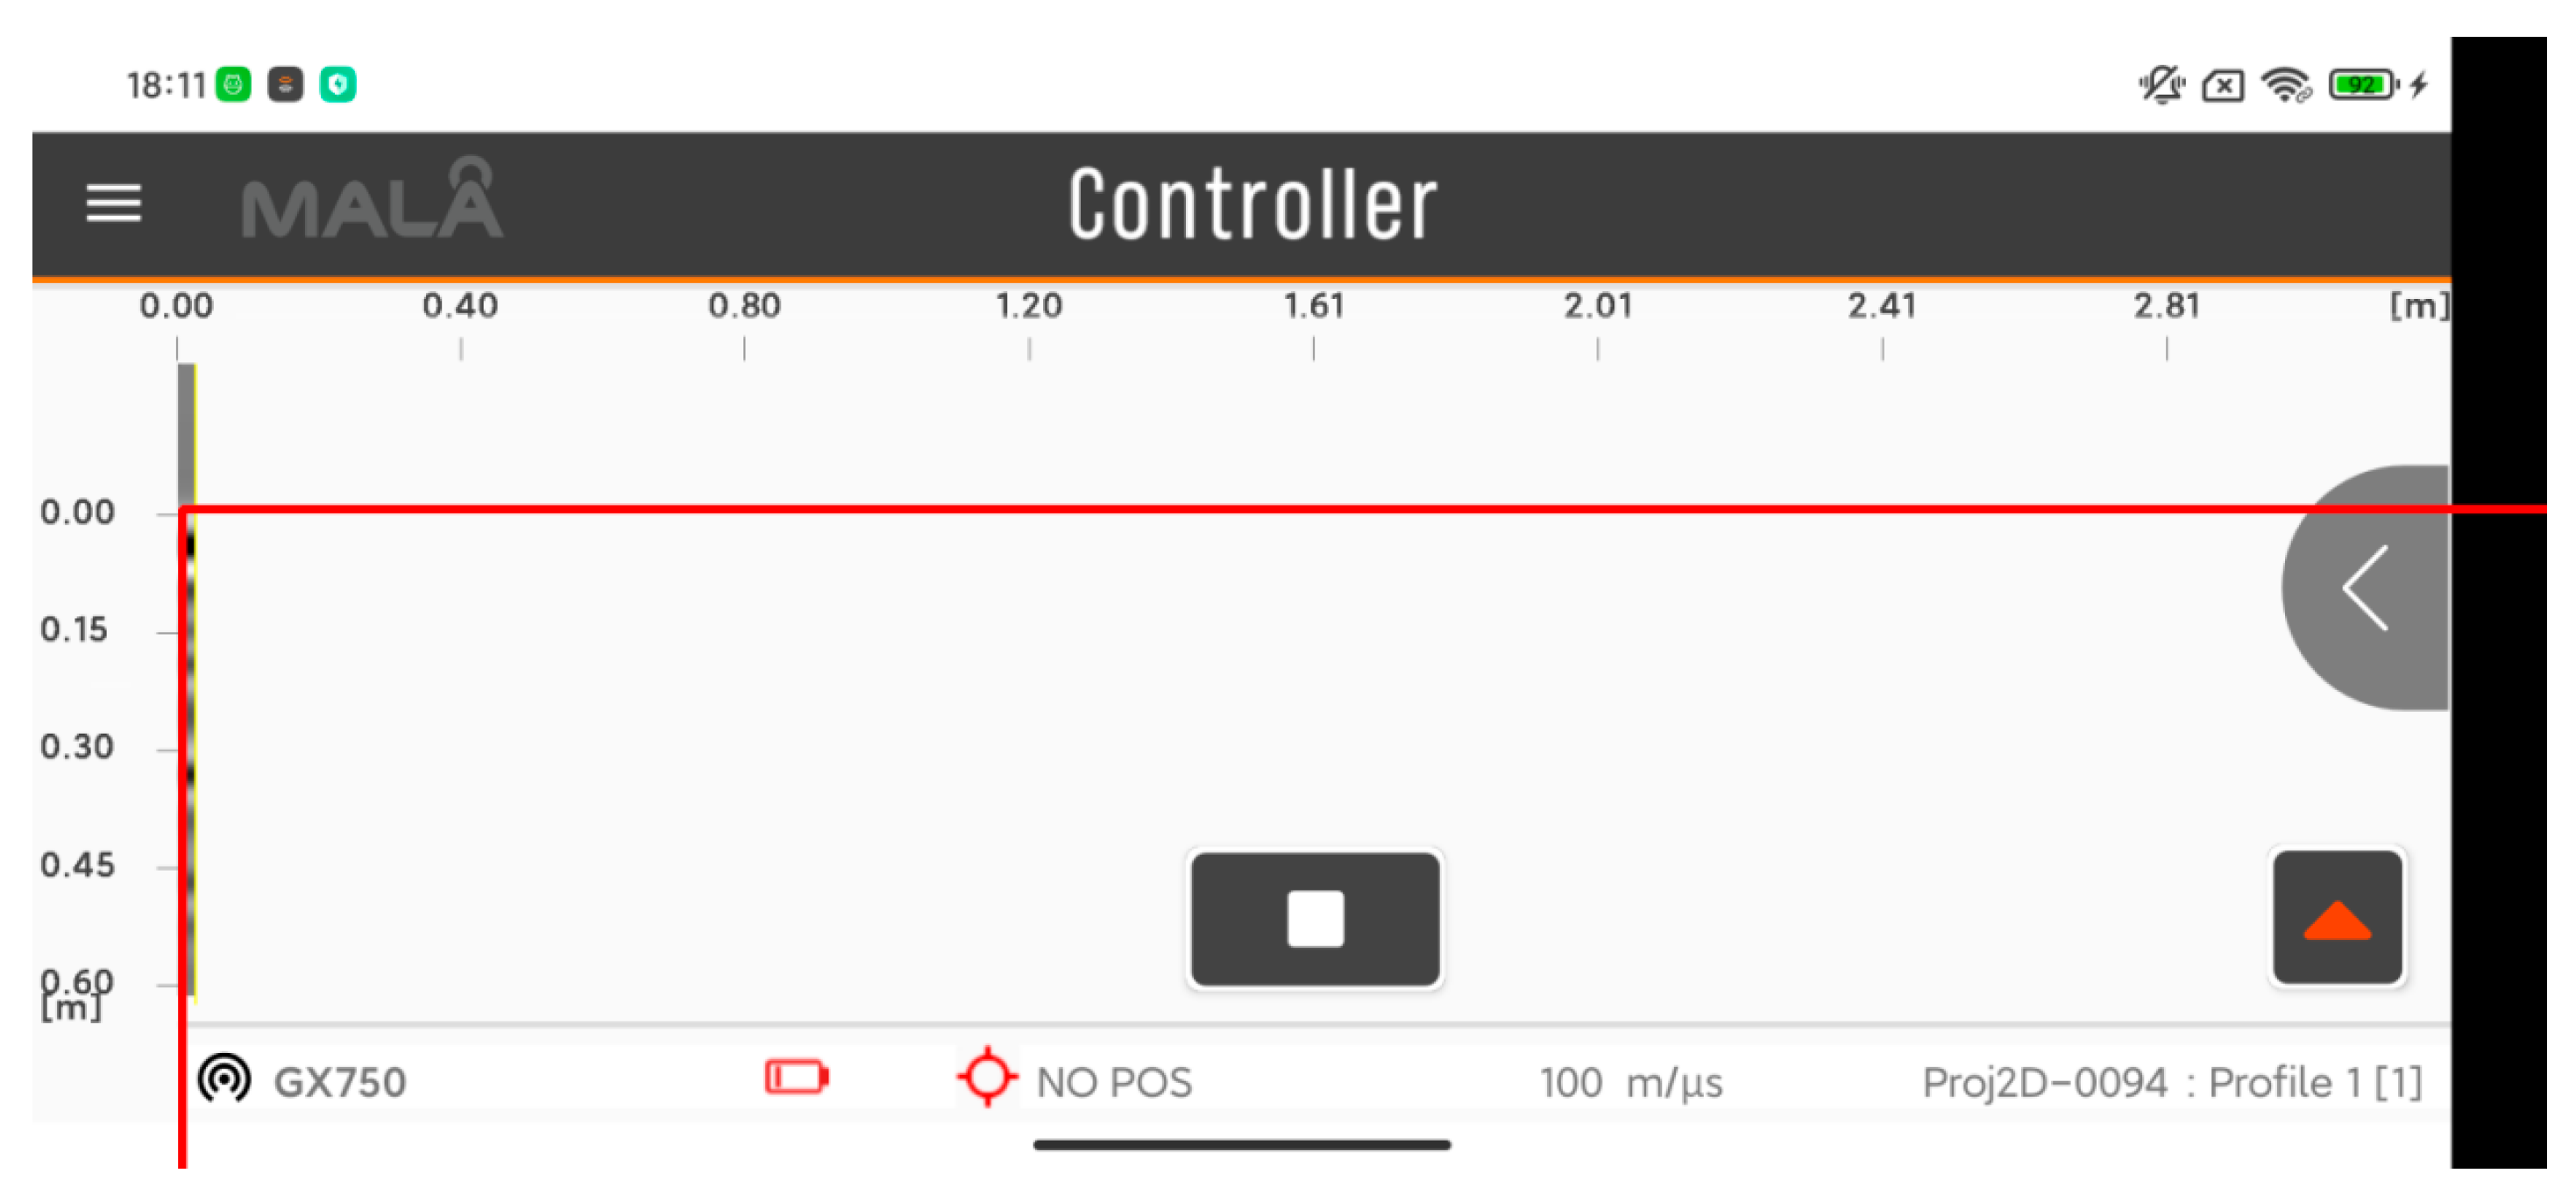
After we acquired the GPR images using MALA Controller software and intercepted the cell phone screen with ADB tool, according to the characteristics of the MALA Controller software interface, the image pixel coordinates were re-established after finding the imaging part of the GPR in the MALA Controller software interface. The image pixel coordinates before re-establishment are shown in Figure 10.
We found the GPR-imaging section in the MALA Controller software interface and established new image pixel coordinates based on this. The re-established image pixel coordinates are shown in Figure 11.
Next, we choose a certain length of pixel vertical coordinates as the unit pixel depth; for example, note that the pixel vertical coordinate corresponding to 0.00 in the vertical coordinate is y 1 , while the actual burial depth is d 1 ; note that the pixel vertical coordinate corresponding to 0.45 in the vertical coordinate is y 2 , while the actual burial depth is d 2 . Then, in the image pixel coordinate system, the difference between y 2 and y 1 describes the difference between d 2 and d 1 with respect to the local coordinate difference, which is the depth of 0.45 m.
We read the pixel coordinates of the YOLOv5 prediction frame on the image; find the pixel vertical coordinate Y of the foreign object, i.e., the peak of the hyperbola; and then use linear interpolation to solve for the burial depth of the foreign object in the local coordinate D. The solution formula is shown in Equation (5).
Y y 1 y 2 y 1 = D d 1 d 2 d 1  
Since, in the process of the GPR detection of underground foreign objects, the depth coordinate axis in the image does not change with the change in the GPR moving distance, then the burial depth obtained by selecting the 0.00 point under the new pixel coordinate system as the starting point is the burial depth in local coordinates.
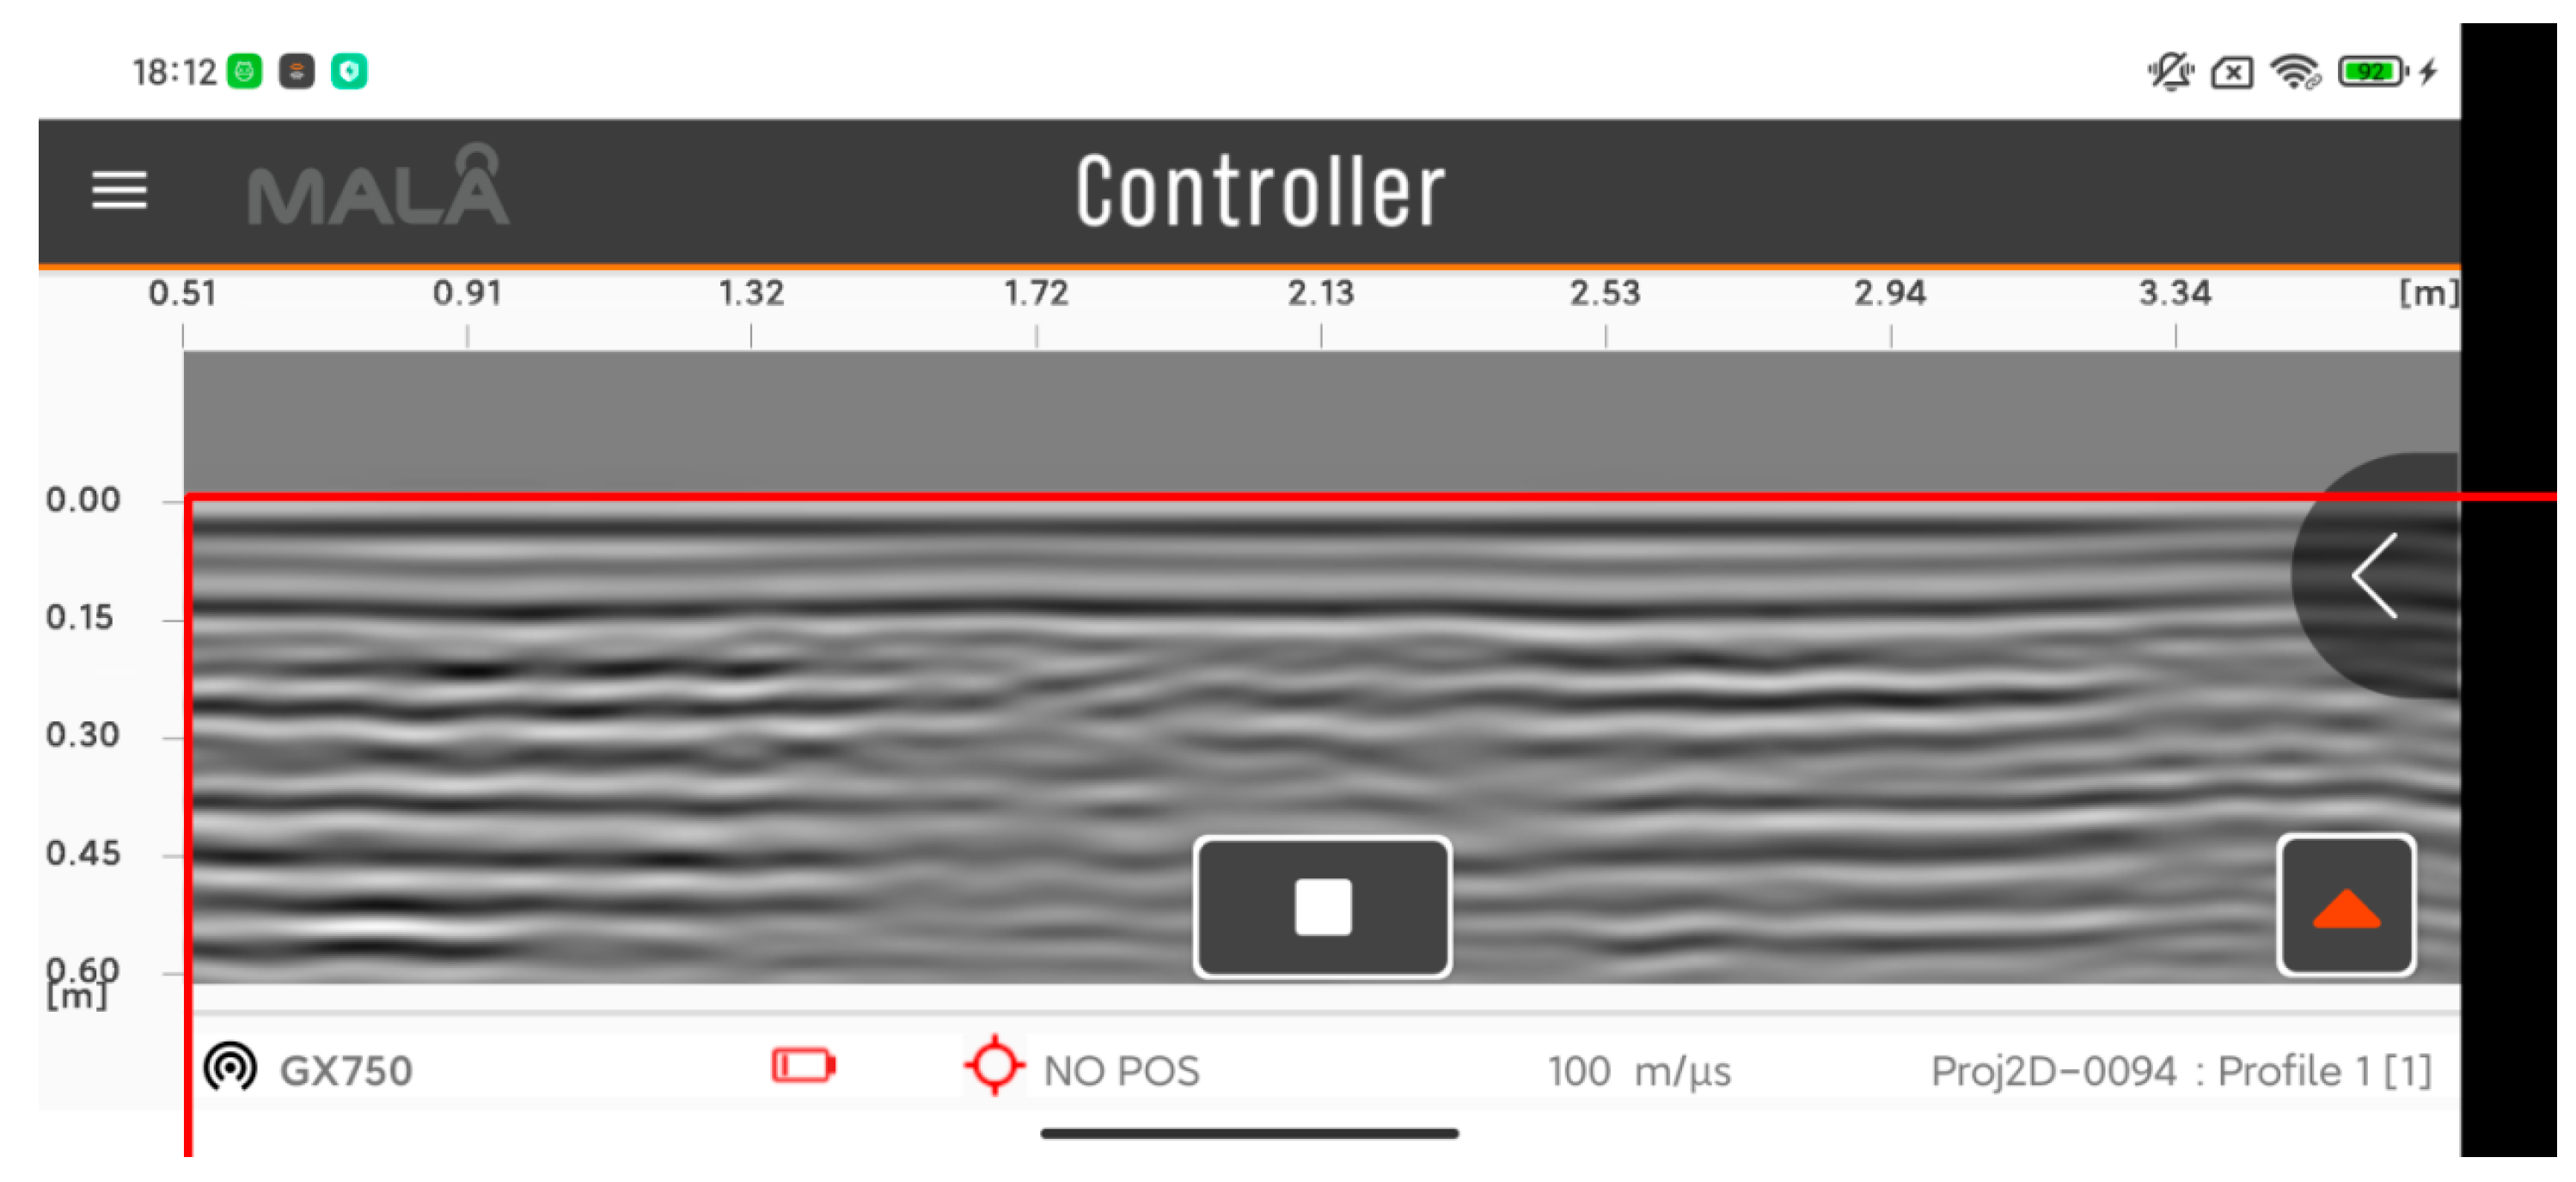
However, when the GPR probes more than a certain distance along the survey line, i.e., when the GPR receives more than a certain number of columns of signal data, the MALA Controller software will only image the last N columns of signal data and refresh the horizontal coordinates of the MALA Controller software interface at the same time. Therefore, when the GPR moves more than a certain distance, the value of the horizontal axis of the MALA Controller software interface will change, i.e., the distance represented by the starting point in the new pixel coordinate system will change. Therefore, in order to obtain the distance of the target foreign object in the actual GPR moving along the measuring line’s direction, in addition to the above-mentioned linear difference method, the distance of the GPR moving along the measuring line direction corresponding to the starting point under the new pixel coordinate system should be added. Take Figure 12 as an example: at this point the distance represented by the point 0.00 of the new pixel coordinates is 0.51 m.
Since the position of the measuring line distance axis of the ground-penetrating radar in the GPR image is fixed, we only need to identify the coordinates of the starting point and the ending point of the measuring line distance axis in the image and read out the pixel coordinates of the starting point and the ending point of the measuring line distance axis and the hyperbola vertex of the soil-situated hard foreign matter; then, we can obtain the measuring line distance of the soil-situated hard foreign matter through the linear interpolation method.
In order to solve the above problem, we first obtain the digital images containing only the starting and ending points of the distance axis of the measurement line corresponding to 0.51 and 3.34 in Figure 12 by cutting the images, and then use the recognition engine of Tesseract-OCR to perform OCR text recognition on the cut digital picture, OCR text recognition is then performed on the clipped digital images using Tesseract OCR’s recognition engine. Thus, the distance of the measured line from the start point of the axis and the end one are obtained.
Finally, the distance between the local coordinates of the starting point and the end point of the line of sight distance axis identified by OCR, as well as the starting point and the end point of the line of sight distance axis, and the pixel coordinates of the target foreign object in the ground-penetrating radar image are used to obtain the position of the soil hard foreign object along the measurement line by linear interpolation method. The position equation of the target foreign object in the GPR displacement direction is shown in Equation (6).
X x 1 x 2 x 1 = S s 1 s 2 s 1  
where X is the pixel horizontal coordinate of the target foreign object parabola in the GPR image, x 1 is the new pixel horizontal coordinate of the start point of the distance axis of the measurement line, x 2 is the new pixel horizontal coordinate of the end point of the distance axis of the measurement line, S is the distance of the target foreign object in local coordinates along the measurement line, s 1 is the distance of the start point of the distance axis of the measurement line in local coordinates along the measurement line, s 2 is the distance of the end point of the distance axis of the measurement line in local coordinates along the measurement line.
The abscissa in the GPR image is shown in 
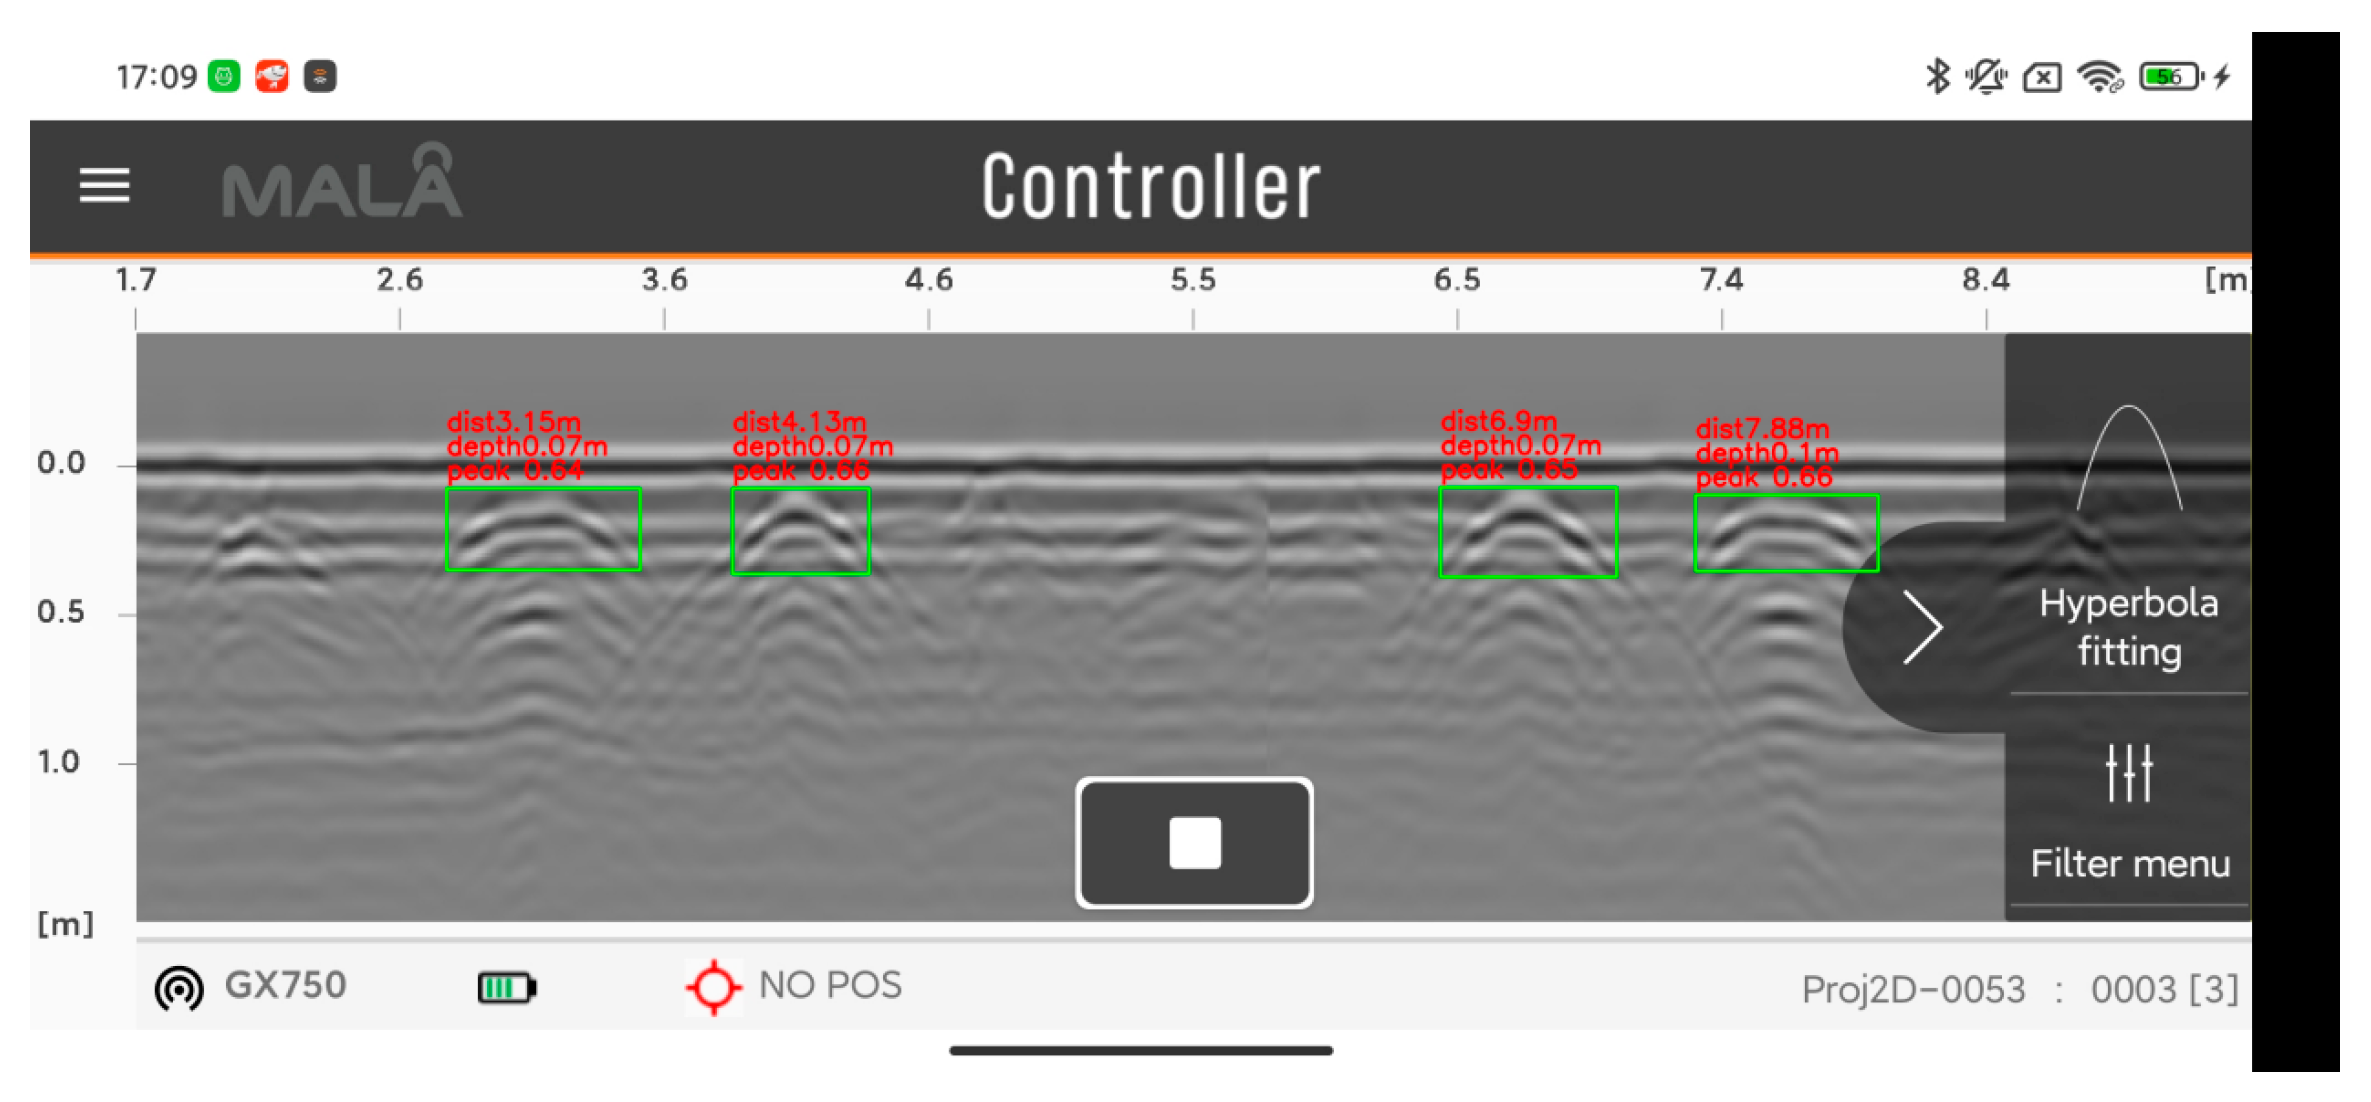
Figure 13, we recognize that the starting point of the distance axis of the current survey line is 0.51 and the ending point is 3.34 through the OCR text recognition algorithm; then, we can read that the new pixel abscissa of the image corresponding to the starting point (0.51) is 0, the new pixel abscissa of the image corresponding to the end point (3.34) is 400, and the new pixel abscissa of the image corresponding to the hyperbola vertex of the soil-situated hard foreign object is 100. Consequently, the lateral distance (dist) of the soil-situated hard foreign object is shown in Equation (7).
dist 0.51 100 0 = 3.34 0.51 400 0
Similarly, through the observation of the depth coordinate axis and the reading of pixel coordinates, the burial depth of soil-situated hard foreign matter can be obtained with the help of linear interpolation method
The burial depth and displacement position obtained by linear interpolation method are shown in Figure 14.

3. Results and Discussion

We carried out detection experiments in the soil platform of the Key Laboratory of the Ministry of Education of Southern Agricultural Machinery and Equipment. We selected 15 cm long steel bars as foreign matter in the examined soil. The buried depth of the steel bars is 15 cm, and the buried positions are 50 cm, 150 cm, and 250 cm away from the starting point. The specific buried positions are shown in Figure 8.
We used the MALA GX 750 HDR instrument developed by the MALA Company to carry out detection experiments. The instrument collected 412 samples in each channel with a sampling spacing of 0.015 m; the diameter of the ranging wheel of the GPR instrument was 17 cm, and the propagation speed of the electromagnetic wave we selected in the soil medium was 100 m/µs.
In order to more clearly show the accuracy of the hyperbola position of the target in the GPR image detected by the detection system, the position where the GPR initiates detection each time is fixed during the GPR experiment. Therefore, we only need to read the pixel coordinates of the starting and ending points of the distance axis in the GPR image and the coordinates of the parabolic vertex in the GPR image, and then obtain the position of the rebar on the survey line through a linear interpolation.
Firstly, we used the MALA Controller mobile software to read the GPR data in real time and visualize it; then, the computer acquired the visualized GPR data in real time through the ADB tool, and the YOLOv5 algorithm automatically detected the hyperbola of the GPR image acquired by the ADB tool in real time. Consequently, the hyperbolic vertex pixel coordinates were obtained according to the position of the box, and the real-time location of the foreign matter in the soil was realized by linear interpolation. Finally, we compared and analyzed the error between the positioning results of our real-time detection system and the actual position.
We used the built real-time detection system for an indoor detection test; the real-time identification results output by the system in the detection process are shown in Figure 15; Figure 15a shows the real-time detection system used to identify the detection results of the GPR after the first piece of rebar was detected; Figure 15b shows the real-time detection system used to identify the detection results of GPR after detecting the second piece of rebar; and Figure 15c shows the real-time detection system used to identify the GPR results following the detection of the third piece of rebar. From Figure 15c, it can be seen that the three target bodies can be marked in real time, and the detection result map also marks the burial depth and the distance from the detection zero position of the three rebar pieces identified by the system.
We used the real-time detection system along the detection direction to repeat the test five times. The comparison of the results regarding the detection of rebar along the detection line direction from the GPR detection starting point’s location and the actual burial distance is shown in Table 2, while the comparison of the results obtained by the real-time detection system regarding the detection of the buried depth of the rebar and the actual buried location is shown in Table 3.
From Table 2 and Table 3, we can see that the average error of the depth of rebar detected by the constructed real-time detection system is within 0.02 m, and the error of detecting rebar along the measurement line from the location of the starting point of GPR detection is within 0.08 m, as seen from the test results regarding the detection of different diameters of rebar in five groups.

4. Conclusions

In this study, a detection system based on ground-penetrating radar and the YOLOv5 algorithm for automatically detecting target characteristic curves in ground-penetrating radar images was built, and the YOLOv5 network framework was used to detect the feature curves of the GPR pictures and accurately locate the targets after detection, which achieved the real-time detection of GPR pictures and the accurate localization of soil-situated foreign objects in GPR pictures. The contributions of this paper are as follows.
(1) We built a real-time detection system, used the ABD tool to take continuous screenshots of the employed cell phone screen when using the GPR instruments for detection, and used the YOLOv5 algorithm for the real-time target detection of GPR images, which successfully achieved ideal results regarding the detection of the target features of GPR images.
(2) Using soil-situated foreign object localization based on the linear interpolation method, we converted the pixel coordinates of soil-situated foreign object features in GPR images into local coordinates to determine the specific burial locations of soil-situated foreign objects. Then, we read the pixel coordinates of the YOLOv5 prediction frame on the images; ascertained the pixel longitudinal coordinates of foreign objects, i.e., the peak of the hyperbola; and then used the linear interpolation method to solve for the burial location of the soil-situated foreign objects in local coordinates.
Since the Faster RCNN, SSD, and YOLOv5 algorithms used herein are only image target detection algorithms, which are mainly used for the automatic detection of hyperbolas in GPR images, at this stage, the algorithms we used do not process the parameters of GPR signals. Therefore, in our future research work, we will use the algorithm to process the parameters of GPR signals and conduct in-depth research in this direction.

Author Contributions

Conceptualization, Z.Z. and Z.Q.; methodology, Z.Q.; software, J.Z.; validation, H.Y.; formal analysis, W.T.; investigation, J.L.; writing—original draft preparation, Z.Q.; writing—review and editing, J.Z. and H.Y.; funding acquisition, Z.Z. All authors have read and agreed to the published version of the manuscript.

Funding

The authors would like to acknowledge the support of this study provided by the Guangdong Provincial Department of Agriculture’s Modern Agricultural Innovation Team Program for Animal Husbandry Robotics (Grant No. 2019KJ129), the State Key Research Program of China (Grant No. 2016YFD0700101), the Vehicle Soil Parameter Collection and Testing Project (Grant No. 4500-F21445), and the Special project of Guangdong Provincial Rural Revitalization Strategy in 2020 (YCN [2020] No. 39) (Fund No. 200-2018-XMZC-0001-107-0130).

Data Availability Statement

Not applicable.

Conflicts of Interest

The authors declare no conflict of interest.

References

  1. Li, Y.; Zhao, Z.; Xu, W.; Liu, Z.; Wang, X. An effective FDTD model for GPR to detect the material of hard objects buried in tillage soil layer. Soil Tillage Res. 2019, 195, 104353. [Google Scholar] [CrossRef]
  2. Meschino, S.; Pajewski, L.; Pastorino, M.; Randazzo, A.; Schettini, G. Detection of subsurface metallic utilities by means of a SAP technique: Comparing MUSIC- and SVM-based approaches. J. Appl. Geophys. 2013, 97, 60–68. [Google Scholar] [CrossRef]
  3. Zhang, X.; Derival, M.; Albrecht, U.; Ampatzidis, Y. Evaluation of a Ground Penetrating Radar to Map the Root Architecture of HLB-infected Citrus Trees. Agronomy 2019, 9, 354. [Google Scholar] [CrossRef] [Green Version]
  4. Hong, W.; Kang, S.; Lee, S.J.; Lee, J. Analyses of GPR signals for characterization of ground conditions in urban areas. J. Appl. Geophys. 2018, 152, 65–76. [Google Scholar] [CrossRef]
  5. Krysiński, L.; Sudyka, J. GPR abilities in investigation of the pavement transversal cracks. J. Appl. Geophys. 2013, 97, 27–36. [Google Scholar] [CrossRef]
  6. Abouhamad, M.; Dawood, T.; Jabri, A.; Alsharqawi, M.; Zayed, T. Corrosiveness mapping of bridge decks using image-based analysis of GPR data. Autom. Constr. 2017, 80, 104–117. [Google Scholar] [CrossRef]
  7. Cuenca-García, C.; Risbøl, O.; Bates, C.R.; Stamnes, A.A.; Skoglund, F.; Ødegård, Ø.; Viberg, A.; Koivisto, S.; Fuglsang, M.; Gabler, M.; et al. Sensing Archaeology in the North: The Use of Non-Destructive Geophysical and Remote Sensing Methods in Archaeology in Scandinavian and North Atlantic Territories. Remote Sens. 2020, 12, 3102. [Google Scholar] [CrossRef]
  8. Papadopoulos, N.; Sarris, A.; Yi, M.; Kim, J. Urban archaeological investigations using surface 3D Ground Penetrating Radar and Electrical Resistivity Tomography methods. Explor. Geophys. 2018, 40, 56–68. [Google Scholar] [CrossRef]
  9. Li, W.; Cui, X.; Guo, L.; Chen, J.; Chen, X.; Cao, X. Tree Root Automatic Recognition in Ground Penetrating Radar Profiles Based on Randomized Hough Transform. Remote Sens. 2016, 8, 430. [Google Scholar] [CrossRef] [Green Version]
  10. Jin, Y.; Duan, Y. A new method for abnormal underground rocks identification using ground penetrating radar. Measurement 2020, 149, 106988. [Google Scholar] [CrossRef]
  11. Shuang-Fei, L.I.; Jia-Cun, L.I.; Zhang, D. Topographic correction of GPR profiles based on differential GPS. J. Geomech. 2022, 22, 771–777. [Google Scholar]
  12. Chae, J.; Ko, H.Y.; Lee, B.G.; Kim, N. A Study on the Pipe Position Estimation in GPR Images Using Deep Learning Based Convolutional Neural Network. J. Internet Comput. Serv. 2019, 20, 39–46. [Google Scholar]
  13. Wang, S.; Al-Qadi, I.L.; Cao, Q. Factors Impacting Monitoring Asphalt Pavement Density by Ground Penetrating Radar. NDT E Int. 2020, 115, 102296. [Google Scholar] [CrossRef]
  14. Jin, Y.; Duan, Y. Wavelet Scattering Network-Based Machine Learning for Ground Penetrating Radar Imaging: Application in Pipeline Identification. Remote Sens. 2020, 12, 3655. [Google Scholar] [CrossRef]
  15. Jiao, L.; Ye, Q.; Cao, X.; Huston, D.; Xia, T. Identifying concrete structure defects in GPR image. Measurement 2020, 160, 107839. [Google Scholar] [CrossRef]
  16. Yuan, C.; Cai, H. Spatial reasoning mechanism to enable automated adaptive trajectory planning in ground penetrating radar survey. Automat. Constr. 2020, 114, 103157. [Google Scholar] [CrossRef]
  17. Rajiv, K. Multi-Feature Based Multiple Pipelines Detection Using Ground Penetration Radar. Int. J. Comput. Intell. Res. 2017, 13, 1123–1138. [Google Scholar]
  18. Shaw, M.R.; Millard, S.G.; Molyneaux, T.C.K.; Taylor, M.J.; Bungey, J.H. Location of steel reinforcement in concrete using ground penetrating radar and neural networks. NDT E Int. 2005, 38, 203–212. [Google Scholar] [CrossRef]
  19. Li, Y.; Liu, C.; Yue, G.; Gao, Q.; Du, Y. Deep learning-based pavement subsurface distress detection via ground penetrating radar data. Automat. Constr. 2022, 142, 104516. [Google Scholar] [CrossRef]
  20. Wang, Y.; Qin, H.; Tang, Y.; Zhang, D.; Wang, Z.; Pan, S. A deep learning network to improve tunnel lining defect identification using ground penetrating radar. IOP Conf. Ser. Earth Environ. Sci. 2021, 861, 42057–42058. [Google Scholar] [CrossRef]
  21. Dinh, K.; Gucunski, N.; Duong, T.H. An algorithm for automatic localization and detection of rebars from GPR data of concrete bridge decks. Automat. Constr. 2018, 89, 292–298. [Google Scholar] [CrossRef]
  22. Qin, H.; Zhang, D.; Tang, Y.; Wang, Y. Automatic recognition of tunnel lining elements from GPR images using deep convolutional networks with data augmentation. Automat. Constr. 2021, 130, 103830. [Google Scholar] [CrossRef]
  23. Cui, F.; Ning, M.; Shen, J.; Shu, X. Automatic recognition and tracking of highway layer-interface using Faster R-CNN. J. Appl. Geophys. 2022, 196, 104477. [Google Scholar] [CrossRef]
  24. Park, S.; Kim, J.; Jeon, K.; Kim, J.; Park, S. Improvement of GPR-Based Rebar Diameter Estimation Using YOLO-v3. Remote Sens. 2021, 13, 2011. [Google Scholar] [CrossRef]
  25. Liu, H.; Lin, C.; Cui, J.; Fan, L.; Xie, X.; Spencer, B.F. Detection and localization of rebar in concrete by deep learning using ground penetrating radar. Automat. Constr. 2020, 118, 103279. [Google Scholar] [CrossRef]
  26. Tešić, K.; Baričević, A.; Serdar, M. Non-Destructive Corrosion Inspection of Reinforced Concrete Using Ground-Penetrating Radar: A Review. Materials 2021, 14, 975. [Google Scholar] [CrossRef]
  27. Li, Y.; Zhao, Z.; Luo, Y.; Qiu, Z. Real-Time Pattern-Recognition of GPR Images with YOLO v3 Implemented by Tensorflow. Sensors 2020, 20, 6476. [Google Scholar] [CrossRef] [PubMed]
  28. Li, S.; Gu, X.; Xu, X.; Xu, D.; Zhang, T.; Liu, Z.; Dong, Q. Detection of concealed cracks from ground penetrating radar images based on deep learning algorithm. Constr. Build. Mater. 2021, 273, 121949. [Google Scholar] [CrossRef]
  29. Ishitsuka, K.; Iso, S.; Onishi, K.; Matsuoka, T. Object Detection in Ground-Penetrating Radar Images Using a Deep Convolutional Neural Network and Image Set Preparation by Migration. Int. J. Geophys. 2018, 2018, 9365184. [Google Scholar] [CrossRef]
  30. Redmon, J.; Divvala, S.; Girshick, R.; Farhadi, A. You only look once: Unified, real-time object detection. In Proceedings of the IEEE Conference on Computer Vision and PATTERN Recognition, Las Vegas, NV, USA, 27–30 June 2016; pp. 779–788. [Google Scholar]
  31. Redmon, J.; Farhadi, A. YOLOv3: An Incremental Improvement. arXiv 2018, arXiv:1804.02767. [Google Scholar]
Figure 1. Parabolic target feature marker.
Horticulturae 08 01116 g001
Figure 2. Partial GPR Dataset Diagram.
Horticulturae 08 01116 g002
Figure 3. YOLOv5s network structure.
Horticulturae 08 01116 g003
Figure 4. Comparison of the effect of YOLOv5 algorithm and other two target detection algorithms in actual detection.
Horticulturae 08 01116 g004aHorticulturae 08 01116 g004b
Figure 5. Components of the GPR real-time detection system.
Horticulturae 08 01116 g005
Figure 6. Flow chart for building a real-time detection and identification system.
Horticulturae 08 01116 g006
Figure 7. Schematic diagram of real-time acquisition of GPR image.
Horticulturae 08 01116 g007
Figure 8. Test diagram of indoor real-time detection of steel bars.
Horticulturae 08 01116 g008
Figure 9. The ABD tool captures part of the process of the mobile phone screen.
Horticulturae 08 01116 g009aHorticulturae 08 01116 g009bHorticulturae 08 01116 g009c
Figure 10. Image pixel coordinate diagram before reconstruction.
Horticulturae 08 01116 g010
Figure 11. Reconstructed image pixel coordinate map.
Horticulturae 08 01116 g011
Figure 12. Reconstructed image pixel coordinate map.
Horticulturae 08 01116 g012
Figure 13. Abscissa in GPR image.
Horticulturae 08 01116 g013
Figure 14. Buried depth and displacement position map obtained by linear interpolation.
Horticulturae 08 01116 g014
Figure 15. Target location results of ground-penetrating radar images.
Horticulturae 08 01116 g015
Table 1. Performance comparison of detection algorithms.
Faster RCNNSSDYOLOv5
P0.4990.8650.893
R0.8270.3920.706
AP0.7150.6040.805
F10.620.540.65
inference time54.9 ms9.6 ms11 ms
weight108 MB91.1 MB13.7 MB
Table 2. Comparison of the distance between the steel bar detected by the ground-penetrating radar real-time detection system and the actual buried distance (unit/m).
Rebar 1Rebar 2Rebar 3
The actual burial distance of the rebar0.501.502.50
The value of the first measurement distance0.521.472.42
The value of the second measurement distance0.521.462.42
The value of the third measurement distance0.521.472.43
The value of the fourth measurement distance0.521.462.42
The value of the fifth measurement distance0.521.462.42
The average error0.0200.0360.078
Root mean square error0.0200.0360.078
Table 3. Comparison of the depth between the steel bar detected by the ground-penetrating radar real-time detection system and the actual buried depth (unit/m).
Rebar 1Rebar 2Rebar 3
The actual burial depth of rebar0.150.150.15
The value of the first measurement depth0.160.160.17
The value of the second measurement depth0.150.150.16
The value of the third measurement depth0.160.150.16
The value of the fourth measurement depth0.160.170.17
The value of the fifth measurement depth0.150.170.17
The average error0.0060.0100.016
Root mean square error0.0080.0130.017
Publisher’s Note: MDPI stays neutral with regard to jurisdictional claims in published maps and institutional affiliations.

