Article

Growth and Quality of Strawberry (Fragaria ananassa Dutch. cvs. ‘Kuemsil’) Affected by Nutrient Solution Supplying Control System Using Drainage Rate in Hydroponic Systems

1
Vegetable Research Division, National Institute of Horticultural and Herbal Science, Rural Development Administration, Wanju 55365, Korea
2
Postharvest Technology Division, National Institute of Horticultural and Herbal Science, Rural Development Administration, Wanju 55365, Korea
*
Authors to whom correspondence should be addressed.
Horticulturae 2022, 8(11), 1059; https://doi.org/10.3390/horticulturae8111059
Submission received: 11 October 2022 / Revised: 27 October 2022 / Accepted: 7 November 2022 / Published: 11 November 2022
(This article belongs to the Section Fruit Production Systems)

Abstract

:
Although hydroponic techniques enable intensive and effective crop management, controlling the watering for each crop type and growth stage is challenging using the commonly used timed watering system. Therefore, excessive and insufficient watering occurs frequently. Hydroponic technology that considers the drainage rate can minimize the amount of drainage, thereby reducing environmental pollution and fertilizer consumption. This study compared the drainage rate and the timed watering methods in a strawberry hydroponic system and determined the optimal drainage rate. As the drainage rate increased, the amount of water supplied increased. A significantly negative correlation was found between the amount of water supplied and the total nitrogen content. Drainage electrical conductivity (EC) level was the highest in the 10% drainage rate group. In the 20% drainage rate treatment, leaf length and width increased compared to the four applications timer-supplying method. The yield of fruits weighing more than 27 g was the highest in the 20% drainage rate treatment. Therefore, the 20% drainage rate treatment was the most appropriate. We propose that it is possible to reduce unnecessary fertilizer consumption and increase productivity by controlling the water supply using the drainage rate for precise water supply management of strawberries.

1. Introduction

Korean strawberry production amounted to 1.23 billion won and 163 thousand tons [1] in 2020. It ranked first among horticultural crops and is the main income crop for farms. In 2021, the greenhouse strawberry cultivation area was 6057 ha, and the open field cultivation area was only 46 ha, accounting for less than 1% of the total strawberry cultivation area. The hydroponic cultivation area for strawberries was expanded to 1596 ha in 2020 [2].
Hydroponics using an artificial substrate can provide physical and chemical conditions suitable for nutrient absorption by plants [3]. Intensive and effective crop management can be achieved using hydroponic techniques that supply nutrients to crops using a nutrient solution in the substrates [4]. In hydroponics, water supply control is performed to maintain crop growth in an optimal state, minimize loss of substrates, and improve quality [5]. The timer control method used on most farms sets the watering time using a timer. It is the cheapest and simplest to install and operate; however, it is difficult to control the watering according to crops, cultivars, growth stages, and seasons, and the amount of watering is excessive [6,7,8,9,10]. An appropriate balance of solid, gaseous, and liquid phases is required to create an optimal rhizosphere state for plant growth [11].
Along with expanding the hydroponic area, most of the hydroponic farms in Korea are growing crops in open hydroponic systems. The high usage volumes of the nutrient solution increase the production cost and the residual fertilizer in the discharged nutrient solution results in environmental pollution [12]. Vegetable crops can grow under conditions of low nutrient concentration when the rhizosphere buffering capacity is high [13], which means that in hydroponics, the yield and quality of crops are not affected by short-term nutrient depletion [14]. Therefore, it is possible to use a strategy to reduce nutrient discharge during hydroponics cultivation and improve the efficiency of water and nutrients by controlling the amount of nutrient solution discharged [15]. Hydroponic technology considering the drainage rate can reduce fertilizer consumption by supplying the level of water and nutrients required by crops to minimize drainage and prevent environmental pollution [16].
This study was conducted to determine an appropriate watering method by comparing the irrigation characteristics of the timed and drainage rate watering control methods, which are used as farmhouse practices in the hydroponic cultivation of strawberries. Additionally, we analyzed the growth and quality of strawberries cultivated using each watering method.

2. Materials and Methods

2.1. Plant Materials and Cultivation Management

This experiment was conducted in a single plastic greenhouse (width 7 m, length 40 m) of the National Institute of Horticultural and Herbal Science in Wanju-gun, Jeollabuk-do. A multi-pot with 8 planting spaces (Multicup pot type A; Hwasung Industrial Co., Ltd., Jinju, Korea) with a planting distance of 17 cm was placed on high beds (28 cm width, 90 cm bed distance) and filled with a horticultural strawberry substrate (Chamgeuro Industrial Co., Ltd., Hongseong, Korea). On 9 August 2021, 1 dripper (Netafim, Hatzerim, Israel) was inserted into each pot to water the substrate with groundwater (EC 0.34 dS m−1, pH 7.26). The greenhouse was solar sterilized and closed until planting. On 16 September 2021, ‘Fragaria × ananassa Duch. cvs. ‘Kuemsil’’ strawberry plants were planted in the multi-pots, one per pot. Strawberries were grown in 15 beds placed in five rows and three columns in the greenhouse. Each bed was 4 m long, and 6 multi-pots were used per bed. The standard nutrient solution prescribed by the National Institute of Horticultural and Herbal Science [17] for strawberries was supplied (macroelements: NO3-N 6.0 me∙L−1, NH4-N 0.2 me∙L−1, PO4-P 2.0 me∙L−1, K 3.5 me∙L−1, Ca 3.0 me∙L−1, Mg 1.0 me∙L−1, SO4-S 1.0 me∙L−1; microelements: Fe 1.30 mg∙L−1, B 0.30 mg∙L−1, Mn 0.30 mg∙L−1, Zn 0.3 mg∙L−1, Cu 0.02 mg∙L−1, Mo 0.01 mg∙L−1). The temperature and relative humidity in the greenhouse during the cultivation period were measured at 5-s intervals using an environment data logger (FarmingOn2; IReIS Inc., Gangreung, Korea). The average monthly temperature inside the greenhouse during the cultivation period was 14.6 °C in December, 14.7 °C in January, 15.7 °C in February, and 16.5 °C in March. The relative humidity was 4.1% in December, 69.6% in January, 65.5% in February, and 69.5% in March.

2.2. Irrigation Treatment

The water supply using the drainage rate as the control was performed using an irrigation program (RNFarm; IReIs Inc., Gangreung, Korea). In all treatments, the volume of a one-time supply was 50 mL, and the first supply occurred at 9:00. The drainage rate (drainage amount/irrigation amount × 100) was calculated every 1 min by measuring the amount of nutrient solution supplied and the amount of drainage. When the measured drainage rate was less than 10%, 20%, or 30% 1hour after the first watering, the next watering was performed. No water supply occurred after 18:00, and the number of supplies was set at a maximum of 8 applications to prevent excessive water supply. As controls, the nutrient solution was supplied by fixing the supplying volume to 50 mL for the one-time irrigation amount of the timer control method. The first timer control fixed the watering time at daily 9:00, 11:00, 14:00, and 16:00; 4 applications daily. The second timer control was set for 8:30, 10:30, 12:00, 13:00, 15:00, and 16:00; 6 applications daily.

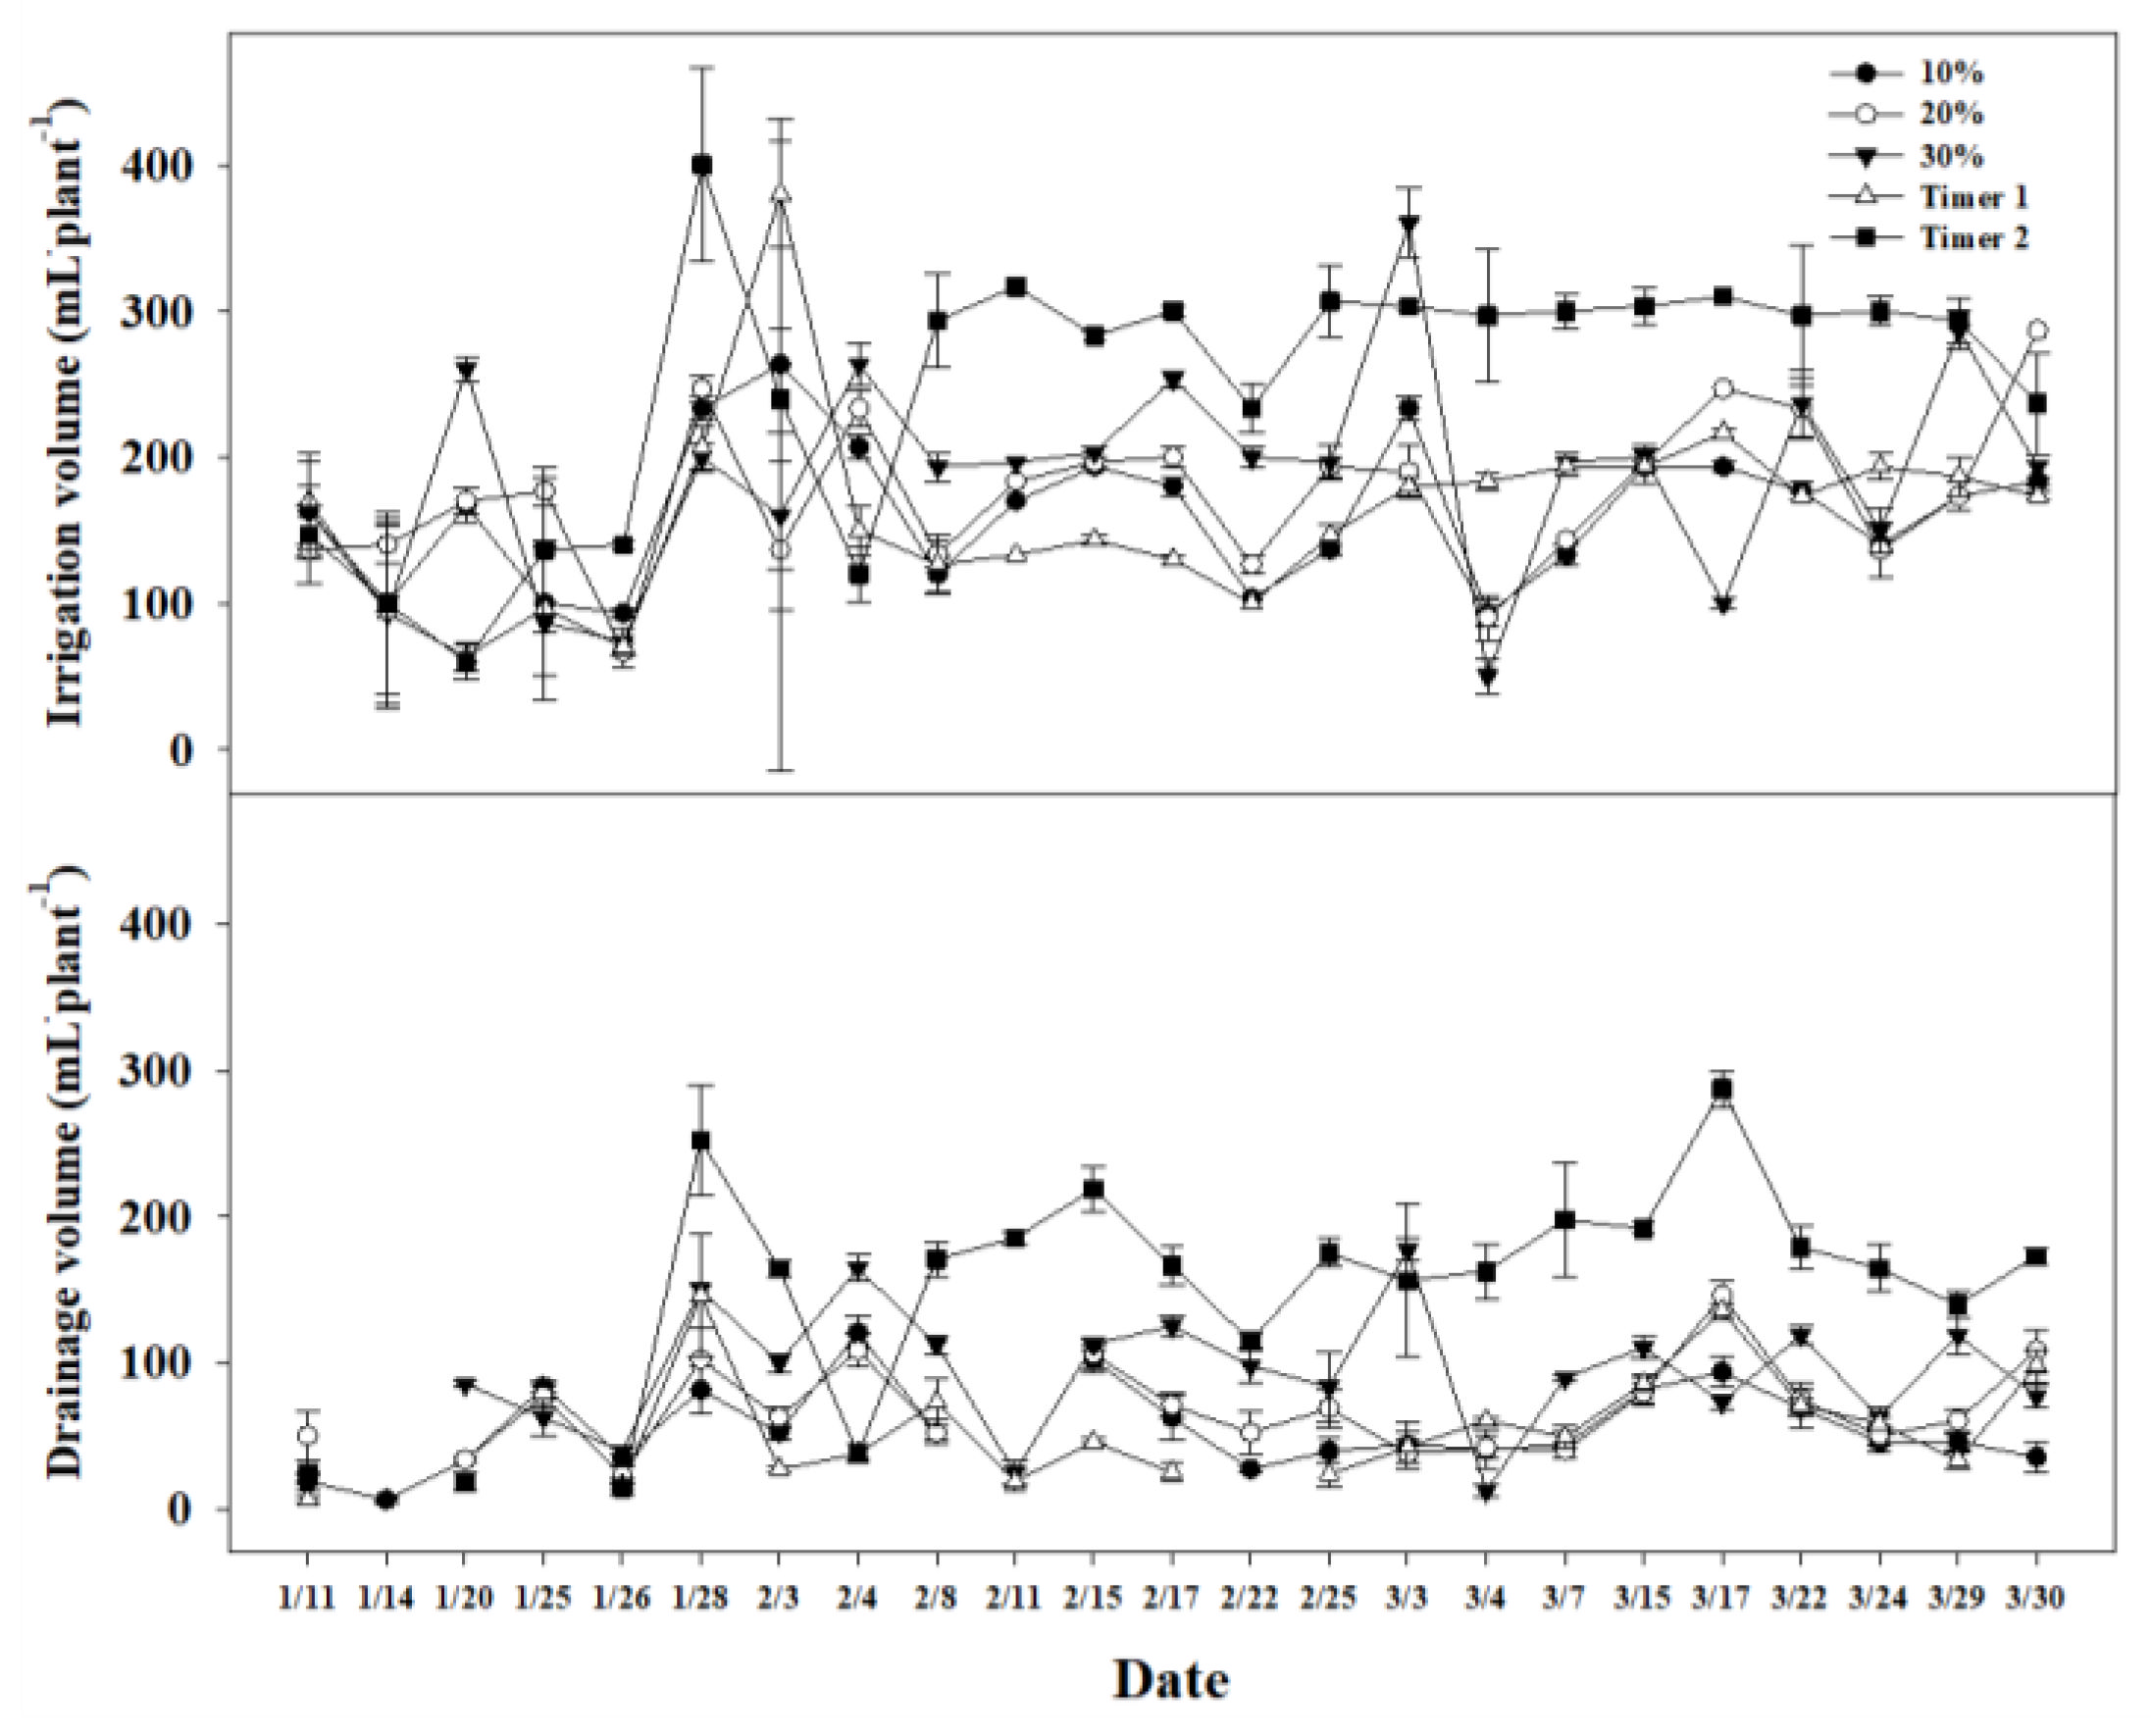
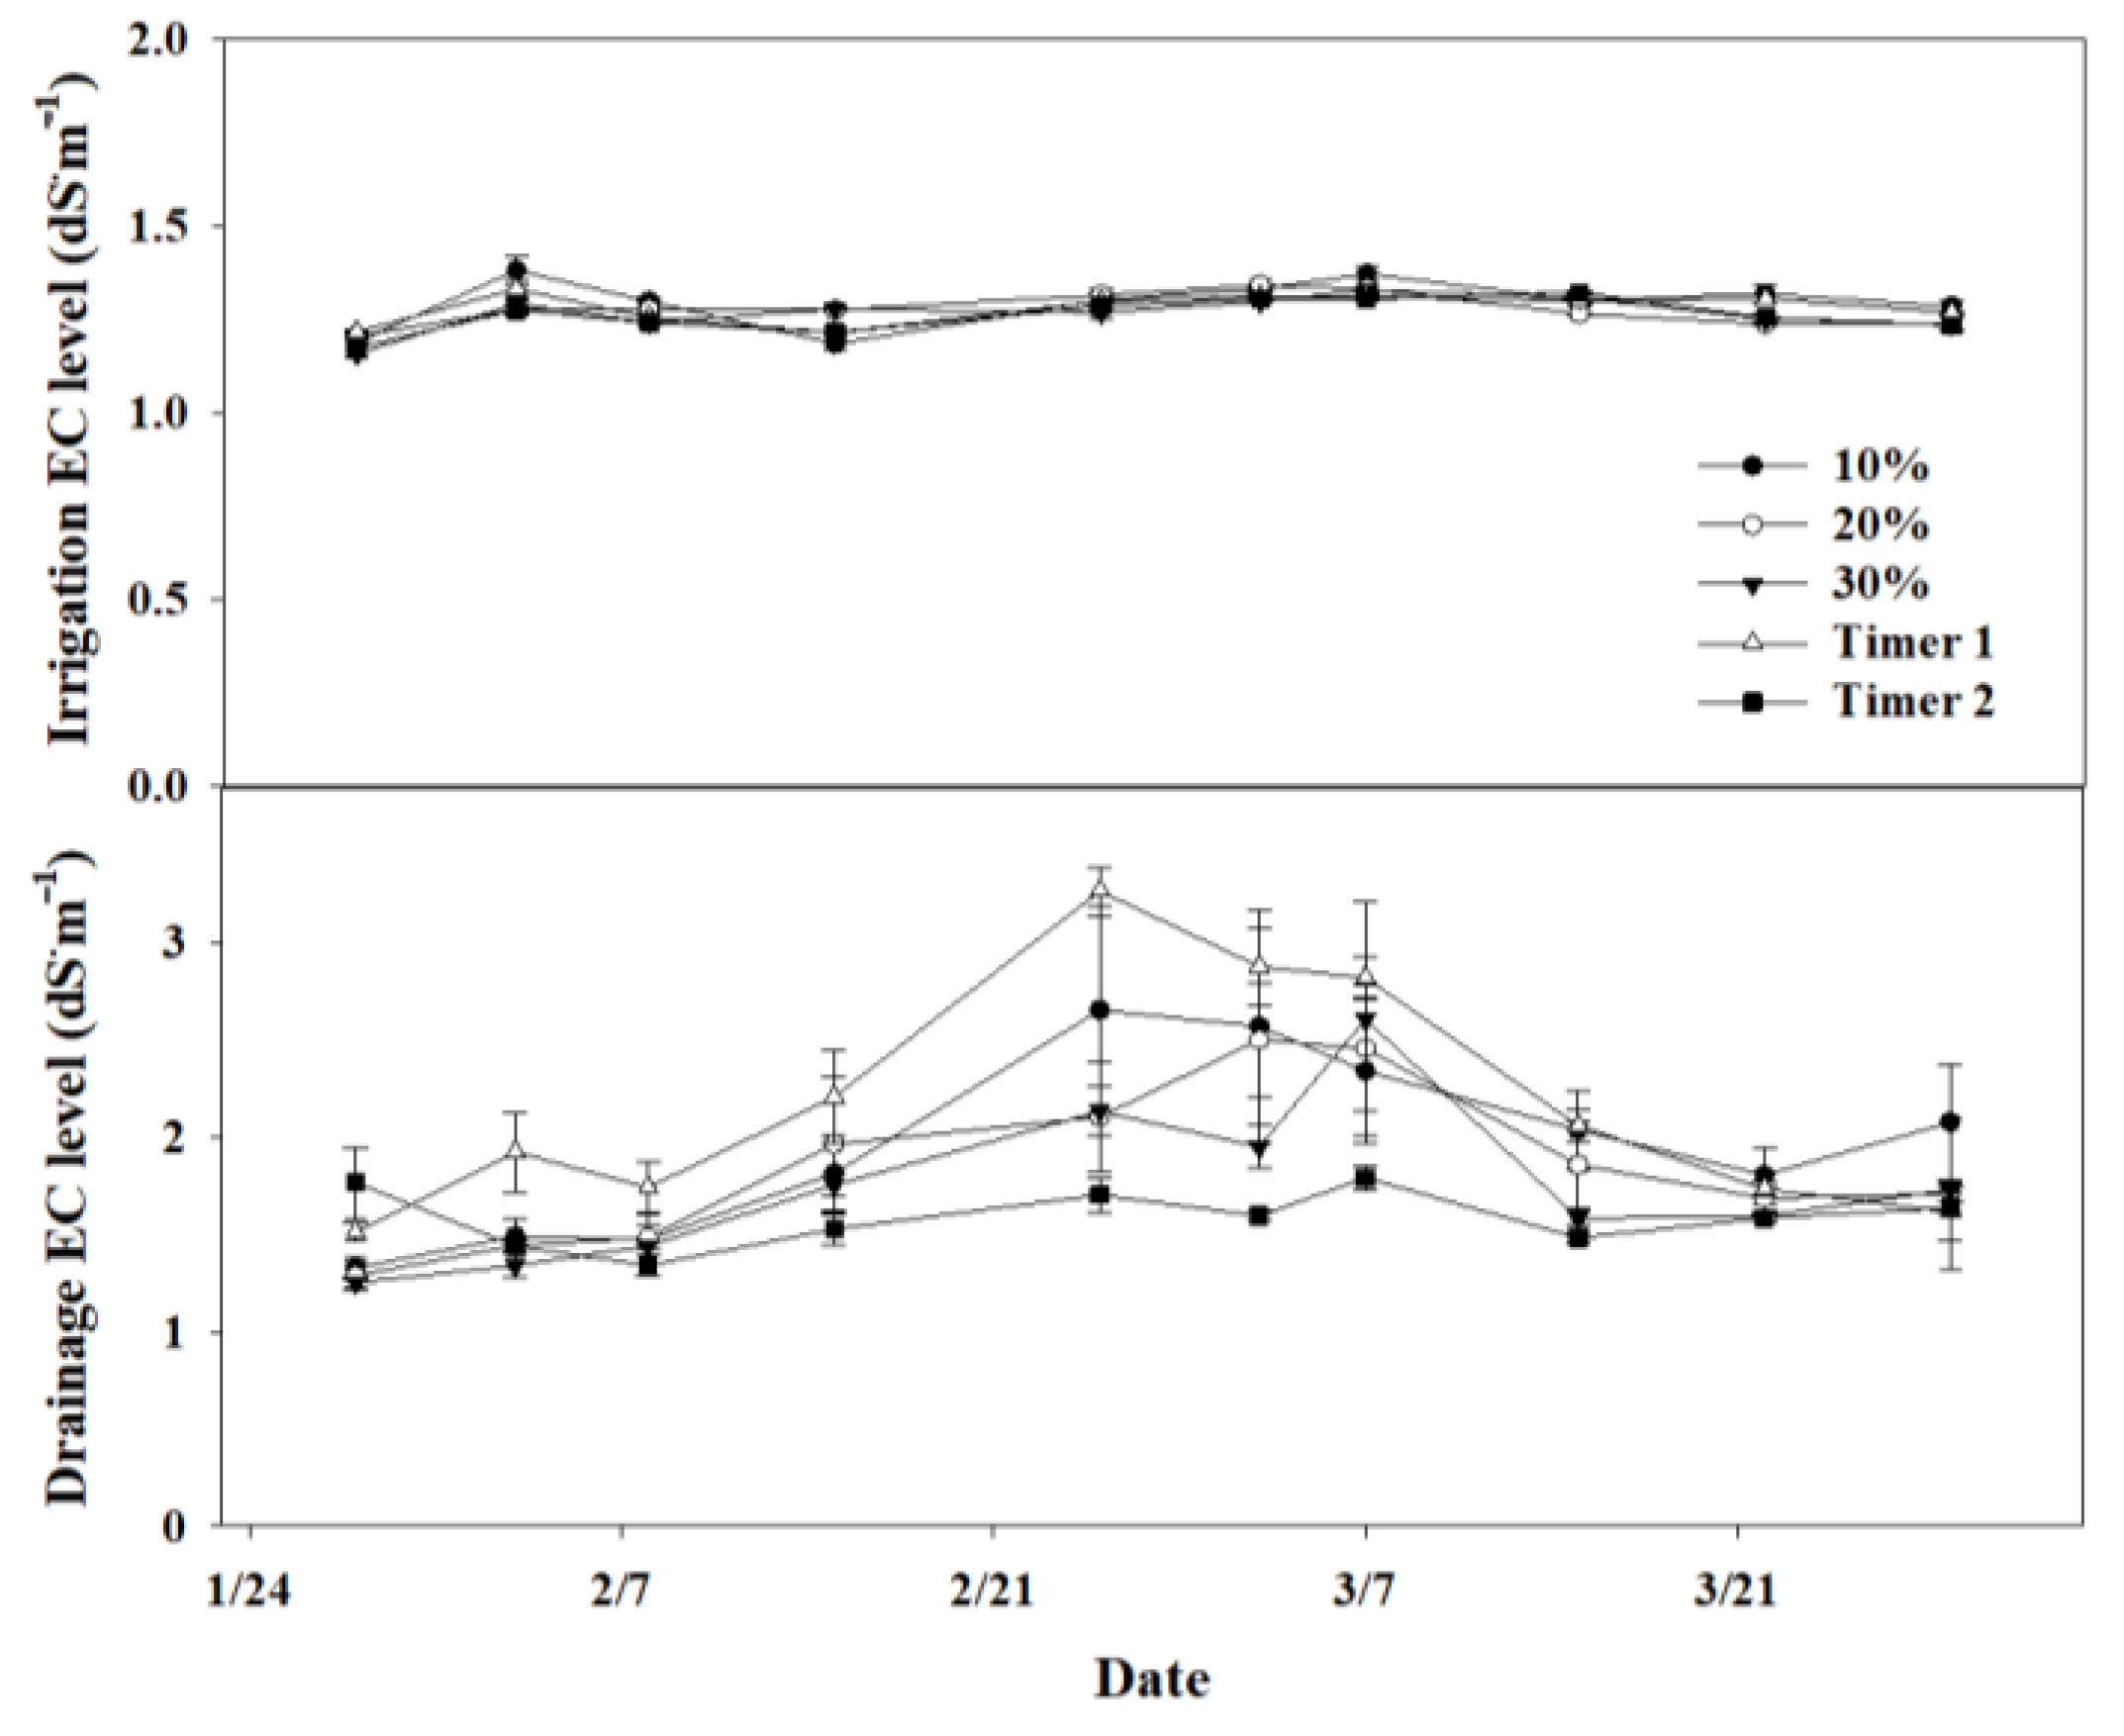
2.3. Supply and Drainage Characteristics

The drainage was collected at 3–4-day intervals for each treatment to analyze the electrical conductivity (EC) and pH of the irrigation and drainage. The EC and pH were measured using an EC and pH meter (Eutech PC 450 Multi-parameter Meter Kit; Thermo Scientific, Waltham, MA, USA). Water use efficiency (WUE), an index indicating how aerial part growth and fruit yield compared to the retained water content of the plant, was calculated by dividing the retained water content by the fresh weight of the plant aerial parts and fruits [10].

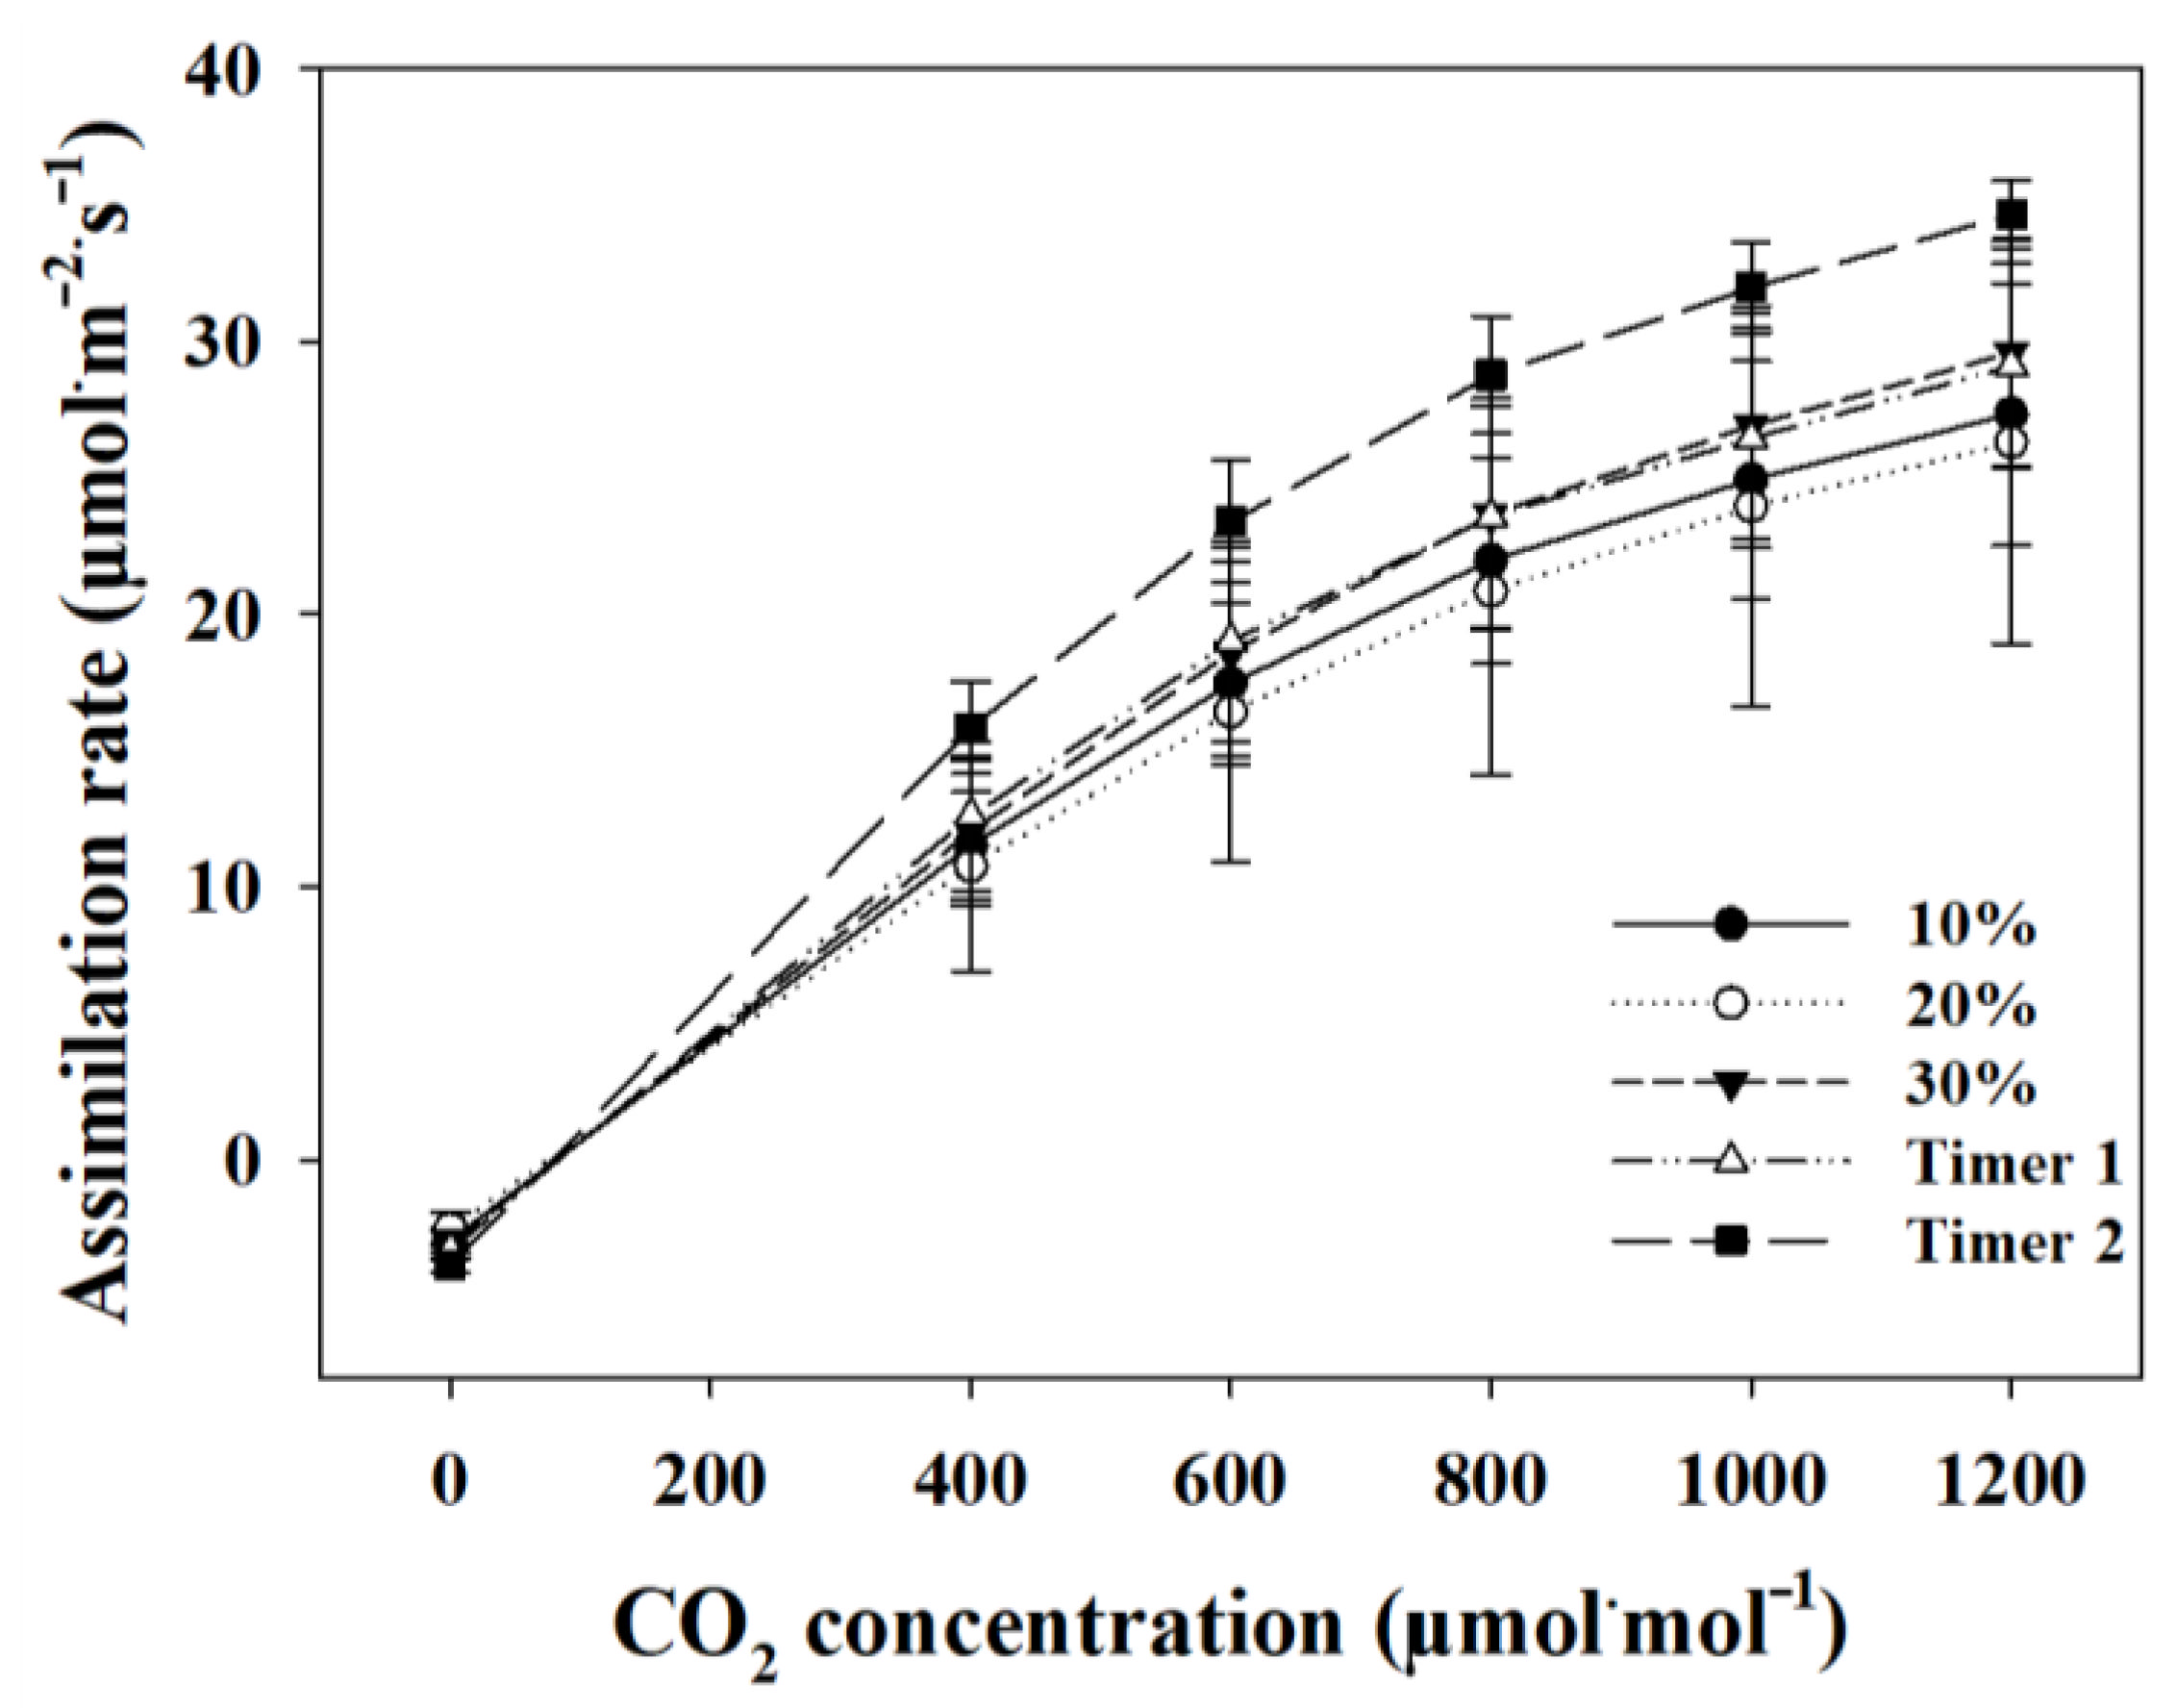
2.4. Growth, Fruit Quality, and Photosynthetic Characteristics

Growth, fruit quality, and yield characteristics of strawberries were measured according to the Rural Development Administration’s Vegetable Research Data Standard Manual [18]. The plant height, petiole length, leaf number, leaf length, leaf width, and crown diameter were determined for 30 plants. The fresh weight, dry weight, and leaf area were determined for 15 plants. Among fully developed leaves, petiole length, leaf width, and leaf length were measured using the third-newest leaf. The crown diameter was measured with a digital caliper (CD-20CPX; Mitutoyo Corp., Kawasaki, Japan) at the maximum diameter of the crown part. Plant fresh weight was measured using an electronic scale (CAS Co., Ltd.; Seoul, Korea), and dry weight was measured after drying for 72 h in a dryer (DS-80-3; Dasol Scientific Co., Ltd., Hwaseong, Korea) at 75 °C. The leaf area was measured by removing all leaves from the crown using a leaf area meter (Li-3100; LI-COR Biosciences Inc., Lincoln, NE, USA). The fruit quality characteristics investigated were soluble solids content, firmness, acidity, sugar/acid ratio, weight, length, width, and color.
The photosynthetic capacity of the third-newest leaf from 3 plants was measured in three repetitions on clear days on 28 April, 3 May, and 6 May 2022, the late harvest season, to investigate the assimilation rate of strawberry plants for each watering treatment. The CO2 response curve was measured using a photosynthetic meter (LI-6800; LI-COR Biosciences Inc., Lincoln, NE, USA) at an airflow rate of 400 μmol∙s−1, a temperature of 25 °C, and a CO2 concentration ranging from 0 to 1200 μmol∙mol−1.

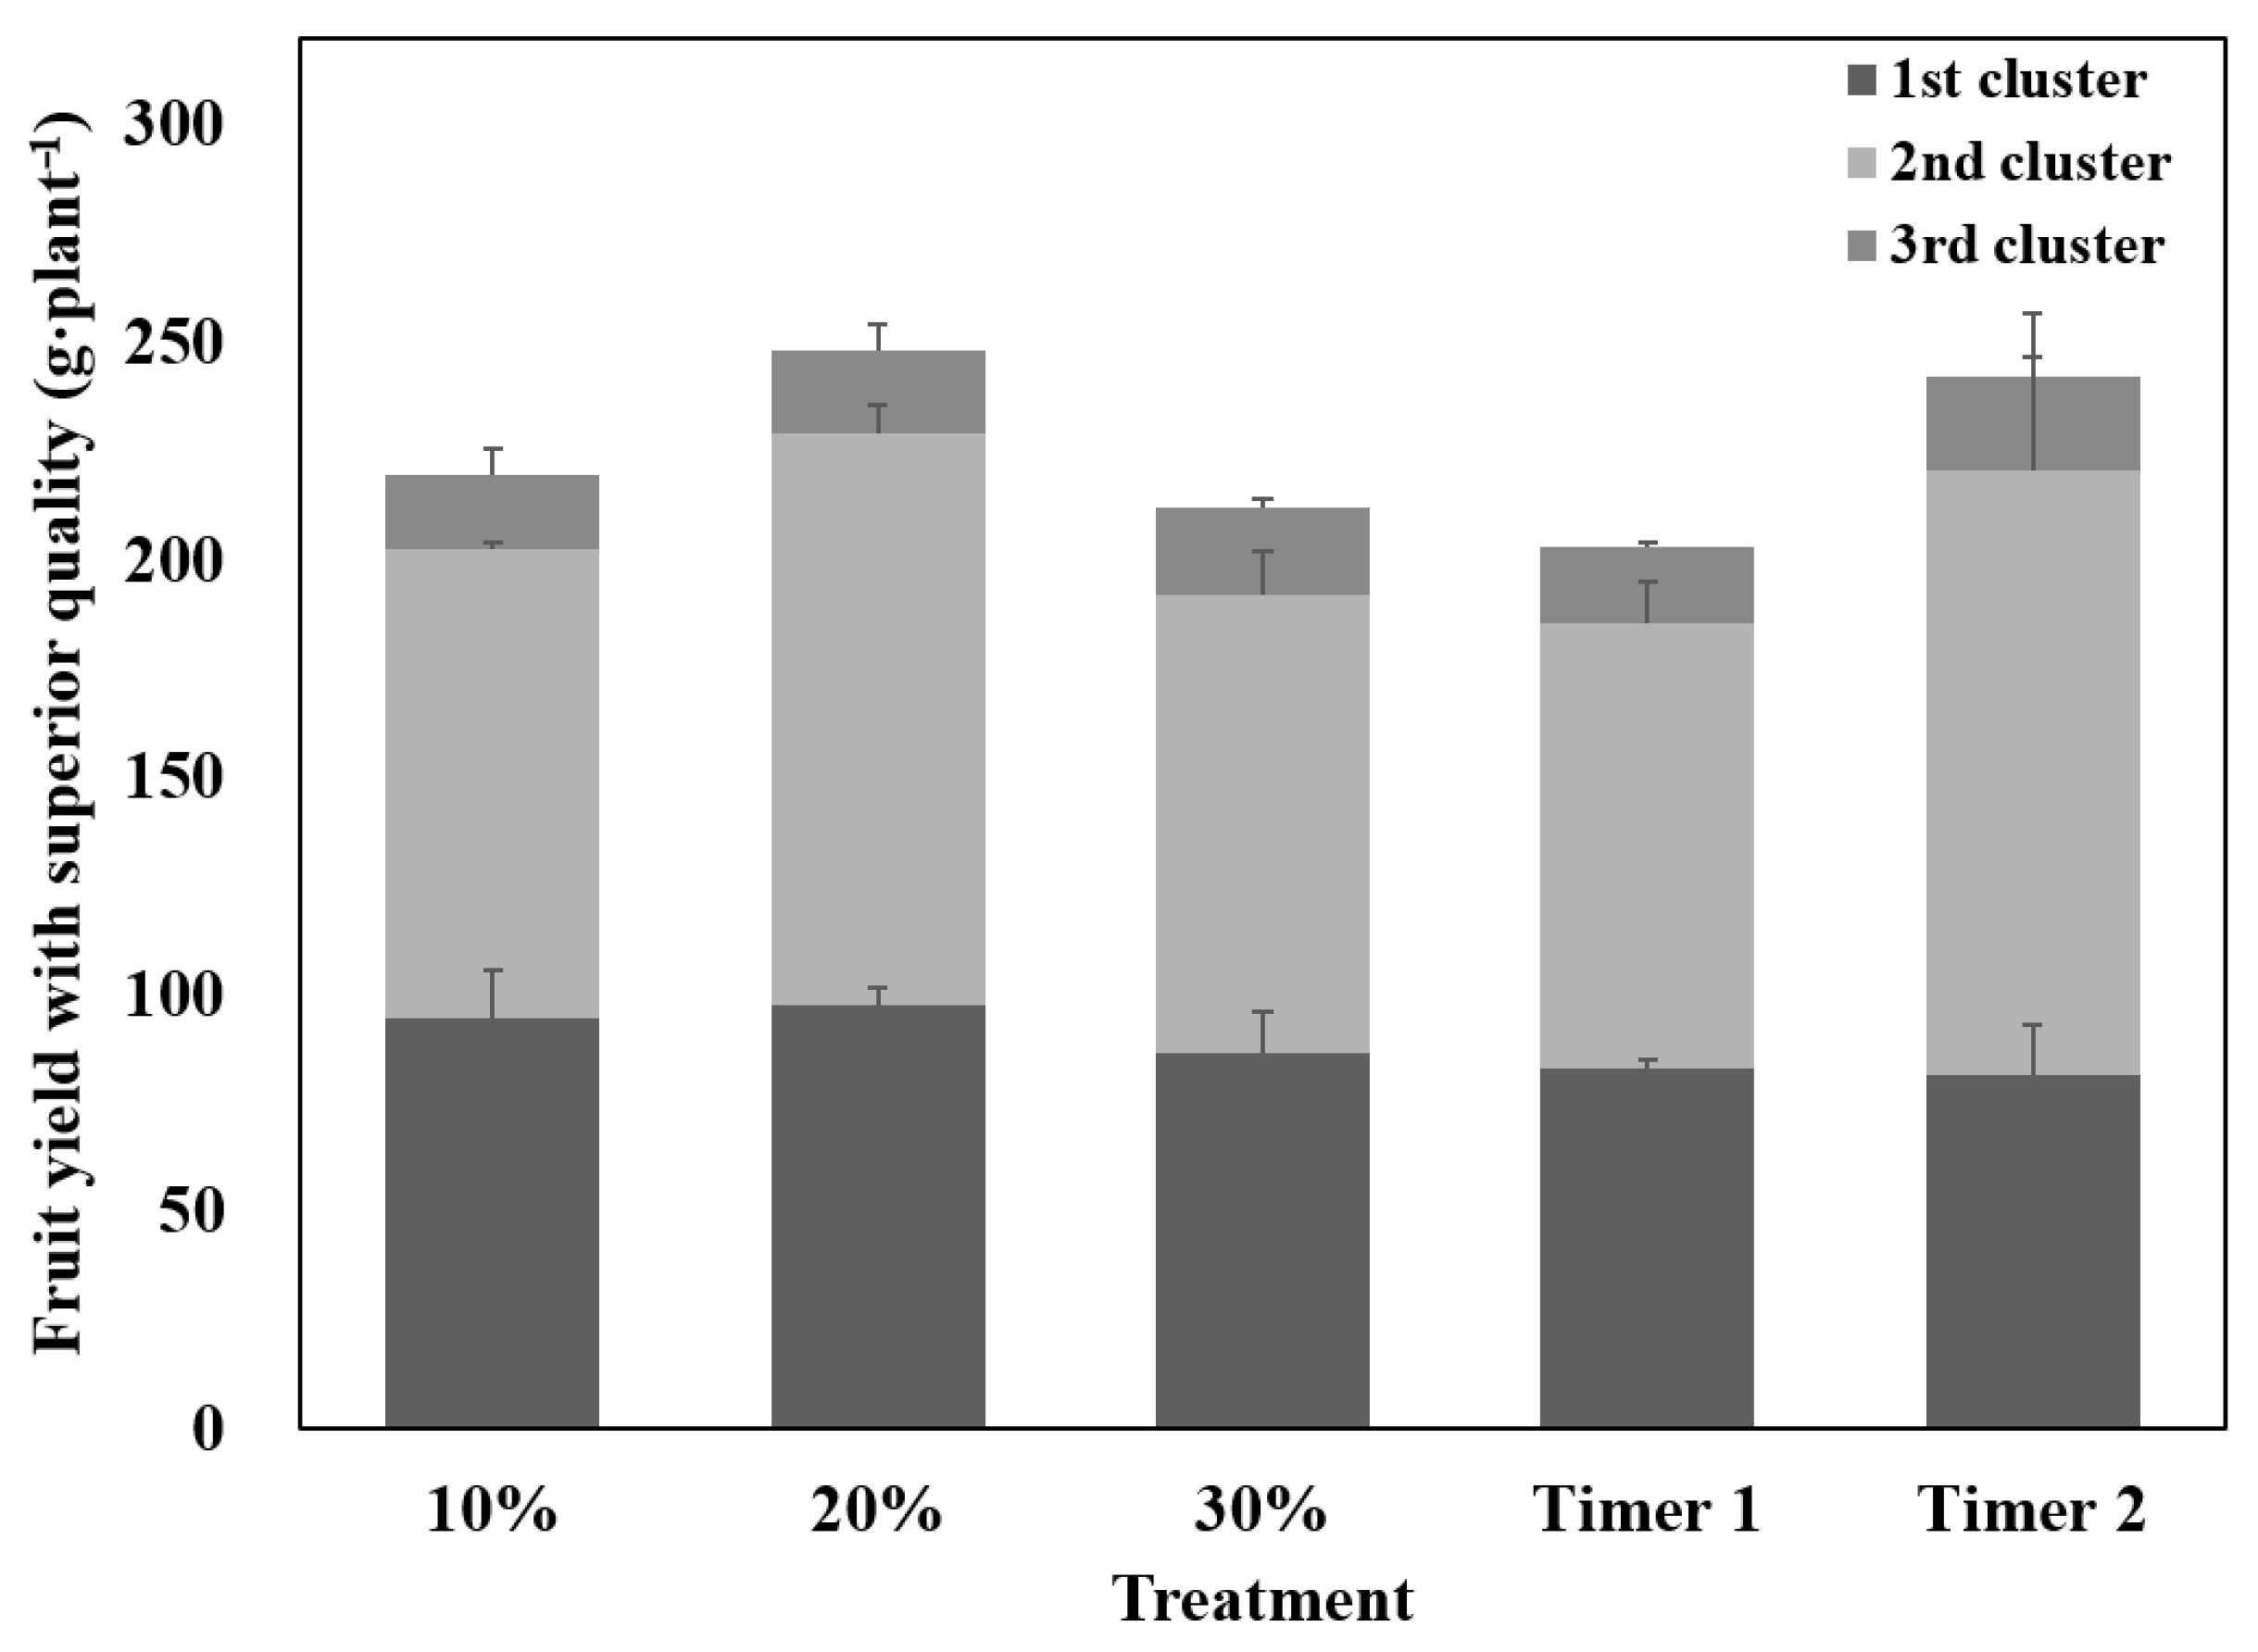
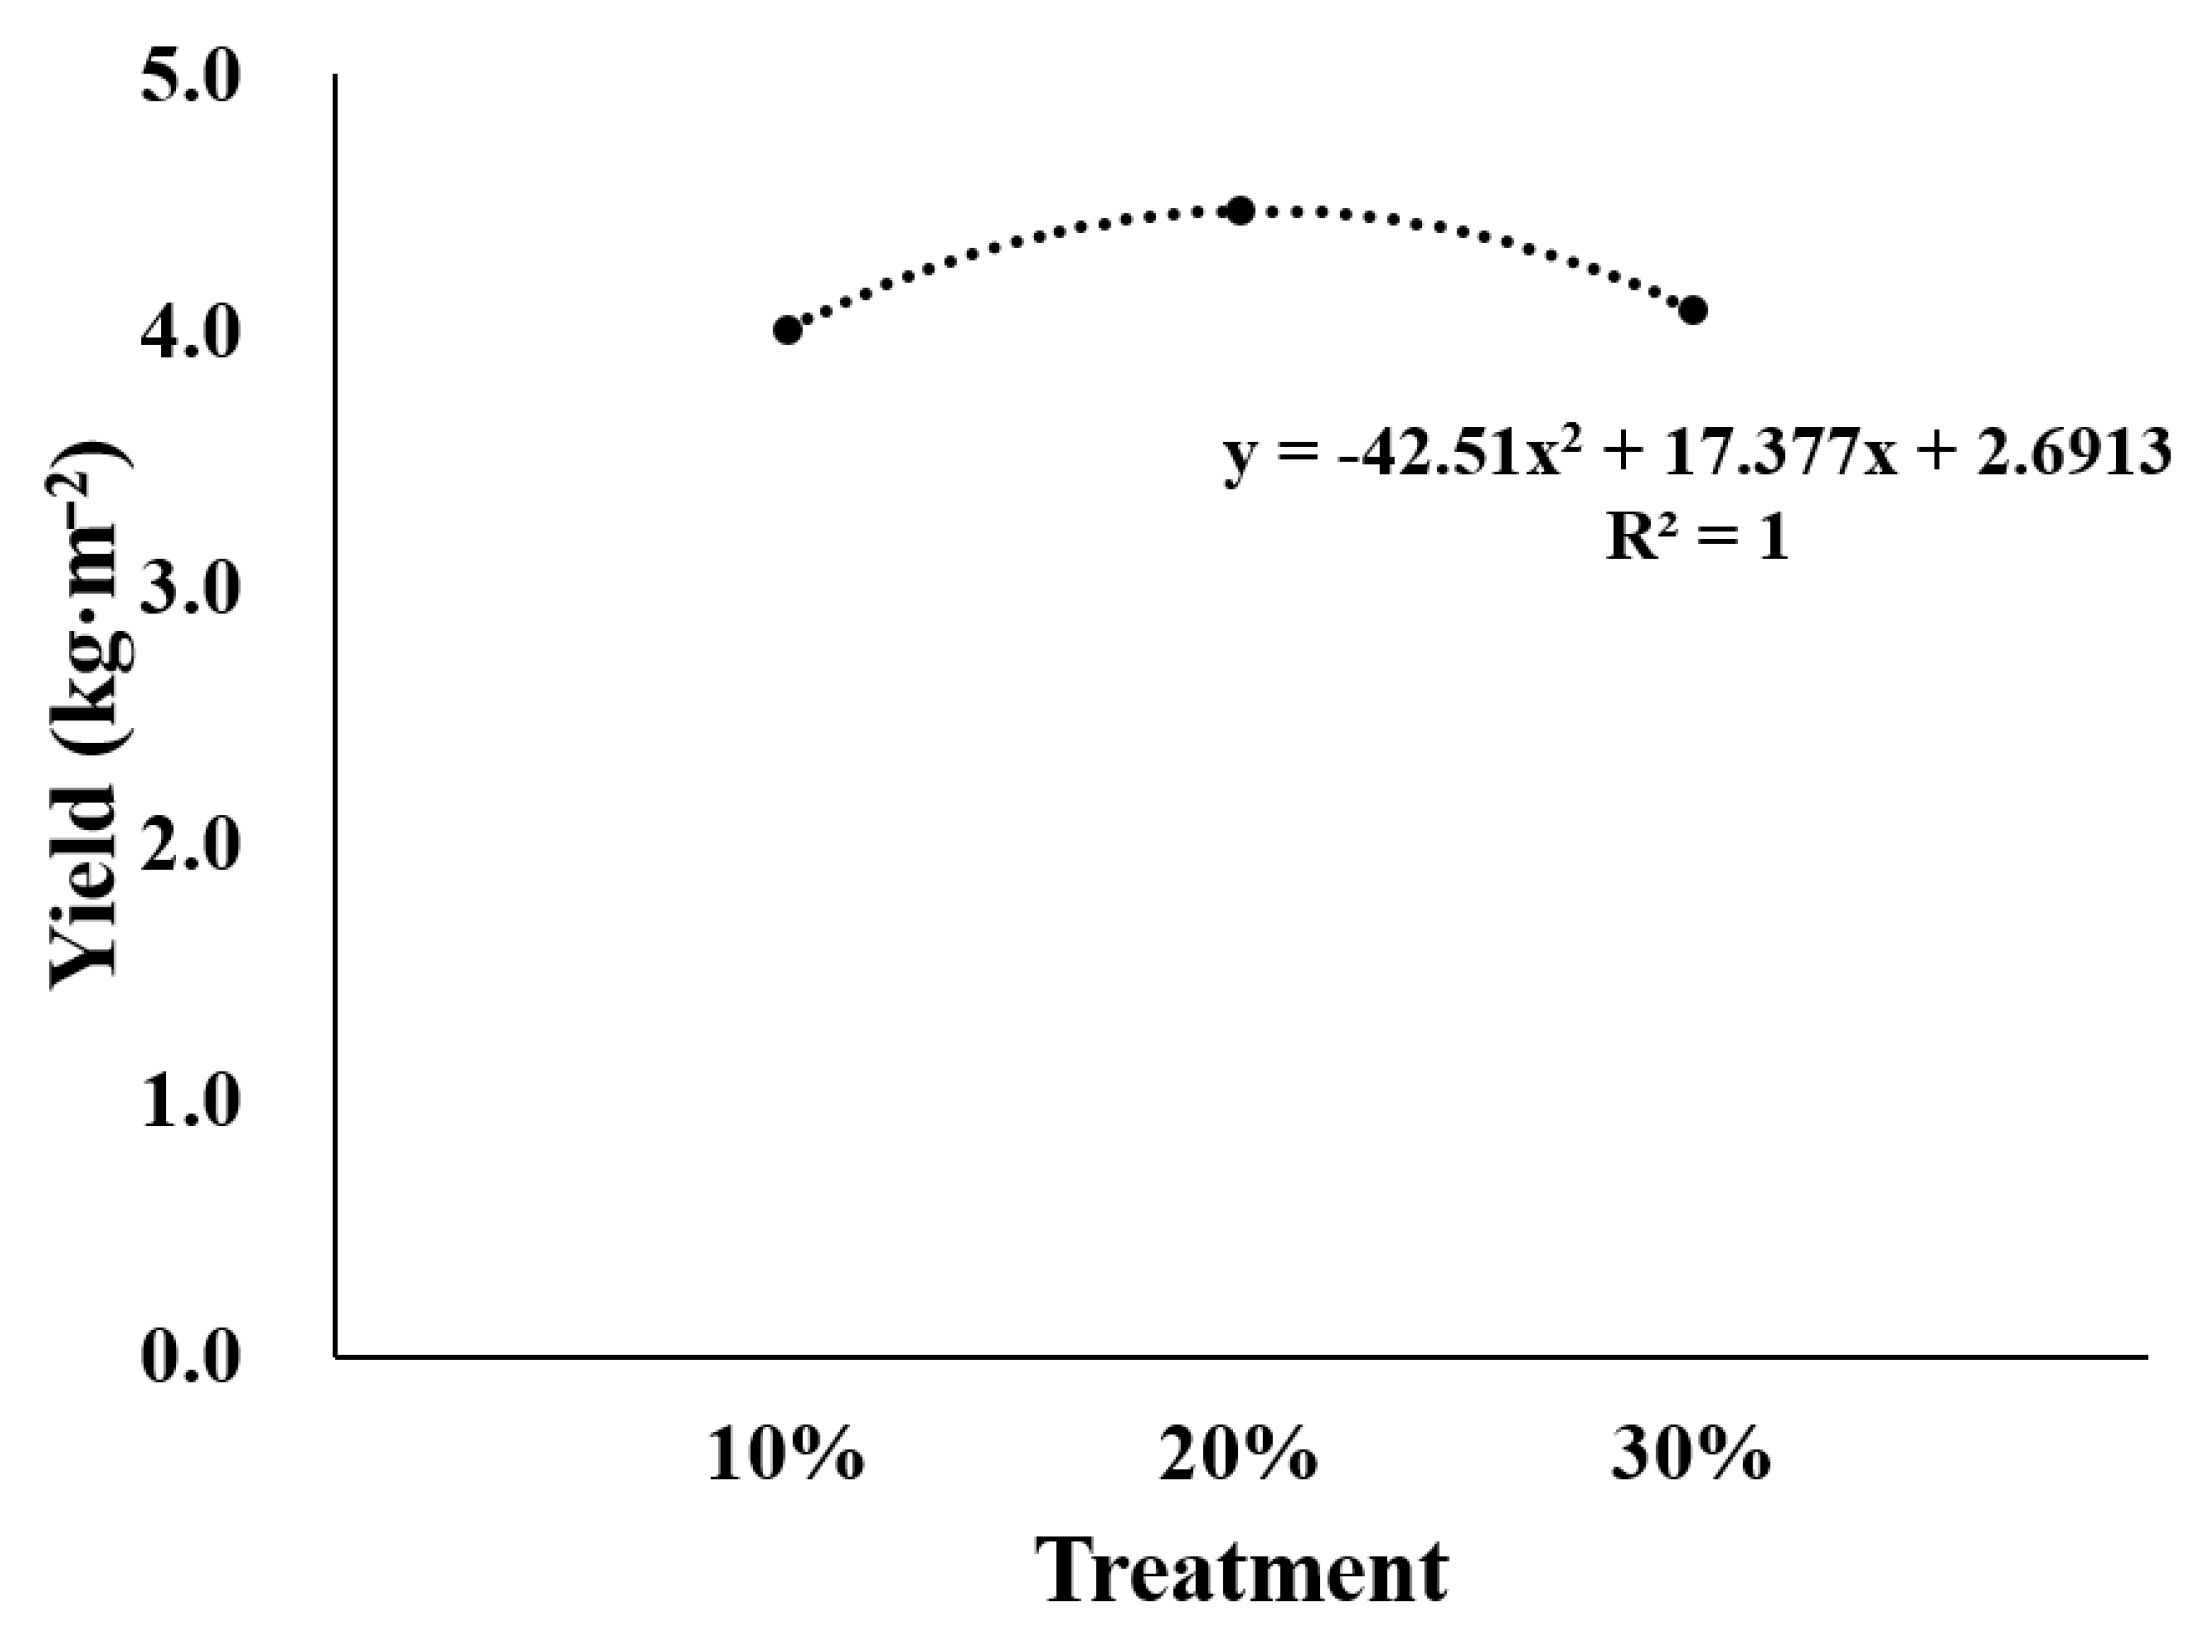
2.5. Yield Characteristics

Fruits were harvested weekly from 14 December to 28 March. The marketable product is classified into seven categories based on the fruit weight: more than 42 g, between 37 and 42 g, between 32 and 37 g, between 27 and 32 g, between 22 and 27 g, between 17 and 22 g, and between 12 and 17 g. Fruits less than 12 g were classified as small fruits, and fruits that were deformed due to insufficient pollination were classified as malformed. The percentage of marketable fruits was calculated by excluding the small and malformed fruits.

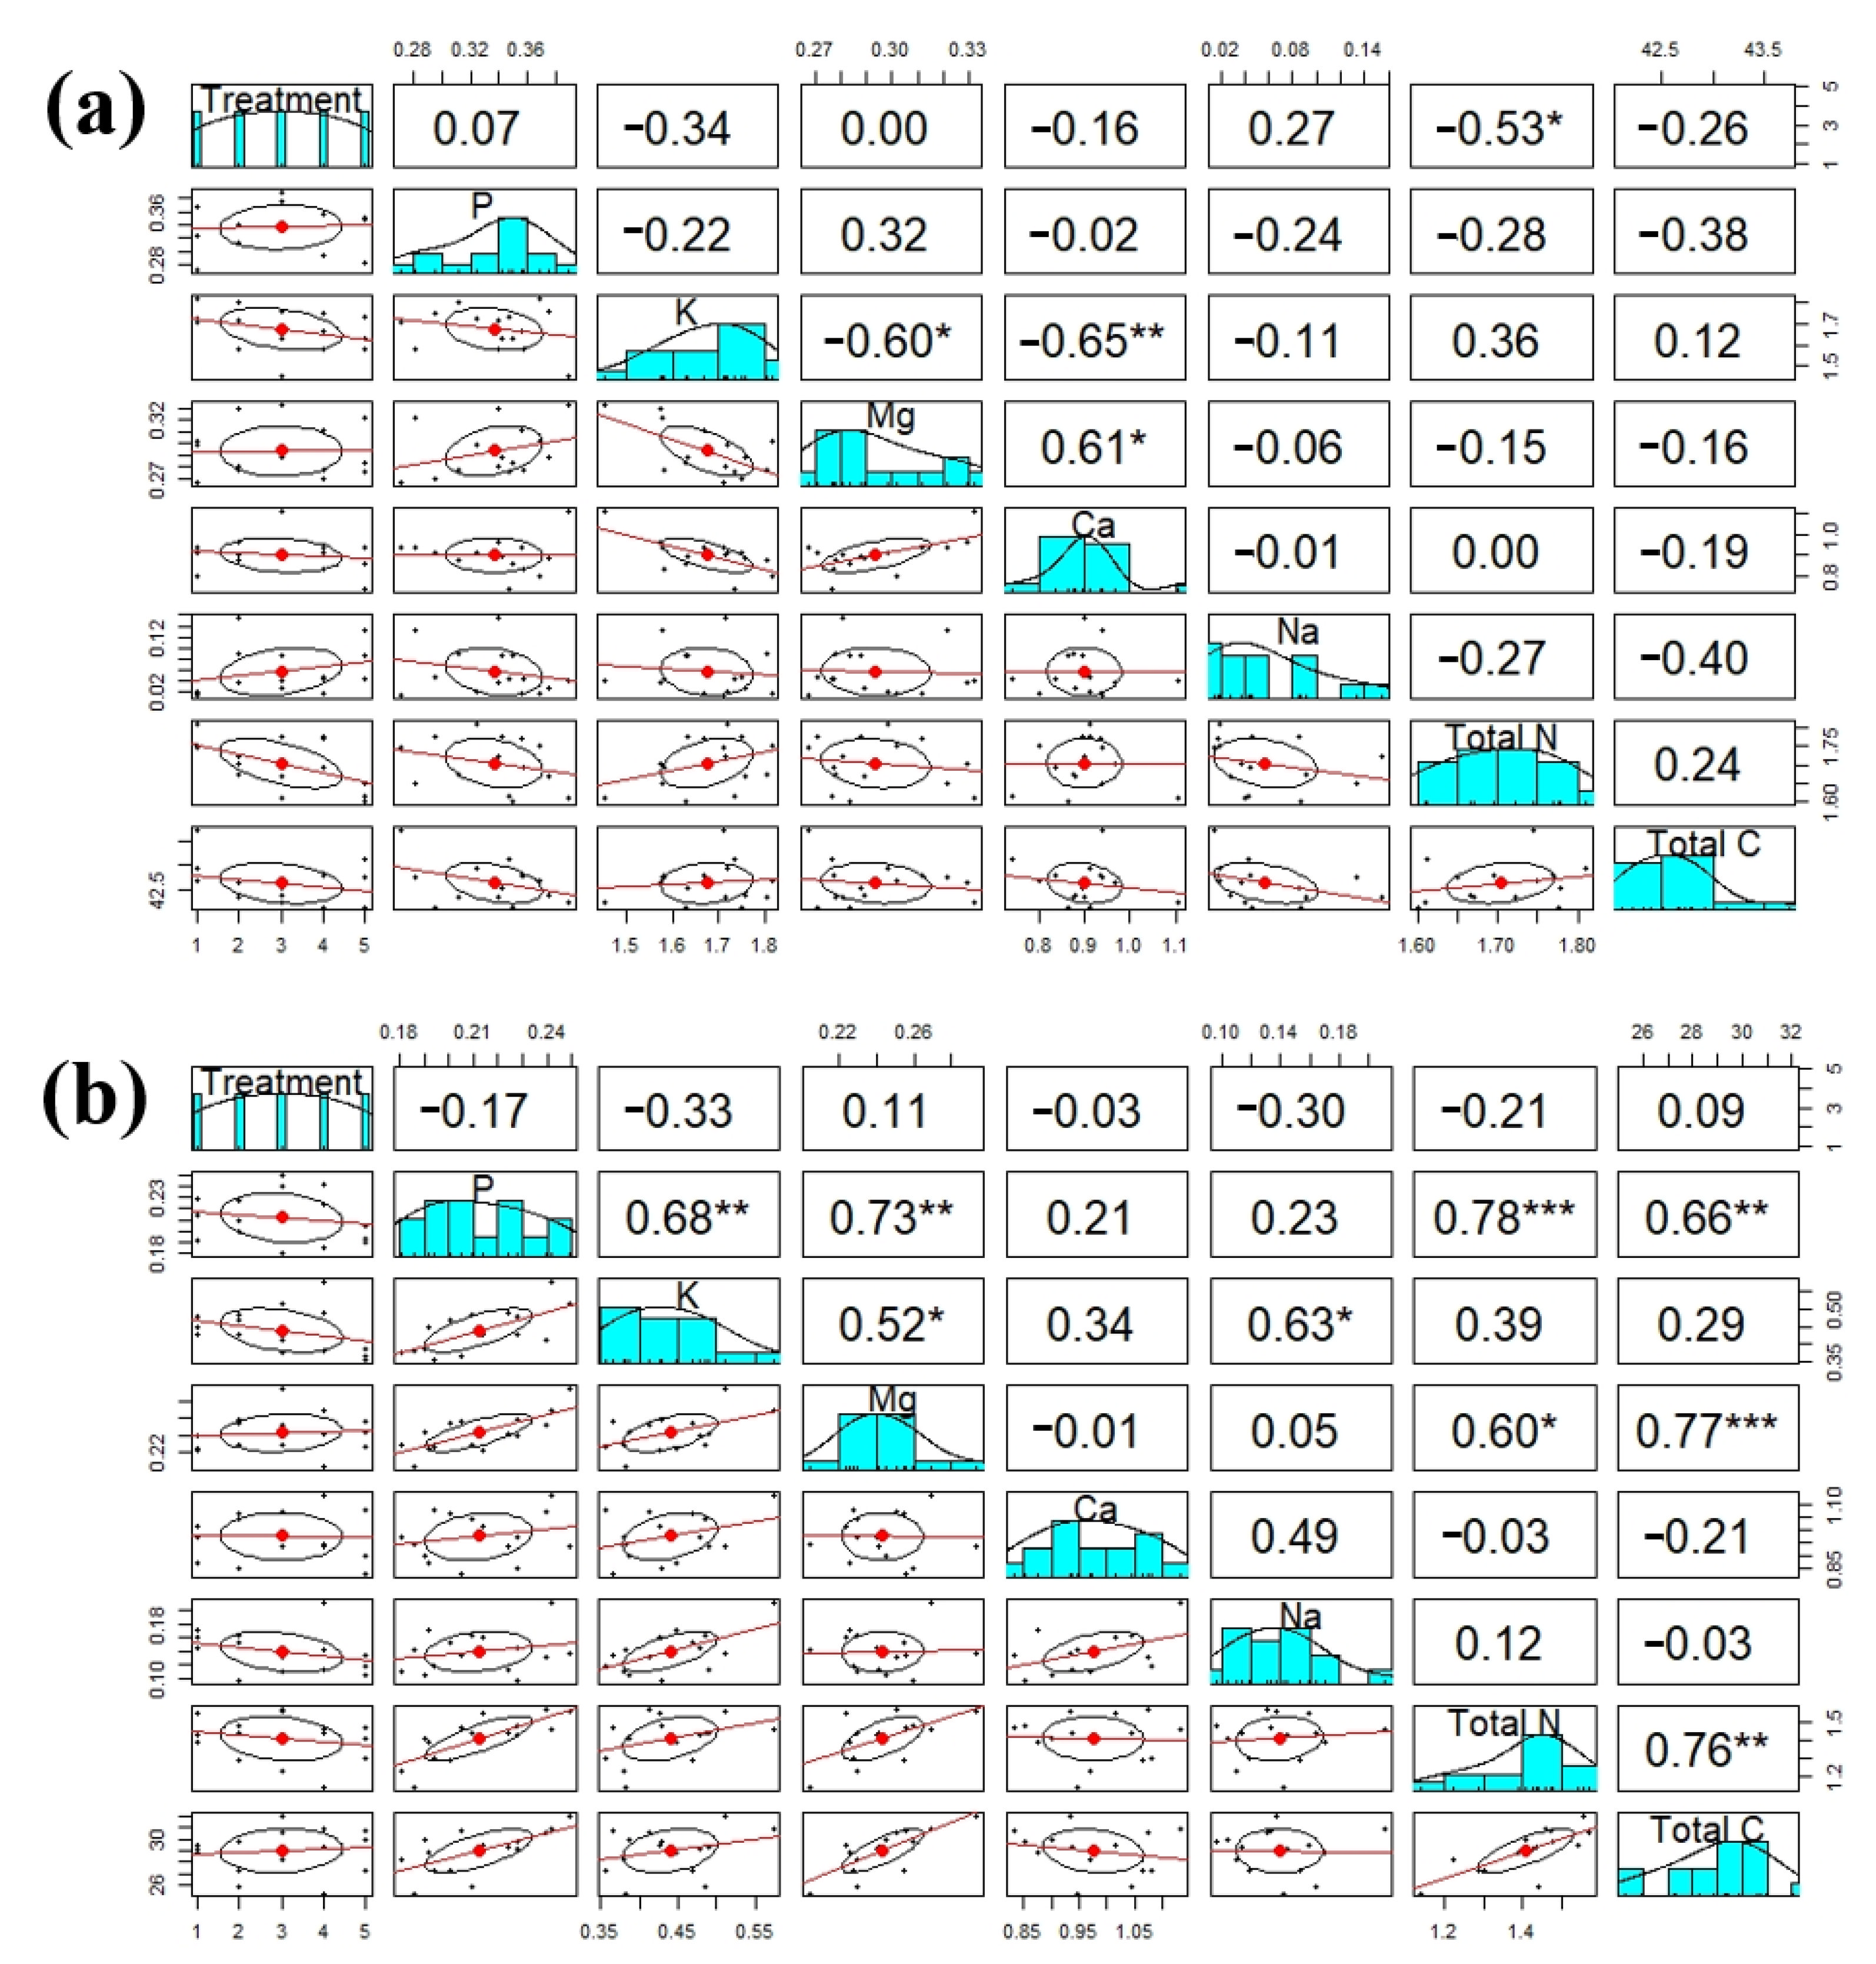
2.6. Mineral Contents

The aerial and the root parts were divided, and the inorganic content was analyzed according to the Rural Development Administration’s research and analysis standard [19]. The material was dried in a dryer at 75 °C for 72 h and pulverized. Subsequently, 0.5 g of the pulverized sample was transferred into a 100 mL glass flask containing 10 mL of a plant decomposition solution (HNO3:HClO4 in a ratio of 75:15). The sample was left for 1 day, and then placed on a heating plate. The heating plate temperature was gradually increased from 80 °C to 250 °C until the red sample turns white, and decomposition was complete. After naturally cooling the decomposed sample, it was filtered into a 100 mL flask using filter paper (No. 6; Advantec, Tokyo, Japan). The analysis was carried out by adding distilled water to a final volume of 100 mL. Total nitrogen (T-N) was analyzed using a nitrogen and total carbon analyzer (Primacs SNC; Skalar Analytical B.V., Breda, The Netherland), and Potassium (K), Calcium (Ca), Magnesium (Mg), and Sodium (Na) were analyzed using an inductively coupled plasma spectrometer (Integra XL; GBC Scientific Equipment Pty. Ltd., Melbourne), Australia). Phosphate (P) was analyzed using a mixture of plant decomposition solution and ammonium metavanadate solution, shaken at 35 °C for 30 min, cooled naturally, and measuring the absorbance at 660 nm using a spectrophotometer (AA3; Seal Analytical Ltd., Southampton, UK).

2.7. Statistical Analysis

Analysis of variance (ANOVA) and 2-way ANOVA were performed using the Sigmaplot program (SigmaPlot 8.0; Systat Software, Inc., Chicago, IL, USA) and the R program (R 4.0.2; R Foundation). Duncan’s multiple range test (DMRT) was applied and p < 0.05 was deemed significant for all tests.

3. Results and Discussion

As a result of examining the amount of watering and drainage during the cultivation period (Figure 1), the fixed watering method set at six watering events (Timer 2) had the largest amount of watering (239.6 mL). The watering method set at four watering events (Timer 1) had the lowest amount of watering (157.3 mL). When watering was controlled with the drainage rate, 161.1, 173.3, and 183.8 mL were supplied at drainage rates of 10%, 20%, and 30%, respectively. When the timer was set for four waterings, the amount of water supplied was similar to that of the water supply control based on a drainage rate of 10%. The lower the drainage rate, the lower the amount of water provided. The amount of water supplied to the 10% drainage treatment was 12.4% lower than the 30% drainage treatment and 32.8% lower than the six-time fixed timer method. The lower the drainage standard, the longer it takes to reach the drainage amount, which is the point of irrigation. This is similar to results from a previous study investigating complex water supply control using insolation and substrate water content [7] and irrigation programs using integrated indoor solar radiation [20]. The average daily drainage amount per plant was 126.7 mL when the timer was set for six applications, which was 57.6% higher than in the 30% drainage rate treatment and 162.2% more than in the 10% drainage rate treatment. The method of setting the timer for four applications and the water supply method based on a drainage rate of 10% had a similar nutrient solution supply and drainage amount. When the timer was set for six applications, an excessive amount of supply and drainage was observed compared to that of the supply control method using the drainage rate, indicating wastage of the nutrient solution. Because various environmental factors, such as light [21], root temperature [22], humidity [23], EC level [24] and the oxygen content of the solutions [25], affect crops inside the greenhouse, it is impossible to set optimal conditions for crop growth because the water supply control using a timer does not consider this.
The irrigation and drainage ECs during the cultivation period were investigated (Figure 2). The irrigation EC level in all treatments was 1.25 ± 0.007 dS∙m−1. The drainage EC level differed because the amount of nutrient solution supplied depended on the supply method. The drainage EC levels were 1.87, 1.76, 1.71, 2.06, and 1.57 dS∙m−1 in the 10%, 20%, 30%, four times, and six times timed application treatment, respectively. The four-times timed application treatment group had the highest draining EC level; a 31.2% higher value than the six-times timed application treatment and 20.5% higher than the 30% drainage rate treatment group. In the case of controlling watering using the drainage rate, when the nutrient solution was supplied based on a drainage rate of 10%, the maximum drainage EC level was 2.65 dS∙m−1, which was high. This is similar to a previous result where the drainage rate decreased and the drainage EC level was high when the supply EC level was high and the water supply was low in melon hydroponics [9]. The irrigation solution pH was 6.81 ± 0.03 on average in all treatment groups, and drainage pH was 7.11 ± 0.06, indicating no significant difference between treatments (data not shown).
The effects of the watering methods on strawberry growth characteristics are presented in Table 1. There was no significant difference among the watering methods during the early growth stage. However, the leaf length and width increased in the drainage rate control method compared to the timer control method during the late growth period. In the treatment with a drainage rate of 20%, the leaf length and width increased by 14.1% and 19.7%, respectively, compared to the four applications timer-supplying method, and by 23.6% and 29.5%, respectively, compared to the six applications timer-supplying method. If the water content of the rhizosphere is kept low due to the low drainage rate, water stress at the roots increases, and nutrient absorption is inhibited, leading to a decrease in plant and leaf area [26]. The leaf area showed the lowest value at 1173 mm2 in the treatment with four daily watering events and the highest value at 1586 mm2 in the treatment with a 20% drainage rate. However, there was no statistically significant difference (data not shown).
As a result of examining the fresh and dry weight of the aerial and root parts of the plant (Figure 3 and Figure 4), the group treated with 6 daily watering events, receiving the largest amount of water had the highest fresh weight at 110.9 g per plant. The fresh weight of the group treated with a drainage rate of 10% showed a 25.3% lower value than Timer 2 at 88.5 g per plant. The dry weight of the aerial part showed the lowest value in the 10% drainage treatment group at 23.8 g per plant, but there was no statistically significant difference. The average root fresh weight was 222 ± 11.4 g, and the dry weight was 37.6 ± 1.93 g, and there was no significant difference between treatments.
The CO2 fixation rate of plant leaves directly reflects the level of photosynthesis and is used as an index to evaluate the photosynthetic performance of plants due to stress in the growing environment of crops [27]. The assimilation rate of the drainage treatment at a CO2 concentration of 1200 μmol∙mol−1 was in the range of 29.4 ± 1.44 μmol∙m−2∙mol−1 (Figure 5). There was no significant difference compared with the timer-supplying method. This is similar to a previous study that found that the difference in the photosynthesis rate between a watering method using an FDR sensor and the watering method using a timer was not significant [10].
A significantly negative correlation was found between the amount of water supplied and the total nitrogen content (Figure 6). Different irrigation levels were found to have significantly affected all nutrients [28]. Similar outcomes to this study were documented by increasing Ca and K concentrations in strawberry leaves given 30 to 50% less irrigation water compared to the control conditions [29]. The correlation coefficient of K and Mg and K and Ca were −0.60 and −0.65, respectively. The negative correlations suggest that K ions inhibited the absorption and antagonistic action of Mg and Ca ions in strawberry plants. It has been reported that antagonism occurs in the absorption process in a specific or non-specific pathway between cations [30] and that phosphoric acid, calcium, magnesium, and manganese tend to decrease as the concentration of potassium fertilization increases in the ‘Nyoho’ strawberry [31]. Potassium ions have an antagonistic action with Ca and Mg ions. In contrast, the correlation coefficient of Mg and Ca was 0.61, indicating that a synergistic action occurred between the two ions. The nutrient contents of the root part of the strawberry did not show any significant difference according to the watering method. However, as in the aerial part, the total N and K contents decreased as the water supply increased. The total N and total C content of the root showed a high correlation with a correlation coefficient of 0.76. Increased root biomass C increased root biomass N [32].
The weight and number of fruits per plant for each irrigation treatment were investigated, and the yield was compared (Table 2). The total weight of fruits with a weight of more than 12 g was 342 g per plant in the 20% drainage treatment group, 11.6% higher than in the 10% drainage rate treatment group and 15.4% higher than in the 4 applications timer treatment. The average marketable fruit rate was 86.0 ± 0.2%, and there was no significant difference between treatments. The ‘Keumsil’ strawberry cultivar is a high-quality strawberry with good taste and excellent storage [33], and the higher the fruit ratio, the higher the price. Although there was no significant difference in productivity for fruits weighing more than 27 g among the watering methods, the 20% drainage treatment group had the highest productivity of 248 g per plant, and the yield was 22.4% higher than that of the 4 applications timer method (Figure 7). As a result of performing regression analysis by comparing the yield per m2 (Figure 8), the regression equation was y = −42.51x2 + 17.377x + 2.6913.
There was no statistically significant difference in soluble solid content (12.1 ± 0.18 °Brix, Table 3) or acidity. As a result of the correlation analysis between growth, yield, and fruit quality characteristics according to the method of nutrient solution supplying (see Supplementary Material, Figure S1), the correlation coefficient between soluble solid-acid ratio and leaf number, sugar-acid ratio and leaf length, sugar-acid ratio and leaf width were −0.60, −0.62, and −0.55, respectively. It indicates that the higher the leaf length, width, leaf number, the lower the soluble solid-acid ratio.
The water absorption characteristics of strawberry plants during the cultivation period were analyzed (Table 4). The total amount of water supplied was 21.5 L per plant when the timer was set for 6 applications, which was 48.3% higher than that of the 10% drainage treatment group with 14.5 L. The amount of drainage was 11.3 L in the treatment with 6 applications timer, which was 162.8% higher than that in the 10% drainage rate treatment. The amount of water retained by subtracting the amount of drainage from the total amount of water supplied was 10.1 L in the 10% drainage rate treatment, which was 8.6% higher than that of the 30% drainage treatment. There was no statistically significant difference in the WUE. However, the WUE of the 10% drainage rate treatment and the 4 applications timer group showed the lowest efficiency at 43.6 g∙L−1. In the treatment with a drainage rate of 30%, WUE was 13.8% higher than that of the treatment group with 4 timed applications and higher than the 10% drainage rate. This indicates that when the same amount of water was supplied, the aerial growth and fruit productivity were 13.8% higher when the water supply was controlled using the drainage rate. When controlling the water supply using the drainage rate, the total water supplied is less than that of the 6-timer treatment. However, it shows a similar WUE level, which, presumably, reduces unnecessary fertilizer consumption.
As a result of the correlation analysis between total supply/drainage per plant, water content, and WUE (Figure 9), the correlation coefficient of total water supply and total drainage were 0.64 and 0.65, respectively, indicating a significant positive correlation. The correlation coefficient of the WUE was −0.70, indicating a negative correlation.

4. Conclusions

Most of the hydroponic farms in Korea are growing crops in open hydroponic systems. The high usage volumes of the nutrient solution increase the production cost. By using the drainage rate, the new watering method has a certain economic value. In the case of hydroponics cultivation of the strawberry cultivar ‘Keumsil,’ the water supply control method using the drainage rate showed higher productivity with a smaller amount of water supply than the water supply control method using a timer. At a 20% drainage rate, the fresh weight of the aerial part and the yield of fruits over 27 g were high. However, there were no significant difference within the experimental range explored. The data might be evaluated during another harvesting season, with more separate plots in order to get significant, more precise figures as long such research are justifiable by potential economic gains. Also a wider experimental domain should be considered to detect how the dependent variable is affected. It is proposed that with the area of hydroponic cultivation rapidly increasing, it is possible to reduce unnecessary fertilizer consumption and increase the productivity of high-quality strawberries by using the drainage rate water supply control method.

Supplementary Materials

The following supporting information can be downloaded at: https://www.mdpi.com/article/10.3390/horticulturae8111059/s1, Figure S1: Correlation matrix between growth and fruit characteristics of strawberry ‘Kuemsil’ as affected by the nutrient solution supplying system using different drainage rate levels and timer (Plant length; No. of leaves; Petiole length; Leaf length; Leaf width; Crown diameter; Soluble solid content; Firmness; Acidity; Soluble solid content/Acidity; Fruit length; Fruit width, Fruit weight).

Author Contributions

Investigation, S.-H.C.; Supervision, D.-Y.K.; Writing—original draft, S.-H.C.; Writing—review & editing, S.Y.L. and M.-S.C. All authors have read and agreed to the published version of the manuscript.

Funding

This research was funded by Rural Development Administration (RDA), Republic of Korea, grant number PJ01626201. The funders had no role in the design of the study; in the collection, analyses, or interpretation of data; in the writing of the manuscript; or in the decision to publish the results.

Institutional Review Board Statement

Not applicable.

Informed Consent Statement

Not applicable.

Data Availability Statement

Not applicable.

Conflicts of Interest

The authors declare no conflict of interest.

References

  1. MAFRA. Agricultural Production Index. 2021. Available online: https://mafra.go.kr/bbs/mafra/131/327493/artclView (accessed on 7 July 2021).
  2. KOSTAT. Agricultural Area Survey. 2021. Available online: https://kosis.kr/statHtml/statHtml.do?orgId=101&tblId=DT_1ET0017&conn_path=I2 (accessed on 28 June 2021).
  3. Ahn, T.I.; Shin, J.W.; Son, J.E. Analysis of Changes in Ion Concentration with Time and Drainage Ratio Under EC-Based Nutrient Control in Closed-Loop Soilless Culture for Sweet Pepper Plants (Capsicum annum L. ‘Boogie’). J. Bio Environ. Control 2010, 19, 298–304. [Google Scholar]
  4. Dorais, M.; Papadopoulos, A.; Gosselin, A. Greenhouse Tomato Fruit Quality. Hortic. Res. 2001, 26, 239–319. [Google Scholar]
  5. Choi, K.L. Characteristics of Water and Nutrient Uptake in Hydroponics and Management of Nutrient Solution in Tomato Cultivation Using Coir Substrate. Ph.D. Thesis, Gyeongsang National University, Jinju, Korea, 2017; pp. 37–39. [Google Scholar]
  6. RDA. Smart Greenhouse Guideline; RDA: Jeonju, Korea, 2018; pp. 68–73. [Google Scholar]
  7. Choi, S.H.; Kim, S.H.; Choi, G.L.; Jeong, H.J.; Lim, M.Y.; Kim, D.Y.; Lee, S.Y. Growth and Quality of the Strawberry (Fragaria ananassa Dutch. cvs. ‘Sulhyang’) as affected by Complex Nutrient Solution Supplying Control System using Integrated Solar Irradiance and Substrate Moisture Contents in Hydroponics. J. Bio Environ. Control 2021, 30, 367–376. [Google Scholar] [CrossRef]
  8. Lim, M.Y.; Choi, S.H.; Choi, G.L.; Kim, S.H.; Jeong, H.J. Effects of Irrigation Amount on Fruiting Period and EC Level by Growth Period on Growth and Quality of Melon (Cucumis melo L.) Using Coir Substrate Hydroponics During Autumn Cultivation. Hortic. Sci. Technol. 2021, 39, 446–455. [Google Scholar] [CrossRef]
  9. Choi, S.H.; Lim, M.Y.; Choi, G.L.; Kim, S.H.; Jeong, H.J. Growth and Quality of Two Melon Cultivars in Hydroponics Affected by Mixing Ratio of Coir Substrate and Different Irrigation Amount on Spring Season. Protected Hort. Plant Fac. 2019, 28, 376–387. [Google Scholar] [CrossRef]
  10. Choi, K.Y.; Choi, E.Y.; Kim, I.S.; Lee, Y.B. Improving Water and Fertilizer Use Efficiency during the Production of Strawberry in Coir Substrate Hydroponics Using A FDR Sensor-Automated Irrigation System. Hortic. Environ. Biotechnol. 2016, 57, 431–439. [Google Scholar] [CrossRef]
  11. Bunt, A.C. Physical Properties of Mixtures of Peats and Minerals of Different Particle Size and Bulk Density for Potting Substrates. Acta Hortic. 1984, 150, 143–154. [Google Scholar] [CrossRef]
  12. Park, B.L.; Cho, H.M.; Kim, M.S. Environmental Impact of Hydroponic Nutrient Wastewater, Used Hydroponic Growing Media, and Crop Wastes from Acyclic Hydroponic Farming System. J. Korea Org. Resour. Recycl. Assoc. 2021, 29, 19–27. [Google Scholar]
  13. Massa, D.; Germano, R.; Carmassi, G.; Incrocci, L.; Montesano, F.; Parente, A.; Burchi, G.; Pardossi, A. Increased Phosphorus Use Efficiency in Basil Grown Hydroponically with Low Phosphorus Concentration and Saline Water. Acta Hortic. 2019, 1242, 327–334. [Google Scholar] [CrossRef]
  14. Massa, D.; Incrocci, L.; Maggini, R.; Carmassi, G.; Campiotti, C.A.; Pardossi, A. Strategies to Decrease Water Drainage and Nitrate Emission from Soilless Cultures of Greenhouse Tomato. Agric. Water Manag. 2010, 97, 971–980. [Google Scholar] [CrossRef]
  15. Massa, D.; Magán, J.J.; Montesano, F.F.; Tzortzakis, N. Minimizing Water and Nutrient Losses from Soilless Cropping in Southern Europe. Agric. Water Manag. 2020, 241, 1–14. [Google Scholar] [CrossRef]
  16. Hwang, Y.H.; An, C.G.; Chang, Y.H.; Yoon, H.S.; An, J.U.; Shon, G.M.; Rho, C.W.; Jeong, B.R. Effect of Zero Drainage Using Drainage Zero Sensor on Root Zone Environment, Growth and Yield in Tomato Rockwool Culture. J. Bio Environ. Control 2012, 21, 398–403. [Google Scholar] [CrossRef]
  17. RDA. Manual for Strawberry Cultivation; RDA: Jeonju, Korea, 2019; p. 144. [Google Scholar]
  18. RDA. Research Data Standards Manual for Vegetables-Strawberris; RDA: Jeonju, Korea, 2021; pp. 10–35. [Google Scholar]
  19. RDA. Agricultural Science and Technology Research Analysis Standard; RDA: Jeonju, Korea, 2012; p. 21. [Google Scholar]
  20. Meric, M.K.; Tuzel, I.H.; Tuzel, Y.; Oztekin, G.B. Effects of Nutrition Systems and Irrigation Programs on Tomato in Soilless Culture. Agric. Water Manag. 2011, 99, 19–25. [Google Scholar] [CrossRef]
  21. Adams, P. Nutrient Uptake by Tomatoes from Recirculating Solutions. In Proceedings of the 6th ISOSC, Lunteren, The Netherlands, 29 April–5 May 1984; The Secretariat of ISOSC: Wageningen, The Netherlands, 1984; pp. 71–80. [Google Scholar]
  22. Moorby, J.; Graves, C.J. Root and Air Temperature Effects on Growth and Yield of Tomatoes and Lettuce. Acta Hortic. 1980, 98, 29–44. [Google Scholar] [CrossRef]
  23. Barker, J.C.; Welles, G.W.H.; Van Uffelen, J.A.M. The Effects of Day and Night Humidity on Yield and Quality of Glasshouse Cucumbers. J. Hortic. Sci. 1987, 62, 363–370. [Google Scholar] [CrossRef]
  24. Chrétien, S.; Gosselin, A.; Dorais, M. High Electrical Conductivity and Radiation-Based Water Management Improve Fruit Quality of Greenhouse Tomatoes Grown in Rockwool. HortScience 2000, 35, 627–631. [Google Scholar] [CrossRef] [Green Version]
  25. Gislerød, H.R.; Adams, P. Diurnal Variations in the Oxygen Content and Acid Requirement of Recirculating Nutrient Solutions and in the Uptake of Water and Potassium by Cucumber and Tomato Plants. Sci. Hortic. 1983, 21, 311–321. [Google Scholar] [CrossRef]
  26. Aljibury, F.K.; May, D.M. Irrigation Schedules and Production of Processed Tomatoes on the San Joaquin Westside. Calif. Agric. 1970, 24, 10–11. [Google Scholar]
  27. Koh, S.C.; Oh, S.J.; Lee, J.H.; Ko, K.S. Chlorophyll Fluorescence and CO2 Fixation Capacity in Leaves of Camellia sinensis, Camellia japonica, and Citrus Unshiu. Korean J. Environ. Biol. 2012, 30, 98–106. [Google Scholar]
  28. Celiktopuz, E.; Kapur, B.; Sarıdas, M.A.; Kargı, S.P. Response of Strawberry Fruit and Leaf Nutrient Concentrations to the Application of Irrigation Levels and a Biostimulant. J. Plant Nutr. 2021, 44, 153–165. [Google Scholar] [CrossRef]
  29. Perin, E.C.; Messias, R.D.S.; Galli, V.; Borowski, J.M.; De Souza, E.R.; De Avila, L.O.; Bamberg, A.L.; Rombaldi, C.V. Mineral Content and Antioxidant Compounds in Strawberry Fruit Submitted to Drough Stress. Food Sci. Technol. 2019, 39 (Suppl. S1), 245–254. [Google Scholar] [CrossRef] [Green Version]
  30. Mengel, K.; Kirkby, E.A. Principles of Plant Nutrition; International Potash Institute: Worblaufen-Bern, Switzerland, 1987; pp. 607–676. [Google Scholar]
  31. Jeong, S.K.; Choi, J.M.; Cha, K.H.; Chung, H.J.; Choi, J.S.; Seo, K.S. Deficiency Symptom, Growth Characteristics, and Nutrient Uptake of ‘Nyoho’ Strawberry Affected by Controlled Calcium Concentrations in Fertilizer Solution. J. Korean Soc. Hortic. Sci. 2001, 42, 284–288. [Google Scholar]
  32. Sainju, U.M.; Allen, B.L.; Lenssen, A.W.; Mikha, M. Root and Soil Total Carbon and Nitrogen Under Bioenergy Perennial Grasses with Various Nitrogen Rates. Biomass Bioenergy 2017, 107, 326–334. [Google Scholar] [CrossRef] [Green Version]
  33. Yoon, H.S.; Jin, H.J.; Oh, J.Y. “Kuemsil”, a Strawberry Variety Suitable for Forcing Culture. Korean J. Breed. Sci. 2020, 52, 184–189. [Google Scholar] [CrossRef]
Figure 1. Changes in irrigation and drainage amounts of strawberry ‘Kuemsil’ affected by the nutrient solution supplying system using different drainage rate levels and timings (Drainage rate 10%, 20%, or 30%; Timer 1, timer set for 4 applications daily; Timer 2, timer set for 6 applications daily). Vertical bars indicate standard errors of the means (n = 3).
Horticulturae 08 01059 g001
Figure 2. Irrigation and drainage EC levels of strawberry ‘Kuemsil’ affected by the nutrient solution supplying system using different drainage rate levels and timings (Drainage rate 10%, 20%, or 30%; Timer 1, timer set for 4 applications daily; Timer 2, timer set for 6 applications daily). Vertical bars indicate standard errors of the means (n = 3).
Horticulturae 08 01059 g002
Figure 3. Fresh weight and dry weight of aerial (a,b) and root (c,d) parts of strawberry ‘Kuemsil’ as affected by the nutrient solution supplying system using different drainage rate levels and timings (Drainage rate 10%, 20%, or 30%; Timer 1, timer set for 4 applications daily; Timer 2, timer set for 6 applications daily). Vertical bars indicate standard errors of the means (n = 15). DMRT at p < 0.05 and different letters indicate significant differences between treatments.
Horticulturae 08 01059 g003
Figure 4. Rhizosphere differences of strawberry ‘Kuemsil’ as affected by the nutrient solution supplying system using different drainage rate levels and timer (Drainage rate 10%, 20%, or 30%; Timer 1, timer set for 4 applications daily; Timer 2, timer set for 6 applications daily).
Horticulturae 08 01059 g004
Figure 5. CO2 response curves of strawberry ‘Kuemsil’ as affected by the nutrient solution supplying system using different drainage rate levels and timer (Drainage rate 10%, 20%, or 30%; Timer 1, timer set for 4 applications daily; Timer 2, timer set for 6 applications daily). Vertical bars indicate standard errors of the means (n = 3).
Horticulturae 08 01059 g005
Figure 6. Correlation among nutrient contents in the aerial (a) and root (b) parts of strawberry ‘Kuemsil’ affected by the nutrient solution supplying system using different drainage rate levels and timings. Asterisks indicate significant differences according to Duncan’s multiple range test at p < 0.05 (*), 0.01 (**) and 0.001 (***).
Horticulturae 08 01059 g006
Figure 7. Fruit yield with superior quality (above 27 g) harvested from strawberry ‘Kuemsil’ affected by the nutrient solution supplying system using different drainage rate levels and timings (Drainage rate 10%, 20%, or 30%; Timer 1, timer set for 4 applications daily; Timer 2, timer set for six applications daily). Vertical bars indicate standard errors of the means (n = 3).
Horticulturae 08 01059 g007
Figure 8. Yield regression model of strawberry ‘Kuemsil’ affected by the nutrient solution supplying system using different drainage rate levels (Drainage rate 10%, 20%, or 30%).
Horticulturae 08 01059 g008
Figure 9. Water uptake characteristics correlation matrix of strawberry ‘Kuemsil’ as affected by the nutrient solution supplying system using different drainage rate levels and timings (total irrigation volume, total drainage volume, total retained volume, water use efficiency). Asterisks indicate significant differences according to Duncan’s multiple range test at p < 0.05 (*), 0.01 (**) and 0.001 (***).
Horticulturae 08 01059 g009
Table 1. Growth characteristics of strawberry ‘Kuemsil’ affected by the nutrient solution supplying system using different drainage rate levels and timings at 159 (early harvest season) and 218 (late harvest season) days after transplanting (Drainage rate 10%, 20%, or 30%; Timer 1, timer set for 4 applications daily; Timer 2, timer set for 6 applications daily).
Harvest SeasonTreatment zNo. of LeavesPlant Height
(cm)
Petiole Length
(cm)
Leaf Length
(cm)
Leaf Width
(cm)
Crown Diameter
(mm)
Early10%10.4a y26.6a9.9a6.4a5.3a19.9a
20%10.1a26.4a10.4a6.8a5.5a20.5a
30%10.4a26.6a12.1a6.6a5.5a20.4a
Timer 110.2a27.3a9.5a6.5a5.3a20.3a
Timer 210.3a27.4a9.9a6.4a5.3a20.5a
Late10%14.3a27.2a12.4a7.9ab7.2ab20.3a
20%15.0a28.6a13.3a8.9a7.9a20.9a
30%14.2a24.4a10.9a7.8ab7.0a–c20.3a
Timer 115.4a24.7a10.9a7.8ab6.6bc20.6a
Timer 214.5a26.6a11.7a7.2b6.1c20.3a
z Drainage rate 10%, 20%, 30%; Timer 1, timer set for 4 applications daily; Timer 2, timer set for six applications daily; y Mean separation within columns by DMRT at 5% level. Different lower case letters indicate significant differences (p < 0.05) between treatments.
Table 2. Marketable fruit yield (above 12 g) characteristics of strawberry ‘Kuemsil’ affected by the nutrient solution supplying system using different drainage rate levels and timings.
Treatment zMarketable Fruit Yield
(g∙plant−1)
Yield
(kg∙m−2)
Marketable Fruit Ratio
1st Cluster2nd Cluster3rd ClusterTotal
10%161a y127a18.2a306a4.00a86.6a
20%175a148a19.2a342a4.47a86.1a
30%159a129a24.9a312a4.08a85.3a
Timer 1153a123a21.0a296a3.87a85.5a
Timer 2162a155a24.3a341a4.46a86.3a
z Drainage rate 10%, 20%, 30%; Timer 1, timer set for 4 applications daily; Timer 2, timer set for 6 applications daily; y Mean separation within columns by DMRT at 5% level. Different lower case letters indicate significant differences (p < 0.05) between treatments.
Table 3. Fruits characteristics of strawberry ‘Kuemsil’ affected by the nutrient solution supplying system using different drainage rate levels and timings.
Treatment zFruit WeightFruit HeightFruit WidthSoluble Solid ContentFirmnessAciditySoluble Solid-Acid Ratio
(g)(cm)(cm)(°Brix)(g·mm−2)(%)
10%40.6a y5.6a4.5a11.9a24.9b0.61a19.6a
20%44.0a5.7a4.5a11.9a28.1a0.61a19.5a
30%46.9a5.9a4.5a12.7a29.8a0.59a21.4a
Timer 138.4a5.6a4.3a12.3a28.2a0.59a20.9a
Timer 240.7a5.7a4.4a11.7a27.7a0.54a21.6a
z Drainage rate 10%, 20%, or 30%; Timer 1, timer set for 4 applications daily; Timer 2, timer set for six applications daily; y Mean separation within columns by DMRT at 5% level. Different lower case letters indicate significant differences (p < 0.05) between treatments.
Table 4. Total irrigation volume (TIV), total drainage volume (TDV), total retained volume (TRV), and water use efficiency (WUE) per strawberry ‘Kuemsil’ plants affected by the nutrient solution supplying system using different drainage rate levels and timings.
Treatment zTIVTDVTRVWUE
(L∙plant−1)(L∙plant−1)(L∙plant−1)(g∙L−1/plant)
10%14.5bc y4.3c10.1a43.6a
20%15.6bc5.1c10.5a48.4a
30%16.5b7.2b9.3a49.6a
Timer 114.1c4.0c10.2a43.6a
Timer 221.5a11.3a10.2a49.7a
z Drainage rate 10%, 20%, 30%; Timer 1, timer set for 4 applications daily; Timer 2, timer set for six applications daily; y Mean separation within columns by DMRT at 5% level. Different lower case letters indicate significant differences (p < 0.05) between treatments.
Publisher’s Note: MDPI stays neutral with regard to jurisdictional claims in published maps and institutional affiliations.

