Article

Comparison between Ultrasonic Bath and Sonotrode Extraction of Phenolic Compounds from Mango Peel By-Products

by
María José Aznar-Ramos
1,2,
María del Carmen Razola-Díaz
1,2,
Vito Verardo
1,2,* and
Ana María Gómez-Caravaca
2,3
1
Department of Nutrition and Food Science, Campus of Cartuja, University of Granada, 18071 Granada, Spain
2
Institute of Nutrition and Food Technology ‘José Mataix’, Biomedical Research Centre, University of Granada, Avd. Conocimiento s/n, 18100 Granada, Spain
3
Department of Analytical Chemistry, Faculty of Sciences, University of Granada, Avd. Fuentenueva s/n, 18071 Granada, Spain
*
Author to whom correspondence should be addressed.
Horticulturae 2022, 8(11), 1014; https://doi.org/10.3390/horticulturae8111014
Submission received: 19 September 2022 / Revised: 21 October 2022 / Accepted: 21 October 2022 / Published: 1 November 2022

Abstract

:
Phenolic compounds present in mango peel byproducts have been reported to have several beneficial health properties. In this study, we carried out an optimization of phenolic compounds using ultrasound-assisted extraction via ultrasonic bath and sonotrode. To optimize the variables of extraction, a Box–Behnken design was used to evaluate the best conditions to obtain high total phenolic compound extraction and high antioxidant activity evaluated by different methods (DPPH, ABTS, and FRAP). The optimal ultrasonic bath conditions were 45% ethanol, 60 min, and 1/450 ratio sample/solvent (w/v) whereas optimal sonotrode conditions were 55% ethanol, 18 min, and 65% amplitude. The extracts obtained at the optimal conditions were characterized by HPLC–ESI-TOF-MS. A total of 35 phenolic compounds were determined and, to our knowledge, several of them were tentatively identified for the first time in mango peel. The samples were composed mainly by phenolic acids derivatives, specifically of galloylglucose and methylgallate, which represented more than 50% of phenolic compounds of mango peel byproducts. In conclusion, sonotrode is a valuable green technology able to produce enriched phenolic compound extracts from mango peel byproducts that could be used for food, nutraceutical, and cosmeceutical applications.

1. Introduction

Mango fruit belongs to the family Anacardiaceae and is one of the four most demanded tropical fruits in the world, whose commercialization continues growing year after year. Mexico, Thailand, Brazil, Peru, and India are the major producers of mangoes, whose importation has increased by 2.9% since 2019 despite COVID-19 [1]. Moreover, mango production worldwide has grown about 14% since 2015. Concretely, in 2020, 54.83 million metric tons of mangoes were produced in the world (www.statista.com (accessed on 17 August 2022)). Nevertheless, there are different byproducts generated from mango processing. Mango peel is the most representative byproduct due to his high weight in the total fruit, between 15% and 20% [2]. It represented a waste of about 11 million metric tons in 2020; thus, the economic losses were high (www.statista.com). Mango peel has several bioactive compounds such as ascorbic acid, carotenoids, and phenolic compounds (phenolic acids, flavonoids, and anthocyanins) [3,4,5]. In several studies, these compounds were demonstrated to have beneficial health properties such as antioxidative, anticarcinogenic, antiatherosclerosis, antimutagenic, and angiogenesis-inhibitory properties; hence, it can be considered a great source to use to promote health [2,6,7,8,9]. Among others, the antioxidant activity reported from mango peel has been highlighted. In this way, phenolic compounds are very important due to their high antioxidant activity which may allow defensive activity against oxidative stress generated by some degenerative diseases [10]. In recent years, the interest in phenolic compounds has increased. Indeed, mango phenolic compounds could increase the shelf-life of food and improve food packaging when added due to their capacity to reduce free radicals and microbials [11].
There are different techniques to extract bioactive compounds. However, conventional methods of extraction such Soxhlet and maceration present several disadvantages such as the use of high temperature (>60 °C), high solvent consumption, and longer extraction times (several hours) [12,13]. Currently, these problems are being solved with green techniques which are more sustainable and careful with the environment such as ultrasound-assisted extraction (UAE) [12], microwave-assisted extraction (MAE) [14], supercritical fluid extraction (SFE) [15], and pressurized-assisted extraction (PLE) [16]. MAE allows reducing the time needed to carry out various extractions simultaneously and it is cheap; however, this method can overheat the sample [17]. SFE needs less time and temperature than traditional extraction methods; however, it is complex and expensive [17]. PLE reduces the time needed but it needs high temperatures, and the extractions are not simple [18]. Ultrasound-assisted extraction is based on the cavitation of the cell carried out by sound waves which are responsible for sample cell-wall rupture, yielding the compounds of interest in the solvent. The advantages of ultrasonic-assisted extraction are that it is a simple method, is easy to use, and reduces the extraction time, temperature, and solvent required [2,5,19]. Therefore, UAE is a great alternative to conventional methods to obtain polyphenols [12]. Ultrasound power can be applied using two types of devices: an ultrasonic bath or probe ultrasound equipment (sonotrode). The ultrasonic bath is more frequently used than the sonotrode because it is cheaper and more available, and it allows the extraction of different samples at the same time. However, the intensity is attenuated due to the water bath [20]. The sonotrode system is more powerful than the ultrasonic bath because the ultrasound delivery is direct and there is minor energy loss [20]. In a study of olive pomace, both technologies were compared, observing a major recovering of phenolic compounds and antioxidant activity in less time when using sonotrode technology [21].
Therefore, two ultrasound technologies are available at a laboratory scale (ultrasonic bath and sonotrode); accordingly, it is important in terms of quality control to establish the best method of extraction for the determination of these target compounds. There are few articles about the extraction of phenolic compound in mango peel byproducts using ultrasonic-assisted extraction (with ultrasound bath [22] or sonotrode [2]) and about the optimization of different parameters (time, ratio of sample to solvent, percentage ethanol/water, and amplitude) with the aim of achieving better conditions to extract them. Ethanol is used because it is classified as GRAS (generally recognized as safe). Therefore, the goal of this article was to optimize the conditions of extraction via ultrasonic bath and sonotrode in order to obtain the highest phenolic recovery with the highest antioxidant activity in mango peel byproducts. In this way, comparing both ultrasound technologies, using the same mango peel sample, can allow determining if there are advantages in the phenolic compounds extracted and their extraction parameters. The antioxidant activity is determined by three different methods due to their different sensibility to determine phenolic compounds that use the hydrogen atom transfer (HAT) and single-electron transfer (SET) mechanisms. Additionally, in the present article, the compounds of the samples obtained under optimum conditions were characterized by HPLC–ESI-TOF-MS.

2. Materials and Methods

2.1. Chemical and Samples

Mango peels of the cv. Palmer proceeding from Brazil were provided by a local industry of juices in February 2022. A total of 10 kg was collected for three consecutive days. The peels were submitted to freeze-drying process using a Zirbus lyophilizer (Bad Grund, Germany) for 120 h at −50 °C with a pressure of 0.8 mbar. To avoid the oxidation of the sensible compounds, the freeze-dryer was covered to create a dark environment. The peels were ground with a knife mill provided by IKA Werke GmbH & Co. KG (Staufen, Germany) and sieved to 0.2 mm. The sample was stored in a freezer at −32 °C before the analysis.
Gallic acid, Trolox, DPPH, ABTS, and FRAP reagents were purchased from Sigma-Aldrich (St. Louis, MO, USA). Na2CO3 was purchased from BDH AnalaR (Poole, England). Water was obtained using a Milli-Q system (Millipore, Bedford, MA, USA). 1-O-Galloyl-β-D-glucose (purity > 90%), vanillic acid (purity > 97%), chlorogenic acid (purity > 95%), ferulic acid (purity > 99%), catechin (purity > 99%), quercetin (purity > 95%), and rutin (purity > 95%) were also acquired from Sigma-Aldrich (St. Louis, MO, USA). HPLC-grade water, Folin–Ciocâlteu reagent, and other reagents were acquired from Merck KGaA (Darmstadt, Germany).

2.2. Experimental Design

A Box–Behnken design and response surface methodology (RSM) were used to optimize the conditions of different variants using bath ultrasonic and sonotrode from mango peel byproducts. The objective of this experimental design was to obtain the major recovery of phenolic compounds and antioxidant activity. The designs were composed by 15 experiments with three different levels (−1, 0, and +1). These experiments were performed in duplicate. The independent variables for ultrasonic bath were X1: ratio ethanol/water (20:80, 60:40, and 100:0 v/v), X2: time (10, 50, and 90 min), and X3: ratio sample/solvent (1:70, 1:285, and 1:500 w/v). In the case of experiments using a sonotrode, ratio sample/solvent was previously established by our research group; accordingly, the independent variables were X1: ethanol/water (20:80, 60:40, and 100:0 v/v), X2: time (5, 25, and 45 min), and X3: amplitude (20%, 60%, and 100%), and a fixed ratio of 1:400 (w/v) was established. The dependent variables evaluated were the total phenolic compounds measured using Folin–Ciocâlteu method, and the antioxidant activity measured using DPPH, ABTS, and FRAP. A second-order polynomial model equation was used to adjust the dependent variables (Equation (1)).
ϒ = β 0 + i = 0 4 β i X i + i = 0 4 β ii X ii 2 + i = 0 4 j = 0 4 β ii X i X j ,
where ϒ represents the response variable: the total phenolic compounds (TPC) or the antioxidant assays ABTS, FRAP, or DPPH. Xi and Xj are the independent factors influencing the response. β0, βi, βii, and βij are the regression coefficients of the model (interception, linear, quadratic, and interaction terms).
Statistica 7.0 package (StatSoft, Tulsa, OK, USA) was used for analyzing statistical data. Both models were evaluated by ANOVA taking into account its regression coefficients, p-values of the regressions, and lack of fit. Additionally, the optimum conditions were established using response surface methodology.

2.3. Extraction of Phenolic Compounds from Mango Peel Byproducts Using Ultrasonic Bath

Mango peel byproducts were extracted using an ultrasonic bath (Bandelin, Sonorex, RK52, Berlin, Germany) which worked at a frequency of 35 kHz. The volume used for extraction was 10 mL of ethanol/water solution following the experimental conditions of the model (Table 1). Then, the samples were centrifuged at 8603× g for 10 min and evaporated using a Buchi R-205 rotavapor. To finish, the samples were reconstituted in 2 mL of methanol/water (1:1) and filtered with a 0.2 μm nylon syringe filter.

2.4. Extraction of Phenolic Compounds from Mango Peel Byproducts Using Sonotrode

A fixed ratio of 1:400 (w/v) was established to extract mango peel byproducts using a sonotrode (UP400St ultrasonic processor, Hielscher, Germany) according to previous studies. The experiments were carried out following the experimental conditions of the model (Table 1). Then, the samples were centrifuged at 8603× g for 10 min and evaporated using a Buchi R-205 rotavapor. Lastly, the samples were reconstituted in 2 mL of methanol/water (1:1) and filtered using a 0.2 μm nylon syringe filter.

2.5. Antioxidant Activity

The antioxidant capacity of mango peel byproducts was determined through three different methods (DPPH, FRAP, and ABTS). The DPPH assay was performed following the protocol of Brand-Williams et al. (1995) [23]. In this way, 0.1 mL of the extract was added to 2.9 mL of 100 μM DPPH solution in MeOH/H2O 1/1 (v/v), and the absorbance was measured after 30 min at 517 nm. The protocol of Re et al. (1999) [24] was carried out for the ABTS assay. ABTS radical cation (ABTS+) was added to ethanol to reach an absorbance of 0.7 ± 0.02 at 734 nm. Thus, 10 μL of extract was added to 1 mL of ABTS reagent, and its absorbance was determined after 10 min. The FRAP assay was undertaken according to the process described by Pulido et al. (2000) [25]. For this, 30 μL of the extracts was added to 0.9 mL of water and 0.9 mL of FRAP reagent. The absorbance was observed after 30 min at 595 nm. For the three assays, the results were expressed as mg Trolox equivalent/g dry weight (dw). Each sample was processed in duplicate.

2.6. Determination of Total Phenolic Compound Using Folin–Ciocâlteu Assay

Total phenolic compounds were performed following the Folin–Ciocâlteu spectrophotometric method [26]. In this way, 100 μL of the extract was added to 500 μL of Folin–Ciocâlteu reagent and 6 mL of MilliQ water. The flask was agitated, and then 2 mL of 15% (w/v) Na2CO3 was added before flushing the flask to 10 mL with MilliQ water. Lastly, it was stored in dark conditions, and, after 2 h, absorbance was measured at 750 nm using a UV–visible spectrophotometer (Spectrophotometer 300 Array, UV–Vis, single beam, Shimadzu, Duisburg, Germany). To calculate the total phenolic compounds, the results were compared to a standard curve of gallic acid. For this reason, results were expressed as mg gallic acid equivalents (GAE)/g dry weight (dw).

2.7. Determination of Phenolic Compounds by HPLC–ESI-TOF-MS

The extracts of mango peel byproducts obtained using the optimized conditions from the Box–Behnken design were analyzed in duplicate on an ACQUITY Ultra Performance LC system (Waters Corporation, Milford, MA, USA) coupled to an electrospray ionization (ESI) source operating in the negative mode and a time-of-flight (TOF) mass detector (Waters Corporation, Milford, MA, USA). The phenolic compounds were separated using a BEH Shield RP18 column (1.7 μm, 2.1 mm × 100 mm; Waters Corporation, Milford, MA, USA) at 40 °C using a gradient previously stated by Verni et al. (2020) [27] (Supplementary Figure S1). The data were processed using MassLynx 4.1 software (Waters Corporation, Milford, MA, USA).
For the quantification of the phenolic compounds in mango peel samples, six different calibration curves of 1-O-Galloyl-β-D-glucose, chlorogenic acid, ferulic acid, quercetin, catechin, and rutin were used. They were elaborated by using the peak areas of each standard measured by HPLC at different concentrations. The identified compounds were classified in function of their structure and molecular weight. Appendix A Table A1 contains the standards used, with their calibration ranges and curves, the regression coefficients, and the limits of detection (LOD) and quantification (LOQ). These curves were good according to their good linearity (R2 > 0.99). Calibration ranges were determined previously according to the LOQ values. LOD ranged between 0.16 and 2.24 µg/mL, and LOQ ranged between 0.54 and 7.48 µg/mL.

3. Results and Discussion

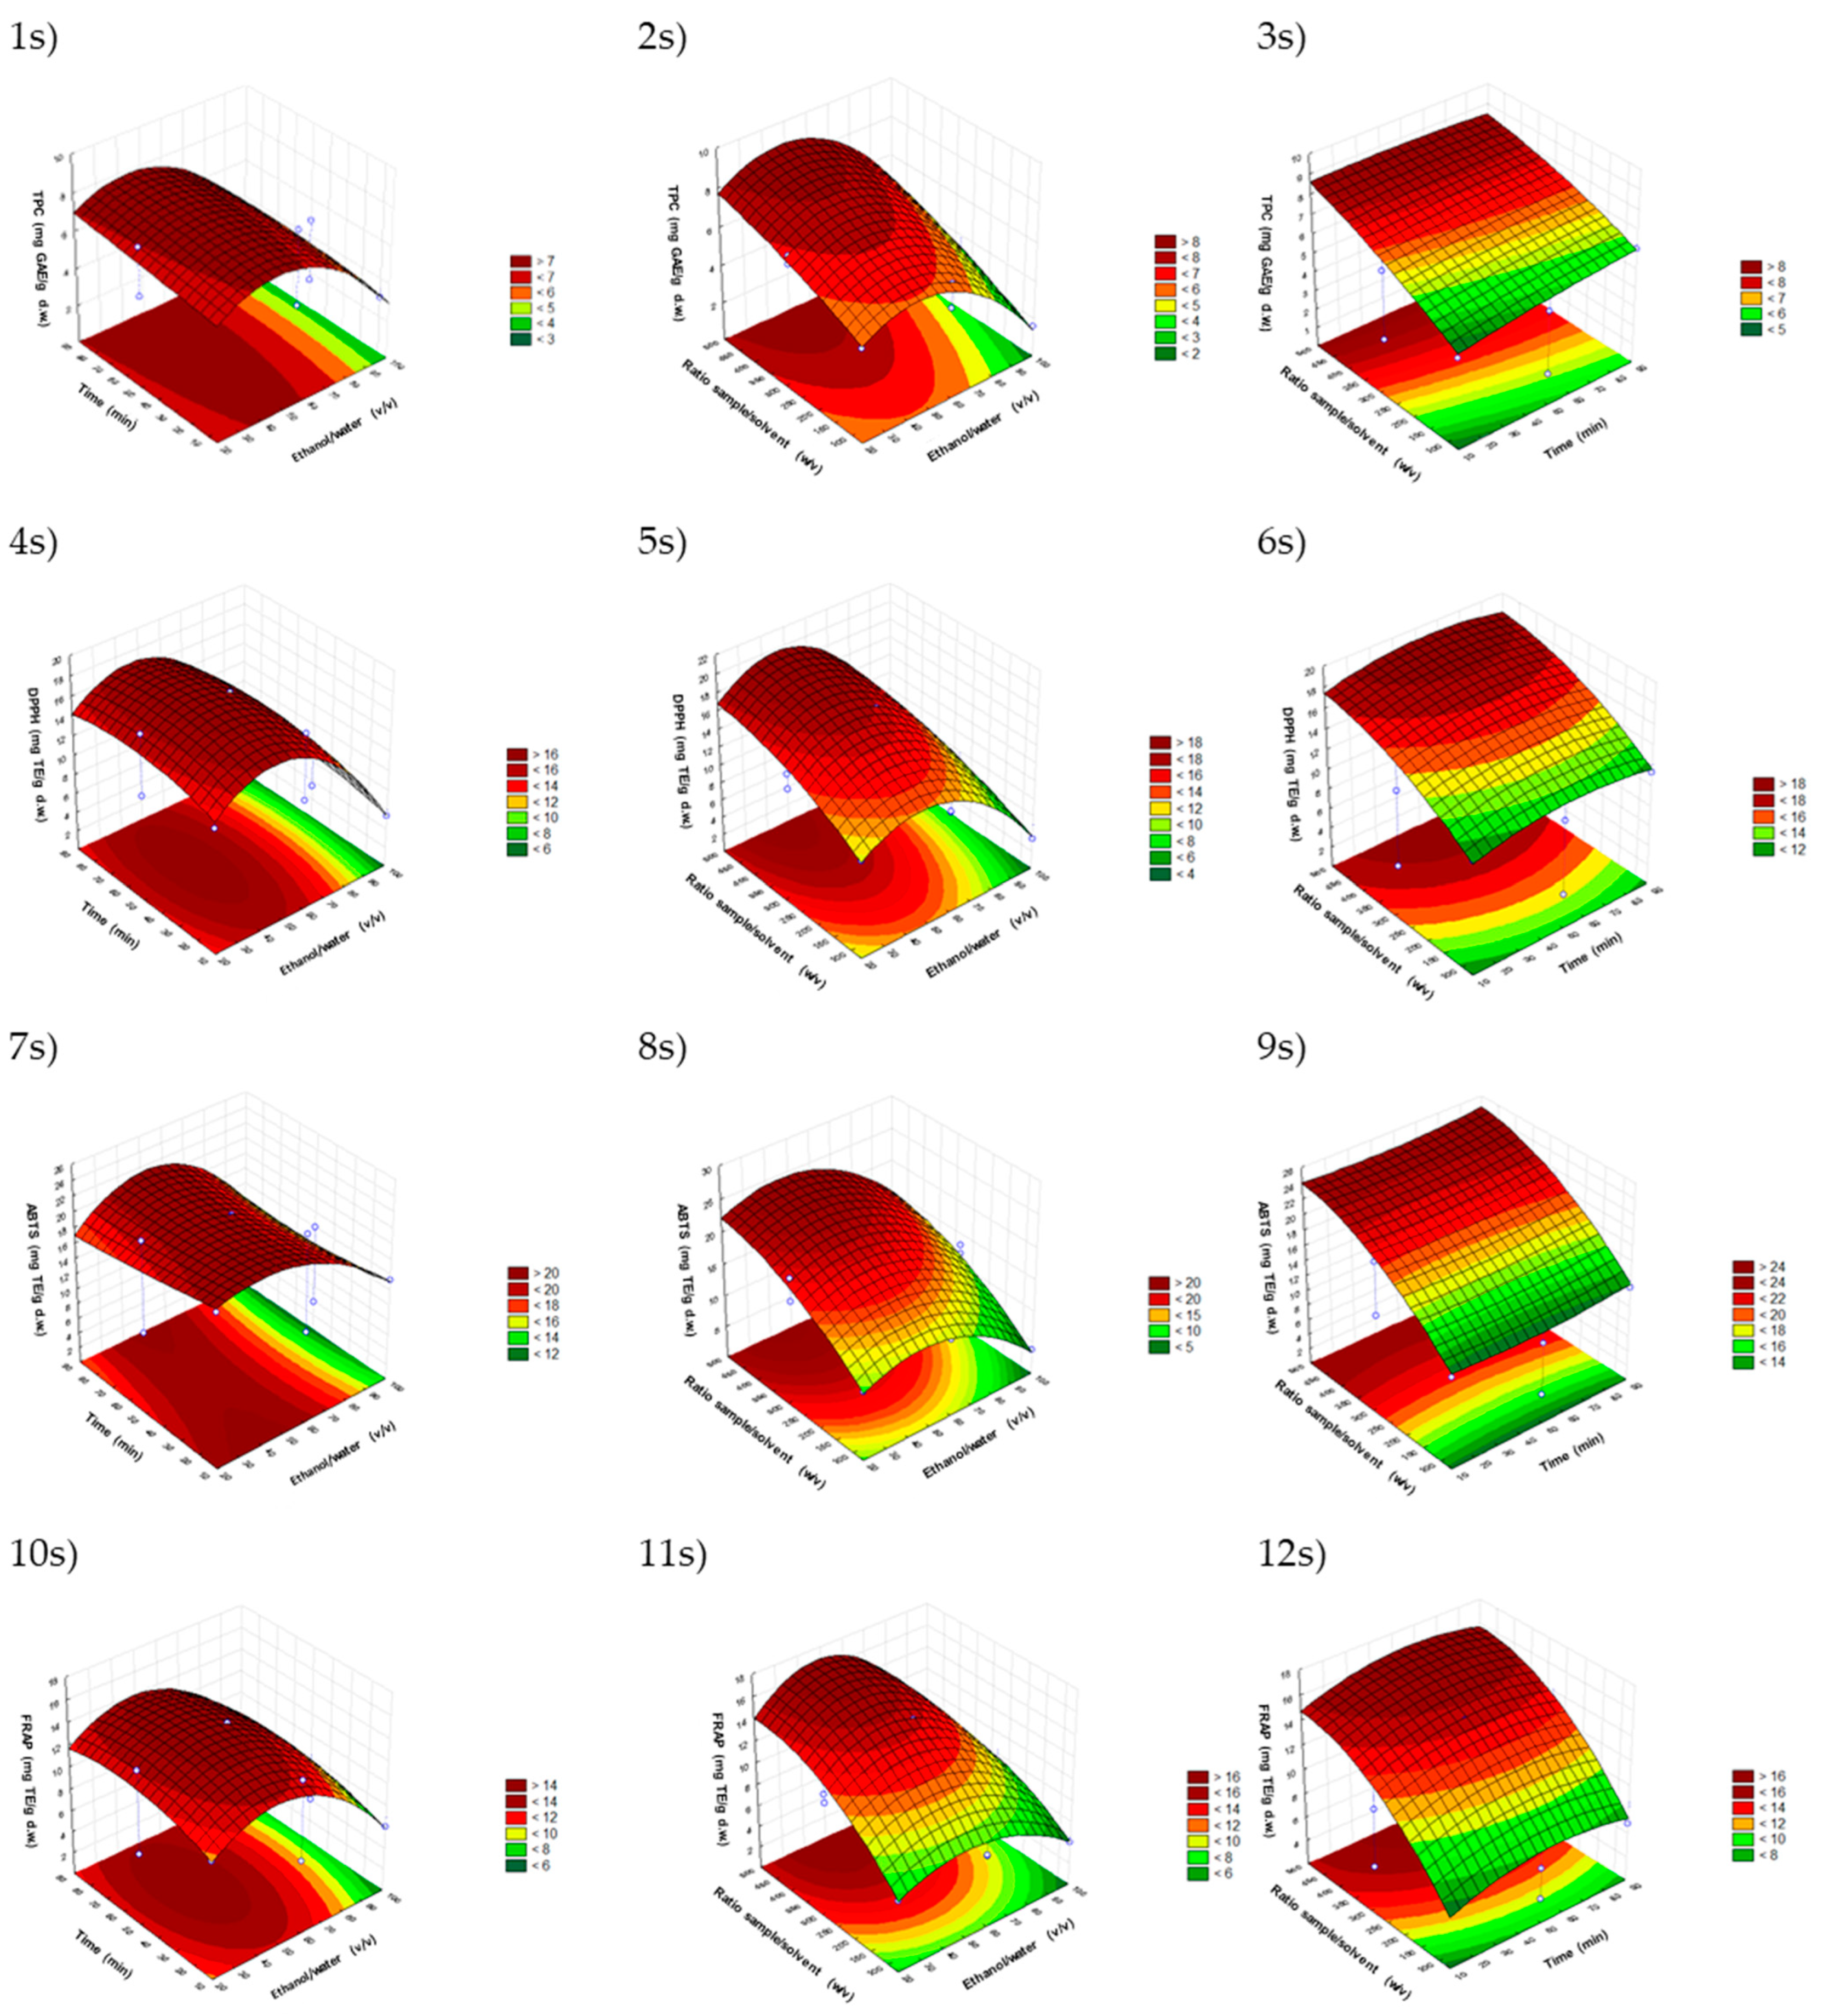
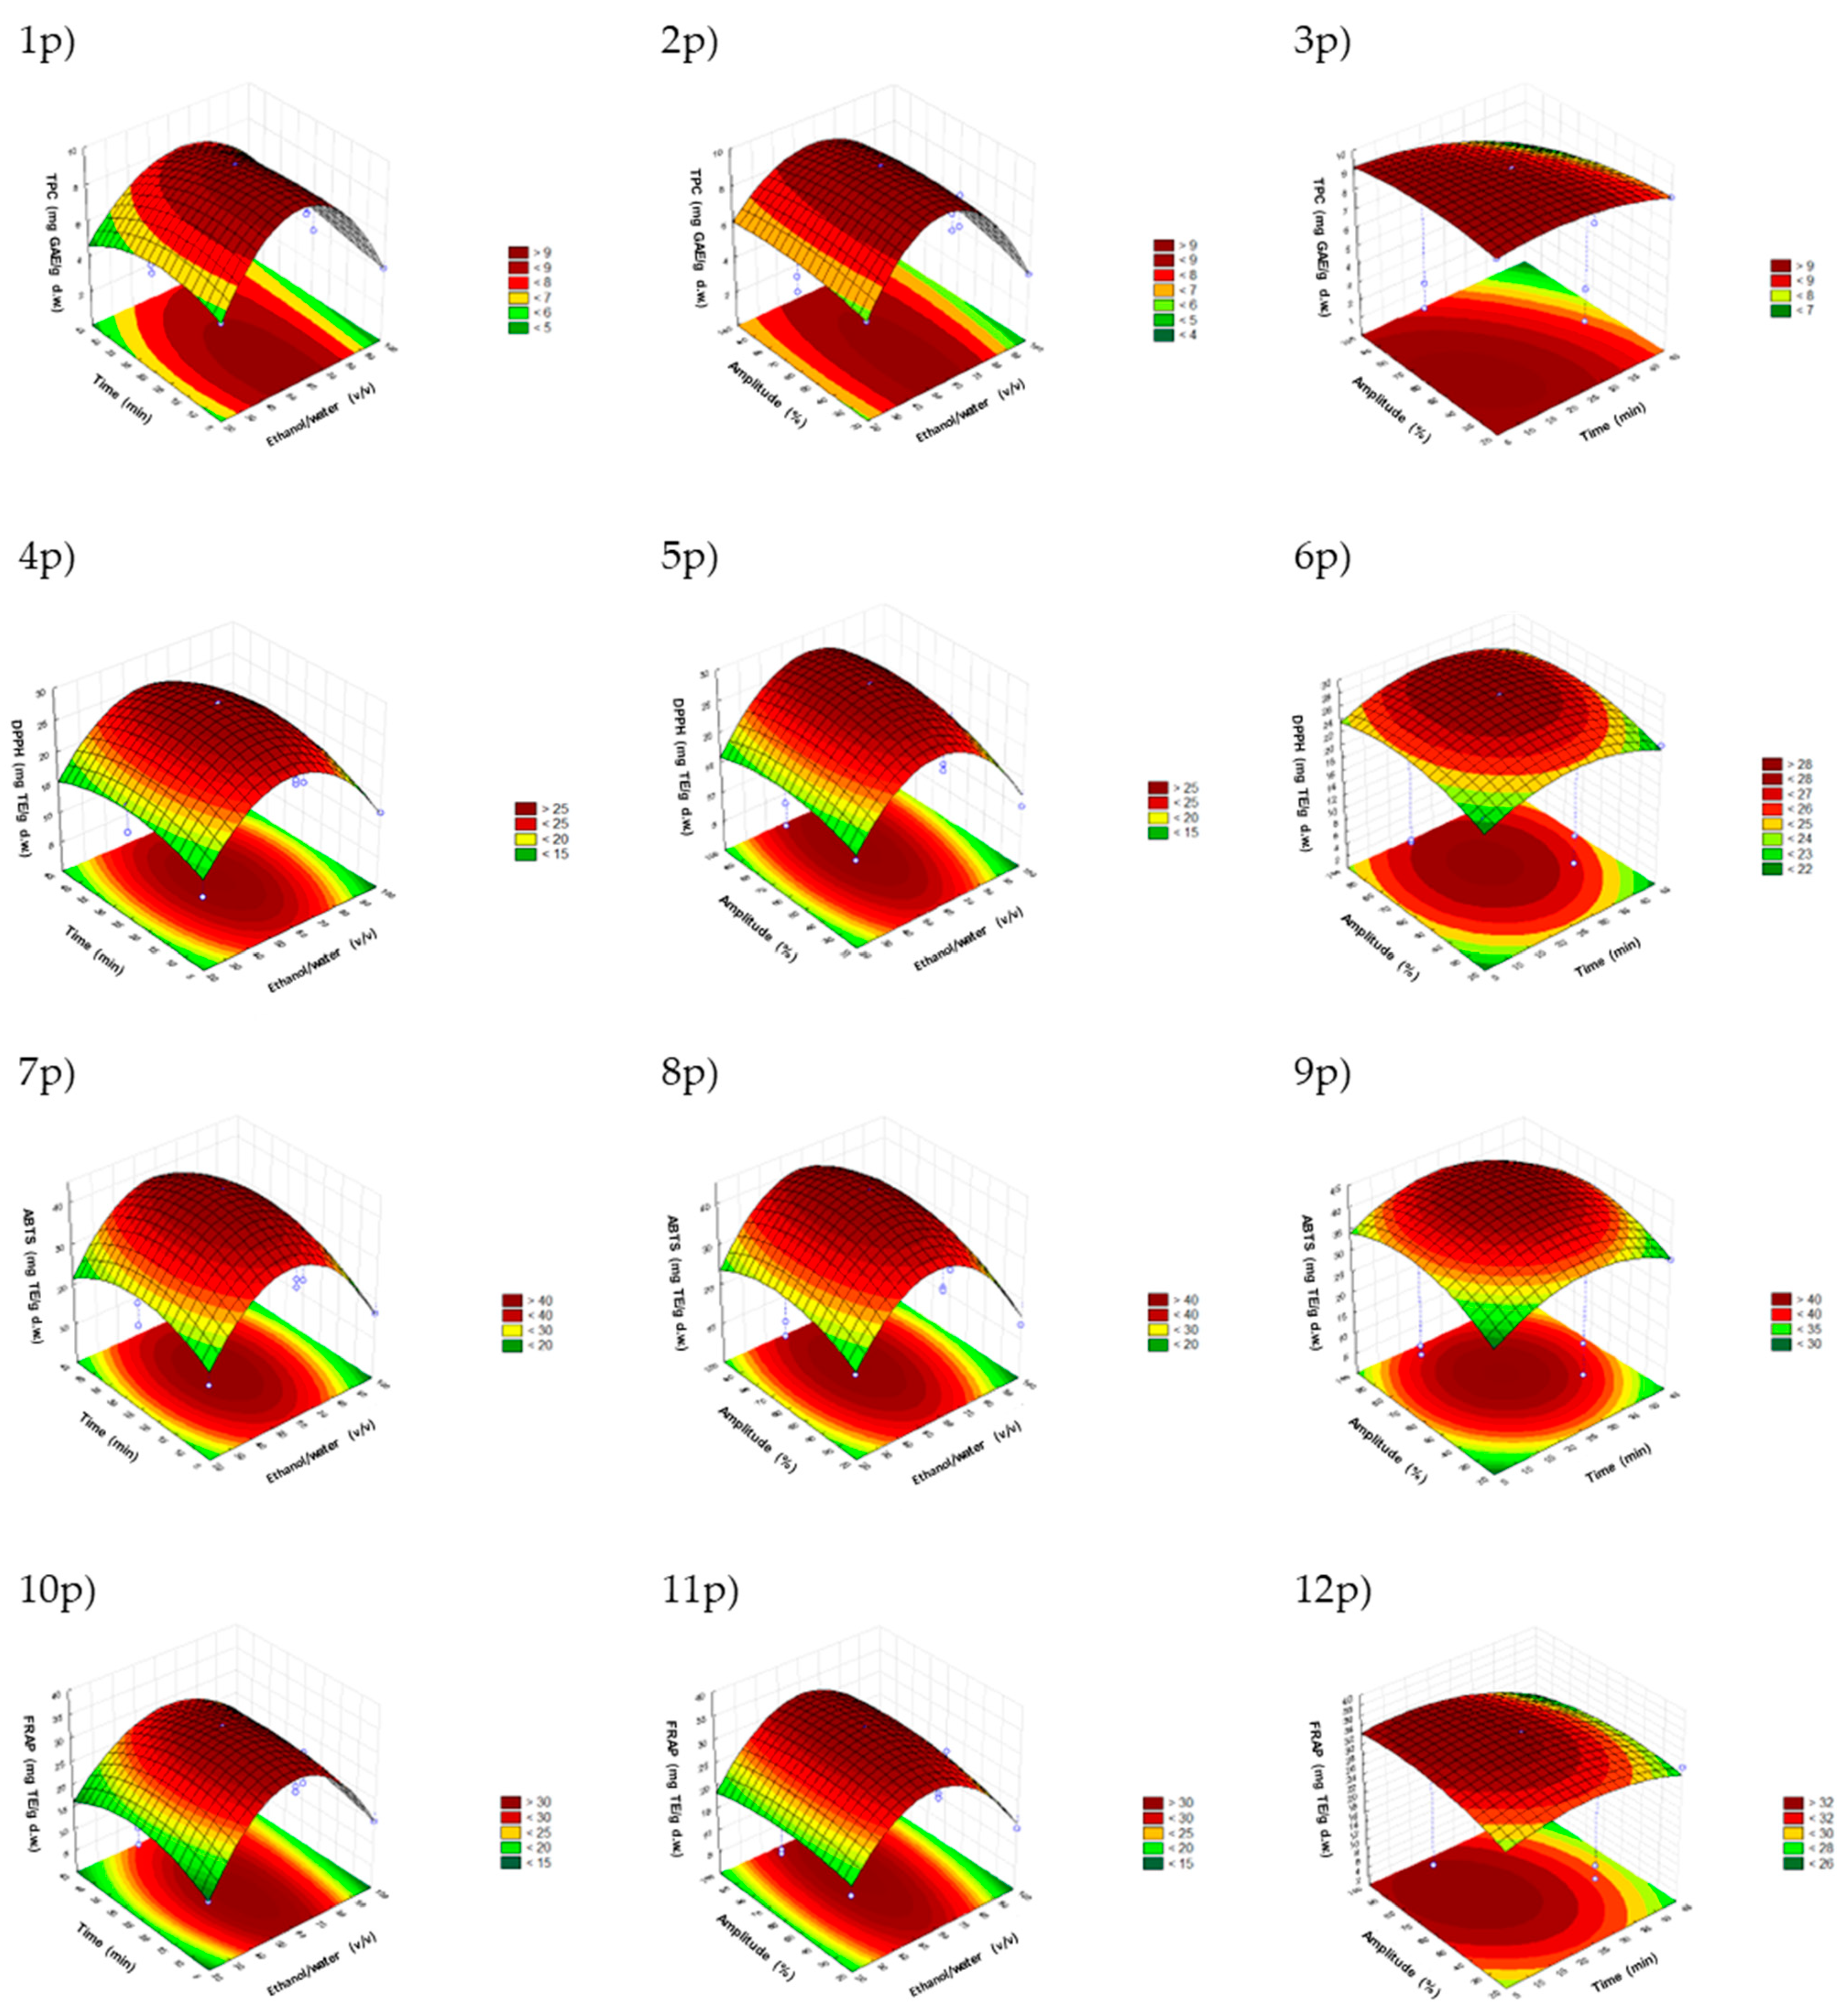
3.1. Fitting the Models

The total phenolic compounds and the antioxidant capacity assays were utilized to optimize the different ultrasonic models (ultrasonic bath and sonotrode) using a Box–Behnken design and response surface methodology (RSM). Table 1 shows all the experiments carried out for both models with the results obtained for all the responses.
The values obtained for TPC ranged between 1.6 and 8.7 mg GAE/g dw and between 3.9 and 9.4 mg GAE/g dw in the ultrasonic bath and sonotrode, respectively. The lowest ultrasonic bath and sonotrode values were obtained when 100% ethanol was used; this confirmed that the lower polarity of the organic solvent compared with water was not enough to recover the targeted compounds. On the other hand, the highest content of phenolic compounds was observed in the ultrasonic bath model with 60% ethanol/water (v/v), 90 min, and a 1:500 ratio of sample to solvent (w/v), whereas the conditions used to obtain the highest value of TPC in the sonotrode model were 60% ethanol/water (v/v), 25 min, and 60% amplitude. These data confirmed that the mixture with water (with higher polarity compared with 100% ethanol) was able to extract high amounts of phenolic compounds.
For antioxidant assays, ultrasonic bath values ranged from 3.4 to 17.8 mg TE/g dw, from 3.9 to 24.8 mg TE/g dw, and from 4.0 to 16.5 mg TE/g dw according to the DPPH, ABTS, and FRAP methods, respectively, whereas sonotrode values ranged from 10.1 to 28.7 mg TE/g dw, from 13.6 to 44.3 mg TE/g dw, and from 13.7 to 33.8 mg TE/g dw, respectively. The trend of antioxidant assay results was very similar to the TPC results; moreover, the lowest and highest values were obtained with the same TPC assay conditions in both models, confirming that the phenolic compounds with high antioxidant activity were better recovered using an ethanol/water mixture.
According to the Box–Behnken design, the experimental data were fitted to second-order polynomial equations, and the regression coefficients are shown in Table 2 for each variable response of the model designs of ultrasonic bath and sonotrode.
The models were tested using ANOVA, setting a statistical significance of confidence model at 95%. At p < 0.05, we rejected the null hypothesis that there was no difference between the means and concluded that there was a significant difference. For this reason, the terms with p > 0.05 were classified as nonsignificant, and the models were recalculated only with significant terms. The tendency and magnitude of influence on the response variables depended on the sign and value of effect. Positive values favored TPC, DPPH, ABTS, and FRAP, whereas negative values indicated an inverse relationship. Furthermore, the value of effect had a direct relationship with the magnitude on the response variables [22]. In the ultrasonic bath model (Table 2), all the linear terms were significant for all the response variables studied except for the linear effect of time (β2) in the FRAP assay. Considering the crossed terms, all showed a significant influence except for the crossed effect β13 in TPC and ABTS responses. Additionally, the quadratic term β11 for TPC, DPPH, and FRAP, β22 for ABTS, and β33 for DPPH and FRAP showed no significant effect. In Table 2, the different effects of the variants and their correspondent p-values can be observed in the sonotrode model. Accordingly, the linear effects were all significant except for ethanol/water (X1) in DPPH and FRAP methods and time (X2) in TPC and FRAP assays. In the case of quadratic effects, all of them were significant for all the response variables studied. Lastly, considering the crossed effects, all showed a significant influence except for the crossed effect β12 in DPPH and ABTS responses, the crossed effect β13 in DPPH, ABTS and FRAP assays, and the crossed effect β23 in the DPPH response. In both models (ultrasonic bath and sonotrode), a high correlation between dependent and independent factors was obtained whose quadratic correlation coefficients (R2) were higher than 0.96; therefore, the model had substantial response variability. Furthermore, the lacks of fit were not significant (p > 0.05); hence, the models fitted well.

3.2. Optimization of Extraction Conditions

In order to establish the optimal conditions of phenolic compound extraction via ultrasonic bath and sonotrode, the different response surface graphics (Figure 1 and Figure 2) were observed and studied. In Figure 1, it can be observed that the highest content of phenolic compounds and antioxidant activity could be reached with an intermediate value of the range of ethanol/water ratio (v/v). However, the highest ratio of sample/solvent (w/v) was needed to get these results. Thus, the optimal bath ultrasonic conditions established were 45% ethanol, 60 min, and a sample/solvent ratio of 1:450 (w/v) (Table 3). The results obtained with these optimal conditions were in concordance with predicted conditions obtained by the mathematical model. The coefficients of variation (CV) that existed between the predicted and the experimental data were lower than 10% in all cases. In the Folin–Ciocâlteu assay and all antioxidant assays (DPPH, ABTS, and FRAP), the CV was less than 4. For these reasons, the ultrasonic bath model optimization was established with these conditions. After the analysis of the different graphics performed by response surface methodology (Figure 2), it was observed that the parameters studied to optimize the sonotrode extraction conditions were found in the middle of the plots. Therefore, the ethanol/water (v/v), time (min), and amplitude (%) values needed to obtain an optimized model were in the intermediate ranged used to carry out the different assays of the model. In this way, the optimal sonotrode conditions used were 55% ethanol, 18 min, and 65% amplitude (Table 3). This model can be considered optimized for these parameters. The time influence depended on the other variables (ethanol/water percentage, the sample/solvent ratio (w/v), and amplitude); however, in Figure 1 and Figure 2, it can be observed that intermediate time values were good to extract phenolic compounds.
According to the literature, ethanol can be used in the food system due to it is classified as GRAS (generally recognized as safe) [28]. Some authors studied the extraction of phenolic compounds by mango peels using ethanolic maceration with and without stirring but needing large times and with unsatisfactory results [15,29]. García-Mendoza et al. (2015) [15] and Sai-Ut et al. (2015) [29] needed 24 h and 221 min to complete their extractions by maceration, respectively. Safdar et al. (2017) [5] reported a higher content of total phenolic compounds and antioxidant capacity when using ethanol (80%) instead of methanol, acetone, or ethyl acetate by maceration and ultrasound-assisted extraction with sonotrode. However, when they used 50% ethanol, no significant differences were found according to the antioxidant extraction. Comparing both techniques, the sonotrode method for 60 min allowed extracting 13% higher total phenolic content than maceration for 20 h.
Martínez-Ramos et al. (2020) [30] compared a conventional solvent extraction and an ultrasound-assisted extraction with sonotrode. They also carried out extractions with different solvent mixtures of acetone, ethanol, and n-hexane. They reported the best mixture as ethanol/acetone 60%/40% due to the capacity of ethanol to extract glycosidic and non-glycosidic phenolic compounds, whereas acetone only extracts non-glycosidic phenolic compounds. The results of phenolic compounds obtained with the sonotrode ultrasound-assisted method in this article were in the same range of magnitude as those found in our study using a similar time. In fact, we only used ethanol as an organic solvent combined with water. Borrás-Enríquez et al. (2021) also optimized the extraction of phenolic compounds from mango peel using an ultrasonic bath. Optimal conditions were obtained with 50% ethanol/water (v/v) [22]. The ethanol/water (v/v) percentage was very similar to the ultrasonic bath percentages of our study. In our case, we needed a longer time due to their bath frequency being 80 kHz in contrast to our bath with a frequency of 35 kHz [22]. Kaur et al. (2021) [2] used ultrasound-assisted extraction by sonotrode, finding that the highest extraction of phenolic compounds was obtained with an amplitude and time lower than those obtained in our work.
Mango peel can be blended with liquid nitrogen due to it being an excellent freezing agent that may control enzymatic browning. Then, it can be used in other food matrices such as potato puree [31]. Jirasuteeruk and Theerakulkait [31] extracted phenolic compounds after pretreatment using distilled water and a sample/solvent ratio (w/v) of 1:6. A better time was obtained at 15 min using an ultrasonic bath at 50 kHz combined with 15 min of stirring. The total phenolic compounds extracted were in the same range as our research (972 mg/100 g dw); however, in our case, this pretreatment was not used.
In addition, in other investigations, new technologies were used such as ultrasound/microwave-assisted extraction, microwave-assisted extraction [14,32], microwave-assisted extraction with deep eutectic solvents [33], supercritical CO2 extraction [34], and sequential extraction steps [15].
All previous research on other technologies used for extracting phenolic compounds from the mango peel byproduct are summarized in Table 4.
There are few studies about the antioxidant activity of mango byproducts; however, those that evaluated the radical-scavenging activity mostly used the DPPH and ABTS techniques. Martínez-Ramos et al. [30] reported values of 26.4 mg TE/100 g dw and 21.1 mg TE/100 g dw for DPPH and ABTS assays, respectively, in mango peels extracts obtained by ultrasound-assisted extraction with ethanol/acetone 60/40 (v/v) for 15 min at 24 kHz. Sai-Ut et al. [29] reported values slightly higher but they used maceration as the extraction technique with temperature (60 °C) and needing longer time (220 min), yielding 102.57 mg TE/100 g for the DPPH method, 108.8 mg TE/100 g for the ABTS technique, and 52.72 mg TE/100 g for the FRAP assay. These results were in the same range of magnitude as those reported here. Nevertheless, Castañeda-Valbuena et al. [12], in mango peel from the Haden variety, reported results in the range of 65.9 to 249.3 mg TE/g for the DPPH method, between 239.1 and 1155.8 mg TE/g for the ABTS technique, and between 7.1 and 100.9 mg TE/g for the FRAP assay, representing the same range of magnitude as the results obtained here for mango peels of the Palmer variety.

3.3. Identification of Polar Compounds Using HPLC–MS-ESI-TOF

Phenolic compounds of mango peel byproducts were identified from the samples extracted in the optimal conditions using HPLC-ESI-TOF-MS. It was possible to compare the different mass data and fragment ions with the literature, commercial standards, and various databases. Determination of phenolic compounds from mango peel byproducts took into account the retention time, experimental and calculated m/z, the error (ppm), score (%), mainly in source fragment ions, and molecular formula.
Table 5 presents a total of 35 identified polar compounds from the sonotrode and ultrasonic bath optimized samples, including two organic acids, 25 phenolic acid derivatives, 10 flavonoids, one monoterpenoid, and another polar compound. The studies of Gómez-Caravaca et al. [4] and Pierson et al. [35] were used to identify most phenolic compounds.
Firstly, two organic acids were identified at 0.39 min and 0.49 min (peaks 3 and 4) corresponding to quinic and citric acid, respectively [4,35].
Phenolic acids were the main representative phenolic compounds found in mango peel. Peak 5 and peak 9 corresponded with galloylglucose isomers a and b, respectively. The compound at 0.803 min (peak 6) was identified as gallic acid. Peak 7 corresponded to 3-galloylquinic. Peak 8 had a molecular formula of C19H25O15 and was proposed to be galloyl diglucoside. Peak 10 was identified as p-hydroxybenzoic acid glucoside. Peak 11 and 27 were methylgallate isomers. Peak 12 corresponded with digalloylglucose. The peak at 4.331 min (peak 15) and with a molecular formula of C16H20O9 was tentatively identified as ferulic acid hexoside. Peak 18 corresponded to syringic acid. Peak 19 was identified as sinapic acid hexoside-pentoside. Peak 20 was assigned to dihydro sinapic acid hexoside-pentoside, and peak 22 corresponded to the hydroxybenzoyl galloyl glucoside. Peak 23 had a molecular formula of C27H24O18 and was identified as trigalloyl glucose. Peak 26 with m/z 477.1017 corresponded to coumaroyl galloyl glucoside. Peak 28 was identified as methyl-digallate ester, and peak 33 was protocatechuic acid. Peak 35 with C16H14O9 as the molecular formula corresponded to ethyl 2,4-dihydroxy-3-(3,4,5-trihydroxybenzoyl) oxybenzoate. Peak 36 at 9.972 min with a fragment at 124 and C9H10O5 as the molecular formula was identified as syringic acid [4,35]. Furthermore, some new phenolic acids were tentatively identified in mango peel for the first time. Firstly, peak 1 at 0.32 min, m/z 341 and fragment ions 191, 165, and 113 corresponded to hexosyl-hexose, identified previously in mango seed samples [36]. Peak 2 at 0.34 min with m/z 377.0817 and fragment ion 341 was tentatively identified as a caffeic acid derivative previously described in Lysimachia species [37]. Peaks 16 and 17 were isomers with m/z 401.1448 and, according to fragment ions 313, 125, and 161, they were classified as 6-pentyl-O-galloyl-beta-d-glucose according to the PUBCHEM database. Peak 21 at 5.367 min, with m/z 533.1869, C23H34O14 as the molecular formula, and a fragment ion at 401.1404, was considered to be dicaffeoylhexaric acid, which was previously identified in Helichrysum italicum samples [38].
Moreover, some flavonoids were found in the mango peel samples according to Gómez-Caravaca et al. (2016) [4] and Pierson et al. (2014) [35]. Peak 13 was identified as catechin, and peaks 29 and 30 corresponded to quercetin glucoside and quercetin galactoside, respectively. Peak 31 with a molecular formula of C20H18O11 was identified as quercetin xyloside. Peaks 32, 37, and 38 were isomers with fragment ions at 300, 271, 284, 255, and 227, which were identified as quercetin 3-rhamnoside. Peak 34 at 9.844 min, with m/z 433.0754, corresponded to the compound quercetin arabinopyranoside. Peak 39 with a molecular formula of C22H22O12 corresponded to rhamnetin hexoside. In addition to these flavonoids, special attention was paid to those identified in mango peel for the first time. Peak 24 at 5.859 min, with m/z 443.1904 and the fragment ion 314, was tentatively named cynaroside A in concordance with the PUBCHEM database.
Additionally a secoiridoid monoterpenoid was found at 7.27 min (peak 25), with m/z 553.1551, tentatively named as ligustrosidic acid according to a previous study of the herbal medicine Ligustri Lucidi Fructus [39]. Furthermore, another polar compound was detected corresponding to peak 35 with a molecular formula of C16H14O9 and fragment ions 124 and 197, tentatively named ethyl 2,4-dihydroxy-3-(3,4,5-trihydroxybenzoyl)oxybenzoate [40].

3.4. Quantification of Phenolic Compounds in Mango Peel Byproducts by HPLC–MS-ESI-TOF

A total of 22 and 15 compounds could be quantified in sonotrode and ultrasonic bath samples, respectively (Table 6).
As expected, the value obtained via HPLC–TOF-MS, which is a specific method for the determination of phenolic compounds, and that obtained via the Folin–Ciocâlteu assay, which is a spectrophotometric method, were a little bit different but in the same order of magnitude.
According to another study [4], the main compounds on sonotrode and ultrasonic bath samples were galloylglucose and methylgallate, a phenolic acid derivative of gallic acid. The amount of galloylglucose extracted by the two ultrasound techniques were quite similar. In sonotrode extracts, a higher content in methylgallate was detected, which was more than eight times higher than in the bath ultrasound extract. The sum of galloylglucose isomers and methylgallate was higher in sonotrode samples (7.1 vs. 5.3 mg/g dw). In both cases, the sum of galloylglucose isomers and methygallate represented more than 50% of the total phenolic compounds, specifically, 57.2% in sonotrode and 56.9% in ultrasonic bath. The study of López-Cobo et al. (2017) [41] found 11–15% galloylglucose isomer I, 8–10% methyldigallate ester isomer, and 5–7% methylgallate in three different varieties of mango peel, being the main representative compounds of the samples; however, it should be taken into account that, in this work, we analyzed a different variety from different origin. According to Hu et al. (2018) [42], gallic acid content was higher in mango peel in comparison with mango pulp. Syringic acid was the third highest compound in the sonotrode sample, representing about, 8% whereas the values obtained in ultrasonic bath were very low, around 0.4%. Syringic acid was one of main compounds in mango peel according to Ajila et al. [43] who extracted with 80% acetone. In the article of Peng and coworkers [44], the main phenolic compounds were quantified, observing that syringic acid was the highest compound present in the peel of Kensington Pride variety (17.78 mg/g dw) and the third highest in Keitt variety (9.3 mg/g dw). Hydroxybenzoyl galloyl glucoside was found in higher amounts in ultrasonic bath samples (1.27 mg/g dw). On the other hand, the flavonoids were found in the same order of magnitude; however, the sonotrode extract reported the highest amounts. Quercetin-glucoside was the main flavonoid, representing 40.5% and 33.2% of the total flavonoids in the bath and sonotrode extracts, respectively.

4. Conclusions

A comparison of the extraction of phenolic compounds and determination of antioxidant activity of mango peel byproducts obtained via ultrasonic bath and sonotrode was carried out for the first time to our knowledge.
The optimal ultrasonic bath conditions were 45/55 ethanol/water (v/v), 60 min, and 1/450 ratio of sample/solvent (w/v), whereas the optimal sonotrode conditions were 55/45 ethanol/water (v/v), 18 min, and 65% amplitude. A total of 35 polar compounds were identified by HPLC–ESI-TOF-MS, from which six were tentatively described here for the first time. In both extractions, phenolic acid derivatives from gallic acid were the majority, representing more than 50% of phenolic compounds from mango peel byproducts. Galloylglucose was the main phenolic compound in both extracts, and the amounts obtained with both techniques were in the same order of magnitude. The total amount of phenolic compounds was higher in the sonotrode sample (+33%) needing a lower time to reach this value. In conclusion, the optimized method via sonotrode extraction is useful to analyze mango peel byproducts for food and nutraceutical applications. In addition, sonotrode ultrasound technology can be scaled up at a pilot and industrial level.

Supplementary Materials

The following supporting information can be downloaded at https://www.mdpi.com/article/10.3390/horticulturae8111014/s1: Figure S1. HPLC-MS chromatograms of ultrasonic and sonotrode extracts extract.

Author Contributions

Conceptualization, V.V. and A.M.G.-C.; formal analysis, M.J.A.-R.; investigation, M.J.A.-R.; data curation, M.d.C.R.-D., V.V., and A.M.G.-C.; writing—original draft preparation, M.J.A.-R. and M.d.C.R.-D.; writing—review and editing, V.V.; supervision, V.V.; project administration, V.V. and A.M.G.-C.; funding acquisition, V.V. and A.M.G.-C. All authors have read and agreed to the published version of the manuscript.

Funding

This study was funded by project RTI2018-099835-A-I00 financed by MCIN/AEI/10.13039/501100011033/FEDER “Una manera de hacer Europa”.

Institutional Review Board Statement

Not applicable.

Informed Consent Statement

Not applicable.

Data Availability Statement

Not applicable.

Acknowledgments

Vito Verardo thanks the Spanish Ministry of Economy and Competitiveness (MINECO) for the “Ramon y Cajal” contract (RYC-2015-18795).

Conflicts of Interest

The authors declare no conflict of interest.

Appendix A

Table A1. Standard analytes used for elaborating the calibration curves with the range used, equations, R2, LOD, and LOQ of each compound for the phenolic compound analysis.
StandardLOD (µg/mL)LOQ (µg/mL)Calibration Ranges (µg/mL)Calibration Curves (µg/mL)R2
1-O-Galloyl-β-D-glucose2.24437.4812LOQ-237y = 6.1459x + 122.90.9976
Chlorogenic acid0.21600.7201LOQ-247y = 63.853x + 135.090.9978
Ferulic acid1.11423.7139LOQ-227y = 12.38x + 92.0680.9980
Catechin0.21840.7281LOQ-230y = 63.149x + 124.930.9921
Rutin0.70262.3420LOQ-220y = 19.632x + 403.420.9924
Quercetin0.16310.5436LOQ-227y = 84.589x + 287.320.9957

References

  1. Altendorf, S. Major Tropical Fruits. Stat. Compend. Rome FAO 2019, 1, 18. [Google Scholar]
  2. Kaur, B.; Panesar, P.S.; Anal, A.K. Standardization of Ultrasound Assisted Extraction for the Recovery of Phenolic Compounds from Mango Peels. J. Food Sci. Technol. 2022, 59, 2813–2820. [Google Scholar] [CrossRef] [PubMed]
  3. Ranganath, K.G.; Shivashankara, K.S.; Roy, T.K.; Dinesh, M.R.; Geetha, G.A.; Pavithra, K.C.G.; Ravishankar, K.V. Profiling of Anthocyanins and Carotenoids in Fruit Peel of Different Colored Mango Cultivars. J. Food Sci. Technol. 2018, 55, 4566–4577. [Google Scholar] [CrossRef] [PubMed]
  4. Gómez-Caravaca, A.M.; López-Cobo, A.; Verardo, V.; Segura-Carretero, A.; Fernández-Gutiérrez, A. HPLC-DAD-q-TOF-MS as a Powerful Platform for the Determination of Phenolic and Other Polar Compounds in the Edible Part of Mango and Its by-Products (Peel, Seed, and Seed Husk). Electrophoresis 2016, 37, 1072–1084. [Google Scholar] [CrossRef] [PubMed]
  5. Safdar, M.N.; Kausar, T.; Nadeem, M. Comparison of Ultrasound and Maceration Techniques for the Extraction of Polyphenols from the Mango Peel. J. Food Process. Preserv. 2017, 41, e13028. [Google Scholar] [CrossRef]
  6. Noratto, G.D.; Bertoldi, M.C.; Krenek, K.; Talcott, S.T.; Stringheta, P.C.; Mertens-Talcott, S.U. Anticarcinogenic Effects of Polyphenolics from Mango (Mangifera Indica) Varieties. J. Agric. Food Chem. 2010, 58, 4104–4112. [Google Scholar] [CrossRef]
  7. Ajila, C.M.; Prasada Rao, U.J.S. Protection against Hydrogen Peroxide Induced Oxidative Damage in Rat Erythrocytes by Mangifera Indica L. Peel Extract. Food Chem. Toxicol. 2008, 46, 303–309. [Google Scholar] [CrossRef]
  8. Núñez Selles, A.J.; Daglia, M.; Rastrelli, L. The Potential Role of Mangiferin in Cancer Treatment through Its Immunomodulatory, Anti-Angiogenic, Apoptopic, and Gene Regulatory Effects. BioFactors 2016, 42, 475–491. [Google Scholar] [CrossRef]
  9. Gondi, M.; Prasada Rao, U.J.S. Ethanol Extract of Mango (Mangifera Indica L.) Peel Inhibits α-Amylase and α-Glucosidase Activities, and Ameliorates Diabetes Related Biochemical Parameters in Streptozotocin (STZ)-Induced Diabetic Rats. J. Food Sci. Technol. 2015, 52, 7883–7893. [Google Scholar] [CrossRef] [Green Version]
  10. Masibo, M.; Qian, H. Major Mango Polyphenols and Their Potential Significance to Human Health. Compr. Rev. Food Sci. Food Saf. 2008, 7, 309–319. [Google Scholar] [CrossRef]
  11. Mugwagwa, L.R.; Chimphango, A.F.A. Comparison of Physicochemical Properties and Economic Gain from Three-Stage and Two-Stage Sequential Valorization of Mango Peels. Biofuels Bioprod. Biorefin. 2021, 15, 454–467. [Google Scholar] [CrossRef]
  12. Castañeda-Valbuena, D.; Ayora-Talavera, T.; Luján-Hidalgo, C.; Álvarez-Gutiérrez, P.; Martínez-Galero, N.; Meza-Gordillo, R. Ultrasound Extraction Conditions Effect on Antioxidant Capacity of Mango By-Product Extracts. Food Bioprod. Process. 2021, 127, 212–224. [Google Scholar] [CrossRef]
  13. Nuralın, L.; Gürü, M. Berberis Vulgaris Fruit: Determination of Phenolic Compounds in Extracts Obtained by Supercritical CO2 and Soxhlet Methods Using HPLC. Food Anal. Methods 2022, 15, 877–889. [Google Scholar] [CrossRef] [PubMed]
  14. Rojas, R.; Contreras-Esquivel, J.C.; Orozco-Esquivel, M.T.; Muñoz, C.; Aguirre-Joya, J.A.; Aguilar, C.N. Mango Peel as Source of Antioxidants and Pectin: Microwave Assisted Extraction. Waste Biomass Valorization 2015, 6, 1095–1102. [Google Scholar] [CrossRef]
  15. Garcia-Mendoza, M.P.; Paula, J.T.; Paviani, L.C.; Cabral, F.A.; Martinez-Correa, H.A. Extracts from Mango Peel By-Product Obtained by Supercritical CO2 and Pressurized Solvent Processes. Lwt 2015, 62, 131–137. [Google Scholar] [CrossRef]
  16. Fernández-Ponce, M.T.; Casas, L.; Mantell, C.; De La Ossa, E.M. Use of High Pressure Techniques to Produce Mangifera Indica L. Leaf Extracts Enriched in Potent Antioxidant Phenolic Compounds. Innov. Food Sci. Emerg. Technol. 2015, 29, 94–106. [Google Scholar] [CrossRef]
  17. Al Jitan, S.; Alkhoori, S.A.; Yousef, L.F. Phenolic Acids From Plants: Extraction and Application to Human Health, 1st ed.; Elsevier B.V.: Amsterdam, The Netherlands, 2018; Volume 58, ISBN 9780444640567. [Google Scholar]
  18. Soria, A.C.; Brokl, M.; Sanz, M.L.; Martínez-Castro, I. Sample Preparation for the Determination of Carbohydrates in Food and Beverages. In Comprehensive Sampling and Sample Preparation; Pawliszyn, J., Ed.; Elsevier: Amsterdam, The Netherlands, 2012; pp. 213–243. ISBN 9780123813749. [Google Scholar]
  19. Martín-García, B.; Aznar-Ramos, M.J.; Verardo, V.; Gómez-Caravaca, A.M. The Establishment of Ultrasonic-Assisted Extraction for the Recovery of Phenolic Compounds and Evaluation of Their Antioxidant Activity from Morus Alba Leaves. Foods 2022, 11, 314. [Google Scholar] [CrossRef]
  20. Sukor, N.; Jusoh, R.; Rahim, S.A.; Kamarudin, N. Ultrasound Assisted Methods for Enhanced Extraction of Phenolic Acids from Quercus Infectoria Galls. Mater. Today Proc. 2018, 5, 21990–21999. [Google Scholar] [CrossRef]
  21. Gómez-Cruz, I.; Contreras, M.D.M.; Carvalheiro, F.; Duarte, L.C.; Roseiro, L.B.; Romero, I.; Castro, E. Recovery of Bioactive Compounds from Industrial Exhausted Olive Pomace through Ultrasound-Assisted Extraction. Biology 2021, 10, 514. [Google Scholar] [CrossRef]
  22. Borrás-Enríquez, A.J.; Reyes-Ventura, E.; Villanueva-Rodríguez, S.J.; Moreno-Vilet, L. Effect of Ultrasound-Assisted Extraction Parameters on Total Polyphenols and Its Antioxidant Activity from Mango Residues (Mangifera Indica L. Var. Manililla). Separations 2021, 8, 94. [Google Scholar] [CrossRef]
  23. Brand-Williams, W.; Cuvelier, M.E.; Berset, C. Use of a Free Radical Method to Evaluate Antioxidant Activity. LWT—Food Sci. Technol. 1995, 28, 25–30. [Google Scholar] [CrossRef]
  24. Re, R.; Pellegrini, N.; Proteggente, A.; Pannala, A.; Yang, M.; Rice-Evans, C. Antioxidant Activity Applying an Improved ABTS Radical Cation Decolorization Assay. Free Radic. Biol. Med. 1999, 26, 1231–1237. [Google Scholar] [CrossRef]
  25. Pulido, R.; Bravo, L.; Saura-Calixto, F. Antioxidant Activity of Dietary Polyphenols as Determined by a Modified Ferric Reducing/Antioxidant Power Assay. J. Agric. Food Chem. 2000, 48, 3396–3402. [Google Scholar] [CrossRef] [PubMed] [Green Version]
  26. Singleton, V.L.; Orthofer, R.; Lamuela-Raventós, R.M. Analysis of Total Phenols and Other Oxidation Substrates and Antioxidants by Means of Folin-Ciocalteu Reagent. In Oxidants and Antioxidants Part A; Methods in Enzymology; Academic Press: Cambridge, MA, USA, 1999; Volume 299, pp. 152–178. [Google Scholar]
  27. Verni, M.; Pontonio, E.; Krona, A.; Jacob, S.; Pinto, D.; Rinaldi, F.; Verardo, V.; Díaz-de-Cerio, E.; Coda, R.; Rizzello, C.G. Bioprocessing of Brewers’ Spent Grain Enhances Its Antioxidant Activity: Characterization of Phenolic Compounds and Bioactive Peptides. Front. Microbiol. 2020, 11, 1831. [Google Scholar] [CrossRef] [PubMed]
  28. de Menezes Rodrigues, G.; Cardozo-Filho, L.; da Silva, C. Pressurized Liquid Extraction of Oil from Soybean Seeds. Can. J. Chem. Eng. 2017, 95, 2383–2389. [Google Scholar] [CrossRef]
  29. Sai-Ut, S.; Benjakul, S.; Kraithong, S.; Rawdkuen, S. Optimization of Antioxidants and Tyrosinase Inhibitory Activity in Mango Peels Using Response Surface Methodology. LWT—Food Sci. Technol. 2015, 64, 742–749. [Google Scholar] [CrossRef]
  30. Martínez-Ramos, T.; Benedito-Fort, J.; Watson, N.J.; Ruiz-López, I.I.; Che-Galicia, G.; Corona-Jiménez, E. Effect of Solvent Composition and Its Interaction with Ultrasonic Energy on the Ultrasound-Assisted Extraction of Phenolic Compounds from Mango Peels (Mangifera Indica L.). Food Bioprod. Process. 2020, 122, 41–54. [Google Scholar] [CrossRef]
  31. Jirasuteeruk, C.; Theerakulkait, C. Ultrasound-Assisted Extraction of Phenolic Compounds from Mango (Mangifera Indica Cv. Chok Anan) Peel and Its Inhibitory Effect on Enzymatic Browning of Potato Puree. Food Technol. Biotechnol. 2019, 57, 350–357. [Google Scholar] [CrossRef]
  32. Ordoñez-Torres, A.; Torres-León, C.; Hernández-Almanza, A.; Flores-Guía, T.; Luque-Contreras, D.; Aguilar, C.N.; Ascacio-Valdés, J. Ultrasound-Microwave-Assisted Extraction of Polyphenolic Compounds from Mexican “Ataulfo” Mango Peels: Antioxidant Potential and Identification by HPLC/ESI/MS. Phytochem. Anal. 2021, 32, 495–502. [Google Scholar] [CrossRef]
  33. Pal, C.B.T.; Jadeja, G.C. Microwave-Assisted Extraction for Recovery of Polyphenolic Antioxidants from Ripe Mango (Mangifera Indica L.) Peel Using Lactic Acid/Sodium Acetate Deep Eutectic Mixtures. Food Sci. Technol. Int. 2020, 26, 78–92. [Google Scholar] [CrossRef]
  34. Villacís-Chiriboga, J.; Voorspoels, S.; Uyttebroek, M.; Ruales, J.; Camp, J.V.; Vera, E.; Elst, K. Supercritical CO2 Extraction of Bioactive Compounds from Hibiscus Sabdariffa. J. Supercrit. Fluids 2019, 147, 213–221. [Google Scholar] [CrossRef]
  35. Pierson, J.T.; Monteith, G.R.; Roberts-Thomson, S.J.; Dietzgen, R.G.; Gidley, M.J.; Shaw, P.N. Phytochemical Extraction, Characterisation and Comparative Distribution across Four Mango (Mangifera Indica L.) Fruit Varieties. Food Chem. 2014, 149, 253–263. [Google Scholar] [CrossRef] [PubMed]
  36. Sun, J.; Chen, P. Ultra High-Performance Liquid Chromatography with High-Resolution Mass Spectrometry Analysis of African Mango (Irvingia Gabonensis) Seeds, Extract, and Related Dietary Supplements. J. Agric. Food Chem. 2012, 60, 8703–8709. [Google Scholar] [CrossRef] [PubMed] [Green Version]
  37. Toth, A.; Toth, G.; Kery, A. Polyphenol Composition and Antioxidant Capacity of Three Lysimachia Species. Nat. Prod. Commun. 2014, 9, 1473–1478. [Google Scholar] [CrossRef] [PubMed] [Green Version]
  38. Kramberger, K.; Barlič-Maganja, D.; Bandelj, D.; Baruca Arbeiter, A.; Peeters, K.; Miklavčič Višnjevec, A.; Pražnikar, Z.J. HPLC-DAD-ESI-QTOF-MS Determination of Bioactive Compounds and Antioxidant Activity Comparison of the Hydroalcoholic and Water Extracts from Two Helichrysum Italicum Species. Metabolites 2020, 10, 403. [Google Scholar] [CrossRef] [PubMed]
  39. Li, H.; Yao, W.; Liu, Q.; Xu, J.; Bao, B.; Shan, M.; Cao, Y.; Cheng, F.; Ding, A.; Zhang, L. Application of UHPLC-ESI-Q-TOF-MS to Identify Multiple Constituents in Processed Products of the Herbal Medicine Ligustri Lucidi Fructus. Molecules 2017, 22, 689. [Google Scholar] [CrossRef] [Green Version]
  40. Dorta, E.; González, M.; Lobo, M.G.; Sánchez-Moreno, C.; de Ancos, B. Screening of Phenolic Compounds in By-Product Extracts from Mangoes (Mangifera Indica L.) by HPLC-ESI-QTOF-MS and Multivariate Analysis for Use as a Food Ingredient. Food Res. Int. 2014, 57, 51–60. [Google Scholar] [CrossRef] [Green Version]
  41. López-Cobo, A.; Verardo, V.; Diaz-de-Cerio, E.; Segura-Carretero, A.; Fernández-Gutiérrez, A.; Gómez-Caravaca, A.M. Use of HPLC- and GC-QTOF to Determine Hydrophilic and Lipophilic Phenols in Mango Fruit (Mangifera Indica L.) and Its by-Products. Food Res. Int. 2017, 100, 423–434. [Google Scholar] [CrossRef]
  42. Hu, K.; Dars, A.G.; Liu, Q.; Xie, B.; Sun, Z. Phytochemical Profiling of the Ripening of Chinese Mango (Mangifera Indica L.) Cultivars by Real-Time Monitoring Using UPLC-ESI-QTOF-MS and Its Potential Benefits as Prebiotic Ingredients. Food Chem. 2018, 256, 171–180. [Google Scholar] [CrossRef]
  43. Ajila, C.M.; Jaganmohan Rao, L.; Prasada Rao, U.J.S. Characterization of Bioactive Compounds from Raw and Ripe Mangifera Indica L. Peel Extracts. Food Chem. Toxicol. 2010, 48, 3406–3411. [Google Scholar] [CrossRef]
  44. Peng, D.; Zahid, H.F.; Ajlouni, S.; Dunshea, F.R.; Suleria, H.A.R. LC-ESI-QTOF/MC Profiling of Australian Mango Peel By-Product Polyphenols and Their PotentialAntioxidant Activities. Processes 2019, 7, 764. [Google Scholar] [CrossRef]
Figure 1. Response surface graphs (1s–12s) of ultrasonic bath model showing the combined effects of the process variables: ethanol/water (v/v), time (min), and ratio sample/solvent (w/v) for TPC (mg GAE/g dw), for DPPH antioxidant assay (mg TE/g dw), for ABTS antioxidant assay (mg TE/g dw), and for FRAP antioxidant assay (mg TE/g dw).
Horticulturae 08 01014 g001
Figure 2. Response surface graphs of sonotrode model (1p–12p) showing the combined effects of the process variables: ethanol/water (v/v), time (min), and amplitude (%) for TPC (mg GAE/g dw), for DPPH antioxidant assay (mg TE/g dw), for ABTS antioxidant assay (mg TE/g dw), and for FRAP antioxidant assay (mg TE/g dw).
Horticulturae 08 01014 g002
Table 1. Box–Behnken design with natural and coded values (parenthesis) of the conditions of sonotrode and ultrasonic bath extraction and the experimental results obtained for total phenolic compounds (TPC), and antioxidant assays (DPPH, ABTS, and FRAP) expressed with the average and the standard deviation.
SonotrodeUltrasonic Bath
Independent FactorsDependent FactorsIndependent FactorsDependent Factors
RunEthanol
X1
Time
X2
Amplitude
X3
TPCDPPHABTSFRAPEthanol
X1
Time
X2
Ratio w/v
X3
TPCDPPHABTSFRAP
120 (−1)5 (−1)60 (0) (94 W)5.4 ± 0.412.0 ± 0.318.5 ± 1.415.0± 1.120 (−1)10 (−1)285 (0)6.5 ± 0.112.8 ± 1.420.1 ± 0.910.7 ± 0.5
2100 (1)5 (−1)60 (0) (72 W)4.1 ± 0.412.5 ± 0.716.4 ± 0.315.0 ± 0.3100 (1)10 (−1)285 (0)3.0 ± 0.35.3 ± 0.213.2 ± 0.76.0 ± 0.1
320 (−1)45 (1)60 (0) (95 W)4.6 ± 0.515.7 ± 0.822.1 ± 0.115.9 ± 0.420 (−1)90 (1)285 (0)7.0 ± 0.214.4 ± 1.116.6 ± 0.411.5 ± 0.3
4100 (1)45 (1)60 (0) (74 W)5.9 ± 0.216.3 ± 0.920.8 ± 1.021.1 ± 0.4100 (1)90 (1)285(0)3.00 ± 0.26.4 ± 0.311.8 ± 2.56.8 ± 0.2
520 (−1)25 (0)20 (−1) (39 W) 5.6 ± 0.814.4 ± 0.121.0 ± 0.316.6 ± 0.120 (−1)50 (0)70 (−1)4.9 ± 0.110.8 ± 0.010.8 ± 1.76.6 ± 0.0
6100 (1)25 (0)20 (−1) (29 W)3.9 ± 0.110.1 ± 0.313.6 ± 0.413.7 ± 0.3100 (1)50 (0)70 (−1)1.6 ± 0.03.4 ± 0.13.9 ± 0.54.0 ± 0.3
720 (−1)25 (0)100 (1) (157 W)6.0 ± 0.318.7 ± 0.626.6 ± 1.120.3 ± 0.720 (−1)50 (0)500 (1)7.4 ± 0.017.0 ± 0.522.5 ± 1.014.1 ± 0.4
8100 (1)25 (0)100 (1) (130 W)5.5 ± 0.217.7 ± 0.420.7 ± 0.520.6 ± 0.3100 (1)50 (0)500 (1)4.8 ± 0.27.0 ± 0.314.0 ± 1.17.0 ± 0.4
960 (0)5 (−1)20 (−1) (34 W)9.2 ± 0.923.2 ± 0.132.2 ± 0.529.6 ± 0.160 (0)10 (−1)70 (−1)4.7 ± 0.211.2 ± 0.212.0 ± 1.56.7 ± 0.0
1060 (0)45 (1)20 (−1) (33 W)8.3 ± 0.322.2 ± 0.431.3 ± 1.028.5 ± 0.960 (0)90 (1)70 (−1)6.0 ± 0.111.3 ± 0.112.6 ± 1.06.8 ± 0.0
1160 (0)5 (−1)100 (1) (151 W)9.2 ± 0.423.8 ± 0.834.1 ± 1.230.85 ± 0.160 (0)10 (−1)500 (1)8.6 ± 0.117.8 ± 2.324.3 ± 1.514.0 ± 0.8
1260 (0)45 (1)100 (1) (142 W)6.7 ± 0.820.8 ± 0.130.9 ± 0.124.1 ± 0.560 (0)90 (1)500 (1)8.7 ± 0.217.8 ± 1.224.8 ± 1.616.5 ± 0.6
1360 (0)25 (0)60 (0) (90 W)9.2 ± 0.128.0 ± 0.744.0 ± 0.832.9 ± 1.260 (0)50 (0)285 (0)7.3 ± 0.316.8 ± 1.120.7 ± 1.913.8 ± 0.0
1460 (0)25 (0)60 (0) (89 W)9.4 ± 0.428.0 ± 0.843.9 ± 0.833.5 ± 1.060 (0)50 (0)285 (0)7.4 ± 0.517.1 ± 1.020.2 ± 1.114.7 ± 0.5
1560 (0)25 (0)60 (0) (90 W)9.3 ± 0.328.7 ± 0.844.3 ± 0.533.8 ± 1.360 (0)50 (0)285 (0)7.4 ± 0.116.8 ± 0.820.4 ± 1.714.4 ± 0.2
Ethanol expressed as v/v %, time as min, amplitude as %, ratio sample/solvent as w/v, TPC as mg GAE/g dw, and DPPH, ABTS, and FRAP as mg TE/g dw. TPC: total phenolic compounds; GAE: gallic acid equivalent; TE: Trolox equivalent; dw: dry weight.
Table 2. Estimated regression coefficients of the adjusted second-order polynomial equation and analysis of variance (ANOVA) of the sonotrode and ultrasonic bath model.
Ultrasonic BathSonotrode
TPCDPPHABTSFRAPTPCDPPHABTSFRAP
Effectp-ValueEffectp-ValueEffectp-ValueEffectp-ValueEffectp-ValueEffectp-ValueEffectp-ValueEffectp-Value
β05.5355 *0.000011.2496 *0.000015.4920 *0.00009.2175 *0.00026.20210.000017.2753 *0.000024.0143 *0.000020.9256 *0.0000
Lineal
β1−3.4867 *0.0003−8.1799 *0.0002−6.4299 *0.0007−4.7598 *0.00400.3547 *0.0228−0.52330.2061−3.3403 *0.00261.29590.0594
β20.3973 *0.01970.9010 *0.0188−1.4636 *0.01360.95400.0961−0.23320.05051.8276 *0.02322.0101 *0.00711.04300.0876
β33.0925 *0.00035.4419 *0.000511.6027 *0.00026.3139 *0.00250.4140 *0.01693.8119 *0.00544.4745 *0.00143.0140 *0.0118
Crossed
β122.3981 *0.00036.0902 *0.00025.3633 *0.00054.3031 *0.00271.3334 *0.00300.00300.88620.43610.19582.6155 *0.0276
β130.08990.15101.1203 *0.0060−0.33480.10861.2314 *0.03120.6125 *0.01400.01400.05010.81540.07001.57910.0707
β230.2633 *0.02171.2760 *0.00472.3397 *0.00262.0726 *0.01140.7910 *0.00840.00840.1193−1.1366 *0.0379−2.8725 *0.0230
Quadratic
β11−0.21780.1033−0.27900.23911.0865 *0.0425−0.01600.97363.6936 *0.000110.7067 *0.000318.1533 *0.000013.5639 *0.0003
β220.3454 *0.0452−1.2767 *0.0169−0.77170.0793−2.2605 *0.03410.5824 *0.00423.4036 *0.00346.4731 *0.00033.0676 *0.0053
β33−0.5770 *0.0169−0.02480.8964−0.0240 0.92691.21360.10530.3732 *0.01022.3264 *0.00725.4665 *0.00052.0479 *0.0125
R20.99280.99550.99030.96480.99150.97860.99770.9828
p model0.00000.00000.00000.00010.00310.00080.00000.0012
p lack of fit0.10260.15040.10220.20680.05050.10750.10830.0707
* = Significant at α ≤ 0.05. (1) Ethanol/water ratio (v/v); (2) time; (3) amplitude in sonotrode model and ratio sample/solvent (w/v) in ultrasonic bath model.
Table 3. Optimal conditions selected and models predicted values with the obtained values expressed with the mean and the standard deviation of ultrasonic bath and sonotrode.
ParameterOptimal Conditions Ultrasonic BathParameterOptimal Conditions Sonotrode
Ethanol/water (v/v)45Ethanol/water (v/v)55
Time (min)60Time (min)18
Ratio sample/solvent (w/v)1/450Amplitude (%)65
TPC (mg/g)DPPH (mg/g)ABTS (mg/g)FRAP (mg/g)TPC (mg/g)DPPH (mg/g)ABTS (mg/g)FRAP (mg/g)
Predicted value (mg/g dw)8.6 ± 0.519.5 ± 1.224.0 ± 1.616.8 ± 1.59.5 ± 0.527.7 ± 2.643.3 ± 1.633.7 ± 3.1
Obtained value (mg/g dw)8.3 ± 0.219.0 ± 1.424.9 ± 0.917.6 ± 1.79.7 ± 0.227.7 ± 1.343.2 ± 1.533.5 ± 0.8
N.S.N.S.N.S.N.S.N.S.N.S.N.S.N.S.
N.S. = not significant.
Table 4. Previous research about other technologies used for extracting phenolic compounds from the mango peel byproduct with the conditions used and the total phenolic compounds (TPC) obtained.
Technology UsedOptimum ConditionsTPC (mg GAE/g dw)Ref.
Maceration80% ethanol/water (v/v), 1:15 sample-to-solvent ratio (w/v), 40 °C, 20 h59.7 mg GAE/ g of powder extract[5]
Maceration49% ethanol/water (v/v), 1:30 sample-to-solvent ratio, 61 °C, 221 min1.1 mg GAE/g dry sample[29]
Conventional solvent extraction1:20 sample to solvent ratio (w/v) ethanol–acetone blend (60–40%), 15 min, 1000 rpm stirring2.0 mg GAE/g dry sample[30]
Maceration3.33 ratio of sample/solvent (w/v) with ethanol 100%, magnetic stirring for 24 h, 25 °C41.6 mg GAE/g of extract[15]
Ultrasound-assisted extraction (ultrasonic bath)50% ethanol/water (v/v), 1:50 ratio of solvent to solid (w/v), 20 min, 60% amplitude, 200 W, 80 kHz18.1 mg/g d.w. sample[22]
Ultrasound-assisted extraction (ultrasonic bath) +stirringLiquid nitrogen + distilled water
1:6 sample/solvent (m/V), 25 °C, 15 min ultrasound extraction +15 min stirring, 50 kHz, 160 W
9.7 mg/g d.w. sample
powder
[31]
Ultrasound-assisted extraction (ultrasonic probe)50% ethanol/water
1:30 sample/solvent (v/w), 45 °C, 10 min, 30% amplitude
35.5 mg GAE/g of raw sample[2]
Ultrasound-assisted extraction (sonicator)80% ethanol, sample-to-solvent ratio of 1:20, 45 °C, 60 min, 35 kHz, 100% amplitude67.6 mg/g of extract[5]
Ultrasound-assisted extraction (ultrasonic probe)Ethanol–acetone blend (60–40%), 1:20 sample to solvent ratio (w/v), 24 kHz, 15 min14.9 mg GAE/g dry sample[30]
Table 5. Identified compounds from optimum ultrasonic bath and sonotrode mango peel byproduct samples using HPLC–MS.
No.Retention Time (min)m/z Experimentalm/z CalculatedError (ppm)Score (%)FragmentsMolecular FormulaCompoundUltrasonic BathSonotrode
1 0.319341.1073341.1084−3.298.42191.0537, 165.0367, 113.0212C12H22O11Hexosyl-hexoseXX
2 0.34377.0877377.08731.194.83341.1050, 191.0179C18H18O9Caffeic acid derivativeXX
3 0.39191.0549191.0556−3.7100111.0016C7H12O6Quinic acidXX
4 0.4895191.0186191.0192−3.1100111.0063C6H8O7Citric acidXX
5 0.659331.0656331.0665−2.790.28169.0085, 125.0135C13H16O10Galloylglucose isomer IXX
6 0.803169.0129169.0137−4.7100125.0271C7H6O5Gallic acidXX
7 1.006343.0663343.0665−0.690.12169.013, 191.0536C14H16O103-Galloylquinic acidXX
8 1.097493.1197493.11930.891.64169.0131, 125.0214C19H26O15Galloyl diglucosideXX
9 1.217331.0652331.0665−3.999.8169.0112, 125.0219C13H16O10Galloylglucose isomer IIXX
10 1.498299.0769299.07670.7100137.0212C13H16O8p-Hydroxybenzoic acid glucoside X
11 2.359183.029183.0293−1.699.7124.0117C8H8O5MethylgallateXX
12 3.278483.076483.0775−3.192.58169.0083, 125.0222C20H20O14DigalloylglucoseXX
13 3.865289.0698289.0712−4.894.78123.0458C15H14O6CatechinXX
14 3.878443.191443.1917−1.699.25137.0241, 101, 151,213,303C21H21O10UnknownXX
15 4.331355.1043355.10293.991.12193.0481, 134.0353C16H20O9Ferulic acid hexosideXX
16 4.465401.1445401.1448−0.796.24313.0528, 125.0237C18H26O106-pentyl-O-galloyl-beta-d-glucose isomer IXX
17 4.718401.1435401.1448−3.290.2161.0387C18H26O106-pentyl-O-galloyl-beta-d-glucose isomer II X
18 4.854197.0445197.045−2.599.91124.0143, 125.0232, 169.0094C9H10O5Syringic acidXX
19 5.164517.2298517.22852.596.76153.0894, 205.1173, 385.1864C24H38O12Sinapic acid hexoside-pentosideXX
20 5.305519.2421519.2442−497.11387.2, 225.1477C24H40O12Dihydro sinapic acid hexoside-pentosideXX
21 5.367533.1869533.187−0.290.47401.1404C23H34O14Dicaffeoylhexaric acidXX
22 5.404451.0872451.0877−1.190.42169.0043C20H20O12Hydroxybenzoyl galloyl glucosideXX
23 5.768635.0894635.08841.692.79169.0086C27H24O18Trigalloyl glucose X
24 5.859443.1904443.1917−2.999314.043C21H32O10Cynaroside A X
25 7.27553.1551553.1557−1.190.82391.621C25H30O14Ligustrosidic acidXX
26 7.063477.1017477.1033−3.491.41313.0555, 163.0370, 119.0459, 169.0117C22H22O12Coumaroyl galloyl glucosideXX
27 7.99183.0291183.0293−1.199.4124.0122 C8H8O5Methylgallate isomer IXX
28 8.057335.0391335.0403−3.696.35183.0244, 124.0123C15H12O9Methyl-digallate ester X
29 8.995463.0875463.0877−0.499.81300.0253C21H20O12Quercetin glucosideXX
30 9.17463.0868463.0877−1.996.82300.0253C21H20O12Quercetin galactosideXX
31 9.707433.075433.0771−4.899.95271.0219, 241.0106, 300.0254C20H18O11Quercetin xylosideXX
32 9.757447.0913447.0927−3.190.17300.0252, 271.0215C21H20O11Quercetin 3-rhamnoside isomer IXX
33 9.79153.091153.0916−3.9n/a149.6901C9H14O2Protocatechuic acidXX
34 9.844433.0754433.0771−3.993.23300.0242C20H18O11Quercetin arabinopyranosideXX
35 9.906349.0544349.056−4.695.21124.014, 197.04C16H14O9Ethyl 2,4-dihydroxy-3-(3,4,5-
trihydroxybenzoyl)oxybenzoate
X
36 9.972197.0443197.045−3.693.87124.0131C9H10O5Syringic acidXX
37 10.092447.092447.0927−1.694.18284.025, 255.0225, 227.0386C21H20O11Quercetin 3-rhamnoside isomer IIXX
38 10.293447.0925447.0927−0.4n/a255.0284C21H20O11Quercetin 3-rhamnoside isomer IIIXX
39 11.156477.1035477.10330.490.36299.0186C22H22O12Rhamnetin hexosideXX
Table 6. Quantification of phenolic compounds in sonotrode and ultrasonic bath of mango peel byproducts by HPLC–MS expressed as µg/g dw.
CompoundUltrasonic Bath (µg/g dw)Sonotrode (µg/g dw)
Caffeic acid derivate995.3 ± 0.6843.4 ± 0.2
Galloylglucose isomer I2736.6 ± 0.22795.4 ± 0.3
Galloylglucose isomer II2291.9 ± 0.72246.9 ± 0.6
Gallic acid141.3 ± 0.1270.0 ± 0.02
p-Hydroxybenzoic acid glucoside<LOQ39.7 ± 0.01
Methylgallate 237.7 ± 0.052037.0 ± 0.3
Digalloylglucose<LOQ536.8 ± 0.2
Catechin<LOQ37.5 ± 0.01
6-pentyl-O-galloyl-beta-d-glucose isomer I<LOQ68.4 ± 0.05
6-pentyl-O-galloyl-beta-d-glucose isomer IIn.d.32.3 ± 0.03
Syringic acid37.3 ± 0.011014.7 ± 0.05
Sinapic acid hexoside-pentoside651.9 ± 0.2482.5 ± 0.03
Dicaffeoylhexaric acid96.7 ± 0.00240.8 ± 0.002
Hydroxybenzoyl galloyl glucoside1268.8 ± 0.31043.8 ± 0.1
Cynaroside A isomer I247.1 ± 0.2316.2 ± 0.01
Ligustrosidic acid128.7 ± 0.00370.8 ± 0.002
Coumaroyl galloyl glucoside112.3 ± 0.002119.2 ± 0.03
Quercetin glucoside225.7 ± 0.09232.0 ± 0.03
Quercetin galactoside68.6 ± 0.0554.2 ± 0.009
Quercetin xyloside15.2 ± 0.0245.6 ± 0.005
Protocatechuic acid<LOQ29.1 ± 0.003
Quercetin arabinopyranoside<LOQ12.5 ± 0.002
Rhamnetin hexoside<LOQ<LOQ
Sum of phenolic compounds9225.1 ± 0.812368.8 ± 0.9
Sum of flavonoids556.6 ± 0.3968.0 ± 0.1
Sum of phenolic acids8698.5 ± 0.511670.8 ± 0.3
n.d., not detected; <LOQ, lower than limit of quantitation.
Publisher’s Note: MDPI stays neutral with regard to jurisdictional claims in published maps and institutional affiliations.

