Communication

Research on the Use of Thermal Imaging as a Method for Detecting Fungal Growth in Apples

Department of Food Biotechnology and Microbiology, Institute of Food Sciences, Warsaw University of Life Sciences—SGGW, Nowoursynowska 159c Str., 02-776 Warsaw, Poland
*
Authors to whom correspondence should be addressed.
Horticulturae 2022, 8(10), 972; https://doi.org/10.3390/horticulturae8100972
Submission received: 3 September 2022 / Revised: 11 October 2022 / Accepted: 18 October 2022 / Published: 20 October 2022
(This article belongs to the Special Issue Storage and Quality Management of Horticultural Products)

Abstract

:
This study assesses whether thermal imaging can be utilized for detecting and monitoring the level of plant product contamination with apples used as an example. The growth of Penicillium expansum, Botrytis cinerea, and Rhizopus stolonifer on apples contaminated with these fungi was investigated by measuring temperature changes using a thermovision camera. The results showed a significant relationship between the temperature of apples and the growth of microorganisms, as well as that the temperature changes occurred in two stages (temperature of the contaminated apples increased on the first day but then decreased). Significant differences were found between the temperature of the apples showing microbial growth and the noncontaminated control sample, which indicates that the thermal imaging technique has a potential application in microbial quality control. Automation of the production process and attempts on the intensification of production capacity have resulted in the need to improve individual stages of product quality control. Thermovision-based methods have a high potential in this field, as they represent an innovative and noninvasive alternative to conventional microbiological diagnostic methods.

1. Introduction

Apples are an excellent example of both a raw material and a product that can be consumed in either natural or processed form (juices, pomace, dried fruit). Fresh apples are susceptible to contamination by microorganisms such as yeasts (Saccharomyces, Pichia, Kloeckera, Candida, etc.), molds (Penicillium, Aspergillus, Rhizopus, Botrytis, Fusarium, Mucor), and coliform bacteria [1].
Filamentous fungi are cosmopolitan and oligotrophic organisms. They can easily modify their metabolism according to the prevailing physical conditions and the type of nutrients present in the substrate. These organisms are also capable of secreting various enzymes and thus can transform macromolecular compounds into simpler absorbable forms [2]. Molds are aerobic organisms that grow on the surfaces of products, forming abundant air mycelium. However, mechanical removal of a visible mycelium does not guarantee the complete elimination of the fungus, as its other portion, including deep mycelium and metabolites (e.g., mycotoxins), remains in the substrate. Thus, these microorganisms occur both on the surface and inside of the fruit [3]. Fungal species, such as Penicillium expansum which causes a common apple disease called soft rot, can cause molding of the seed core in apparently healthy apples with no surface changes. The most common apple diseases of fungal origin are caused by gray mold (Botrytis cinerea). Spores of this mold can easily penetrate a fruit through any skin damage and removed stalks. They are also capable of growing at a wide range of temperatures, and thus cause extensive damage to raw materials [4]. Mold diseases pose a significant threat to plant producers, due to the rapid development of infections and huge economic losses, as well as affect consumers’ health. Therefore, it is necessary to ensure early detection of changes in raw materials [5].
Conventional methods used commonly for determining the presence of microorganisms, including culture and immunological techniques, are time-consuming and costly. Thus, researchers have been focusing on innovative food quality control methods, including thermal imaging (thermovision). Thermovision technique, which is performed with the use of a thermovision camera, allows to conduct simple, inexpensive, and noninvasive tests, as well as obtaining precise results in a shorter time [6]. Infrared thermography (IRT) involves the observation of an object with a temperature above absolute zero and the recording of the radiation distribution in the infrared range. The user is provided with a thermogram or a thermovision image with a color palette scaled according to temperature values [7]. Thermography is distinguished into two types: active and passive. In active thermography, the temperature differences are determined using external sources of thermal stimulation. Tested object is heated or cooled, and then the dynamic temperature changes of the object are analyzed with respect to time. On the other hand, passive thermography makes use of an object that emits radiation created during normal functioning, without stimulation with additional heat sources. Reliable results are obtained from considerable temperature differences characterizing the tested object and its surroundings [8,9]. Due to their simple methodology and noninvasiveness, thermal imaging techniques are widely used in numerous fields, from armed forces to agrophysics [10,11], medicine [12,13], construction [14], and even food industry [15,16]. For instance, in the food industry, thermography is applied in the assessment of the fruit ripening stage based on the content of released volatile compounds [17]. Thermovision is considered an ideal alternative to gas chromatography and E-nose, because both these methods require the collection of gas samples for quantitative analysis, which is complicated and limits mass storage of samples. Studies by Niemira and Zhang [18] and Baranowski et al. [19] demonstrated that thermographic analysis enables highly precise determination of possible subsurface structural changes caused by fruit bruising. Using active thermography, Baranowski et al. [19] showed that in bruised apples, heat spread at more rapid rate than in healthy apples, and after the cessation of thermal impulse, a higher temperature drop occurred (temperature difference between the healthy and damaged tissue: 0.9–1.8 °C). The response of fruit to the termination of the impulse was manifested by a higher value of conductivity coefficient and lower thermal capacity of the bruised tissue [19,20]. The results of the above studies indicate the potential application of thermovision in the assessment of raw material quality in online mode in the production practice. Satone et al. [21] developed a completely automated technique that works based on the compilation of images from a thermovision camera and photographic camera, for the detection of subsurface and superficial defects on apples. Thermovision has also been used in the detection of insects in a fruit based on temperature differences in internal tunnels and changes in the flesh structure [22]. The tunnels (invisible to the naked eye) carved by an insect larvae have a lower temperature than the surrounding healthy tissue, which can be easily highlighted by thermal images. A thermovision camera can help in monitoring the temperature of a microorganism-contaminated sample relative to the noncontaminated control sample at different times [23,24]. IRT has been used for the quantitative determination of Escherichia coli [25,26] and Staphylococcus aureus bacteria [27] in previous studies.
Because of structure diversity intended to be researched and their thermophysical parameters or differences in physical phenomena, which are the base for chosen thermographic methods, it is difficulties to point (or to elaborate) universal thermographic method. It has to be remembered that in choosing of thermographic methodology researches each case of investigated product should be analyzed separately. Therefore, the research has to be conducted on a different matrix [7,8].
This study aimed to elaborate the method of early detection of the development of mold infection on apples using thermal imaging.

2. Materials and Methods

2.1. Apple Samples

Fresh apples (cv. Honeycrisp) were obtained from the orchards of the Warsaw University of Life Sciences. The following mold strains were used in the experiments: P. expansum KKP 774 (Collection of Industrial Microorganism, Warsaw, Poland), Botrytis cinerea IOR 2110 (Institute of Plant National Research Institute, Poznań, Poland), and Rhizopus stolonifer ATCC 14,037 (American Type Culture Collection, Manassas, VA, USA). The strains were propagated on the YPG medium with agar (BTL, Poland) for 7–10 days at a temperature of 28 °C, until spores were visible. The inoculum was prepared in 0.85% NaCl such that the number of spores was 1 × 10⁶ CFU/mL. Apples were contaminated with standardized counts of mold spores. Both individual strain cultures and mixed cultures were used for contaminating apples. The mixed cultures were prepared in four variants: I—50% B. cinerea and 50% P. expansum, II—50% B. cinerea and 50% R. stolonifer, III—50% R. stolonifer and 50% P. expansum, and IV—33% B. cinerea, 33% P. expansum, and 33% R. stolonifer.
The apples were washed, cut in halves, and sterilized by exposing to UV radiation for 30 min in a laminar chamber (Esco Lifesciences Co., Ltd., Singapore). Subsequently, the skin of the apple halves was cut with a sterile scalpel to disturb the natural protective barrier and determine the site of application of the spore suspension. The samples prepared this way were contaminated by local application of 100 μL standardized suspension of spores of the given mold species using a micropipette. After the application, the material was placed in sterile Petri dishes, covered with the lid and incubation under controlled conditions (20 °C (±0.1 °C) and relative humidity—RH 68% (±1%)).

2.2. Thermal Imaging Measurement

Three series of testing were carried out, in which thermal images of the tested apple samples were obtained with a VIGOcam V60 thermovision camera (VIGO System S.A.) at specified time intervals (i.e., after 2, 4, 24, and 48 h of contamination). The following set of samples was prepared for each series of testing: control sample (noncontaminated), three replicates of three samples contaminated separately with spores of each mold species (i.e., B. cinerea, P. expansum, R. stolonifer), and three replicates of four samples contaminated with selected spore mixtures. A thermal imaging camera with a resolution of 320 × 256 pixels and a spectral range of 2.0–5.1 µm was used in the research. Thermal sensitivity of the camera was 0.07 °C at 30 °C and the instantaneous field of view was 0.7 mrad. While taking the thermal images, the emissivity of the apple was set at 0.96 and the camera was fixed at a height of 0.5 m above the apple. Testing was performed under established conditions environmental as follows: humidity: 27% (±1%) and temperature: 20°C (±0.1°C) (AURIOL HG04705, Langenzenn, Germany). The measurements a thermal imaging camera have been performed every 2 s for 1 min.
The obtained thermograms (Figure 1) were analyzed using THERM software, version 2.29.3.
Furthermore, digital photographs of all tested samples were obtained at 2, 24, and 48 h of incubation, which enabled observing the gradual progress of the changes caused in the samples by mold formation.

2.3. Statistical Analysis

Statistical analysis was carried out in Statistica 13.3 software. Significant differences in individual temperatures corresponding to different types of apple peel contamination with respect to storage time were determined using one-way analysis of variance and Tukey’s test (p < 0.05).

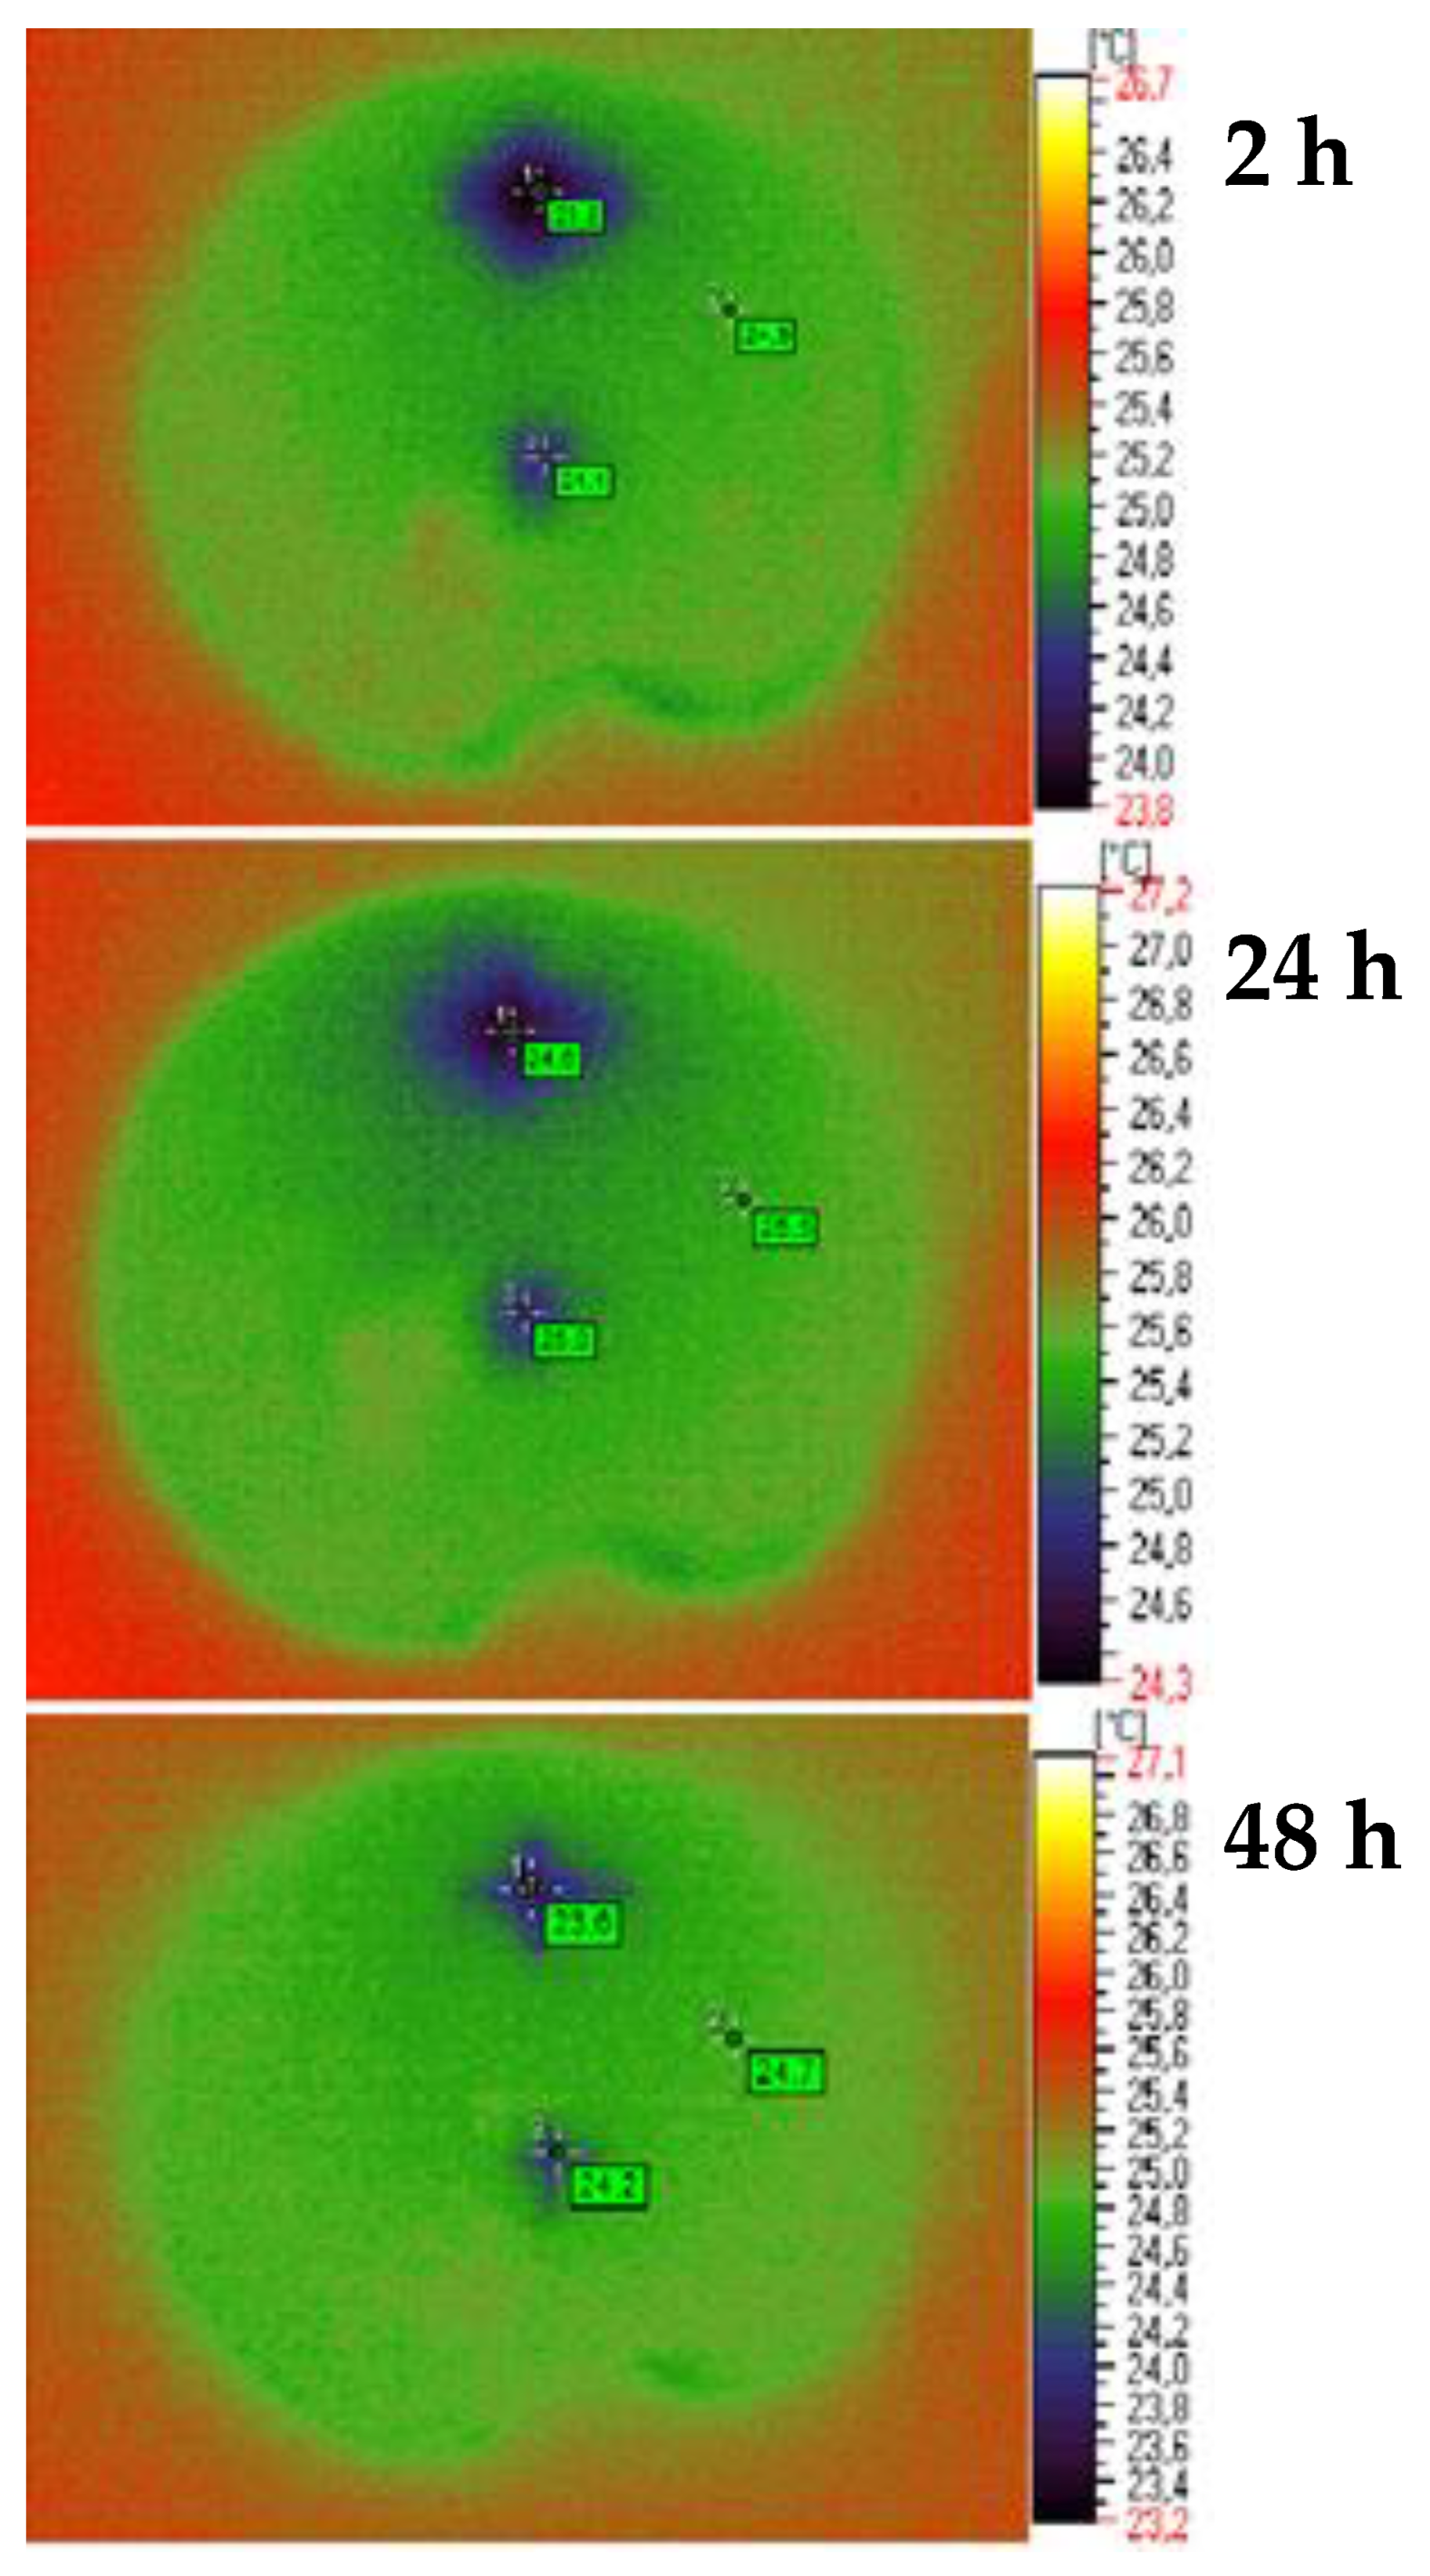
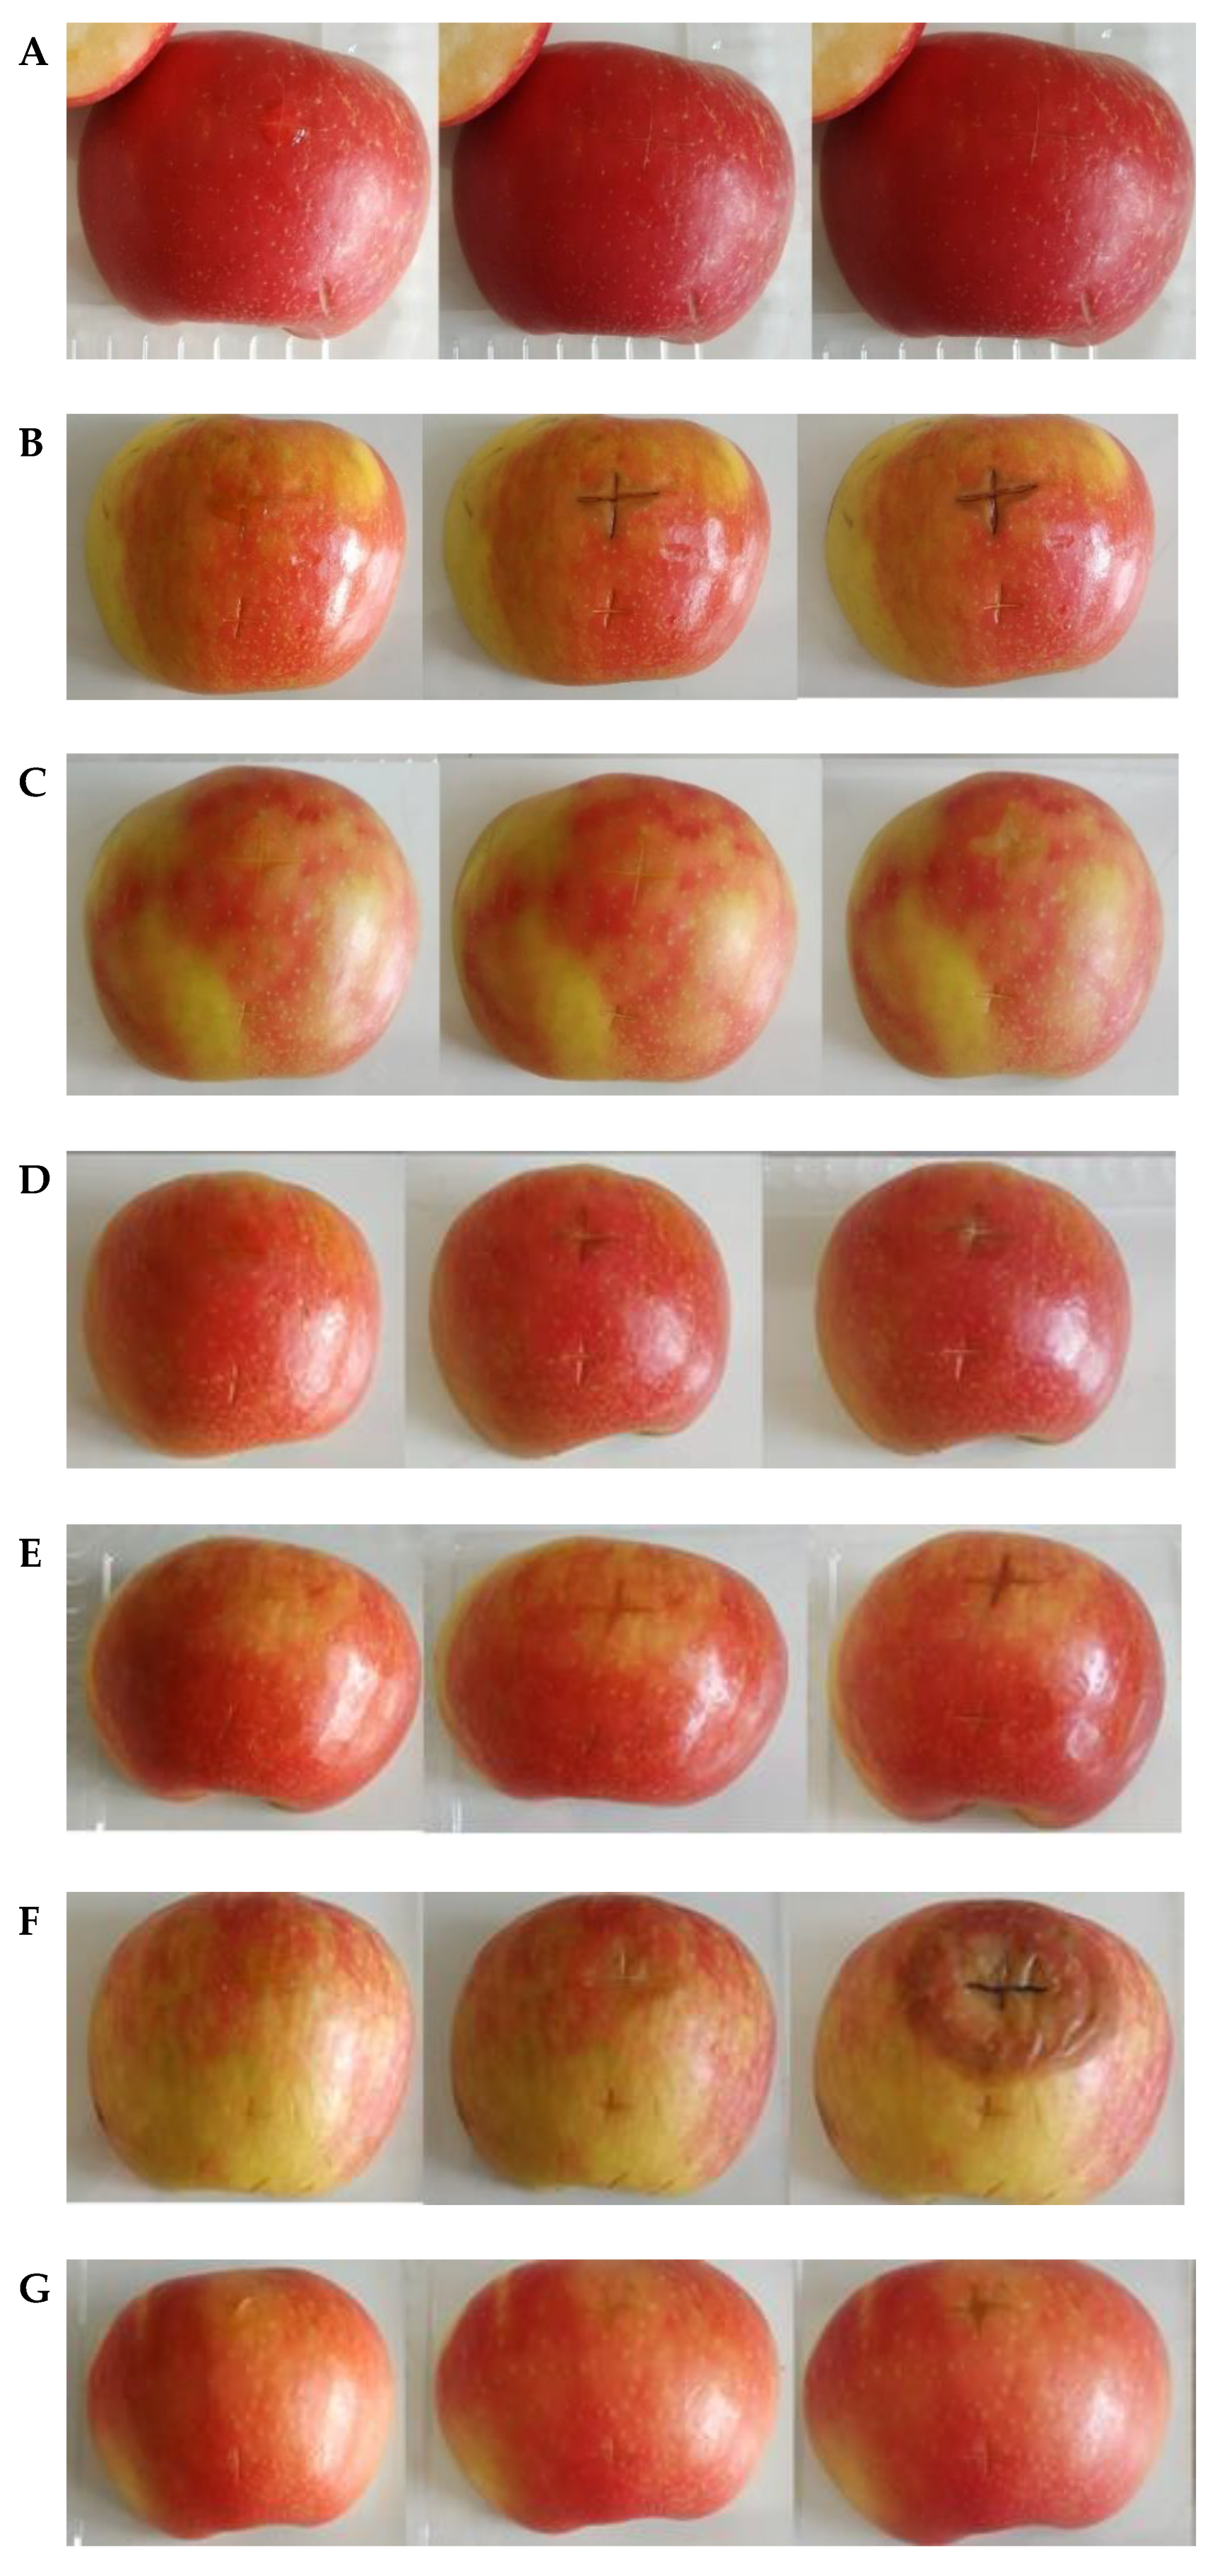
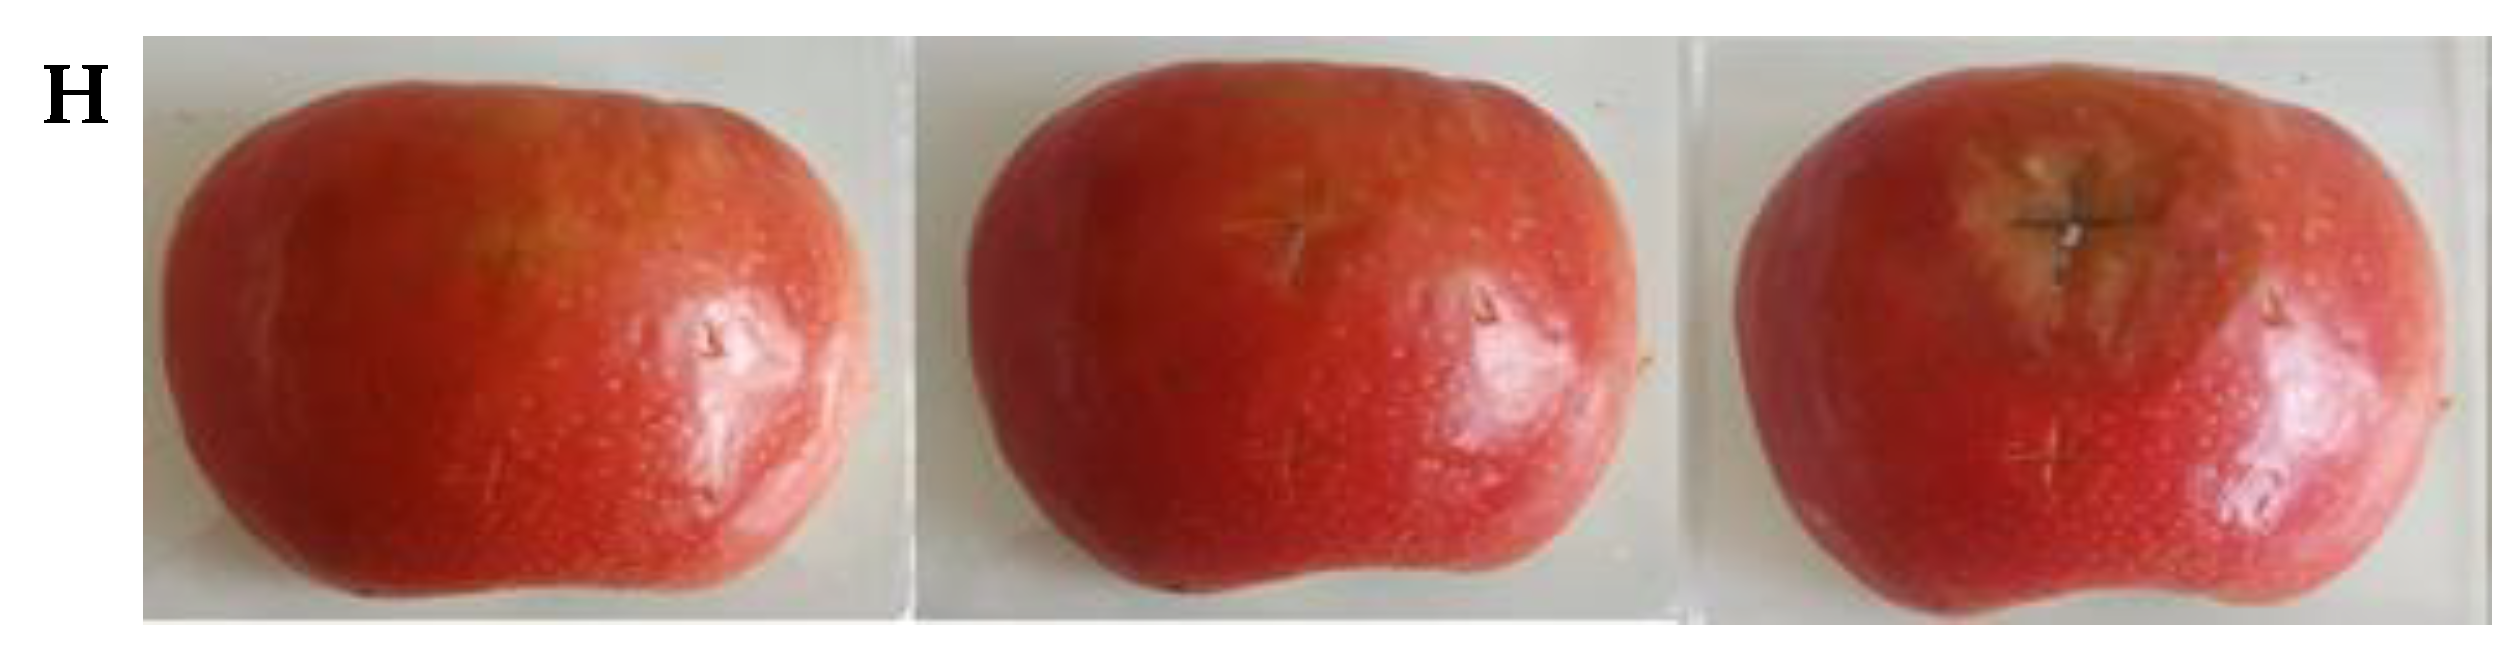
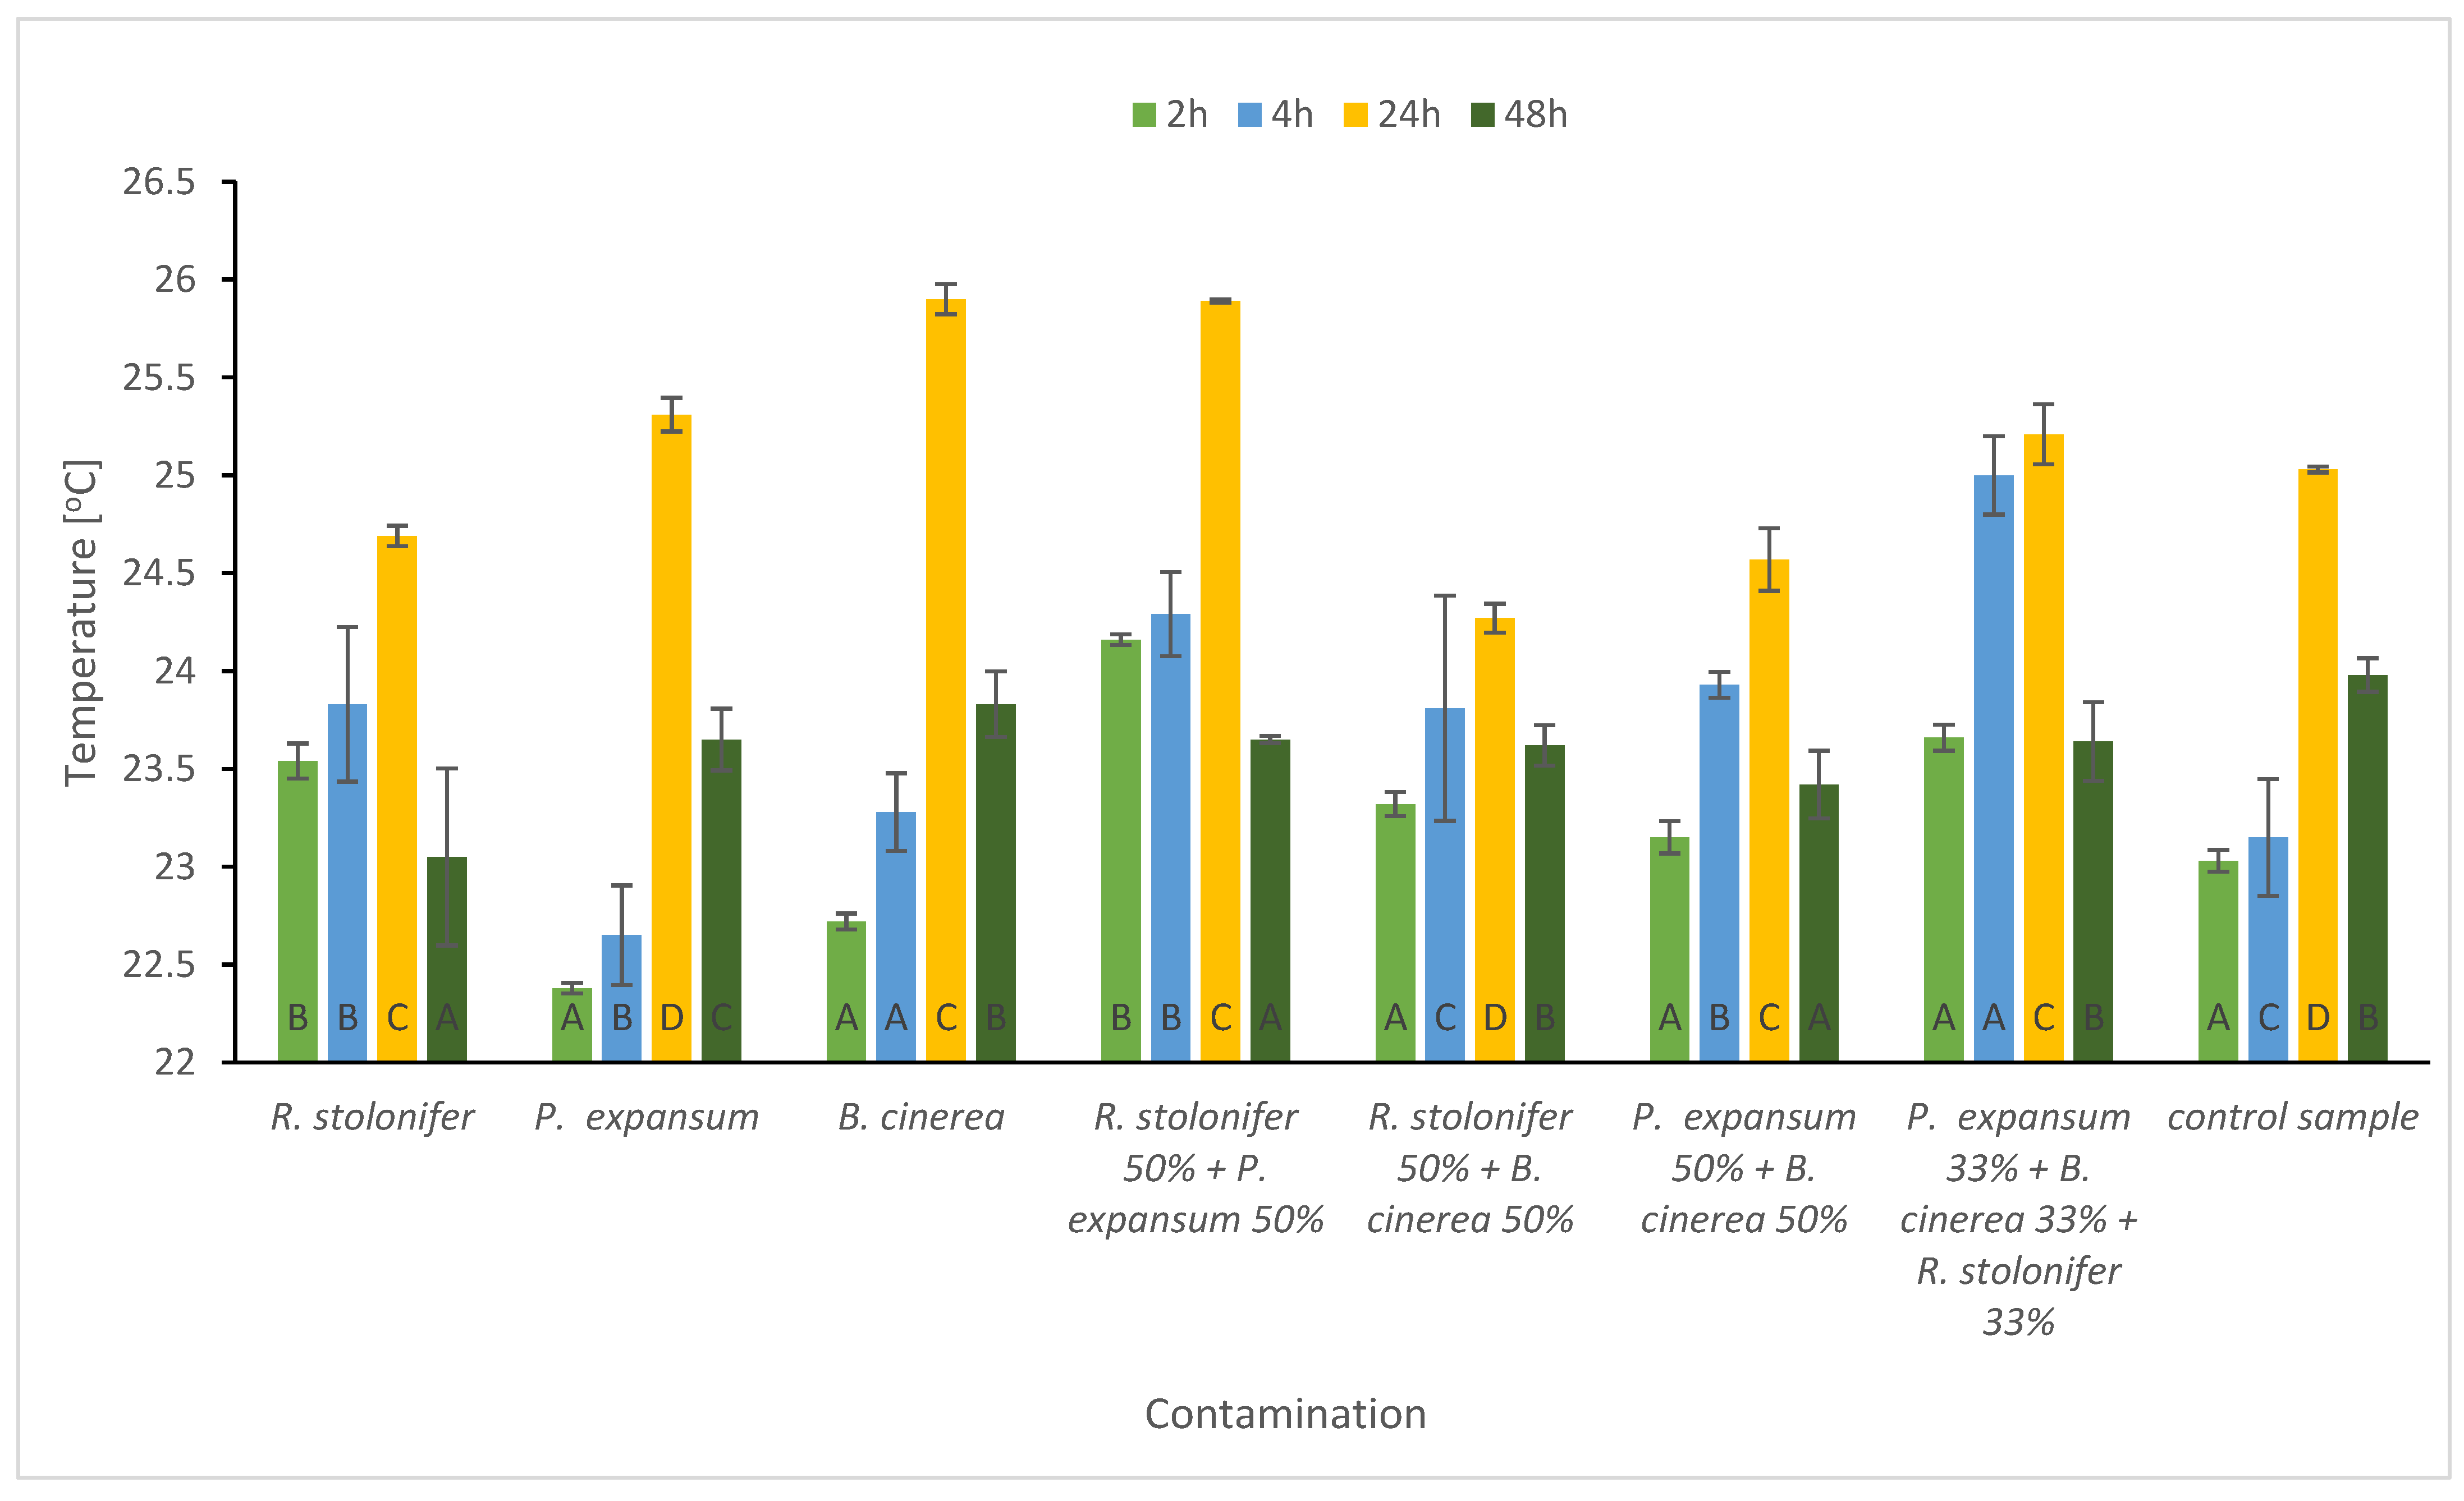
3. Results and Discussion

Figure 1 presents the fruit tissue changes caused by the development of mold during the 48 h incubation of apples, as recorded by the digital camera. On the first day, no significant differences were observed between the control sample and the samples contaminated with mold spores. After 24 h of incubation, the samples contaminated with B. cinerea (Figure 2B), B. cinerea and P. expansum mixture (Figure 2D), R. stolonifer (Figure 2E), R. stolonifer, and B. cinerea mixture (Figure 2F), and R. stolonifer, B. cinerea, and P. expansum mixture (Figure 2H) had reddish-brown discoloration on the skin at the inoculation site. The discoloration intensified during the next 24 h. The color of the shrunken skin became darker, and a gradual tissue decay was seen under the skin. An extensive tissue rotting was observed in samples contaminated with R. stolonifer and B. cinerea variant (Figure 2F) and R. stolonifer, B. cinerea, and P. expansum variant (Figure 2H). This can be attributed to the strong pectinolytic activity of B. cinerea.
Figure 3 presents the temperature changes recorded with a VIGOcam V60 camera during 48 h incubation of apples.
The temperature of all apple samples was found to be increased on the first day, and then decreased between 24 and 48 h of incubation. At 4 h of incubation, the highest temperature was recorded in the sample contaminated with the mixed culture comprising the spores of P. expansum, B. cinerea, and R. stolonifer. At 24 h of incubation, the maximum temperature was found in the samples contaminated with only B. cinerea (25.90 °C) and with P. expansum and R. stolonifer mixed culture (25.89 °C), while the lowest temperature was noted in the sample contaminated with P. expansum and B. cinerea mixed culture (24.27 °C). After 48 h of incubation, the temperatures of the contaminated apples ranged between 23.05 °C and 23.85 °C and were lower than that of the control sample (23.98 °C).
Both apples contaminated with single mold cultures and apples contaminated with mixtures of mold cultures showed a similar trend of temperature changes: a gradual increase in temperature after the first 24 h of inoculation and subsequent decrease in temperature. Furthermore, higher metabolic activity was noted in the sample contaminated with a mixture of P. expansum, B. cinerea, and R. stolonifer, because after 4 h of inoculation a significant increase in the temperature of the fruit skin was observed. The symbiosis between the three species through the production of various enzymes aided in their faster adaptation to the environment, as was indicated by the thermographic images.
Lahiri et al. [23] reported that the temperature of tested samples increased proportionately to the bacterial count and the rate of temperature change varied depending on the tested species, because the morphology of the species significantly influenced the emission of thermal radiation. The results of the present study partially showed this dependence, especially in the initial stage of mold growth. However, the temperature of the tested surface decreased gradually with the development of mycelium. Stoll et al. [28] observed that the development of downy mildew, a grapevine leaf parasitic disease caused by the oomycete Plasmopara viticola, resulted in a decrease in temperature in healthy leaves.
The use of a thermovision camera facilitated the differentiation of morphological traits between the studied mold species. For example, the sample in which R. stolonifer was growing along with a compact cover of P. expansum showed a sealed barrier and a much lower temperature compared to the samples contaminated with other molds. It was found that in thermal imaging diagnostics it is not so much important to measure the temperature as to determine the temperature difference between the mycelium of a given mold species and the substrate. This temperature difference was related to the size of the colony, its structure and microbial metabolism.
As molds have a destructive effect on fruit tissue, the growth of microorganisms may have an impact on the value of conductivity coefficient similar to mechanical damage. This can be attributed to the local loss of moisture and formation of cork-like tissue, characterized by a lower density, and thus differences in thermal diffusivity parameters [29].
After the molds reached an advanced developmental stage, a significant reduction in the temperature of the contaminated fruit samples was observed, which confirms the results reported by Baranowski et al. [19]. Due to the difference in the emissivity of the damaged tissue, the temperature decreases at a faster rate; therefore, the thermogram shows a negative thermal contrast for the damaged surface of the fruit.
Statistical analysis of the comparison of apple samples contaminated with molds and the noncontaminated control sample (Table 1) revealed that the changes recorded after 24 and 48 h were significantly different (regardless of the contamination variant), which indicates that the thermovision technique can be potentially used for assessing the development of microbiological contamination. The greatest differentiation between samples was observed after 24 h of incubation, which enabled the distinction of as many as six homogeneous groups.
Similar results have been obtained by Chelladurai et al. [24]. These results of investigations proved that thermal imaging system could be useful tool to find if grain is infected by fungi or not.

4. Conclusions

This study assessed the development of mold on apples using IRT. The results showed a relationship between the development of mold fungi and the temperature of the tested fruit samples. The samples contaminated with mold spores showed a gradual temperature increase until visible sporulation. On the other hand, the clusters of sporulating molds showed a lower temperature than the substrate. The structure of mycelium also significantly influenced thermal emission. Based on the results of the study, it can be suggested that in order to thoroughly understand the nature of microbiological changes in the examined food products, a series of studies should be conducted, and a database should be created for subsequent application of the thermovision on an industrial scale.

Author Contributions

Conceptualization, E.L.; methodology, E.L. and K.P. (Katarzyna Pobiega); software, E.L. and K.P. (Katarzyna Pobiega); validation, E.L. and K.P. (Katarzyna Pobiega); formal analysis, E.L., K.P. (Kamil Piwowarek) and K.P. (Katarzyna Pobiega); investigation, E.L.; data curation, E.L.; writing—original draft preparation, E.L. and K.P. (Katarzyna Pobiega); writing—review and editing, E.L. and K.P. (Katarzyna Pobiega); visualization, E.L.; supervision, S.B. All authors have read and agreed to the published version of the manuscript.

Funding

This research was supported by the statutory funds of the Department of Food Biotechnology and Microbiology of the Institute of Food Sciences of the Warsaw University of Life Sciences—SGGW, Poland. Research equipment was purchased as part of the “Food and Nutrition Centre - modernisation of the WULS campus to create a Food and Nutrition Research and Development Centre (CŻiŻ)” co-financed by the European Union from the European Regional Development Fund under the Regional Operational Programme of the Mazowieckie Voivodeship for 2014-2020 (Project No. RPMA.01.01.00-14-8276/17).

Institutional Review Board Statement

Not applicable.

Informed Consent Statement

Not applicable.

Data Availability Statement

The data that supports the findings of this study are available from the corresponding author upon reasonable request.

Acknowledgments

The authors thank VIGO System (Ozarow Mazowiecki, Poland) for sharing the camera VIGOcam V60.

Conflicts of Interest

The authors declare no conflict of interest.

References

  1. Graca, A.; Santo, D.; Esteves, E.; Nunes, C.; Abadias, M.; Quintas, C. Evaluation of microbial quality and yeast diversity in fresh-cut apple. Food Microbiol. 2015, 51, 179–185. [Google Scholar] [CrossRef] [PubMed]
  2. Vongsangnak, W.; Nielsen, J. Microbial Production of Food Ingredients, Enzymes and Nutraceuticals. 2—Systems biology methods and developments of filamentous fungi in relation to the production of food ingredients. In Woodhead Publishing Series in Food Science, Technology and Nutrition; Woodhead Publishing: Sawston, UK, 2013; pp. 19–41. [Google Scholar]
  3. Bryk, H.; Kruczyńska, D. Występowanie chorób przechowalniczych na jabłkach odmian parchoodpornych. Acta Agrobot. 2005, 58, 205–212. [Google Scholar] [CrossRef] [Green Version]
  4. Elad, Y.; Pertot, I.; Prado, A.M.C.; Stewart, A. Plant hosts of Botrytis spp. In Botrytis—The Fungus, the Pathogen and Its Management in Agricultural Systems; Elad, Y.Y., Fillinger, S., Eds.; Springer: Cham, Switzerland, 2016; pp. 413–486. [Google Scholar]
  5. Toe, E.; Dadié, A.; Dako, E.; Loukou, G. Bacteriological Quality and Risk Factors for Contamination of Raw Mixed Vegetable Salads Served in Collective Catering in Abidjan (Ivory Coast). Adv. Microbiol. 2017, 7, 405–419. [Google Scholar] [CrossRef] [Green Version]
  6. Barbin, D.; El Masry, G.; Sun, D.; Allen, P.; Morsy, N. Non-destructive assessment of microbial contamination in porcine meat using NIR hyperspectral imaging. Innov. Food Sci. Emerg. Technol. 2013, 17, 180–191. [Google Scholar] [CrossRef]
  7. Gade, R.; Moeslund, T.B. Thermal Cameras and Applications: A Survey. Mach. Vis. Appl. 2014, 25, 245–262. [Google Scholar] [CrossRef] [Green Version]
  8. Saxena, A.; Raman, V.; Ng, E.Y.K. Study on methods to extract high contrast image in active dynamic thermography. Quant. InfraRed Thermogr. J. 2019, 16, 243–259. [Google Scholar] [CrossRef]
  9. Voss, M.; Alessio, K.O.; Santos, R.C.V.; Ebling de Souza, M.; Clerici, D.J.; Wagner, R.; Cichoski, A.J.; Ben da Costa, A.; Helfer, G.A.; Machado, G.S.; et al. Rapid, Noninvasive, and Nondestructive Method for Biofilm Imaging on Metallic Surfaces Using Active Thermography. Anal. Chem. 2020, 92, 5682–5687. [Google Scholar] [CrossRef]
  10. Baranowski, P.; Mazurek, W.; Walczak, R.T. Termografia w agrofizyce. Acta Agrophysica 2003, 2, 663–675. [Google Scholar]
  11. Ishimwe, R.; Abutaleb, K.; Ahmed, F. Applications of Thermal Imaging in Agriculture—A Review. Adv. Remote Sens. 2014, 3, 128–140. [Google Scholar] [CrossRef] [Green Version]
  12. Knížková, I.; Kunc, P.; Gurdil, G.A.K.; Pinar, Y.; Selvi, K.C. Applications of infrared thermography in animal production. J. Fac. Agric. 2007, 22, 329–336. [Google Scholar]
  13. Ring, F. Thermal imaging today and its relevance to diabetes. J. Diabetes Sci. Technol. 2010, 4, 857–862. [Google Scholar] [CrossRef] [Green Version]
  14. Kylili, A.; Fokaides, P.A.; Christou, P.; Kalogirou, S.A. Infrared thermography (IRT) applications for building diagnostics: A review. Appl. Energy 2014, 134, 531–549. [Google Scholar] [CrossRef]
  15. Vadivambal, R.; Jayas, D.S. Applications of thermal imaging in agriculture and food industry—A Review. Food Bioprocess Technol. 2011, 4, 186–199. [Google Scholar] [CrossRef]
  16. Correira, R.M.; Tosatoa, F.; Domingosa, E.; Rodriguesa, R.R.T.; Aquinob, L.F.M.; Filgueirasa, P.R.; Lacerda, V., Jr.; Romãoa, W. Portable near infrared spectroscopy applied to quality control of Brazilian coffee. Talanta 2018, 176, 59–68. [Google Scholar] [CrossRef]
  17. Ding, L.; Dong, D.; Jiao, L.; Zheng, W. Potential using of infrared thermal imaging to detect volatile compounds released from decayed grapes, National Engineering Research Center for Information Technology in Agriculture. PLoS ONE 2017, 12, e0180649. [Google Scholar] [CrossRef] [Green Version]
  18. Niemira, B.A.; Zhang, H.Q. Advanced Technologies for Detection and Elimination of Pathogens. In The Produce Contamination Problem—Causes and Solutions; Sapers, G., Solomon, E., Matthews, K., Eds.; Elsevier: Amsterdam, The Netherlands, 2009; pp. 425–443. [Google Scholar]
  19. Baranowski, P.; Mazurek, W.; Wozniak, J.; Majewska, U. Detection of early bruises in apples using hyperspectral data and thermal imaging. J. Food Eng. 2012, 110, 345–355. [Google Scholar] [CrossRef]
  20. Li, X.; Li, R.; Wang, M.; Liu, Y.; Zhang, B.; Zhou, J. Hyperspectral Imaging and Their Applications in the Nondestructive Quality Assessment of Fruits and Vegetables. In Hyperspectral Imaging in Agriculture, Food and Environment; Intech Open: London, UK, 2018; pp. 27–63. [Google Scholar]
  21. Satone, M.; Diwakar, S.; Joshi, V. Automatic Bruise Detection in Fruits Using Thermal Images. Int. J. Adv. Res. Comput. Sci. Softw. Eng. 2017, 7, 727–732. [Google Scholar] [CrossRef]
  22. Ekramirad, N.; Akinbode, A.A.; Alimardani, R. A Review of Non-Destructive Methods for Detection of Insect Infestation in Fruits and Vegetables. Innov. Food Res. 2015, 2, 6–12. [Google Scholar]
  23. Lahiri, B.B.; Divya, M.P.; Bagavathiappan, S.; Thomas, S.; Philip, J. Detection of pathogenic gram negative bacteria using infrared thermography. Infrared Phys. Technol. 2012, 55, 485–490. [Google Scholar] [CrossRef]
  24. Chelladurai, V.; Jayas, D.S.; White, N.D.G. Thermal imaging for detecting fungal infection in stored wheat. J. Stored Prod. Res. 2010, 46, 174–179. [Google Scholar] [CrossRef]
  25. Hahn, F.; Hernandez, G.; Echeverria, E.; Romanchick, E. Escherichia coli detection using thermal images. Biosyst. Eng. 2006, 48, 4.7–4.13. [Google Scholar]
  26. Salaimeh, A.A.; Campion, J.J.; Gharaibeh, B.Y.; Evans, M.E.; Saito, K. Real-time quantification of viable bacteria in liquid medium using infrared thermography. Infrared Phys. Technol. 2011, 54, 517–524. [Google Scholar] [CrossRef]
  27. Salaimeh, A.A.; Campion, J.J.; Gharaibeh, B.Y.; Evans, M.E.; Saito, K. Real-time quantification of Staphylococcus aureus in liquid medium using infrared thermography. Infrared Phys. Technol. 2012, 55, 170–172. [Google Scholar] [CrossRef]
  28. Stoll, M.; Schultz, H.R.; Baecker, G.; Berkelmann-Loehnertz, B. Early pathogen detection under different water status and the assessment of spray application in vineyards through the use of thermal imagery. Precis. Agric. 2008, 9, 407–417. [Google Scholar] [CrossRef]
  29. Varith, J.; Hyde, G.M.; Baritelle, A.L.; Fellman, J.K.; Sattabongkot, T. Non-contact bruise detection in apples by thermal imaging. Innov. Food Sci. Emerg. Technol. 2003, 4, 211–218. [Google Scholar] [CrossRef]
Figure 1. Infrared image of apple samples contaminated with the mixture P. expansum and B. cinerea, obtained with a VIGOcam V60 camera.
Horticulturae 08 00972 g001
Figure 2. Images of apples obtained during their storage: (A)—noncontaminated apples (control sample); (B)—apples contaminated with Botrytis cinerea mold spores; (C)—apples contaminated with Penicillium expansum mold spores; (D)—apples contaminated with a mixture of B. cinerea and P. expansum mold spores; (E)—apples contaminated with Rhizopus stolonifer mold spores; (F)—apples contaminated with a mixture of R. stolonifer and B. cinerea mold spores; (G)—apples contaminated with a mixture of R. stolonifer and P. expansum mold spores; (H)—apples contaminated with a mixture of R. stolonifer, B. cinerea, and P. expansum mold spores.
Horticulturae 08 00972 g002aHorticulturae 08 00972 g002b
Figure 3. Temperature changes in apples contaminated with molds recorded during 48 h incubation (A–D)—homogeneous groups determined for the given contamination variant.
Horticulturae 08 00972 g003
Table 1. Comparison of temperature changes in samples in subsequent hours of incubation according to the contamination variant.
Contamination VariantTemperature
(°C)
2 h4 h24 h48 h
R. stolonifer23.54 B23.83 A24.69 E23.05 B
P. expansum22.38 C22.65 D25.31 A23.65 A
B. cinerea23.30 AB23.28 B25.90 B23.83 D
R. stolonifer, P. expansum24.21 D24.22 C25.89 B23.65 A
R. stolonifer, B. cinerea23.37 AB23.81 A24.27 C23.62 A
P. expansum, B. cinerea23.15 A23.93 AC24.57 D23.42 C
P. expansum, B. cinerea, R. stolonifer23.66 B25.00 E25.21 A23.64 A
Control23.03 A23.15 B25.03 F23.98 E
The superscripts different letters in a column indicate significant differences (p < 0.05).
Publisher’s Note: MDPI stays neutral with regard to jurisdictional claims in published maps and institutional affiliations.

