Article

Systematic Characterization of Brassica napus HIR Gene Family Reveals a Positive Role of BnHIR2.7 in Sclerotinia sclerotiorum Resistance

1
Integrative Science Center of Germplasm Creation in Western China (CHONGQING) Science City and Southwest University, College of Agronomy and Biotechnology, Southwest University, Beibei, Chongqing 400715, China
2
Institute of Innovation and Entrepreneurship, Southwest University, Beibei, Chongqing 400715, China
3
Department of Biochemistry, Women Medical and Dental College, Khyber Medical University, Peshawar 22080, Pakistan
4
Engineering Research Center of South Upland Agriculture, Ministry of Education, Chongqing 400715, China
5
Academy of Agricultural Sciences, Southwest University, Beibei, Chongqing 400715, China
*
Authors to whom correspondence should be addressed.
Horticulturae 2022, 8(10), 874; https://doi.org/10.3390/horticulturae8100874
Submission received: 14 August 2022 / Revised: 18 September 2022 / Accepted: 19 September 2022 / Published: 23 September 2022
(This article belongs to the Special Issue Advances in Brassica Crops Genomics and Breeding, Volume II)

Abstract

:
Hypersensitive-induced response protein (HIR) is a class of plant immune proteins that play pivotal roles in Sclerotinia sclerotiorum (Lib.) de Bary resistance. However, there has been no systematic investigation and identification of HIR genes in rapeseed (Brassica napus L.). Hence, we identified 50 BnHIR genes and classified them into four groups. Subcellular localization prediction suggested that HIR proteins are mainly localized in the mitochondria. Cis-acting elements involved in light and diverse abiotic stress were found in the promoter regions of BnHIR. The majority of BnHIR genes in Groups 1/3/4 were expressed in most examined tissues, especially in leaves and siliques pericarp, while the BnHIR genes in Group 2 were not or had low expression in all detected tissues. In the case of S. sclerotiorum inoculation, HIR genes in Groups 1/3/4 were strongly induced, especially homologous genes in Group 1, which exhibited different expression patterns. Moreover, overexpression of BnHIR2.7 in Arabidopsis thaliana illustrated its prominent resistance to S. sclerotiorum. Our study provides insight into the evolutionary relationships of the HIR family genes in B. napus and lays the foundation for their resistance to S. sclerotiorum in B. napus.

1. Introduction

Sclerotinia Disease (SD) is a host non-specific soil-borne fungal disease mainly caused by Sclerotinia sclerotiorum (Lib.) de Bary. After completing one life cycle, the fungus can remain active for decades by producing long-lived dormant bodies or sclerotia to exacerbate the potential SD inoculum [1]. SD is a potential problem that threatens multiple traits in Brassica napus L., such as reducing oil content, changing fatty acid composition, and fungal toxicity, which seriously affects the quality of rapeseed oil and causes substantial economic losses. Although traditional fungicides have a certain positive effect on SD control, the host range of S. sclerotiorum still exists widely due to its long-lived capacity in soil. Therefore, breeding new varieties is highly urgent to resist S. sclerotiorum in rapeseed [2].
The influence of pathogenic bacteria or the stress of unfavorable environmental conditions can stimulate plant hypersensitive reactions (HR). Hypersensitive-induced reaction (HIR) is involved in plant HR as a hypersensitivity protein [3]. HIR proteins are a class of hypersensitive reactions (HR). These proteins are part of the PID (proliferation, ion, and death) superfamily, and contain the stomatin/prohibitin/flotillin/HflK (SPFH) domain, which may play an important part in cell proliferation, ion channel regulation, and cell death [4,5,6]. The HIR protein induces programmed cell death in the lesions by mediating the HR response, thereby inhibiting the further spread of S. sclerotiorum hyphae. In plants, HIR genes are divided into four groups [7]. All four groups of HIR genes in A. thaliana are expressed in leaves, but their abundance varies. Moreover, all AtHIR proteins are enriched in the membrane microdomain of the plasma membrane and form both homo- and hetero-oligomers in vivo [8]. It was found that in rice, OsHIR1 binds to the plasma membrane and triggers hypersensitive cell death. Pathogen inoculation studies of transgenic A. thaliana heterologously expressing OsHIR1 showed that all transgenic lines exhibited enhanced resistance to Pseudomonas syringae pv tomato DC3000 (Pst DC3000) [9]. In wheat (Triticum aestivum L.), expression of TaHIR1 and TaHIR3 decreased under environmental stimuli such as low temperature, drought, and high salt stress [10].
In addition, HIR genes have been identified and studied in many species, including tobacco (Nicotiana tabacum L.) [11], maize (Zea mays L.) [12], barley (Hordeum vulgare L.) [13], pepper (Piper nigrum L.) [14], and wheat [10]. B. napus is one of the most important allopolyploid crops around the world, originating from Brassica rapa L. and Brassica oleracea L. [15]. Despite the importance of Brassica plants, the identity and function of BnHIR genes have not been studied in depth. In this study, we identified HIR family genes in B. napus using AtHIR genes as queries and studied their phylogenetic relationships, gene structures, and cis-acting elements. We also analyzed the spatio-temporal expression patterns of the BnHIR genes in various tissues during different stages, as well as the expression patterns induced by S. sclerotiorum. Moreover, overexpressed BnHIR2.7 in Arabidopsis thaliana (L.) Heynh. showed resistance to S. sclerotiorum, which could effectively inhibit the growth of S. sclerotiorum in leaves compared with the wild type. These results lay the base for understanding the function of HIR genes and the cultivation of Sclerotinia-resistant materials in B. napus.

2. Materials and Methods

2.1. Plants, Strain Materials, and Growth Conditions

The A. thaliana wild-type Col-0 and B. napus variety ZS11 were supplied by Southwest University, China. A. thaliana seeds were sterilized and sown on 1/2 Murashige and Skoog (MS) medium for two weeks and then transplanted into nutrient soil to continue culturing in the growth chamber (16 h photoperiod, 25/18 °C when the fourth leaf appeared, day/night, 60% humidity, 250 μmol·m−2·s−1). The rapeseed was sterilized and sown on MS medium, transplanted into nutrient soil for cultivation after two leaves, and then S. sclerotiorum strain 1980 was grown. The sclerotia of S. sclerotiorum were sterilized and placed on Potato Dextrose Agar (PDA) medium and cultured in a 23 °C incubator to the third generation.

2.2. Identification of BnHIR Gene Family in B. napus

The genome, coding, and protein sequences of A. thaliana and B. napus were downloaded from the Arabidopsis Information Resource (http://www.arabidopsis.org, accessed on 13 December 2021) and EnsemblPlants (http://plants.ensembl.org, accessed on 13 December 2021), respectively. To identify HIR genes in B. napus, 18 HIR protein sequences from A. thaliana were used as queries in a reciprocal BLASTP [16,17], with a threshold e-value of less than 1 × 10⁻⁵, minimal alignment coverage was 50% [18]. Then, the conserved SPFH domain in HIR candidate proteins was confirmed using the website Pfamscan (https://www.ebi.ac.uk/Tools/pfa/pfamscan/, accessed on 5 February 2022). Protein molecular weight (MW) and theoretical isoelectric point (pI) were predicted by the Prosite ExPASy server (http://web.expasy.org/protp aram/, accessed on 5 February 2022). Transmembrane transit peptides were predicted using the TMpred tool (http://www.ch.embnet.org/software/TMPRED_form.html/, accessed on 7 February 2022), and SignalP5.0 (https://services.healthtech.dtu.dk/service.php?SignalP-5.0, accessed on 5 February 2022) was used to identify signal peptides. The subcellular locations of HIR proteins were predicted by plant mPLoc (http://www.csbio.sjtu.edu.cn/bioinf/plant-multi/, accessed on 20 March 2022) [19].

2.3. Phylogenetic Analysis, Gene Structure, and Protein Motif Analysis

The HIR proteins of A. thaliana and B. napus were aligned by MUSCLE (multiple sequence comparison of logarithmic expectation, http://www.ebi.ac.uk/Tools/msa/MUSCLE/, accessed on 8 February 2022) [20]. The maximum likelihood (ML) tree was constructed to demonstrate their phylogenetic relationship using the online PhyML server (PhyML3.0, http://www.atgc-montpellier.fr/phyml, accessed on 10 February 2022) [21,22] with the JTT + G+F substitution model. Model of rate heterogeneity: discrete gamma; the number of substitution rate categories, 4; bootstrap replicates, 100. The phylogenetic trees were modified and visualized in Evolview V3 [23]. The intron structure of BnHIRs was displayed by the Gene Structure Display Server (GSDS 2.0, http://gsds.gao-lab.org/, accessed on 12 February 2022). The conserved motifs of BnHIR proteins were predicted using MEME (Multiple EM for Motif Elicitation) V5.0.4 (http://alternate.MEME suite.org, accessed on 13 February 2022) [24], with the following parameter settings: the optimal motif width between 6 and 200; the number of motifs 15.; only motifs with E-value lower than 1 × 10⁻¹⁰ were kept for further study.

2.4. Analysis of Cis-Acting Elements and Expression Patterns of BnHIR Genes

The 2000-bp genomic DNA sequence upstream of BnHIR genes was extracted using TBtools [25]. Then sequences were submitted to PlantCARE (http://bioinformatics.psb.ugent.be/webtools/PlantCARE/html/, accessed on 17 March 2022) [26] to identify potential cis-acting elements and plotted using R package tidyverse. To analyze the expression patterns of BnHIR genes at different tissues during different stages, we retrieved their expressions from the BrassicaEDB database (https://biodb.swu.edu.cn/brassica/, accessed on 13 February 2022) [27], including roots (Ro-f), stems (St-f), leaves (LeY-f), buds (Bu-b), petals (Pe-f), seeds (Se), and silique pericarp (SP) collected at 7, 13, 21, 27, 35, 43, and 49 days after pollination (DAP); and seeds coat (SC) and embryo (Em) at 21, 27, 35, and 43 DAP. Moreover, we analyzed BnHIR gene expressions after S. sclerotiorum infection, and the RNA-seq expression data of S. sclerotiorum infection were downloaded from the NCBI SRA database (PRJNA274853) [28]. All expression levels were normalized by log2 (FPKM + 1) and visualized by TBtools [25].

2.5. Overexpression Vector Construction and Plant Transformation

Total RNA was extracted from the leaves of B. napus and A. thaliana using an RNA extraction kit (Tiangen, Beijing, China). First-strand cDNA was synthesized using PrimeScript RT Master Mix Kit (TaKaRa, Dalian, China). Total DNA was extracted from B. napus and A. thaliana leaves using the CTAB method [29].
The coding sequence (CDS) of BnHIR2.7 was firstly amplified using the primer pair OV-HIR2.7-F/OV-HIR2.7-R and recombined into vector pEarlyGate101 for constructing the overexpression vector, resulting in p35S::BnHIR2.7-YFP (named OV-BnHIR2.7). Then, the transgenic Arabidopsis lines of OV-BnHIR2.7 were acquired through Agrobacterium tumefaciens-mediated transformation of strain GV3101 [30]. Primer Premier 5 (https://premierbiosoft.com/index.html) was used to design primers for this experimental step, and the primer sequences are listed in Table S1.

2.6. Phenotypic Observation of A. thaliana Transgenic and Mutant Plants

The AtHIR T-DNA insertion mutant (SALK_037519C, named Athir2.7-Mu) was obtained from AraShare (http://www.AraShare.cn, accessed on 20 May 2021). The homozygous Athir2.7-Mu mutants were identified and were screened using primers Athir2.7-LP/Athir2.7-RP and LBb1.3/Athir2.7-RP (Table S1). Total RNA was extracted from leaves of seedlings of Col-0, OV-BnHIR2.7, and Athir2.7-Mu, and first-strand cDNA was synthesized as previously described. qRT-PCR primers were obtained from the qPrimerDB database (http://biodb.swu.edu.cn/qPrimerDB, accessed on 25 April 2022) for OV-BnHIR2.7 and Athir2.7-Mu [31] (Table S1), and the qRT-PCR reactions were performed according to the MIQE guidelines [32] with three technical replicates per sample. Using the 2−∆∆Ct method, BnACT7 was used as control for normalization [33].
After qRT-PCR analysis, the OV-BnHIR2.7 line with the highest expression of BnHIR2.7 and the Athir2.7-Mu line with the lowest expression was selected for phenotype observation. Plant height was measured from the cotyledon nodes to the top of the main inflorescence at maturity. At 50 days of the seedling stage, five siliques from the bottom to the top of the main stem were selected to measure and count the length of the siliques.

2.7. Expression Analysis of BnHIR2.7 under the Infection of S. sclerotiorum

To confirm the function of BnHIR2.7 to S. sclerotiorum resistance, leaves of A. thaliana Col-0, OV-BnHIR2.7, and AtHIR2.7-Mu were selected for S. sclerotiorum inoculation experiments. Edge hyphae were excised using a 1 mm punch and carefully turned over to the front of normal leaves. The lesion area was measured and photographed every 12 h, with three replicates of each experiment. Each A. thaliana plant was inoculated on three leaves, and samples were collected every 12 h and immediately stored in liquid nitrogen. The Col-0, OV-BnHIR2.7, and Athir2.7-Mu leaves that had grown normally for 40 days were selected, and the three inoculated leaves of each treatment were stained with trypan blue to observe the leaf cells. Briefly, a 0.4% trypan blue staining solution was used to immerse leaves in trypan blue dye solution for 36 h and then leaves were decolorized using glacial acetic acid and methanol (3:1, v:v). Moreover, the gene expression levels of some marker genes in the SA and MeJA pathways were identified after inoculation with S. sclerotiorum.

2.8. Statistical Analysis

Statistical analysis was performed using SPSS v22.0 and one-way analysis of variance (ANOVA), and results are expressed as mean ± standard error and significant t-test, *, p < 0.05; **, p < 0.01; ***, p < 0.001. Results were visualized using GraphPad Prism 10 software [34].

3. Results

3.1. Identification and Characterization of the B. napus HIR Family

We identified 50 HIR genes with the conserved SPFH domain in B. napus. The putative HIR genes in B. napus were named according to their orthologs in A. thaliana (Table 1). Most AtHIR genes in B. napus have multiple homologous genes, and most AtHIR genes in B. napus have multiple homologs. However, in the subfamilies PHB5, PHB7, and HIR4, no homologues of A. thaliana genes were found in B. napus, indicating that the subfamily may have been lost. Among the 50 BnHIR proteins, the lengths ranged from 227 (BnHIR1) to 535aa (BnHIR1.3), and the MW ranged from 25.97 (BnHIR1) to 58.02 kDa (BnHIR1.3). Interestingly, the isoelectric point distribution of BnHIR proteins is wide, ranging from 4.99 (BnHIR1) to 9.55 (BnPHB2.5). Some proteins have transmembrane structures, such as BnPHB1.3, BnPHB1.5, and BnPHB1.7. Subcellular localization indicated that the majority of BnHIR proteins were localized in mitochondria and a few in the nucleus (Table 1).

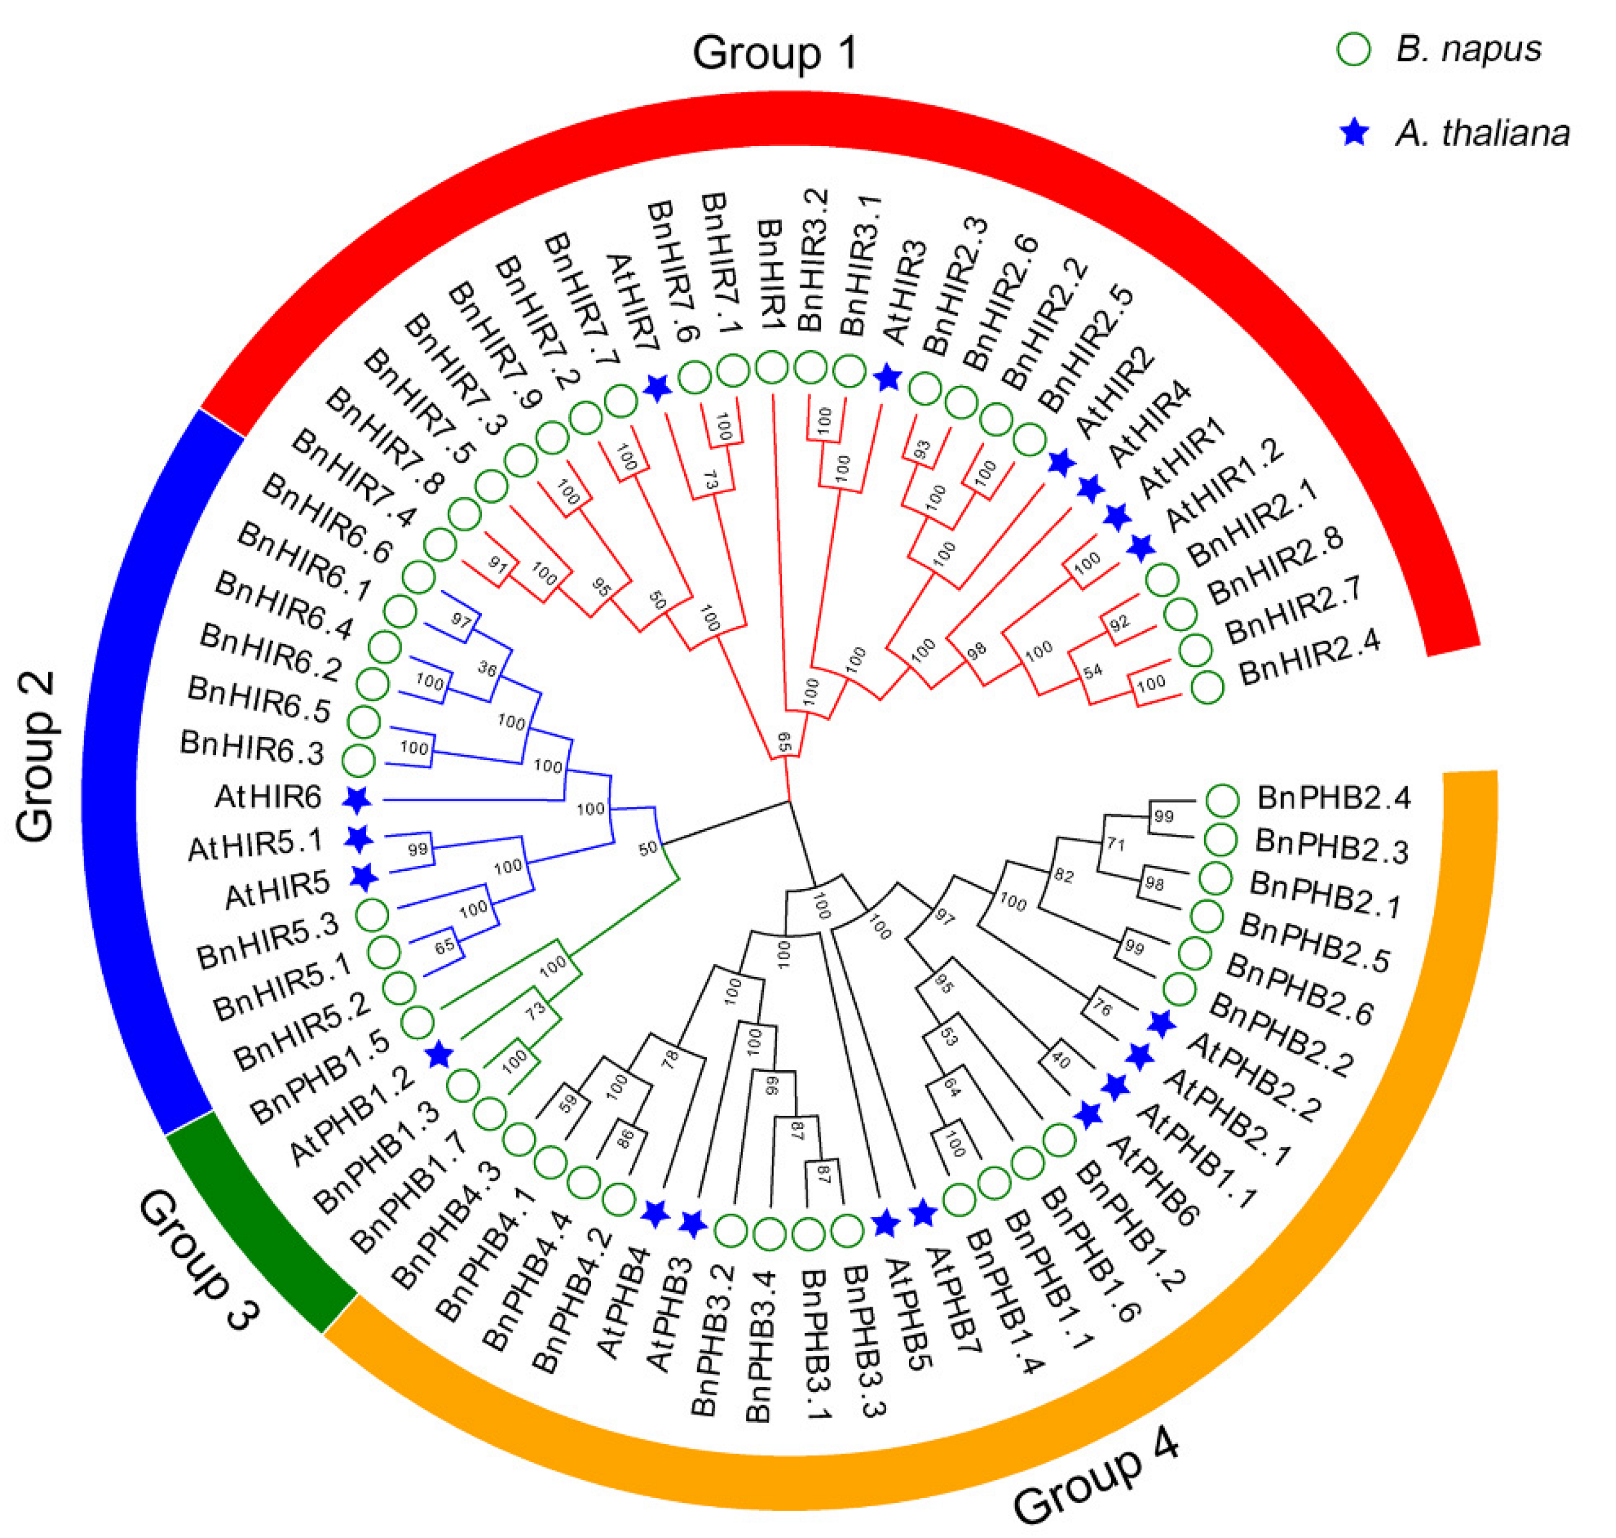
3.2. Phylogenetic Analysis of HIR Proteins in B. napus

The maximal likelihood (ML) phylogenetic tree containing 68 HIR proteins from B. napus (50) and A. thaliana (18) was constructed to explore the phylogenetic relationships. The bootstrap value showed that B. napus HIR proteins can be divided into four groups: Group 1 (HIR1/2/3/4/7 clade), Group 2 (HIR5/6 clade), Group 3 (PHB1 clade), and Group 4 (PHB2/3/4 clades). Group 1 and Group 4 are the largest clades containing 26 members, and Group 3 is the smallest clade containing 4 members. In particular, HIR5/6 formed an independent clade during evolution, while HIR1/2/3/4/7 became a clade. In addition, some genes in the HIR2 subfamily correspond to Arabidopsis AtHIR1, which then combine to form a larger clade (Figure 1). The evolutionary relationships among the rapeseed HIR genes are consistent with those of A. thaliana, except for the BnHIR1 clade.

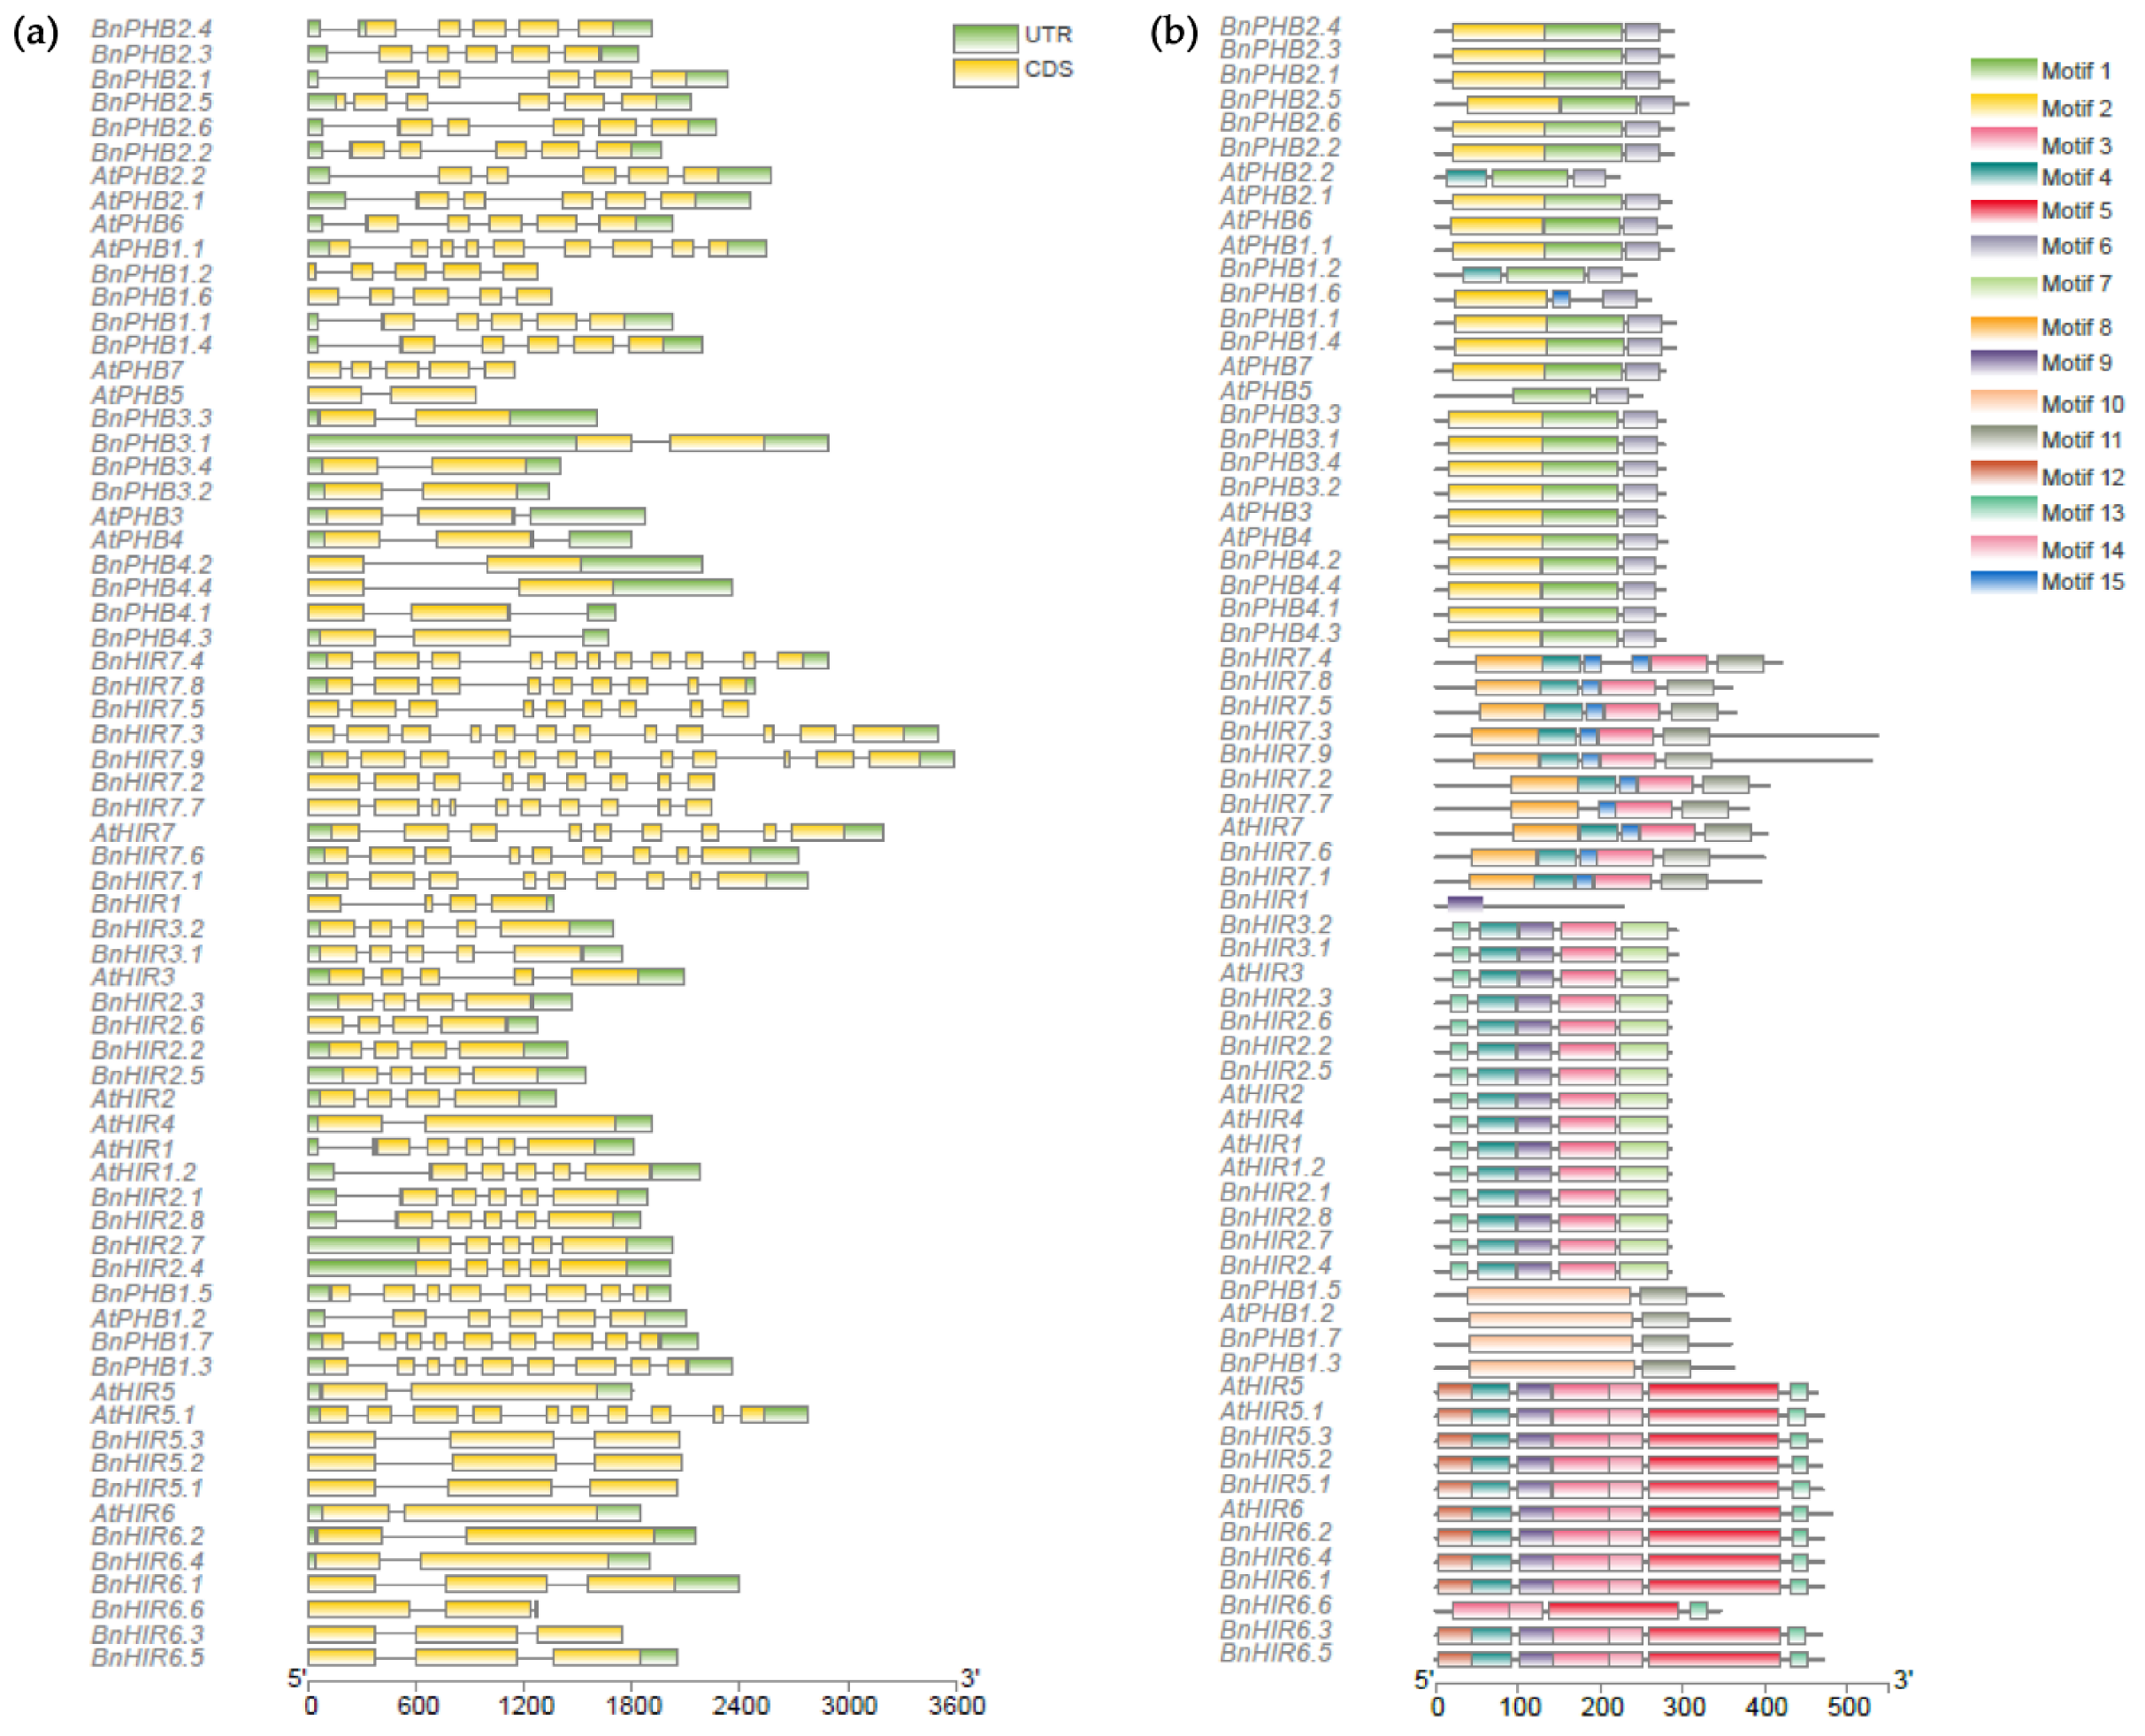
3.3. Gene Structure and Conserved Motif Analysis

To analyze the exon/intron structure of the BnHIR and AtHIR genes, we compared the CDS with their corresponding genomic sequences. The results showed that most BnHIR genes contained 3–6 exons, and some genes contained more than 8 exons, such as BnHIR7 subfamily genes (Figure 2a). Genes from the same subfamily presented similar gene structures. Most BnHIR genes have a long exon at the 3′ ends of their genomic sequence. Furthermore, the gene structure of BnHIR is highly similar to their corresponding AtHIR.
To better investigate structural diversity among BnHIR proteins, MEME was used to analyze 15 conserved motifs identified in the full-length BnHIR protein (Figure 2b). Motif 2 or motif 3 was observed in all 50 BnHIR proteins. Multiple motifs were observed in almost all BnHIR proteins, with some motifs only found in a few HIR proteins, except for BnHIR1 proteins that contain only motif 9. For example, motif 10 was only detected in Group 3, while motif 4 was unique to the HIR subfamily. Furthermore, there is a high degree of similarity between BnHIR and its cognate AtHIR proteins.

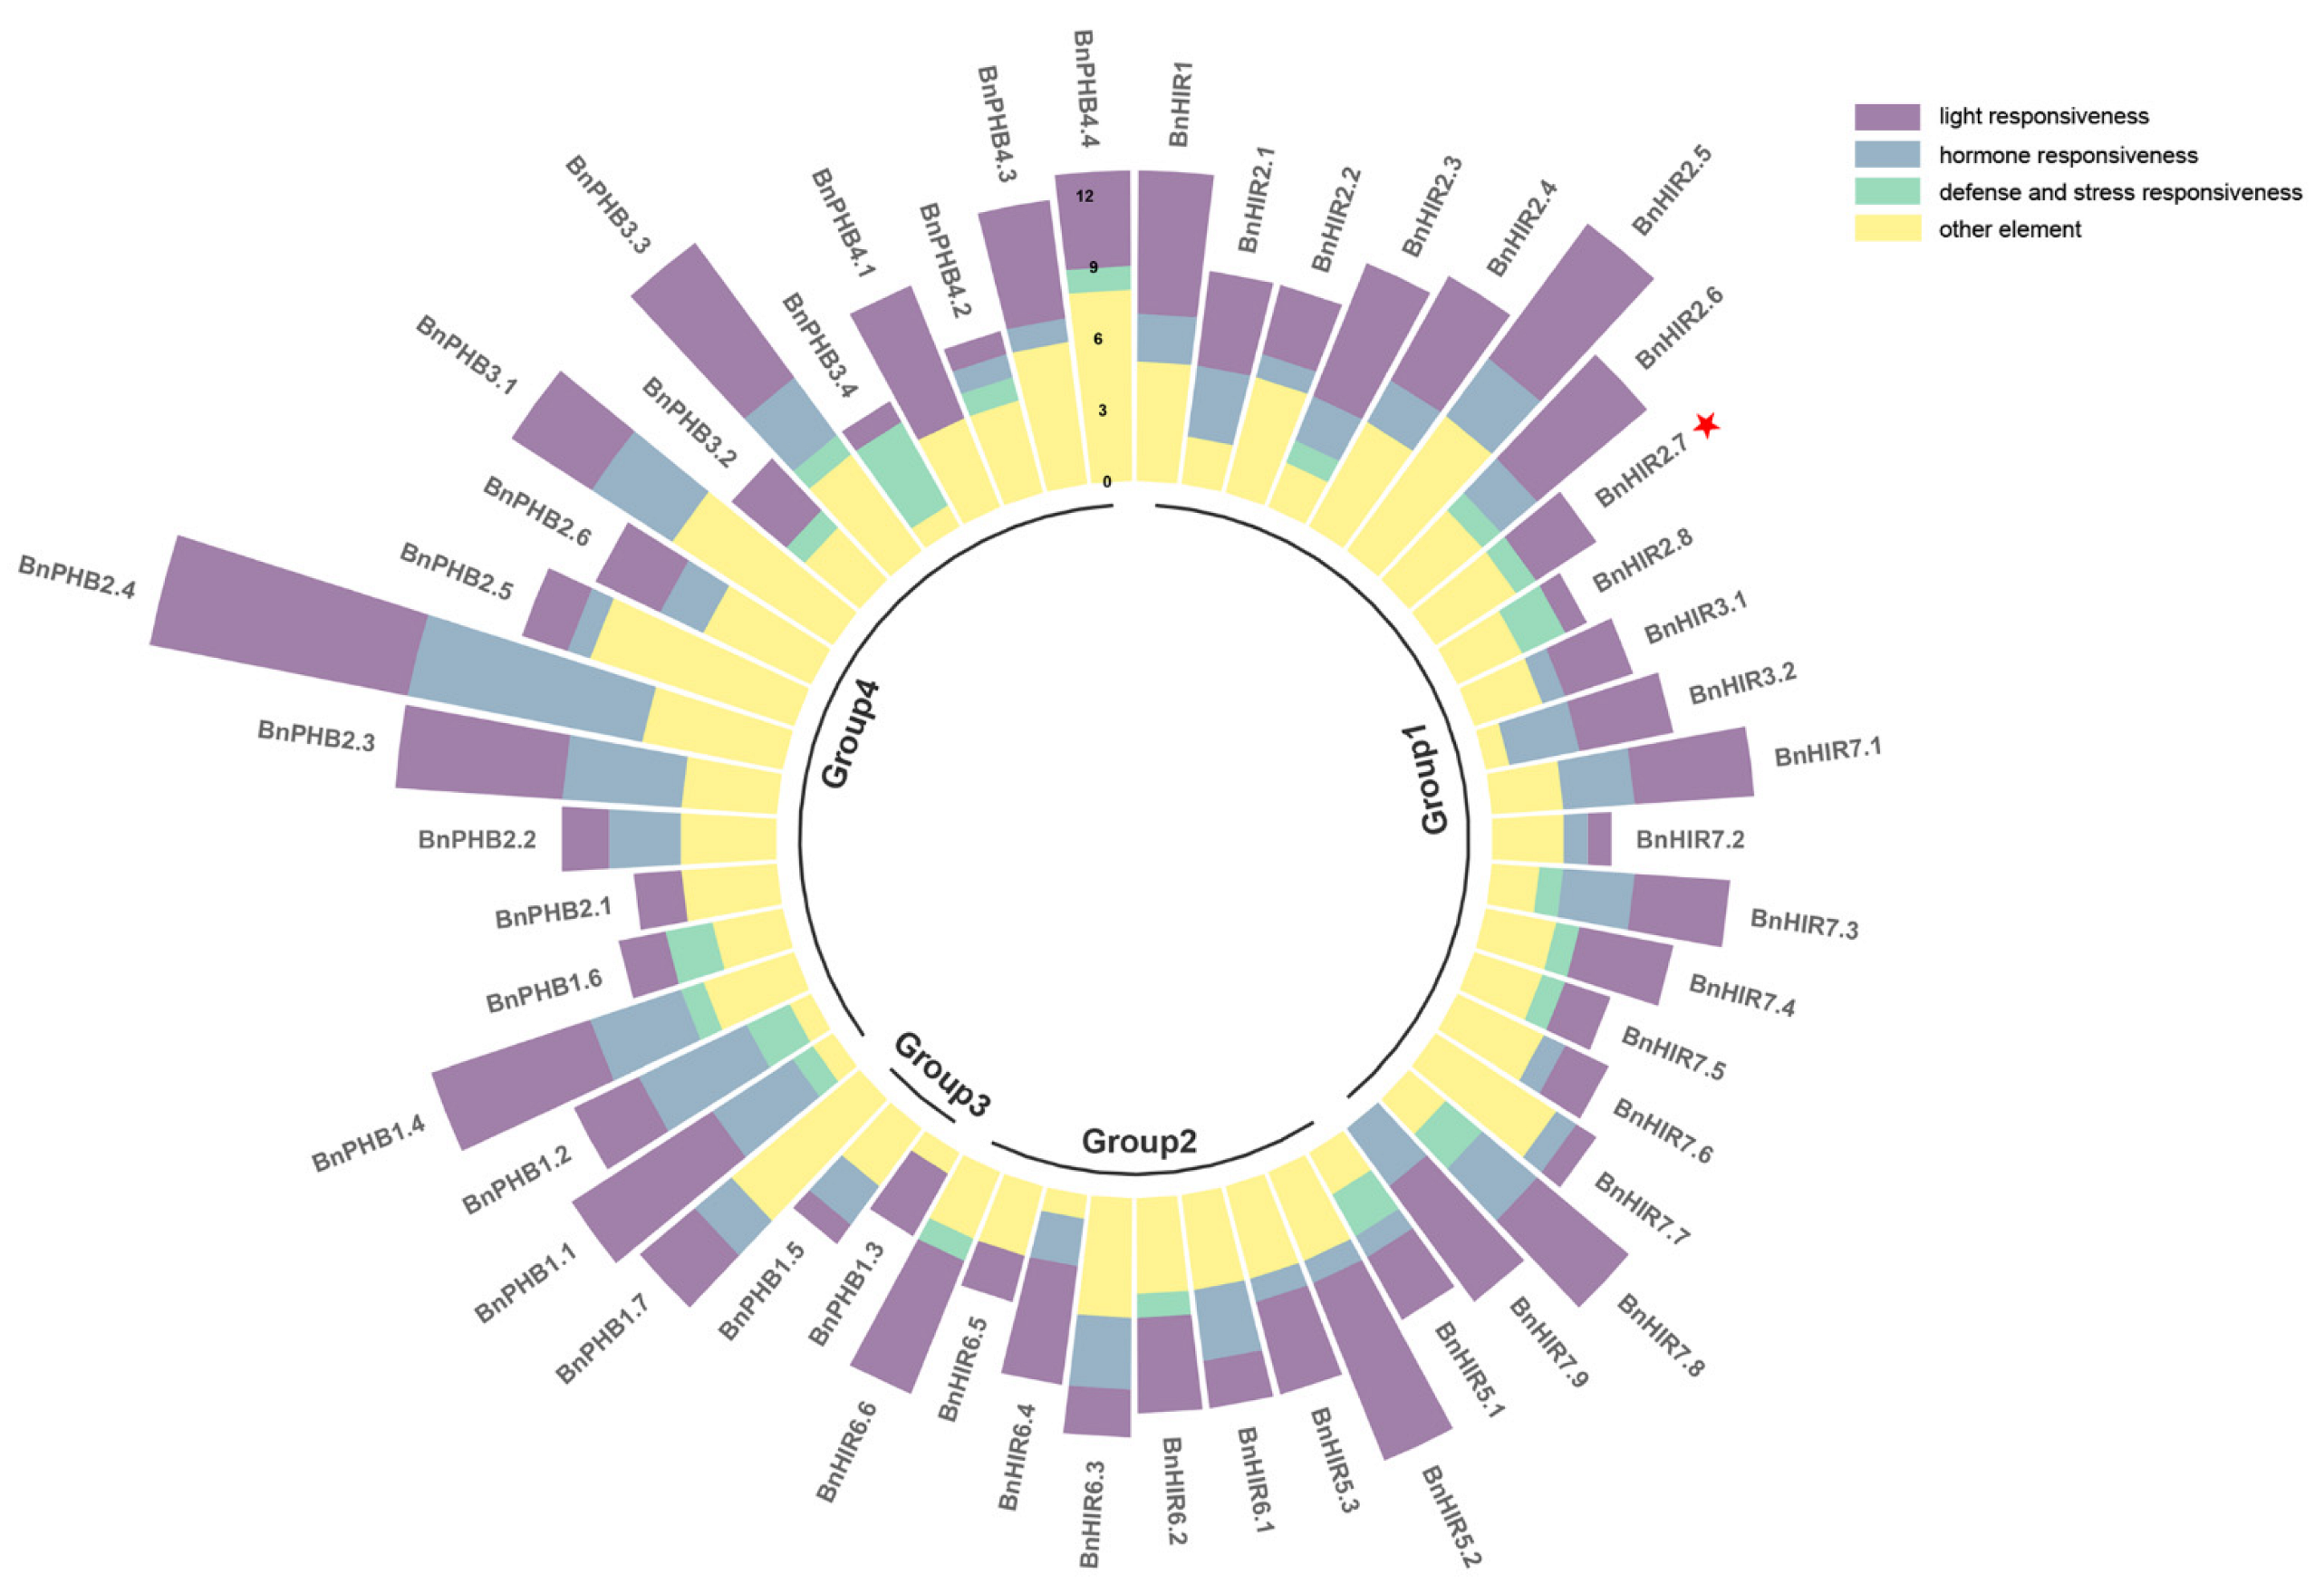
3.4. Cis-Acting Elements in the Promoter Regions of BnHIR Genes

To further explore the transcriptional regulation of the BnHIR genes, the potential cis-acting elements were identified in their upstream 2000 bp genomic DNA sequence. To better understand the potential function of the BnHIR genes, cis-acting elements involved in light response, defense, and stress response were preserved. All BnHIR genes contained light responsiveness, such as GT1-motif and G-box, and at least four cis-acting elements were found in the upstream region of each BnHIR gene (Figure 3). Elements responsive to phytohormones were also found in most promoter regions of HIR genes, including abscisic acid (ABRE) and cis-acting regulatory element (CAT-box). Members in Groups 1/2/4 had more abundant cis-acting elements, but members in Group 3 had fewer cis-acting elements, and BnPHB1.3 contained only four elements, with no phytohormone and stress cis-acting elements. In addition, the promoter regions of BnHIR included those cis-acting elements, such as the protein binding region (HD-Zip 3), enhancer (CAAT-box), and abiotic stress response (MBS) (Figure S1). Notably, the promoter region of BnPHB2.4 had the most multitudinous cis-acting elements, including 10 phytohormone-responsive elements, 11 light-responsive elements, and six other cis-acting elements. In contrast, BnPHB1.3 had the fewest cis-acting elements in the promoter region, indicating that their functions are conserved or degenerated.

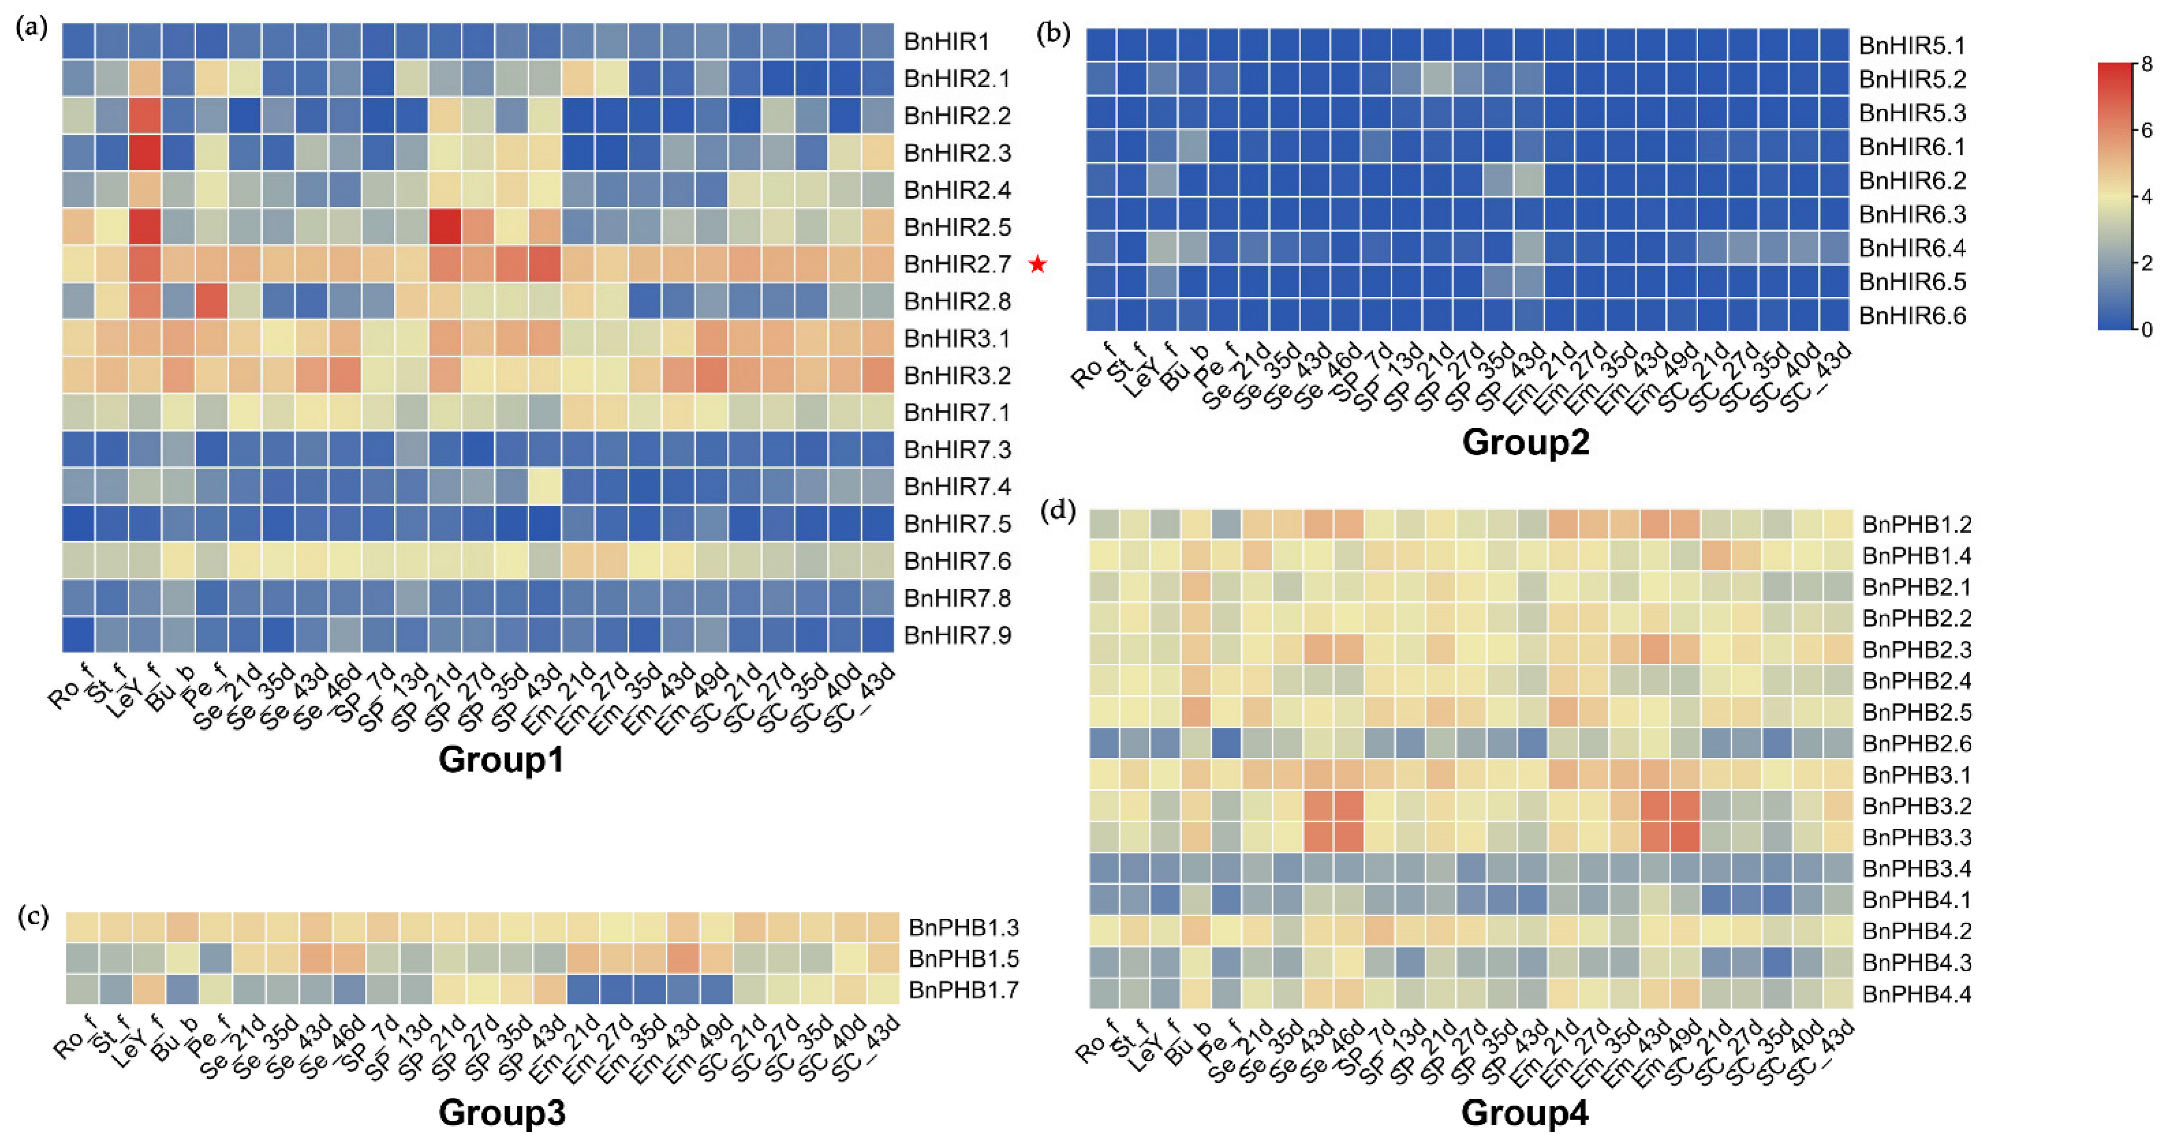
3.5. Expression Patterns of BnHIR Genes at Different Developmental Stages

To better study the biological functions of BnHIRs, we analyzed their expression profiles in numerous tissues during different stages. No expression was detected in BnHIR2.6, BnHIR7.2, BnHIR7.7, BnPHB1.1, or BnPHB1.6 in any examined tissue. In Group 1, BnHIR2.2 and BnHIR2.3 were only highly expressed in leaves, and BnHIR2.7, BnHIR3.2, and BnHIR3.3 were highly expressed in all detected tissues (Figure 4a). However, BnHIR7.8, BnHIR7.9, and Group 2 HIR genes had little or no expression in various detected tissues. Ten BnHIR genes, including BnHIR2.2, BnHIR2.3, BnHIR2.5, BnHIR2.7, and BnHIR2.8, were highly specifically expressed in leaves, and BnHIR2.5 and BnHIR2.7 were also highly specifically and highly expressed in siliques pericarp (Figure 4b). In Group 3, BnPHB1.7 was expressed in all examined tissues except embryos (Figure 4c). Genes in Group 4 were highly expressed in all tissues, and BnPHB3.2 and BnPHB3.3 were higher in seeds and embryos at 43d and 46d (Figure 4d).

3.6. Expression Analysis of BnHIRs under S. sclerotiorum Induction

To further investigate the role of BnHIRs under S. sclerotiorum induction, we analyzed the expression profiles of BnHIRs at different time points in response to S. sclerotiorum infection.
HIR genes in Group 1 showed different expression patterns. BnHIR2.4, BnHIR2.5, BnHIR3.1, and BnHIR3.2 were all highly expressed in the susceptible variety and the resistance variety after S. sclerotiorum infection. In particular, BnHIR2.7 was weakly expressed in the susceptible variety. Still, the expression level in resistant materials was higher and up-regulated rapidly 24 h after infection, reaching a maximum at 48 h and gradually decreasing (Figure 5a). Members in Group 2 had relatively weak responses to S. sclerotiorum (Figure 5b). The PHB genes in Group 3 were consistently expressed, with no apparent specificity between the two varieties (Figure 5c). As with Group 3, each member of Group 4 had high expression, with no obvious species specificity. However, 48 h after S. sclerotiorum infection in the disease-resistant material, all members of Group 4 had a higher response to S. sclerotiorum except for BnPHB2.2, with the highest expression levels for BnPHB3 and BnPHB 4 (Figure 5d).

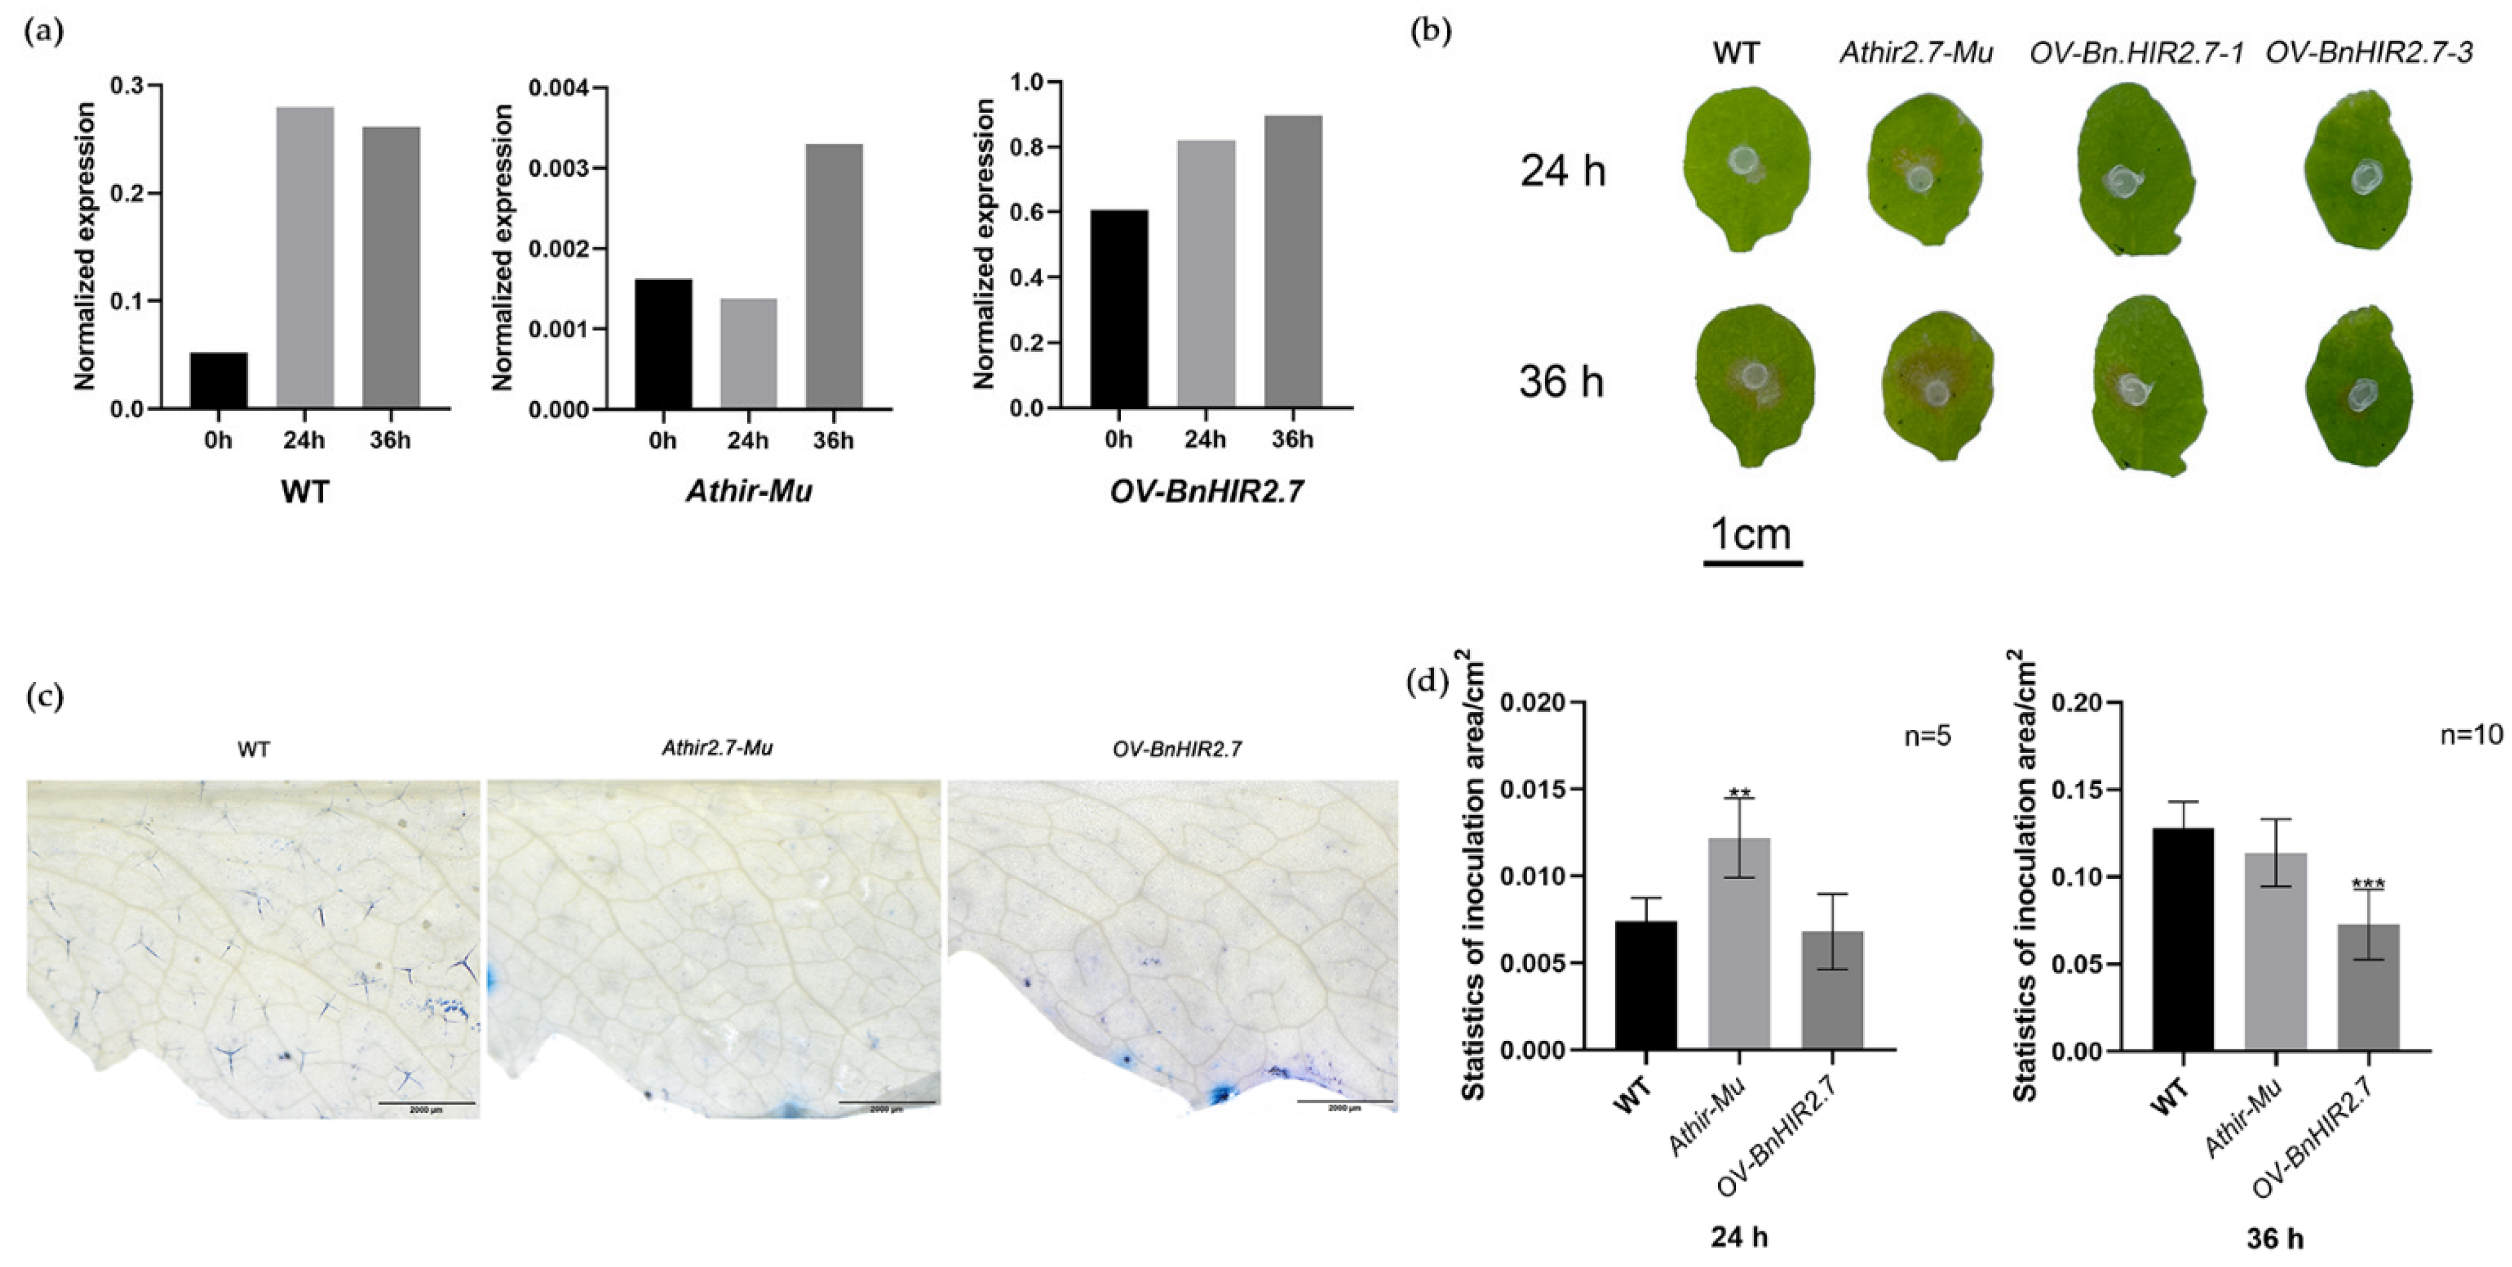
3.7. Functional Characterization of BnHIR2.7 in Transgenic Arabidopsis

To further explore the function of BnHIR2.7, we detected the phenotype of OV-BnHIR2.7 transgenic A. thaliana overexpression lines, Athir2.7-Mu mutants, and wild-type Col-0 plants. The OV-BnHIR2.7-3 line showed the highest BnHIR2.7 expression compared to wild type (Figure S2). Therefore, the OV-BnHIR2.7-3 and Athir2.7-Mu lines were selected for further study.
The expression levels of SA and MeJA pathway marker genes of Col-0, Athir2.7-Mu, and OV-BnHIR2.7 plants were detected at different times after inoculation with S. sclerotiorum (Figure S3a). We analyzed the phenotypes of OV-BnHIR2.7 transgenic A. thaliana overexpression lines, Athir2.7-Mu mutants, and wild-type Col-0 plants. At the seedling stage, there was no noticeable difference between Col-0 wild-type, OV-BnHIR2.7, and Athir2.7-Mu (Figure S3b). At the maturity stage, OV-BnHIR2.7 plants were prominently higher than Athir2.7-Mu plants (Figure S3c). In addition, the siliques of the Col-0 wild-type were prominently smaller than those of the OV-BnHIR2.7 plants but prominently longer than those of the Athir2.7-Mu (Figure S3d). These results suggest that HIR2.7 is a critical positive regulator of plant growth and development, especially in promoting silique length. Moreover, there was no extreme difference in BnHIR2.7 expression in the overexpressed lines before and after S. nucleobium inoculation (Figure 6a). Notably, trypan blue staining showed that overexpression of BnHIR2.7 in A. thaliana did not induce programmed cell death (Figure 6b). Col-0, Athir2.7-Mu, and OV-BnHIR2.7 A. thaliana leaves showed different degrees of lesions at 24 h and 36 h after inoculation with S. sclerotiorum (Figure 6c). At 48 h after S. sclerotiorum inoculation, the lesions expanded to the entire A. thaliana leaf (Figure S3e). Correspondingly, the infected area of strain in overexpressed lines was significantly (p = 0.00007) lower than that of Col-0 at 36 h inoculated, and that of Athir2.7-Mu was significantly (p = 0.0036) higher than that of Col-0 at 24 h inoculated (Figure 6d).

4. Discussion

HIR family genes play key roles in plant development, metabolism, and stress resistance, and they have been identified in many plant species. In wheat, TaHIR1 and TaHIR3 expression were reduced in response to environmental stimuli such as low temperature, drought, and high salt stress. TaHIR1 and TaHIR3 genes’ silencing induced by barley streak mosaic virus reduced the resistance of the wheat variety Suwon11 to the avirulent stripe rust type CYR23 and the necrotic cell region near the infection site and altered the expression levels of defense-related genes [10]. In pepper, overexpression of CaHIR1 gene resulted in spontaneous cell death, enhanced disease resistance against P. syringae [14], and enhanced sensitivity to salinity and drought stress during germination [35]. However, the gene function of BnHIR in B. napus has not been studied in depth.
Previous studies have shown that HIR genes have conserved functions and profound evolutionary origins in each kingdom [7]. It has been reported that 19 and 16 HIR genes have been identified in the rice and maize genomes, respectively [7,12]. In this study, we identified 50 BnHIRs, and these genes encode HIR proteins with an SPFH or PHB domain, consistent with canonical HIR proteins in other plants [36]. B. napus has more HIR genes than those plants, probably owing to additional whole-genome triploidy (WGT) during the evolutionary history of Brassica crops [15]. In higher plants, HIR genes can be divided into four classes, including I (HIR7 clade), II (HIR1/2/3 clade), III (PHB1/2/3/4 clade), and IV (PHB5/6 clade), some of which can be subdivided into smaller subclasses [7,12]. Phylogenetic analysis of the HIR genes of A. thaliana and B. napus was performed. They were divided into four groups according to the bootstrap value, structural and functional characteristics, and named as HIR subfamily (Group 1/2) and PHB (Group 3/4) subfamily, respectively. They were not completely the same as previous studies [11,37]. The BnHIR family genes have relatively diverse gene structure changes (Figure 2a). In addition, the homologous genes in each subfamily have similar characteristics, including gene structure, conserved motifs, and cis-acting elements, suggesting their functional conservation (Figure 1). It is predicted that most BnHIR proteins were localized in mitochondria. Furthermore, several cis-acting elements have multiple copies in the BnHIR promoter region. This is particularly true for cis-acting elements that confer light and hormone responsiveness, which would enhance the response of the BnHIR gene to stress and developmental signals, and suggests that the BnHIR gene plays an important role in these processes. Furthermore, in B. napus, there are more members in Groups 1 and 4 than in Groups 2 and 3, suggesting that the ancestral evolutionary branch of Group 1/4 has undergone more expansion than the other two evolutionary branches. BnPHB1.3, BnPHB1.5, and BnPHB1.7 corresponded to AtPHB1.2 and independently became Group 3 in the phylogenetic tree, and they were not divided into the same group with other BnPHBs (Figure 1). This may indicate that the HIR genes in B. napus have differentiated and performed different functions.
The expression pattern of HIR genes has been studied in several species. In maize, the expression pattern was classified into three groups, A, B, and C, based on the results of cluster analysis. The expression of HIR genes in Group A was higher in the embryo and stem. HIR genes in Group B may play an important role in seed development, while HIR genes in Group C may alter the development and senescence of maize [12]. In B. napus, BnPHB3.2 and BnPHB3.3 in Group 4 were also highly expressed in seeds and embryos, suggesting that HIR genes play a considerable role in embryo and seed development. In soybean, GmHIR1 is highly expressed in flower buds, while GmHIR2 is mainly expressed in globular embryos. The majority of the BnHIR genes are not active in buds, which may be due to the function degradation in B. napus. In the GmHIR15 and GmHIR16 gene pair, the expression of GmHIR15 in leaves increased to a higher level than that of GmHIR16. In the GmHIR14 and GmHIR17 gene pair, GmHIR14 was expressed in seeds, but GmHIR17 was not [38]. This is basically consistent with the function of the BnHIR genes. Furthermore, in tomato (Solanum lycopersicum L.), the expression pattern of tomato SlHIR genes is spatially specific; for example, SlPHB4 and SlPHB10 were expressed in root and flower tissues, respectively. SlPHB8 and SlPHB9 were highly expressed in 2 cm fruit, while the expression patterns of SlPHB5, SlPHB14, and SlPHB15 increased with the fruit development stages [35]. In our study, most members of the BnHIR2/3 and BnPHB2/3 subfamilies were highly expressed in seeds, seed coats, and embryos during seed development and siliques during maturation. HIR genes were highly expressed in seeds and siliques in several species, suggesting that these genes have important roles in seed development and maturation. Compared with other species, however, the HIR gene in B. napus appears to have lost its function in promoting root development and promoting flowering. After inoculation with S. sclerotiorum, the comparison of gene expression between the two materials found that the expression levels of 31 HIR genes were up-regulated at 48 h and 96 h (Figure S4c), while that of nine HIR genes were down-regulated (Figure S4d), suggesting that most of the HIR genes had a positive response to the induction of S. sclerotiorum.
Some studies have been conducted on the function and mechanism of the HIR gene. AtPHB3 and AtPHB4 are mainly expressed in shoot and proliferative root tissues, and overexpressed AtPHB3 and AtPHB4 exhibit an irregular leaf shape and extensive branching phenotype [39,40]. It has been reported that NbPHB1 and NbPHB2 are prominently reduced during plant senescence. This may be because HIR proteins interact directly or indirectly with mitochondrial DNA (mtDNA) at the molecular level to regulate reactive oxygen species’ (ROS) formation and oxidative phosphorylation (OXPHOS) [41,42,43,44]. HIR proteins may also be involved in the mitochondrial organization [45,46]. Athir2-1 and Athir3-1 mutants allow normal growth of Pto DC3000 AvrRpt2 but not Pto DC3000, and overexpression of AtHIR1 and AtHIR2 reduces Pto DC3000 growth [8]. In rice, overexpression of OsHIR1 could make plants more susceptible to hypersensitivity, resulting in a faster response to restrict the development of invading pathogens from the site of infection to otherwise healthy tissue [9]. Overexpression of CaHIR1 in pepper enhances basal resistance to infection by hemi-biotrophic bacteria or biotrophic oomycete pathogens [33]. Compared with Col-0, the lesion area of OV-BnHIR2.7 A. thaliana leaves was smaller, while Athir2.7-Mu A. thaliana leaves lesions expanded. These results indicate that when the expression level of BnHIR2.7 was low or silenced, plants could not effectively defend against S. sclerotiorum infection (Figure 6c). In addition, qRT-PCR results show that Col-0, OV-BnHIR2.7, and Athir2.7-Mu A. thaliana were prominently up-regulated after inoculation with S. sclerotiorum, suggesting that BnHIR2.7 responds to S. sclerotiorum. In addition to resistance to S. sclerotiorum, the A. thaliana Athir2.7-Mu and OV-BnHIR2.7 lines showed differences in biomass (Figure S3c) and silique size (Figure S3d) compared with Col-0. This may imply that BnHIR2.7 may be a potential gene with disease resistance and improved crop yield. In recent years, a series of investigations have been performed to study SD resistance in B. napus. Several transcription factors and kinases have been revealed to be associated with SD resistance signaling pathways, such as BnWRKY33 [47,48], BNWRKY 70 [49], and BnMPK3 [50]. In addition, rapid alkalinization factors (RALF), such as BnRALF10, induce multiple immune responses to exhibit resistance to S. sclerotiorum, including ROS accumulation, cytoplasmic Ca2+ promotion, and defense-related gene expression induction [51]. It has also been speculated that Phloem proteins (PP2s) can cross-link together through disulfide bonds to form high molecular weight polymers, which block the sieve to form a physical barrier to slow mycelial colonization [1]. As a potential gene family for disease resistance, HIR may be located upstream of SA- and MeJA-related pathways and inhibit the spread of S. sclerotiorum by promoting the accumulation of SA and H2O2 in the plant [14]. To clarify the possible mechanism of BnHIR2.7 disease resistance, we quantitatively analyzed the key genes of SA and MeJA pathways before and after S. sclerotiorum inoculation. qRT-PCR results showed that marker gene expressions in the SA and MeJA pathways were up-regulated, respectively, after heterologous overexpression of BnHIR2.7 Arabidopsis was inoculated with S. sclerotiorum (Figure S3a), suggesting that HIR responds to biotic stress through, but not dependent on, SA or JA pathways. Next, further experiments will reveal the mechanisms of BnHIR2.7 to S. sclerotiorum resistance.

5. Conclusions

In this study, 50 BnHIR genes were identified in the B. napus genome based on publicly available genomic data. The identified BnHIR genes were phylogenetically divided into four groups, and their evolutionary relationships were analyzed. Under normal growth conditions, the majority of the BnHIR genes in Group 1 and Group 4 were highly expressed in leaves, siliques, embryos, and seeds. The HIR gene in Group 2 was low or not expressed in the detected tissues. Except for BnPHB1.7, other genes of Group 3 had high expression levels in the detected tissues. Following inoculation with S. sclerotiorum, the majority of the HIR genes in Group 1 and Group 4 were up-regulated. BnHIR2.7 was barely expressed in the susceptible cultivars but highly expressed in resistant materials. We experimentally verified that overexpression of BnHIR2.7 could inhibit the growth of S. sclerotiorum. In addition, our study found the role of BnHIR2.7 in promoting silique, which also provides clues for further research. These results may suggest further functional characterization of the BnHIR gene family of great value, especially when considering genetic improvements for agronomic traits and S. sclerotiorum resistance in B. napus.

Supplementary Materials

The following supporting information can be downloaded at: https://www.mdpi.com/article/10.3390/horticulturae8100874/s1, Figure S1: Statistics of cis-acting elements in the BnHIR promoter region. Figure S2: Relative expression level of Arabidopsis transgenic lines. Figure S3: Phenotype comparison of wild type, Athir2.7-Mu, and OV-BnHIR2.7 lines. Figure S4: Venn diagram of changes in HIR gene expression under Sclerotinia sclerotiorum infection; Table S1: Primers used in this study.

Author Contributions

J.L. and K.L.: conceptualization, methodology, and funding acquisition; M.L. and Y.T.: performed the sampling and experiments, writing—original draft preparation; M.Y. and Y.F.: contributed to data analysis and interpretation; S.U.K., W.C. and S.W.: validation; X.L., L.W. and W.C.: software; C.Q.: supervision. K.L.: writing—reviewing and editing. All authors have read and agreed to the published version of the manuscript.

Funding

This work was supported by the National Natural Science Foundation of China [31871653 and 32272111 to K.L.], the Talent Project of Chongqing Natural Science Foundation [cstc2021ycjh-bgzxm0033 to K.L.], and Germplasm Creation Special Program of Southwest University.

Data Availability Statement

Not applicable.

Conflicts of Interest

The authors declare that the research was conducted in the absence of any commercial or financial relationships that could be construed as a potential conflict of interest.

Abbreviations

HIR: hypersensitive-induced response protein; SD, Sclerotinia disease; B. napus, Brassica napus; S. sclerotiorum, Sclerotinia sclerotiorum; A. thaliana: Arabidopsis thaliana; MS: Murashige and Skoog medium; PDA: Potato Dextrose Agar; qRT-PCR: quantitative real-time PCR; SPFH, stomatin/prohibitin/flotillin/HflK domain; JA, jasmonic acid; MeJA, methyl jasmonate; WGT, whole-genome triploidy; ROS, reactive oxygen species; SA, salicylic acid; RPS2, resistant to P. syringae 2; ABA, abscisic acid; GA, gibberellin; CDS, the coding sequence; BLASTP, basic local alignment search tool protein; pI, theoretical isoelectric point; MW, molecular weight; kDa, kilodalton; MUSCLE, multiple sequence comparison by log-expectation; MEME, Multiple EM for Motif Elicitation; ML, maximum likelihood; CTAB, cetyl trimethyl ammonium bromide; MIQE, Minimum Information for Publication of Quantitative Real-Time PCR experiments; ABRE, abscisic acid responsiveness; GARE, gibberellin responsiveness; Col-0, Columbia; WGT, whole-genome triploidization; B. rapa, Brassica rapa; B. oleracea, Brassica oleracea.

References

  1. Zuo, R.; Xie, M.; Gao, F.; Sumbal, W.; Cheng, X.; Liu, Y.; Bai, Z.; Liu, S. The Characterization of the Phloem Protein 2 Gene Family Associated with Resistance to Sclerotinia sclerotiorum in Brassica napus. Int. J. Mol. Sci. 2022, 23, 3934. [Google Scholar] [CrossRef]
  2. Ding, L.; Li, T.; Guo, X.; Li, M.; Liu, X.; Cao, J.; Tan, X. Sclerotinia Stem Rot Resistance in Rapeseed: Recent Progress and Future Prospects. J. Agric. Food Chem. 2021, 69, 2965–2978. [Google Scholar] [CrossRef]
  3. Nadimpalli, R.; Yalpani, N.; Johal, G.S.; Simmons, C.R. Prohibitins, Stomatins, and Plant Disease Response Genes Compose a Protein Superfamily That Controls Cell Proliferation, Ion Channel Regulation, and Death. J. Biol. Chem. 2000, 275, 29579–29586. [Google Scholar] [CrossRef] [PubMed]
  4. Atkinson, M.M.; Keppler, L.D.; Orlandi, E.W.; Baker, C.J.; Mischke, C.F. Involvement of Plasma-Membrane Calcium Influx in Bacterial Induction of the K+/H+ And Hypersensitive Responses in Tobacco. Plant Physiol. 1990, 92, 215–221. [Google Scholar] [CrossRef]
  5. Beers, E.P.; McDowell, J.M. Regulation and Execution of Programmed Cell Death in Response to Pathogens, Stress and Developmental Cues. Curr. Opin. Plant Biol. 2001, 4, 561–567. [Google Scholar] [CrossRef]
  6. Lam, E.; Kato, N.; Lawton, M. Programmed cell death, mitochondria and the plant hypersensitive response. Nature 2001, 411, 848–853. [Google Scholar] [CrossRef]
  7. Di, C.; Xu, W.; Su, Z.; Yuan, J.S. Comparative Genome Analysis of PHB Gene Family Reveals Deep Evolutionary Origins and Diverse Gene Function. BMC Bioinform. 2010, 11, S22. [Google Scholar] [CrossRef]
  8. Qi, Y.; Tsuda, K.; Nguyen, L.V.; Wang, X.; Lin, J.; Murphy, A.S.; Glazebrook, J.; Thordal-Christensen, H.; Katagiri, F. Physical Association of Arabidopsis Hypersensitive Induced Reaction Proteins (Hirs) with the Immune Receptor RPS2. J. Biol. Chem. 2011, 286, 31297–31307. [Google Scholar] [CrossRef]
  9. Zhou, L.; Cheung, M.Y.; Li, M.W.; Fu, Y.; Sun, Z.; Sun, S.M.; Lam, H.M. Rice Hypersensitive Induced Reaction Protein 1 (OsHIR1) Associates with Plasma Membrane and Triggers Hypersensitive Cell Death. BMC Plant Biol. 2010, 10, 290. [Google Scholar] [CrossRef]
  10. Duan, Y.; Guo, J.; Shi, X.; Guan, X.; Liu, F.; Bai, P.; Huang, L.; Kang, Z. Wheat Hypersensitive-Induced Reaction Genes Tahir1 and Tahir3 Are Involved in Response to Stripe Rust Fungus Infection and Abiotic Stresses. Plant Cell Rep. 2012, 32, 273–283. [Google Scholar] [CrossRef]
  11. Karrer, E.E.; Beachy, R.N.; Holt, C.A. Cloning of Tobacco Genes That Elicit the Hypersensitive Response. Plant Mol. Biol. 1998, 36, 681–690. [Google Scholar] [CrossRef] [PubMed]
  12. Wen, X.; Niu, T.; Kong, X. In Silico Analysis of PHB Gene Family in Maize. Plant Growth Regul. 2013, 73, 181–191. [Google Scholar] [CrossRef]
  13. Rostoks, N.; Schmierer, D.; Kudrna, D.; Kleinhofs, A. Barley Putative Hypersensitive Induced Reaction Genes: Genetic Mapping, Sequence Analyses and Differential Expression in Disease Lesion Mimic Mutants. Theor. Appl. Genet. 2003, 107, 1094–1101. [Google Scholar] [CrossRef]
  14. Jung, H.W.; Hwang, B.K. The Leucine-Rich Repeat (LRR) Protein, Calrr1, Interacts with the Hypersensitive Induced Reaction (HIR) Protein, Cahir1, and Suppresses Cell Death Induced by the Cahir1 Protein. Mol. Plant Pathol. 2007, 8, 503–514. [Google Scholar] [CrossRef]
  15. Chalhoub, B.; Denoeud, F.; Liu, S.; Parkin, I.A.P.; Tang, H.; Wang, X.; Chiquet, J.; Belcram, H.; Tong, C.; Samans, B.; et al. Early Allopolyploid Evolution in the Post-Neolithic Brassica napus Oilseed Genome. Science 2014, 345, 950–953. [Google Scholar] [CrossRef]
  16. Altschul, S.F.; Gish, W.; Miller, W.; Myers, E.W.; Lipman, D.J. Basic Local Alignment Search Tool. J. Mol. Biol. 1990, 215, 403–410. [Google Scholar] [CrossRef]
  17. Altschul, S.F.; Madden, T.L.; Schaffer, A.A.; Zhang, J.H.; Zhang, Z.; Miller, W.; Lipman, D.J. Gapped BLAST and PSI-BLAST: A New Generation of Protein Database Search Programs. Nucleic Acids Res. 1997, 25, 3389–3402. [Google Scholar] [CrossRef]
  18. Fan, Y.; Yu, M.; Liu, M.; Zhang, R.; Sun, W.; Qian, M.; Duan, H.; Chang, W.; Ma, J.; Qu, C.; et al. Genome-Wide Identification, Evolutionary and Expression Analyses of the GALACTINOL SYNTHASE Gene Family in Rapeseed and Tobacco. Int. J. Mol. Sci. 2017, 18, 2768. [Google Scholar] [CrossRef]
  19. Chou, K.C.; Shen, H.B. Plant-mPLoc: A Top-Down Strategy to Augment the Power for Predicting Plant Protein Subcellular Localization. PLoS ONE 2010, 5, e11335. [Google Scholar] [CrossRef]
  20. Edgar, R.C. MUSCLE: Multiple Sequence Alignment with High Accuracy and High Throughput. Nucleic Acids Res. 2004, 32, 1792–1797. [Google Scholar] [CrossRef] [Green Version]
  21. Guindon, S.; Dufayard, J.F.; Lefort, V.; Anisimova, M.; Hordijk, W.; Gascuel, O. New Algorithms and Methods to Estimate Maximum-Likelihood Phylogenies: Assessing the Performance of PhyML 3.0. Syst. Biol. 2010, 59, 307–321. [Google Scholar] [CrossRef] [PubMed]
  22. Lefort, V.; Longueville, J.E.; Gascuel, O. SMS: Smart Model Selection in PhyML. Mol. Biol. Evol. 2017, 34, 2422–2424. [Google Scholar] [CrossRef] [PubMed]
  23. Subramanian, B.; Gao, S.; Lercher, M.J.; Hu, S.; Chen, W.H. Evolview v3: A Webserver for Visualization, Annotation, and Management of Phylogenetic Trees. Nucleic Acids Res. 2019, 47, W270–W275. [Google Scholar] [CrossRef] [PubMed]
  24. Bailey, T.L.; Williams, N.; Misleh, C.; Li, W.W. MEME: Discovering and Analyzing DNA and Protein Sequence Motifs. Nucleic Acids Res. 2006, 34, W369–W373. [Google Scholar] [CrossRef] [PubMed]
  25. Chen, C.; Chen, H.; Zhang, Y.; Thomas, H.R.; Frank, M.H.; He, Y.; Xia, R. TBtools: An Integrative Toolkit Developed for Interactive Analyses of Big Biological Data. Mol. Plant. 2020, 13, 1194–1202. [Google Scholar] [CrossRef] [PubMed]
  26. Lescot, M.; Dehais, P.; Thijs, G.; Marchal, K.; Moreau, Y.; Van de Peer, Y.; Rouze, P.; Rombauts, S. PlantCARE, a Database of Plant Cis-Acting Regulatory Elements and a Portal to Tools for In Silico Analysis of Promoter Sequences. Nucleic Acids Res. 2002, 30, 325–327. [Google Scholar] [CrossRef]
  27. Chao, H.; Li, T.; Luo, C.; Huang, H.; Ruan, Y.; Li, X.; Niu, Y.; Fan, Y.; Sun, W.; Zhang, K.; et al. BrassicaEDB: A Gene Expression Database for Brassica Crops. Int. J. Mol. Sci. 2020, 21, 5831. [Google Scholar] [CrossRef]
  28. Abedi, A.; Hajiahmadi, Z.; Kordrostami, M.; Esmaeel, Q.; Jacquard, C. Analyses of Lysin-motif Receptor-like Kinase (LysM-RLK) Gene Family in Allotetraploid Brassica napus L. and Its Progenitor Species: An In Silico Study. Cells 2021, 11, 37. [Google Scholar] [CrossRef]
  29. Porebski, S.; Bailey, L.G.; Baum, B.R. Modification of a CTAB DNA Extraction Protocol for Plants Containing High Polysaccharide and Polyphenol Components. Plant Mol. Biol. Rep. 1997, 15, 8–15. [Google Scholar] [CrossRef]
  30. Schmidt, R.; Willmitzer, L. High Efficiency Agrobacterium tumefaciens-Mediated-Transformation of Arabidopsis thaliana Leaf and Cotyledon Explants. Plant Cell Rep. 1988, 7, 583–586. [Google Scholar] [CrossRef]
  31. Lu, K.; Li, T.; He, J.; Chang, W.; Zhang, R.; Liu, M.; Yu, M.; Fan, Y.; Ma, J.; Sun, W.; et al. qPrimerDB: A Thermodynamics-Based Gene-Specific Qrt-PCR Primer Database for 147 Organisms. Nucleic Acids Res. 2018, 46, D1229–D1236. [Google Scholar] [CrossRef] [PubMed]
  32. Bustin, S.A.; Benes, V.; Garson, J.A.; Hellemans, J.; Huggett, J.; Kubista, M.; Mueller, R.; Nolan, T.; Pfaffl, M.W.; Shipley, G.L.; et al. The MIQE Guidelines: Minimum Information for Publication of Quantitative Real-Time PCR Experiments. Clin. Chem. 2009, 55, 611–622. [Google Scholar] [CrossRef] [PubMed]
  33. Wu, G.; Zhang, L.; Wu, Y.; Cao, Y.; Lu, C. Comparison of Five Endogenous Reference Genes for Specific PCR Detection and Quantification of Brassica napus. J. Agric. Food Chem. 2010, 58, 2812–2817. [Google Scholar] [CrossRef] [PubMed]
  34. Swift, M.L. GraphPad Prism, Data Analysis, and Scientific Graphing. J. Chem. Inf. Comput. Sci. 1997, 37, 411–412. [Google Scholar] [CrossRef]
  35. Jung, H.W.; Lim, C.W.; Lee, S.C.; Choi, H.W.; Hwang, C.H.; Hwang, B.K. Distinct Roles of the Pepper Hypersensitive Induced Reaction Protein Gene Cahir1 in Disease and Osmotic Stress, as Determined by Comparative Transcriptome and Proteome Analyses. Planta 2008, 227, 409–425. [Google Scholar] [CrossRef]
  36. Morrow, I.C.; Parton, R.G. Flotillins and the PHB Domain Protein Family: Rafts, Worms and Anaesthetics. Traffic 2005, 6, 725–740. [Google Scholar] [CrossRef]
  37. Huang, F.; Ye, X.; Wang, Z.; Ding, Y.; Cai, X.; Yu, L.; Waseem, M.; Abbas, F.; Ashraf, U.; Chen, X.; et al. The prohibitins (PHB) Gene Family in Tomato: Bioinformatic Identification and Expression Analysis Under Abiotic and Phytohormone Stresses. GM Crop. Food 2021, 12, 535–550. [Google Scholar] [CrossRef]
  38. Song, M.; Peng, X.; Du, C.; Lei, L.; Zhang, T.; Xiang, Y. Genome-Wide Analysis of the PHB Gene Family in Glycine max (L.). Merr. Genes Genom. 2017, 39, 1095–1106. [Google Scholar] [CrossRef]
  39. Van Aken, O.; Pečenková, T.; van de Cotte, B.; De Rycke, R.; Eeckhout, D.; Fromm, H.; De Jaeger, G.; Witters, E.; Beemster, G.T.; Inzé, D.; et al. Mitochondrial Type-I Prohibitins of Arabidopsis thaliana are required for Supporting Proficient Meristem Development. Plant J. 2007, 52, 850–864. [Google Scholar] [CrossRef]
  40. Wang, Y.; Ries, A.; Wu, K.; Yang, A.; Crawford, N.M. The Arabidopsis prohibitin Gene PHB3 Functions in Nitric Oxide-Mediated Responses and in Hydrogen Peroxide-Induced Nitric Oxide Accumulation. Plant Cell 2010, 22, 249–259. [Google Scholar] [CrossRef] [Green Version]
  41. Artal-Sanz, M.; Tsang, W.Y.; Willems, E.M.; Grivell, L.A.; Lemire, B.D.; van der Spek, H.; Nijtmans, L.G. The Mitochondrial Prohibitin Complex Is Essential for Embryonic Viability and Germline Function in Caenorhabditis elegans. J. Biol. Chem. 2003, 278, 32091–32099. [Google Scholar] [CrossRef]
  42. Chen, J.C.; Jiang, C.Z.; Reid, M.S. Silencing a Prohibitin Alters Plant Development and Senescence. Plant J. 2005, 44, 16–24. [Google Scholar] [CrossRef]
  43. Ahn, C.S.; Lee, J.H.; Reum Hwang, A.; Kim, W.T.; Pai, H.S. Prohibitin is Involved in Mitochondrial Biogenesis in Plants. Plant J. 2006, 46, 658–667. [Google Scholar] [CrossRef]
  44. Artal-Sanz, M.; Tavernarakis, N. Prohibitin Couples Diapause Signalling to Mitochondrial Metabolism During Ageing in C. elegans. Nature 2009, 461, 793–797. [Google Scholar] [CrossRef]
  45. Merkwirth, C.; Langer, T. Prohibitin Function Within Mitochondria: Essential Roles for Cell Proliferation and Cristae Morphogenesis. Biochim. Biophys. Acta 2009, 1793, 27–32. [Google Scholar] [CrossRef]
  46. Merkwirth, C.; Dargazanli, S.; Tatsuta, T.; Geimer, S.; Löwer, B.; Wunderlich, F.T.; von Kleist-Retzow, J.C.; Waisman, A.; Westermann, B.; Langer, T. Prohibitins Control Cell Proliferation and Apoptosis by Regulating OPA1-Dependent Cristae Morphogenesis in Mitochondria. Genes 2008, 22, 476–488. [Google Scholar] [CrossRef]
  47. Wang, Z.; Fang, H.; Chen, Y.; Chen, K.; Li, G.; Gu, S.; Tan, X. Overexpression of BnWRKY33 in Oilseed Rape Enhances Resistance to Sclerotinia sclerotiorum. Mol. Plant Pathol. 2015, 15, 677–689. [Google Scholar] [CrossRef]
  48. Hu, H.; Tang, Y.; Wu, J.; Chen, F.; Yang, Y.; Pan, X.; Dong, X.; Jin, X.; Liu, S.; Du, X. Brassica napus Mediator Subunit16 Induces BnMED25- and BnWRKY33-Activated Defense Signaling to Confer Sclerotinia sclerotiorum Resistance. Front. Plant Sci. 2021, 12, 663536. [Google Scholar] [CrossRef]
  49. Sun, Q.; Lin, L.; Liu, D.; Wu, D.; Fang, Y.; Wu, J.; Wang, Y. CRISPR/Cas9-Mediated Multiplex Genome Editing of the BnWRKY11 and BnWRKY70 Genes in Brassica napus L. Int. J. Mol. Sci. 2018, 19, 2716. [Google Scholar] [CrossRef]
  50. Wang, Z.; Bao, L.; Zhao, F.; Tang, M.; Chen, T.; Li, Y.; Wang, B.; Fu, B.; Fang, H.; Li, G.; et al. BnaMPK3 Is a Key Regulator of Defense Responses to the Devastating Plant Pathogen Sclerotinia sclerotiorum in Oilseed Rape. Front. Plant Sci. 2019, 10, 91. [Google Scholar] [CrossRef]
  51. He, Y.; Zhang, Z.; Xu, Y.; Chen, S.; Cai, X. Genome-Wide Identification of Rapid Alkalinization Factor Family in Brassica napus and Functional Analysis of BnRALF10 in Immunity to Sclerotinia sclerotiorum. Front. Plant Sci. 2022, 3, 877404. [Google Scholar] [CrossRef]
Figure 1. Phylogenetic relationship of HIR proteins between A. thaliana and B. napus. The ML tree was generated with bootstrap analysis (100 replicates) using the online PhyML server. The tree was visualized by Evolview V3. HIR proteins in the phylogenetic tree clustered into four groups (Groups 1–4). At: A. thaliana; Bn: B. napus.
Horticulturae 08 00874 g001
Figure 2. Gene structure and conserved motifs of HIR members in A. thaliana and B. napus. (a) Gene structure is displayed using the Gene Structure Display Server (GSDS 2.0), exons and introns are shown by green boxes and black lines, respectively, and the untranslated regions (UTRs) are indicated by yellow boxes. (b) Conserved motifs are identified MEME and represented by differently colored boxes.
Horticulturae 08 00874 g002
Figure 3. Cis-acting elements in the promoter region of BnHIR genes. Cis-acting elements in promoter regions were predicted using PlantCARE (http://bioinformatics.psb.ugent.be/webtools/plantcare/html/, accessed on 17 March 2022) and plotted using R package tidyverse. All cis-acting elements are grouped into four categories and marked with different colored boxes. The red star represents the target gene for subsequent functional verification.
Horticulturae 08 00874 g003
Figure 4. Expression patterns of BnHIR genes in different tissues. (a) Expression patterns of HIR genes in Group 1. (b) Expression patterns of HIR genes in Group 2. (c) Expression patterns of HIR genes in Group 3. (d) Expression patterns of HIR genes in Group 4. The blue-to-red color bar on the right represents log2-transformed expression values, with blue indicating little or no expression and red indicating high expression. Expression data were obtained from the BrassicaEDB database (https://biodb.swu.edu.cn/brassica/, accessed on 13 February 2022), and expression levels of BnHIRs were normalized by log2(FPKM + 1). Complete tissue names are listed in Materials and Methods. The red star represents the target gene for subsequent functional verification.
Horticulturae 08 00874 g004
Figure 5. Expression patterns of BnHIR genes under S. sclerotiorum induction. (a) Expression patterns of HIR genes in Group 1. (b) Expression patterns of HIR genes in Group 2. (c) Expression patterns of HIR genes in Group 3 (d) Expression patterns of HIR genes in Group 4. The blue-to-red color bar on the right represents the normalized expression value, and expression levels of BnHIRs were normalized by log2(FPKM + 1). Expression data were retrieved from the NCBI SRA database (PRJNA274853). The red star represents the target gene for subsequent functional verification.
Horticulturae 08 00874 g005
Figure 6. Expression patterns of BnHIR subgroup genes induced by S. sclerotiorum. (a) Expression of Col-0, Athir-Mu, OV-BnHIR2.7 at 24 and 36 h after S. sclerotiorum infection. (b) Col-0, Athir-Mu, OV-BnHIR2.7 trypan blue staining (image scale 2000 μm). (c) Col-0, Athir-Mu, and OV-BnHIR2.7 leaves at 24 and 36 h after inoculation with S. sclerotiorum. (d) The statistics of the infected area of Col-0, Athir-Mu, OV-BnHIR2.7 at 24 and 36 h after inoculation with S. sclerotiorum. Note: ** indicates significant difference at level of p < 0.01; *** indicates significant difference at level of p < 0.001.
Horticulturae 08 00874 g006
Table 1. Physical and chemical properties of HIR proteins in B. napus.
Gene NameGene IDHomologs in
A. thaliana
Amino
Acids
MW (kDa) apI bSubcellular
Localization
BnHIR5.1BnaA02g32070DAT5G2526046951,982.355.57Nucleus
BnHIR5.2BnaA02g32090DAT5G2526046851,756.075.42Nucleus
BnHIR5.3BnaC02g40750DAT5G2526046751,708.935.40Nucleus
BnHIR6.1BnaA02g34440DAT5G6487046951,663.186.12Nucleus
BnHIR6.2BnaA06g23810DAT5G6487047051,848.365.95Nucleus
BnHIR6.3BnaA07g33580DAT5G6487046751,499.116.60Nucleus
BnHIR6.4BnaC03g49410DAT5G6487047051,853.335.88Nucleus
BnHIR6.5BnaC06g38190DAT5G6487046951,551.086.39Nucleus
BnHIR6.6BnaCnng58920DAT5G6487034537,805.166.13Nucleus
BnHIR1BnaC09g53100DAT5G6274022725,972.594.99Chloroplast, Nucleus
BnHIR2.1BnaA02g35710DAT1G6984028531,218.545.49Mitochondrion
BnHIR2.2BnaA03g27520DAT3G0129028631,610.325.89Mitochondrion
BnHIR2.3BnaA05g34000DAT3G0129028631,529.246.01Mitochondrion
BnHIR2.4BnaA07g28360DAT1G6984028631,316.545.27Mitochondrion
BnHIR2.5BnaC03g32530DAT3G0129028631,610.325.89Mitochondrion
BnHIR2.6BnaC05g48690DAT3G0129028631,529.246.01Mitochondrion
BnHIR2.7BnaC06g30890DAT1G6984028631,316.545.27Mitochondrion
BnHIR2.8BnaCnng44030DAT1G6984028531,087.345.35Mitochondrion
BnHIR3.1BnaA03g13070DAT5G5157029232,465.115.28Mitochondrion
BnHIR3.2BnaC03g15940DAT5G5157029232,366.025.38Mitochondrion
BnPHB1.1BnaA01g08360DAT4G2851029032,048.989.45Mitochondrion
BnPHB1.2BnaA08g13690DAT4G2851024227,374.508.69Mitochondrion
BnPHB1.3BnaA09g19330DAT2G0351036141,160.825.44Mitochondrion
BnPHB1.4BnaC01g09910DAT4G2851029032,048.989.45Mitochondrion
BnPHB1.5BnaC02g47990DAT2G0351034739,719.466.10Mitochondrion
BnPHB1.6BnaC08g13090DAT4G2851026028,591.949.06Mitochondrion
BnPHB1.7BnaC09g21530DAT2G0351035840,821.525.56Mitochondrion
BnPHB2.1BnaA08g27620DAT1G0386028831,909.779.37Mitochondrion
BnPHB2.2BnaA09g50790DAT1G0386028832,033.879.39Mitochondrion
BnPHB2.3BnaA10g02220DAT1G0386028831,923.749.35Mitochondrion
BnPHB2.4BnaC05g02140DAT1G0386028831,908.689.37Mitochondrion
BnPHB2.5BnaC08g00370DAT1G0386030634,181.589.55Mitochondrion
BnPHB2.6BnaC08g43560DAT1G0386028831,991.839.37Mitochondrion
BnPHB3.1BnaA04g10580DAT5G4077027730,481.017.94Mitochondrion
BnPHB3.2BnaA07g15170DAT5G4077027730,446.997.94Mitochondrion
BnPHB3.3BnaC04g32860DAT5G4077027730,481.017.94Mitochondrion
BnPHB3.4BnaC06g13200DAT5G4077027730,481.017.94Mitochondrion
BnPHB4.1BnaA06g32230DAT3G2728027830,372.776.94Mitochondrion
BnPHB4.2BnaA09g01960DAT3G2728027830,330.696.94Mitochondrion
BnPHB4.3BnaC07g24140DAT3G2728027830,367.756.99Mitochondrion
BnPHB4.4BnaC09g01400DAT3G2728027830,330.696.94Mitochondrion
BnHIR7.1BnaA01g16560DAT4G2758539543,279.166.30Mitochondrion
BnHIR7.2BnaA02g09860DAT4G2758540443,570.069.05Mitochondrion
BnHIR7.3BnaA02g09870DAT4G2758553558,018.045.71Nucleus
BnHIR7.4BnaA03g12010DAT4G2758542045,807.708.50Mitochondrion
BnHIR7.5BnaA10g07200DAT4G2758536439,713.448.89Mitochondrion
BnHIR7.6BnaC01g20150DAT4G2758539843,625.716.74Mitochondrion
BnHIR7.7BnaC02g13810DAT4G2758537840,677.629.13Nucleus
BnHIR7.8BnaC03g14740DAT4G2758535939,006.849.02Mitochondrion
BnHIR7.9BnaC02g13820DAT4G2758552857,171.015.67Mitochondrion
a MW, molecular weight; b pI, isoelectric point.
Publisher’s Note: MDPI stays neutral with regard to jurisdictional claims in published maps and institutional affiliations.

