Article

Investigating the Molecular Mechanisms of Pepper Fruit Tolerance to Storage via Transcriptomics and Metabolomics

Engineering Research Center of Education Ministry for Germplasm Innovation and Breeding New Varieties of Horticultural Crops, College of Horticulture, Hunan Agricultural University, Changsha 410128, China
*
Author to whom correspondence should be addressed.
Horticulturae 2021, 7(8), 242; https://doi.org/10.3390/horticulturae7080242
Submission received: 16 July 2021 / Revised: 2 August 2021 / Accepted: 9 August 2021 / Published: 12 August 2021
(This article belongs to the Collection Postharvest Handling of Horticultural Crops)

Abstract

:
Pepper is one of the most important vegetable crops in China and has high economic value. However, the pepper fruit is easily softened and spoiled after harvest, which seriously affects its flavor, transportation, and economic value. In this study, we used pepper lines with different levels of storage resistance, A144 and A361, and performed physiological examination, transcriptomics, and metabolomics on them at 0 and 3 days after harvest in order to analyze their gene expression patterns and molecular regulatory mechanisms for storage tolerance. A total of 23,477 genes and 985 metabolites were identified. After comparing and analyzing each sample, we identified 7829 differentially expressed genes and 296 differential metabolites. We found that the genes such as ethylene-responsive transcriptional factor (ERFs), polygalacturonase (PG), cellulose synthase (CESA), abscisic acid insensitive (ABI), protein kinase 2 (SnRK2), and protein phosphatase 2C (PP2C) and metabolites such as phenylalanine and glycyl-tyrosine were differentially expressed between different storage times in the two materials. Through GO and KEGG enrichment analysis, we found that the differential genes were mainly enriched in carbohydrate metabolism, small molecule metabolism, and plant hormone signal transduction, and the differential metabolites were mainly enriched in flavonoid biosynthesis, glutathione metabolism, and cysteine and methionine metabolism pathways. This study provides a scientific basis for investigating the molecular mechanisms of storage tolerance and developing new pepper varieties with improved storage resistance.

1. Introduction

Pepper (Capsicum annuum L.) is a vegetable crop belonging to the Solanaceae Capsicum genus. It is widely cultivated in the world and is the world’s largest seasoning crop [1]. China is a major pepper planting country, with an average pepper planting area of 1.33 million hectares and a total economic value of 70 billion yuan, ranking first among all vegetables and accounting for 16.67% of the world’s total vegetable production value. Pepper fruit can synthesize and accumulate capsaicin, fragrance, pigments (anthocyanins and carotenoids), and various vitamins such as vitamins C and E; thus, it is considered a good nutrition source with great economic value [2]. Pepper can be eaten fresh or used for food processing. The harvested fruits are not resistant to storage at room temperature or high temperature; under these conditions, the fruits are perishable and deteriorate, and the hardness and nutrient content of the fruits also decrease. Moreover, pepper thrives in a warm climate and is mainly marketed in summer and autumn. Storage at high temperature often causes rapid respiration of pepper fruit, fruit rot, gray mold and black spot, leading to pepper deterioration, weight loss, and serious economic losses [3]. Therefore, proper storage and transportation of peppers can not only adjust the contradiction between production and market sale, but also extend its supply period, which can greatly increase the variety of vegetables and meet market demand.
The hardness of the fruit is an important indicator of fruit maturity and quality. In general, as the maturity increases, the hardness gradually decreases, which also affects the fruit quality. Studies have shown that the changes in cell wall structure are closely related to the ripening and softening of the fruit. The destruction of the internal structure of the cell wall is the major reason for fruit softening. The dissociation of the intercellular cell wall layer, the degradation of pectin, and the disintegration of fibrous materials lead to successive disintegration and destruction of cell organelles [4,5,6]. In addition, the differential expression of related genes is also an important factor affecting fruit softening. Montgomery’s study found that the expression of tomato PG gene gradually increased with the increase in ethylene production during the fruit ripening [7]. PG-mediated decomposition of pectin was also reported in melon fruits, and three PG cDNAs were obtained: MPG1, MPG2, and MPG3. MPG1 and MPG2 are related to the PG in senescent peach and tomato, and MPG3 is related to tomato fruit PG [8]. The PEL gene in strawberry has a regulatory effect on fruit ripening and softening in the later stage of strawberry development. It has been shown that the PEL gene is a candidate gene for improving strawberry fruit hardness and delaying fruit ripening and softening [9]. There are 6 β-Gal genes in tomato fruits expressed during fruit ripening and softening [10]. In apples, β-Gal gene expression increases as the fruit softens [11].
In recent years, transcriptomics and metabolomics technologies have been widely used in fruit studies, and transcriptome sequencing is the fastest growing technology [12]. Up to now, many studies have used transcriptomics to examine the genetic changes during fruit development and postharvest softening. Guo et al. [13] used transcriptomics to analyze the texture of watermelon fruits at different growth stages and identified a large number of differentially expressed genes that can regulate fruit texture, such as Cx and PME genes. Dessireé et al. [14] identified four genes related to papaya softening, including Gal, endoxylanase gene, PE, and EXP. Metabolomics has also been widely used in the study of fruit ripening and postharvest storage. Osorio et al. [15] used metabolomics and transcriptional analysis to study the postharvest physiology of tomato fruits; they found that dfd gene mutation could delay fruit maturity and softening. Tietel et al. [16] used metabolomics based on gas chromatography–mass spectrometry (GC-MS) to analyze the flavor substances of citrus fruits after anaerobic treatment; they found that the substances that caused the peculiar smell of citrus fruits not only included the well-known ethanol and acetaldehyde, but also included the derivatives of fatty acids and amino acids, such as ethyl esters. However, so far, there are relatively few studies using transcriptomics and metabolomics to investigate the changes in pepper fruit hardness and storage tolerance. Therefore, in order to clarify the molecular mechanisms regulating pepper storage tolerance, this study aimed to perform transcriptomics and metabolomics on two pepper lines with different levels of storage tolerance and investigate the genes and metabolites related to pepper storage tolerance. Our results provide a scientific basis for the improvement of pepper storage tolerance and the cultivation of new storable pepper varieties.

2. Materials and Methods

2.1. Plant Growth and Sampling

Two pepper (Capsicum annuum L.) lines with different levels of storage resistance, ‘A144’ (resistant to storage, named A below) and ‘A361’ (nonresistant to storage, named B), provided by the pepper department of the College of Horticulture, Hunan Agricultural University, were used as test materials. The test pepper seeds were cultivated in plugs after germinating. During the five-leaf and one-heart period, the seedlings with strong and consistent growth were selected and planted in the greenhouse of the Yun Yuan Base of Hunan Agricultural University. During the plant growth period, regular water and fertilizer management were applied. At 50 days after the self-pollination of two pepper materials, 6 red ripe fruits were harvested from 6 different plants of each line, and the harvest fruits were evenly divided into two groups. For one group, the hardness of the A144 (A1) and A361 (B1) pepper fruits was measured immediately after harvest (0d), and then the fruits were further cut into three equal parts: two parts were snap-frozen with liquid nitrogen and stored at −80 °C for transcriptomics and metabolomics analysis, and the remaining one was used for physiological index measurement. The other group of A144 (A2) and A361 (B2) pepper fruits was placed in a 30 °C incubator for 3 days after harvest, and the fruit hardness was measured and cut into three equal parts: two were snap-frozen with liquid nitrogen and stored at −80 °C for transcriptomics and metabolomics analysis, and the remaining one was used for physiological index measurement. Three biological replicates were performed in each treatment.

2.2. Determination of Fruit Hardness

Three fruits from each pepper line were selected on the day of harvest (0d) and at 3 days after 30 °C incubation. GY-4 hardness tester (Top Cloud-agriculture, Beijing, China) was used to measure the hardness at the largest fruit diameter, and the averaged value from 3 fruits was calculated.

2.3. Determination of Physiological Indexes Related to Storage

PG activity was assayed spectrophotometrically following derivatization of the reaction product with UV-absorbing 2-cyanoacetamide [17]. For the determination of soluble sugar content, 1 mL distilled water was added to about 0.1 g fruit tissue, which was ground into homogenate. For the determination of the cellulose content, 1 mL of 80% ethanol was added to about 0.3 g of fruit tissue, which was ground into a homogenate. Anthrone colorimetry was used in the follow-up experiment [18]. Before the determination of hemicellulose content, the sample was dried naturally or dried in an oven to constant weight. After the full grinding with a mortar, the appropriate powder was screened with a 30–50 mesh sieve. A sample of about 5 mg sample was taken for the follow-up experiment (Beijing Solarbio & Technology Co., Beijing, China). For the determination of soluble pectin content, 80% ethanol was added to about 0.1 g fruit tissue, which was ground into homogenate. The method of Zhang et al. [19] was used in the follow-up experiment.

2.4. Observation of Fruit Tissue Structure

The conventional paraffin section method [20] was used to make tissue sections. After harvesting, the fruit was fixed with 70% FAA fixative, dehydrated by alcohol gradient, embedded in paraffin, and stained with Safranine O-Fast Green to observe the cell wall structure.

2.5. RNA Extraction, Library Preparation, and Sequencing

Total RNA was extracted from plant tissues using TRI Reagent (Sigma Life Science, St Louis, MO, USA) following the manufacturer’s instructions. RNA quality was checked by RNase-free agarose gel electrophoresis to avoid possible degradation and contamination and then verified using Agilent 2100 Bio-analyzer (Agilent Technologies, Santa Clara, CA, USA). Next, poly (A) mRNA was isolated using oligo-dT beads (Qiagen, Germany) and then fragmented into short pieces by adding fragmentation buffer. First-strand cDNA was synthesized using random hexamer-primed reverse transcription, followed by the synthesis of second-strand cDNA using RNase H and DNA polymerase I. The cDNA fragments were purified using a QIA quick PCR extraction kit and then washed with EB buffer for end reparation poly (A) addition and ligated to sequencing adapters. Following agarose gel electrophoresis and extraction of cDNA from gels, the cDNA fragments were purified and enriched by PCR to construct the final cDNA library, which was then sequenced on the Illumina sequencing platform (Illumina-nova6000) using the paired-end technology. Three biological replicates were performed for each line, and six DGE libraries were generated and sequenced.

2.6. Transcriptome Analysis

Raw reads were filtered through Perl program to remove low-quality sequences (more than 50% bases with quality lower than 20 in one sequence), reads with more than 5% N bases (unknown bases), and reads containing adaptor sequences. Then, the clean reads were mapped to the pepper reference genome using TopHat2, allowing up to one mismatch. The DEGs were identified using the R package edge R. The expression level of each gene was calculated and normalized to FPKM. The FDR was used to determine the threshold of the p-value in multiple tests. In our study, the FDR < 0.05 and fold change > 2 were used as significance cut-offs for differential gene expression. The DEGs were used for GO and KEGG enrichment analyses. GO terms with corrected p-value < 0.05 and KEGG pathways with p-value < 0.05 were considered as significantly enriched terms.

2.7. Metabolite Extraction

Plant tissues (100 mg) were individually grounded with liquid nitrogen, and the homogenate was resuspended with prechilled 80% methanol and 0.1% formic acid by vortexing well. The samples were incubated on ice for 5 min and then centrifuged at 15,000× g and 4 °C for 20 min. The supernatant was diluted to a final concentration containing 53% methanol by LC-MS-grade water. The samples were subsequently transferred to a fresh Eppendorf tube and centrifuged at 15,000× g and 4 °C for 20 min. Finally, the supernatant was injected into the LC-MS/MS system for analysis [21].

2.8. HPLC-MS/MS Analysis

LC-MS/MS analyses were performed using an Exion LC AD system (SCIEX) coupled with a QTRAP6500+ mass spectrometer (SCIEX) by Novogene Co., Ltd. (Beijing, China). Samples were injected onto an X select HSS T3 (2.1 × 150 mm, 2.5 μm) using a 20 min linear gradient at a flow rate of 0.4 mL/min for the positive/negative polarity mode. The eluents were eluent A (0.1% formic acid–water) and eluent B (0.1% formic acid–acetonitrile) [22]. The solvent gradient was set as follows: 2% B, 2 min; 2–100% B, 15.0 min; 100% B, 17.0 min; 100–2% B, 17.1 min; 2% B, 20 min. QTRAP 6500+ mass spectrometer was operated in positive polarity mode with 35 psi curtain gas, medium collision gas, ion spray voltage of 5500 V, temperature of 550 °C, ion source gas 1:60, and ion source gas 2:60. QTRAP 6500+ mass spectrometer was operated in negative polarity mode with 35 psi curtain gas, medium collision gas, ion spray voltage of −4500 V, temperature of 550 °C, ion source gas 1:60, and ion source gas 2:60.

2.9. Data Analysis

2.9.1. Physiological Data Analysis

SPSS 17.0 was used to conduct one-way analysis of variance (ANOVA). LSD and Duncan’s method were used for pairwise comparisons. p < 0.05 was considered statistically significant.

2.9.2. Metabolite Data Analysis

The metabolites were annotated using the KEGG database (http://www.genome. jp/kegg/, accessed on 30 May 2021), HMDB database (http://www.hmdb.ca/, accessed on 30 May 2021), and LIPID MAPS database (http://www.lipidmaps.org/, accessed on 30 May 2021). Principal components analysis (PCA) and partial least squares discriminant analysis (PLS-DA) were performed by metaX (a flexible and comprehensive software for processing metabolomics data). We applied univariate analysis (t-test) to calculate the statistical significance (p-value). The metabolites with VIP > 1, p-value < 0.05, fold change ≥ 2, or FC ≤ 0.5 were considered to be differential metabolites. ggplot2 in R was used to plot volcano plots and filter the metabolites of interest based on log2(FC) and −log10(p-value) of metabolites. For clustering heatmaps, the data were normalized using z-scores of intensity areas and plotted by p heatmap package in R. The correlation between differential metabolites were analyzed by cor () in R (method = Pearson). The statistical significance of the correlation was calculated by cor. Mtest () in R. p-value < 0.05 was considered as statistically significant, and correlation plots were plotted by corr plot package in R. The functions of these metabolites and metabolic pathways were analyzed using the KEGG database. The metabolic pathways enriched with differential metabolites were identified with the condition x/n > y/N; when p-value < 0.05, the metabolic pathway was considered as a significantly enriched pathway.

2.10. Quantitative Real-Time PCR

qRT-PCR was conducted as described in Osorio et al. [23]. Three replicates were conducted for each sample. Cp actin gene was used as the internal control. Primers used in the study are listed in Table S1. The relative gene expression levels were normalized using the 2 (-Delta Delta C(T)) method [24].

2.11. Registration Number

The RNA-seq data generated in this study can be obtained from SRA archives (http://www.ncbi.nlm.nih.gov/sra, accessed on 30 May 2021). Registration number: PRAJNA722115.

3. Results

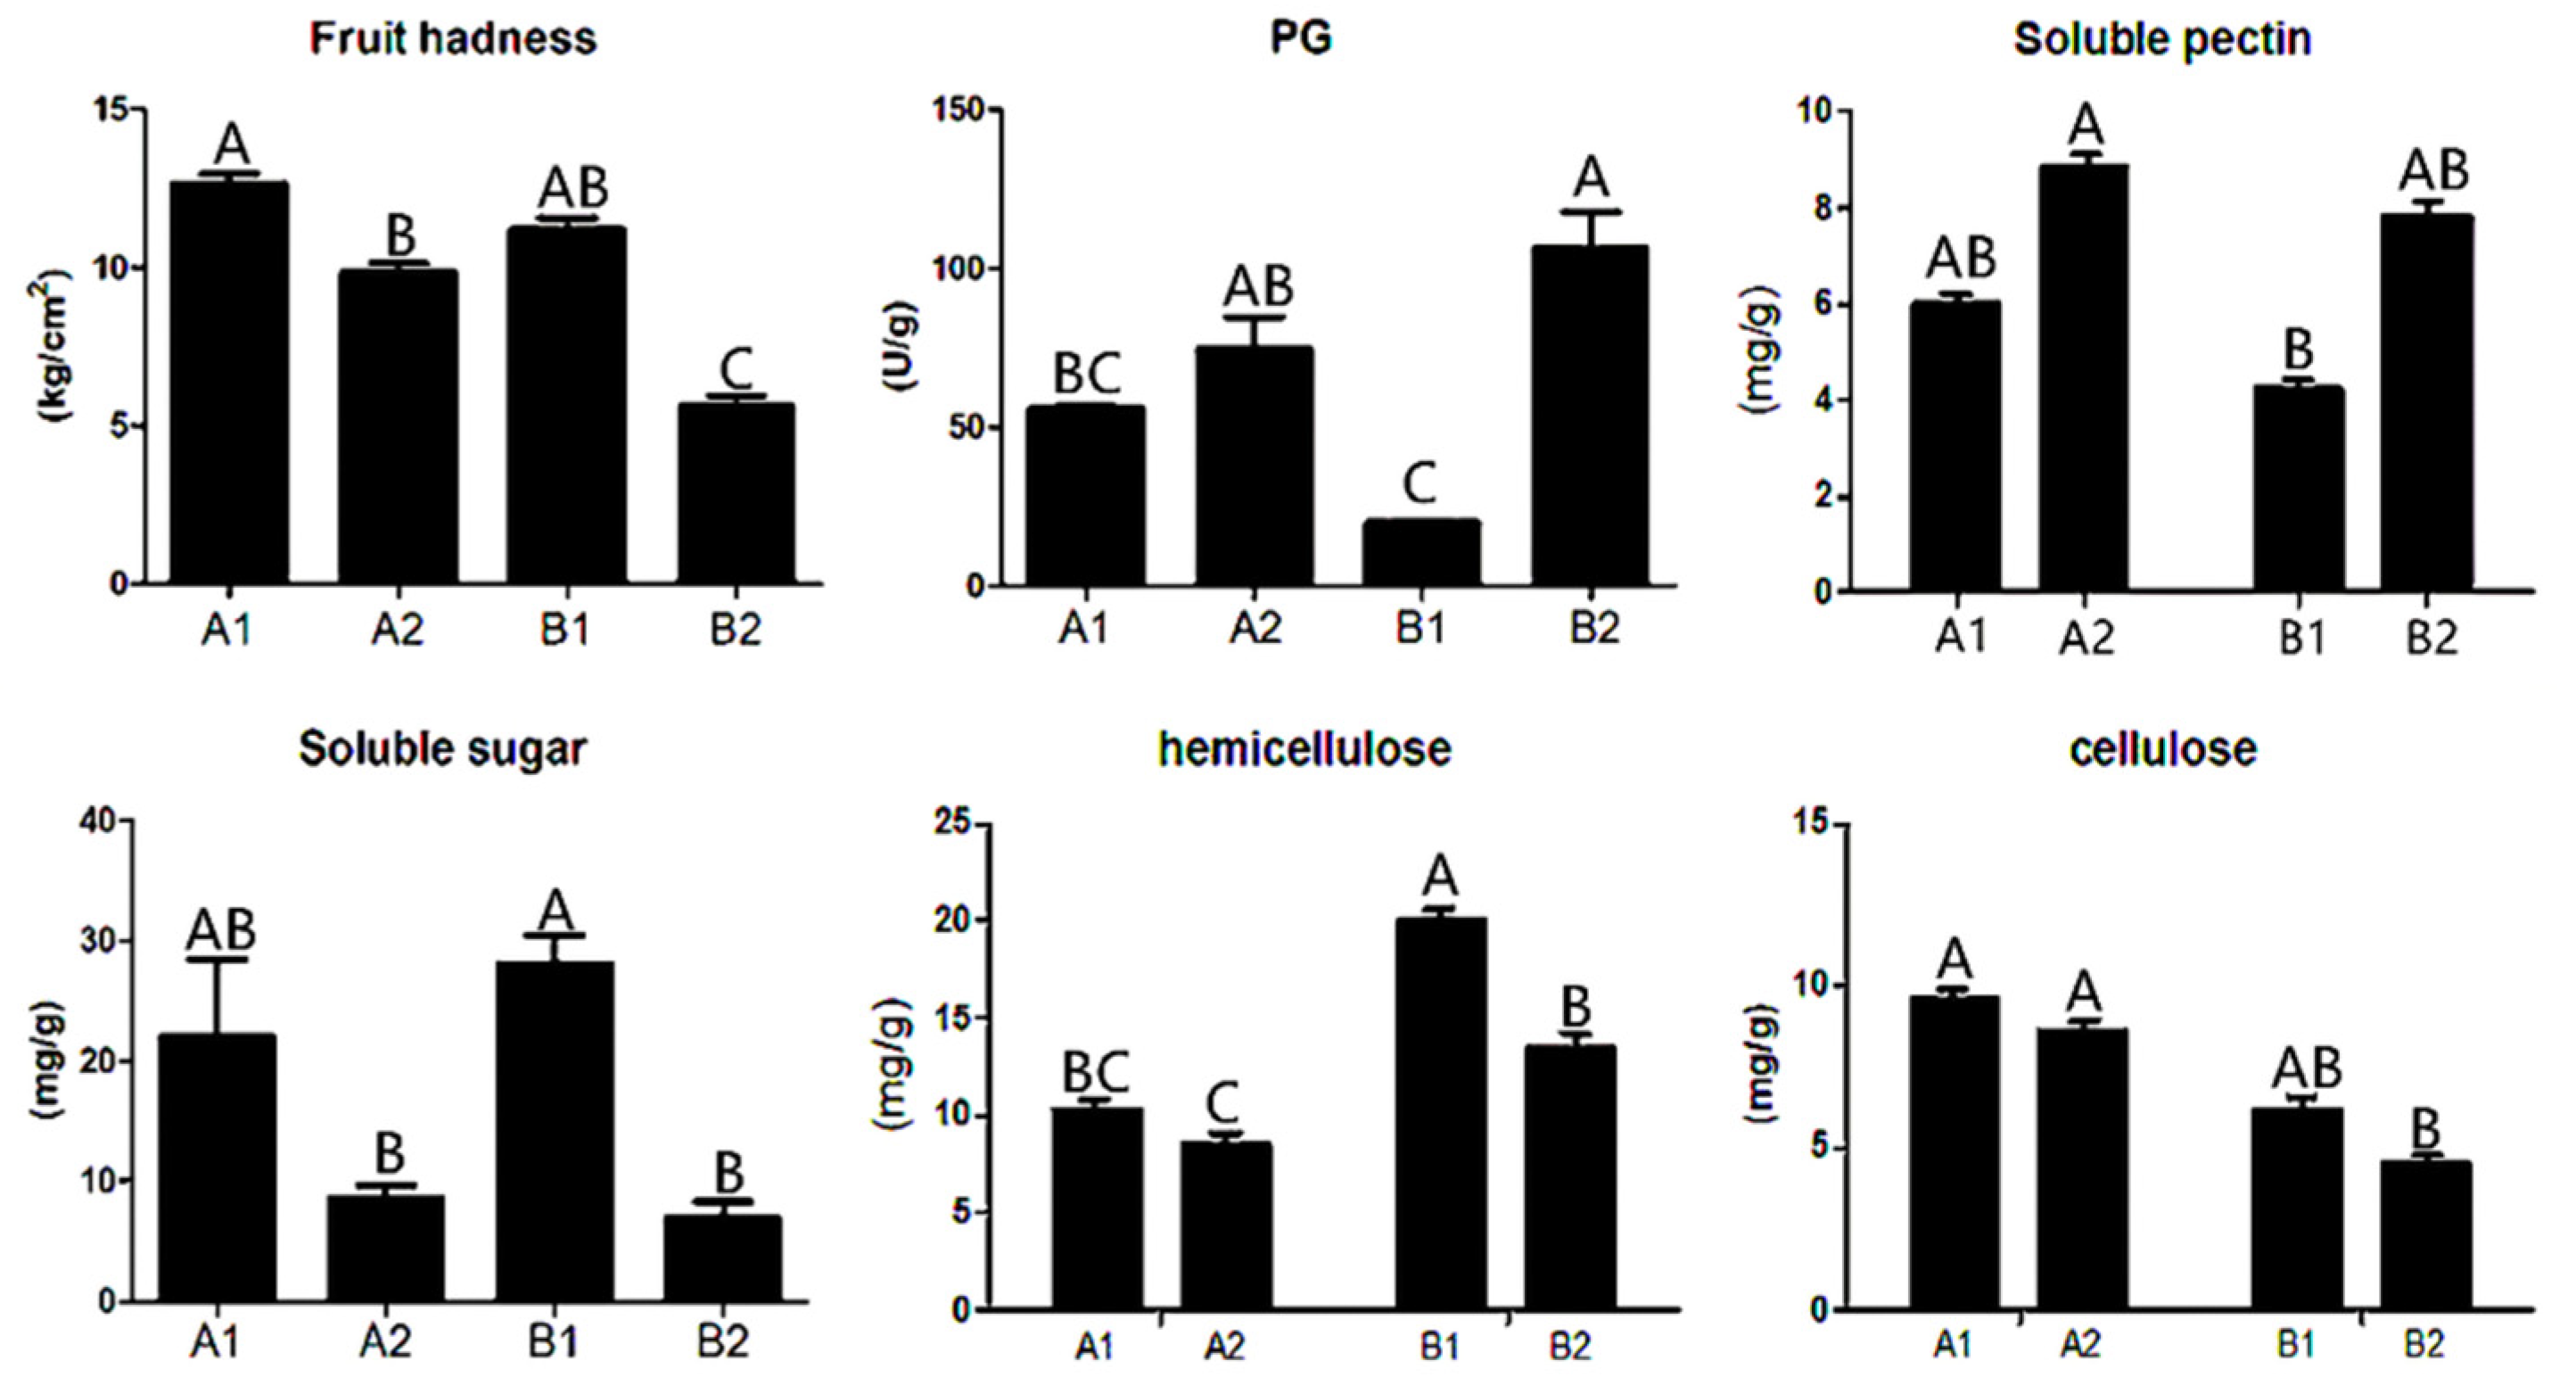
3.1. Hardness- and Storage-Related Physiological Indexes

Through the analysis of the physical and chemical properties of A144 and A361, we found that the fruit hardness and contents of soluble sugar, hemicellulose, cellulose, and polygalacturonase (PG) were significantly different between the two lines and between before and after storage (Figure 1). Specifically, fruit firmness and contents of soluble sugar, cellulose, and hemicellulose were decreased in A2 (A144 at 3 days postharvest) and B2 (A361 at 3 days postharvest) compared with A1 (A144 at 0d) and B1 (A361 at 0d), but the decrease in B2 was greater than that in A2 (Figure 1). The opposite was true for PG and soluble pectin. The contents of PG and soluble pectin in A2 and B2 were significantly higher than those of A1 and B1, and the increase in B2 was greater than that in A2.

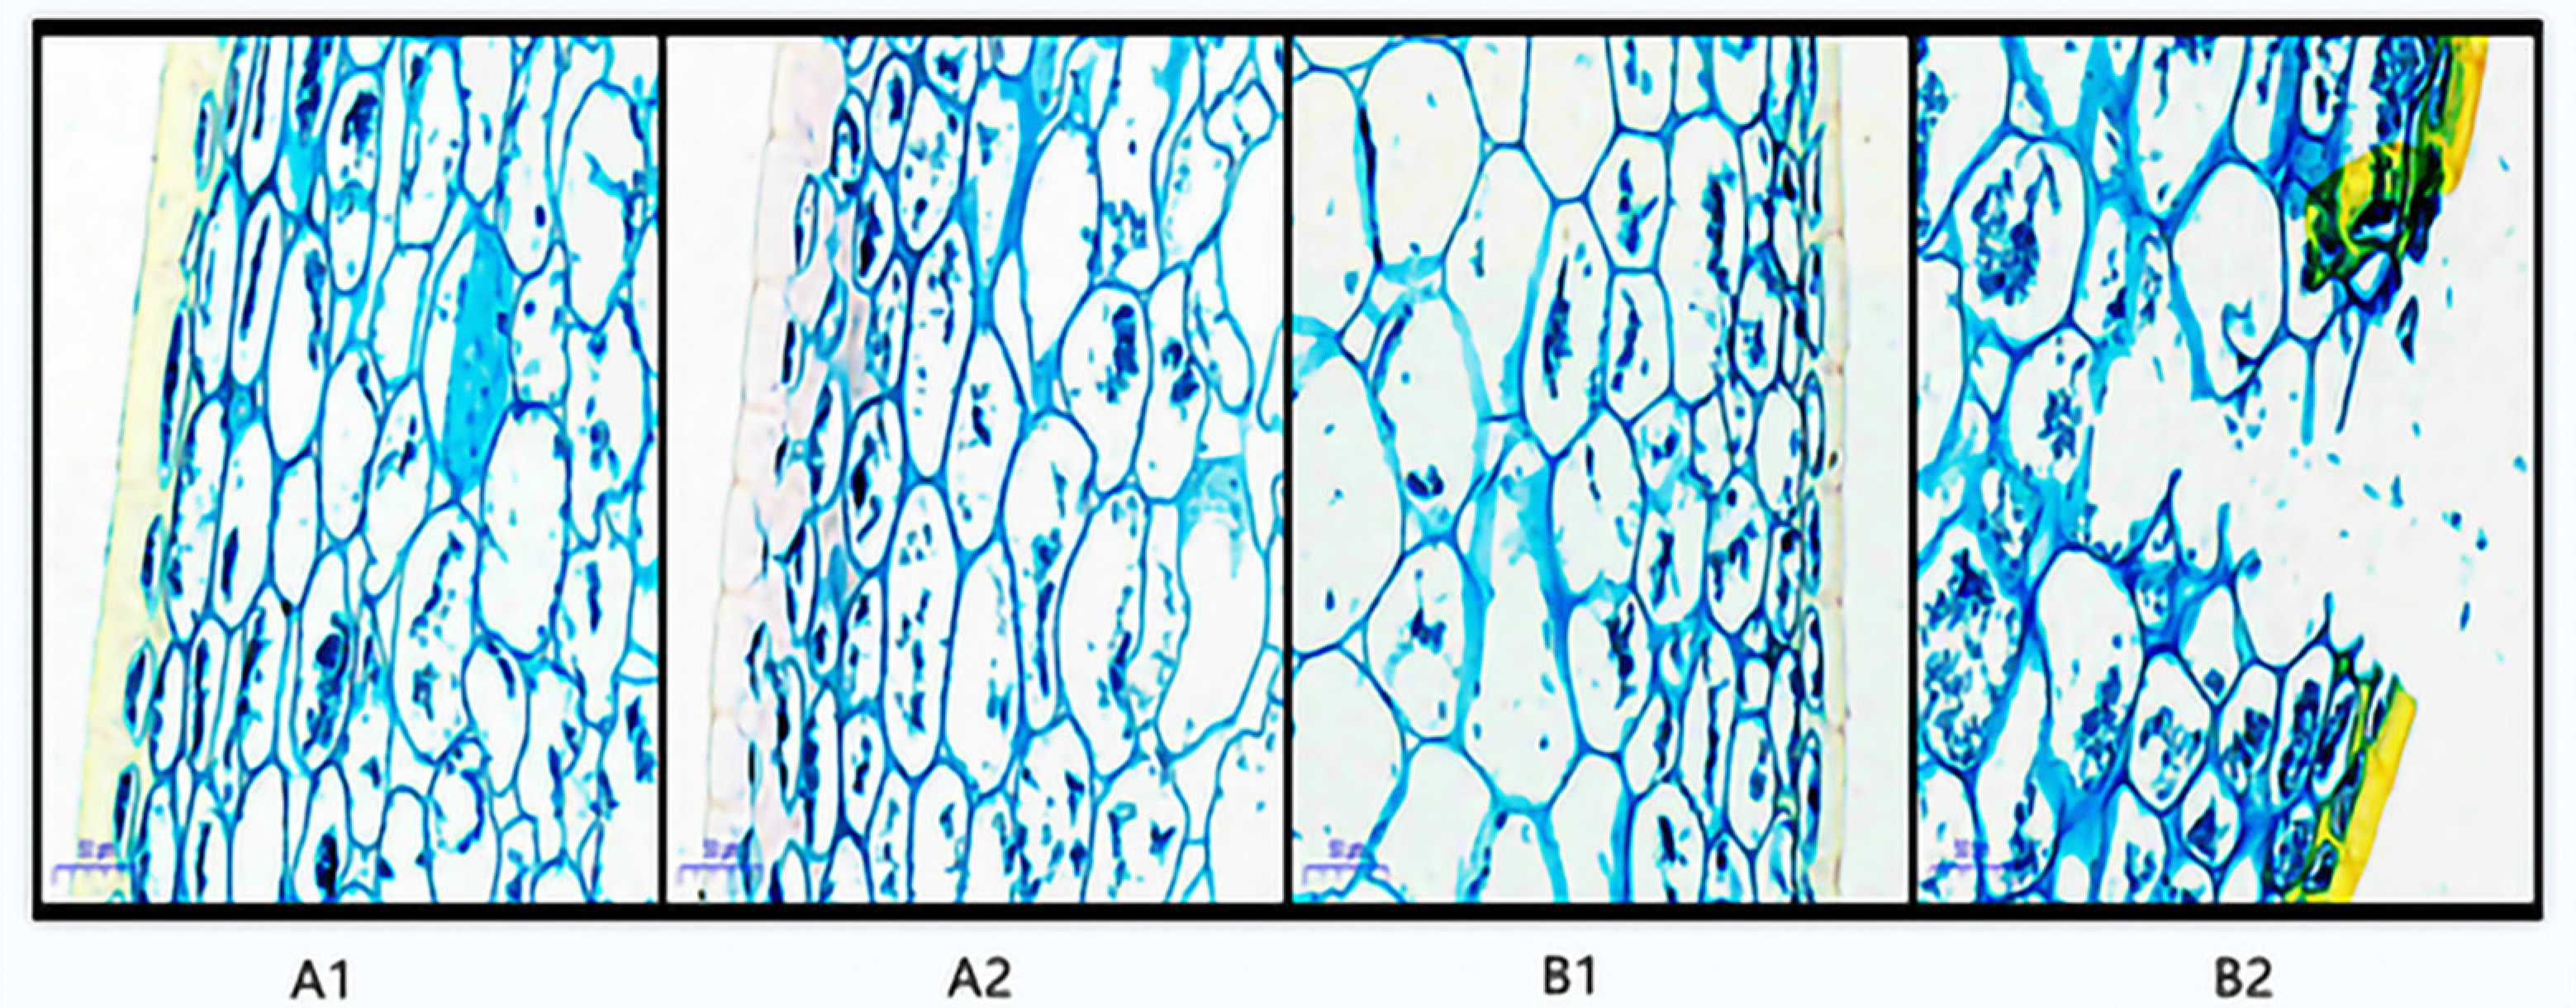
3.2. Observation of Pulp Structure

For the postharvest fruit structure of A1 and B1, the fruit skin cells were tightly and regularly arranged, with a complete cuticle on the outermost layer, and the degree of compactness of the cuticle and cell arrangement was almost the same (Figure 2). For the postharvest fruit tissue structure of A2 and B2, the cuticle and cells began to rupture to different degrees: the cuticle of the storage-resistant A2 was relatively complete, the degree of cell rupture was smaller, and there was less cell fusion, while the cuticle and cells of the non-storage-resistant B2 were ruptured to a larger extent.

3.3. Transcriptome Sequencing Analysis

From Illumina Nova 6000 sequencing, we obtained more than 5G of sequencing data and a total of 516,522,132 raw reads. After removing the linker sequence, low-quality sequences, and rRNA, 509,298,534 clean reads were obtained. The clean reads were aligned to the reference genome, and more than 87% of all samples were successfully matched to the reference genome. After the alignment, a total of 23,477 genes were identified, from which 18,523 genes were quantified. Among the quantified genes, 15,174 genes were present in all samples, and there were 463, 242, 275, and 125 unique genes in A1, A2, B1, and B2, respectively (Figure 3A).

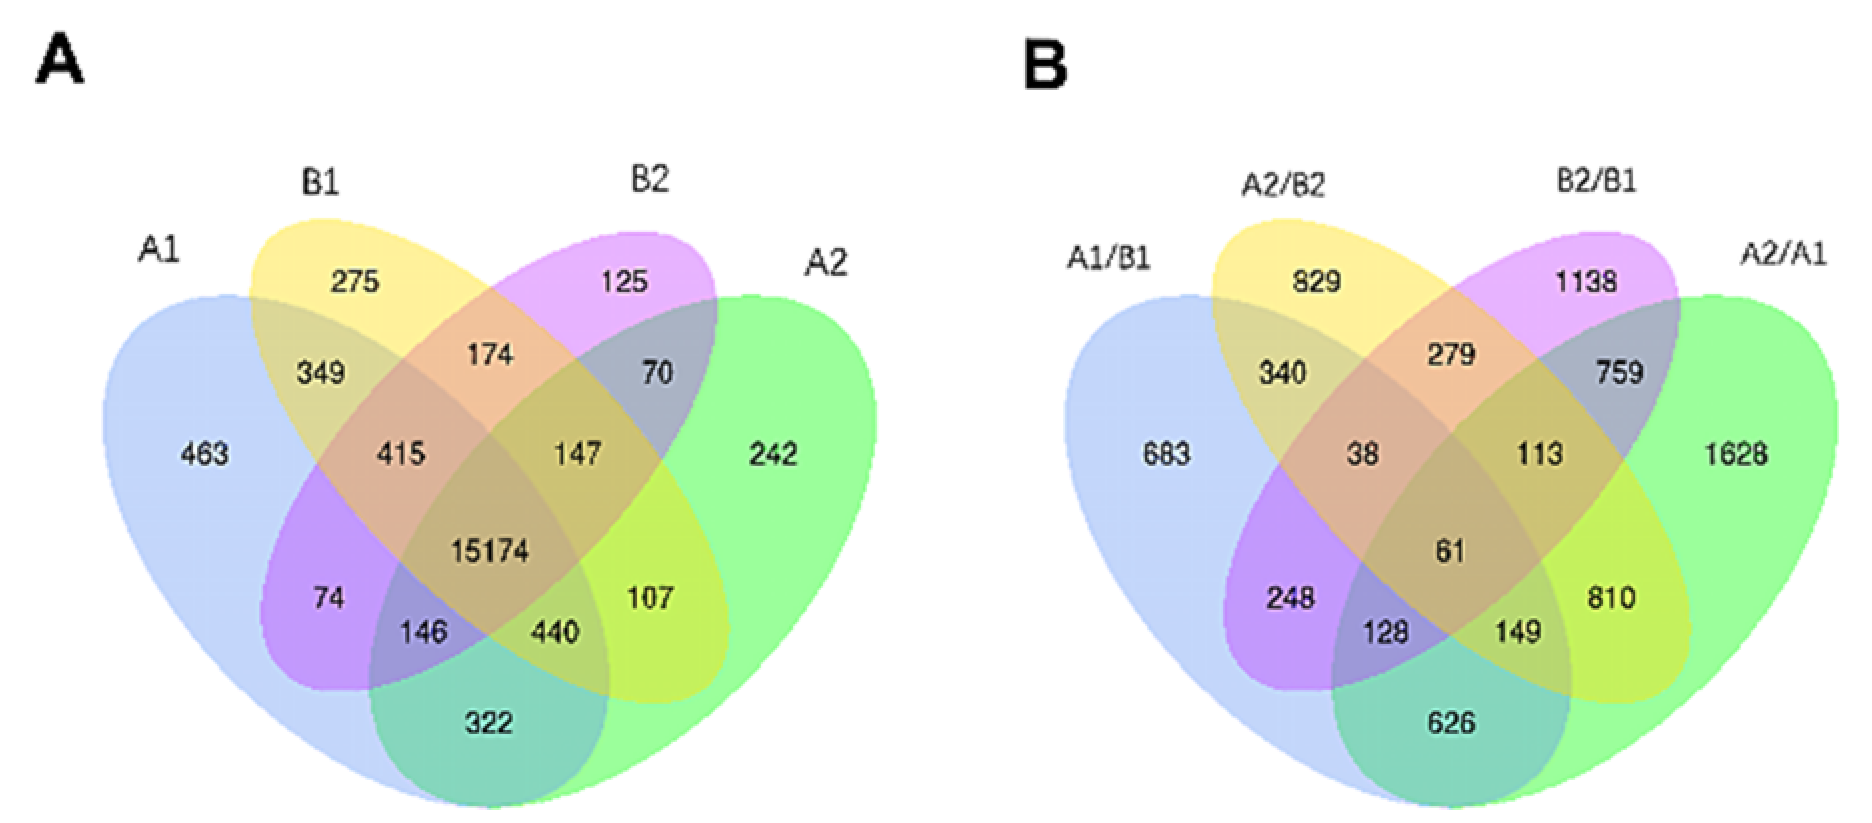
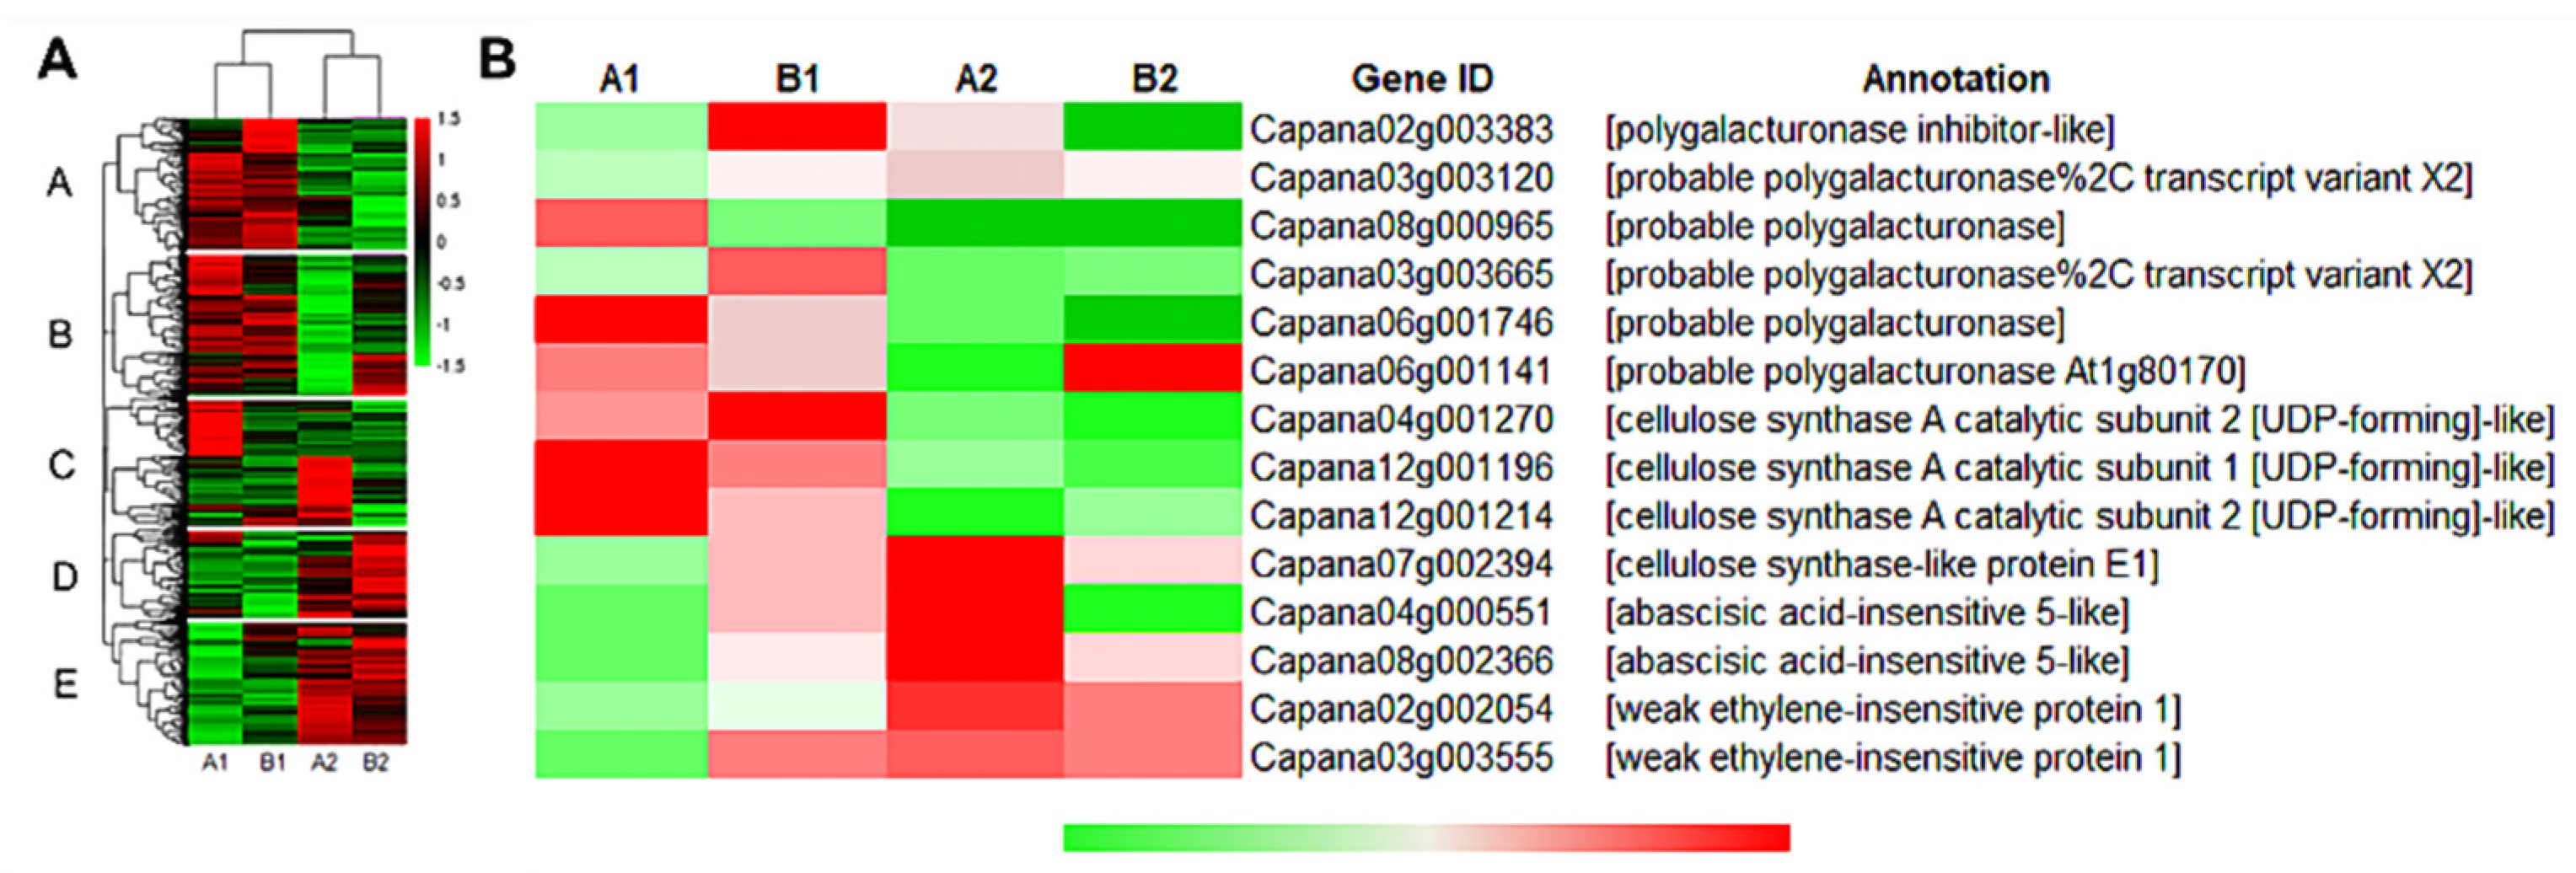
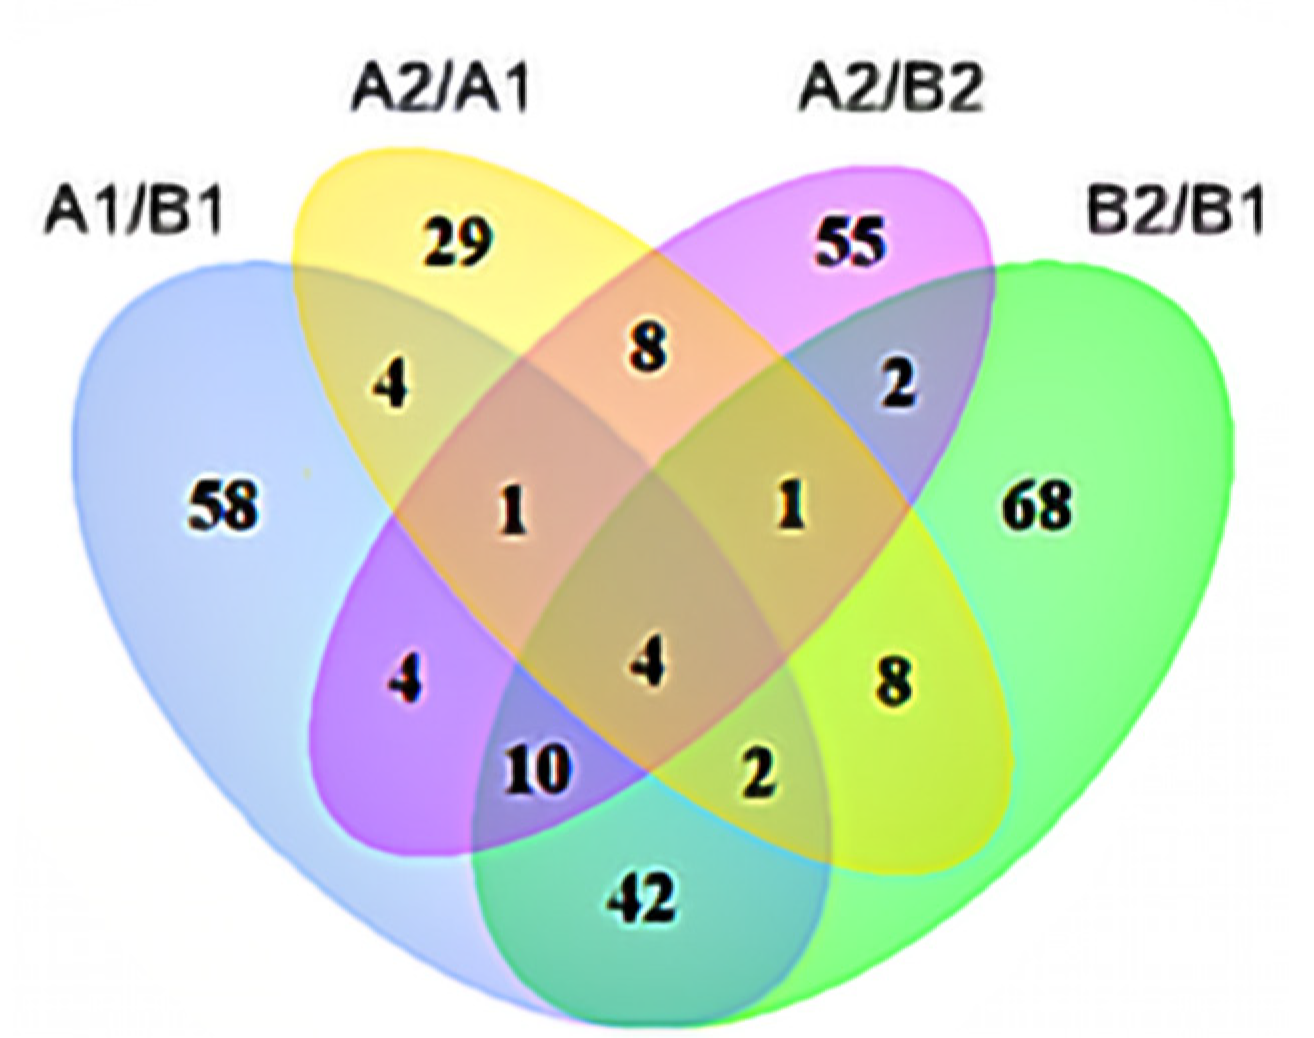
3.3.1. Identification and Analysis of Differentially Expressed Genes

In each comparison group, a total of 7829 differentially expressed genes (DEGs) were identified (Figure 3B). Specifically, there were 4274, 2764, 2273, and 2619 DEGs in A2/A1, B2/B1, A1/B1, and A2/B2 comparison groups. Moreover, 61 genes were significantly different in each comparison group, and there were 1628, 1138, 683, and 829 genes that were only significantly different in A2/A1, B2/B1, A1/B1, and A2/B2 groups, respectively.
Through cluster analysis, the gene expression patterns of A1, B1, A2, and B2 were divided into two categories, and the expression patterns in each category were consistent (Figure 4A). In the A and B groups, the gene expression of A1 and B1 showed an upregulation trend, and the gene expression of A2 and B2 showed a downregulation trend; in the D and E groups, the gene expression of A1 and B1 showed a downregulation trend, and the gene expression of A2 and B2 showed an upregulation trend. However, in group C, the gene expression of B1 and B2 were both downregulated, but most of the genes in A1 and A2 were upregulated. Therefore, we hypothesized that these genes might contain key genes for the storage tolerance of pepper. Next, we screened out 14 storage-related genes that exhibited differential expressions after harvesting the two pepper materials, including polygalacturonase (PG), polygalacturonase inhibitor (PGI), cellulose synthase (CESA), abscisic acid insensitive (ABI) and, weakly ethylene-insensitive (WEI) genes (Figure 4B). Among them, the expression level of PG (Capana06g001141) in A2 fruit was significantly lower than that in B2, and its expression level in A2 was significantly lower than that in A1, while B2 was not significantly different from B1. The expression levels of ABI5 (Capana04g000551 and Capana08g002366) and WEI1 (Capana02g002054) in A2 were significantly higher than those in A1, but no significant difference was found between B1 and B2 fruits. The expression levels of PGI (Capana02g003383) and CESA (Capana07g002394), which inhibit pepper fruit softening, were all significantly higher in A2 compared to B2. These results suggest that the differential expression of the above genes might be the important reason for the difference in storage tolerance of the two pepper materials.

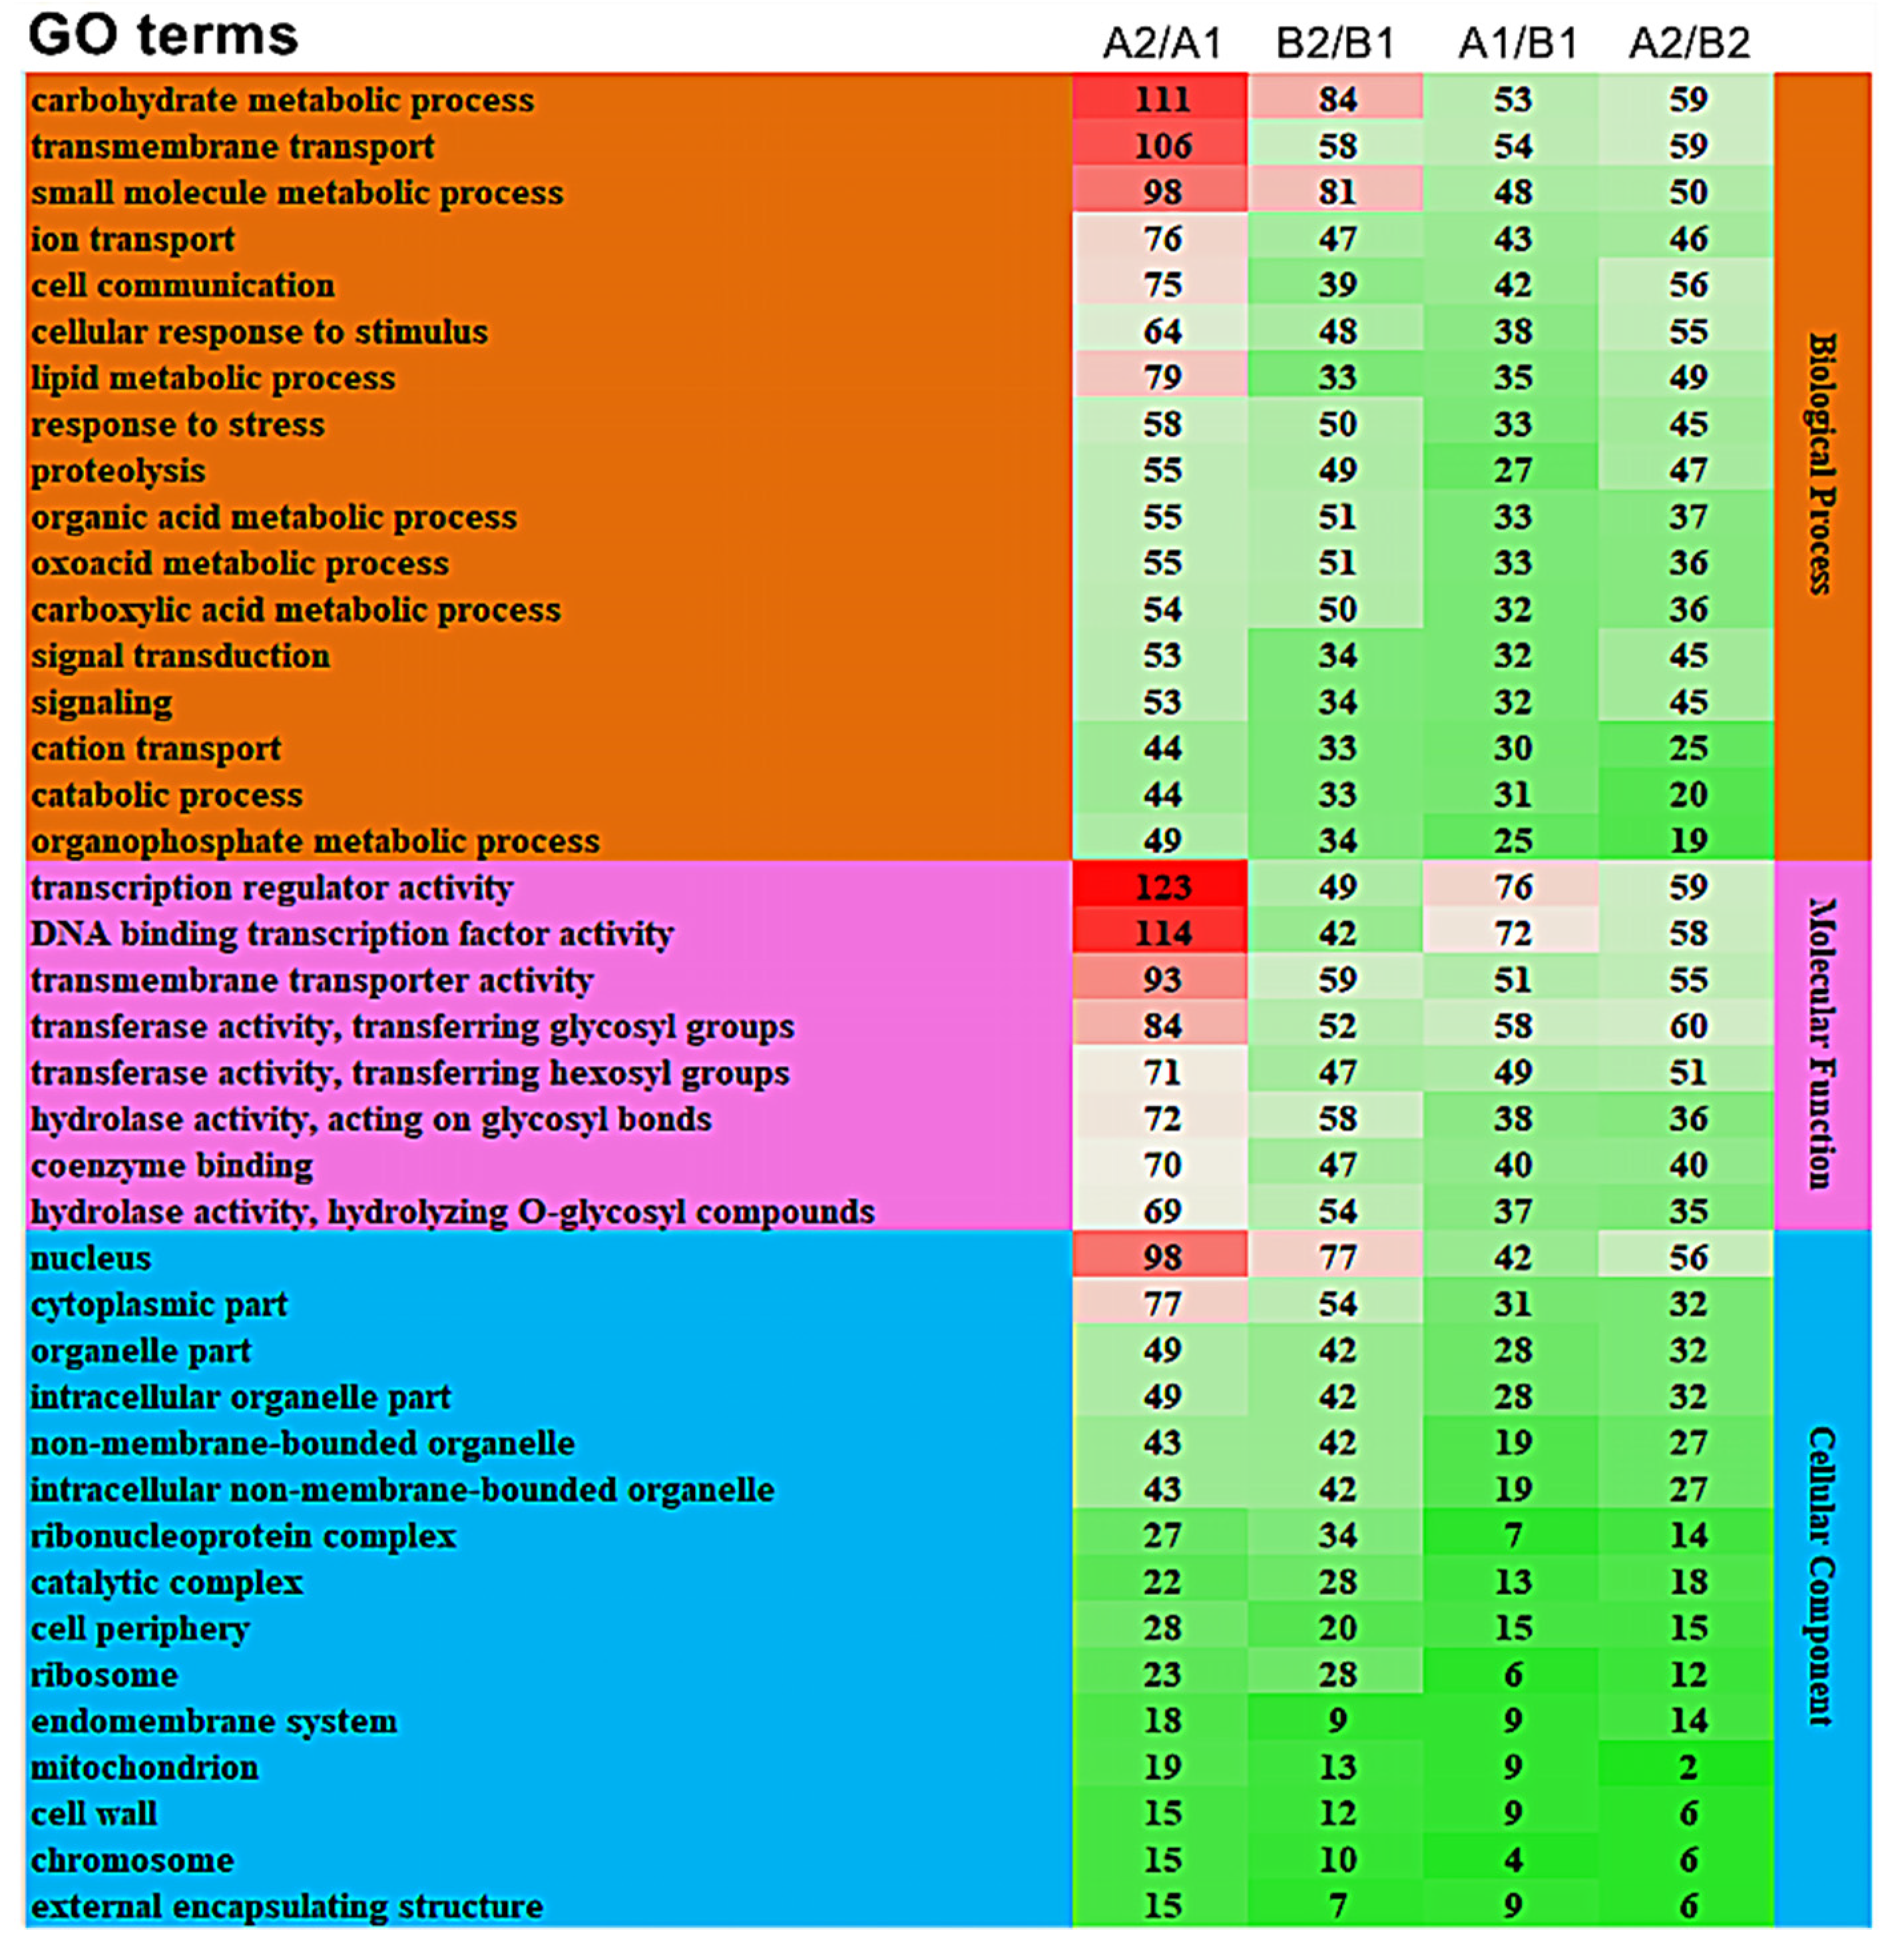
3.3.2. GO Enrichment Analysis of Differentially Expressed Genes

We performed further enrichment analysis on the top 40 GO terms containing the largest number of differentially expressed genes. The results show that in the biological processes class, carbohydrate metabolic process (GO:0005975), transmembrane transport (GO:0055085), and small molecule metabolic process (GO:0044281) were significantly enriched in A2/A1, B2/B1, A1/B1, and A2/B2, and each functional item had the highest degree of enrichment in A2/A1 (Figure 5). In the molecular functions class, the transcription regulator activity (GO:0140110), DNA binding transcription factor activity (GO:0003700), and transmembrane transport activity (GO:0022857) were significantly enriched in all the four comparison groups, and the transcription regulator activity (GO:0140110) process was significantly enriched in A2/A1. The cellular components class was divided into 14 categories. The most significantly enriched processes in the comparison groups were the nucleus (GO:0005634) and cytoplasmic parts (GO:0044444). Therefore, the GO enrichment in carbohydrate metabolic process (GO:0005975), transcription regulator activity (GO:0140110), and DNA binding transcription factor activity (GO:0003700) might be the reason for the difference in storage tolerance between A144 and A361.

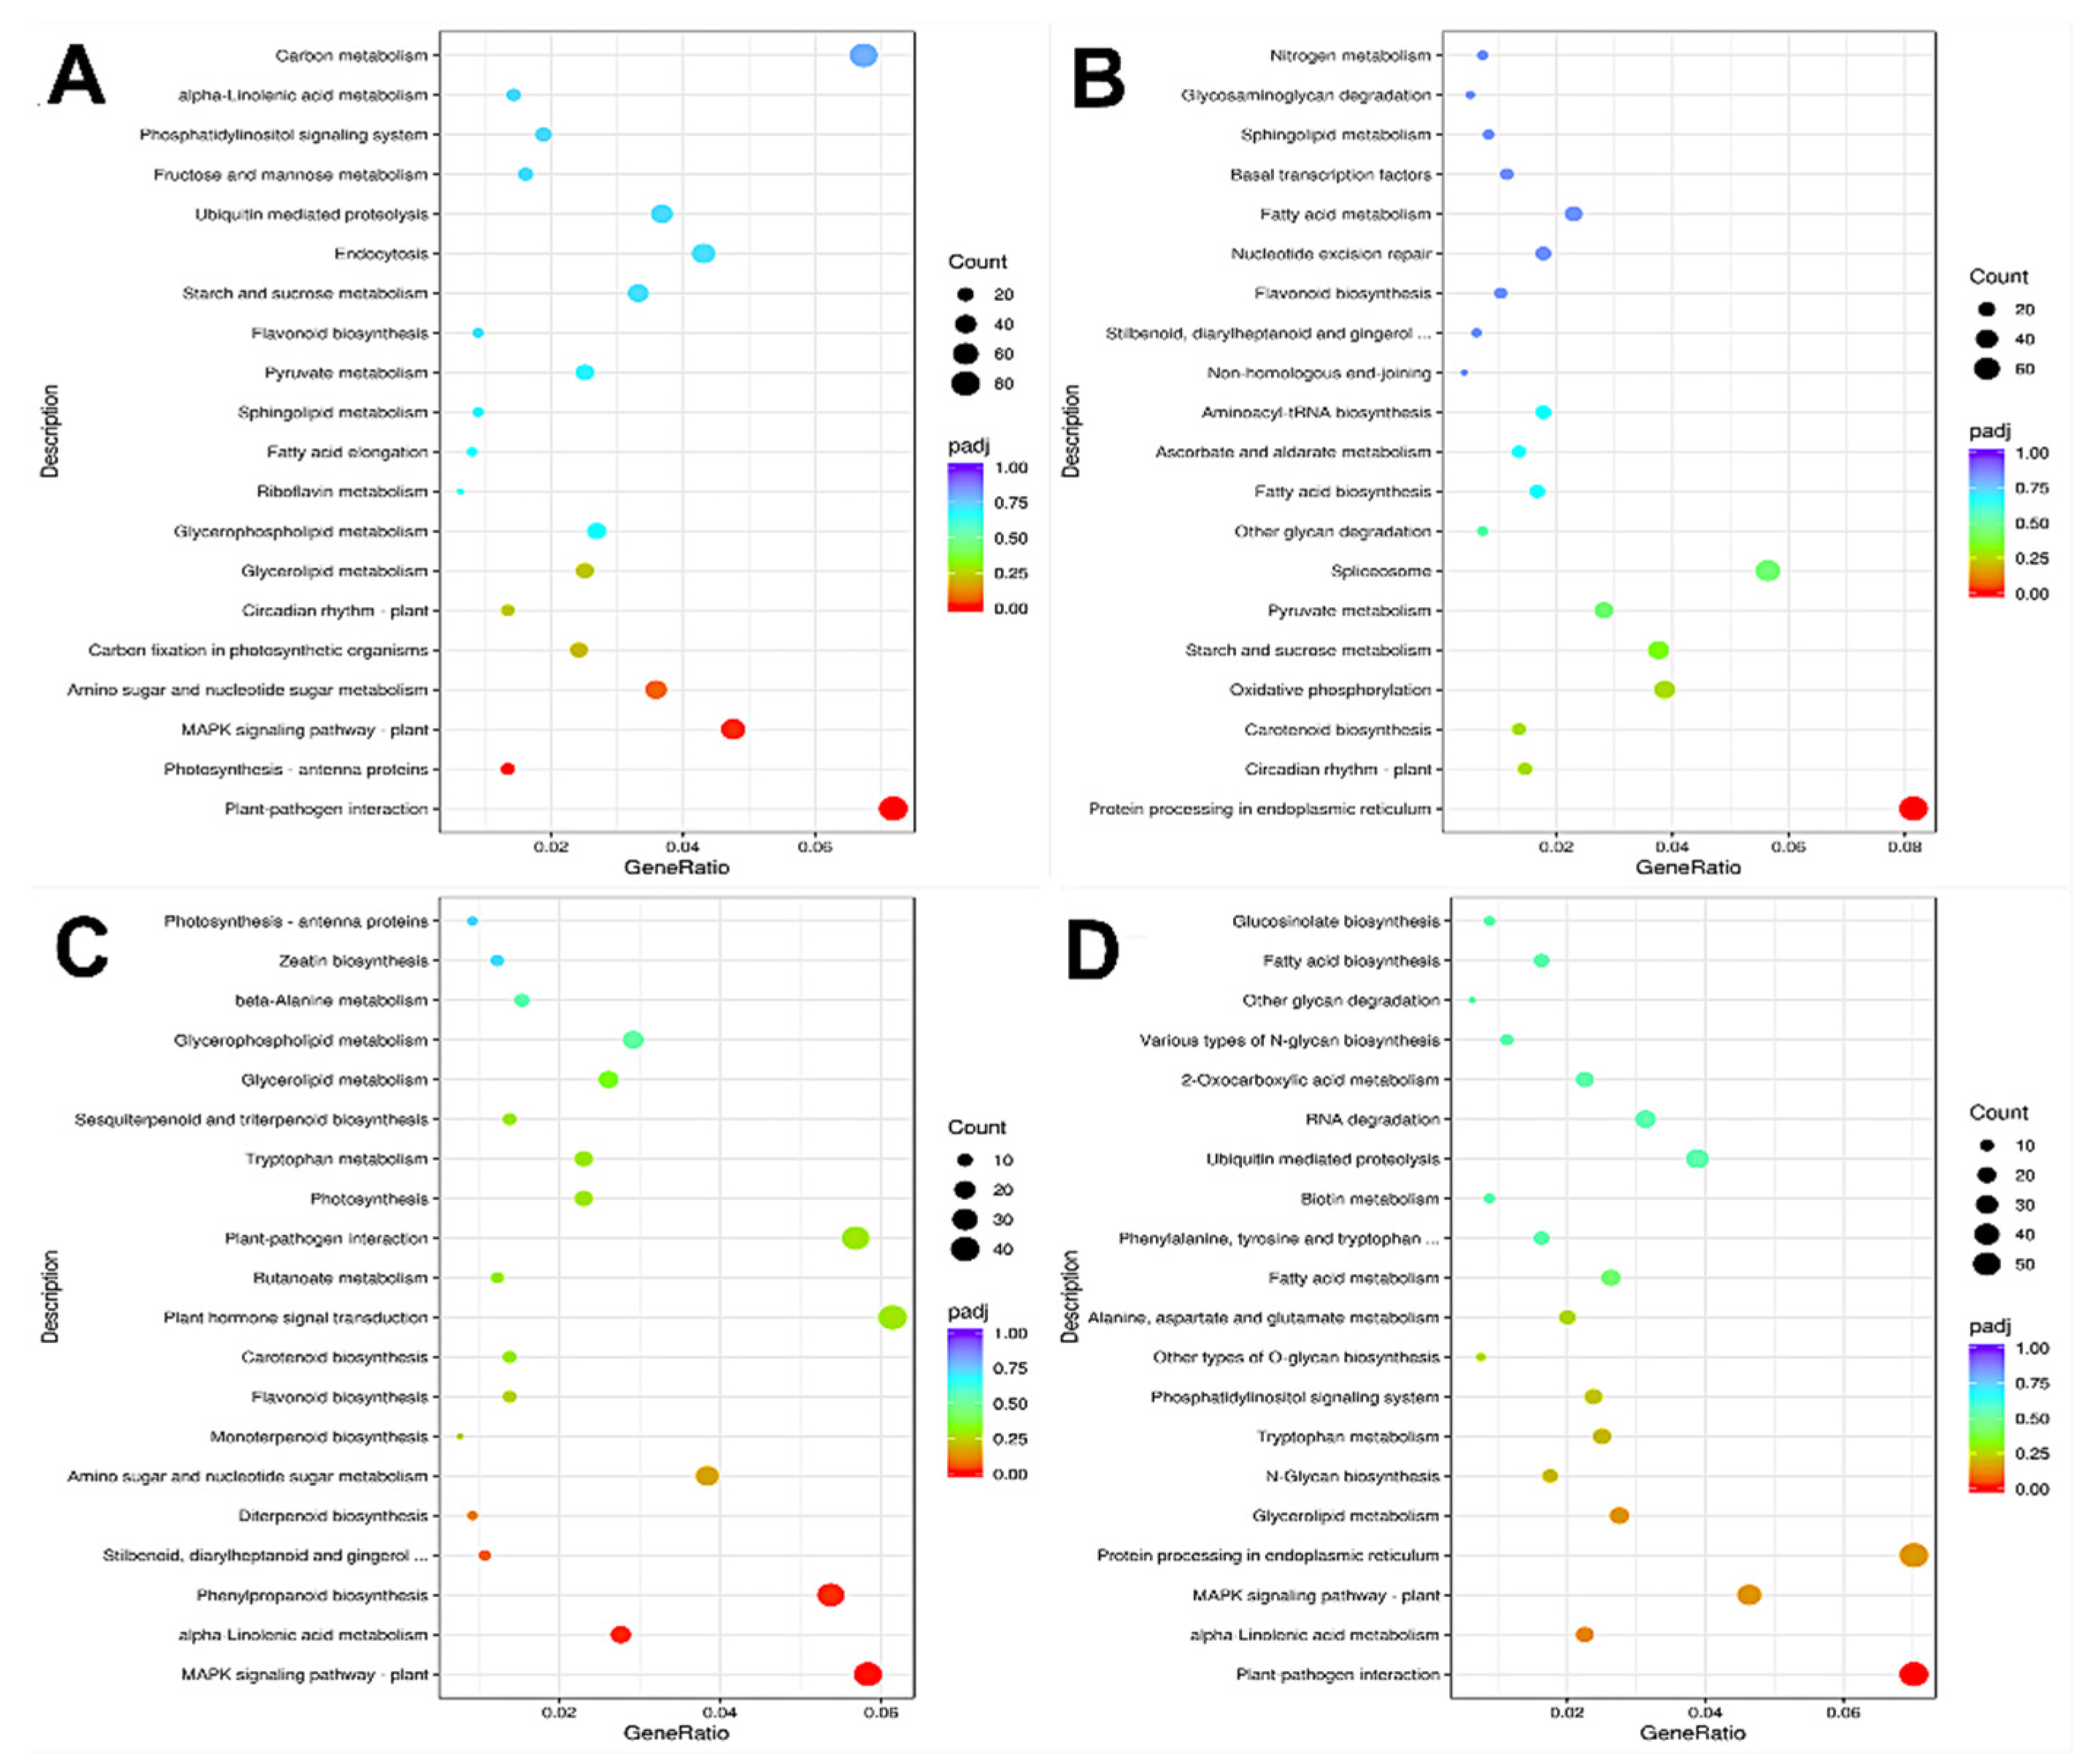
3.3.3. KEGG Pathway Enrichment Analysis

KEGG pathway enrichment analysis was performed on the differentially expressed genes (DEGs) in each comparison group. The results show that the DEGs in A2/A1 fruits were significantly enriched in photosynthesis-antenna proteins, plant–pathogen interaction, and MAPK signaling pathway-plant pathways (Figure 6A). The DEGs in the B2/B1 fruits were significantly enriched in the protein processing in the endoplasmic reticulum pathway (Figure 6B). The DEGs in A1/B1 were significantly enriched in plant MAPK signaling pathway-plant, alpha-linolenic acid metabolism, and phenylpropanoid biosynthesis pathway (Figure 6C), while the DEGs in A2/B2 were significantly enriched in plant–pathogen interaction pathway (Figure 6D). These results show that these fruits might be regulated by phytohormone signal transduction and protein synthesis-related genes. The enrichment in plant MAPK signal transduction and phytopathogen interaction pathways in A2/A1, A1/B1, and A2/B2 groups indicates that the above enriched pathways might be the cause of the difference in storage tolerance.

3.3.4. Expression Analysis of Ethylene-Responsive Transcription Factors (ERFs)

ERFs are important factors regulating plant growth and fruit ripening. In this study, we identified a total of 116 ERFs, of which 77 were quantified (Table S1). We further analyzed 40 ERFs with FPKM value > 5 (Figure 7). Among them, the expression of ERF1B-like (Capana05g001701) was significantly increased by 2.9 times in A2/A1, but there was no significant difference between B2 and B1, and its expression in A2 was significantly higher than that in B2. The expression levels of ERF3-like (Capana10g000161) and ERF096-like (Capana02g001898) in A2 fruits were significantly lower than those in A1 by 2.35 and 3.89 times, while there was no significant difference between B1 and B2; moreover, the expression levels of ERF3-like and ERF096-like in A2 were significantly lower than those in B2. The expression level of ERFRAP2-13-like (Capana04g001107) in A2 and B1 fruits was significantly lower than that in A1, and the expression level of A2 was significantly lower than that of B2. The differential expression of genes such as ERF1B-like, ERF3-like, and ERF096-like might be the reason for the difference in storage tolerance of the two pepper materials.

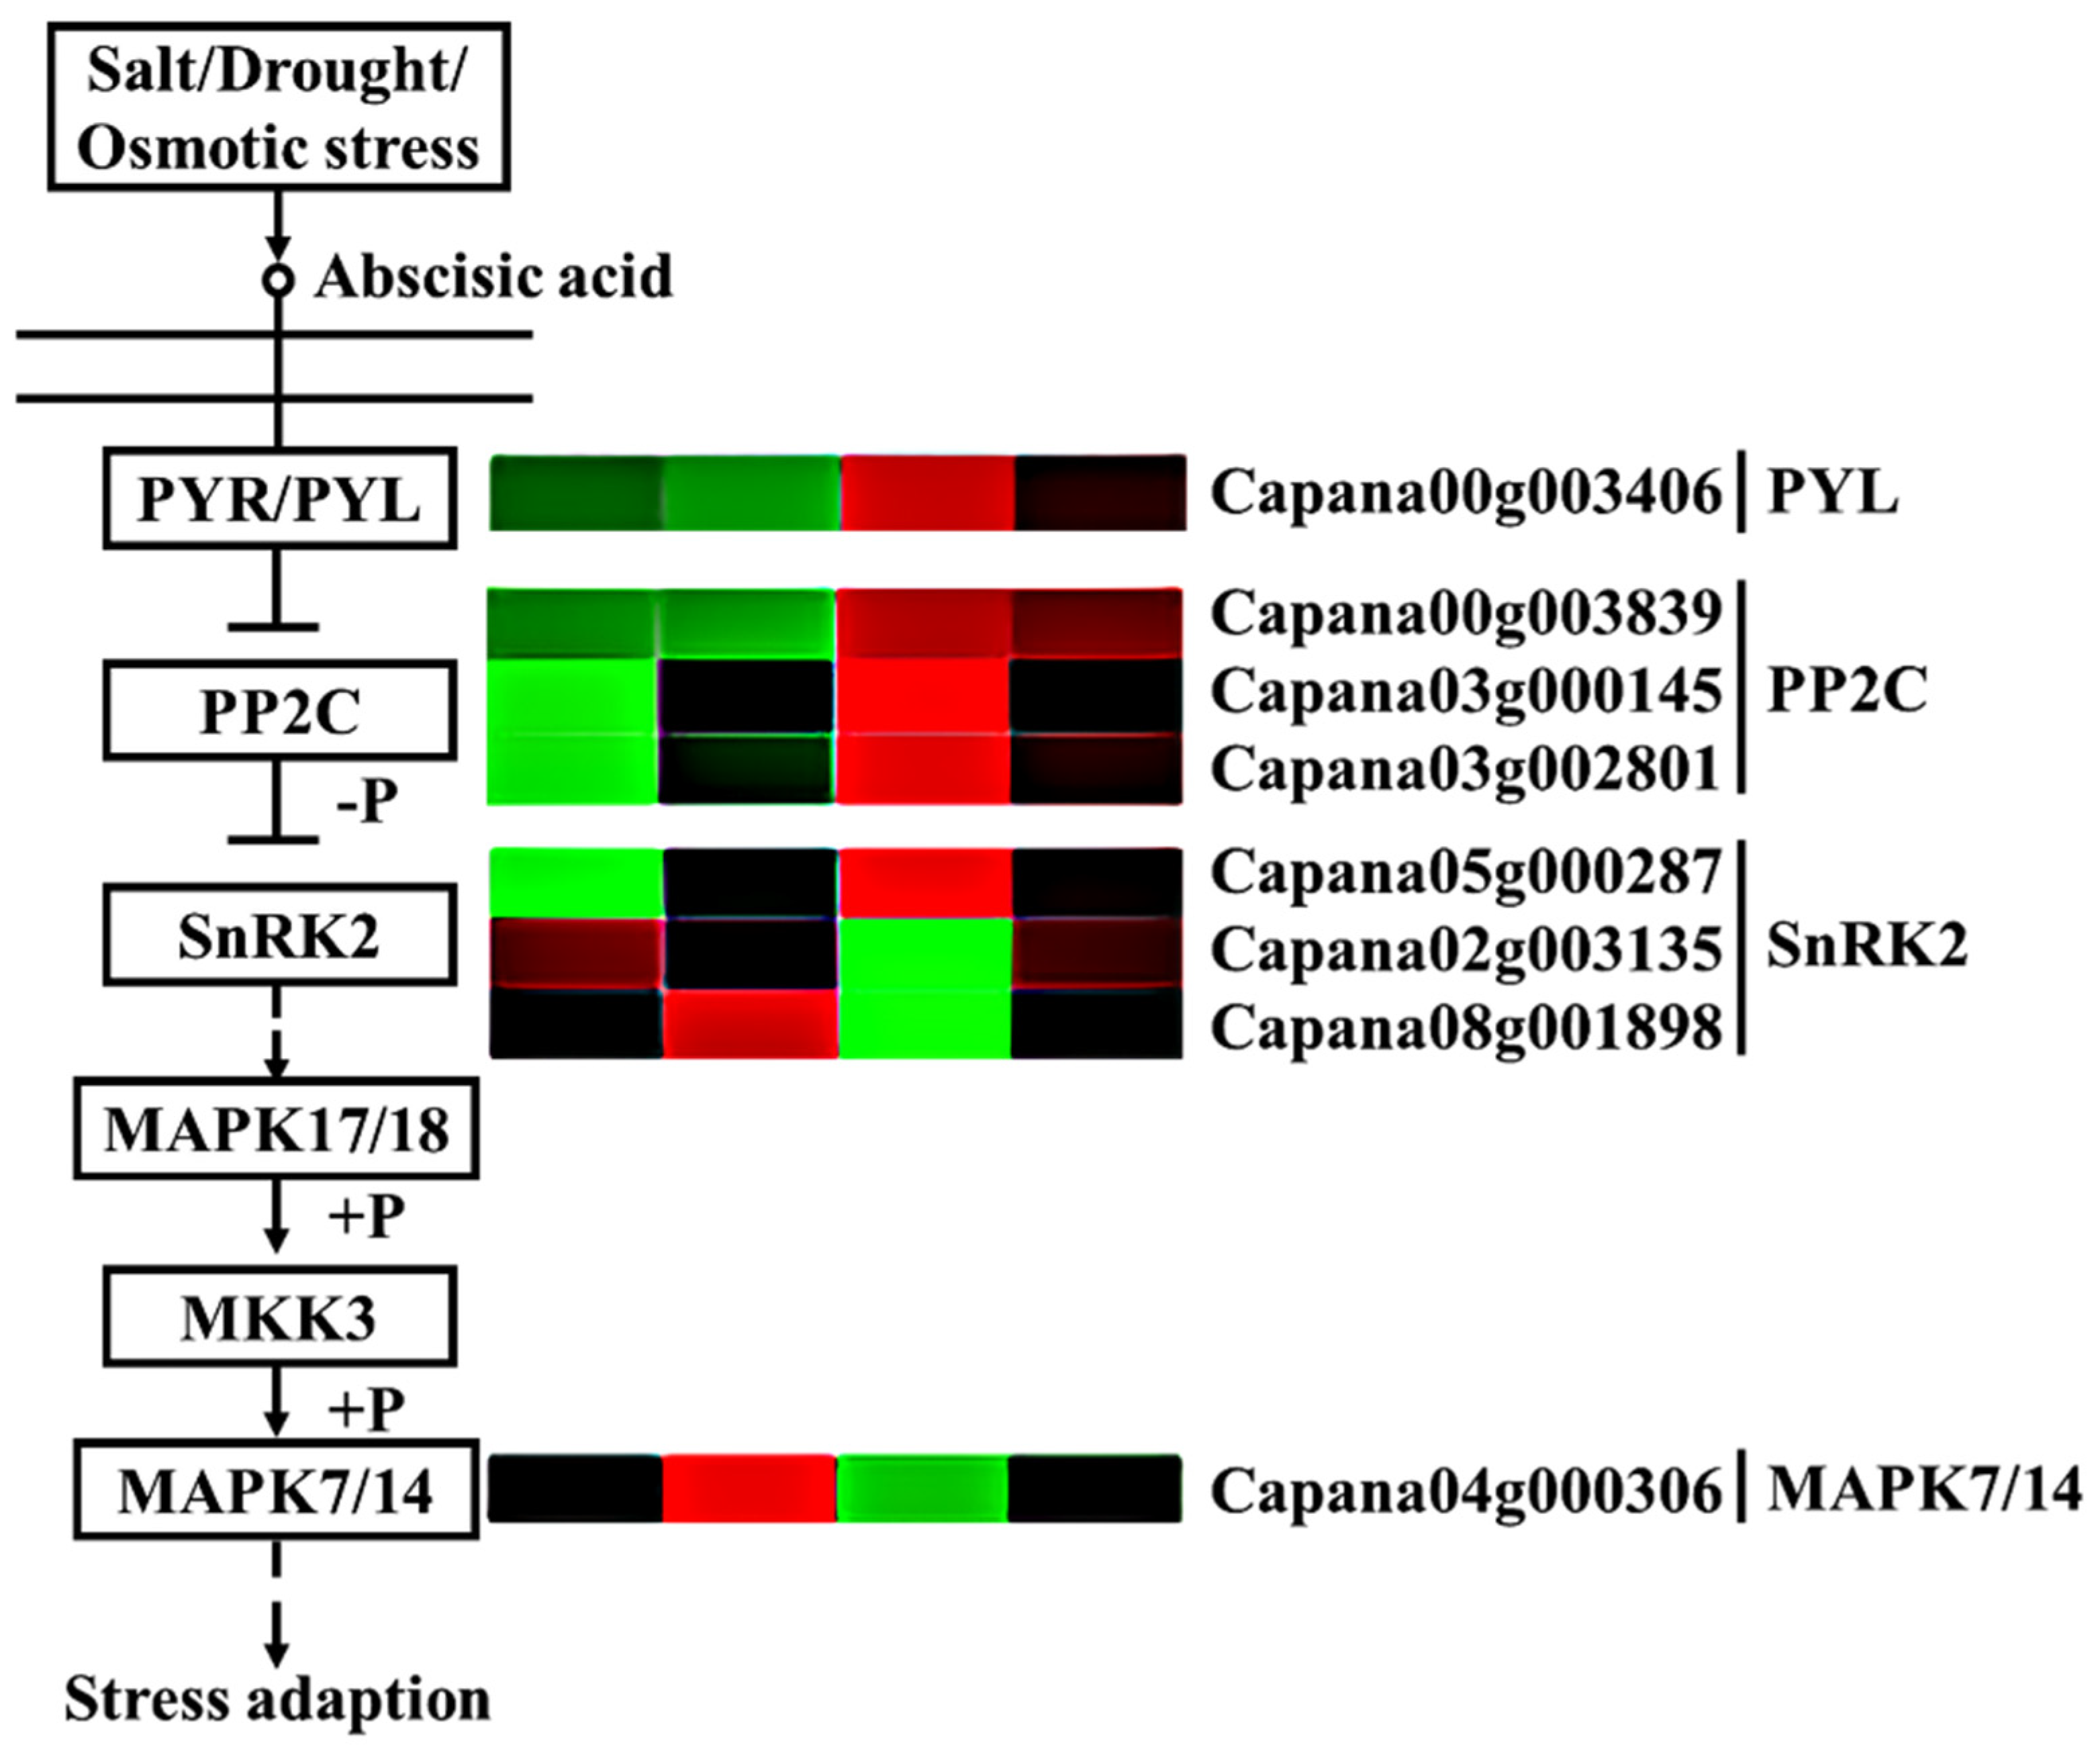
3.3.5. The Expression of Abscisic Acid Related Genes

Our study found that a large number of genes in the abscisic acid (ABA) plant hormone signaling pathway were differentially expressed in each comparison group (Figure 8). In the two pepper materials, most genes were upregulated after storage for 3 days, such as abscisic acid receptor PYL (PYL) (Capana00g003406), protein phosphatase 2C (PP2C) (Capana00g003839 and Capana03g002801), and protein kinase 2 (SnRK2) (Capana05g000287), among which PYL had the largest increase, and A2/B2 had significantly higher expression levels of these genes than A1/B1. However, protein kinase 2 (SnRK2) (Capana08g001898 and Capana02g003135) and mitogen-activated protein kinase 7/14 (MPK7/14) (Capana04g000306) showed different trends. The expression of protein kinase 2 (SnRK2) (Capana08g001898 and Capana02g003135) and MPK7/14 (Capana04g000306) in A2 was significantly downregulated compared to A1, while in B2, onlySnRK2 (Capana08g001898) and MPK7/14 (Capana04g000306) were downregulated as compared to B1; moreover, the expression of SnRK2 and MPK7/14 in A2 was significantly lower than that in B2. These results indicate that PP2C, SnRK2, and MPK7/14 might be closely related to the storage tolerance of pepper.

3.4. Metabolome Determination and Differential Metabolite Analysis

The metabolome analysis of the two pepper materials identified a total of 985 metabolites (Table S2). There were 123, 85, 57, and 137 significantly different metabolites in A1/B1, A2/B2, A2/A1, and B2/B1 (Figure 9), respectively. There were four common differential metabolites in the four comparison groups, which were UDP-galactose, cis-4-hydroxy-D-proline, uridine 5′-diphospho-D-glucose, and rotenone. The contents of UDP-galactose and uridine 5′-diphospho-D-glucose in A1 fruit were significantly lower than those in B1, and the contents in both fruits decreased significantly after storage; after storage, the contents in A2 fruit were significantly lower than those in B2 fruit. The content of cis-4-hydroxy-D-proline in A1 fruit was significantly higher than that in B1, and the content in both materials increased after storage; after storage, the content in A2 was significantly higher than that in B2. The content of rotenone in A2 fruit was significantly lower than that in A1, but the content in B2 fruit was significantly higher than that in B1. With |log2FC| > 2 as the cut-off, 30 differential metabolites were identified from each comparison (Table S3). In A2/A1 and B2/B1, 9-KODE and 9-HOTrE showed larger changes, and the contents increased significantly after storage in both materials; the content in B2 was significantly higher than that in B1 by 3.19 times, while the content in A2 was only increased by 2.65 times compared to A1. We also found that Phe-Pro and Gly-Tyr were differentially expressed in A2/A1 and B2/B1. Compared to B1, the contents of Phe-Pro and Gly-Tyr in A1 were higher by 3.9 times and 3.95 times, and the contents in A2 were higher than B2 by 2.75 and 2.3 times. In addition, methyl indole-3-acetate was also different between the two pepper materials. The content of methyl indole-3-acetate in A2 fruit was significantly lower than that in A1 and B2, but there was no significant difference between B1 and B2. The changes of these metabolites might be an important reason for the loss of nutrients in pepper fruit and the difference in fruit’s storage tolerance.

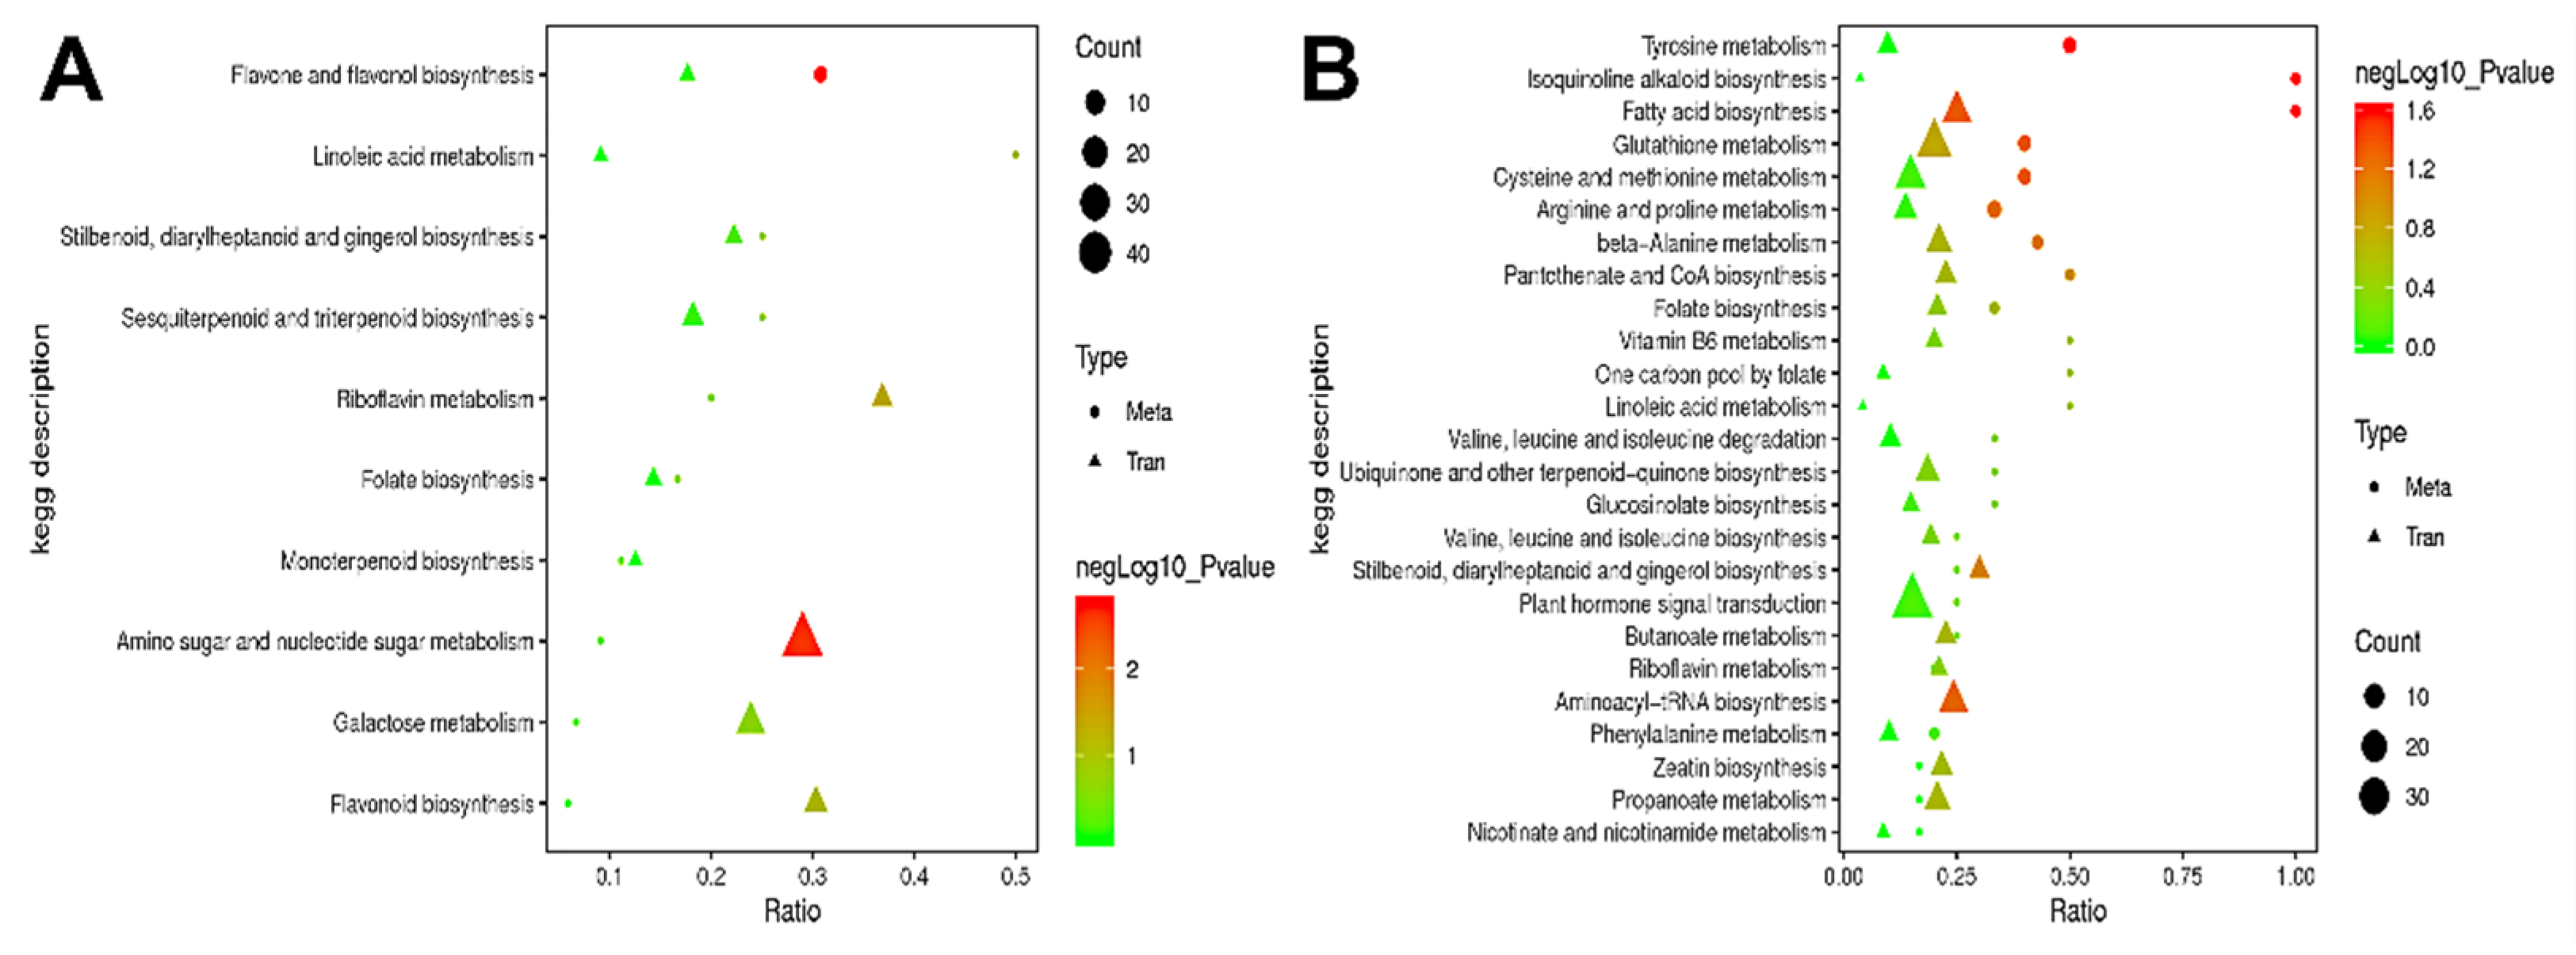
3.5. KEGG Pathway Analysis and the Analysis of Correlation between Differential Genes and Differential Metabolites

Pearson correlation analysis was performed between the significantly different genes obtained by transcriptome analysis and the significantly different metabolites obtained by metabolomics analysis in order to measure the degree of correlation between the differential genes and metabolites. The top 50 differential metabolites and the top 100 differential genes based on p-value were sorted from small to large (Table S4). Through KEGG enrichment analysis, we identified the metabolic pathways enriched with correlated differential genes and metabolites; we also explored the enrichment degree of these pathways and determined the main biochemical and signaling pathways involving both differential metabolites and genes. In A2/A1, the differential metabolites were mainly enriched in the flavone and flavonol biosynthesis pathway, and the differential genes were mainly enriched in amino sugar and nucleotide sugar metabolism, galactose metabolism, and flavonoid biosynthesis pathways (Figure 10A). In B2/B1, the differential metabolites were mainly enriched in glutathione metabolism, cysteine and methionine metabolism, arginine and proline metabolism, and tyrosine metabolism pathways, and the differential genes were mainly enriched in plant hormone signal transduction, glutathione metabolism, cysteine and methionine metabolism, aminoacyl-tRNA biosynthesis, and fatty acid biosynthesis pathways (Figure 10B). Interestingly, we found that the differential genes and metabolites in A144 were significantly enriched in the flavonoid biosynthesis pathway, which was not observed in A361; on the other hand, the differential genes and metabolites in A361 were significantly enriched in glutathione metabolism and cysteine and methionine metabolism pathways, which was not observed in A144. This result indicated that the reason for the difference in fruit storage tolerance might be related to the changes in metabolites involved in flavonoid biosynthesis, glutathione metabolism, and cysteine and methionine metabolism pathways.

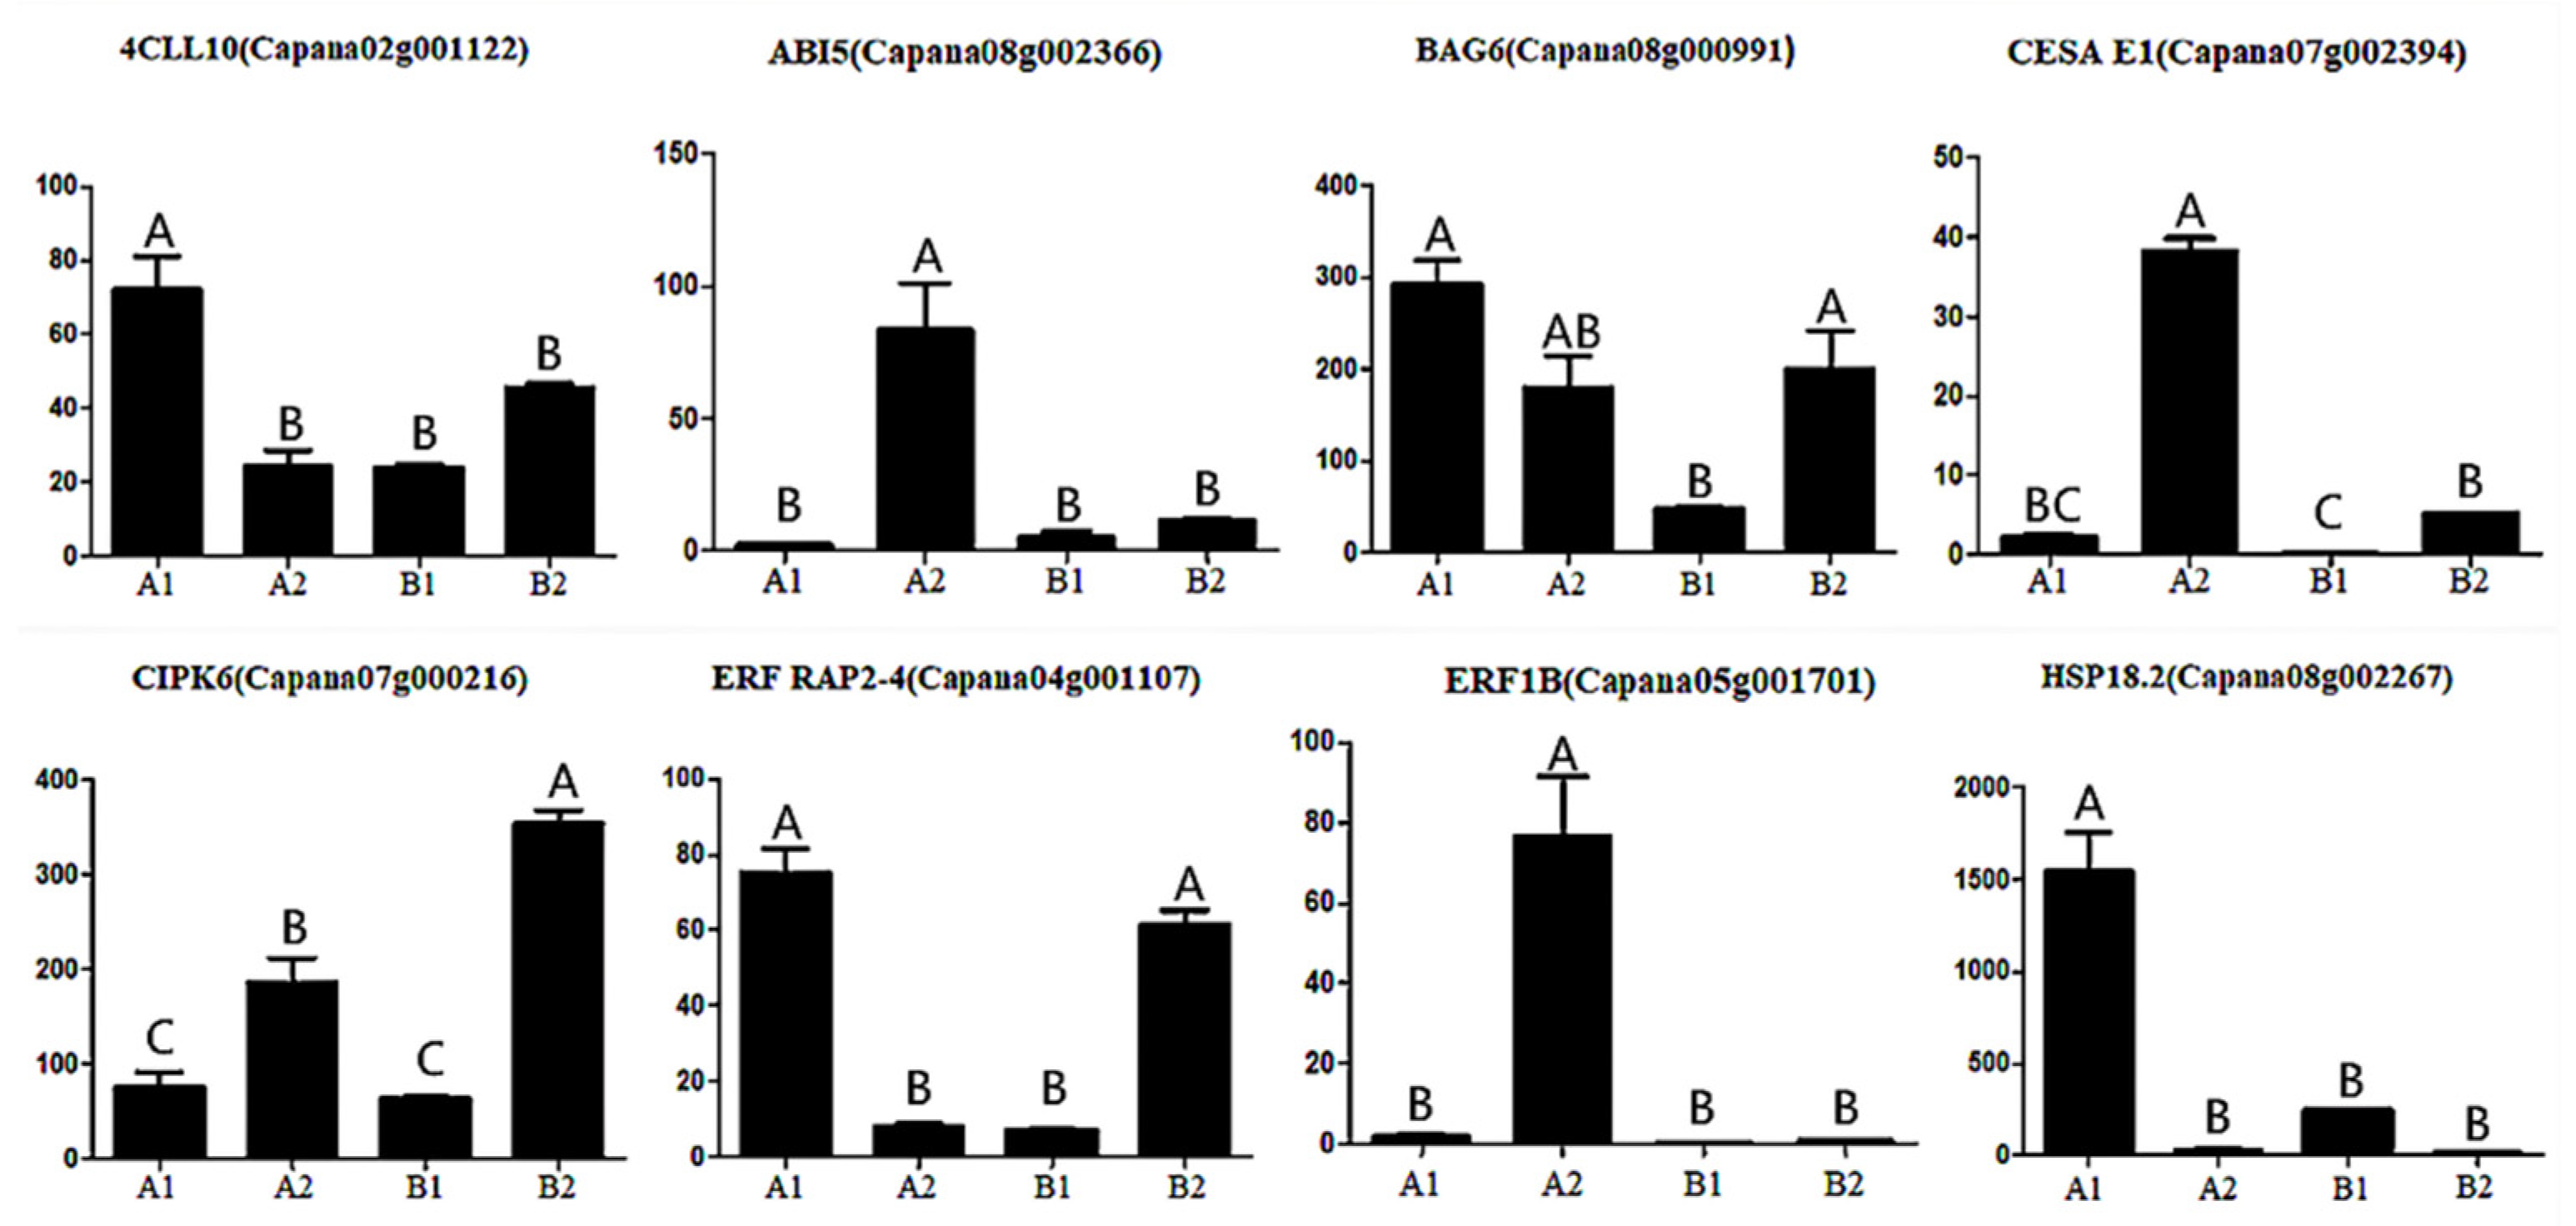
3.6. Verification of Gene Expression Pattern by qRT-PCR

In order to verify the results of ISO SEQ, eight selected genes (4CLL10, ABI5, BAG6, CESA E1, CIPK6, ERF RAP2-4, ERF1B, and HSP18.2) were analyzed by qRT-PCR with gene-specific primers. The transcriptional abundance patterns of three pepper fruits were calculated. When evaluated by real-time RT-PCR, qRT-PCR analysis showed a similar trend in transcript abundance (Figure 11), thus confirming that the FPKM value of each transcript determined by ISO SEQ was reliable in this study.

4. Discussion

Pepper is not a respiratory climacteric fruit, and a series of physiological and biochemical reactions will occur after harvest. During postharvest storage, physiological changes such as fruit softening, dehydration, and wilting are the main factors affecting its economic value. One of the important signs of fruit ripening is softening. Inhibiting or delaying the decrease in fruit hardness is of great importance for fruit storage and prolonging the sale period. During the ripening and softening of tomatoes, kiwi, strawberry, avocado, and other fruits, the decrease in fruit hardness is closely related to the increase in PG activity [25,26,27,28,29,30]. The changes in cell wall structure are closely related to fruit ripening and softening. The destruction of the internal structure of the cell wall is the most important reason for fruit softening. The dissociation of intercellular layers of the cell wall, the degradation of the middle lamella, and the disintegration of fibrous material lead to successive disintegration and destruction of cell organelles [31]. Studies have also shown that the degradation of pectin, including water-soluble pectin (WSP), CDTA-soluble pectin (CSP), and ion-bound pectin (SSP), directly leads to the decomposition of cellulose and hemicellulose, which intensifies fruit softening [32,33]. In this study, the PG activity and soluble pectin content of the two pepper lines both showed an increasing trend during postharvest storage, and the contents of cellulose and hemicellulose and fruit hardness showed a decreasing trend. However, the storage-tolerant variety A144 did not show significant change, while the non-storage-tolerant variety A361 showed significantly increased PG activity and soluble pectin content and significantly decreased cellulose content after storage, which is consistent with previous studies. Moreover, the soluble sugar content in pepper fruits decreased to various degrees at 3 days after harvest, suggesting that large amounts of nutrients are lost during the storage process, which seriously affects the fruit quality. However, the relationship between nutrient loss during storage and storage resistance is still unclear and needs further investigation.
Studies have shown that silencing the PG gene in apples can reduce the rate of fruit softening, indicating that the PG gene plays a key role in the ripening and softening of apple fruits [34]. Asif et al. [35] cloned four PG-related genes from banana fruits, of which MAPG3 and MAPG4 were thought to be related to plant maturation and regulated by ethylene, while MAPG2 was more closely related to fruit softening. Studies on a variety of fruits show that the pectin lyase (PEL) gene participates in the ripening and softening of both climacteric and nonclimacteric fruits [36,37,38], and it can accelerate fruit softening by lysing pectin aggregates. Cellulose is synthesized by CESA protein encoded by the CESA gene [39]. Gerasimo et al. [40] studied the function of the CESA3 gene in Arabidopsis mutants and showed that the accumulation of cellulose required a large amount of CESA. In this study, the expression of PG (Capana06g001141) in A361 was significantly higher than that in A144 after 3 days of storage, while the expression levels of genes that inhibit pepper fruit softening in A144 such as PGI (Capana02g003383), CESA (Capana07g002394), and WEI1 (Capana02g002054) were significantly higher than those in A361. This indicates that the different expression levels of genes such as PG, PGI, CESA, and WEI1 in A144 and A361 may be an important reason for the differences in storage and transportation resistance between the two materials.
Ethylene-responsive transcription factors (ERFs) are important factors for signal transduction, and fruit softening can be regulated by modulating the expression of ethylene-related genes. ERFs can promote the degradation of chlorophyll by regulating the related genes. For example, CitERF6 in sweet orange and ponkan can upregulate the expression of the CitPPH gene involved in chlorophyll degradation in fruits to promote fruit chlorosis, thereby accelerating fruit growth and senescence [41]. BR ERF72 in turnip can be induced by methyl jasmonate and upregulate genes involved in jasmonic acid synthesis to accelerate leaf aging [42]. ERFs can regulate ethylene biosynthesis and signal transduction by regulating the expression of key genes involved in ethylene synthesis. For example, the MdERF3 gene in apple fruits is induced by ethylene and can upregulate the expression of MdACS1, thereby accelerating the synthesis of ethylene and promoting fruit ripening [43]. So far, a number of ERFs have been identified in tomato, some of which can positively regulate fruit ripening and some of which can negatively regulate ripening. In this study, we found that there was no difference in ERF1B-like (Capana05g001701) and ERF3-like (Capana10g000161) expression before and after storage in A361 fruits, but the expression level of ERF1B-like (Capana05g001701) was significantly increased in A144 after storage, and the expression level of ERF3-like (Capana10g000161) was significantly decreased in A144 fruits after storage and was significantly lower than that in A361. Studies have shown that the overexpression of SlERF4 (Sl-ERF.B3) can inhibit fruit ripening and pigment accumulation [44], which is consistent with our results. SlERF1 (Sl-ERF.H) [45] and SlERF2 (Sl-ERF.E1) [46] can affect fruit softening by responding to ethylene and regulating ethylene synthesis genes. It has also been found that in bananas, MaERF9 and MaERF11 interact with ethylene synthesis genes ACS and ACO to regulate fruit ripening [47], suggesting that ERFs are involved in plant growth, development, and senescence. The differential expression of these ERFs found in this study may be an important reason for the different softening processes in the two pepper lines.
Different from the ripening of respiratory climacteric fruits, ABA plays a positive regulatory role in fruit ripening of both climacteric and nonclimacteric fruits [48,49,50]. Lara et al. showed that the endogenous ABA in the ‘Granny Smith’ apple peel might play a role in cold-induced ethylene synthesis by increasing the activity of ACO protein [51]. Exogenous ABA treatment can induce ethylene production by regulating the expression of ACS and ACO genes, thereby promoting the ripening of tomato fruits [52]. Many genes are expressed in the signal transduction of ABA plant hormones, among which genes such as PYR, PYL, PP2C, and SnRK2 play a major role. As a negative regulator of ABA signal transduction, PP2C negatively regulates the SnRK2 protein kinase, which is a positive regulator in ABA response, and they can be rapidly activated by ABA under the action of internal phosphorylation [53]. The Arabidopsis small ubiquitin-related modifier E3 ligase SIZ1 can protect ABI5 from protease degradation by SUMO modification, thereby negatively regulating the effect of ABA on seed germination [54]. In this study, the expression levels of ABI5 and PP2C (Capana03g000145) in A144 after 3 days of storage were significantly higher than those on the day of harvest and significantly higher than those in A361, but there was no significant change after storage in A361. The expression of SnRK2 (capana02g003135) and (capana08g001898) was significantly decreased after 3 days of storage in A144 fruits, but not in A361 fruits, and its expression was significantly lower in A144 than in A361. These results indicate that, after storage, the high expression of PP2C, a negative regulator of ABA signal transduction, and the low expression of SnRK2, a positive regulator in ABA response, can promote the obstruction of ABA synthesis and delay plant senescence in storage-resistant peppers A144, while promoting the synthesis of ABA and accelerating fruit softening and aging in the storage-intolerant pepper A361.
In recent years, due to the development of metabolomics, important progress and breakthroughs have been made in the postharvest research of fruits and vegetables. Metabolomics has become an important research method to reveal the mechanism of fruit and vegetable quality changes [55]. Studies have found that metabolites such as sugars, organic acids, amino acids, lipids, and amines participate in different biological metabolic pathways during fruit development [56]. Vandendriessche et al. [57] used nuclear magnetic resonance (NMR) to study the relationship between metabolic changes of apples during storage and the occurrence of internal browning; they found that there were metabolic differences between apples that were sensitive or not sensitive to browning, such as differences in pyruvate, citric acid, fumaric acid, alanine, acetaldehyde, and 3-hydroxybutanone. Monti et al. [58] performed metabolomics on 15 peach varieties and found that putrescine and pyruvate content decreased and maltose and xylose content increased with fruit ripening and senescence, showing that these metabolites can be useful as markers of postharvest peach maturity and senescence. In this study, we identified quercetin and quercetin 3-D-galactoside in A144 fruits, and their contents were significantly increased after 3 days of storage, while quercetin and quercetin 3-D-galactoside were not identified in A361. The content of indole-3-methyl acetate was significantly reduced after storage in A144 fruits, but not in A361, and its content was significantly lower in A144 fruits than that in A361. Wojdyło and Nowicka [59] analyzed the composition of Actinidia chinensis fruit and found that the fruit mainly contained total polyphenols and total flavonoids such as quercetin, quercetin, isoquercitrin, kaempferol, and proanthocyanidin. Quercetin, as a flavonoid, has antioxidation and antiaging functions [60,61]. Indole-3-acetic acid (IAA) is the main active component of natural plant auxins, and its physiological effects are very extensive, such as regulating the elongation and division of plant cells [62]. These results indicate that, after pepper harvest, the higher quercetin content and the lower indole-3-methyl acetate content were beneficial for delaying the softening of pepper fruit.

5. Conclusions

In this study, we found that the increase in PG activity and soluble pectin content and the decrease in hemicellulose, cellulose, and soluble sugar contents all promoted the softening of pepper fruit. A total of 7829 differentially expressed genes and 296 differential metabolites were identified, of which the number of upregulated genes was less than the number of downregulated genes. Through the KEGG enrichment analysis of these differential genes and metabolites, we found that the storage tolerance of pepper might be affected by the genes related to sugar metabolism, plant hormone signal transduction and protein synthesis and the metabolites related to flavonoid biosynthesis, glutathione metabolism, and cysteine and methionine metabolism, suggesting that the fruit may be positively or negatively regulated by phytohormone-transduction-related genes and flavonoid metabolites. We further identified the genes such as PG, PGI, ABI5, CESA, WEI1, and ERF and as the metabolites such as 13-ketooctadecadienoic acid; 9-hydroxyoctadecadienoic acid; and amino acids and their derivatives phenylalanine, glycyl-tyrosine, and indole-3-methyl acetate that might be important substances in regulating the softening of pepper fruit. Overall, our results provide a scientific reference for a deeper understanding of the complex regulatory mechanisms of pepper storage tolerance.

Supplementary Materials

The following are available online at https://www.mdpi.com/article/10.3390/horticulturae7080242/s1, Table S1. Quantitative identification of ERFs, Table S2. Number of metabolites identified, Table S3. The first thirty differential metabolites of |log2fc| > 2 in each comparison group, Table S4. Correlation analysis of the top 100 differential metabolites and the top 50 differential genes in p-value ranking.

Author Contributions

Conceived and designed the experiments: L.-J.O., X.-X.Z. and H.S. Performed the experiments: H.S., Q.L., M.C. and X.-H.Z. Analyzed the data: L.-Z.M., Q.-L.Y., Y.H. and C.-F.F. Contributed reagents/materials/analysis tools: H.S., Y.-H.D. and Z.-Y.L. Wrote the paper: H.S. All authors have read and agreed to the published version of the manuscript.

Funding

This work was funded by a project of the National Natural Science Foundation of China (U19A2028). The Key Research and Development Program of Hunan(2019NK2191).

Institutional Review Board Statement

Not applicable.

Informed Consent Statement

Not applicable.

Data Availability Statement

Transcriptome data has been uploaded to the public database and can be found in https://submit.ncbi.nlm.nih.gov/subs/. Found in, login number PRAJNA722115. Physiological data are included in the article.

Conflicts of Interest

The authors declare no conflict of interest.

References

  1. Liu, F.; Yu, H.; Deng, Y.; Zheng, J.; Liu, M.; Ou, L. PepperHub, an informatics hub for the chili pepper research community. Mol. Plant 2017, 10, 1129–1132. [Google Scholar] [CrossRef] [PubMed]
  2. Howard, L.R.; Talcott, S.T.; Brenes, C.H.; Villalon, B. Changes in phytochemical and antioxidant activity of selected pepper cultivars (Capsicum species) as influenced by maturity. J. Agric. Food Chem. 2000, 48, 1713–1720. [Google Scholar] [CrossRef]
  3. Zhou, X.H.; Tao, L.R.; Mei, N.; Liu, L. Research progress on low temperature storage technology of green pepper. Food Ferment. Technol. 2017, 53, 98–101. [Google Scholar]
  4. Dawson, D.M.; Watkins, C.B. Cell wall changes in nectarines (Prunuspersica): Solubilization and depolymerization of pectic and neutral polymers during ripening and in mealy Fruit. Plant Physiol. 1992, 100, 1203–1210. [Google Scholar] [CrossRef] [Green Version]
  5. Brummell, D.A.; Harpster, M.H.; Dunsmuir, P. Differential expression of expansin gene family members during growth and ripening of tomato fruit. Plant Mol. Biol. 1999, 39, 161–169. [Google Scholar] [CrossRef] [PubMed]
  6. Rose, J.K.C.; Bennett, A.B. Cooperative disassembly of the cellulose–xyloglucan network of plant cell walls: Parallels between cell expansion and fruit ripening. Trends Plant Sci. 1999, 4, 176–183. [Google Scholar] [CrossRef]
  7. Montgomery, J.; Pollard, V.; Deikman, J.; Fischer, R.L. Positive and negative regulatory regions control the spatial distribution of polygalacturonase transcription in tomato fruit pericarp. Plant Cell 1993, 5, 1049–1062. [Google Scholar] [PubMed] [Green Version]
  8. Hadfield, K.A.; Rose, J.K.C.; Yaver, D.S.; Berka, R.M.; Bennett, A.B. Polygalacturonase gene expression in ripe melon fruit supports a role for polygalacturonase in ripening-associated pectin disassembly. Plant Physiol. 1998, 117, 363–373. [Google Scholar] [CrossRef] [Green Version]
  9. Yonder, M.D.; Keen, N.T.; Jurnak, F. New domain motif: The structure of pectatelyase C, a secreted plant virulence factor. Science 1993, 260, 1503–1507. [Google Scholar] [CrossRef]
  10. Smith, D.L. A family of at least seven β-galactosidase genes is expressed during tomato fruit development. Plant Physiol. 2000, 123, 1173–1184. [Google Scholar] [CrossRef] [Green Version]
  11. Ross, G.S.; Wegrzyn, T.; Macrae, E.A.; Redgwell, R.J. Apple β-Galactosidase: Activity against cell wall polysaccharides and characterization of a related cDNA clone. Plant Physiol. 1994, 106, 521–528. [Google Scholar] [CrossRef] [PubMed] [Green Version]
  12. Lockhart, D.J.; Winzeler, E.A. Genomics, gene expression and DNA arrays. Nature 2000, 405, 827–836. [Google Scholar] [CrossRef]
  13. Guo, S.; Sun, H.; Zhang, H.; Liu, J.; Ren, Y.; Gong, G. Comparative Transcriptome Analysis of Cultivated and Wild Watermelon during Fruit Development. PLoS ONE 2015, 10, e0130267. [Google Scholar] [CrossRef]
  14. Dessireé, Z.C.; Patricia, E.; Eric, M.N.; Marco, V.S.; Raúl, H.; Víctor, M. Transcription analysis of softening-related genes during postharvest of papaya fruit (Carica papaya L. ‘Pococí’hybrid). Postharvest Biol. Technol. 2017, 125, 42–51. [Google Scholar]
  15. Osorio, S.; Carneiro, R.T.; Lytovchenko, A.; Mcquinn, R.; Srensen, I.; Vallarino, J.G. Genetic and metabolic effects of ripening mutations and vine detachment on tomato fruit quality. Plant Biotechnol. J. 2019, 18, 106–118. [Google Scholar] [CrossRef] [Green Version]
  16. Tietel, Z.; Lewinsohn, E.; Fallik, E.; Porat, R. Elucidating the Roles of Ethanol Fermentation Metabolism in Causing Off-Flavors in Mandarins. J. Agric. Food Chem. 2011, 59, 11779–11785. [Google Scholar] [CrossRef]
  17. Andrews, P.K.; Li, S.L. Cell wall hydrolytic enzyme activity during development of nonclimacteric sweet cherry (Prunus avium L.) fruit. J. Hortic. Sci. 1995, 70, 561–567. [Google Scholar] [CrossRef]
  18. Min, L.; Li, Y.; Hu, Q.; Zhu, L.; Gao, W.; Wu, Y. Sugar and auxin signaling pathways respond to high-temperature stress during anther development as revealed by transcript profiling analysis in cotton. Plant Physiol. 2014, 164, 1293–1308. [Google Scholar] [CrossRef] [Green Version]
  19. Zhang, L.; Chen, F.; Yang, H.; Sun, X.; Liu, H.; Gong, X. Changed in firmness, pectin content and nanostructure of two crisp peach cultivars after storage. LWT Food Sci. Technol. 2010, 43, 26–32. [Google Scholar] [CrossRef]
  20. Cai, S.; Lashbrook, C.C. Laser capture microdissection of plant cells from tape-trans-ferredparaffin sections promotes recovery of structurallyintact RNA for global gene profiling. Plant J. 2006, 48, 628–637. [Google Scholar] [CrossRef]
  21. Want, E.J.; Masson, P.; Michopoulos, F.; Wilson, I.D.; Theodoridis, G.; Plumb, R.S. Global metabolic profiling of animal and human tissues via UPLC-MS. Nat. Protoc. 2012, 8, 17–32. [Google Scholar] [CrossRef] [PubMed]
  22. Ping, L.; Weidong, D.; Peiyuan, Y.; Zhongda, Z.; Hongwei, K.; Lina, Z. Multiple Reaction Monitoring-Ion Pair Finder: A systematic approach to transform non-targeted mode to pseudo-targeted mode for metabolomics study based on liquid chromatography-mass spectrometry. Anal. Chem. 2015, 87, 5050–5055. [Google Scholar]
  23. Osorio, S.; Alba, R.; Nikoloski, Z.; Kochevenko, A. Integrative Comparative Analyses of Transcript and Metabolite Profiles from Pepper and Tomato Ripening and Development Stages Uncovers Species-Specific Patterns of Network Regulatory Behavior. Plant Physiol. 2012, 159, 1713–1729. [Google Scholar] [CrossRef] [Green Version]
  24. Livak, K.J.; Schmittgen, T.D. Analysis of Relative Gene Expression Data using Real-Time Quantitative PCR. Methods 2002, 25, 402–408. [Google Scholar] [CrossRef]
  25. Ali, Z.M.; Chin, L.H.; Lazan, H. A comparative study on wall degrading enzymes, pectin modifications and softening during ripening of selected tropical fruits. Plant Sci. 2004, 167, 317–327. [Google Scholar] [CrossRef]
  26. Bonghi, C.; Pagni, S.; Vidrih, R.; Ramina, A.; Tonutti, P. Cell wall hydrolases and amylase in kiwifruit softening. Postharvest Biol. Technol. 1996, 9, 19–29. [Google Scholar] [CrossRef]
  27. Huber, D.J. Strawberry Fruit Softening: The potential roles of polyuronides and hemicelluloses. J. Food Sci. 2010, 49, 1310–1315. [Google Scholar] [CrossRef]
  28. Villarreal, N.M.; Rosli, H.G.; Martínez, G.A.; Civello, P.M. Polygalacturonase activity and expression of related genes during ripening of strawberry cultivars with contrasting fruit firmness. Postharvest Biol. Technol. 2008, 47, 141–150. [Google Scholar] [CrossRef]
  29. Huber, D.J.; O’Donoghue, E.M. Polyuronides in avocado (Perseaamericana) and tomato (Lycopersiconesculentum) fruits exhibit markedly different patterns of molecular weight downshifts during ripening. Plant Physiol. 1993, 102, 473–480. [Google Scholar] [CrossRef] [Green Version]
  30. Kutsunai, S.Y.; Lin, A.C.; Percival, F.W.; Christoffersen, L.R.E. Ripening-related polygalacturonase cDNA from avocado. Plant Physiol. 1993, 103, 289–290. [Google Scholar] [CrossRef] [PubMed] [Green Version]
  31. Posé, S.; Paniagua, C.; Matas, A.; Gunning, A.P.; Morris, V.J.; Quesada, M.A.; Mercado, J.A. A nanostructural view of the cell wall disassembly process during fruit ripening and postharvest storage by atomic force microscopy. Trends Food Sci. Technol. 2018, 87, 47–58. [Google Scholar] [CrossRef]
  32. Chen, Y.H.; Hung, Y.C.; Chen, M.Y.; Lin, H.T. Effects of acidic electrolyzed oxidizing water on retarding cell wall degradation and delaying softening of blueberries during postharvest storage. LWT Food Sci. Technol. 2017, 84, 650–657. [Google Scholar] [CrossRef]
  33. Chen, Y.H.; Sun, J.Z.; Lin, H.T.; Hung, Y.C.; Zhang, Y.F. Paper-based 1-MCP treatment suppresses cell wall metabolism and delays softening of Huanghua pears during storage. J. Sci. Food Agric. 2017, 97, 2547–2552. [Google Scholar] [CrossRef]
  34. Atkinson, R.G.; Sutherland, P.W.; Johnston, S.L.; Gunaseelan, K.; Hallett, I.C.; Mitra, D. Down-regulation of polygalacturonase 1 alters firmness, tensile strength and water loss in apple (Malusx domestica) fruit. BMC Plant Biol. 2012, 12, 129. [Google Scholar] [CrossRef] [Green Version]
  35. Asif, M.H.; Nath, P. Expression of multiple forms of polygalacturonase gene during ripening in banana fruit. Plant Physiol. Biochem. 2005, 43, 177–184. [Google Scholar] [CrossRef]
  36. Pua, E.C.; Ong, C.K.; Liu, P.; Liu, J.Z. Isolation and expression of two pectatelyase genes during fruit ripening of banana (Musa acuminata). Physiol. Plant. 2010, 113, 92–99. [Google Scholar] [CrossRef]
  37. Nieves, S.D.; Silvia, J.B.; Matas, A.J.; Rose, J.K.C.; Juan, M.B.; Mercado, J.A.; Quesada, M.A. Antisense inhibition of a pectatelyase gene supports a role for pectin depolymerization in strawberry fruit softening. J. Exp. Bot. 2008, 59, 2769–2779. [Google Scholar]
  38. Youssef, S.M.; Silvia, J.B.; Bellido, M.L.; Martín-Pizarro, C.; Barceló, M.; Abdal-Aziz, S.A.; Caballero, J.L. Fruit yield and quality of strawberry plants transformed with a fruit specific strawberry pectatelyase gene. Sci. Hortic. 2009, 119, 120–125. [Google Scholar] [CrossRef]
  39. Song, L.; Yu, J.; Tian, P.; Hu, X.; Wang, Q.; Pan, Y. Genome-wide characterization of the cellulose synthase gene superfamily in Solanum lycopersicum. Gene 2019, 688, 71–83. [Google Scholar] [CrossRef]
  40. Daras, G.; Rigas, S.; Penning, B. Thethanatos mutation in Arabidopsis thalianacellulose synthase3 (AtCesA3) has adominant-negative effect on cellulose synthesis and plant growth. New Phytol. 2009, 184, 114–126. [Google Scholar] [CrossRef] [PubMed]
  41. Li, S.; Xie, X.; Liu, S. Auto-and mutual-regulation between two CitERFs contribute to ethyleneinduced citrus fruit degreening. Food Chem. 2019, 299, 125163. [Google Scholar] [CrossRef]
  42. Tan, X.L.; Fan, Z.Q.; Shan, W.; Yin, X.R.; Kuang, J.F.; Lu, W.J.; Chen, J.Y. Association of BrERF72 with methyl jasmonate-induced leaf senescence of Chinese flowering cabbage through activating JA biosynthesis-related genes. Hortic. Res. 2018, 5, 1–11. [Google Scholar] [CrossRef] [PubMed] [Green Version]
  43. Tong, L.; Jiang, Z.; Zhang, L.; Tan, D.; Yun, W.; Hui, Y.; Li, T.; Wang, A. Apple (Malusdomestica) MdERF2 negatively affects ethylene biosynthesis during fruit ripening by suppressing MdACS1 transcription. Plant J. 2016, 88, 735–748. [Google Scholar]
  44. Liu, M.; Diretto, G.; Pirrello, J.; Roustan, J.-P.; Li, Z.; Giuliano, G.; Regad, F.; Bouzayen, M. The chimeric repressor version of an ethylene response factor (ERF) family member, Sl-ERF.B3, shows contrasting effects on tomato fruit ripening. New Phytol. 2014, 203, 206–218. [Google Scholar] [CrossRef] [PubMed] [Green Version]
  45. Li, Y.; Zhu, B.; Xu, W.; Zhu, H.; Chen, A.; Xie, Y.; Shao, Y.; Luo, Y. LeERF1 positively modulated ethylene triple response on etiolated seedling, plant development and fruit ripening and softening in tomato. Plant Cell Rep. 2007, 26, 1999–2008. [Google Scholar] [CrossRef]
  46. Zhang, Z.; Zhang, H.; Quan, R.; Wang, X.C.; Huang, R. Transcriptional regulation of the ethylene response factor LeERF2 in the expression of ethylene biosynthesis genes controls ethylene production in tomato and tobacco. Plant Physiol. Biochem. 2009, 150, 365–377. [Google Scholar] [CrossRef] [Green Version]
  47. Xiao, Y.Y.; Chen, J.Y.; Kuang, J.F.; Shan, W.; Xie, H.; Jiang, Y.M.; Lu, W.J. Banana ethylene response factors are involved in fruit ripening through their interactions with ethylene biosynthesis genes. J. Exp. Bot. 2013, 64, 2499–2510. [Google Scholar] [CrossRef] [Green Version]
  48. Gupta, M.K.; Lenka, S.K.; Gupta, S.; Rawal, R.K. Agonist, antagonist and signaling modulators of ABA receptor for agronomic and post-harvest management. Plant Physiol. Biochem. 2020, 148, 10–25. [Google Scholar] [CrossRef]
  49. Jiang, Y.; Joyce, D.C. ABA effects on ethylene production, PAL activity, anthocyanin and phenolic contents of strawberry fruit. Plant Growth Regul. 2003, 39, 171–174. [Google Scholar] [CrossRef]
  50. Chai, Y.M.; Jia, H.F.; Li, C.L. FaPYR1 is involved in strawberry fruit ripening. J. Exp. Bot. 2011, 62, 5079–5089. [Google Scholar] [CrossRef] [Green Version]
  51. Lara, I.; Vendrell, M. Cold-induced ethylene biosynthesis is differentially regulated in peel and pulp tissues of ‘Granny Smith’ apple fruit. Postharvest Biol. Technol. 2003, 29, 109–119. [Google Scholar] [CrossRef]
  52. Zhang, M.; Yuan, B.; Leng, P. The role of ABA in triggering ethylene biosynthesis and ripening of tomato fruit. J. Exp. Bot. 2009, 60, 1579–1588. [Google Scholar] [CrossRef] [PubMed] [Green Version]
  53. Ma, Y.; Szostkiewicz, I.; Korte, A.; Moes, D.; Yang, Y.; Christmann, A.; Grill, E. Regulators of PP2C phosphatese activity functions as acid sensors. Science 2009, 324, 1064–1068. [Google Scholar]
  54. Miura, K.; Lee, J.; Jin, J.B.; Chan, Y.Y.; Miura, T.; Hasegawa, P.M. Sumoylation of ABI5 by the Arabidopsis SUMO E3 ligase SIZ1 negatively regulates abscisic acid signaling. Proc. Natl. Acad. Sci. USA 2009, 106, 5418–5423. [Google Scholar] [CrossRef] [Green Version]
  55. Picone, G.; Trimigno, A.; Tessarin, P.; Donnini, S.; Rombolà, A.D.; Capozzi, F. 1H NMR foodomics reveals that the biodynamic and the organic cultivation managements produce different grape berries (Vitisvinifera L. cv. Sangiovese). Food Chem. 2016, 213, 187–195. [Google Scholar] [CrossRef]
  56. Lasanajak, Y.; Minocha, R.; Minocha, S.C.; Goyal, R.; Fatima, T.; Handa, A.K.; Mattoo, A.K. Enhanced flux of substrates into polyamine biosynthesis but not ethylene in tomato fruit engineered with yeast S-adenosylmethionine decarboxylase gene. Amino Acids 2014, 46, 729–742. [Google Scholar] [CrossRef]
  57. Vandendriessche, T.; Schäfer, H.; Verlinden, B.E.; Humpfer, E.; Hertog, M.; Nicolaï, B.M. High-throughput NMR based metabolic profiling of ‘Braeburn’ apple in relation to internal browning. Postharvest Biol. Technol. 2013, 80, 18–24. [Google Scholar] [CrossRef]
  58. Monti, L.L.; Bustamante, C.A.; Osorio, S.; Gabilonodo, J.; Borsani, J.; Lauxmann, M.A.; Maulion, E.; Valentini, G.; Budde, C.O.; Fernie, A.R.; et al. Metabolic profiling of a range of peach fruit vareties reveals high metabolic diversity and commonalities and differences during ripening. Food Chem. 2016, 190, 879–888. [Google Scholar] [CrossRef]
  59. Wojdyło, A.; Nowicka, P. Anticholinergic effects of actinidiaarguta fruits and their polyphenol content determined by liquid chromatography-photodiode array detector-quadrupole/time of flight-mass spectrometry (LC-MS-PDA-Q/TOF). Food Chem. 2019, 271, 216–223. [Google Scholar] [CrossRef]
  60. Bischoff, S.C. Quercetin: Potentials in the prevention and therapy of disease. Curr. Opin. Clin. Nutr. Metab. Care 2008, 11, 733–740. [Google Scholar] [CrossRef]
  61. Lesjak, M.; Beara, I.; Simin, N. Antioxidant and anti-inflammatory activities of quercetin and its derivatives. J. Funct. Foods 2017, 40, 68–75. [Google Scholar] [CrossRef]
  62. Duan, N.; Jia, Y.K.; Xu, J.; Chen, H.L.; Sun, P. Research progress of plant endogenous hormones. Chin. Agric. Sci. Bull. 2015, 31, 159–165. [Google Scholar]
Figure 1. Physiological indexes of pepper before and after storage. Annotation: The abscissa represents different groups; the ordinate represents the content. A1 represents A144 material stored for 0 days; A2 represents A144 material stored for 3 days; B1 represents A361 material stored for 0 days; B2 represents A361 material stored for 3 days. Different letters above the bar chart indicate significant differences (p < 0.01).
Horticulturae 07 00242 g001
Figure 2. Paraffin section of pepper before and after storage. Annotation: A1 represents A144 material stored for 0 days; A2 represents A144 material stored for 3 days; B1 represents A361 material stored for 0 days; B2 represents A361 material stored for 3 days.
Horticulturae 07 00242 g002
Figure 3. Venn analysis of differentially expressed genes. Annotation: (A) A1 represents A144 material stored for 0 days; A2 represents A144 material stored for 3 days; B1 represents A361 material stored for 0 days; B2 represents A361 material stored for 3 days. (B) A1/B1 means A1 compared to B1; A2/B2 means A2 compared to B2; B2/B1 means B2 compared to B1; A2/A1 means A2 compared to A1.
Horticulturae 07 00242 g003
Figure 4. Heat map analysis of storage tolerance genes. Annotation: (A) Genes or samples with similar expression patterns in the heat map are gathered together. The color in each grid does not reflect the gene expression value, but the value obtained after homogenizing the rows of expression data (generally between −2 and 2), so the colors in the heat map can only be compared horizontally (the expression of the same gene in different samples); vertical comparison (expression of different genes in the same sample) is not allowed. (B): Expression of representative genes among different samples.
Horticulturae 07 00242 g004
Figure 5. GO analysis of differentially expressed genes. Annotation: The numbers in the diagram represent the number of genes in the enrichment. The higher the number, the redder the color; the lower the number, the greener the color. A1/B1 means A1 compared to B1; A2/B2 means A2 compared to B2; B2/B1 means B2 compared to B1; A2/A1 means A2 compared to A1.
Horticulturae 07 00242 g005
Figure 6. KEGG enrichment analysis of differentially expressed genes. Annotation: (A) A2 compared to A1; (B) B2 compared to B1; (C) A1 compared to B1; (D) A2 compared to B2. The horizontal coordinate in the figure is the ratio of the number of different genes and the total number of genes annotated to KEGG pathway. The ordinate is KEGG pathway, the size of the point represents the number of genes annotated to KEGG pathway, red represents the significant enrichment, and purple represents the small enrichment significance.
Horticulturae 07 00242 g006
Figure 7. Heat map analysis of ERFs. Annotation: Different colors represent different FPKM values; red represents higher FPKM values, and blue represents lower FPKM values.
Horticulturae 07 00242 g007
Figure 8. Comparative analysis of ABA signal transduction pathway genes. Annotation: The deeper the green, the lower the gene expression. The deeper the red, the higher the gene expression.
Horticulturae 07 00242 g008
Figure 9. Venn analysis of different metabolites. Annotation: A1/B1 means A1 compared to B1; A2/B2 means A2 compared to B2; B2/B1 means B2 compared to B1; A2/A1 means A2 compared to A1.
Horticulturae 07 00242 g009
Figure 10. Association analysis of differential genes and KEGG pathways. Annotation: (A) A2 compared to A1; (B) B2 compared to B1. The abscissa is the ratio of the number of different metabolites or genes enriched in the pathway to the number of metab-olites or genes annotated in the pathway, and the ordinate is the KEGG pathway co-enriched by metabolomics and transcriptomics. Count: the number of metabolites or genes enriched in the pathway.
Horticulturae 07 00242 g010
Figure 11. Expression analysis of 8 genes in pepper during different storage periods. Annotation: The horizontal coordinate represents different groups, and the ordinate represents the gene expression. Different letters above the bar chart indicate significant differences (p < 0.01).
Horticulturae 07 00242 g011
Publisher’s Note: MDPI stays neutral with regard to jurisdictional claims in published maps and institutional affiliations.

