Article

Effects of Temperature and Photoperiod on the Flower Potential in Everbearing Strawberry as Evaluated by Meristem Dissection

1
Department of Biosystems and Technology, Swedish University of Agricultural Sciences, 234 22 Lomma, Sweden
2
Department of Plant Protection Biology, Swedish University of Agricultural Sciences, 234 22 Lomma, Sweden
3
Department of Horticulture, Division of Food Production and Society, NIBIO-Norwegian Institute of Bioeconomy Research, 1431 Ås, Norway
*
Author to whom correspondence should be addressed.
Horticulturae 2021, 7(11), 484; https://doi.org/10.3390/horticulturae7110484
Submission received: 29 September 2021 / Revised: 5 November 2021 / Accepted: 6 November 2021 / Published: 10 November 2021
(This article belongs to the Collection New Challenges in Productivity of Berry Fruits)

Abstract

:
The growing interest in using everbearing (EB) strawberry cultivars to extend the cultivation period has faced some challenges. These include poor runner production due to its perpetual flowering nature; irregular flowering behavior and extended periods of high temperature have caused floral inhibition and reduced yield. As flowering is an interplay between temperature and photoperiod, it is important to investigate the effects of this interaction on the cultivation. Therefore, this study used meristem dissection as a tool to study the effect of temperature and photoperiod on meristem development. Tray plants of two EB strawberry cultivars ‘Florentina’ and ‘Favori’ were grown at 20 °C, 25 °C, and 30 °C under short day (SD) conditions, and subsequently at 20 °C under long day (LD) conditions. The meristem development was analysed every 6 weeks for a 15-week period in SD and for 14 weeks in LD conditions using meristem dissection. The plants showed similar flowering patterns to previously studied everbearing cultivars, which was qualitative LD plants at high temperatures and quantitative LD plants at lower temperatures. Our results show that meristem dissection can be used to determine the temperature and photoperiodic effect on meristem development, and for the occurrence of cropping peaks, and can therefore be used to decide the environmental input and to evaluate yield potential.

1. Introduction

Strawberry is an economically important crop, with European production estimated to be 1.7 million tons annually, accounting for 20% of the world strawberry production [1]. Despite the short summers, strawberry is also an important fruit in the Nordic countries. Due to the cold climate, seasonally flowering (SF) cultivars are favored in open fields, and this results in a short cultivation period [2,3]. Different techniques are used to extend the growing season to meet the increasing demands. This is conventionally done through environmental manipulation, using forcing and protecting systems, such as greenhouses and tunnels [3,4,5,6,7].
Strawberries grown in controlled systems are protected against damage caused by weather conditions (e.g., rain and hail), and other benefits include a better environmental control of optimal growing temperature and light intensity, which improves plant and fruit quality and thus has an increased yield [8]. However, this only enhances the cultivation by a few weeks. The growing period can be further extended using everbearing (EB) cultivars that have several crop flushes throughout the cultivation period [3,6,9]. In such systems, cold stored tray plants with already initiated flowers are preferred as a starting material to program the production [10,11].
The key to early fruit production is the control of flowering and hence there is a lot of published research focused on the factors that affect vegetative and generative reproduction [12,13]. It is well known that the interaction between temperature and photoperiod affect flowering, and the threshold is cultivar dependent [10,14].
SF cultivars are classified as facultative short day (SD) plants [15,16]; however, variations between cultivars have been reported [10,13,17]. At low temperatures of ≤10 °C, SF strawberries flower irrespectively of photoperiod, and at high temperatures above approximately 24 °C, flowering is inhibited [5,12,18]. At intermediate temperatures, between 18–20 °C, SD is needed for flower induction [18,19], with a critical photoperiod of 14–15 h [14,19]. EB cultivars are qualitative long day plants (LD) at high temperatures and quantitative LD plants at intermediate temperatures; while at low temperatures (<15 °C) they are photoperiodically insensitive [12,13,20].
The strawberry meristem may remain dormant or differentiate into either a leaf rosette, known as a branch crown, or a runner [18,21]. Branch crowns provide a platform for inflorescences, while a runner is a vegetative elongated shoot with a terminal daughter plant that can be used for clonal propagation. As a meristem can differentiate into a single structure only, both structures are inversely proportional and compete for resources [22].
The development of the meristem has been observed and systematically evaluated under both light and electron microscopes [23,24,25,26], classified as plant architectural studies or, as commercially known, flower mapping [27]. Flower mapping (FM) describes the position and developmental stage of each meristem on a plant through dissection [28]. These stages are described based on the formation of floral structures on the meristems and various studies have compiled different stages [23,24,25,28,29,30,31,32,33], with the most extensive description of different developmental stages presented in the general Biologische Bundesanstalt, Bundessortenamt und CHemische (BBCH) scale [34], which expands from germination to senescence. The change in the stages over time is in response to a stimulus, so FM can also give a better understanding of the plants’ responses to environmental factors [27].
Temperature directly influences the length of the growing season, and therefore fluctuations in the climate would result in irregular flowering patterns [35]. When tunnel temperatures increase unexpectedly, high temperatures may affect flower and fruit quality as well as quantity [13,36,37,38,39]. Although the effect of high temperature on the development of reproductive and vegetative structures in EB cultivars have been previously reported [13,38,40,41], in most of these studies the plants were moved after treatment in control climate rooms optimal for growth. Furthermore, there are only a few studies on cropping flushes [7,42,43], as well as limited information on how EB cultivars perform under tunnel conditions in Nordic regions [3], especially with increasing summer temperatures.
This study was conducted to investigate the effects of temperature on meristematic fate, and subsequently, to estimate the development of the next flush in two everbearing strawberry cultivars. The experiment was also designed to evaluate flower mapping as a tool to study and estimate meristematic developmental stages, leading to flowering in everbearing cultivars. The results from this work can therefore be used to improve production by selecting plants based on their behavior and meristematic development.

2. Materials and Methods

Two experiments were conducted in natural ambient SD and LD, separately, in greenhouse chambers at the Swedish University of Agricultural Sciences in Alnarp (55.7° N, 13.1° E). The SD experiment assessed the favorable temperature for flowering, while the LD experiment evaluated the differences between the cultivars at optimum temperatures and photoperiods.

2.1. Plant Material

Cold tray plants (class A+) of two everbearing strawberry cultivars ‘Florentina’ and ‘Favori’ were received from Van den Elzen Plants, the Netherlands, on 18 December 2019, and kept in cold storage at 4 °C for a week upon arrival. The first flower mapping was done when the plants were potted, to record the stage of the meristems of the stating material at the start of the experiments (W0). The two cultivars were chosen based on their flowering and yield performance in a pilot study tested in a tunnel system.

2.2. Experimental Design

The experiment set-ups are summarized in Table 1, showing the temperature treatments in SD (Expt. 1) and LD (Expt. 2). The duration of the SD experiment was 15 weeks, from December to April, while the duration of the LD experiment was 14 weeks, from April to July. Plants of same size and origin were used in both experiments after planting for Expt. 1, the remaining plants were kept in cold store at 4 °C for 4 months until the start of Expt. 2, in April 2020. In both experiments, growth parameters such as plant height, number of leaves, and runners were recorded.

2.2.1. Experiment 1—SD Experiment

The plants were grown in peat-based soil (Weibull Horto, Hammenhög, Sweden), under an average of 8.5 h ambient SD, increasing from 7 to 10 h photoperiod from start to end of the experiment at three day/night temperatures (Table 1) in three separate greenhouse chambers, with natural and artificial light. Temperature fluctuations were kept within ±2.0 °C and the average humidity level was up to 75%. In addition to the natural daylight, plants were supplemented with 200 µmol·m−2·s–1 photosynthetic photon flux density (PPFD) from high pressured sodium lamps (HPS Philips GreenPower 400 W, Philips, Eindhoven, The Netherlands), which provided continuous light for 7 h, from 09:00 a.m. to 16:00 p.m. throughout experiment 1, in addition to the natural daylight. A central computer in the greenhouse controlled both the light and ventilation. Four plants were potted in 11 L pots in December 2019 and were shifted to their respective treatment rooms on the same day. The remaining plants were kept in the cold room (4 °C) to be used in Expt. 2. The plants were watered (100 mL/pot) daily and visually inspected. The watering was further adapted to the different needs of individual plants through visual inspection, and therefore the plants in the 30 °C treatment was given additional water when the substrate dried.
The plants were fertilized with a nutrient mixture of Kristalon superba red (YaraTera kristalon Super Red; NPK 12-5-30 with S and micro; EC = 1.3 mS/cm) and Calcinit (YaraTera Calcinit; total N 15.5%, N 14.4%, Ammoniacal N 1.1%, CaO 19%; EC = 1.1 mS/cm). Super Red was administered twice a week with an amount of ½ dl per pot, while ½ dl per pot of Calcinit was administered once a week. Furthermore, yellow sticky PE traps (Horiver, Koppert B.V., Mechelen, Belgium) were used for the control of insects and Swirski Ulti-Mites (Koppert B.V., Mechelen, Belgium) for the control of thrips.

2.2.2. Experiment 2—LD Experiment

Expt. 2 in LD was set up like Expt. 1 (Table 1), except for a few modifications as follows. The plants were grown at 20 °C under an average of 17.5 h of ambient LD, increasing from 16 to 18 h over the period of the experiment, in a greenhouse chamber. The average day/night temperature was 22/17 °C. Apart from natural light, HPS (400 W) lamps provided 200 µmol·m−2·s–1 PPFD supplement light for 16 h, from 05:00 a.m. to 21:00 p.m. Four plants from the same starting material as for Expt. 1 were potted in 11 L pots on 22 April 2020, and were moved to the 20 °C chamber on the same day. The plants were watered (100 mL/ pot) twice a day for the first two weeks and once a day thereafter. Fertilizer and plant protection methods used was similar to Expt. 1.

2.3. Data Collection

2.3.1. Morphological Changes

Plant development (plant height, number of leaves, and runners) was recorded in 0, 5, 8, 10, 12, and 14 weeks after potting for Expt. 1, and 0, 2, 3, 4, 5, 6, 7, 8, 9, 10, 11, 12, 13, and 14 weeks for Expt. 2. The last fully developed leaf was marked weekly using a permanent marker. Runners and dead leaves were removed and the fate of the meristem at the axil of the dead leaf was recorded twice a week. Plant height (cm) was measured for each plant in each treatment, and the measurements were taken from the top of the rooting system to the most evenly formed canopy. The first measurement was recorded when the plants were potted and denoted as week 0 and continued for 14 weeks.
Every two days, new fully open flowers were recorded and removed, and the total number of flowers was calculated from these data for the whole experimental period for Expt. 1. For Expt. 2, half of the plants per cultivar were used to record the fruit yield, while the flowers of the other half were counted and removed to avoid repeated counting.
A flowering flush was categorized using data from plants grown at 30 °C, when the percentage of plants producing new flowers remained constant for two weeks. The following week was considered as the start of a new flush.

2.3.2. Flower Mapping and Meristem Scoring

FM was conducted three times during each experiment. The first FM was at week 0, to observe the state of the plants at planting, and the next two FMs were 2.5 weeks after the plants stopped flowering, 6 and 12 weeks after potting, respectively, for both experiments. On the final day of the experiment (week 15 for Expt. 1 and week 14 for Expt. 2), all the remaining plants were dissected, weighted, and the fate of the meristem was visually recorded (without the use of a microscope) as either vegetative (<S5) or generative (>S5).
Flowering was evaluated by dissecting seven randomly selected plants from each treatment for each cultivar and the development of the meristem was recorded per leaf axil (AXM). The scoring was done under a stereo optical light microscope (Olympus VMT 4F) based on a simplified scale [23,24,25,28,29,30,31,32,33], as shown in Table 2.
The anatomical changes below S4 were not distinguishable with the resolution of a stereo microscope, and thus anything below this stage was recorded as S3 and was counted as vegetative.
Towards the end of the experiment, the strawberry architecture was complex and most of the meristems observed in plants ‘Favori’ cv. were reproductive or had formed fully open flowers (S9), while plants ‘Florentina’ cv. were still actively producing new leaves (Figure 1B) and therefore had fewer meristems at advanced stages and the older meristems were at a stage that was visually distinguishable. Hence, after 14 weeks, the remaining plants were dissected, and all meristems were scored as either reproductive (>S6) or vegetative (S3 or runner) to get an estimate of the number of meristems and their developmental stage per plant per cultivar in each treatment. This was done by visual observation without the microscope; hence stages from 6 (S6) were observable. Dead buds were excluded from the experiment.

2.3.3. Biomass and Dry Weight

At the end of both experiments, after harvesting the fruits, the shoot system and the root system of the plants was separated at the start of the root system and weighted separately to determine the shoot and root fresh weight, respectively. The plants were then dried in an oven (Nonolab AB, Stockholm, Sweden) at 90 °C for 3–4 days and weighted to retrieve the dry weight. The dry matter (DM, %) was calculated by the following formula, where DW is dry weight and FW represents fresh weight: DM = DW/FW × 100.

2.3.4. Statistical Analysis

All statistical analyses were performed in R 1.3.959 (RStudio Core Team 2020). The statistical differences in the height and number of leaves between the temperature treatment were separated using general linear mixed regression and analysis of variance (ANOVA) at a 95% confidence interval. To compare the differences between treatments and cultivars, the data were further subjected to Tukey’s post-hoc tests at p ≤ 0.05.

3. Results

3.1. Plant Growth and Development at Different Temperature Treatments under SD

Plant height and number of leaves increased steadily throughout the experimental period (Figure 1A,B). Initially, the plants grew faster, at higher temperatures. Over time, the plant growth rate (plant height over time) for both cultivars decreased (Figure 1) and the difference between the growth rate became less significant (Figure A1 in Appendix A). At higher temperatures, the growing steadily decreased compared to the growth at lower temperatures.
The different temperature treatments had a similar effect on both cultivars. For both cultivars, the plants at 30 °C grew faster than at 20 and 25 °C (Figure 1). However, after week 5, the plants at 25 °C grew taller than at 30 °C. This was observed for both cultivars, although a little later in ‘Favori’ (week 8) than in ‘Florentina’. On average, ‘Favori’ had taller plants throughout the 14 weeks treatment period.
For both cultivars, the plants at 20 °C were the shortest and produced the lowest number of leaves (Figure 1). The differences were statistically significant (p < 0.05) within the temperature treatments, except after week 12 at 25 °C and 30 °C for ‘Favori’ and 30 °C for ‘Florentina’ (Table A1 and Table A2 in Appendix A). Both cultivars produced more leaves at higher temperatures. Initially, ‘Favori’ produced slightly more leaves until week 5, where the average number of leaves across the temperature treatments within each cultivar differed statistically (Table A2 in Appendix A). At the end of the experiment, ‘Florentina’ had more leaves than ‘Favori’. When the temperature treatments within the cultivars was compared, it was observed that the average increase in plant height and number of leaves was significantly different at p = 0.05 (Table A1 and Table A2 in Appendix A). Both cultivars produced only a few runners and the production started about 8 weeks from the start of the treatments. Runner production was significantly lower at 20 °C, and there was no statistical difference in runner production between 25 °C and 30 °C (Table A3 in Appendix A, p = 0.05).

3.1.1. Meristem Development, Flowering and Fruit Production

At week 0, for both cultivars, there were more reproductive (≥S4) than vegetative meristems (stage S3, Figure 2). ‘Favori’ had more buds that were developmentally more advanced than in ‘Florentina’. The average number of meristems at each developmental stage was different between the cultivars, although not statistically significant (Figure 2).
In ‘Florentina’, at all three temperature treatments, it was observed that there was a significant increase in the number of vegetative meristems (S3, Figure 3). At 20 °C, there was also a significant increase in the number of flowers (S9) between W0 and W6, while at 25 °C, the increase in S9 started later at W12, and at 30 °C; there was no statistically significant difference in the number of flowers observed during any of the three flower mapping dates. At all three temperatures, the number of vegetative meristems increased at later sampling dates. A Holm−Sidak post-hoc test showed that the difference was significant for all three sampling periods (Figure 3). The results also show that at 25 °C, there was a significant difference in the number of meristems at S6 between W0 and W12. Although, at 20 °C, there were more meristems at advanced stages during the later stages of the experiment, these differences were not statistically significant.
In ‘Favori’, for both 20 °C and 25 °C, there was an increase in the average number of meristems identified as vegetative (S3) between W0 and W6, but not at W12 (Figure 4). However, at 30 °C, there was a significant increase in the average number of vegetative meristems even at W12. It was, however, interesting to note that there was no increase in number of open flowers (S9) at 20 °C. At 25 °C and 30 °C, there were statistically more meristems at S9 after W6, but there was no statistically significant increase seen after that time point.
At the end of the treatment (15 weeks), all the remaining plants were dissected and the meristem at each leaf axil was scored (Figure 5). The results show that ‘Florentina’ had significantly more vegetative (S3) than generative (>S5) meristems at all temperatures, while ‘Favori’ had significantly more generative than vegetative meristems at 20 °C and 30 °C.
The cumulative percentage of flowering plants recorded as date of anthesis are shown in Figure 6A. The data were reset at week 6 and week 12 and were later compared to the flower mapping data to follow the development of the meristems after flower mapping.
The graphs (Figure 6A) show that ‘Favori’ started flowering later than ‘Florentina’ at both 20 °C and 25 °C. However, after 6 weeks, ‘Favori’ had produced more open flowers compared to ‘Florentina’. This held true for all treatments except for 20 °C, where both cultivars performed similarly. After week 12, the same trend was still observed, except at 30 °C, where fewer ‘Favori’ flowered compared to ‘Florentina’.
The difference between the flushes was compared using pairwise comparison and Holm−Sidak method for multiple comparison (Figure 6B). In ‘Florentina’, at 20 °C and 30 °C, the three flushes were not significantly different from each other. This pattern was observed also in ‘Favori’, but at 30 °C only. The post hoc Tukey’s test showed that there was no significant difference between the cultivars during each flush.
After 15 weeks, the percentage of buds that developed into flowers, those that further developed into fruits, as well as buds that did not develop into a fully formed flower, was calculated (Figure 7). The average number of buds that differentiated into flowers and fruits differed between the temperature treatments, which was statistically significant for both cultivars (Table A4 in Appendix A).
The results show that most fruits collected (47.0%) from ‘Florentina’ were from plants at 20 °C while the lowest number of fruits were collected at 30 °C (9.8%, Figure 7). In ‘Favori’, 16.3% and 16.8% of the pollinated flowers differentiated into fruits at 25 °C and 30 °C, respectively. However, at 20 °C only 8.6% of the pollinated flowers turned into fruits. Furthermore, the number of meristems that differentiated into flowers was highest at 20 °C when compared to 25 and 30 °C for both ‘Florentina’ (61.4%) and ‘Favori’ (36.0%).
The number of buds, flowers, and fruits were compared between the treatments and the results showed that in ‘Florentina’, the meristematic traits at 20 °C differed significantly when compared to 25 and 30 °C (Table A5 in Appendix A). Moreover, in ‘Favori’, the number of flowers differed at 20 °C only, while the other two traits were similar, irrespective of treatment.

3.1.2. Percentage Dry Matter

The biomass data showed that there was no significant difference in the biomass retrieved between the different temperature treatments. However, ‘Florentina’ had a significantly higher biomass than ‘Favori’ at 20 °C and 25 °C (Figure A1 in Appendix A). ‘Favori’ at 25 °C had the highest shoot biomass by percentage of plant weight, while ‘Florentina’ at 30 °C had the lowest (Figure A1 in Appendix A).
The results show that there was no significant difference (Table A6 in Appendix A) in the biomass between the shoots and the roots for ‘Favori’ for any of the treatments. For ‘Florentina’, the biomass for both the shoots and roots at 20 °C was similar to the other temperature treatments, while at 30 °C there was a significant increase in root biomass compared to 25 °C (Figure A1 in Appendix A).

3.2. Plant Growth and Development at Optimal Temperature in LD

To compare the effect of photoperiod on plant growth and development for both cultivars, plants were grown under ambient LD (16–18 h) at 20 °C for 14 weeks. In LD, it was observed that for both cultivars, the average height and the total number of leaves was lower than in SD (Figure 8). Although both cultivars performed similar in growth development, the difference was statistically significant between the cultivars (Table A7 and Table A8 in Appendix A).

3.2.1. Meristem Development, Flowering, and Fruit Production in LD

Seven randomly selected plants were dissected at the start (W0), at 6 (W6) and 12 weeks (W12) of treatment, and the developmental stages of the meristems were scored to observe the progress, and also estimate the next flowering flush (Figure 9). Tukey’s post hoc test showed that there were no statistically significant differences between the cultivars at any stage, except at S9. At W12, there was a significant increase in the number of meristems developed into S9 for both cultivars, and ‘Favori’ had significantly more meristems at S9 than ‘Florentina’.
At the end of the experiment (W14), the remaining plants were dissected, and the number of meristems were scored without a microscope, similar to Figure 5 in SD, and it was found that in LD, 95% of the meristems of each cultivar were generative.
In LD, both cultivars flowered continuously from the beginning of the experiment (W0). However, ‘Florentina’ flowered statistically faster than ‘Favori’ (Figure 10A). The percentage of plants that flowered per week was similar for both cultivars. Although the dataset was reset at weeks 6 and 12 to correlate with the flower mapping, there is no dip seen in the graph, since all the plants were flowering continuously. However, at the end of the 14 weeks, ‘Favori’ had more flowers than ‘Florentina’ (Figure 10B, Table A9 in Appendix A).
Plants had ripe fruits about 10 weeks after planting, and these were harvested until the end of the experiment (week 14). Overall, ‘Favori’ had the highest number of fruits and also produced heavier fruits than ‘Florentina’.
At the end of the experiment, all the meristems were compiled with the number of flowers and fruits. Although the cultivars behaved similarly under LD (Figure 10A,B), the difference between the cultivar was significant (Figure 10D and Figure 11; Table A9 in the Appendix A), where ‘Florentina’ produced more flowers while a higher number of fruits were collected from ‘Favori’ (Figure 10D).

3.2.2. Percentage Dry Matter under LD

The accumulated biomass, although higher in ‘Florentina’, did not vary significantly between the cultivars in LD at 20 °C (Figure A2 in Appendix A, p > 0.05).

4. Discussion

Flower development in strawberry is an interplay between temperature and photoperiod [10,13,44]. Here, the flowering potential of two everbearing strawberry cultivars, ‘Florentina’ and ‘Favori’, were analyzed by meristem dissection. The experiments were conducted in a greenhouse at ambient SD and LD, to mimic the natural growing conditions of a tunnel under three temperature treatments in SD, followed by an experiment exploring the optimal temperature in LD. We followed the meristem development over time to monitor the effect of environmental stimulus on plant development and to estimate the quality of the next flush [45].

4.1. Flower Mapping as a Tool to Dissect the Effect of Temperature and Photoperiod on Meristem Development in Two Cultivars

At week 0 in the SD experiment, there were no open flowers in either cultivar. However, some meristems were at an advanced generative stage (>S6), indicating that the plants were already induced before arriving at Alnarp. This was proven when plants exposed to 30 °C flowered within a week of planting, while those at 25 °C and 20 °C delayed flowering by one and two weeks, respectively (Figure 6A). This observation is consistent with previous knowledge of temperature effect on everbearing cultivars, where high temperature induces early flowering [42].
In both the SD and LD experiments at week 0, the average number of meristems at each developmental stage in the two cultivars were not significantly different (Figure 2 and Figure 9), signifying that the plants would behave similarly within the treatments, irrespective of photoperiod and temperature (Figure 6A and Figure 11A). A higher percentage of ‘Florentina’ plants flowered earlier than ‘Favori’, showing that ‘Florentina’ is an earlier flowering cultivar compared to ‘Favori’. ‘Favori’, on the contrary, started flowering later and the first flush was very weak, producing less flowers. However, this behavior probably conserves energy for the next flush and it was observed in the biomass distribution in both cultivars (Figure A1 in Appendix A). At the end of the experiment, ‘Favori’ was more generative and had a higher shoot/root ratio than ‘Florentina’, which was more vegetative. (Figure 5 and Figure 9). Previously Nishizawa et al. (1998) used 14C to show the allocation of biomass during the growing period in the SF cultivars. They found that the root biomass is accumulated during acclimatation and is mobilized to the shoot during inflorescence growth. Fernandez et al. (2001) did a more detailed study with three SF cultivars and saw a similar pattern where root biomass reduced in favor for the shoot biomass during flowering [46,47].
Throughout the SD treatment, from W0 to W12, there was a significant increase in the number of meristems that were vegetative (S3) in both cultivars at all temperature treatments (Figure 3 and Figure 4). This increase could be due to the production of new leaves over the 14 weeks treatment and thus, new leaf axils, producing more flowering sites with a vegetative meristem, that, in the future, would differentiate into a generative bud and form the next flush [13,42]. Additionally, the increase in the ambient day length by April stimulated an increase in the number of meristems in generative stages [13,19]. These results support the findings from other studies [13,19], that the critical temperature is cultivar dependent. This was also seen in the SD experiment, where ‘Favori’ (Figure 4), had a significantly higher number of flowers (S9) at week 12 for plants grown at 25 °C and 30 °C, while the same was true for ‘Florentina’ plants in 20 °C and 25 °C. Moreover, after 15 weeks in SD, ‘Favori’, but not ‘Florentina’, had significantly more generative than vegetative meristems (Figure 5). One reason for this could be that this was an effect of late blooming in ‘Favori’, and that the flowering continued into week 15. Another reason could be that the flowers in ‘Florentina’ had already formed a berry and were accounted for in Figure 7. The difference could also be due to the different method of classification of meristem at week 15 (Figure 5), where only meristems that were visible without a microscope were scored as reproductive and therefore the S4 and S5 stages (Table 2) could easily have been overlooked and, hence was underrepresenting the generative meristems in the data.
Furthermore, in the LD experiment by week 12 (Figure 9), both cultivars had significantly more open flowers (S9), and by the end of the experiment (week 14), both cultivars had significantly higher numbers of generative than vegetative meristems. This is supported by previous studies, where EB produced more flowers in LD than in SD [13,20]. However, a more frequent flower mapping approach, to follow the fate of the meristems across a wider range of temporal changes, would help deduce precise conclusions [24,25,26,27,30,44]. In addition, complex phenological modelling, such as done by Labadie et al. (2019), would be required to help dissect these changes, reasoning and their effects on the overall yield [43].

4.2. The Use of Flower Mapping to Analyse Temperature and Photoperiod Effect on Flower Flushes

Dividing the data made it easier to investigate how the flushes differed between each treatment and between the cultivars. From our data, we see a narrow first flush that quickly flattens off, which was a result of the previous season induction prior to chilling of the tray plants [13,19,42]. The second and third flush showed an increasing percentage of flowering plants (Figure 6A). The results in Figure 6B illustrate that although the EB cultivar flowers continuously, prolonged high temperatures (25 and 30 °C) reduce the number of plants that flower in SD. With increased exposure to high temperatures such as 25 and 30 °C, significantly less plants flowered in flush 3 as compared to flush 1 and 2. This is in accordance with previous research [13,20]. Rivero et al. (2021) recently showed that increased exposure for 10 or more weeks to high 26 °C in SD caused a semi-dormant state in EB cultivars, including ‘Favori’ [13]. Whereas, in this study, increased exposure to 20 °C statistically increased the percentage of flowering plants in ‘Favori’ (Figure 6B and Table A4 in Appendix A).
Moreover, in the LD experiment both cultivars flowered continuously at 20 °C, whereas later (Figure 10A), ‘Favori’ eventually had a higher number of flowers (Figure 10B). This has also been reported earlier by Sønsteby and Heide (2007) [20], who showed that at high temperatures, EB are qualitative LD plants, and quantitative LD plants at lower temperatures, indicating that the effect of photoperiod is chanced with the temperature, as also seen in our study. Furthermore, in the LD experiment, the cultivars did not show any significant difference between the average number of meristems at each developmental stage, except S9, where ‘Favori’ had more flowers than ‘Florentina’. This is again supported by other reports [13,19,20,28].
However, a more detailed study by using more temperature points under both photoperiods, is required to give a better understanding. This knowledge about the delicate balance between the photoperiod and temperature, can be used to improve the conditions to favor for plants with generative meristems and manipulate the flowering potential [13,42].

4.3. Temperature and Photoperiod Effect Plant Growth and Development

This study illustrates the importance of temperature on plant growth and development; as shown by the difference in growth rate, measured through height (Figure 1A and Table A1 in Appendix A) and number of leaves (Figure 1B and Table A2 in Appendix A). Not unexpectedly, the plants at 20 °C were overall shorter, growing more slowly with fewer number of leaves and significantly less runners (Table A3 in Appendix A) as compared to the two other temperature treatments. Runners in both cultivars were formed after 8 weeks (Figure 1C) of SD treatment, irrespective of the temperature. This is consistent with earlier research, where the runner capacity of EB has been shown to be low and cultivar dependent [13,44].
In SD, plants at 30 °C for both cultivars, and at 25 °C for ‘Favori’, showed a less significant increase in height during the weeks 12 and 14 in SD (Table A1 in Appendix A). While in LD at 20 °C, the growth rate decreased slowly after week 8 (Table A7 in Appendix A). One of the reasons for this could be that the plants at lower temperature were investing more energy in flowering than in growth [13,42]. We also noticed that in SD, both cultivars at 30 °C were outperformed in height and number of leaves by plants at 25 °C. Moreover, when comparing the growth in the two photoperiods, it was observed that plants in the LD experiment were taller than those in the SD at 20 °C. Rivero et al. (2021) found that ‘Favori’ grown at 26 °C for 10 weeks, assumed a dormancy-like appearance even in LD, and, therefore, that our plants at 30 °C became shorter than those treated at 25 °C, could mean that this difference may have been induced by high temperature [13]. These findings are important indicators in strawberry production, where high temperature in the tunnel can reduce the flowering potential [38,39].

4.4. Temperature and Photoperiod Effect on Fruits

In SD, ‘Florentina’ produced the highest number of fruits at 20 °C, while ‘Favori’ at 30 °C. The difference is mainly due to the early flowering of ‘Florentina’ which led to early fruiting, while ‘Favori’ bloomed later and was still producing fruits at the end of the experiment. Studies have shown that increasing temperature affects not only the fruit quality, but also reduces the yield in the next crop peak [48]. Previous studies have also shown that high temperatures result in delayed flowering and a lower percentage of plants that produce flowers [37,40]. Although not clearly understood, several reasons for this phenomenon have been proposed, such as inhibition of floral initiation, abortion of embryos pre and post anthesis, pollen viability and performance, and pistil malformation and malfunction [35,37,38,49]. Although, in LD at 20 °C, both cultivars preformed similarly (Figure 8 and Figure 10A); however, a higher percentage of meristems in ‘Favori’ produced a significantly heavier total yield than ‘Florentina’. A more detailed study with several temperature treatments, and also increasing the frequency of meristem dissection, is necessary to get a broader view of the optimal condition for a flower flush. Moreover, a further inspection of the size and weight of the berries could shed more light on the quality of the yield in SD as was done by previous researchers [37,39]. Moreover, a larger dataset, extensive phenotyping, modelling, and molecular studies would be needed to form any conclusive theories.

5. Conclusions

This study explored the effect of temperature and photoperiod treatments on the growth and development of two EB strawberry cultivars; but, unlike other studies, where the plants have been moved to LD conditions post-treatment, the plants here received 14-weeks of continuous treatment. This gives new insight into the behavior of plants to extended periods of specific temperatures (20, 25, and 30 °C) in SD, and also the behavior of plants at optimum temperature (20 °C) in LD. In these experiments, we used a qualitative method to show how periodical observation of the meristems could help to estimate the length of the next flower flush and, more importantly, show that while the developmental stages may be similar at the start of the experiment, the environmental cues, such as temperature and photoperiod, manipulate the overall outcome and also the length of the flowering period. The findings in this paper are informative for breeders and berry producers who wish to manipulate the size of the plants and also the occurrence of the flower flushes.

Author Contributions

Conceptualization, S.M. and S.K.; Data curation, S.S.; Formal analysis, S.S.; Funding acquisition, S.K.; Investigation, S.S. and D.B.; Methodology, S.S., S.M. and S.K.; Project administration, S.K.; Resources, S.K.; Supervision, S.M. and S.K.; Visualization, S.S. and A.S.; Writing—original draft, S.S.; Writing—review & editing, S.S., S.M., A.S. and S.K. All authors have read and agreed to the published version of the manuscript.
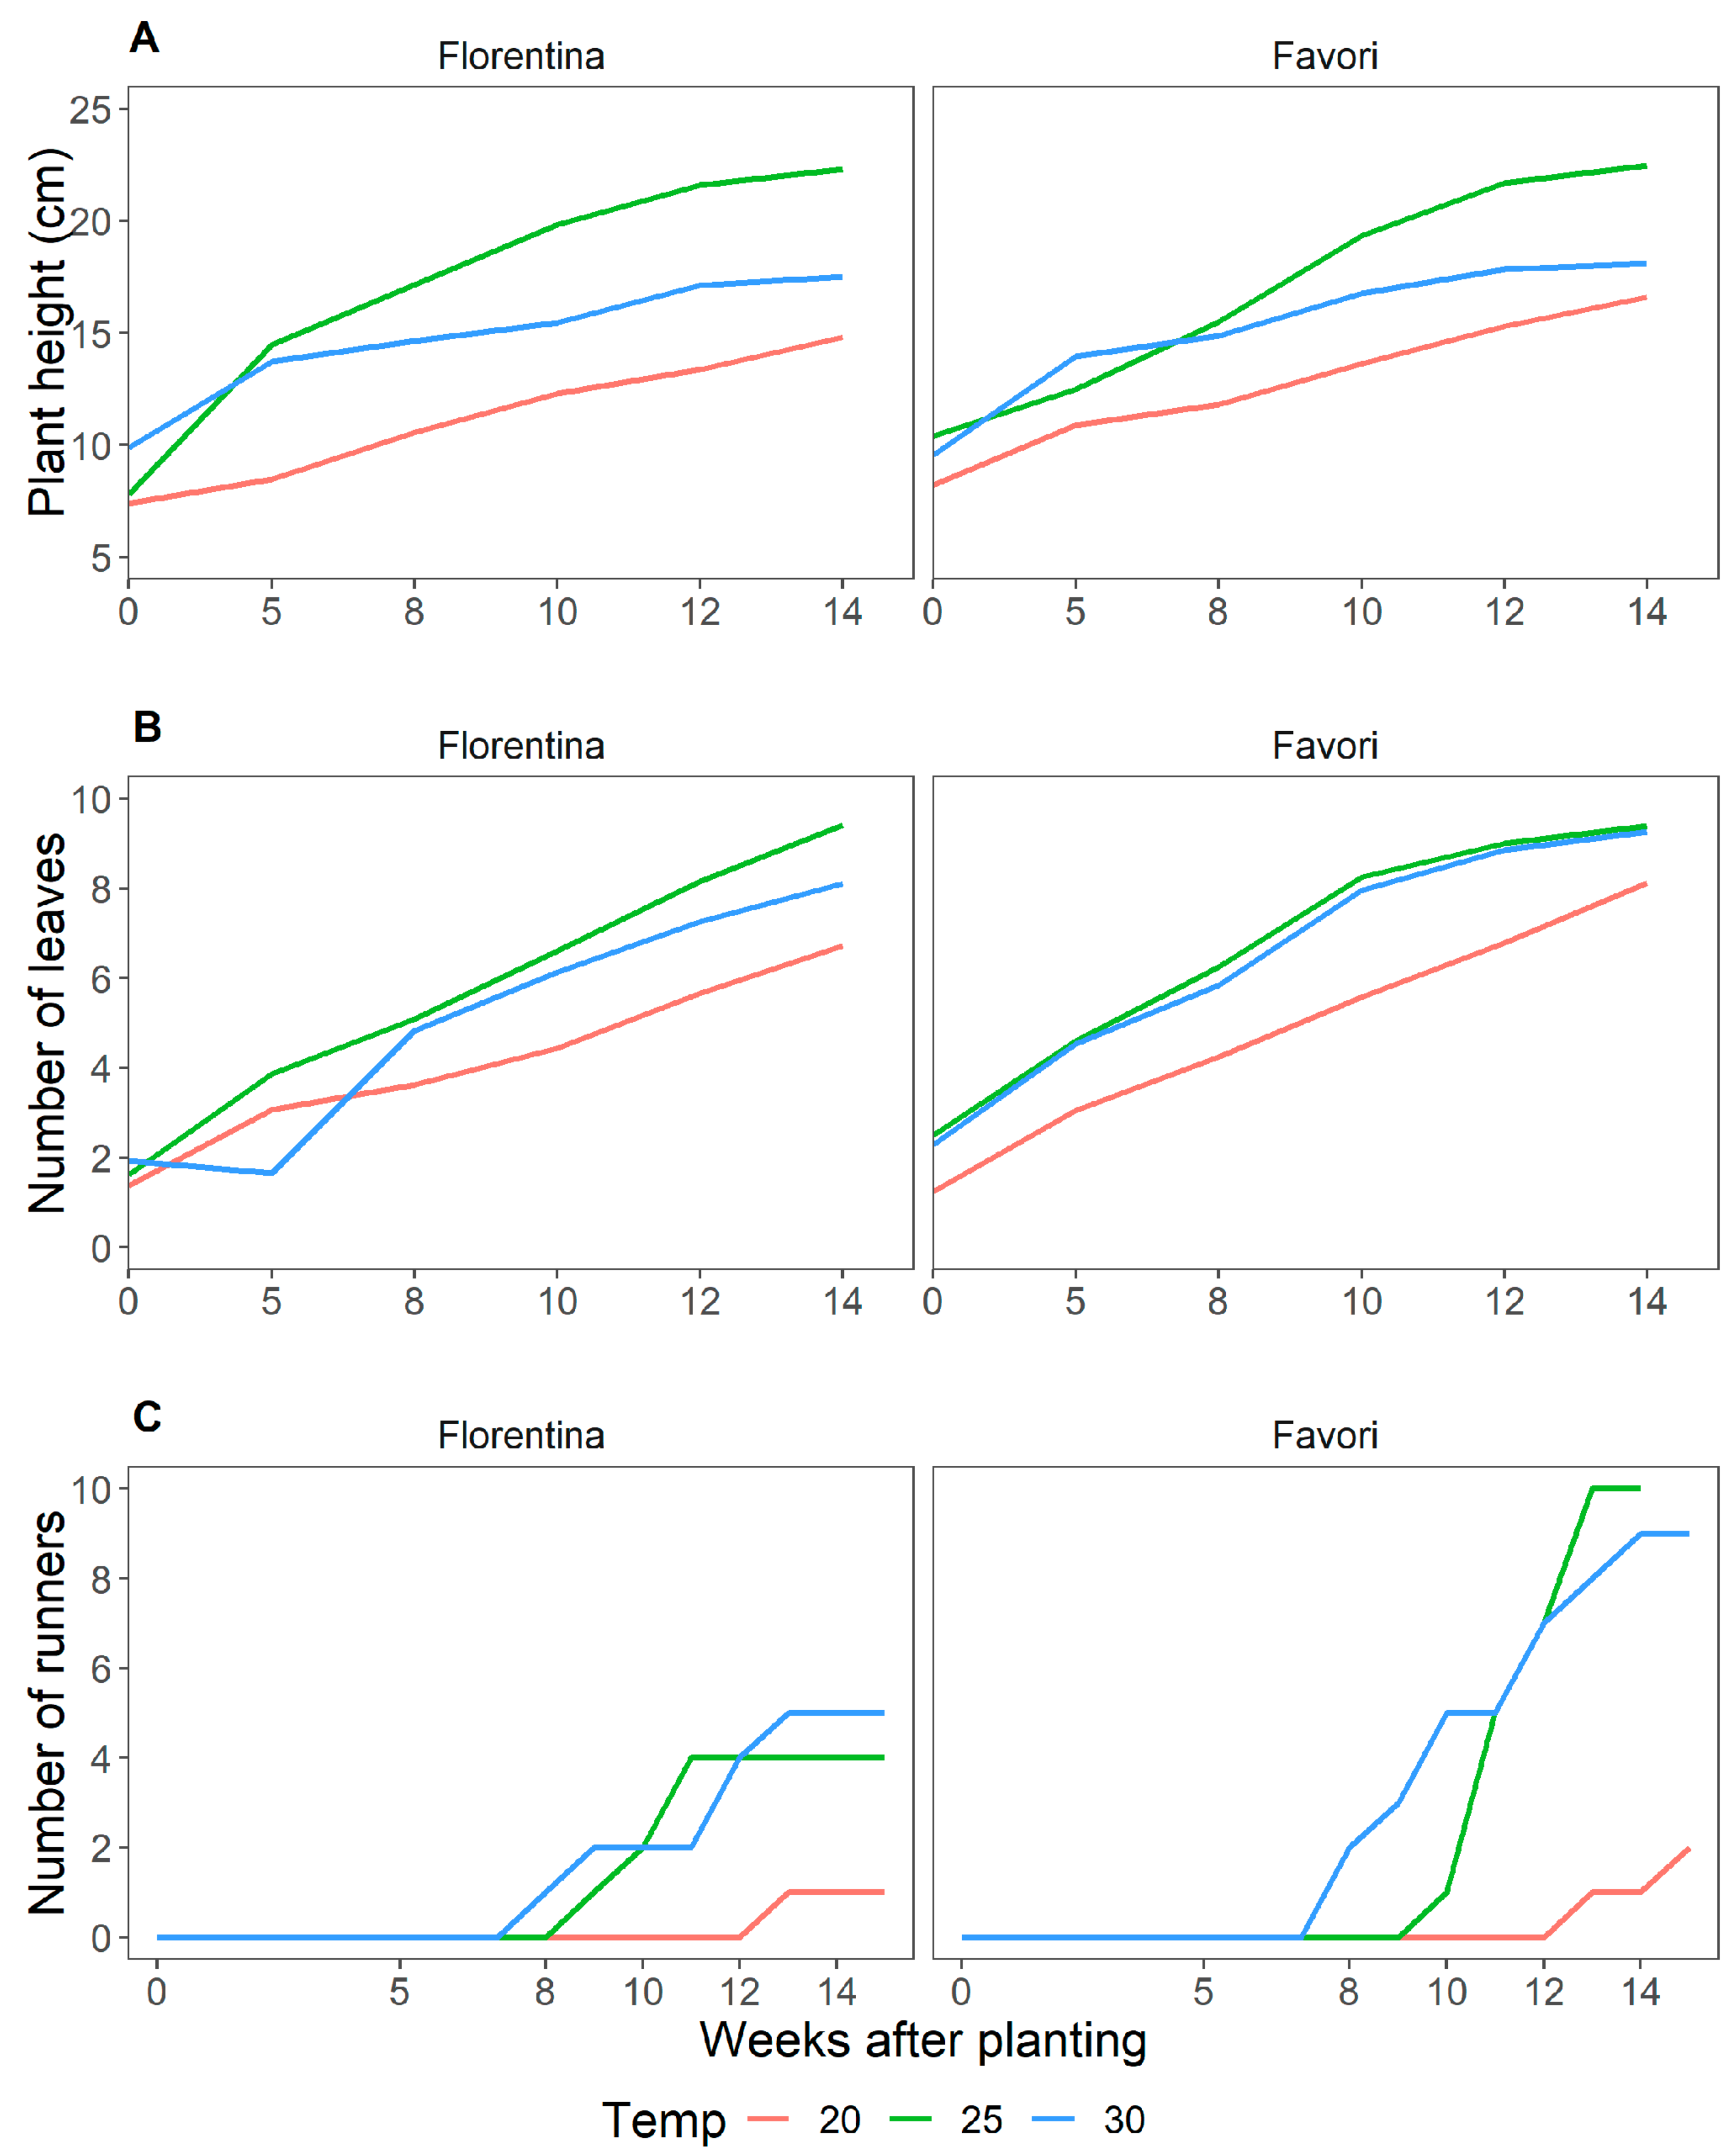
Funding

This research was funded by Stiftelsen Lantbruksforskning (SLF)- Swedish farmers’ foundation for agricultural research, grant number R-18-25-147.

Institutional Review Board Statement

Not applicable.

Informed Consent Statement

Not applicable.

Acknowledgments

The authors would like to acknowledge the research council SLF. The personal at the cultivation unit in Alnarp are also thanked for their help for administrating the plant fertilizers and plant protection.

Conflicts of Interest

The authors declare no conflict of interest.

Appendix A

Table A1. Mixed effects linear regression model for height measurements taken during W0, W5, W8, W10, W12, and W14 for the three temperature treatments, 20, 25, and 30 °C in SD for ‘Florentina’ and ‘Favori’, respectively. Sidak pairwise comparison shows that similar alphabet indicates no significant difference between weeks. The values marked in red show consecutive non-significant difference.
WeekTemperature (°C)FlorentinaFavori
0207.25a8.24a
5208.40b10.95b
82010.54c11.78c
102012.32d13.63d
122013.36e15.34e
142014.76f16.63f
0257.47a9.95a
52514.38b12.47b
82517.20c15.49c
102519.87d19.74d
122521.59e21.91e
142522.37f22.59e
0309.88a9.51a
53013.78b13.92b
83014.74c14.70c
103015.49d16.51d
123017.14e17.68e
143017.60e17.96e
Table A2. Mixed effects linear regression model for the total number of leaf measurements taken during W0, W5, W8, W10, W12, and W14 for the three temperature treatments, 20, 25, and 30 °C in SD for ‘Florentina’ and ‘Favori’. Sidak pairwise comparison shows that similar alphabet indicates no significant difference between weeks. The values marked in red show consecutive non-significant difference.
WeekCultivarTemperature (°C)FlorentinaFavori
0Florentina201.32a1.18a
5Florentina202.94b3.05b
8Florentina203.58c4.18c
10Florentina204.39d5.51d
12Florentina205.58e6.76e
14Florentina206.59f8.17f
0Florentina251.60a2.50a
5Florentina253.85b4.72b
8Florentina255.13c6.21c
10Florentina256.63d8.34d
12Florentina258.17e9.22e
14Florentina259.55f10.21f
0Florentina301.95a2.33a
5Florentina301.63a4.53b
8Florentina304.81b5.89c
10Florentina306.12c8.08d
12Florentina309.31d9.30e
14Florentina3010.63e9.77f
Table A3. Pairwise comparison using least square means for plant height, number of leaves and runners between the temperature treatments for the cultivars ‘Florentina’ and ‘Favori’. The p-value was adjusted using the Tukey-pairwise correction method (p = 0.05).
Florentina (N = 30–32)
Plant height (cm)No. of leavesNo. of runners
Temperature (°C)25–2030–2025–3025–2030–2025–3025–2030–2025–30
p-value<0.05<0.05<0.05<0.05<0.05<0.05<0.05<0.050.90
Favori (N = 20–34)
Plant height (cm)No. of leavesNo. of runners
Temperature (°C)25–2030–2025–3025–2030–2025–3025–2030–2025–30
p-value<0.05<0.05<0.05<0.05<0.05<0.05<0.05<0.050.91
Table A4. Pairwise comparison of the least squared means of the meristematic development between the temperature treatments in SD for ‘Florentina’ and ‘Favori’. The least square means followed by the same lowercase letter did not differ statistically by the Tukey test at 5% of error probability (p < 0.05).
Temperature (°C)MeristemFlorentinaFavori
20Buds1.34a4.39a
25Buds6.90b4.39a
30Buds7.65b4.47a
20Flowers2.86b9.79b
25Flowers0.91a7.60a
30Flowers1.84ab7.63a
20Fruits3.75b2.51a
25Fruits1.52a2.41a
30Fruits1.07a1.32a
Figure A1. Pairwise comparison of the percentage biomass (%) using least means followed by the same lowercase letter between the cultivars indicate no statistical difference by the Tukey test at 5% of error probability (p < 0.05) (A). Biomass contribution from the shoot and root after between the two strawberry cultivars, ‘Florentina’ and ‘Favori’ after 14 weeks of temperature treatment at 20 °C, 25 °C, and 30 °C in SD (B).
Horticulturae 07 00484 g0a1
Table A5. Pairwise comparison using Tukey’s post-hoc test between the temperature treatments in SD for ‘‘Florentina’ and ‘Favori’. Similar letters denote non significance between the temperature treatments at p = 0.05. The least square means followed by the same lowercase letter did not differ statistically by the Tukey test at 5% of error probability (p < 0.05).
CultivarPartTemperature (°C)EmmeanGroup
FlorentinaShoot2062.8ab
FlorentinaShoot2565.2b
FlorentinaShoot3059a
FlorentinaRoot2037.2ab
FlorentinaRoot2534.8a
FlorentinaRoot3041b
FavoriShoot2071.2a
FavoriShoot2572.7a
FavoriShoot3069.6a
FavoriRoot2028.8a
FavoriRoot2527.3a
FavoriRoot3030.4a
Table A6. Mixed effects linear regression model for the LD treatment within the cultivars ‘Florentina’ and ‘Favori’, respectively, for the plant height and total number of leaf measurements taken during the 14 weeks under the LD treatment (N = 29–32). The least square means followed by the same lowercase letter did not differ statistically by the Tukey test at 5% of error probability (p < 0.05).
HeightLeaves
WeekFlorentinaFavoriFlorentinaFavori
05.64a5.99a0.00a0.00a
28.67b10.15b0.75b1.35b
310.03c12.63c1.07b1.82bc
410.29c13.37cd1.97c2.33c
511.12d13.96d2.80d3.48d
612.07e14.90e4.12e4.12e
714.03f15.74f4.95f4.45ef
814.58fg16.28fg5.75g4.85fg
914.77fg16.46fgh6.29gh5.39gh
1015.01gh16.98ghi6.75h5.90hi
1114.99gh17.20hi7.61i6.24ij
1215.36gh17.50ij7.91i6.73j
1315.64hi18.16jk8.56j6.75j
1416.40i18.91k8.79j7.73k
Table A7. Tukey’s pairwise comparison of least squared means for multiple comparison between the cultivars ‘Florentina’ and ‘Favori’ for plant height (cm) and number of leaves over the course of the 14 weeks treatment period.
Florentina–FavoriEstimateSEp-Value
Height−2.1150.005129<0.0001
Leaves0.440.00341<0.0001
Table A8. Pairwise comparison for number of flowers over the 14-week in LD treatment at 20 °C between cultivars, ‘Florentina’ and ‘Favori’.
WeekEstimateSEt.ratiop-Value
00.3240.6820.4740.6354
22.420.6823.5480.0004
31.4960.6822.1930.0288
40.3110.6990.4440.657
5−0.1760.682−0.2580.7966
6−0.6760.682−0.9910.322
7−1.4530.682−2.130.0336
8−0.8260.682−1.2110.2264
9−0.8540.682−1.2520.2113
10−2.1240.682−3.1130.002
11−2.9540.682−4.33<0.0001
12−2.3270.682−3.4110.0007
13−1.660.682−2.4330.0153
14−1.7790.682−2.6070.0094
Table A9. Pairwise comparison of ‘Florentina’ and ‘Favori’ for the differentiation of meristem into flowers and fruits in LD at 20 °C.
MeristemContrastEstimatep-Value
BudsFlorentina—Favori−3.490.177
FlowersFlorentina—Favori−9.87<0.001
FruitsFlorentina—Favori−7.60.003
Figure A2. Accumulated biomass (%) (A) and percentage distribution of dry matter in the shoots and roots (B) of the strawberry cvs. ‘Florentina’ and ‘Favori’ grown for 14 weeks under ambient LD condition in a greenhouse at 20 °C. The p-value for the ANOVA analysis is stated at the bottom of the panel.
Horticulturae 07 00484 g0a2

References

  1. Food and Agriculture Organizations of the United Nations. FAOSTAT Statistical Database. Available online: http://faostat.fao.org/ (accessed on 5 November 2021).
  2. Sønsteby, A.; Roos, U.M.; Heide, O.M. Phenology, Flowering and Yield Performance of 13 Diverse Strawberry Cultivars Grown under Nordic Field Conditions. Acta Agric. Scand. Sect. B-Soil Plant Sci. 2017, 67, 278–283. [Google Scholar] [CrossRef]
  3. Moor, U.; Põldma, P.; Starast, M.; Mainla, L.; Tõnutare, T.; Karp, K. Extension of the Strawberry (Fragaria × ananassa Duch.) Season in Estonia Using Ever-Bearing Cultivars and Covers during the Winter. Acta Hortic. 2020, 1268, 143–148. [Google Scholar] [CrossRef]
  4. Laugale, V.; Dane, S.; Lepse, L.; Strautina, S.; Kalnina, I. Influence of Low Tunnels on Strawberry Production Time and Yield. Acta Hortic. 2017, 1156, 573–578. [Google Scholar] [CrossRef]
  5. Sønsteby, A.; Opstad, N.; Heide, O.M. Environmental Manipulation for Establishing High Yield Potential of Strawberry Forcing Plants. Sci. Hortic. 2013, 157, 65–73. [Google Scholar] [CrossRef]
  6. Neri, D.; Baruzzi, G.; Massetani, F.; Faedi, W. Strawberry Production in Forced and Protected Culture in Europe as a Response to Climate Change. Can. J. Plant Sci. 2012, 92, 1021–1036. [Google Scholar] [CrossRef]
  7. Mezzetti, B.; Giampieri, F.; Zhang, Y.; Zhong, C. Status of Strawberry Breeding Programs and Cultivation Systems in Europe and the Rest of the World. J. Berry Res. 2018, 8, 205–221. [Google Scholar] [CrossRef]
  8. Gude, K.; Stanley, H.; Rivard, C.L.; Cunningham, B.; Kang, Q.; Pliakoni, E.D. Quality of Day-Neutral Strawberries Grown in a High Tunnel System. Sci. Hortic. 2021, 275, 109726. [Google Scholar] [CrossRef]
  9. Darrow, G.M. Everbearing Strawberries; Farmers Bulletin 901; US Department of Agriculture: Washington, DC, USA, 1917; pp. 1–20.
  10. Gallace, N.; Lieten, P. Winter Manipulation of Photoperiod and Chill to Enhance the Perpetual Flowering Nature of “Soprano”. Acta Hortic. 2021, 1309, 333–340. [Google Scholar] [CrossRef]
  11. Lieten, P.; Evenhuis, B.; Baruzzi, G. Cold Storage of Strawberry Plants. Int. J. Fruit Sci. 2005, 5, 75–82. [Google Scholar] [CrossRef]
  12. Hytönen, T.; Kurokura, T. Control of Flowering and Runnering in Strawberry. Hortic. J. 2020, 89, 96–107. [Google Scholar] [CrossRef] [Green Version]
  13. Rivero, R.; Remberg, S.F.; Heide, O.M.; Sønsteby, A. Environmental Regulation of Dormancy, Flowering and Runnering in Two Genetically Distant Everbearing Strawberry Cultivars. Sci. Hortic. 2021, 290, 110515. [Google Scholar] [CrossRef]
  14. Darrow, G.M.; Waldo, G.F. Responses of Strawberry Varieties and Species to Duration of the Daily Light Period. USDA Tech. Bull. 1932, 453, 1–32. [Google Scholar]
  15. Ito, H.; Saito, T. Studies on the Flower Formation in the Strawberry Plants. Tohoku J. Agric. Res. 1962, 13, 191–203. [Google Scholar]
  16. Darrow, G.M. The Strawberry: History, Breeding and Physiology; Holt, Rinehart and Winston: Austin, TX, USA, 1966. [Google Scholar]
  17. Sønsteby, A.; Heide, O.M. Flowering Performance and Yield of Established and Recent Strawberry Cultivars (Fragaria × ananassa Duch.) as Affected by Raising Temperature and Photoperiod. J. Hortic. Sci. Biotechnol. 2017, 92, 367–375. [Google Scholar] [CrossRef]
  18. Guttridge, C.G.  Fragaria × ananassa . CRC Handb. Flower. 1985, 3, 16–33. [Google Scholar]
  19. Heide, O.M.; Stavang, J.A.; Sønsteby, A. Physiology and Genetics of Flowering in Cultivated and Wild Strawberries—A Review. J. Hortic. Sci. Biotechnol. 2013, 88, 1–18. [Google Scholar] [CrossRef]
  20. Sønsteby, A.; Heide, O.M. Long-Day Control of Flowering in Everbearing Strawberries. J. Hortic. Sci. Biotechnol. 2007, 82, 875–884. [Google Scholar] [CrossRef]
  21. Hytönen, T.; Elomaa, P. Genetic and Environmental Regulation of Flowering and Runnering in Strawberry. Genes Genomes Genom. 2011, 5, 56–64. [Google Scholar]
  22. Tenreira, T.; Lange, M.J.P.; Lange, T.; Bres, C.; Labadie, M.; Monfort, A.; Hernould, M.; Rothan, C.; Denoyes, B. A Specific Gibberellin 20-Oxidase Dictates the Flowering-Runnering Decision in Diploid Strawberry. Plant Cell 2017, 29, 2168–2182. [Google Scholar] [CrossRef] [Green Version]
  23. Kurokura, T.; Inaba, Y.; Neri, D.; Sugiyama, N. A Morphological Study of the Development of the Second Inflorescences in Strawberry (Fragaria × ananassa Duch.). Ann. Appl. Biol. 2005, 146, 511–515. [Google Scholar] [CrossRef]
  24. Savini, G.; Neri, D.; Zucconi, F.; Sugiyama, N. Strawberry Growth and Flowering: An Architectural Model. Int. J. Fruit Sci. 2006, 5, 29–50. [Google Scholar] [CrossRef]
  25. Jahn, O.L.; Dana, M.N. Crown and Inflorescence Development in the Strawberry, Fragaria × ananassa. Am. J. Bot. 1970, 57, 605–612. [Google Scholar] [CrossRef]
  26. Savini, G.; Neri, D. Strawberry Architectural Model. Acta Hortic. 2004, 649, 169–176. [Google Scholar] [CrossRef]
  27. Durner, E.F. Plant Architecture of “Albion” Strawberry (Fragaria × ananassa Duch.) Is Not Influenced by Light Source during Conditioning. AIMS Agric. Food 2018, 3, 246–265. [Google Scholar] [CrossRef]
  28. Van Delm, T.; Melis, P.; Stoffels, K.; Van De Vyver, F.; Baets, W. Strawberry Plant Architecture and Flower Induction in Plant Production and Strawberry Cultivation. Acta Hortic. 2014, 1049, 489–494. [Google Scholar] [CrossRef]
  29. Aspuria, J.R.; Fujime, Y. Eco-Physiological Studies in the Analysis of Dormancy in Strawberry. Acta Hortic. 1995, 395, 97–104. [Google Scholar] [CrossRef]
  30. Jonkers, H. On the Flower Formation, the Dormancy and the Early Forcing of Strawberries. Ph.D. Thesis, Wageningen University, Wageningen, The Netherlands, 1965. [Google Scholar]
  31. Taylor, D.R. The Physiology of Flowering in Strawberry. Acta Hortic. 2002, 567, 245–251. [Google Scholar] [CrossRef]
  32. Bosc, J.P.; Neri, D.; Massetani, F.; Bardet, A. Relationship between Plant Architecture and Fruit Production of the Short-Day Strawberry Cultivar Gariguette. J. Berry Res. 2012, 2, 105–111. [Google Scholar] [CrossRef] [Green Version]
  33. Opstad, N.; Sønsteby, A.; Myrheim, U.; Heide, O.M. Seasonal Timing of Floral Initiation in Strawberry: Effects of Cultivar and Geographic Location. Sci. Hortic. 2011, 129, 127–134. [Google Scholar] [CrossRef]
  34. Meier, U. Growth Stages of Mono-and Dicotyledonous Plants; Blackwell Science: Berlin, Germany, 2001. [Google Scholar]
  35. Heide, O.M.; Sønsteby, A. Climate-Photothermographs, a Tool for Ecophysiological Assessment of Effects of Climate Warming in Crop Plants: Examples with Three Berry Crops. J. Berry Res. 2020, 10, 411–418. [Google Scholar] [CrossRef]
  36. Menzel, C. Higher Temperatures Decrease Fruit Size in Strawberry Growing in the Subtropics. Horticulturae 2021, 7, 34. [Google Scholar] [CrossRef]
  37. Ledesma, N.A.; Kawabata, S. Responses of Two Strawberry Cultivars to Severe High Temperature Stress at Different Flower Development Stages. Sci. Hortic. 2016, 211, 319–327. [Google Scholar] [CrossRef]
  38. Karapatzak, E.K.; Wagstaffe, A.; Hadley, P.; Battey, N.H. High-Temperature-Induced Reductions in Cropping in Everbearing Strawberries (Fragaria × ananassa) Are Associated with Reduced Pollen Performance. Ann. Appl. Biol. 2012, 161, 255–265. [Google Scholar] [CrossRef]
  39. Ledesma, N.A.; Nakata, M.; Sugiyama, N. Effect of High Temperature Stress on the Reproductive Growth of Strawberry Cvs. “Nyoho” and “Toyonoka”. Sci. Hortic. 2008, 116, 186–193. [Google Scholar] [CrossRef]
  40. Smeets, L. Effect of Temperature and Daylength on Flower Initiation and Runner Formation in Two Everbearing Strawberry Cultivars. Sci. Hortic. 1980, 12, 19–26. [Google Scholar] [CrossRef]
  41. Wagstaffe, A.; Battey, N.H. Characterisation of the Thermodormancy Response in the Everbearing Strawberry “Everest”. J. Hortic. Sci. Biotechnol. 2006, 81, 1086–1092. [Google Scholar] [CrossRef]
  42. Gallace, N.; Lieten, P.; Boonen, M.; Bylemans, D. Reduced Winter Chill as a Means to Improve the Production Potential of Late Day-Neutral Strawberry Cultivars. Eur. J. Hortic. Sci. 2019, 84, 20–23. [Google Scholar] [CrossRef]
  43. Labadie, M.; Denoyes, B.; Guédon, Y. Identifying Phenological Phases in Strawberry Using Multiple Change-Point Models. J. Exp. Bot. 2019, 70, 5687–5701. [Google Scholar] [CrossRef] [Green Version]
  44. Sønsteby, A.; Woznicki, T.L.; Heide, O.M. Effects of Runner Removal and Partial Defoliation on the Growth and Yield Performance of ‘Favori’ Everbearing Strawberry Plants. Horticulturae 2021, 7, 215. [Google Scholar] [CrossRef]
  45. Savini, G.; Neri, D.; Mercadante, L.; Molari, G.; Magnani, D.; Capriolo, G. Meristem Analysis on Strawberry Plants during Propagation and Production. Acta Hortic. 2006, 708, 237–240. [Google Scholar] [CrossRef]
  46. Nishizawa, T.; Hori, Y. Translocation and Distribution of 14C-Photoassimilates in Strawberry Plants Varying in Developmental Stages of the Inflorescence. J. Jpn. Soc. Hortic. Sci. 1988, 57, 433–439. [Google Scholar] [CrossRef] [Green Version]
  47. Fernandez, G.E.; Butler, L.M.; Louws, F.J. Strawberry Growth and Development in an Annual Plasticulture System. HortScience 2001, 36, 1219–1223. [Google Scholar] [CrossRef] [Green Version]
  48. Hamano, B.M.; Kato, K.; Honda, K.; Maeda, T.; Morishita, M. Promotion of Flowering by Photoperiod Treatment in Six Strawberry (Fragaria × ananassa Duch.) Cultivars with Different Everbearing Patterns. J. Hortic. Sci. Biotechnol. 2015, 90, 157–163. [Google Scholar] [CrossRef]
  49. Wagstaffe, A.; Battey, N.H. The Optimum Temperature for Long-Season Cropping in the Everbearing Strawberry “Everest”. Acta Hortic. 2006, 708, 45–49. [Google Scholar] [CrossRef]
Figure 1. Average plant height in cm (A); average number of leaves (B), starting at W0; and number of runners (C), starting at W8 for strawberry plants of cvs. ‘Florentina’ (N = 30–32) and ‘Favori’ (N = 20–34) during 14 weeks at ambient natural short day at 20 °C, 25 °C, and 30 °C (Expt. 1).
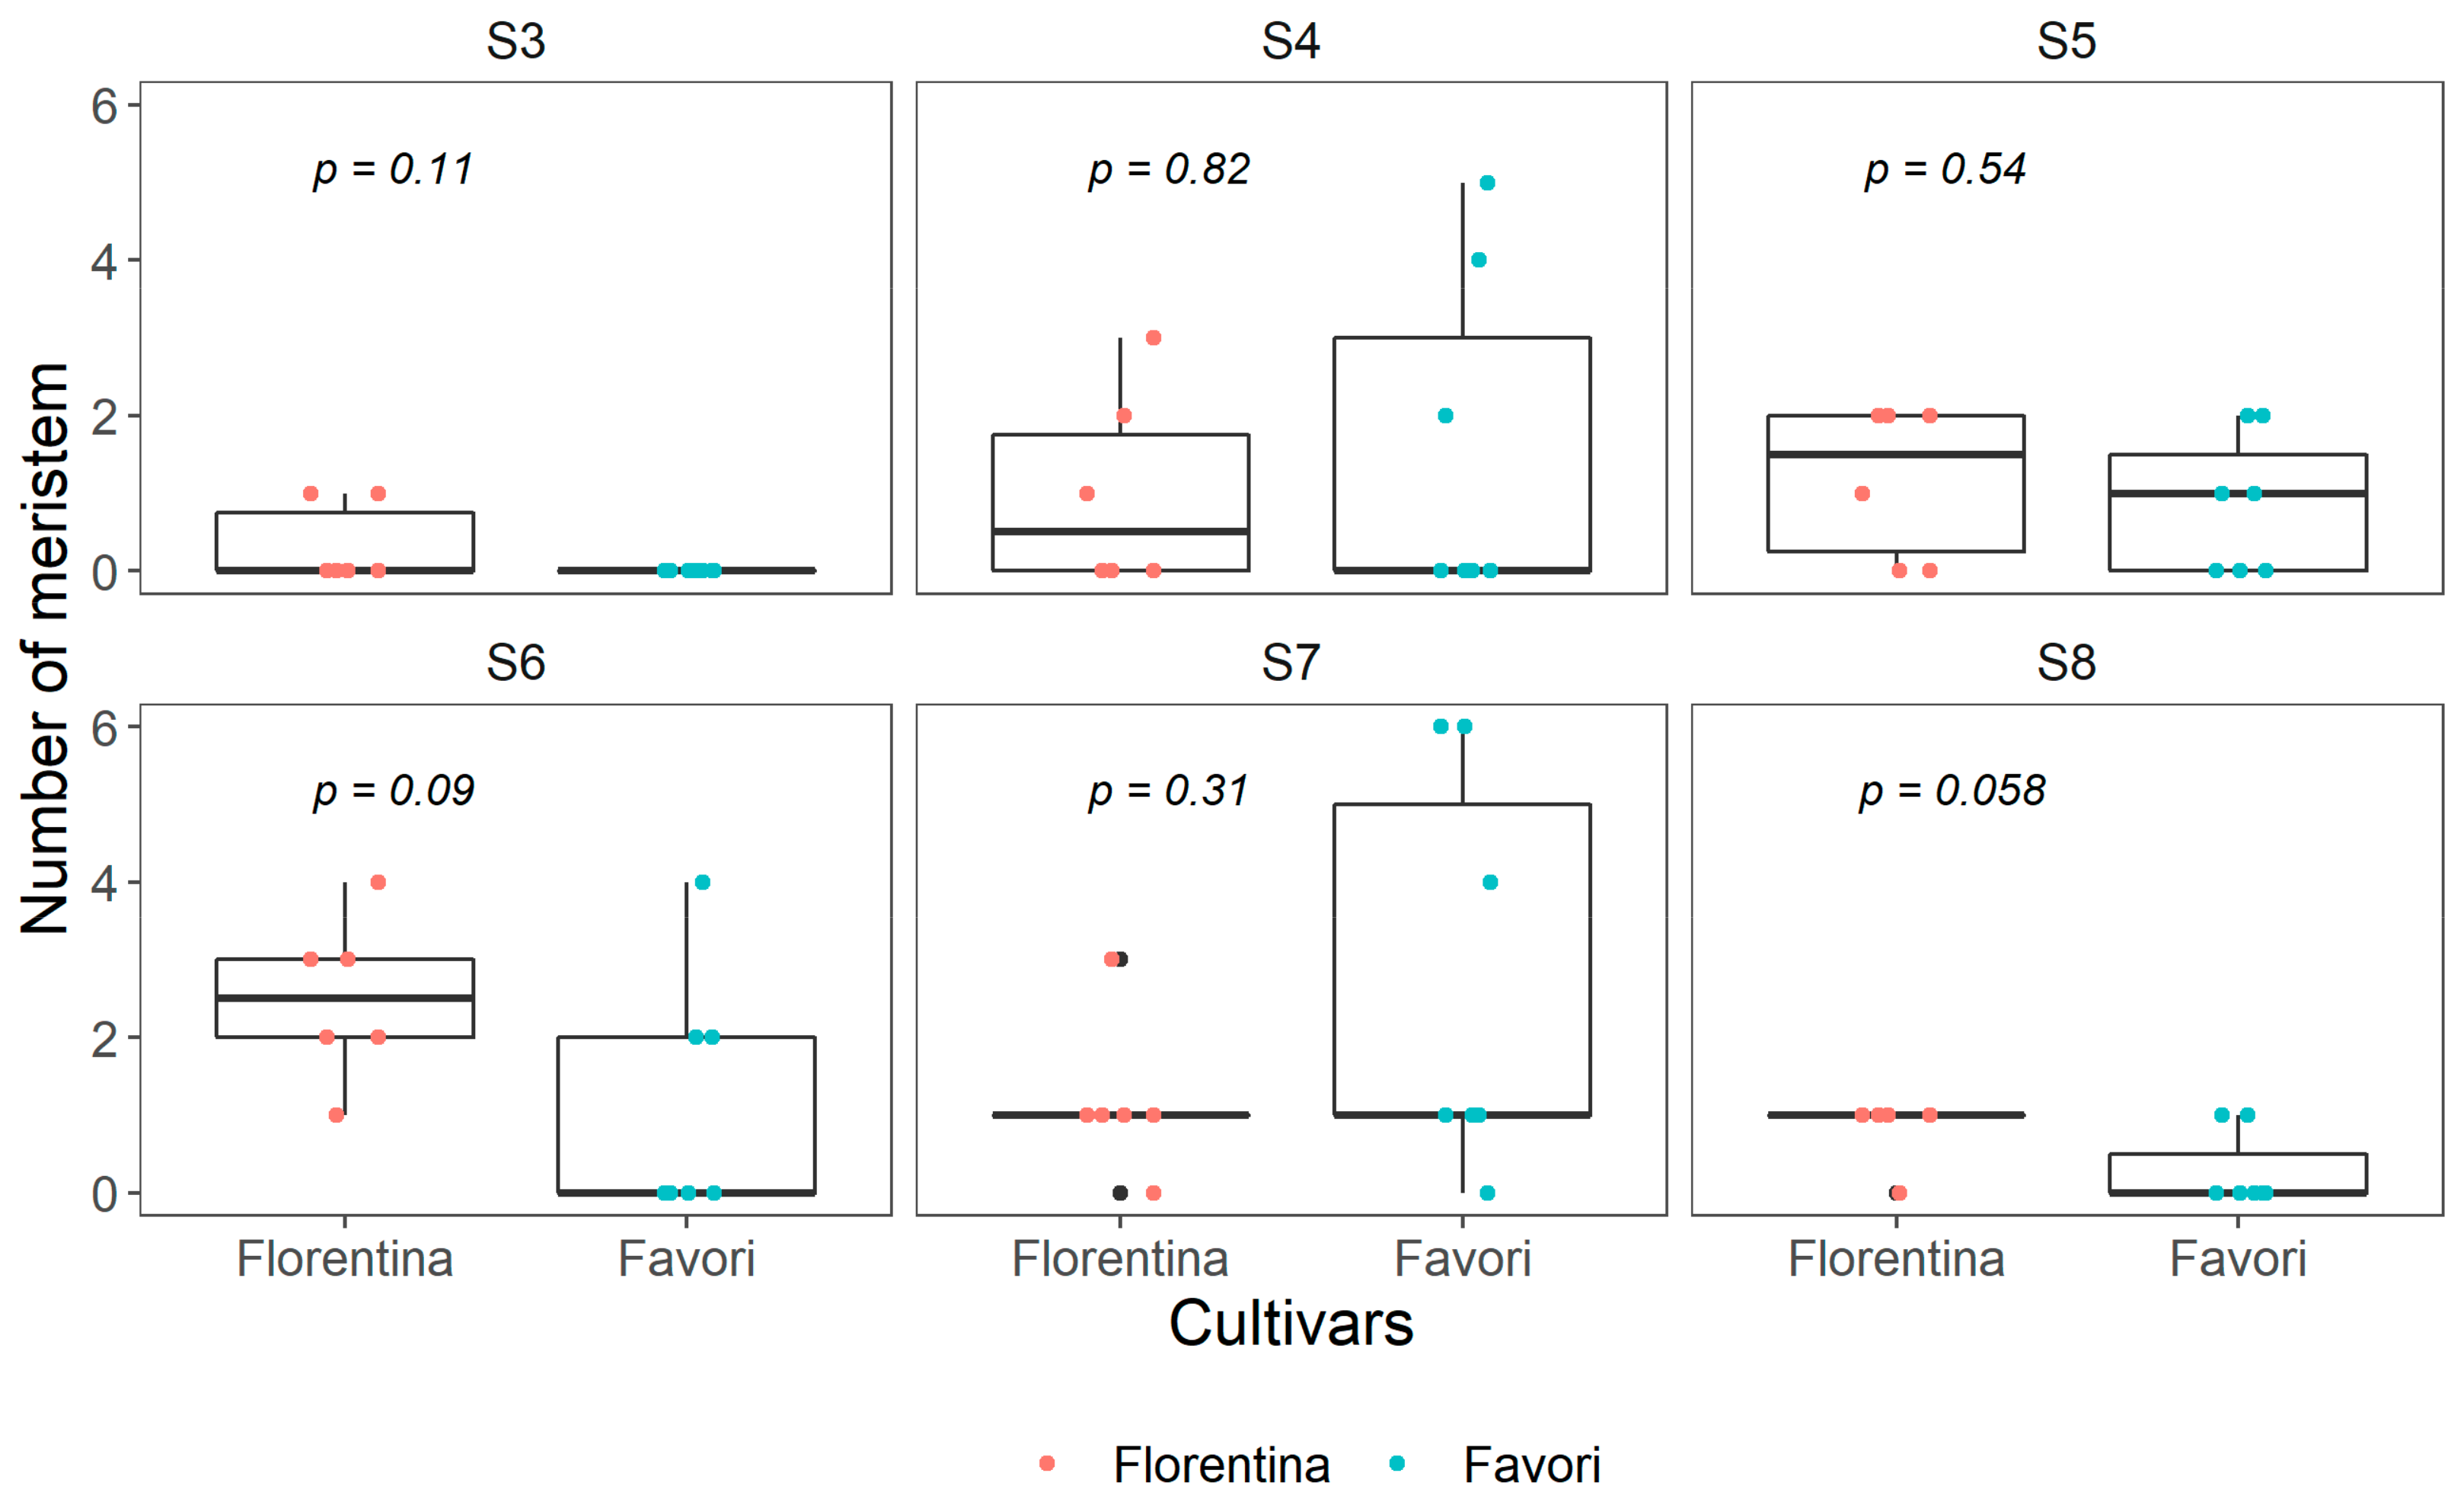
Horticulturae 07 00484 g001
Figure 2. Boxplot of number of meristems at each developmental stage (S3–S8) in ‘Florentina’ and ‘Favori’ strawberry plants at start of experiment (W0), N = 7, where any bud below S4 was pooled as vegetative and categorized as S3. The p-value is adjusted using pairwise Kruskal−Wallis test.
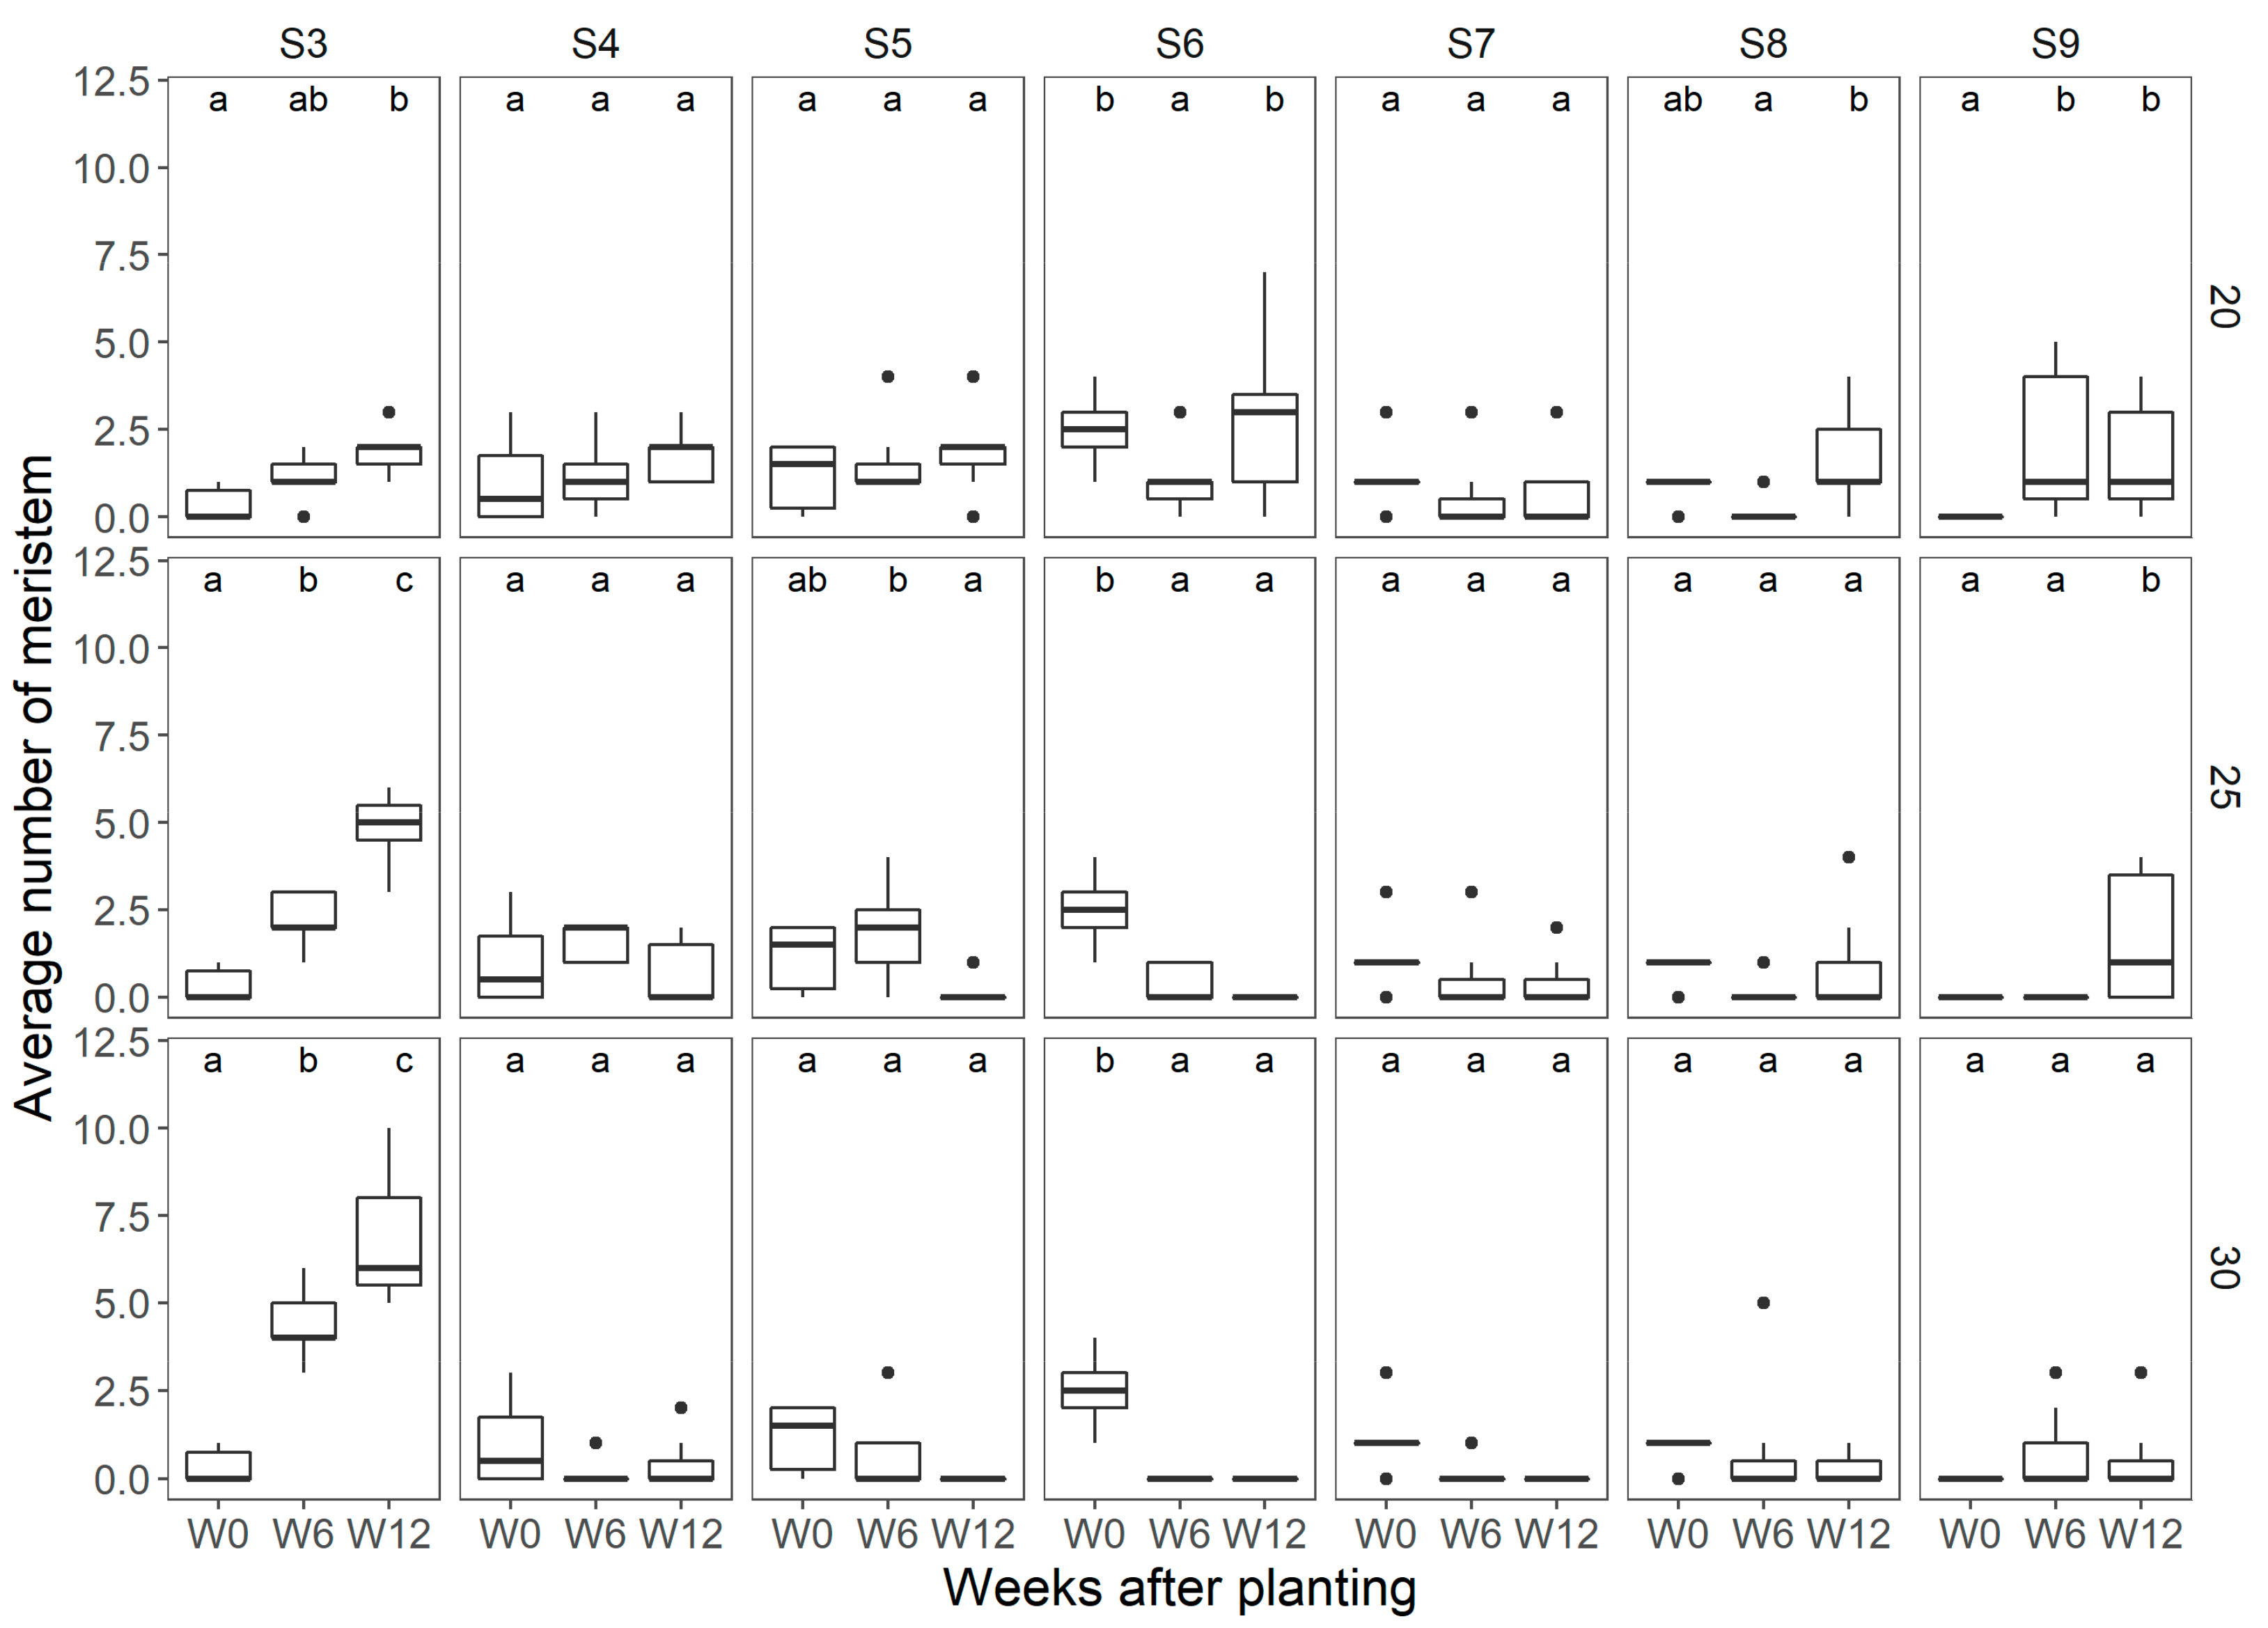
Horticulturae 07 00484 g002
Figure 3. Average number of meristems observed per temperature treatment at each of the flower mapping occasions in ‘Florentina’, where W0 = week 0, W6 = week 6, and W12 = week 12 after start of treatment, at 20 °C, 25 °C, and 30 °C, N = 7. The different letters above the boxplots in each box denote differences among means between the flower mapping occasions per temperature treatment, and similar lowercase letters indicate non-significant difference by the Holm−Sidak post-hoc test at 5% of error probability (p < 0.05).
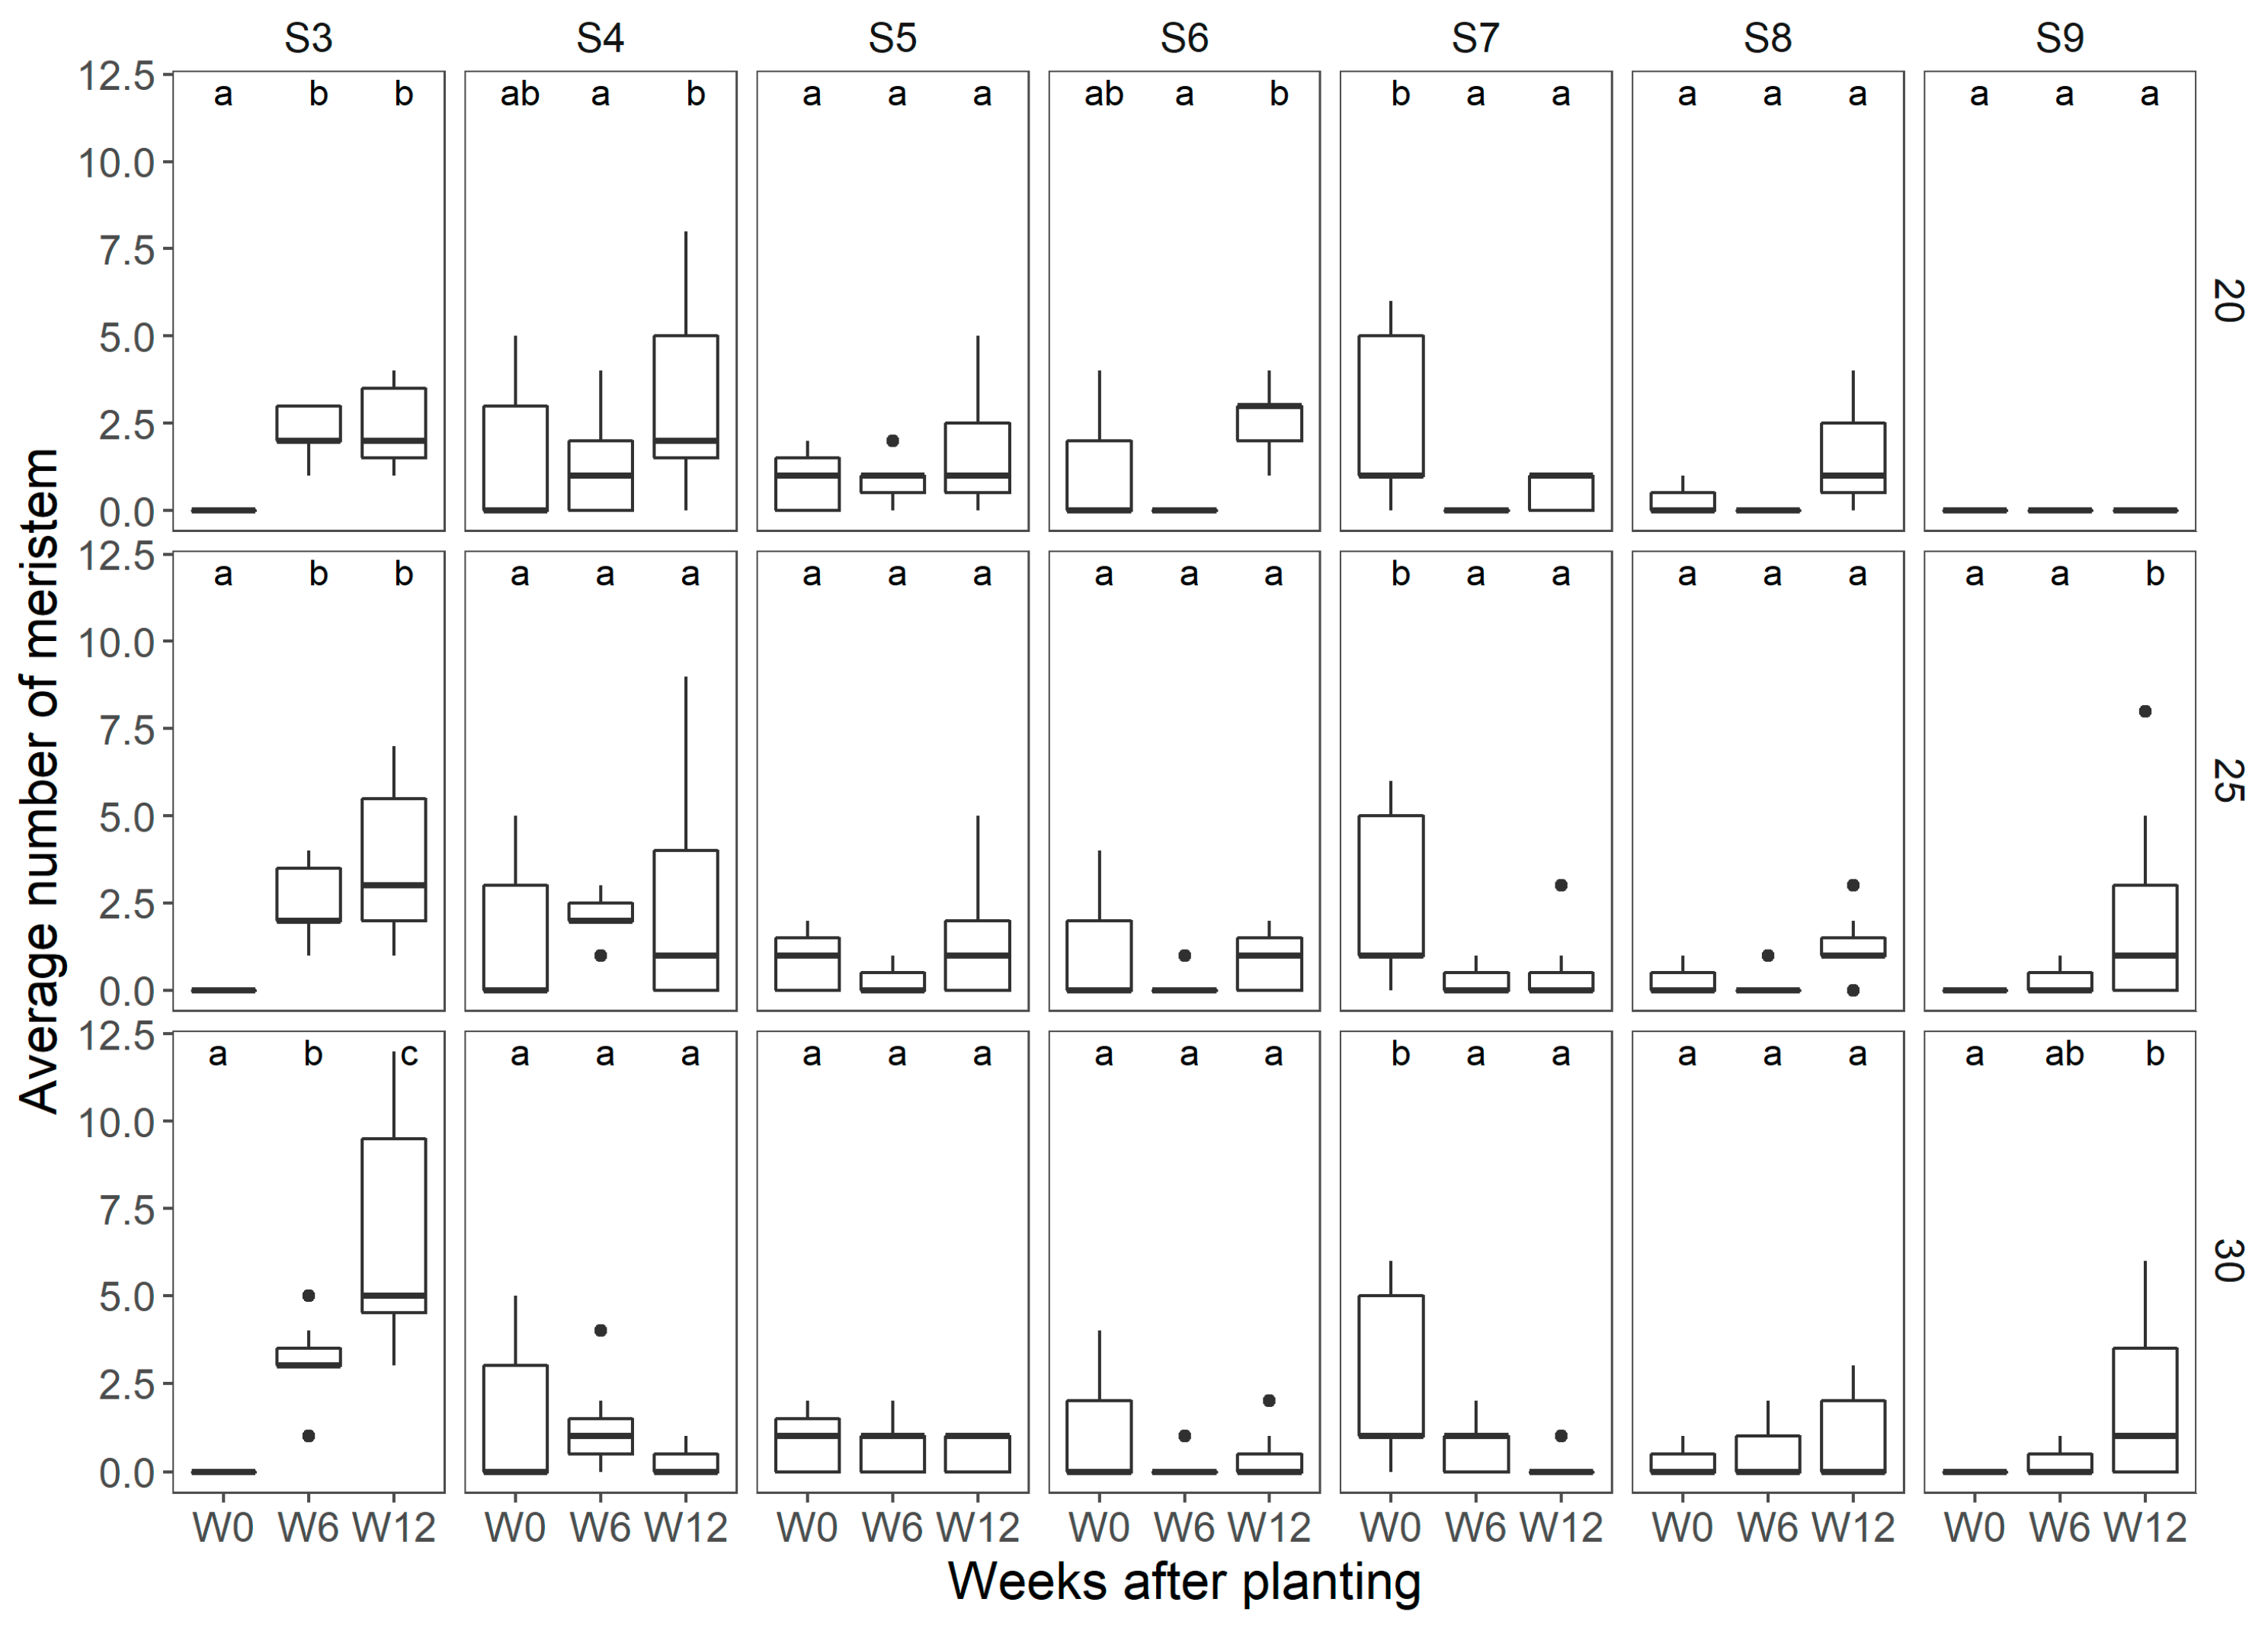
Horticulturae 07 00484 g003
Figure 4. Average number of meristems observed per temperature treatment at each of the flower mapping occasions for ‘Favori’, where W0 = week 0, W6 = week 6, and W12 = week 12 after start of treatment, at 20 °C 25 °C, and 30 °C, N = 7. The different letters above the boxplots in each box denote differences among means between the flower mapping occasions per temperature treatment and similar lowercase letters indicate non-significant difference by the Holm−Sidak post-hoc at 5% of error probability (p < 0.05).
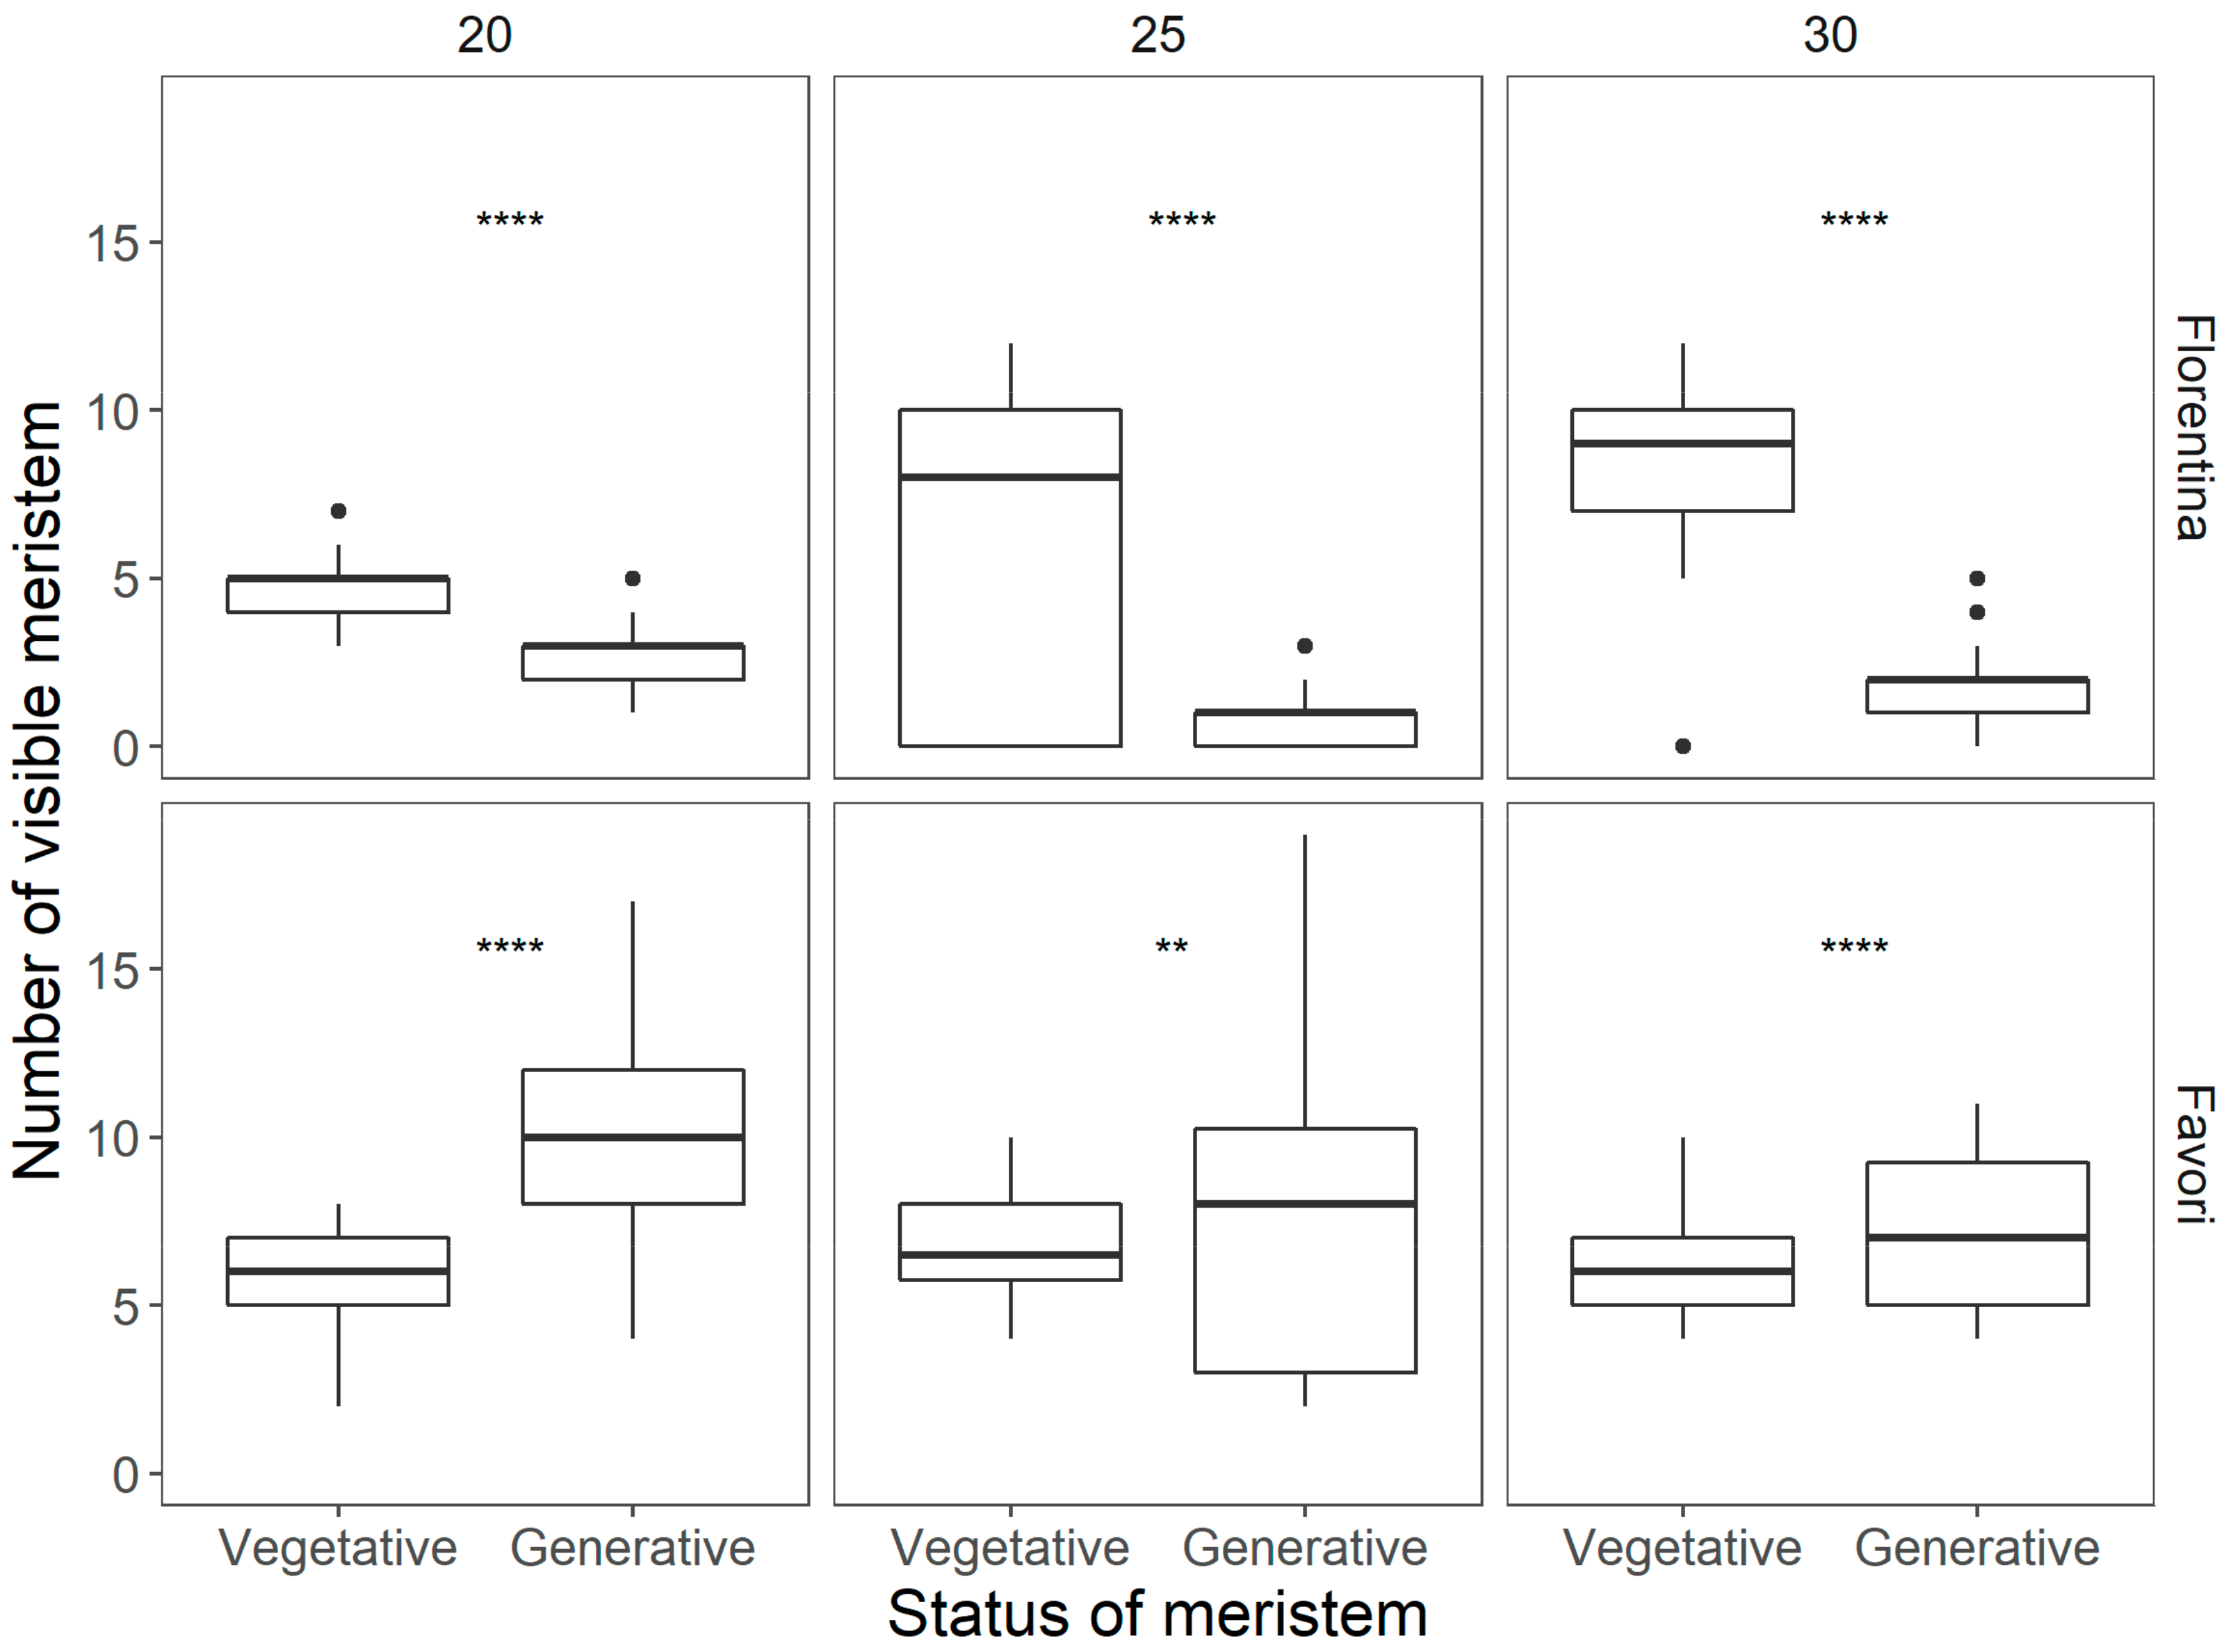
Horticulturae 07 00484 g004
Figure 5. Differences in the status of the meristem at the end of 15 weeks of temperature treatments for each cultivar Statistically significant differences between the vegetative and generative stages were calculated by ANOVA and are indicated by asterisks (* p < 0.05; ** p < 0.01; *** p < 0.001; **** p < 0.0001).
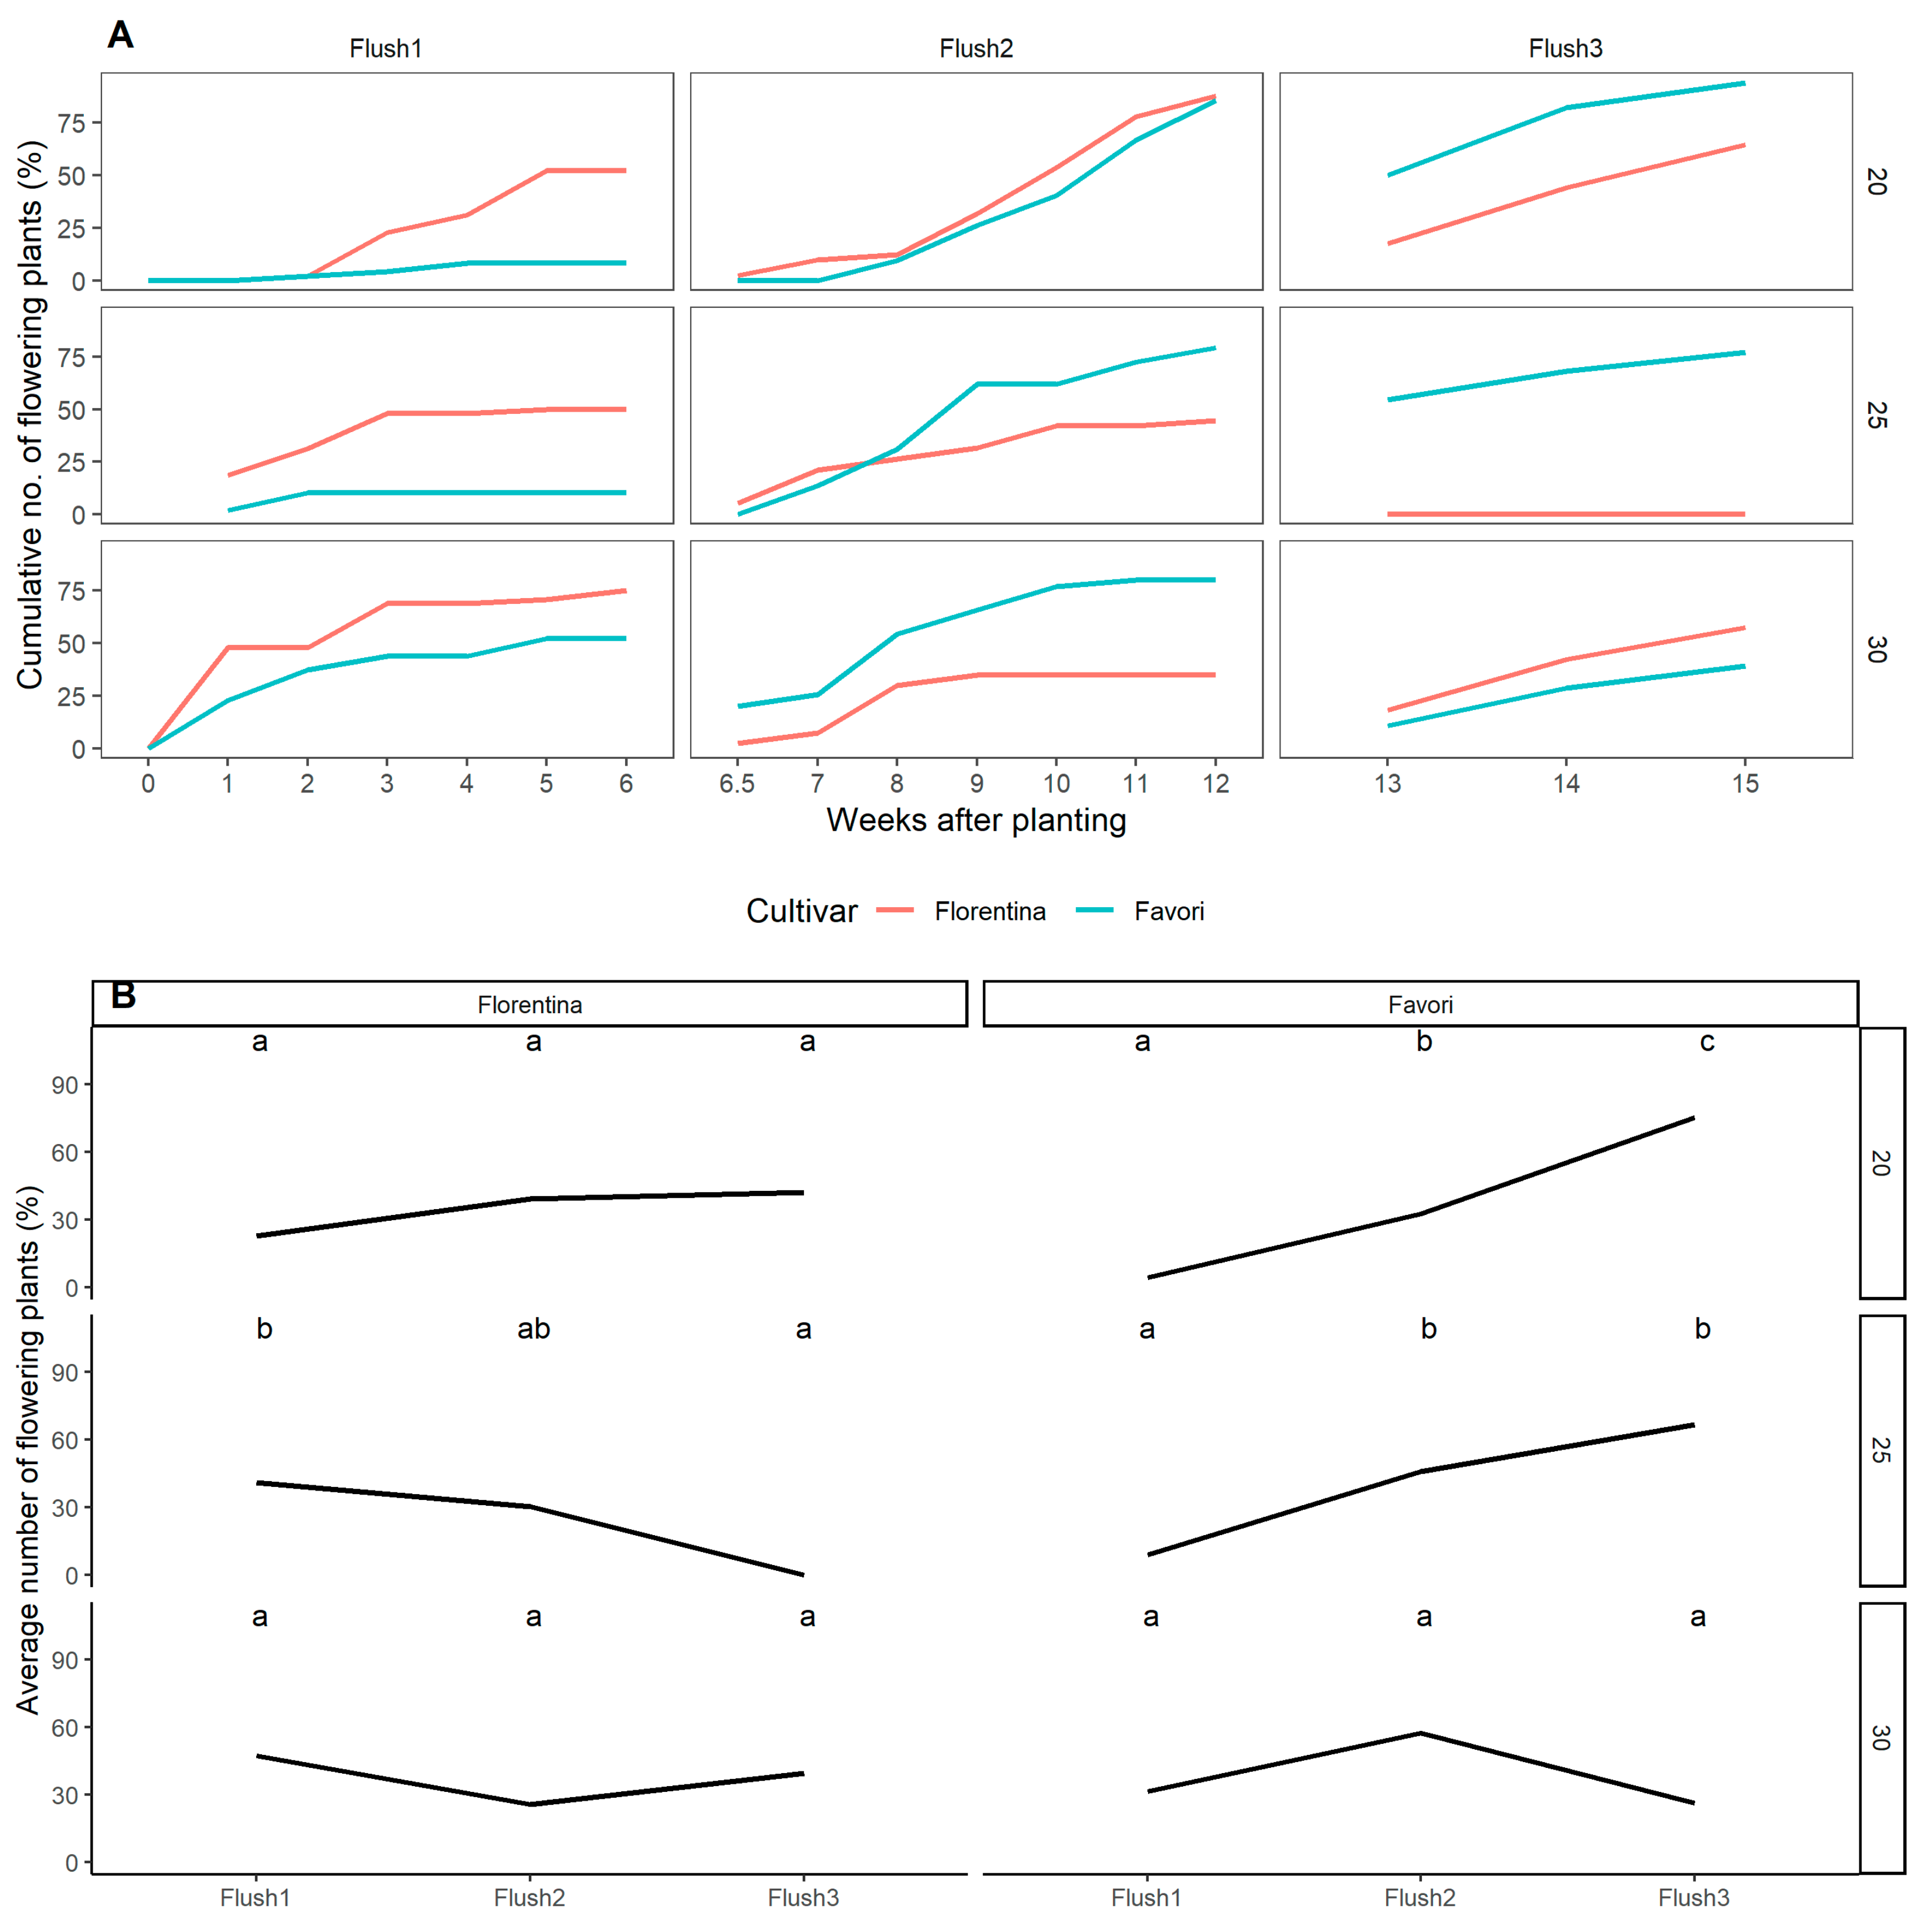
Horticulturae 07 00484 g005
Figure 6. Cumulative number of flowering plants (%), recorded at anthesis, at each flush during the three temperature treatments for ‘Florentina’ and ‘Favori’ (A). The data was divided into three flushes, where flush 1 = W0–W6, flush 2 = W7–W12, and flush 3 = W13–W15, correlating with the flower mapping data. The number of plants that flushed were compared for each cultivar at each temperature treatment using pairwise comparison and letters were calculated using Tukey’s post-hoc method for multiple comparison. Similar letters indicate no significance at p = 0.05 (B).
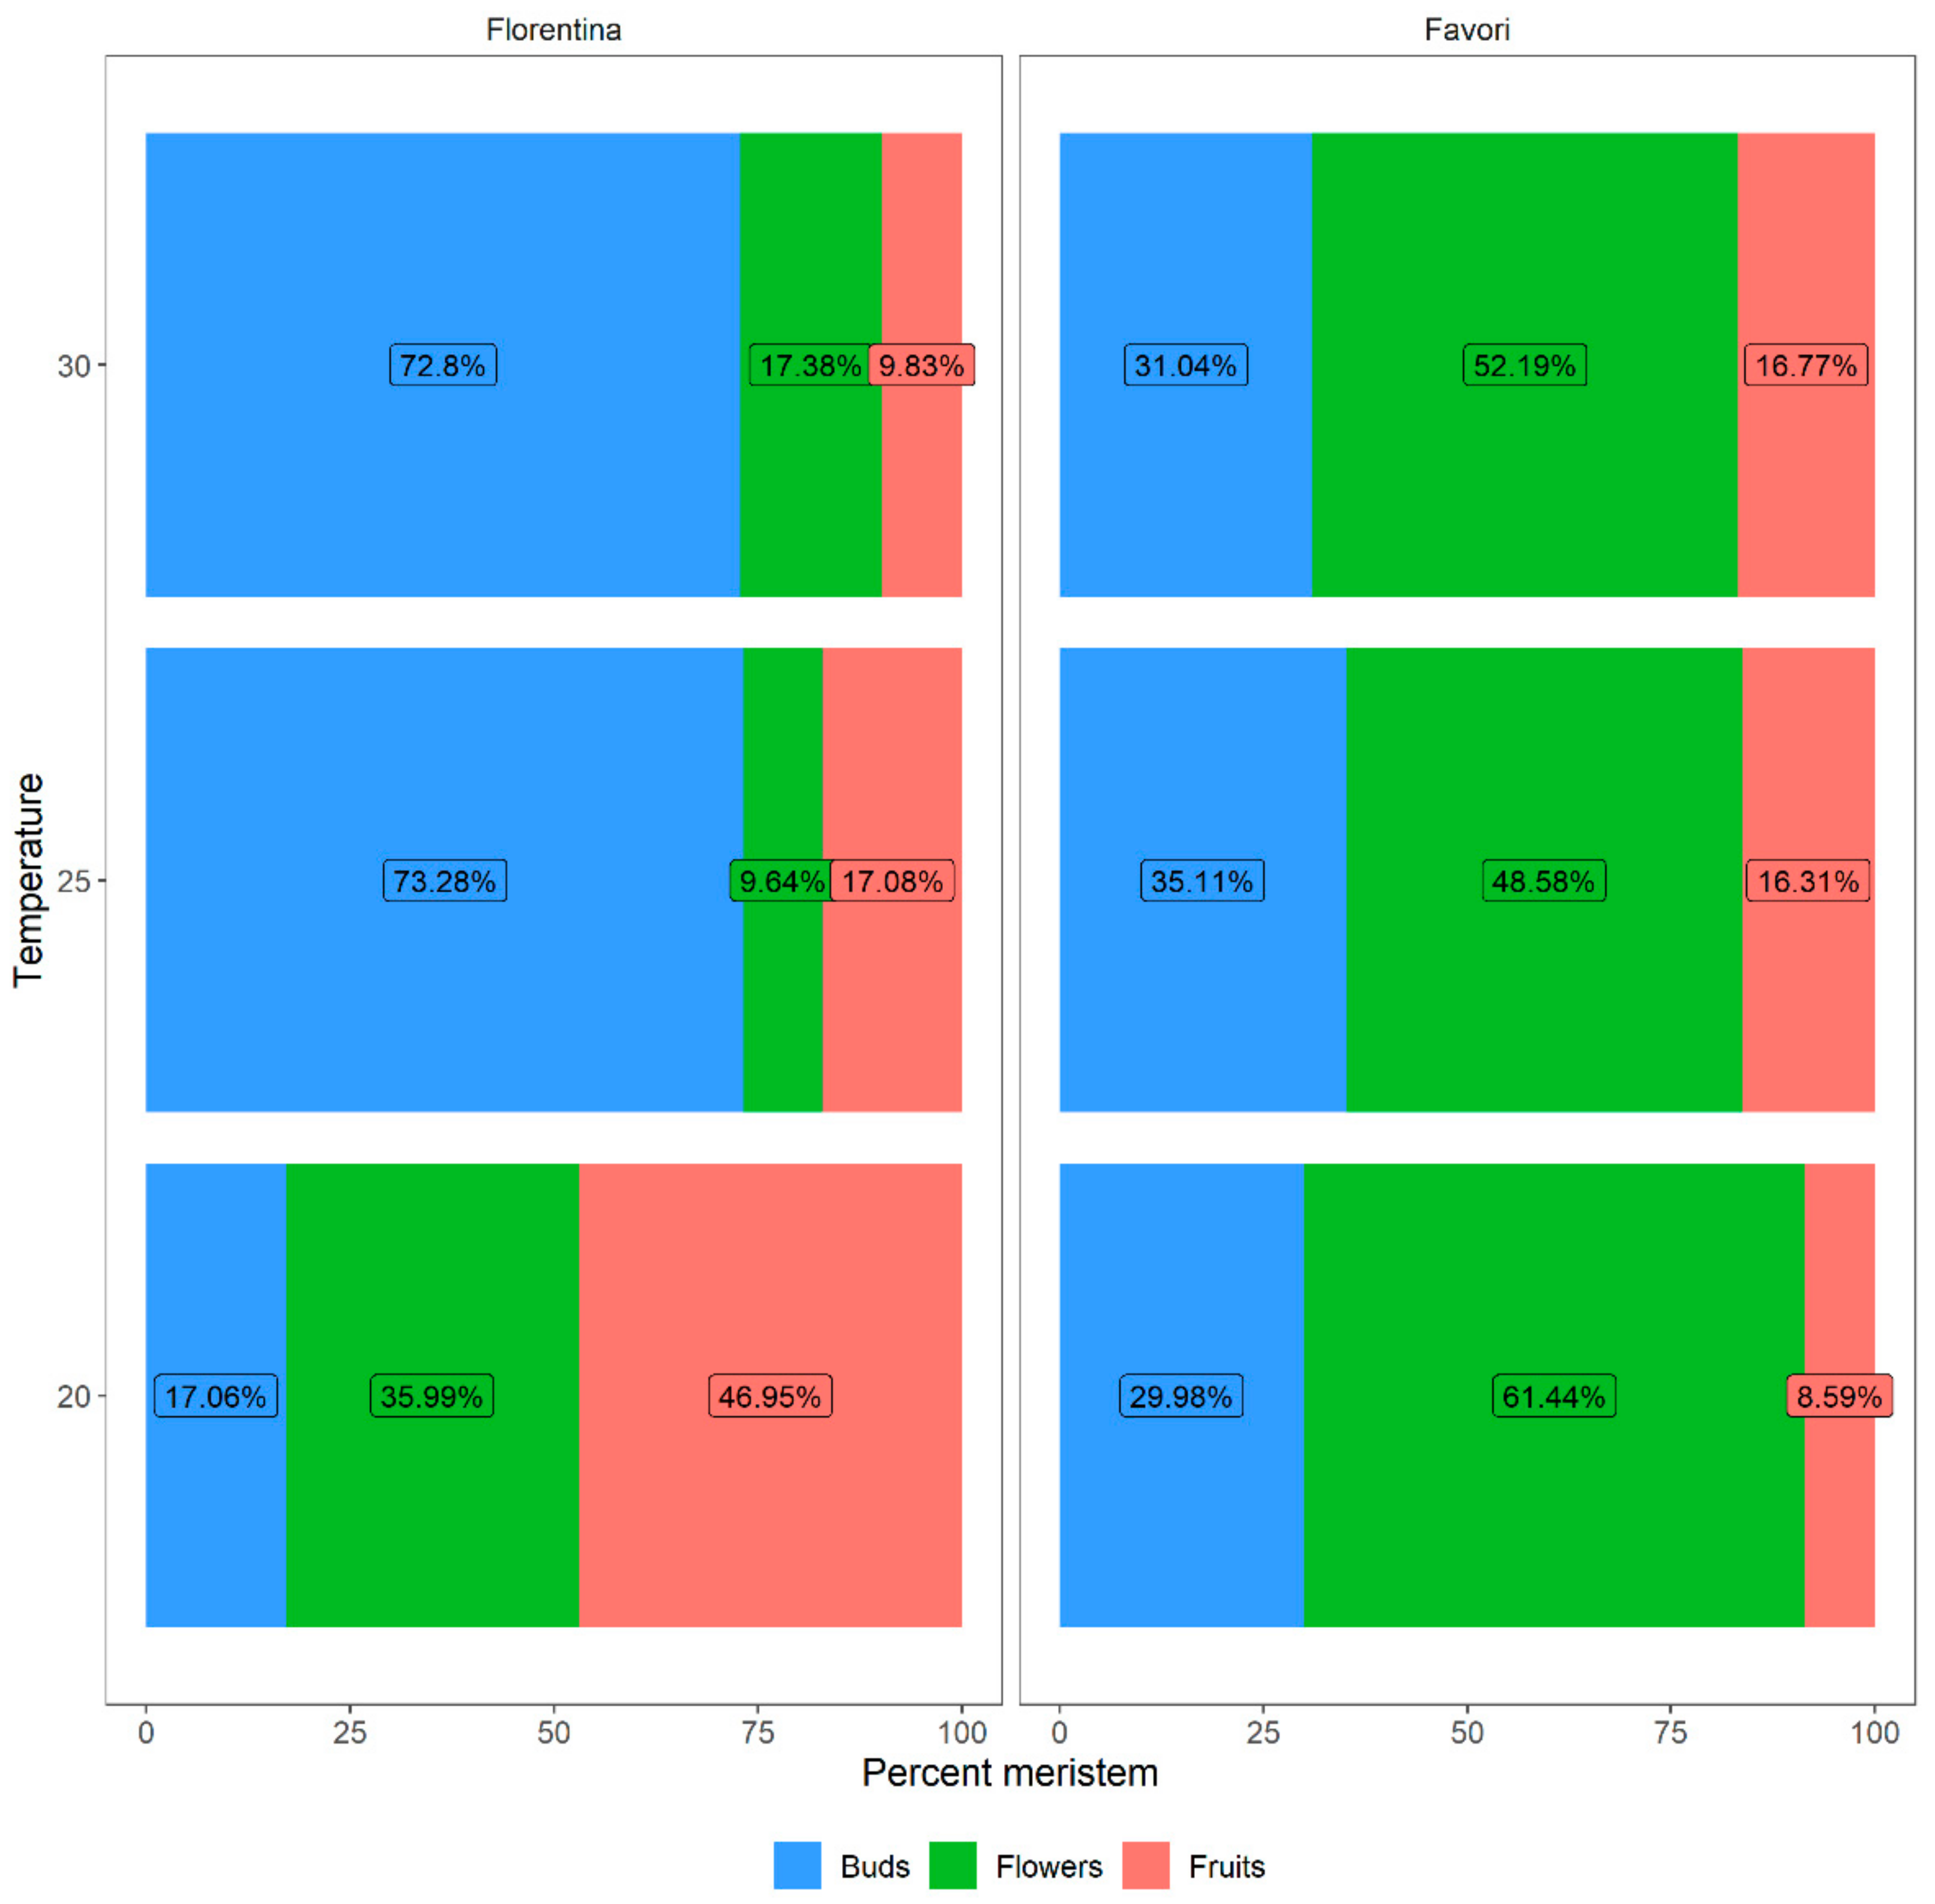
Horticulturae 07 00484 g006
Figure 7. The percentages of meristems that differentiated into flowers and fruits for plants of the strawberry cultivars ‘Florentina’ and ‘Favori’ treated at three temperatures (20 °C, 25 °C, and 30 °C). The buds that were below S9 (fully differentiated flower) were compiled as “Buds”.
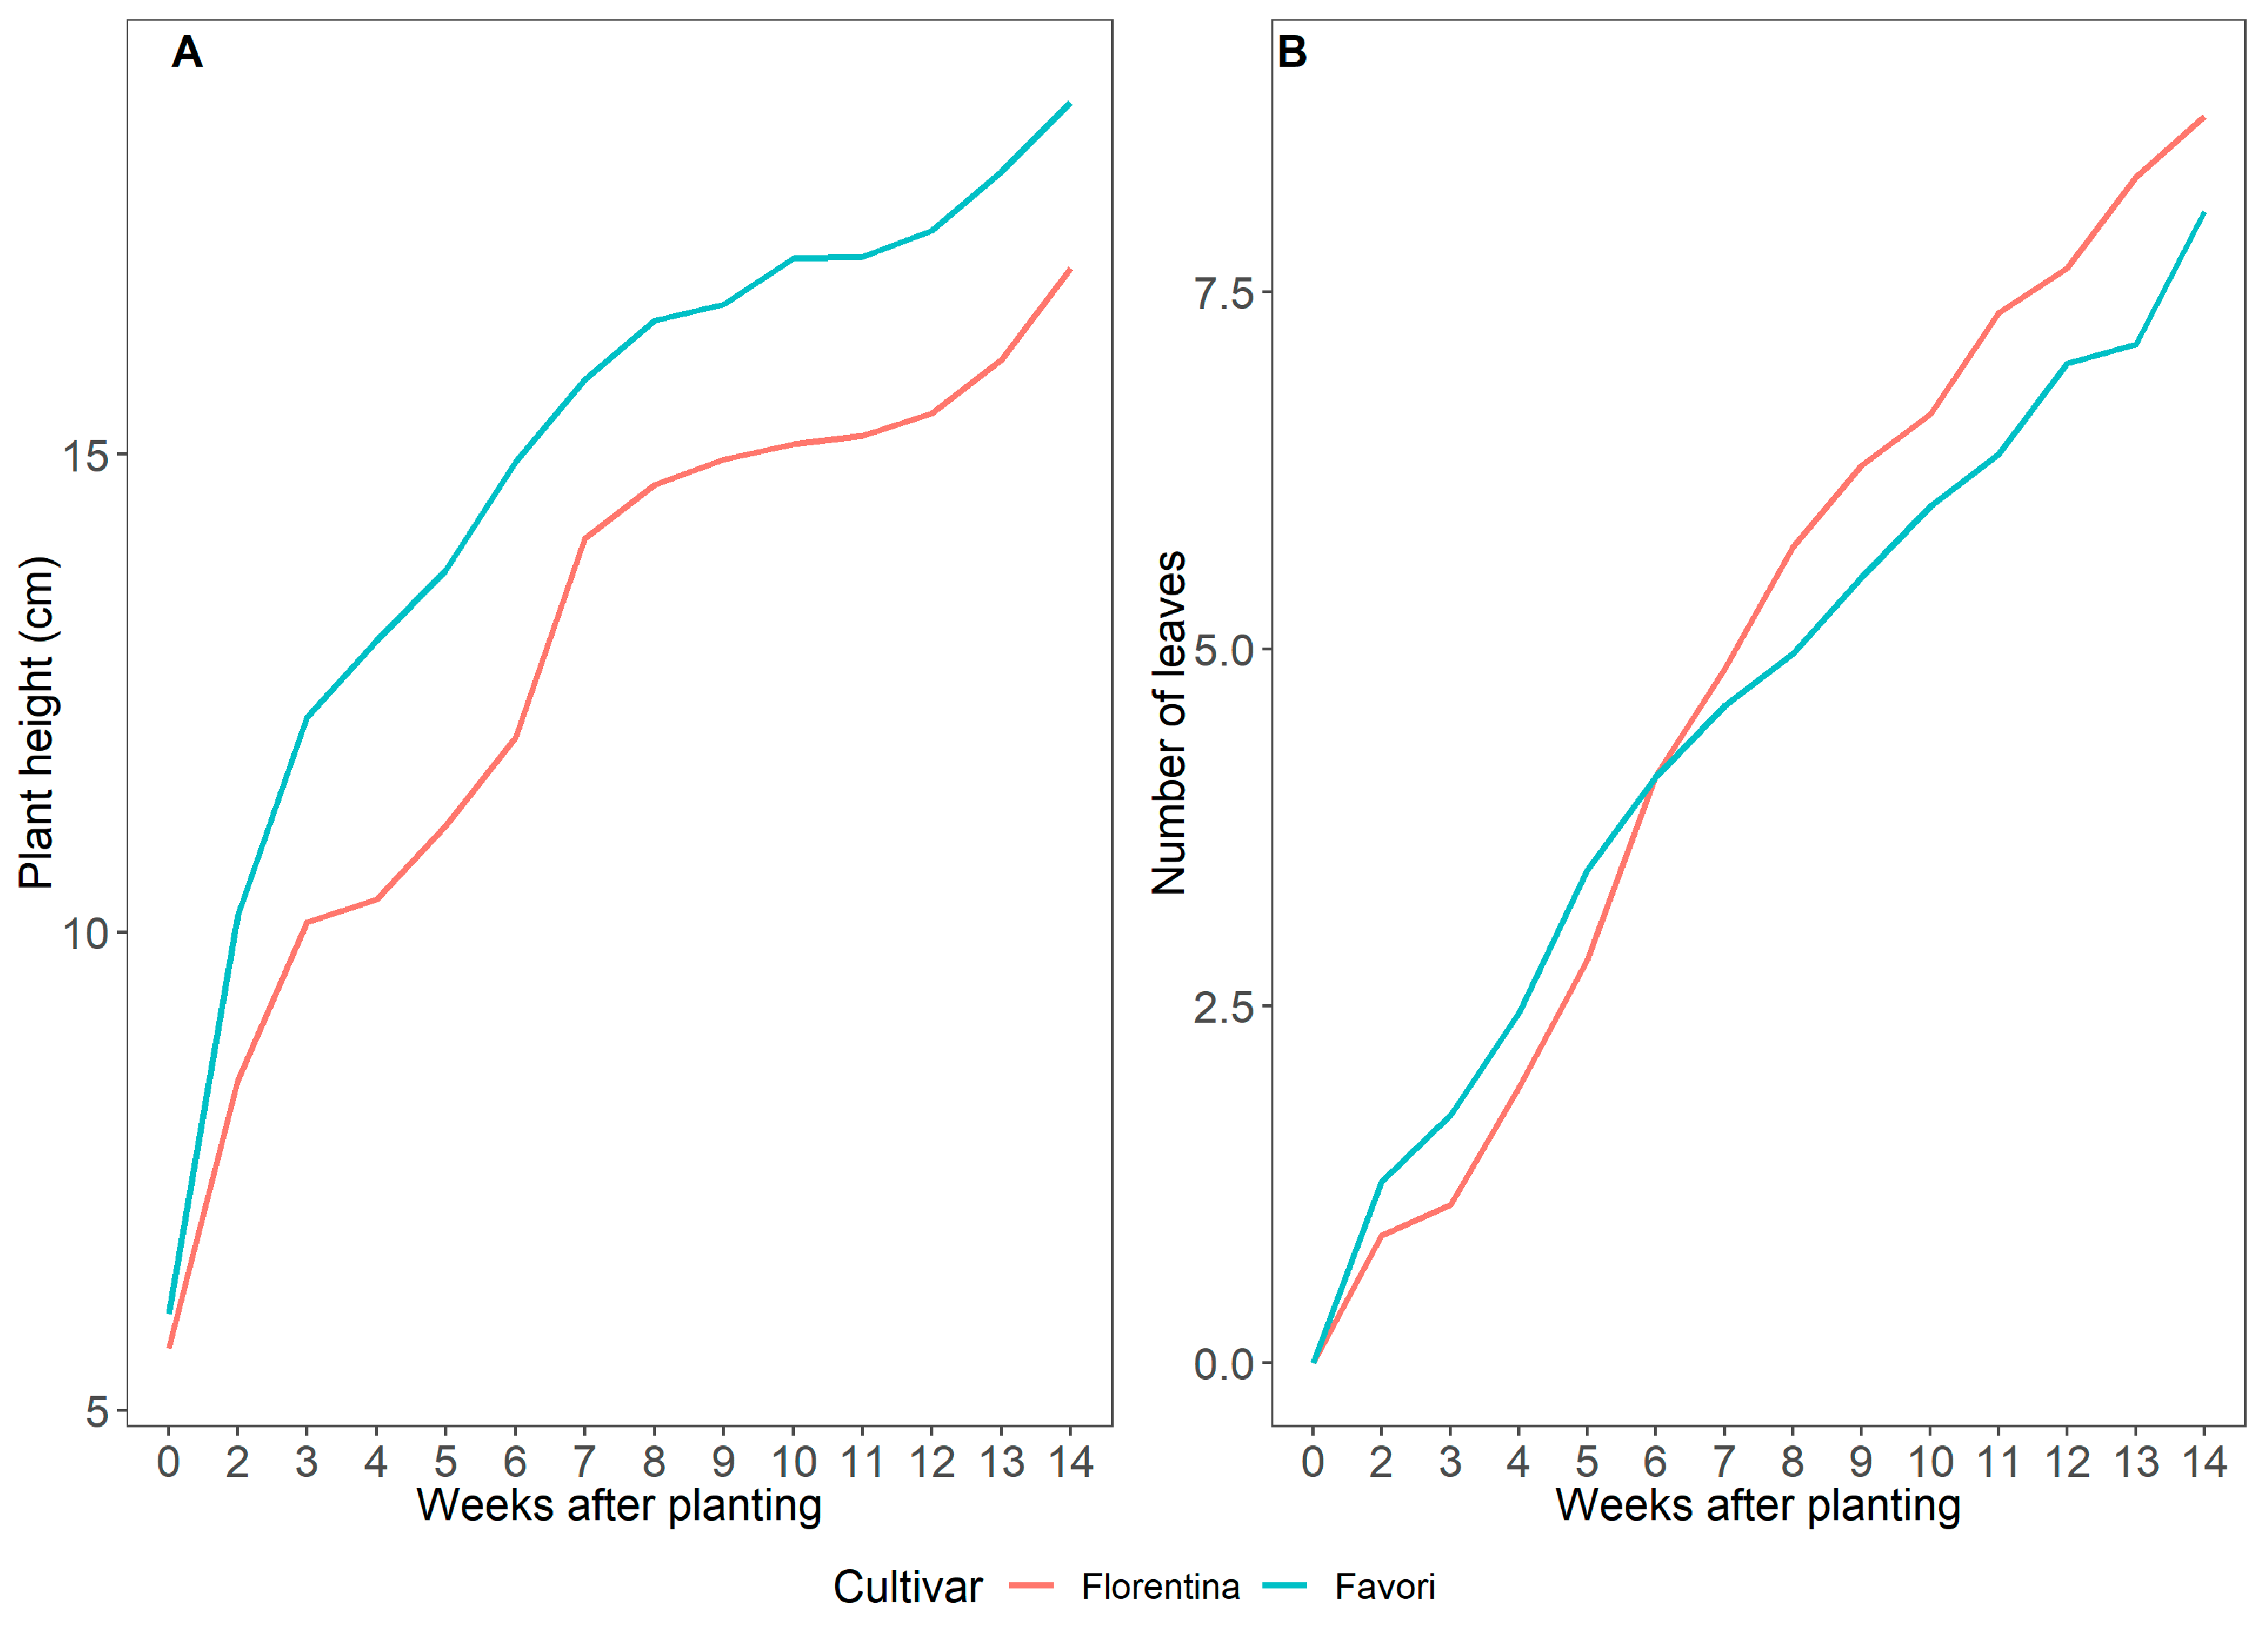
Horticulturae 07 00484 g007
Figure 8. Average plant height (A) and total number of leaves (B) for ‘Florentina’ and ‘Favori’ strawberry plants grown at ambient long day at 20 °C for 14 weeks (N = 29–32).
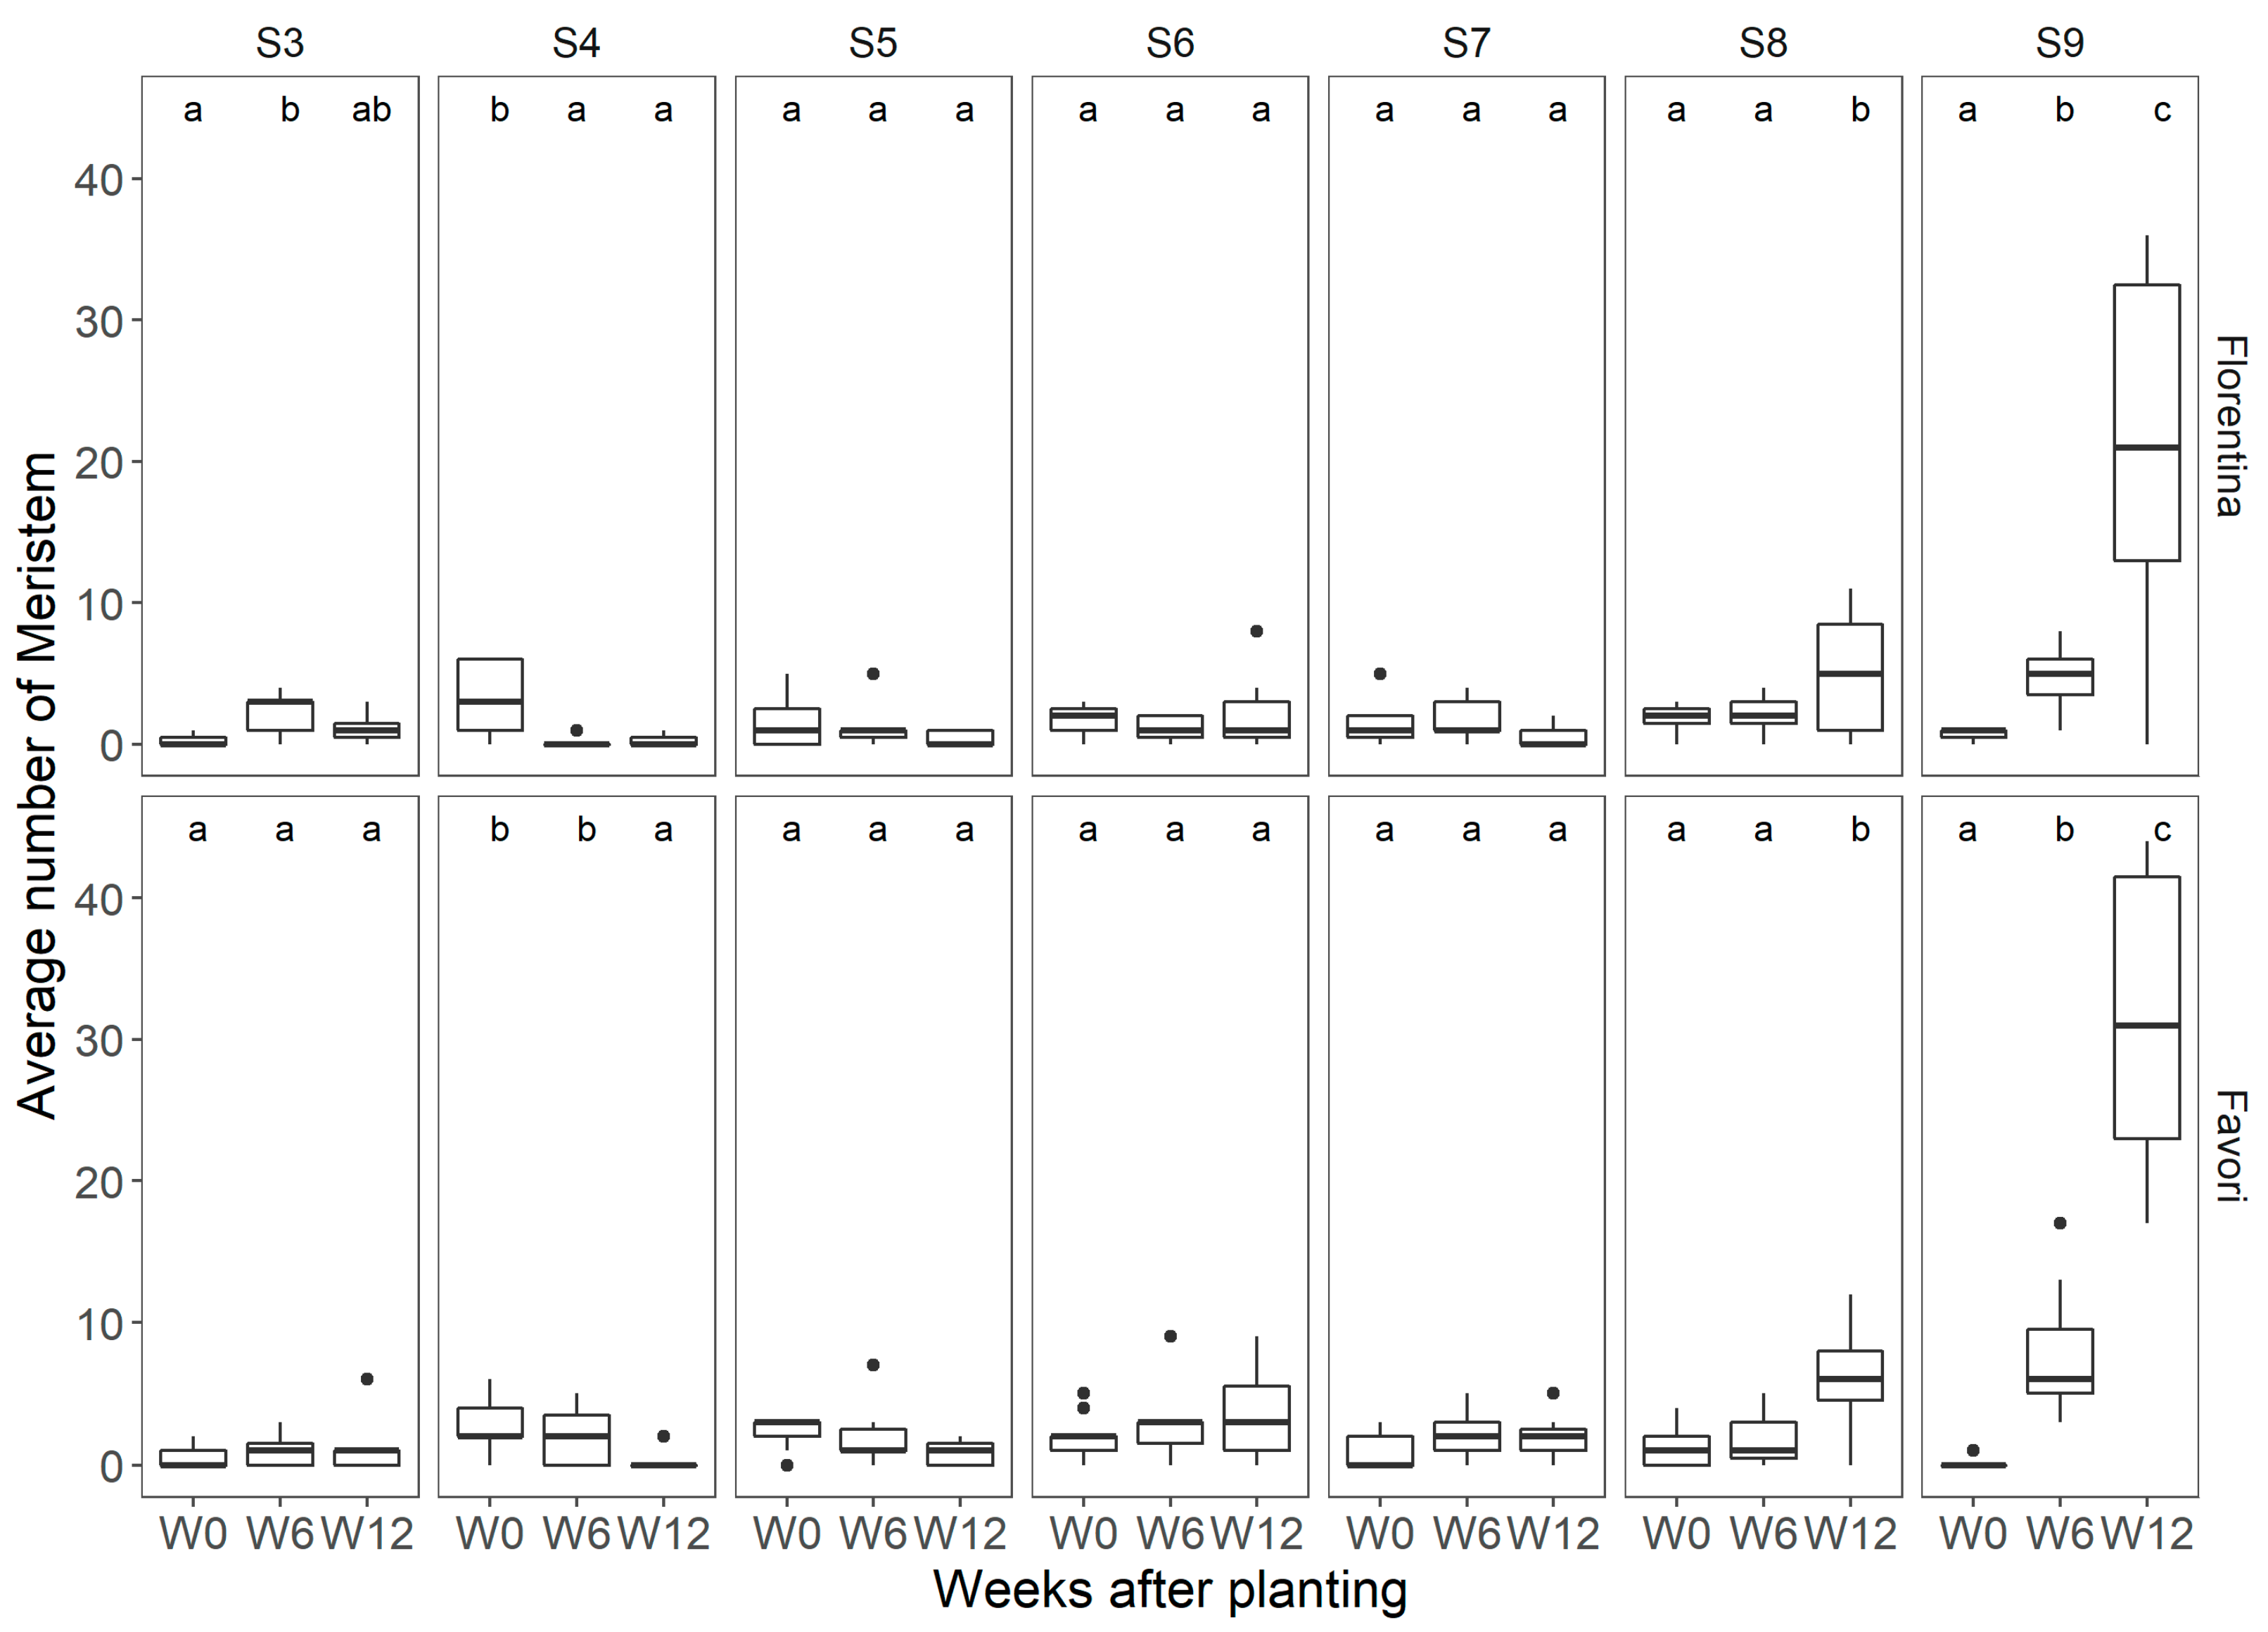
Horticulturae 07 00484 g008
Figure 9. Boxplots of the meristem development stages (S3–S9) at three timepoints (W0, W6, and W12) for plants of the strawberry cultivar ‘Florentina’ and ‘Favori’ grown in a greenhouse at ambient long photoperiod at 20 °C for 14 weeks, where N = 7. Pairwise comparison between the week, where the different letters above the boxplots represent statistical differences, while similar letters indicate no significant difference between cultivars by the Tukey test at 5% of error probability (p < 0.05).
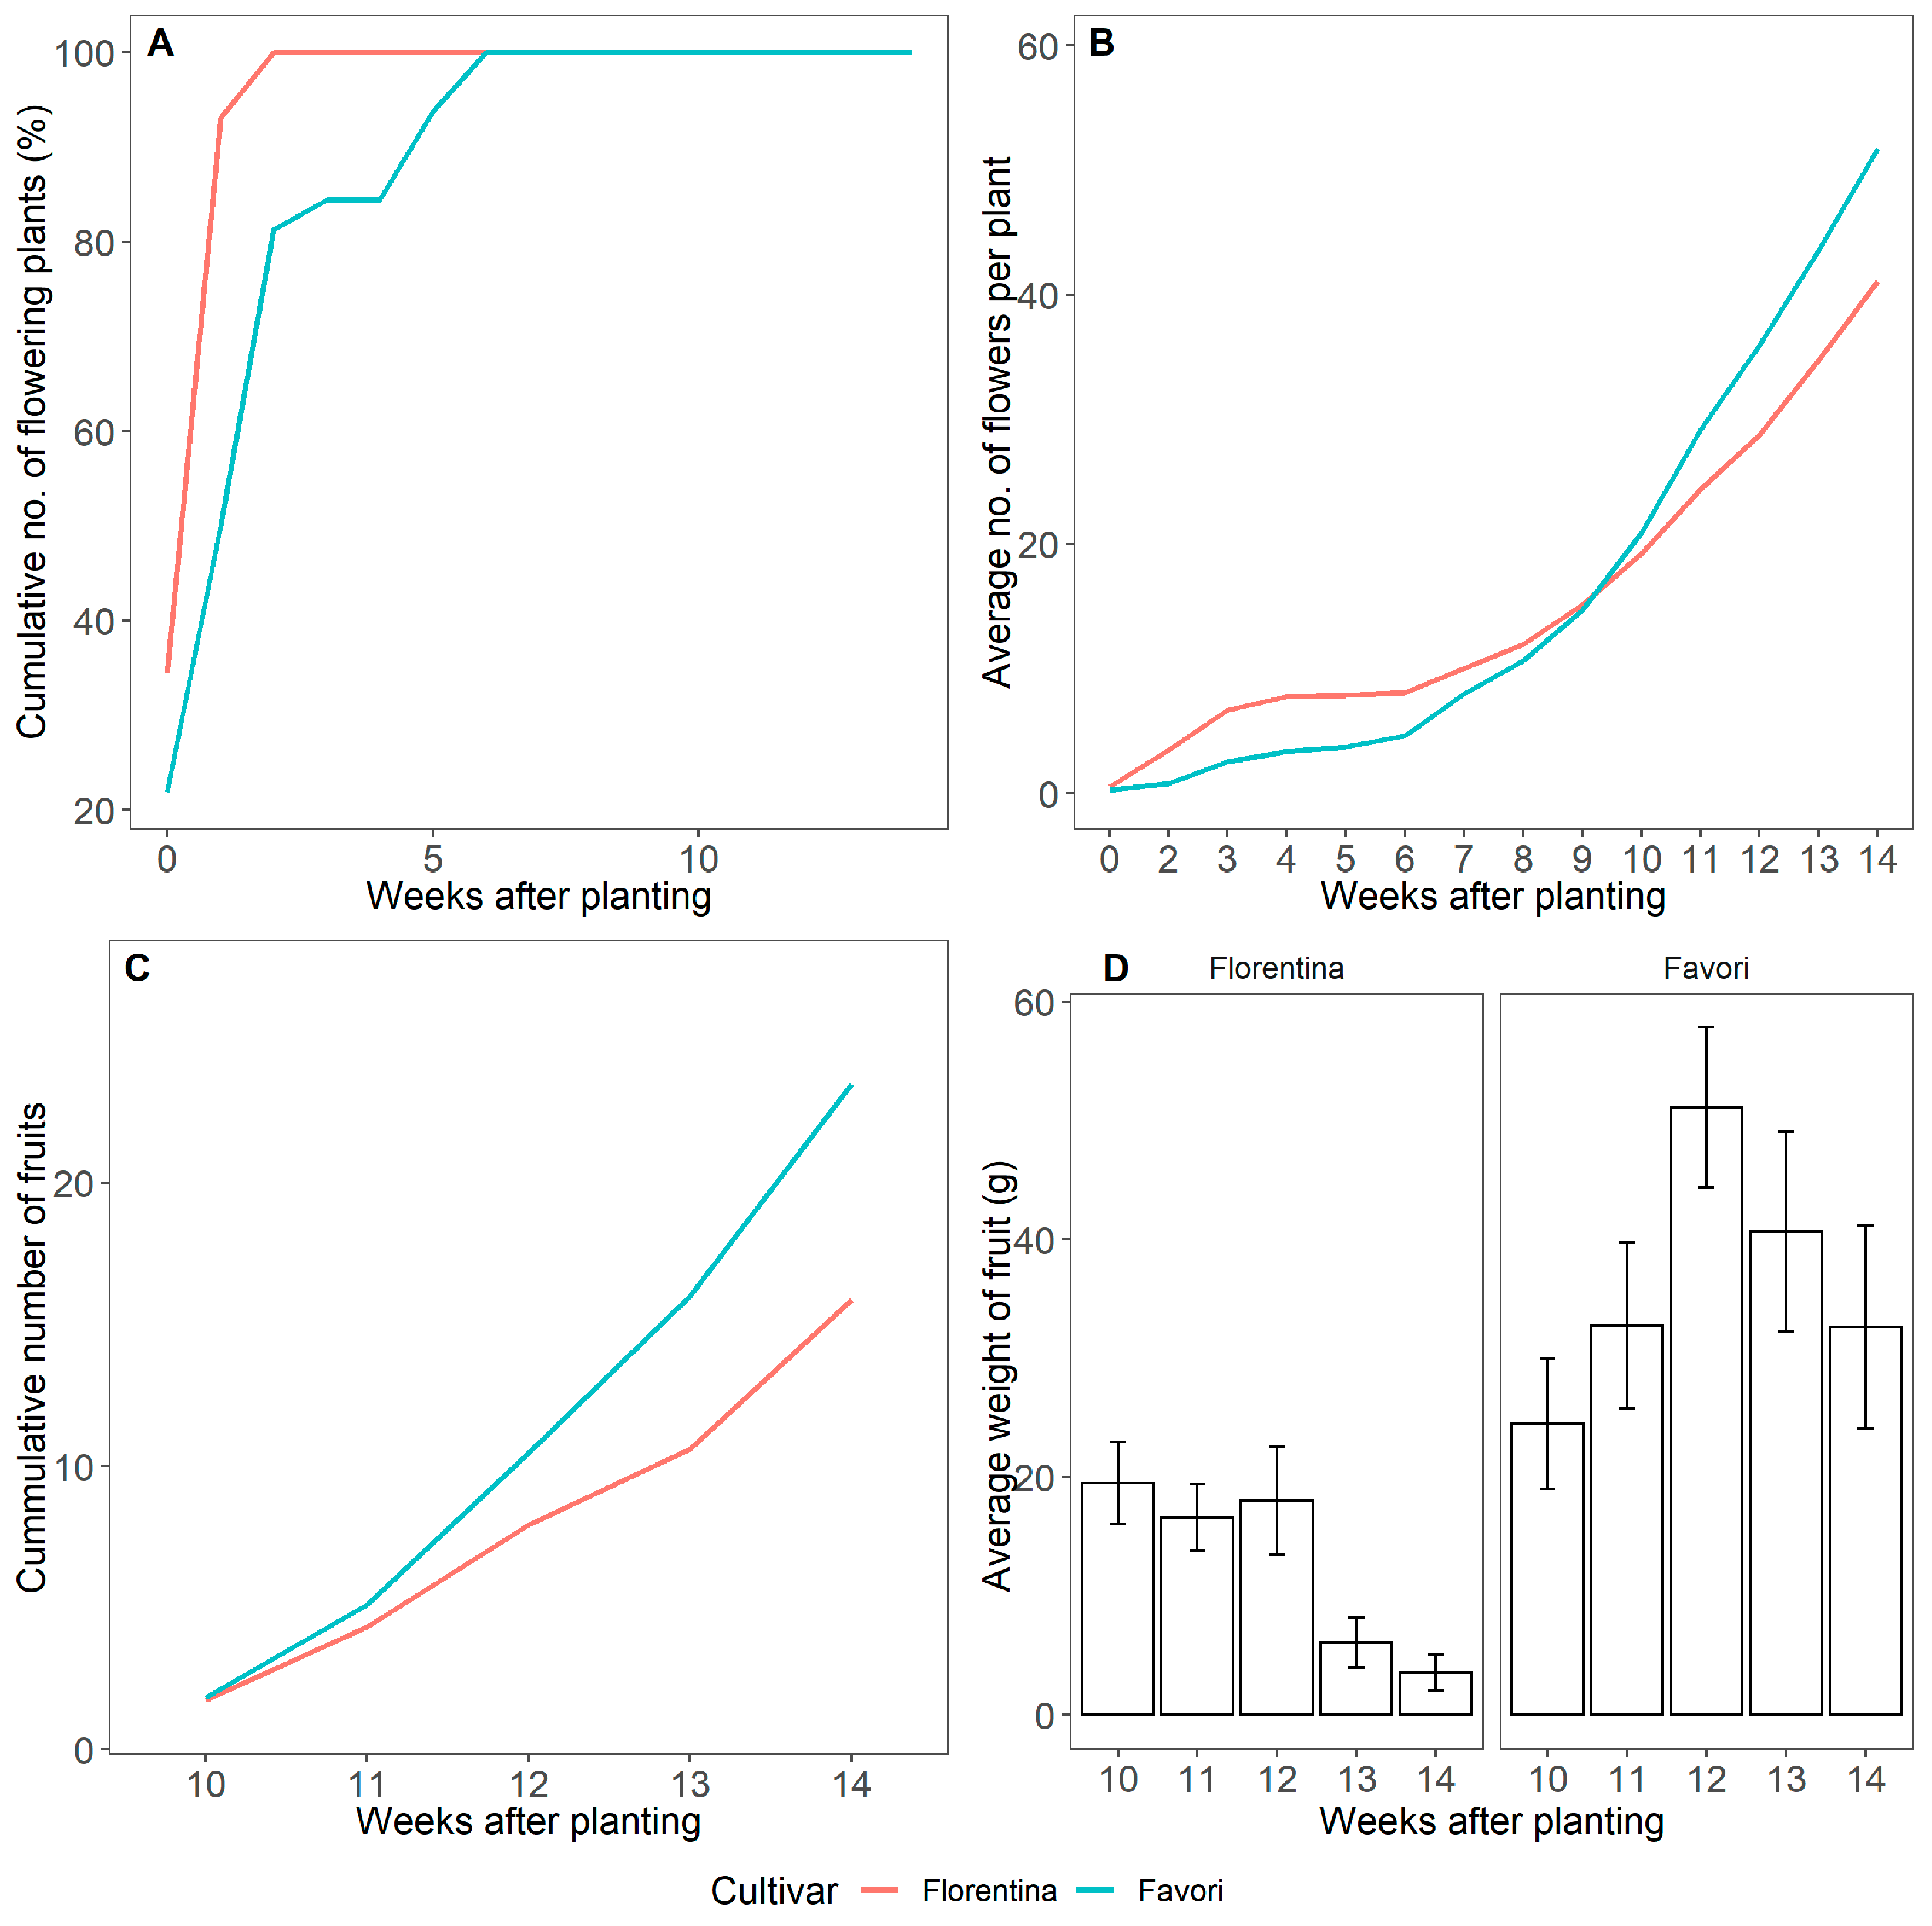
Horticulturae 07 00484 g009
Figure 10. Cumulative number of plants that flowered (%) (A), cumulative number of flowers per plant (B), cumulative number of fruits collected (C), and average weight of the total number of fruits collected on the given week with the error bars representing the standard error (D) over the course of 14 weeks at 20 °C under LD condition for ‘Florentina’ and ‘Favori’.
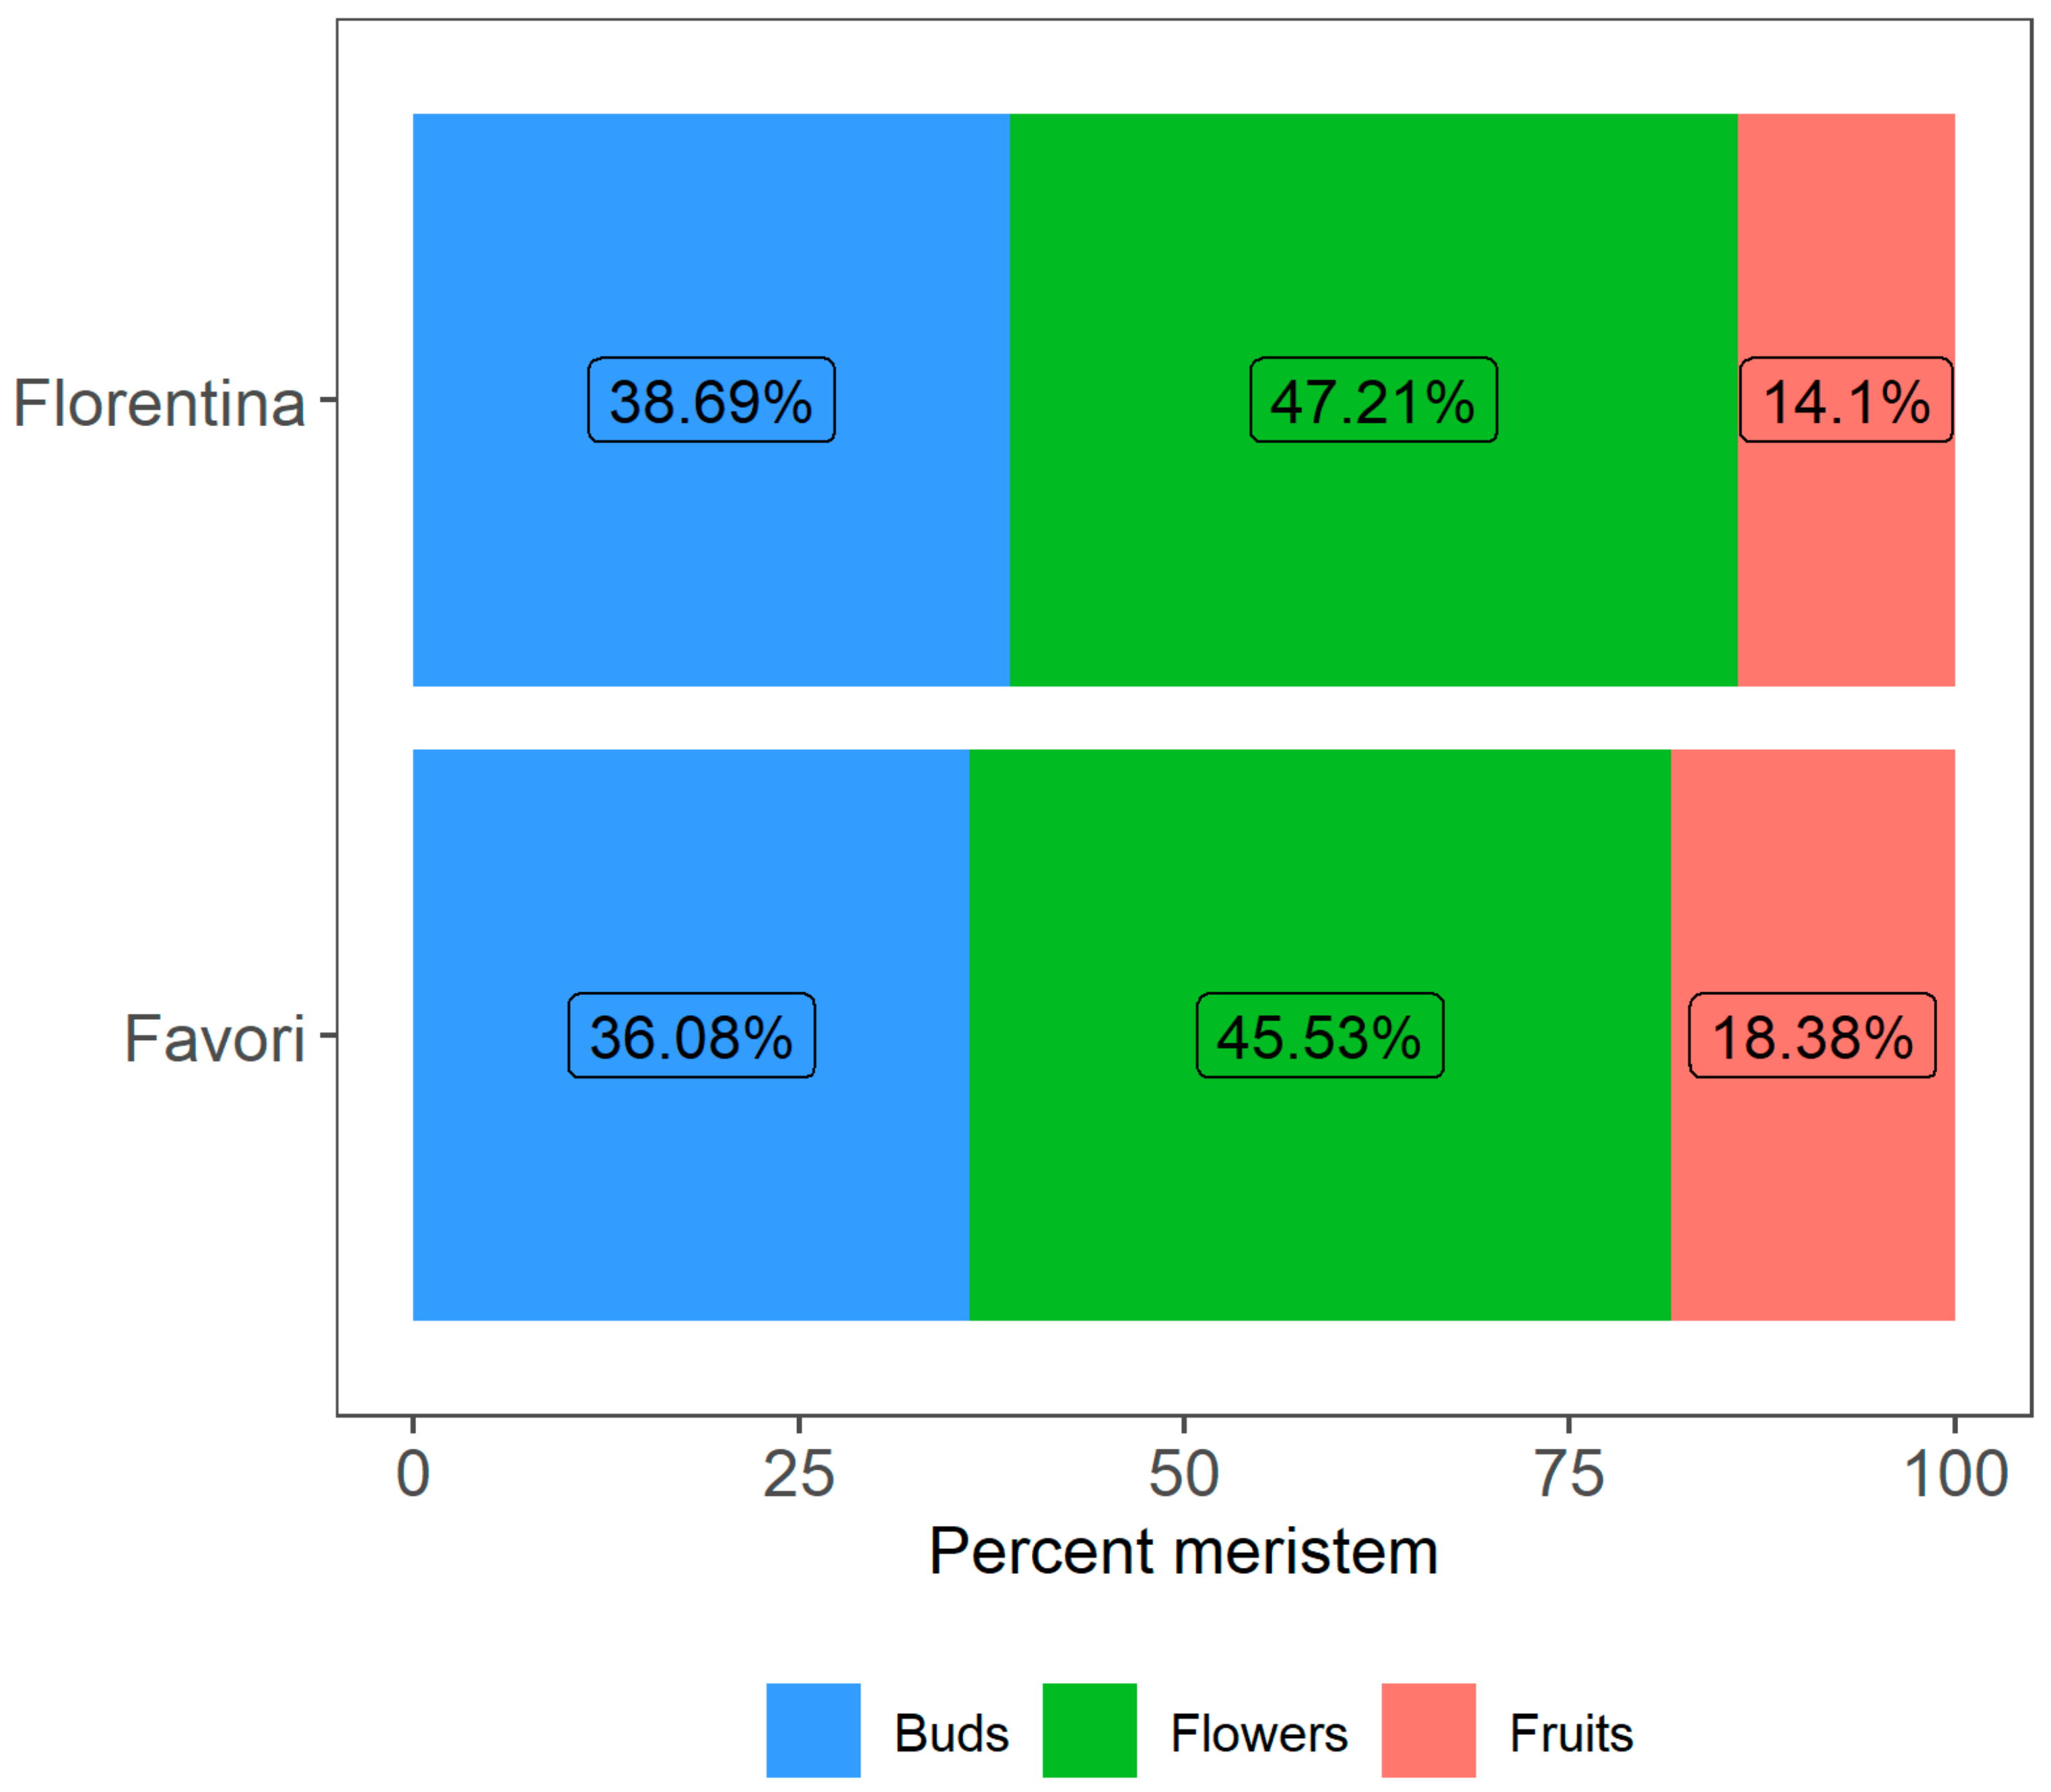
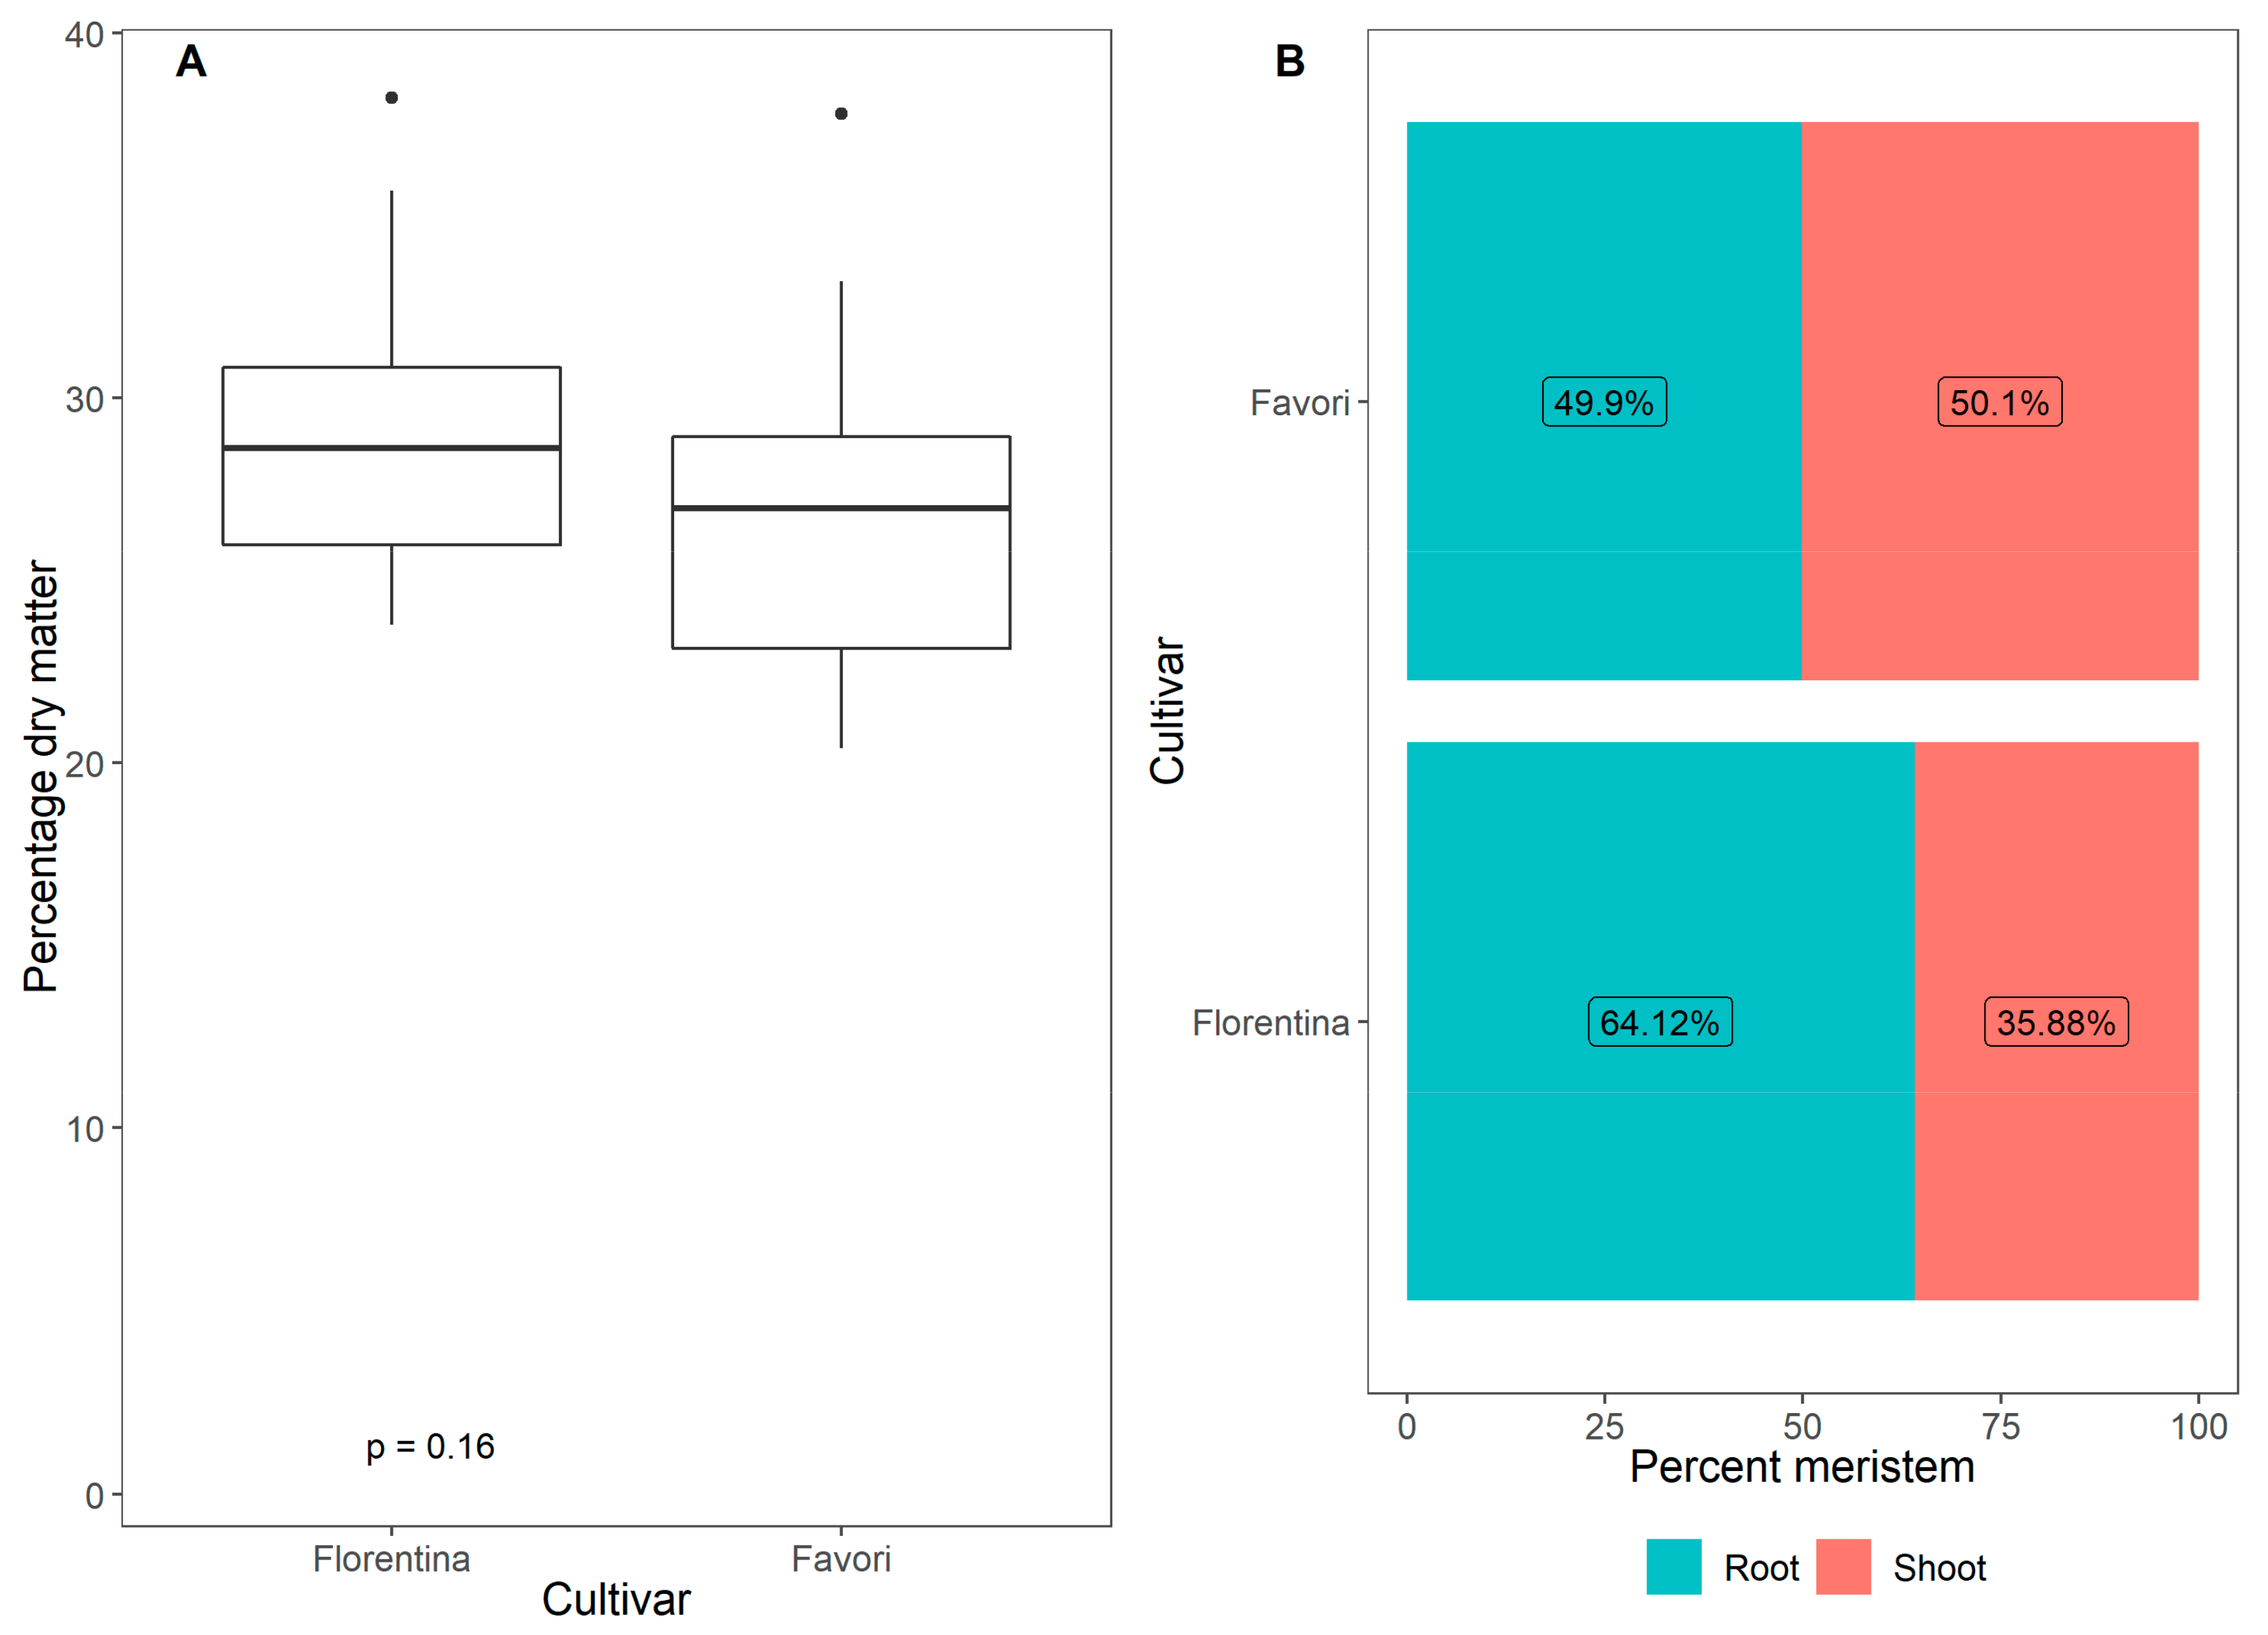
Horticulturae 07 00484 g010
Figure 11. Percentage of meristems that differentiated into flowers and fruits for plants of the strawberry cultivars ‘Florentina’ and ‘Favori’ after 14 weeks at 20 °C under LD conditions. The buds that were below S9 (fully differentiated flower) were compiled as buds.
Horticulturae 07 00484 g011
Table 1. Experimental set up with the two everbearing strawberry cultivars ‘Florentina’and ‘Favori’, conducted in a greenhouse at Alnarp, Sweden, under ambient short day (SD), long day (LD) and temperatures conditions as indicated.
SDLD
Temperature (day/night)20/17 °C, 25/24 °C and 30/27 °C20/20 °C
Day length7–10 h16–18 h
Duration 15 weeks14 weeks
SubstratePeat (WeibullHorto- Sweden)
FertilizationKristalon superba Red (NPK 12-5-30; EC = 1.3 mS/cm) and Calcinit (15% N, 14.4% NO3, 1.1% Al, 19% Ca; EC = 1.1 mS/cm)
Plants per pot4 plants per 11 L pot
Number of replicates12 pots per cultivar per temperature treatment
Table 2. Description of floral developmental stages (S3 to S9) for strawberry plants assessed under a stereo light microscope. Stages below S4 were regarded as vegetative, while stages from 4 to 9 were regarded as reproductive.
Meristem StagesPhenotypic Identification
S3
Horticulturae 07 00484 i001
All development below S4.
S4
Horticulturae 07 00484 i002
Cup-shaped, sepal initiation, flat carpel with stamens shorter than the carpel.
S5
Horticulturae 07 00484 i003
Stamen taller than a slightly dome-shaped carpel.
S6
Horticulturae 07 00484 i004
Colourless/white stamen taller than a fully defined dome-shaped carpel.
S7
Horticulturae 07 00484 i005
Pistil starting to differentiate into individual stigma, yellow stamen and small petals starting to form.
S8
Horticulturae 07 00484 i006
Fully formed flower with differentiated pistil, yellow stamen and white petals.
S9
Horticulturae 07 00484 i007
Open flower
Publisher’s Note: MDPI stays neutral with regard to jurisdictional claims in published maps and institutional affiliations.

