
Effect of Simulated Vibration and Storage on Quality of Tomato


Abstract
:Practical Application
1. Introduction
2. Materials and Method
2.1. Plant Sample and Vibration/Storage Treatments
2.2. Physical and Physiological Quality Analysis
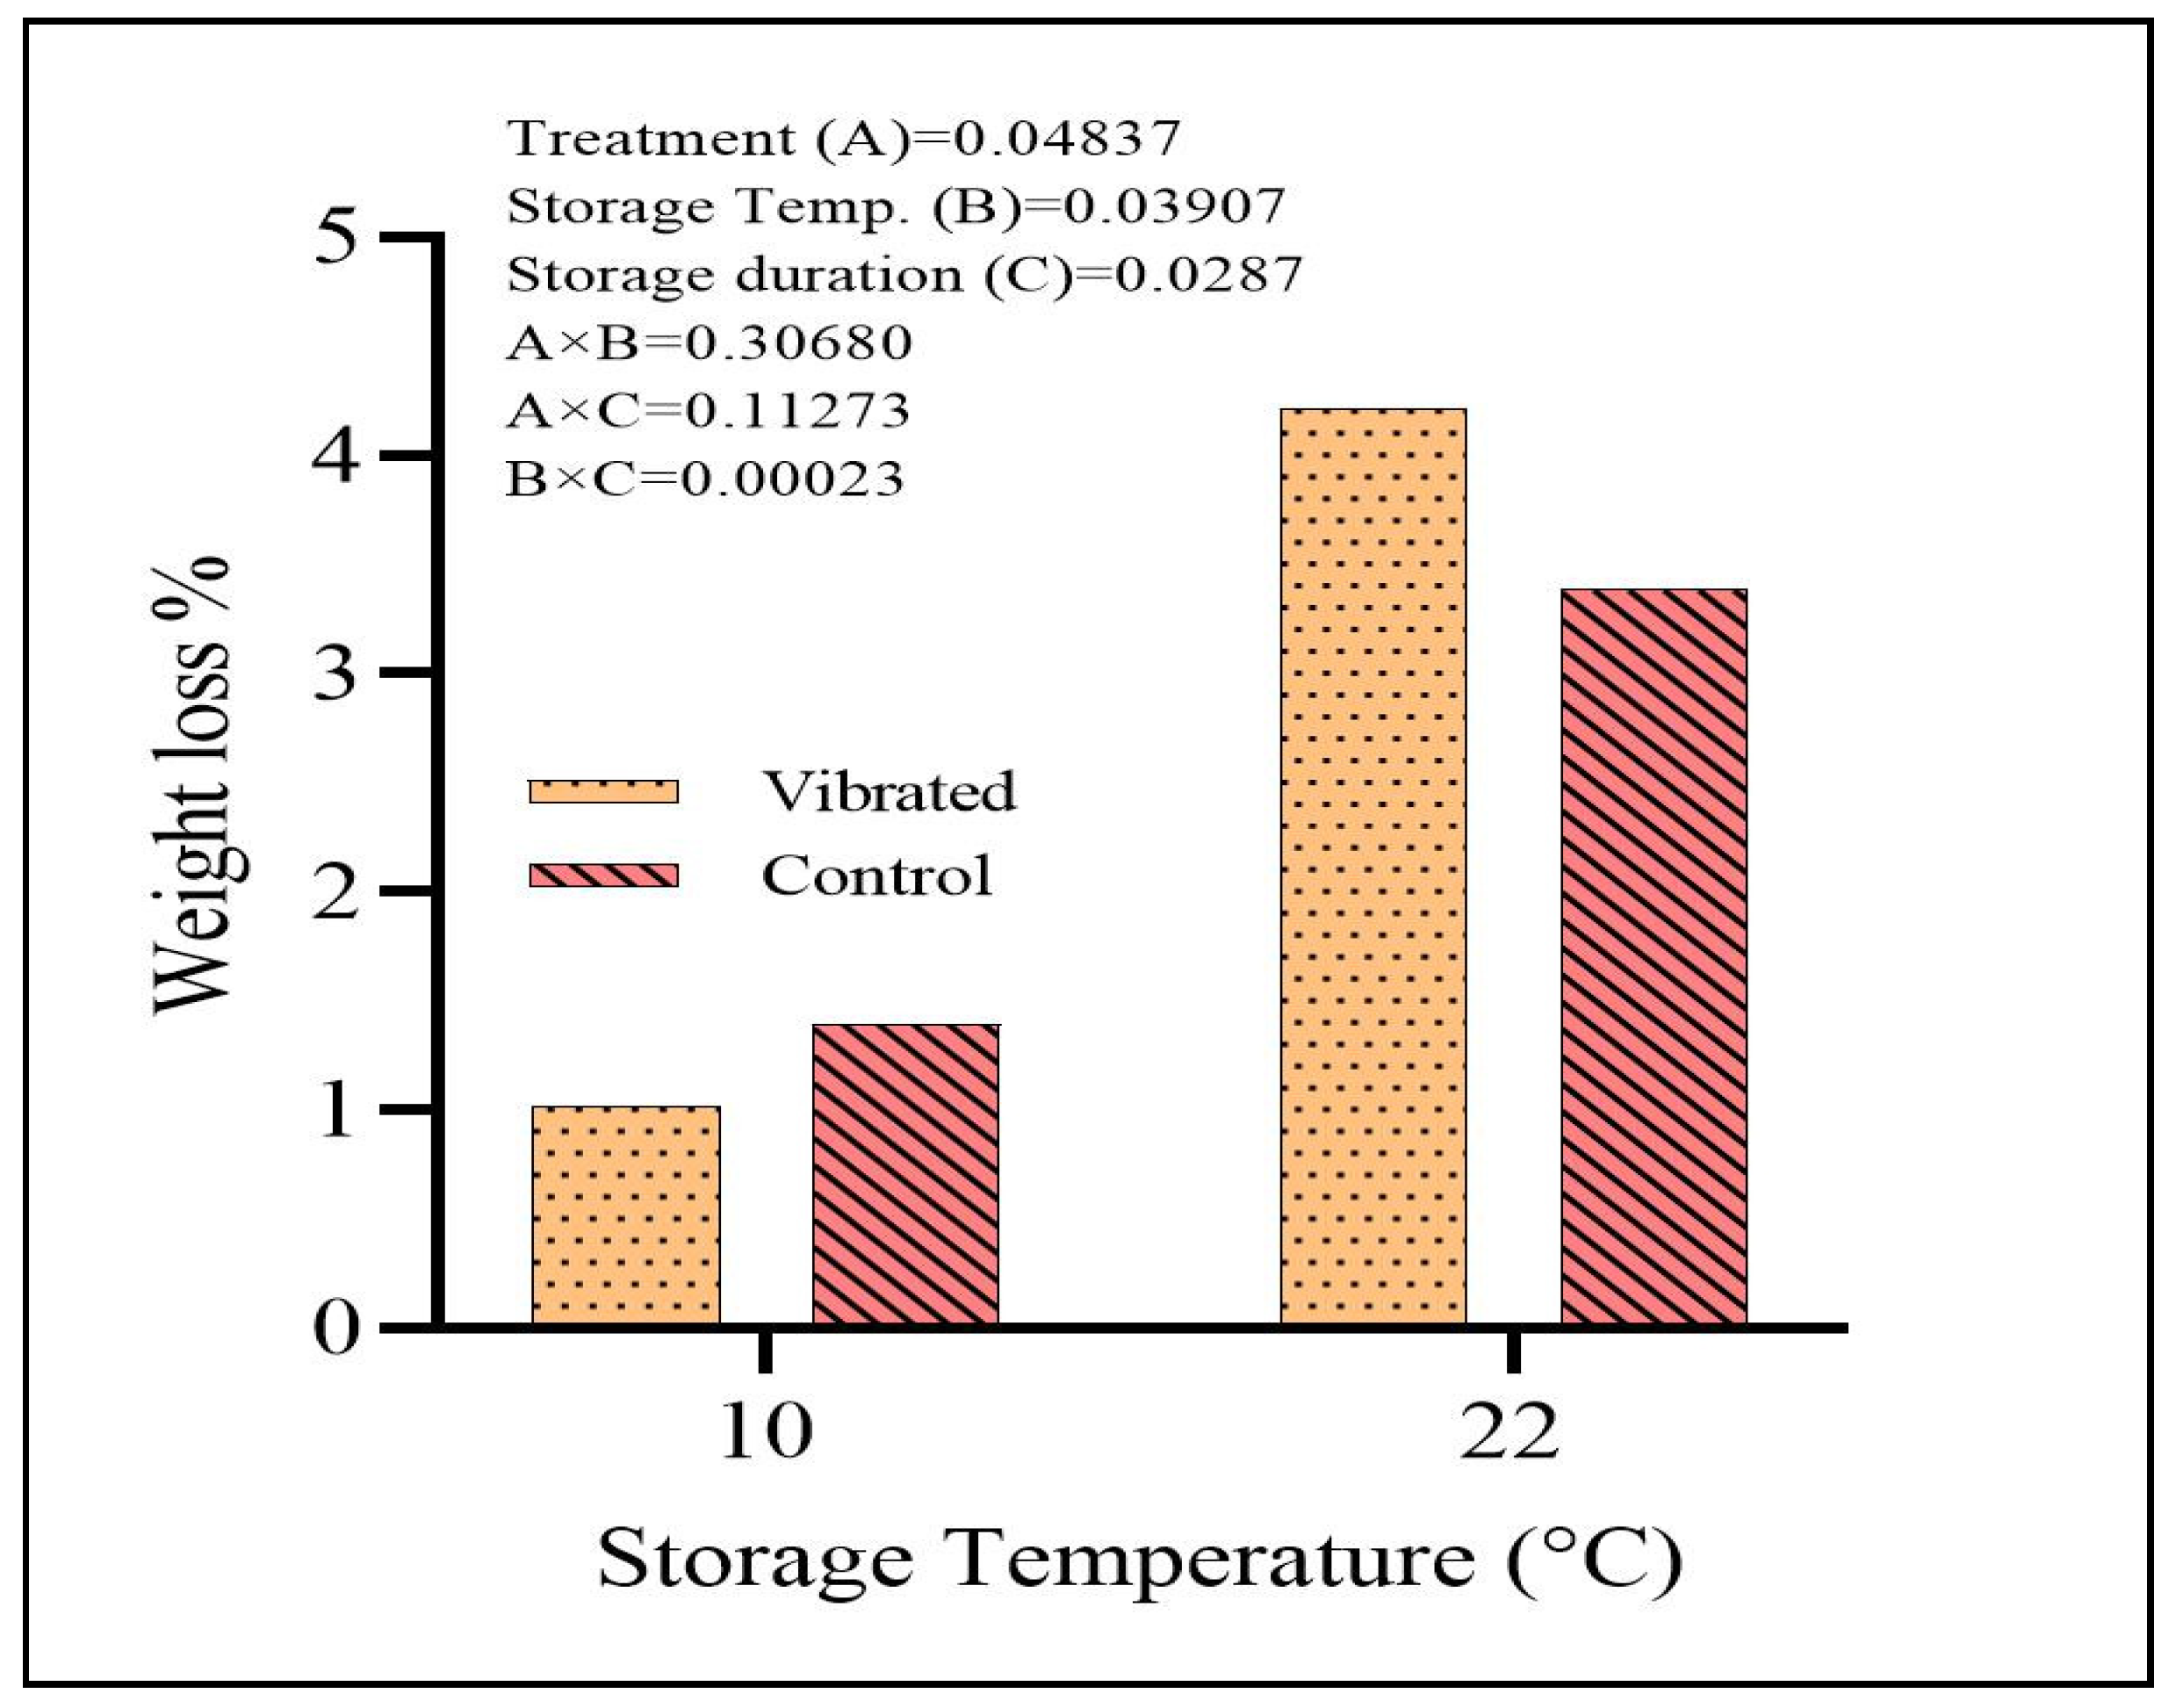
2.2.1. Weight Loss%
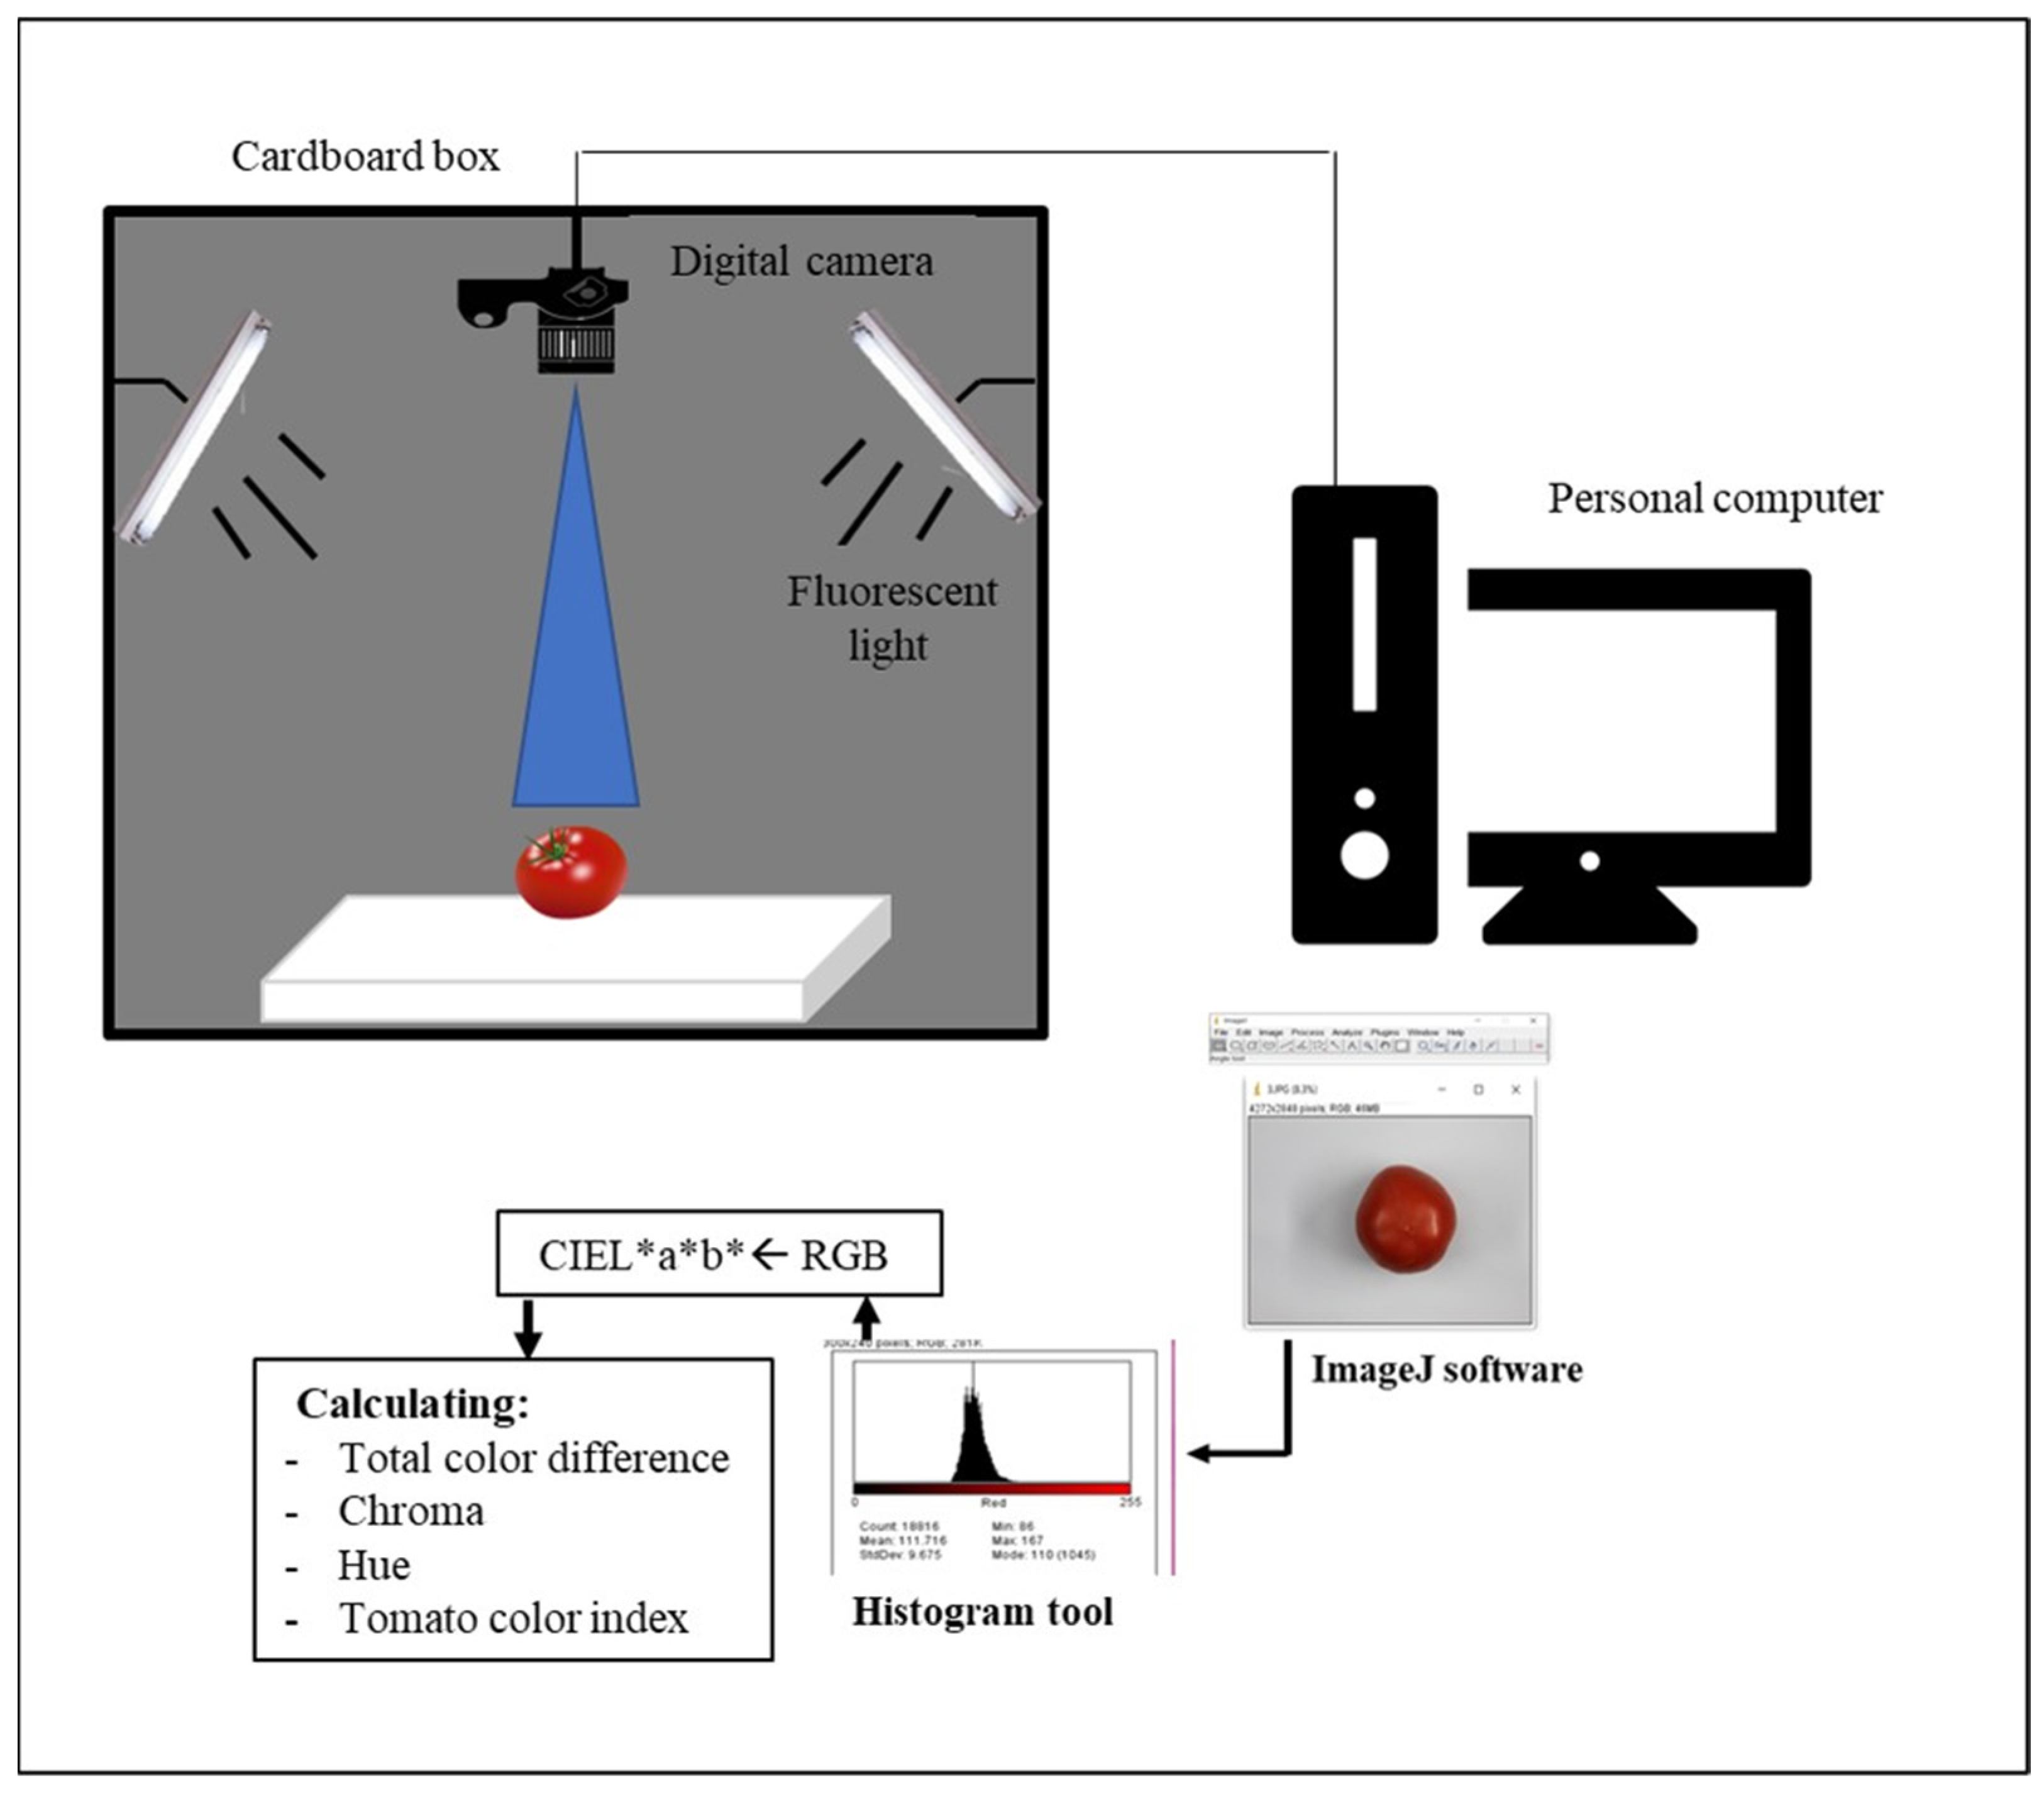
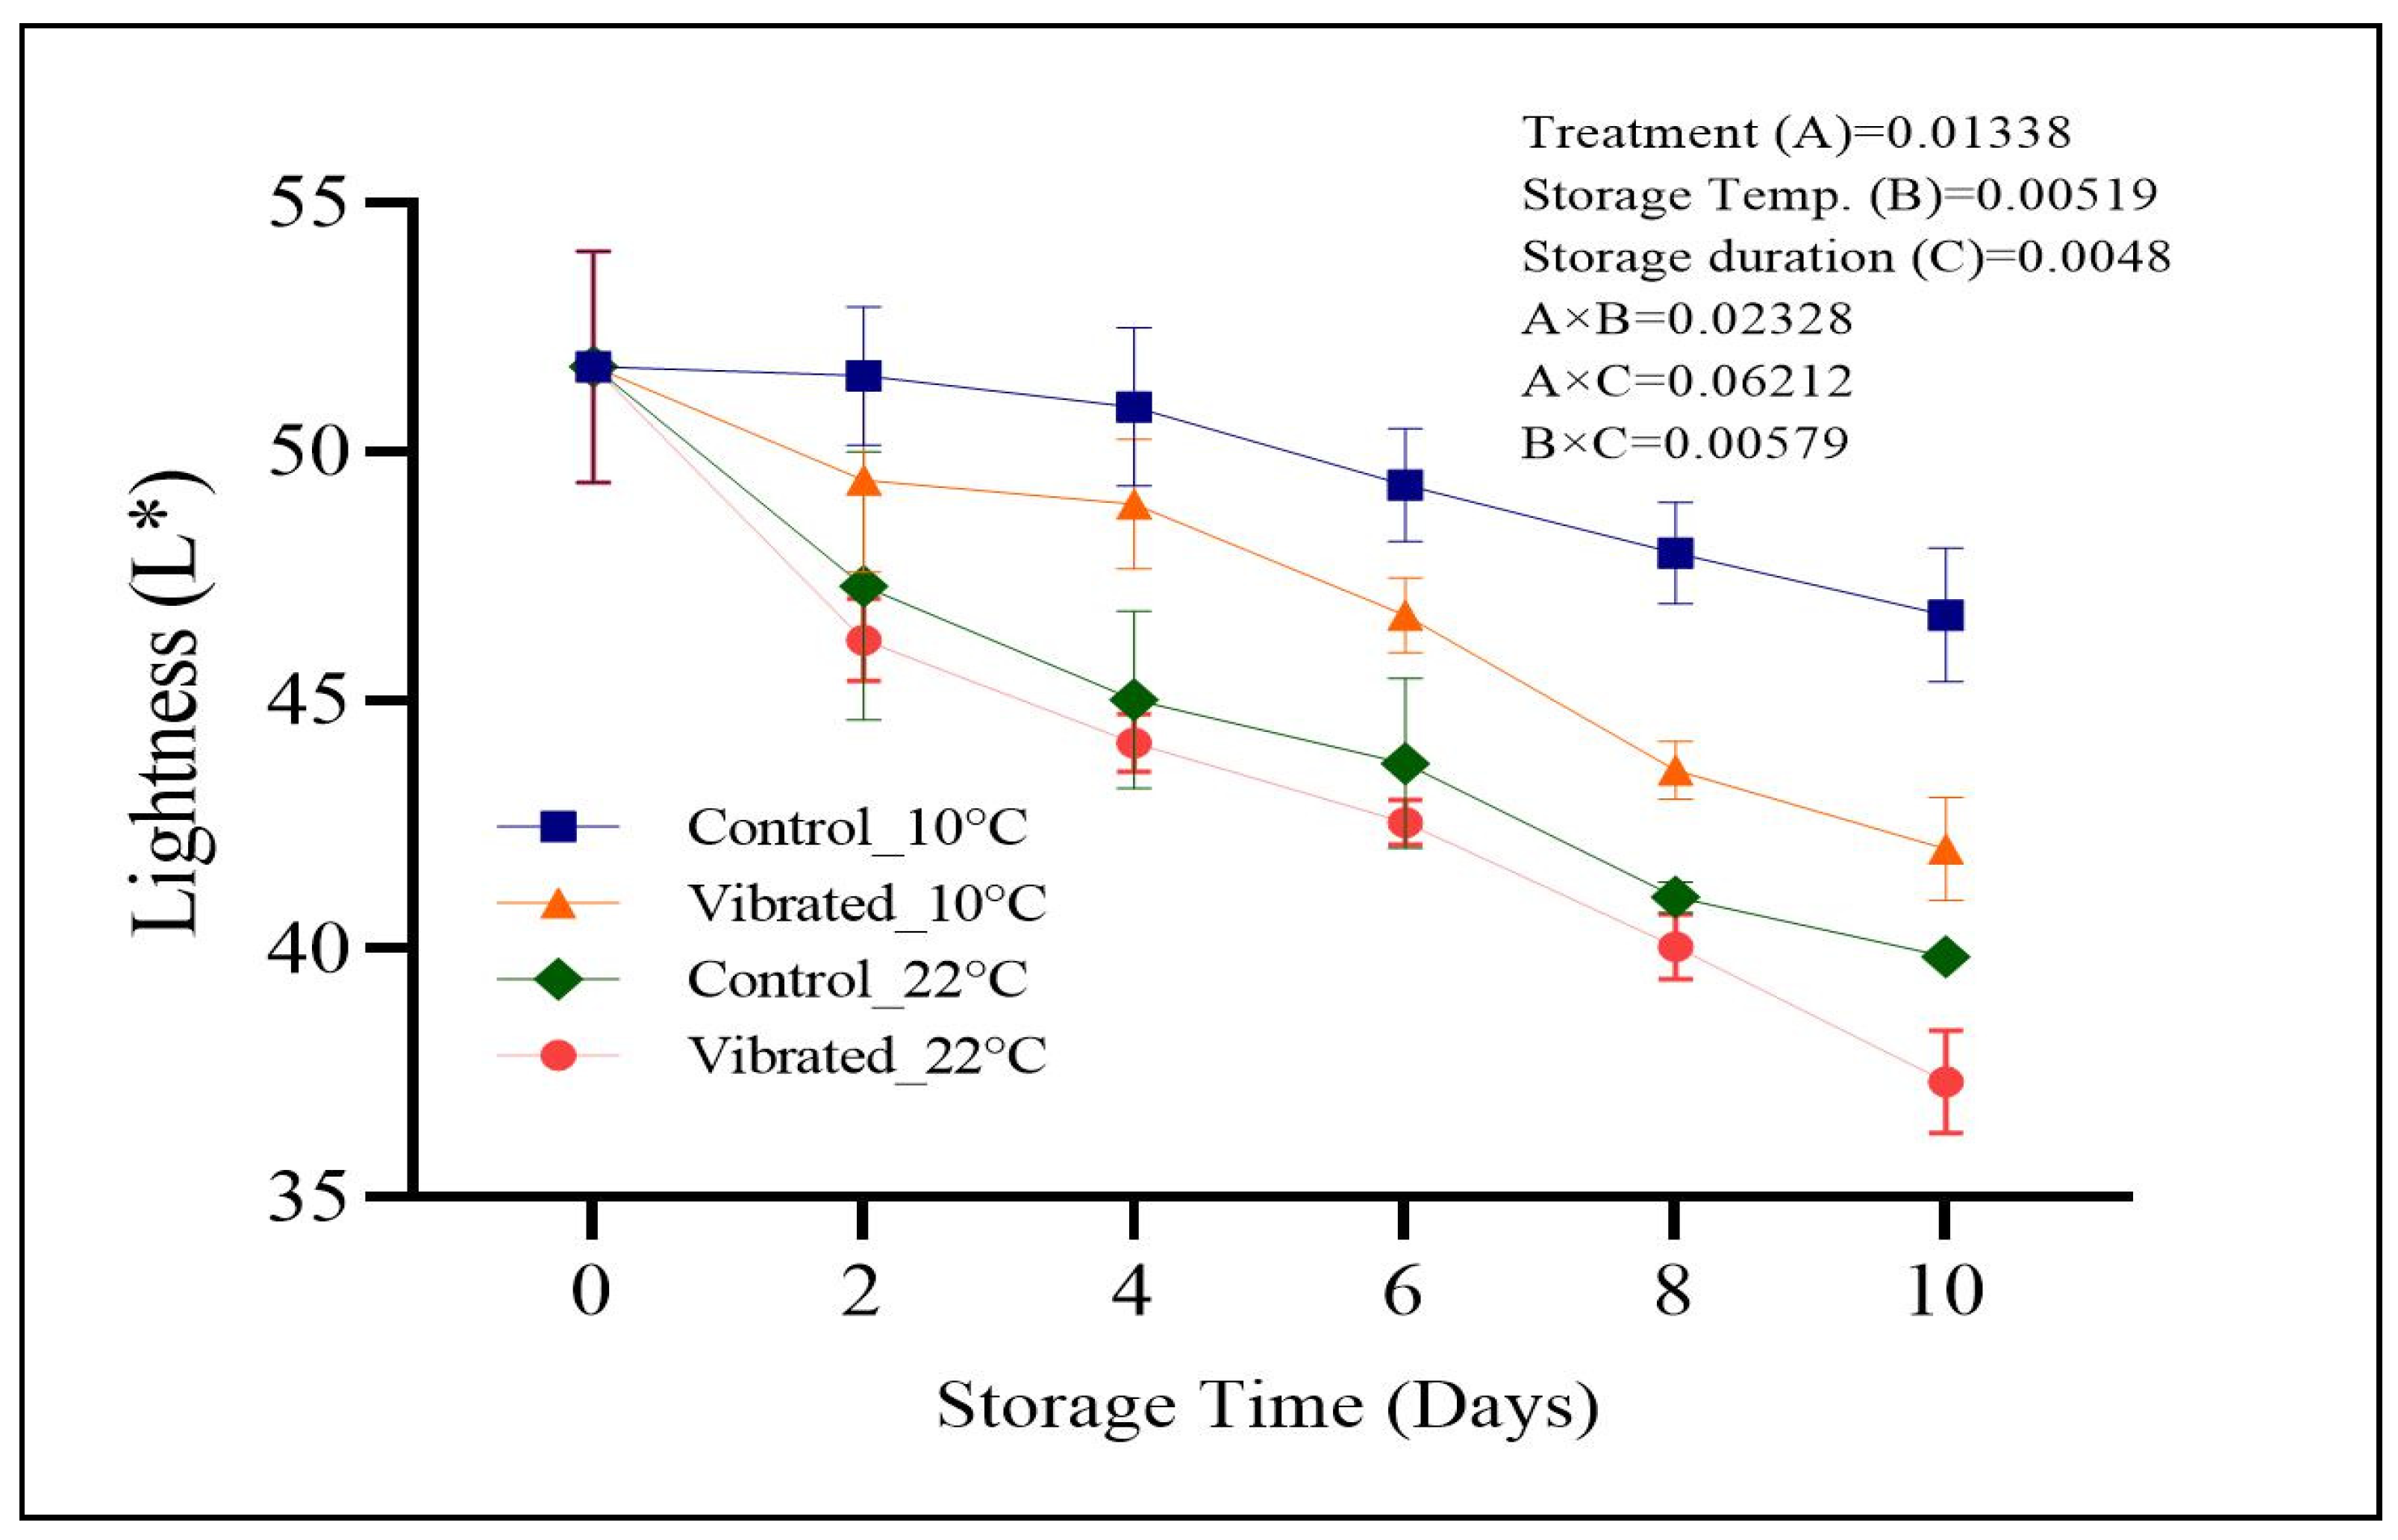
2.2.2. Color Measurements
2.2.3. Firmness
2.2.4. Total Soluble Solids (°Brix)
2.2.5. Headspace Gases (CO2, O2, and C2H4)
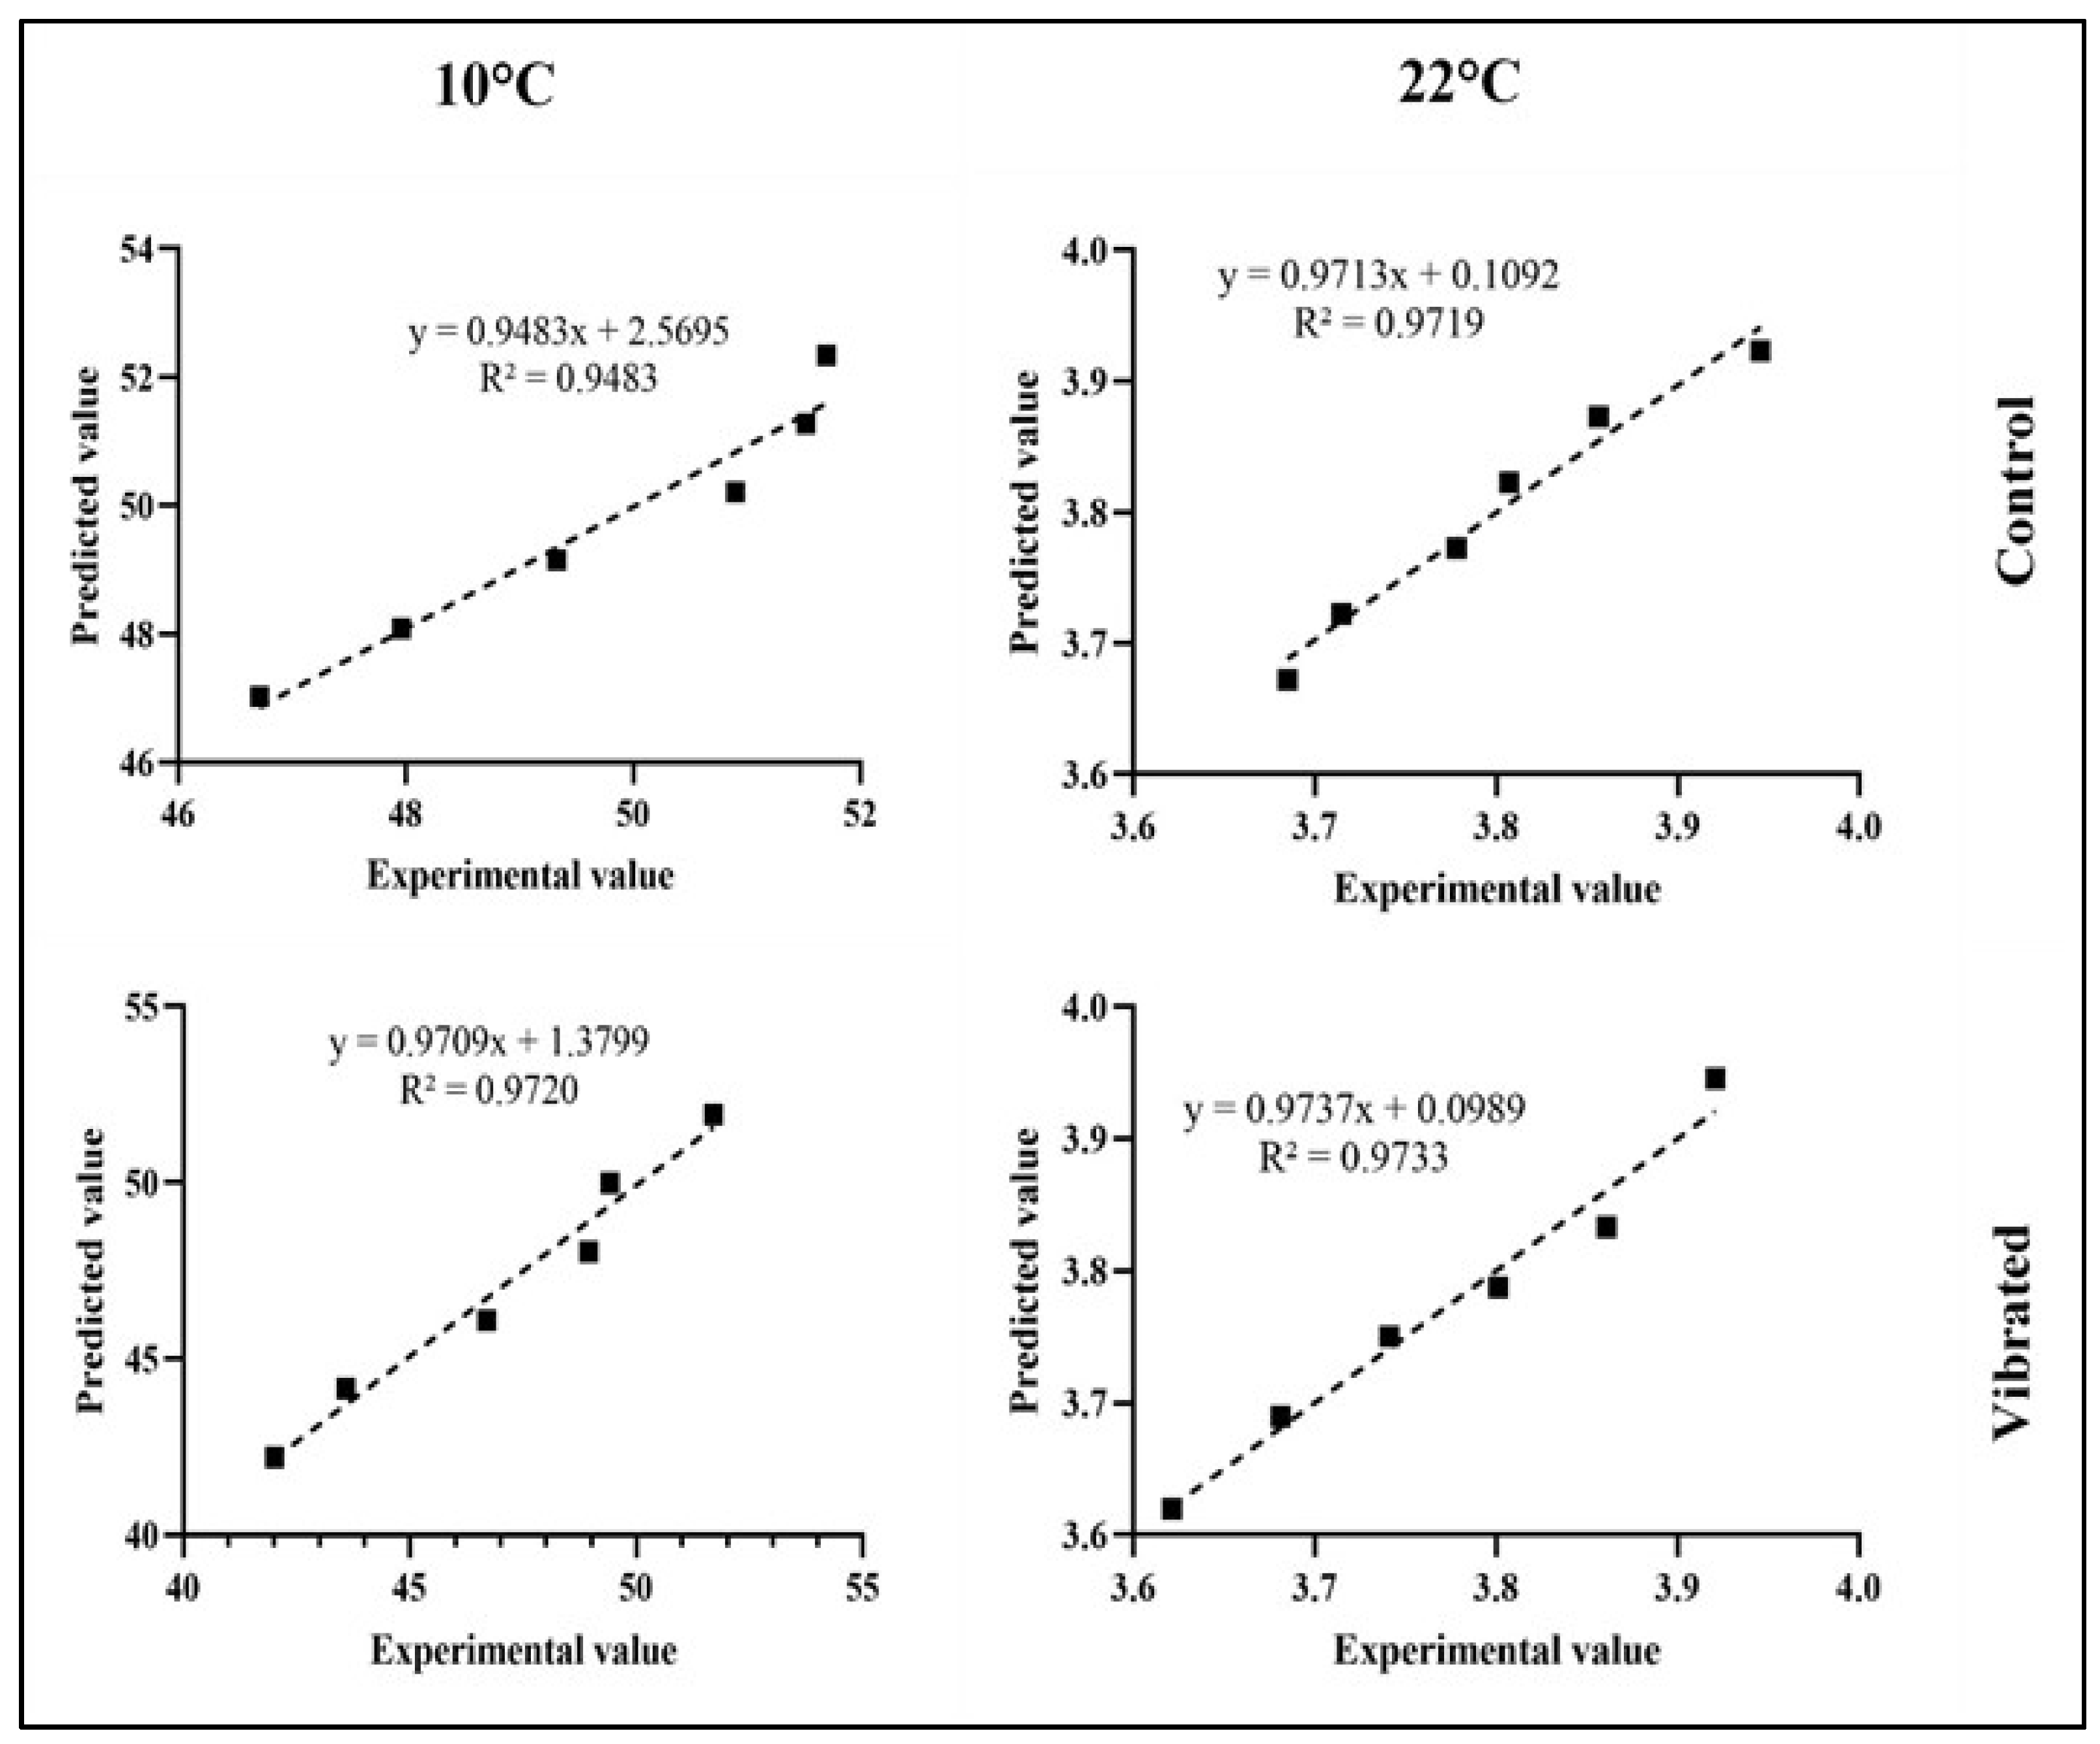
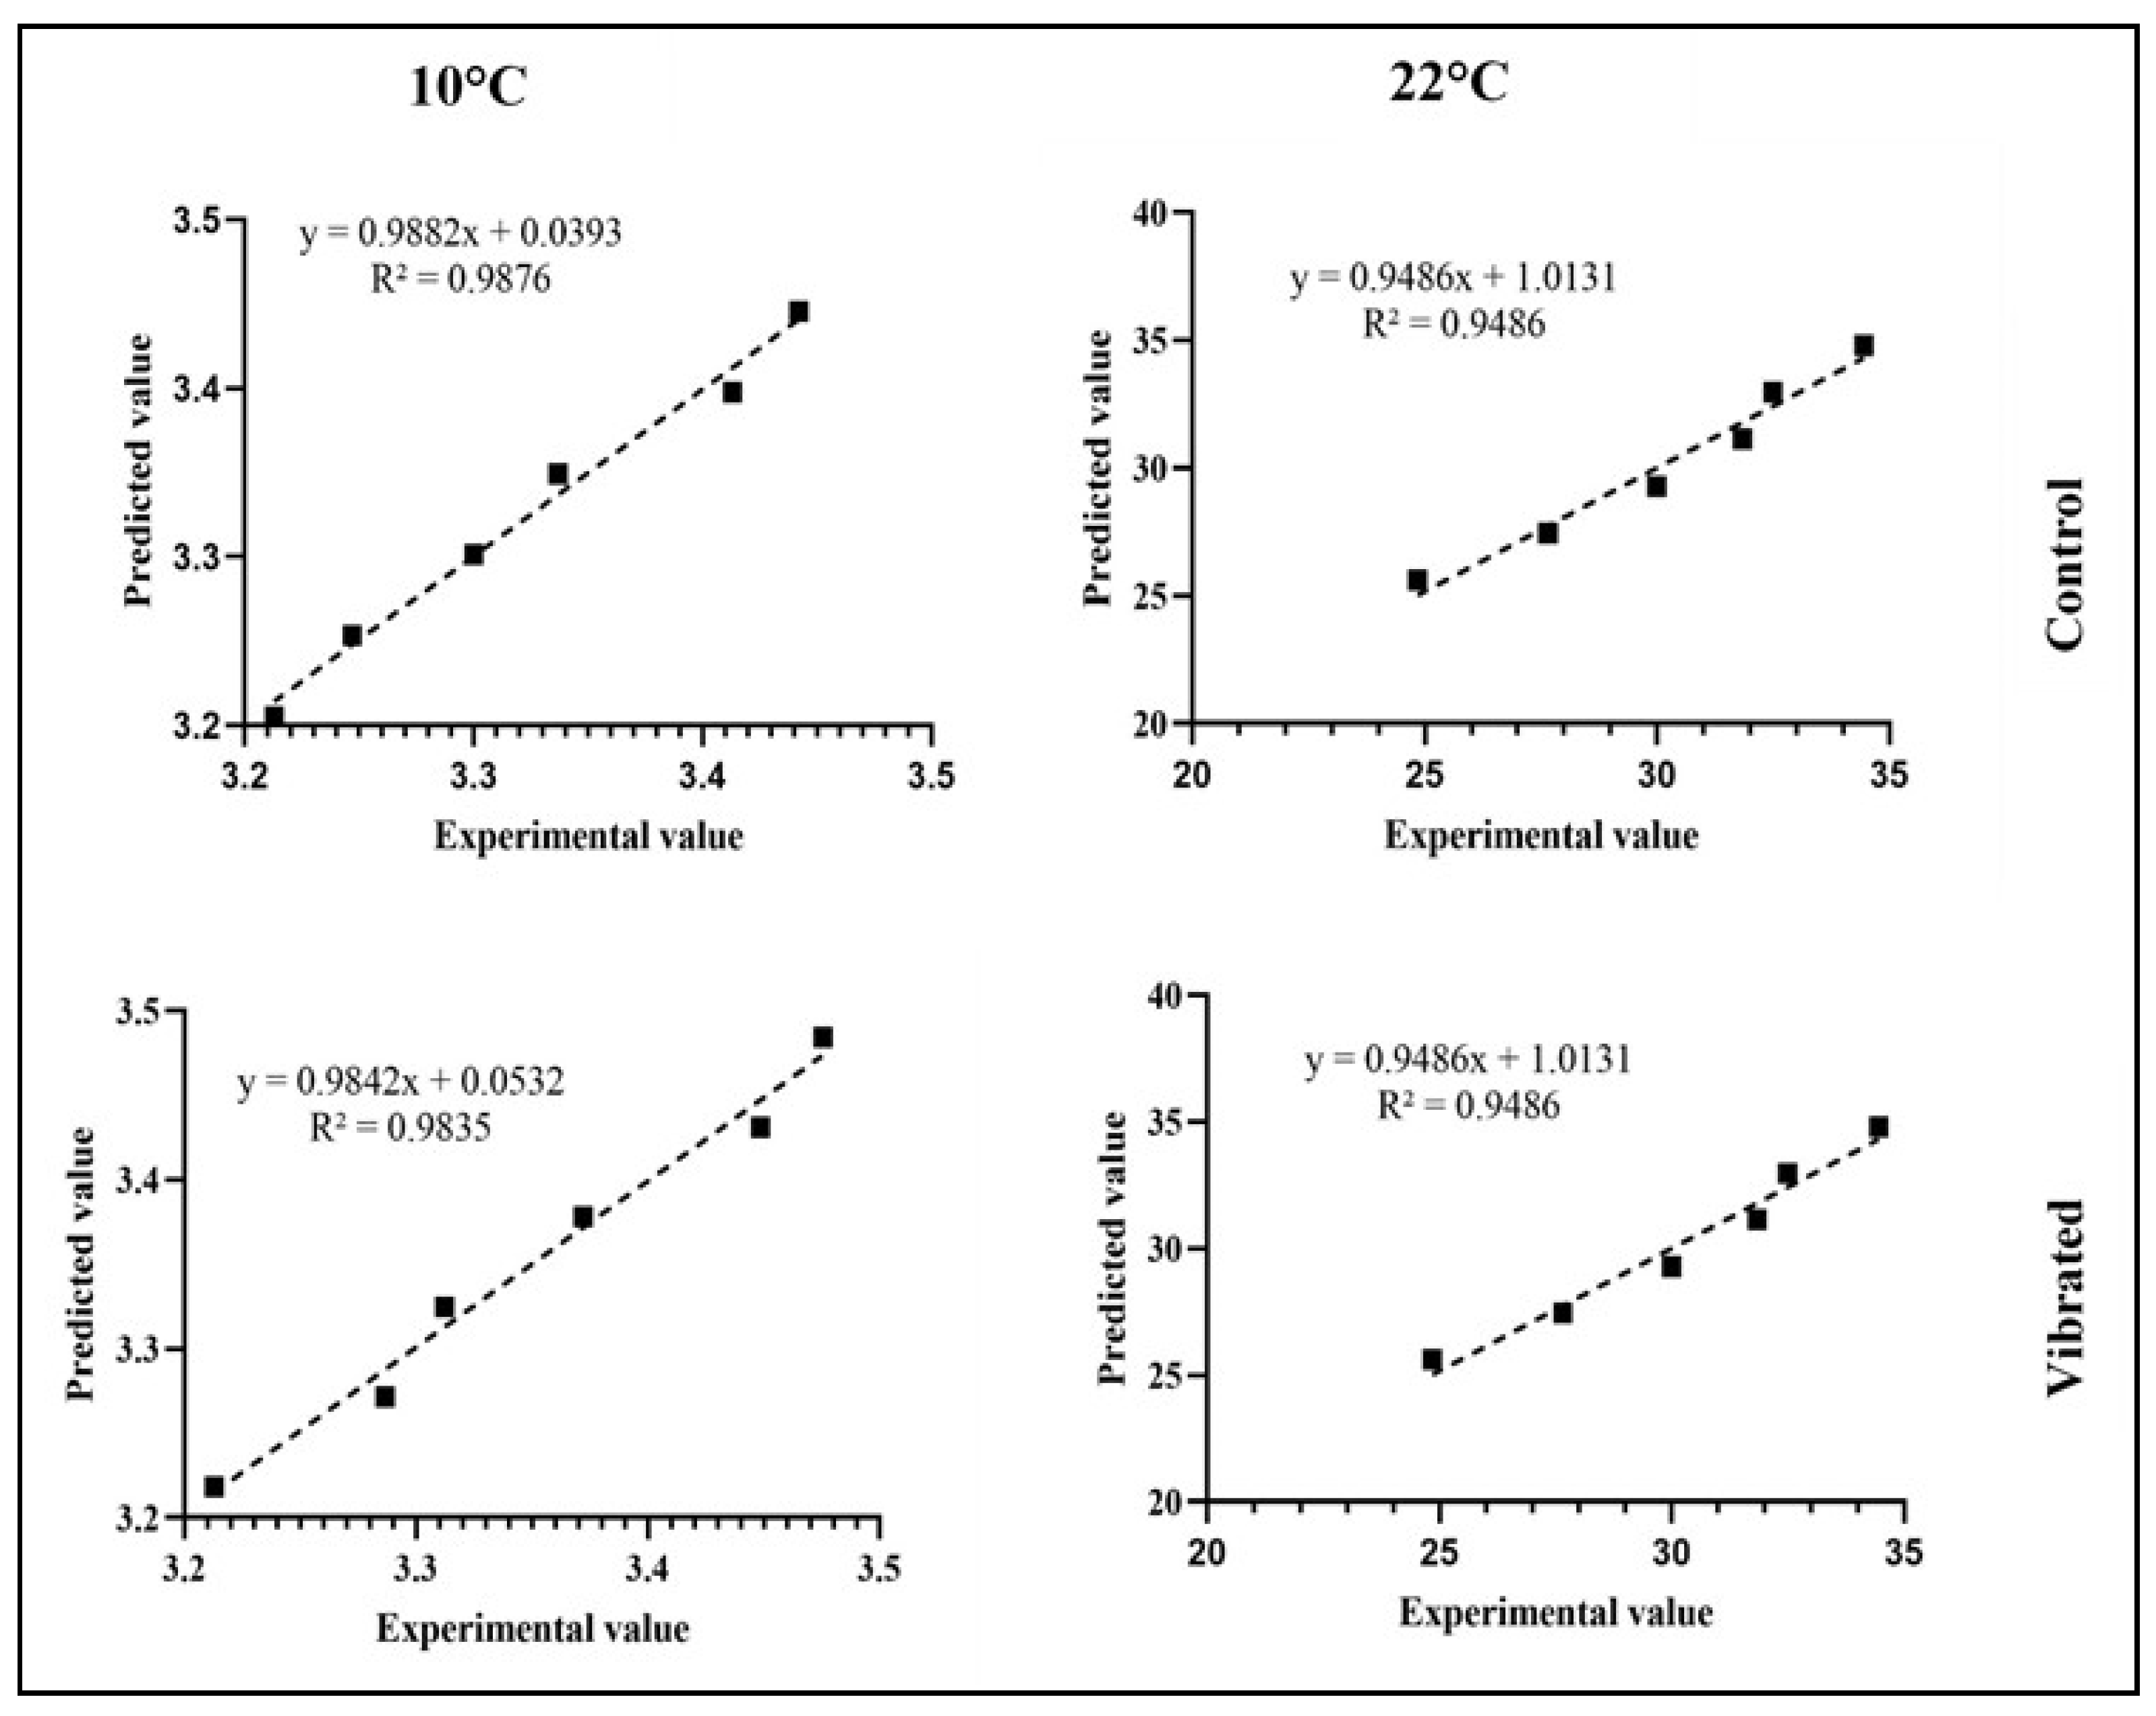
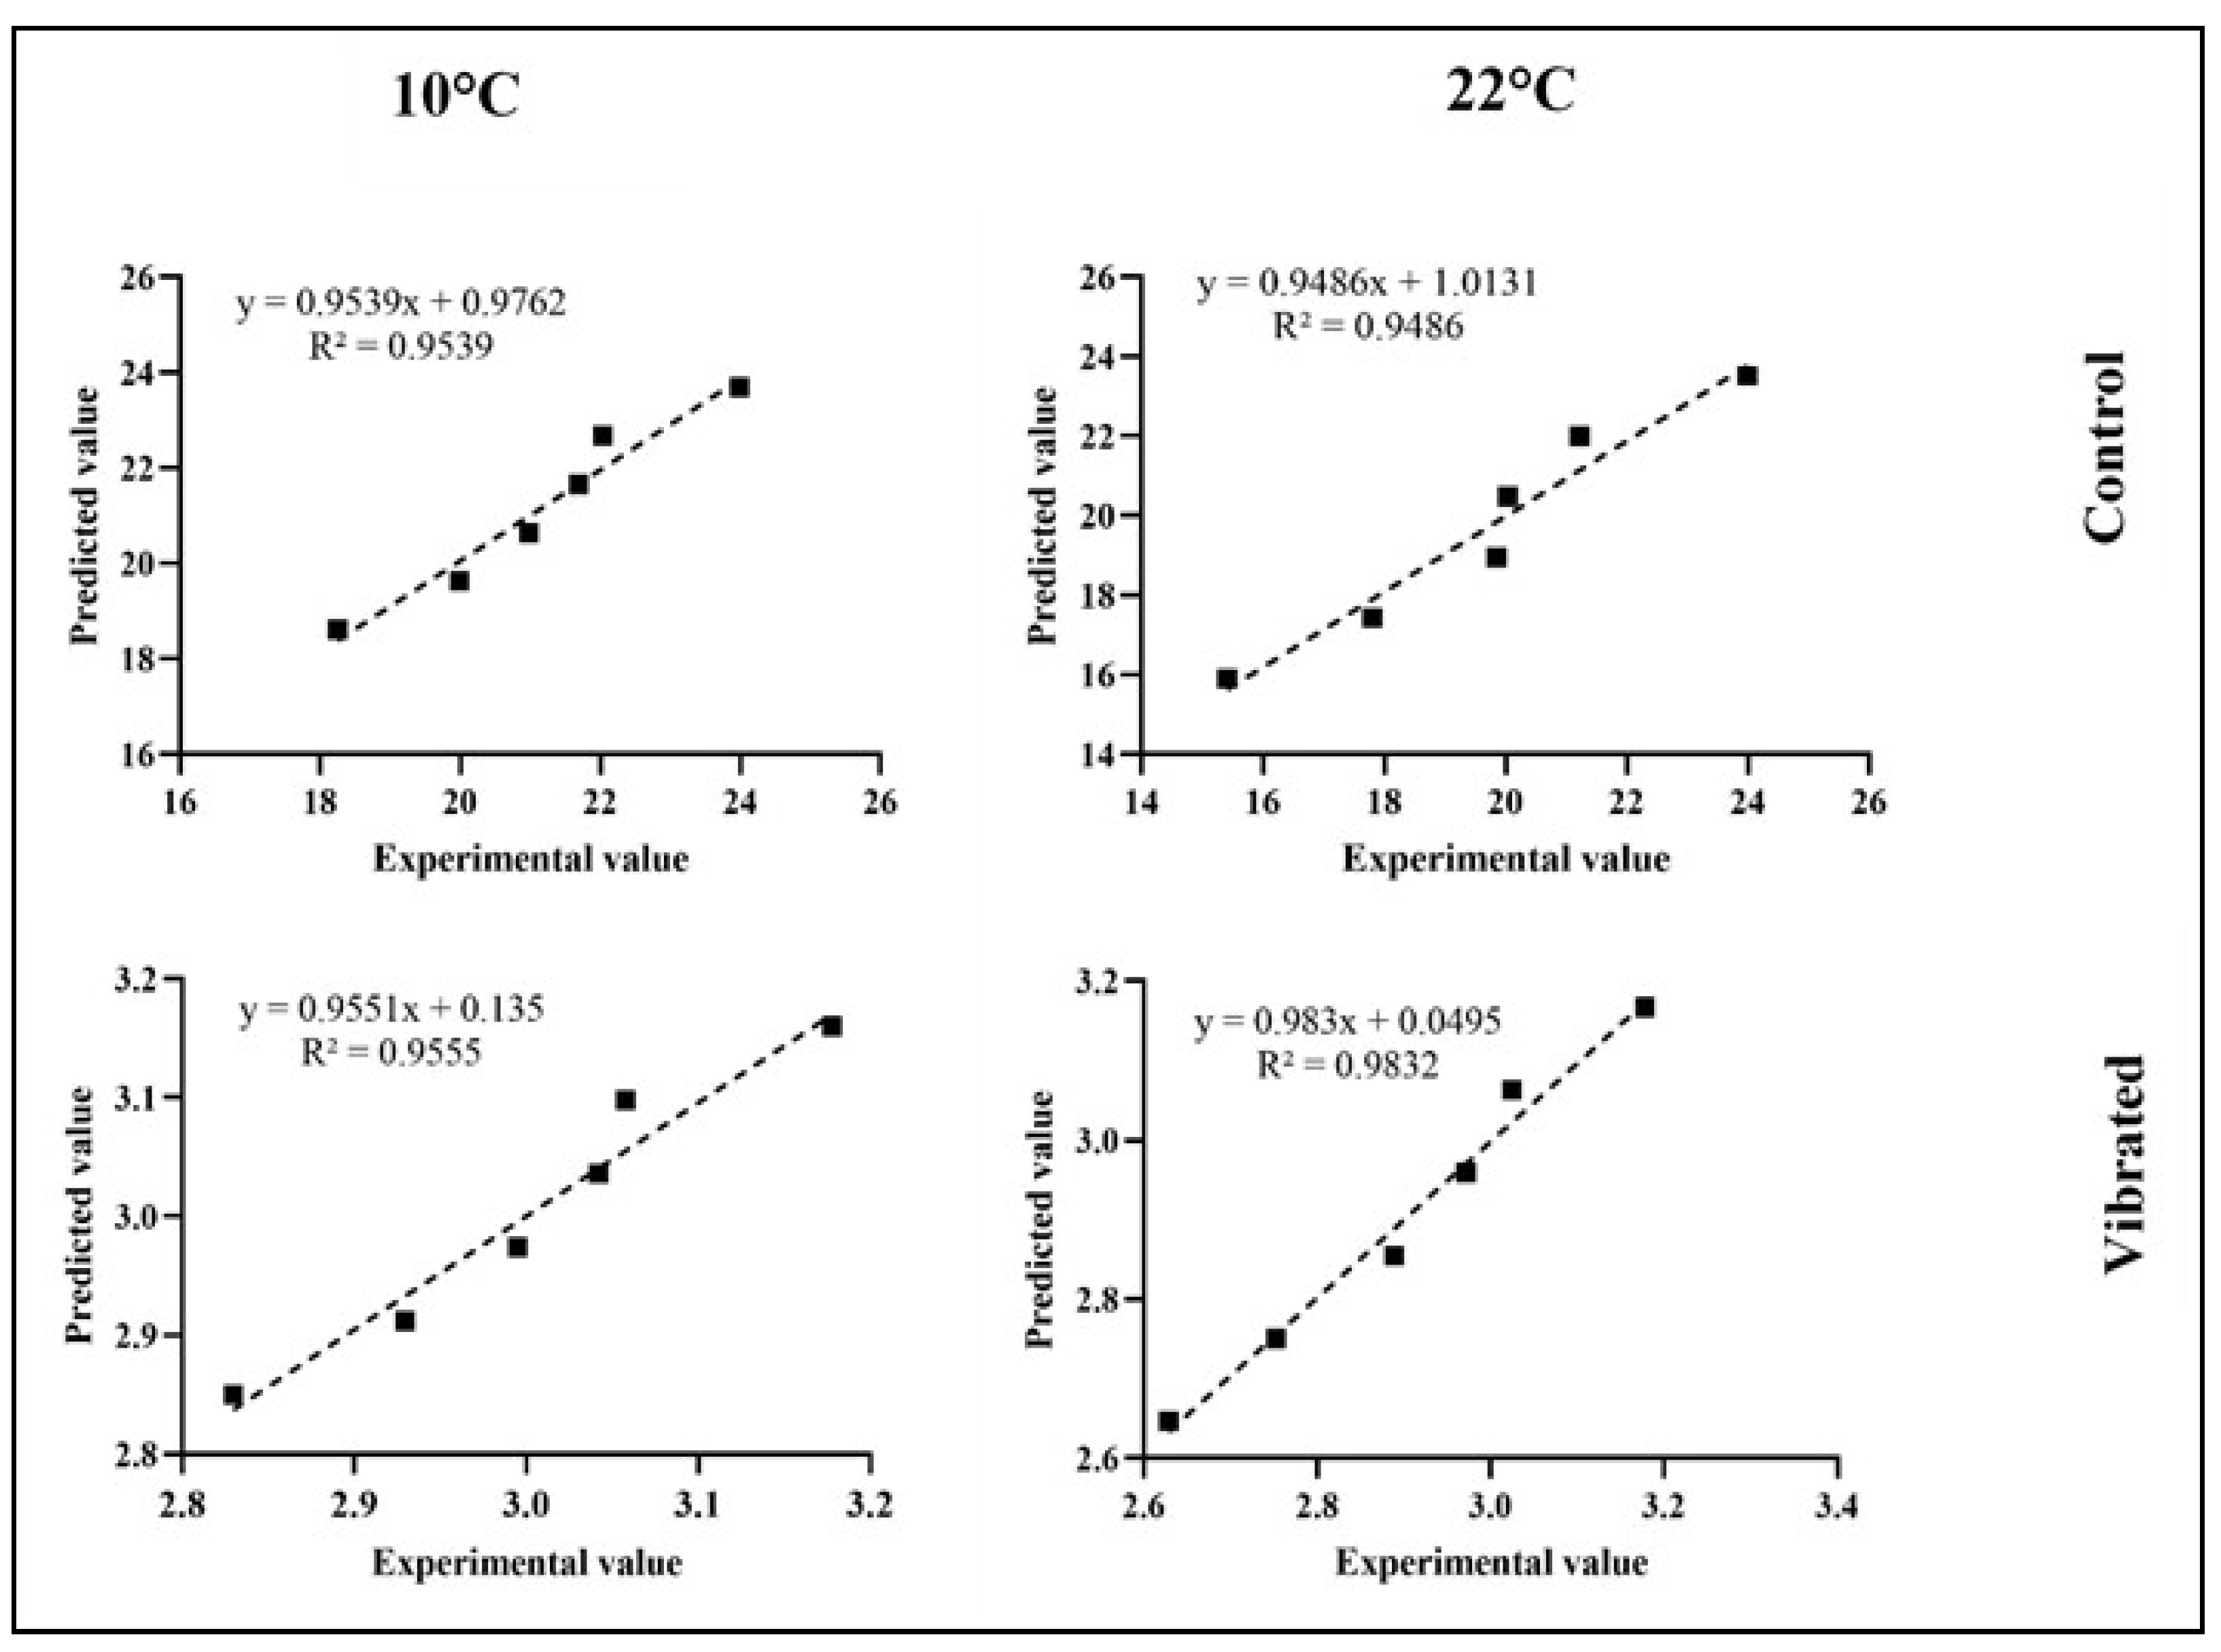
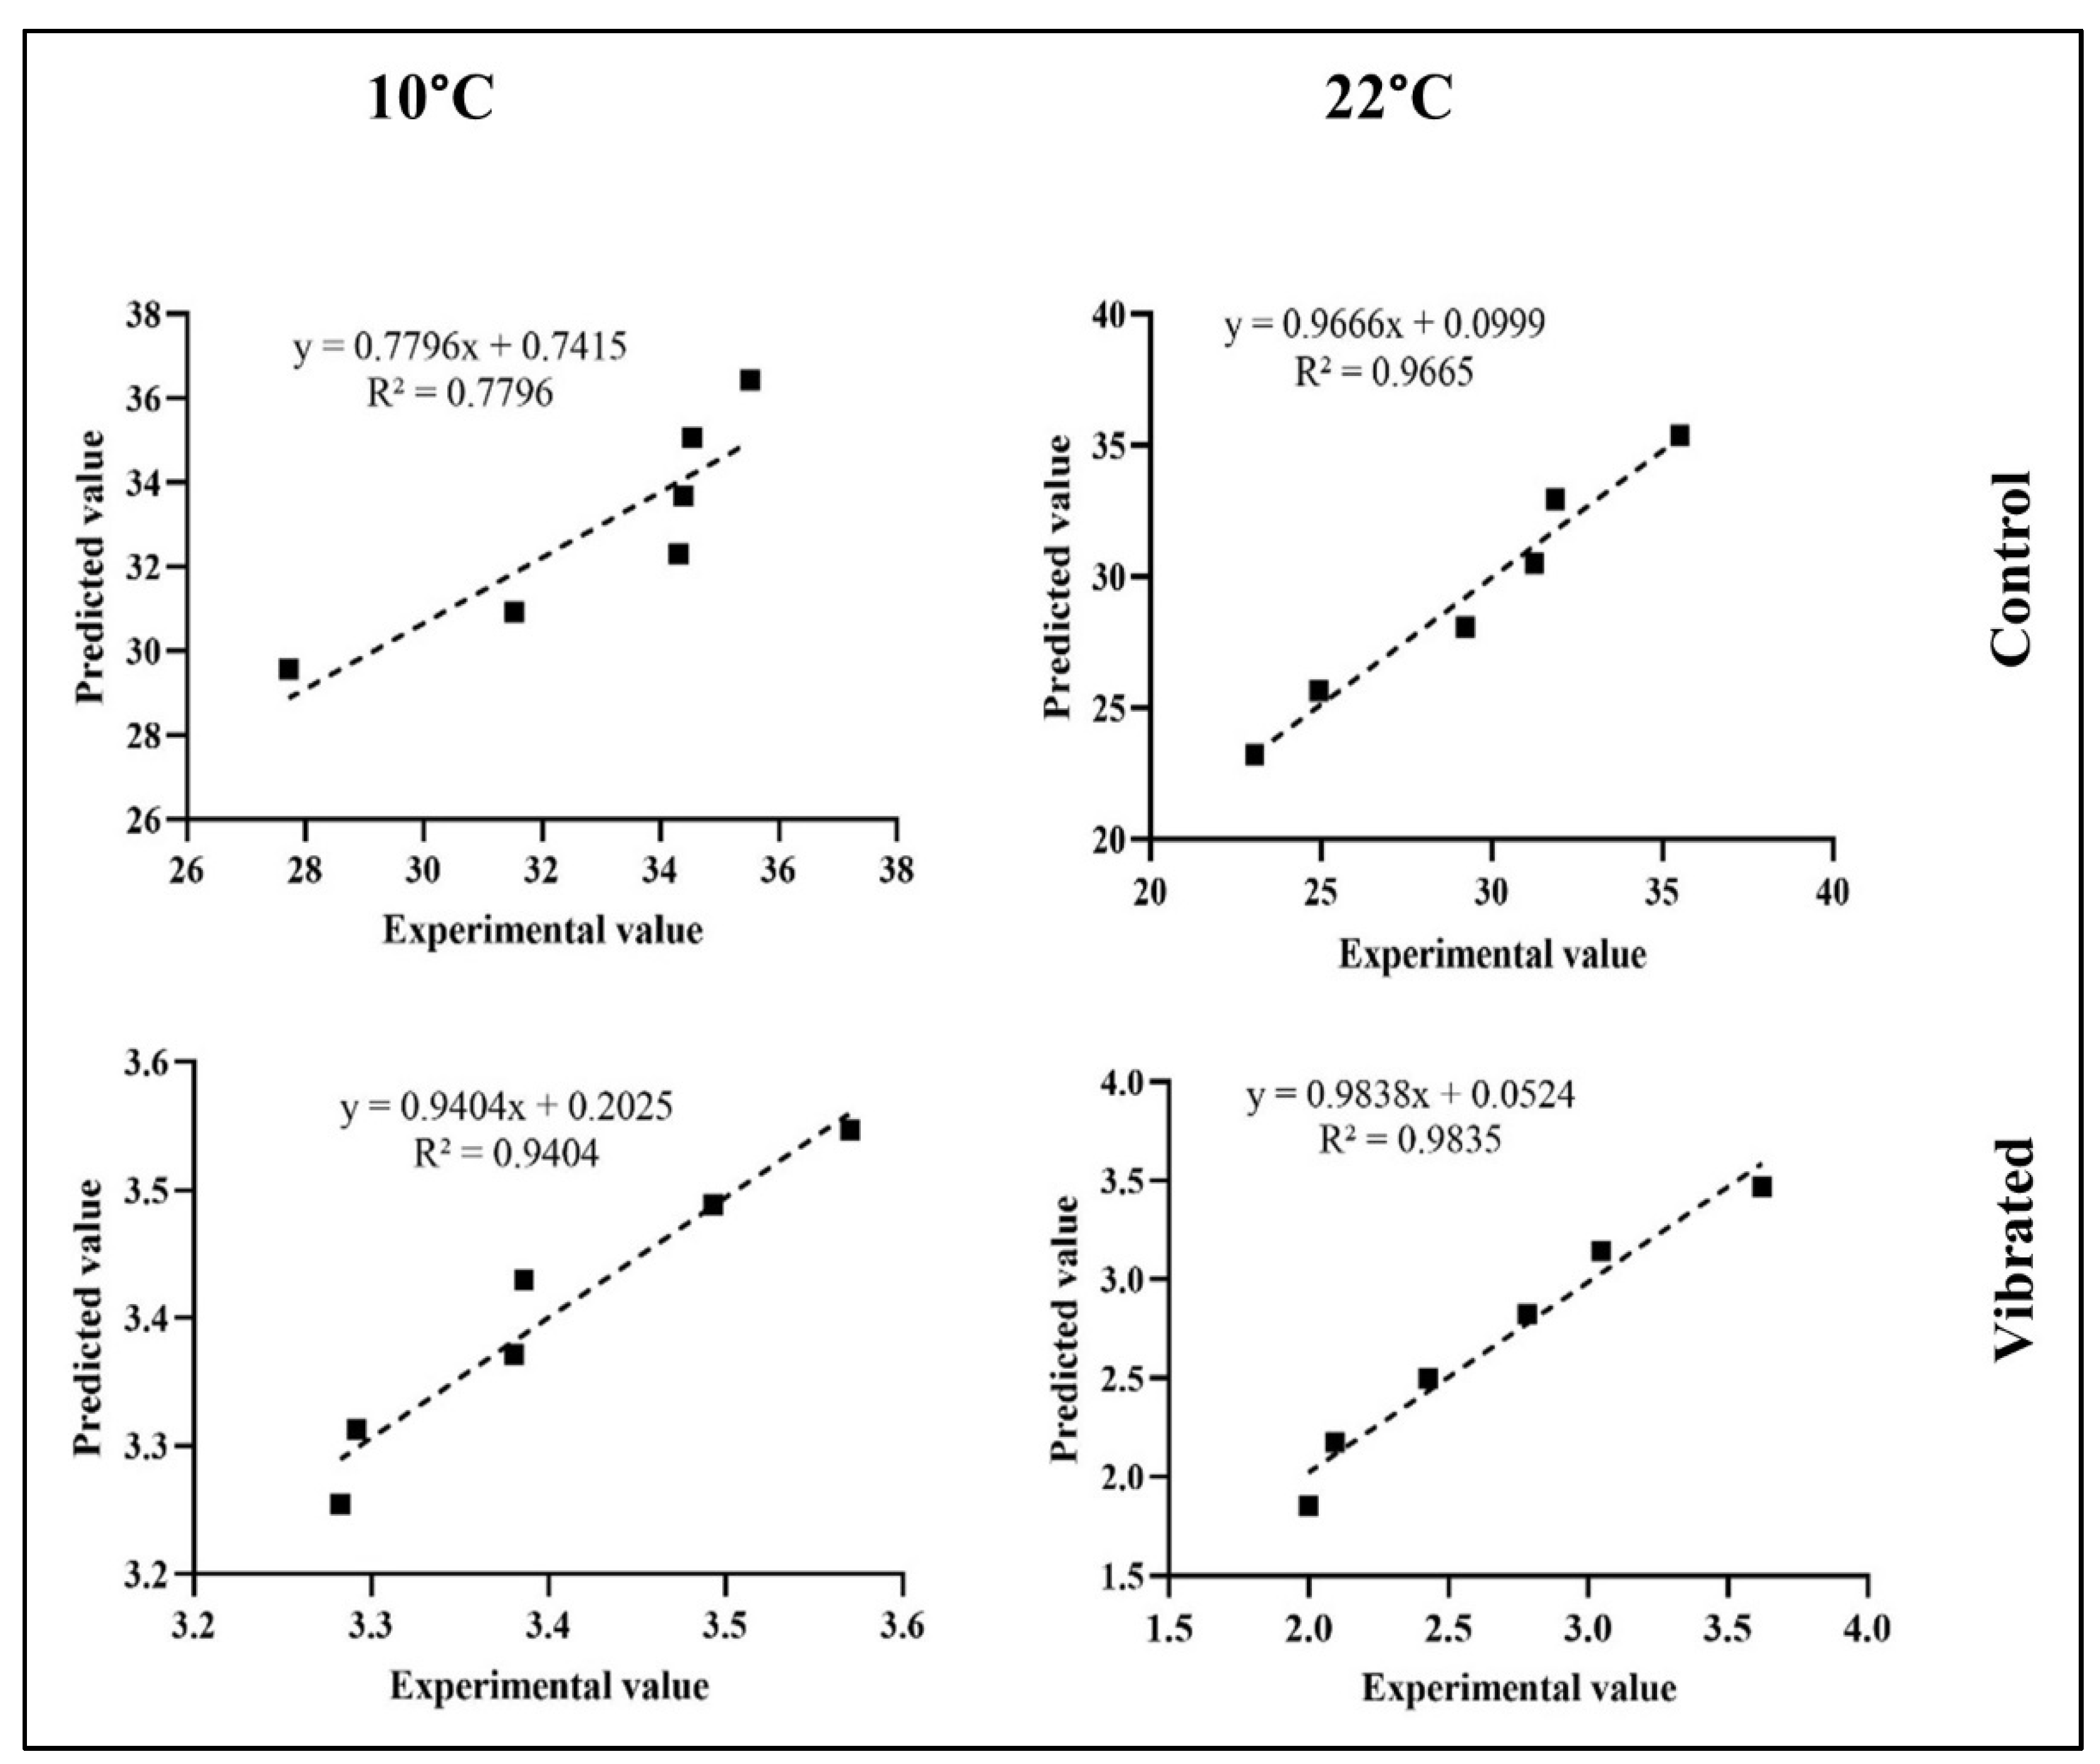
2.3. Kinetic Model
2.4. Statistical Analysis
3. Results and Discussions
3.1. Simulated Vibration Analysis
3.2. Physiological Weight Loss (%)
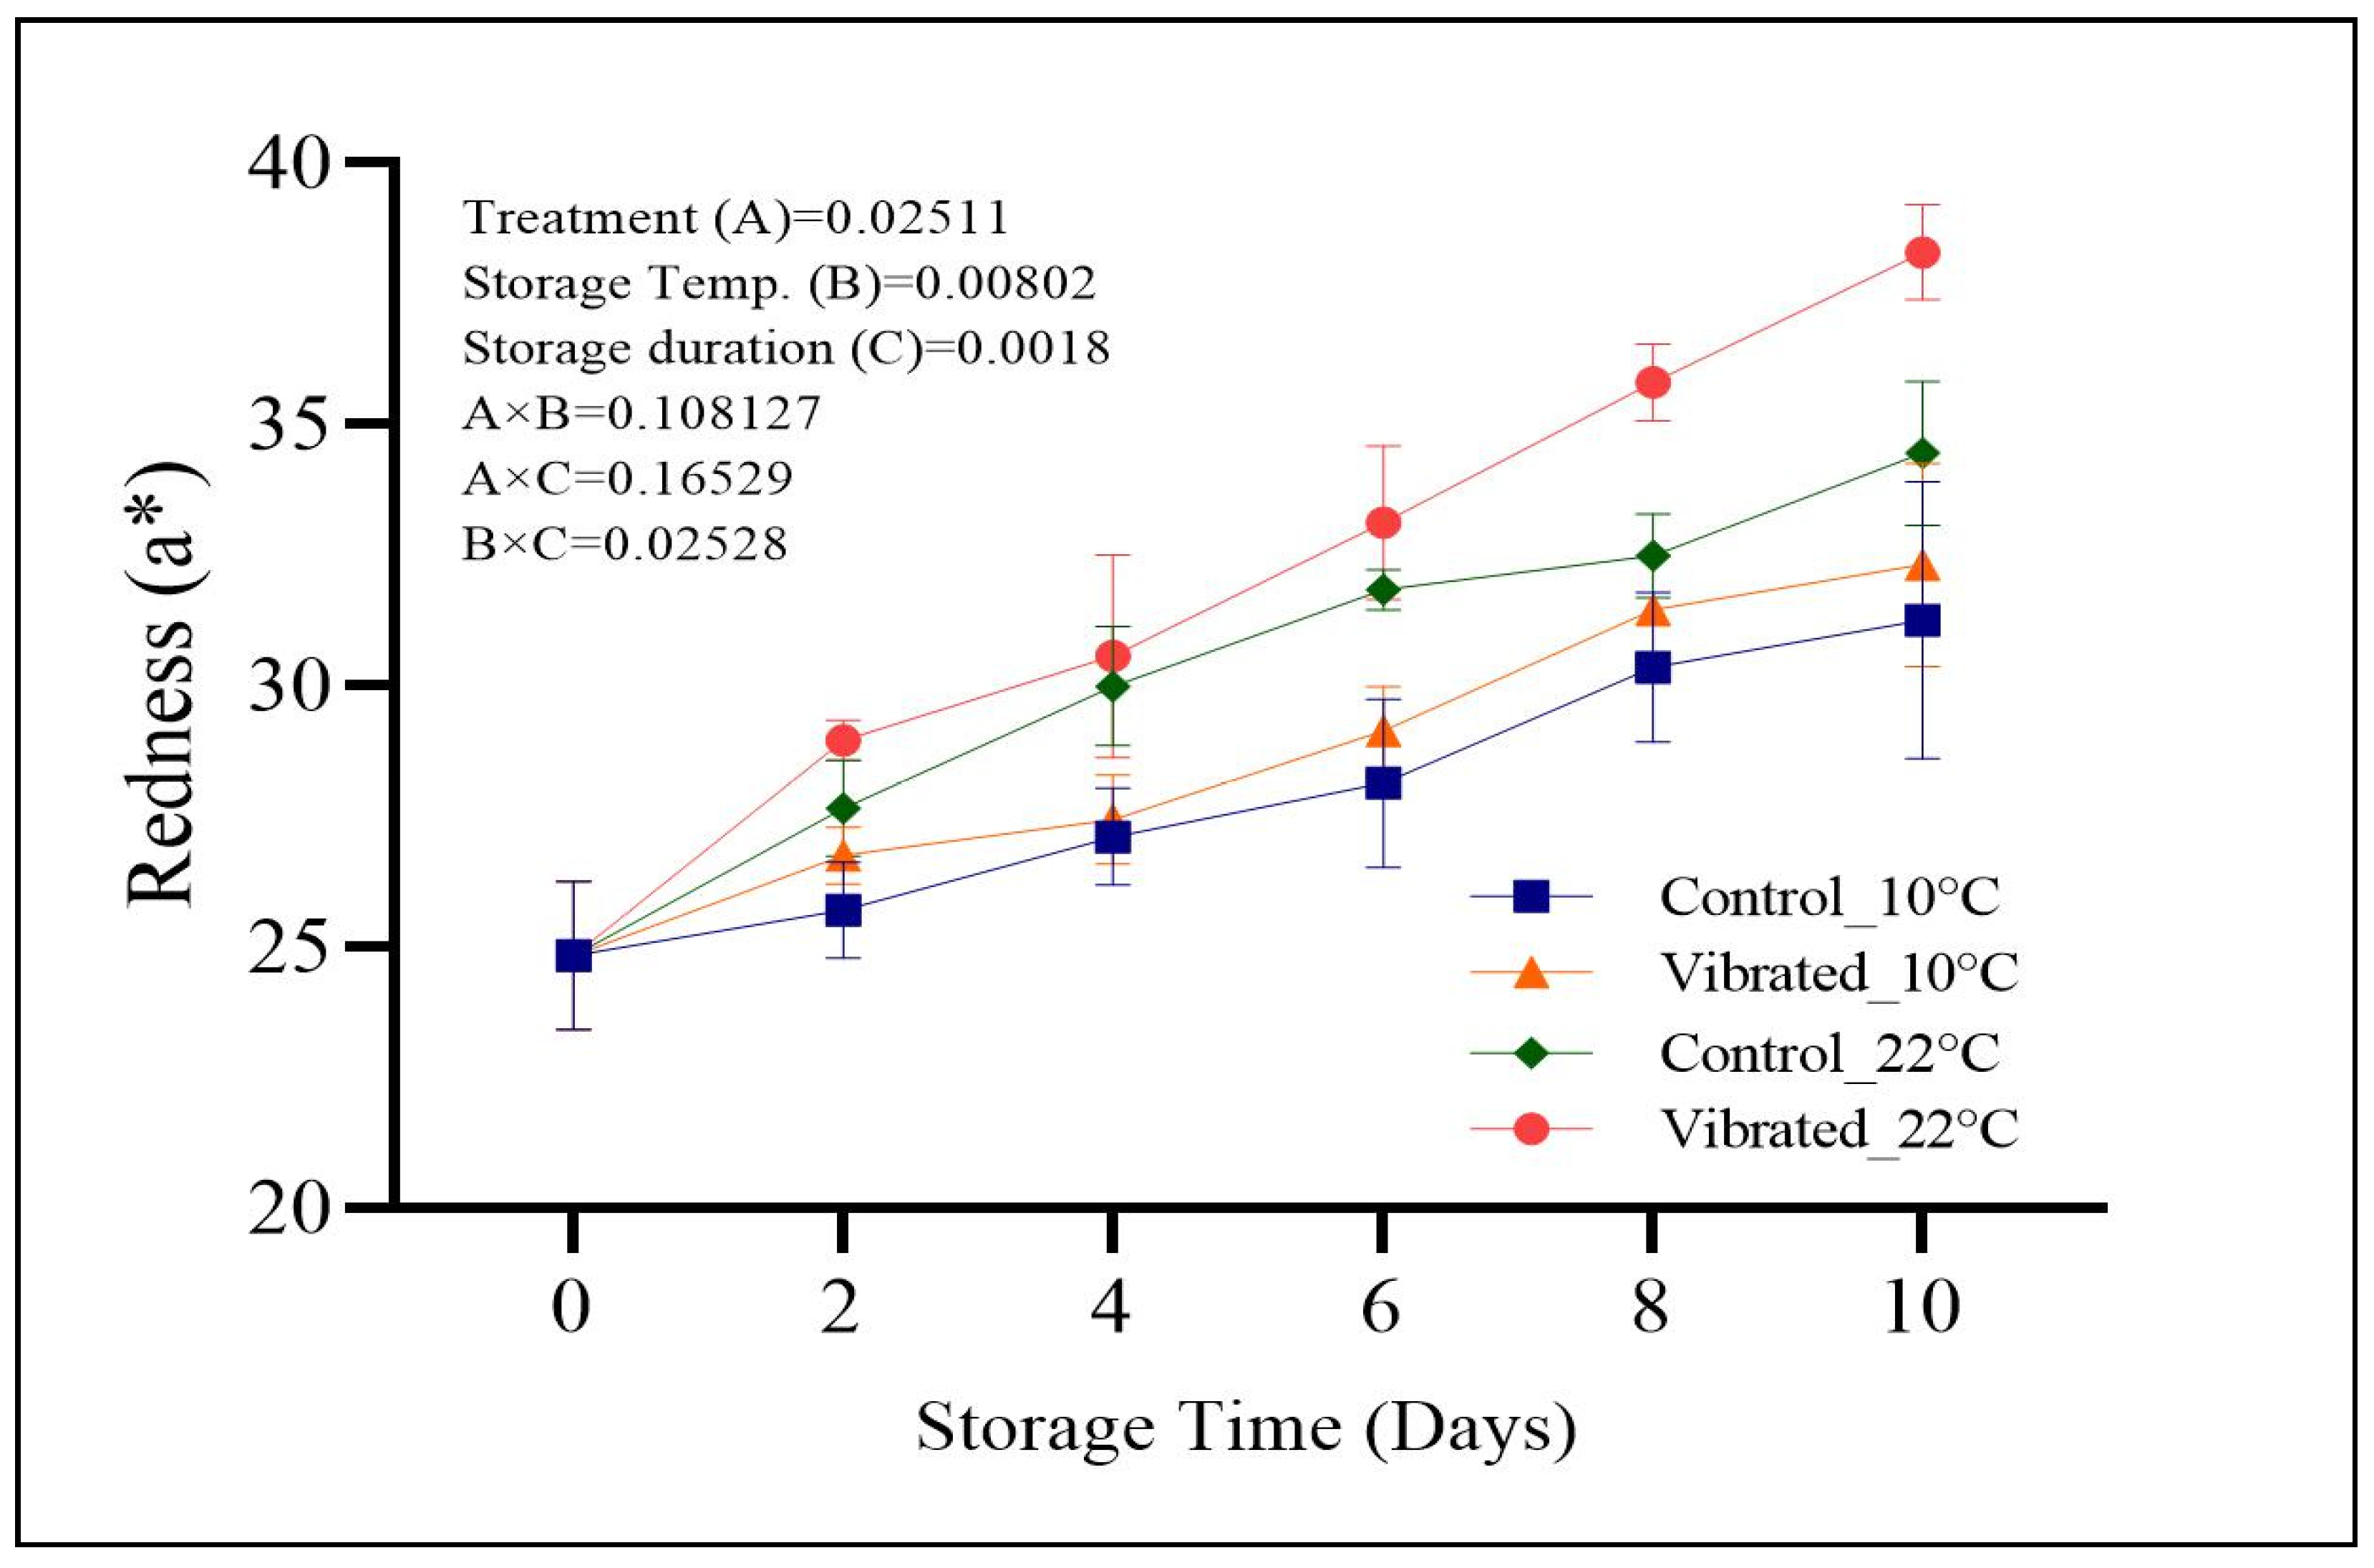
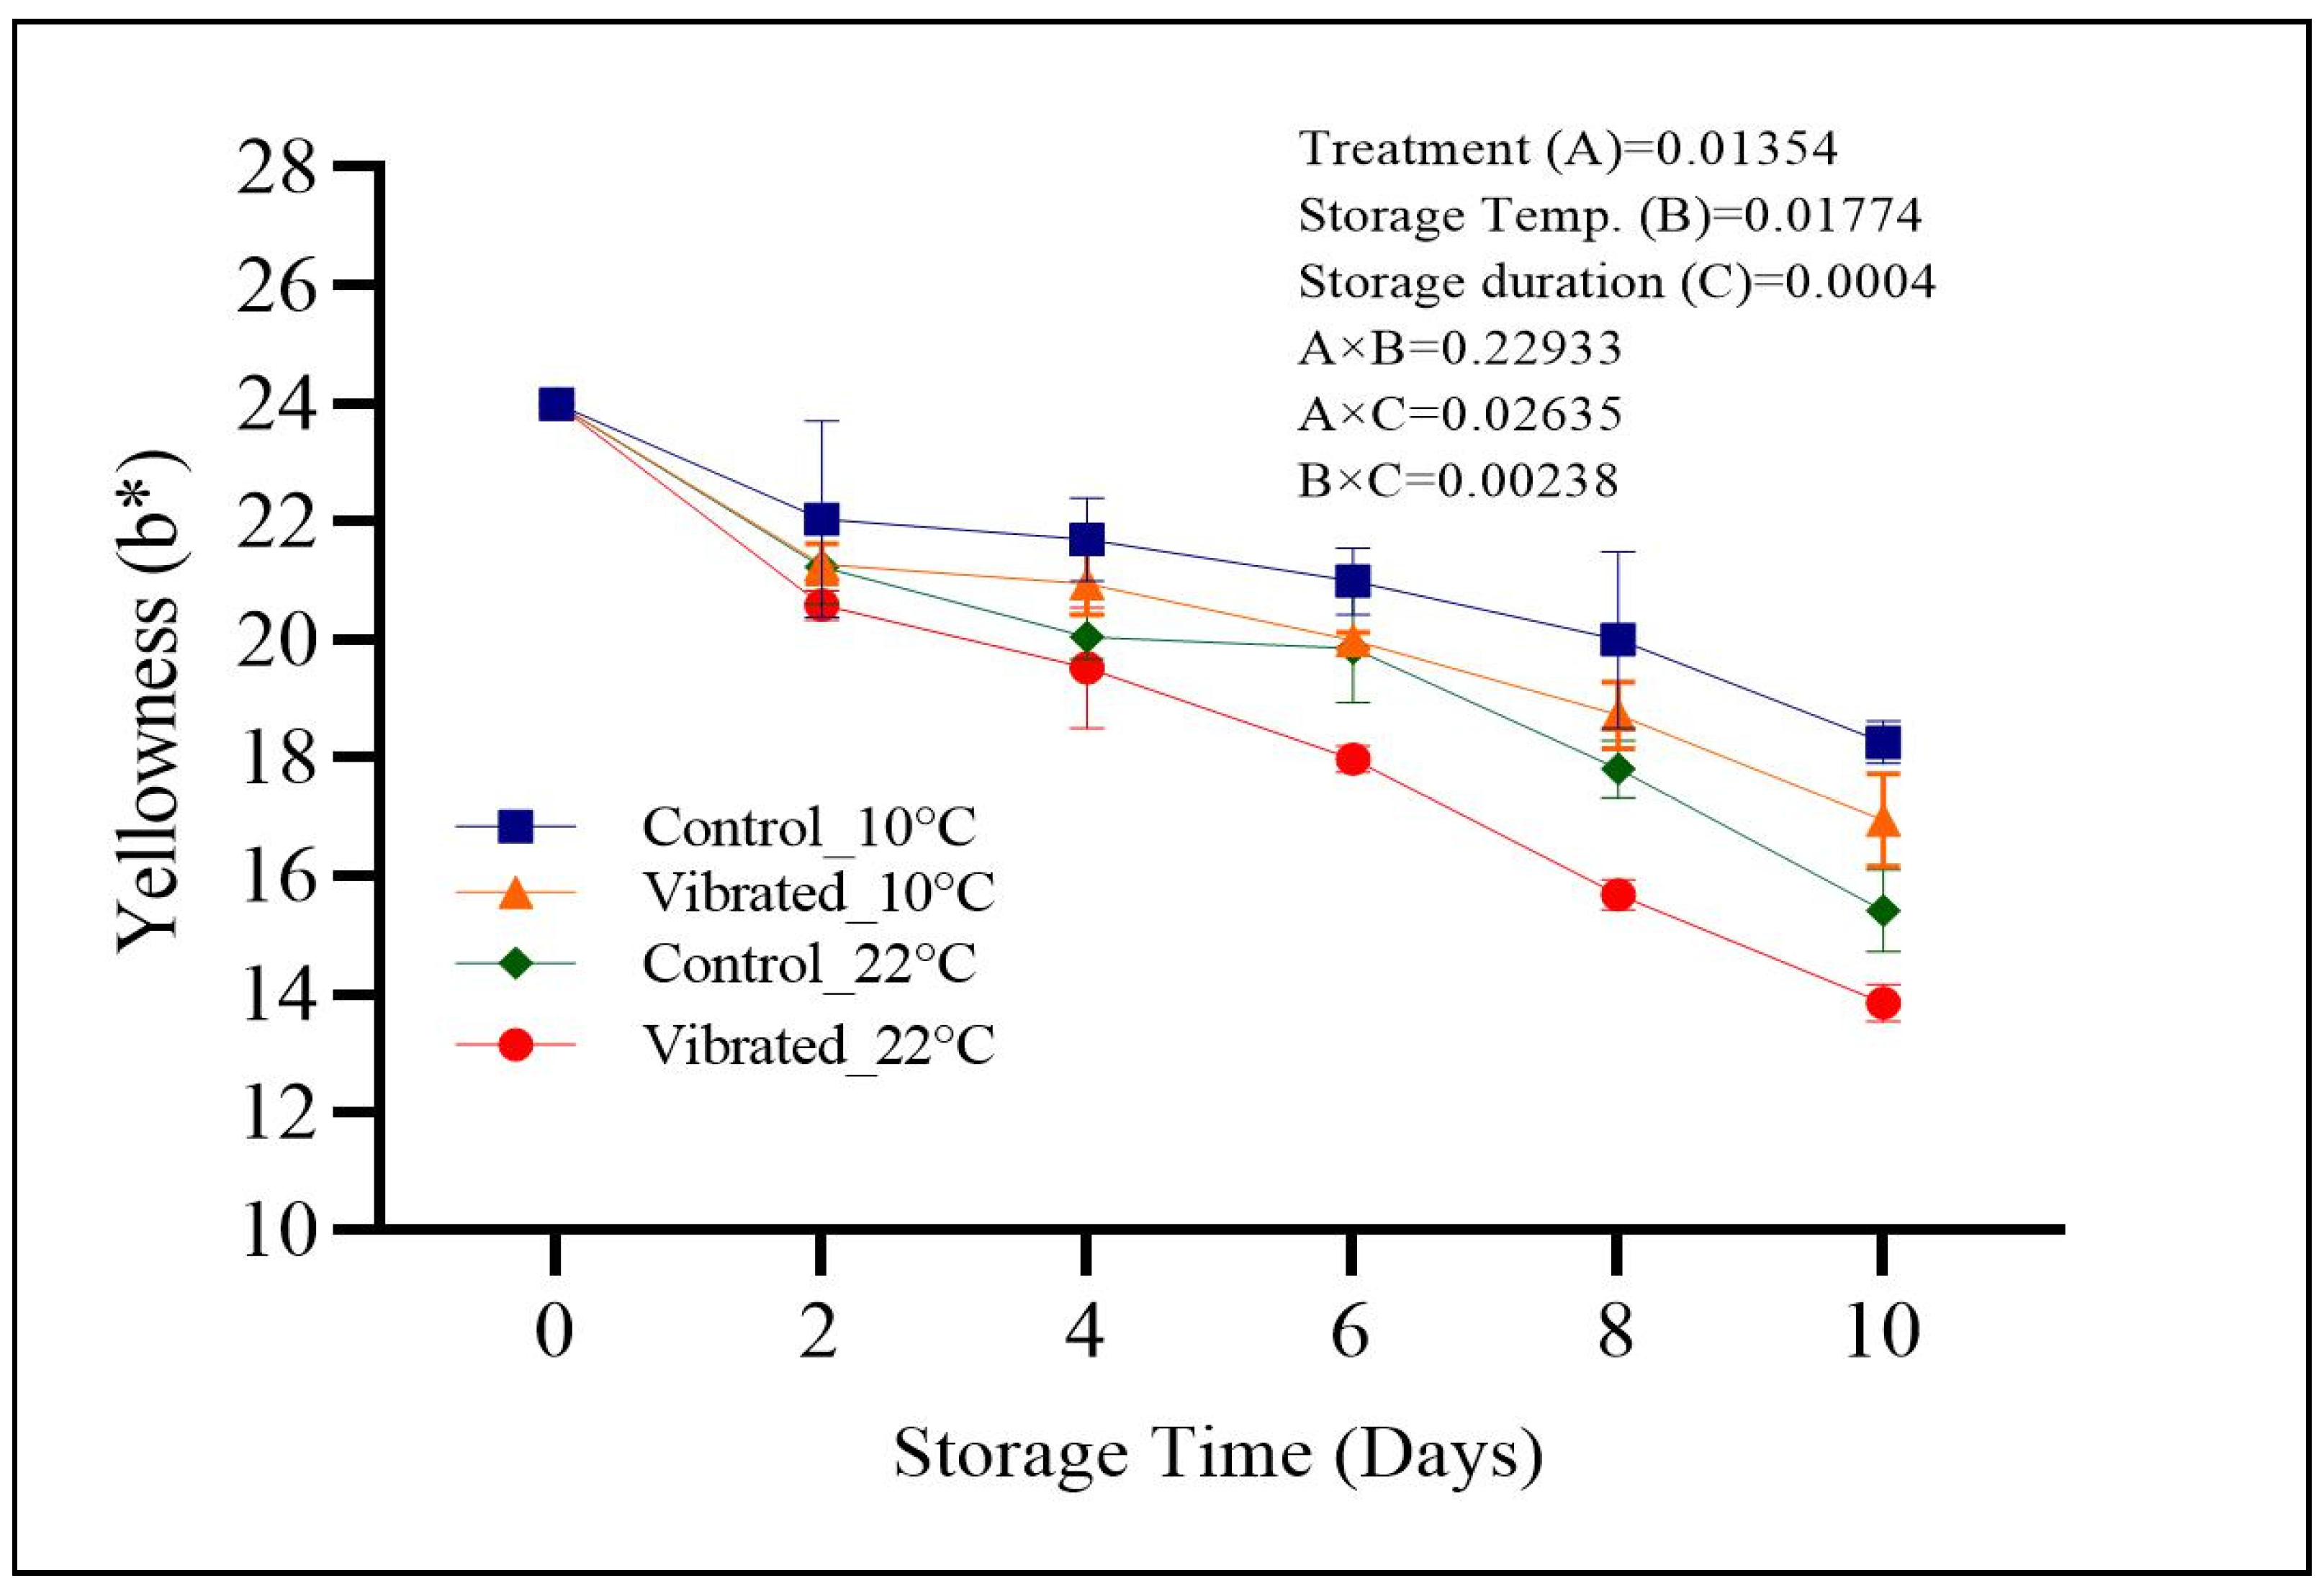
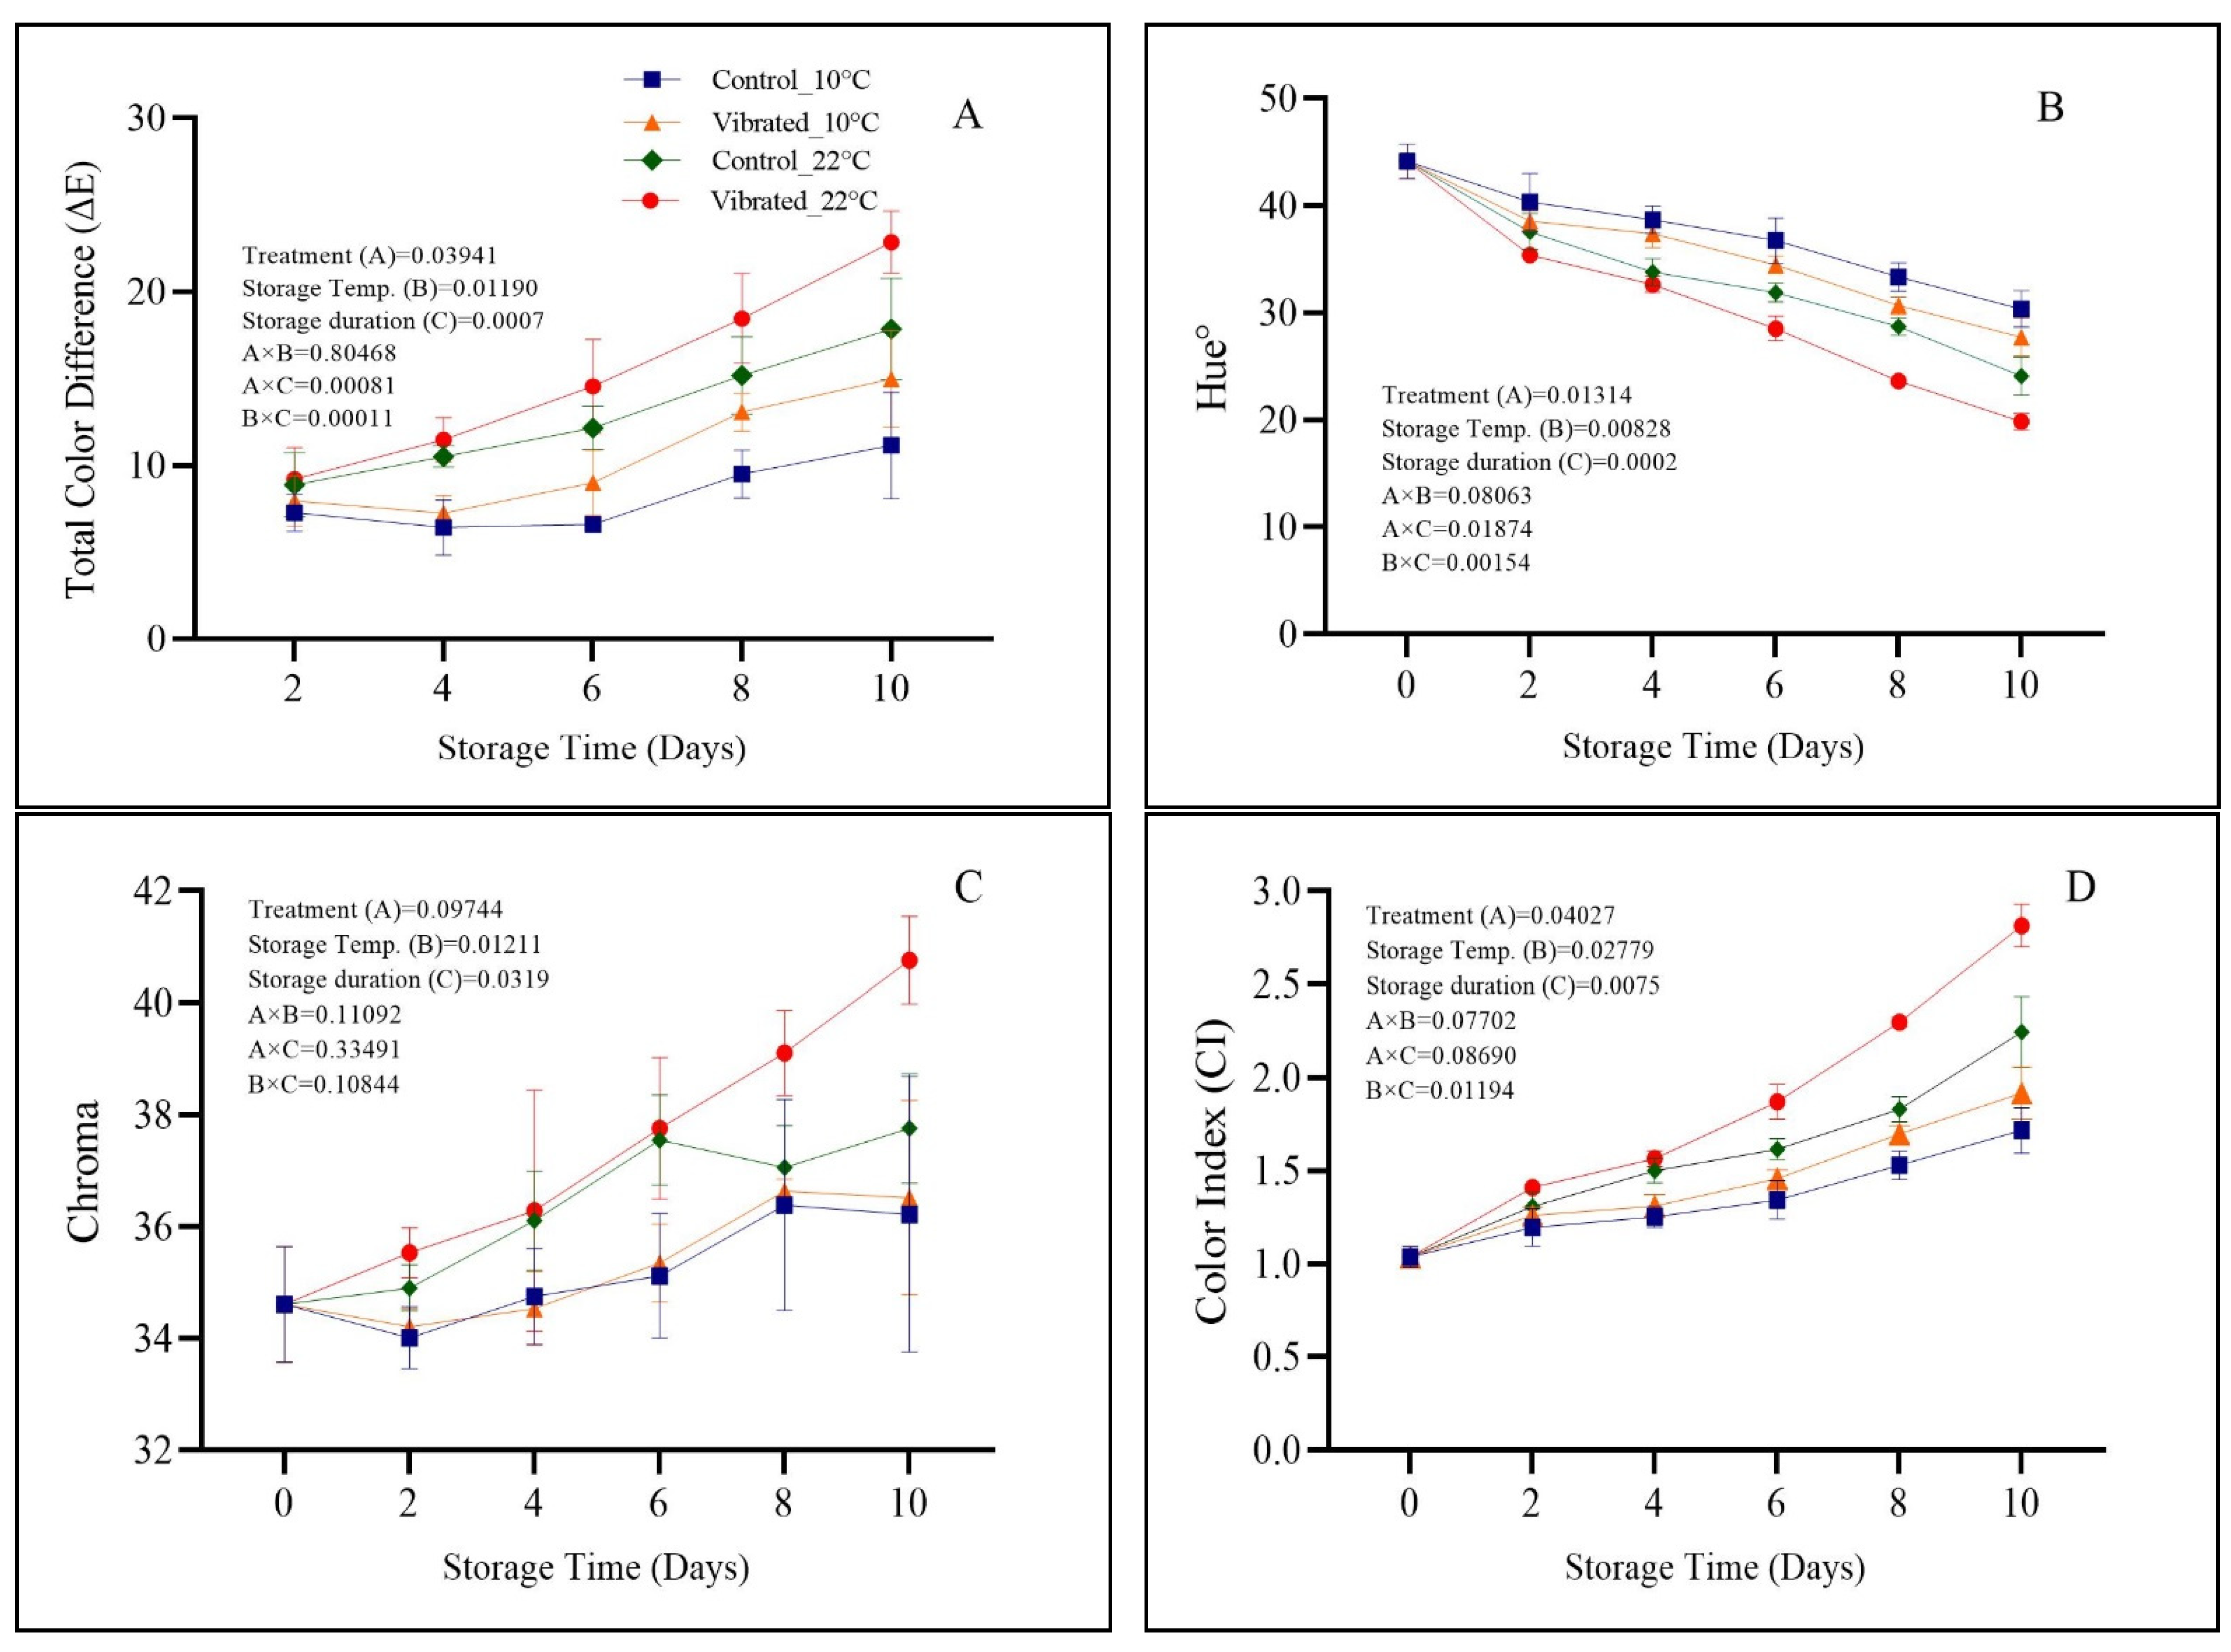
3.3. Color
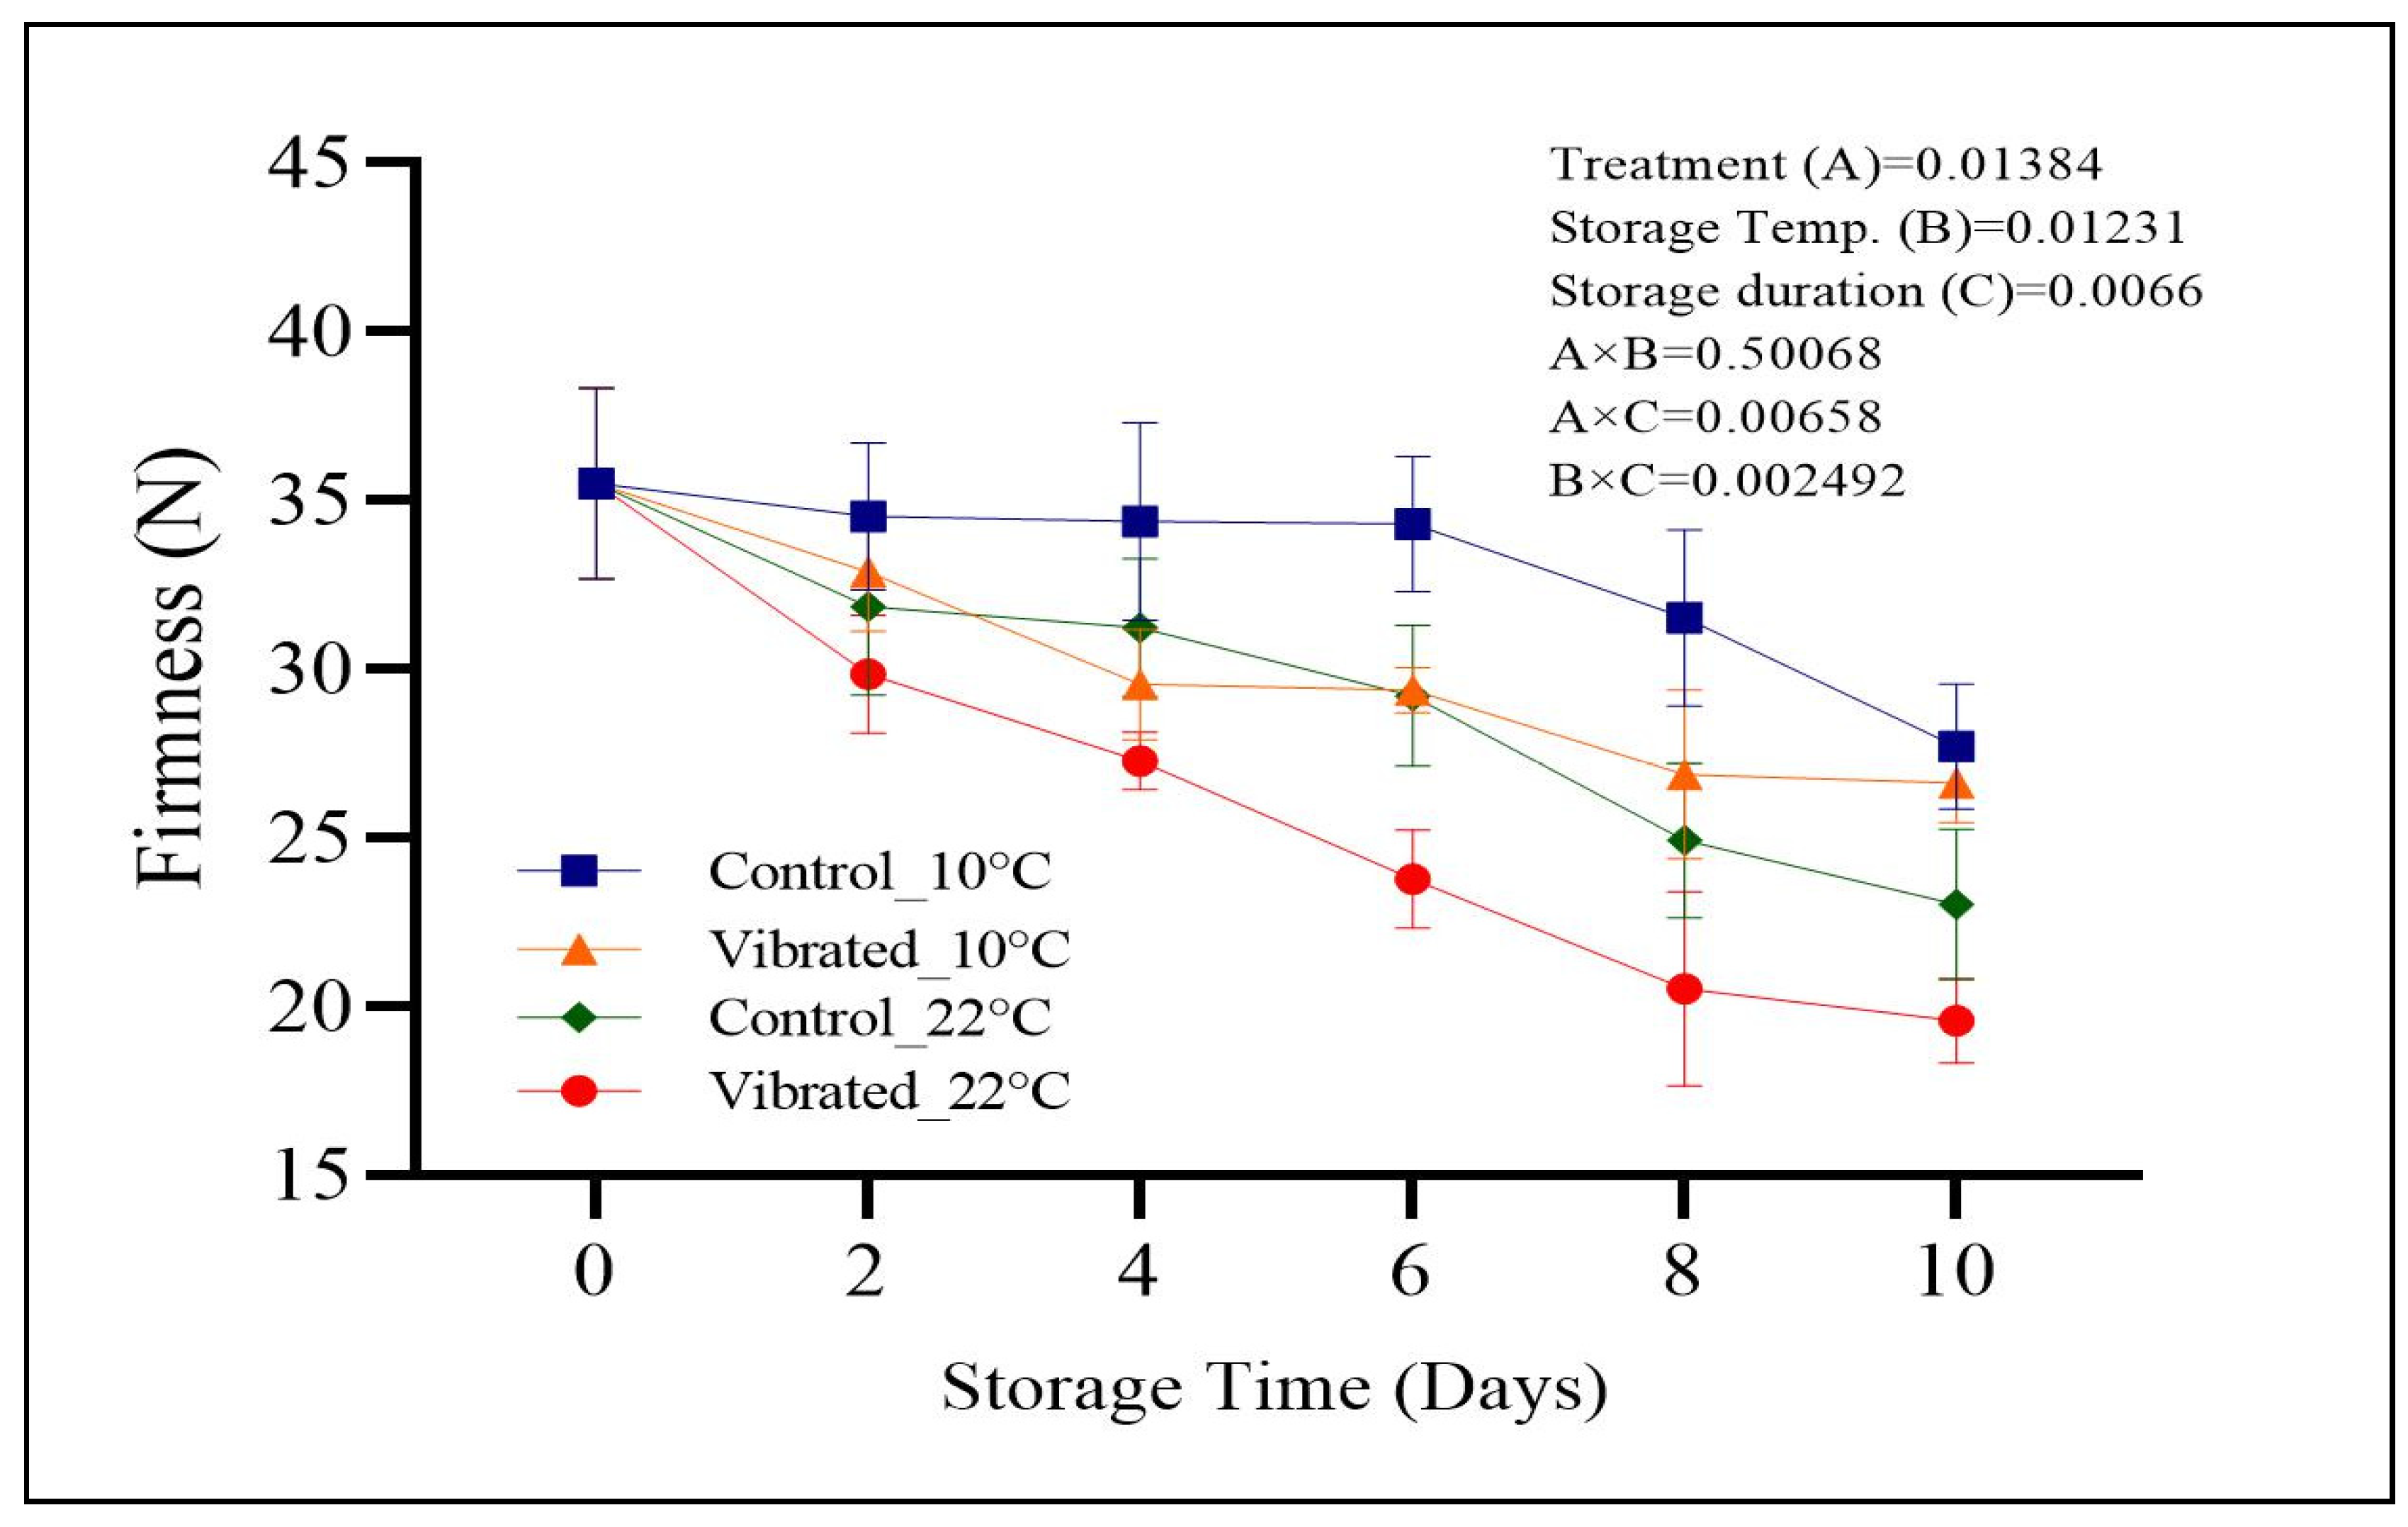
3.4. Firmness (N)
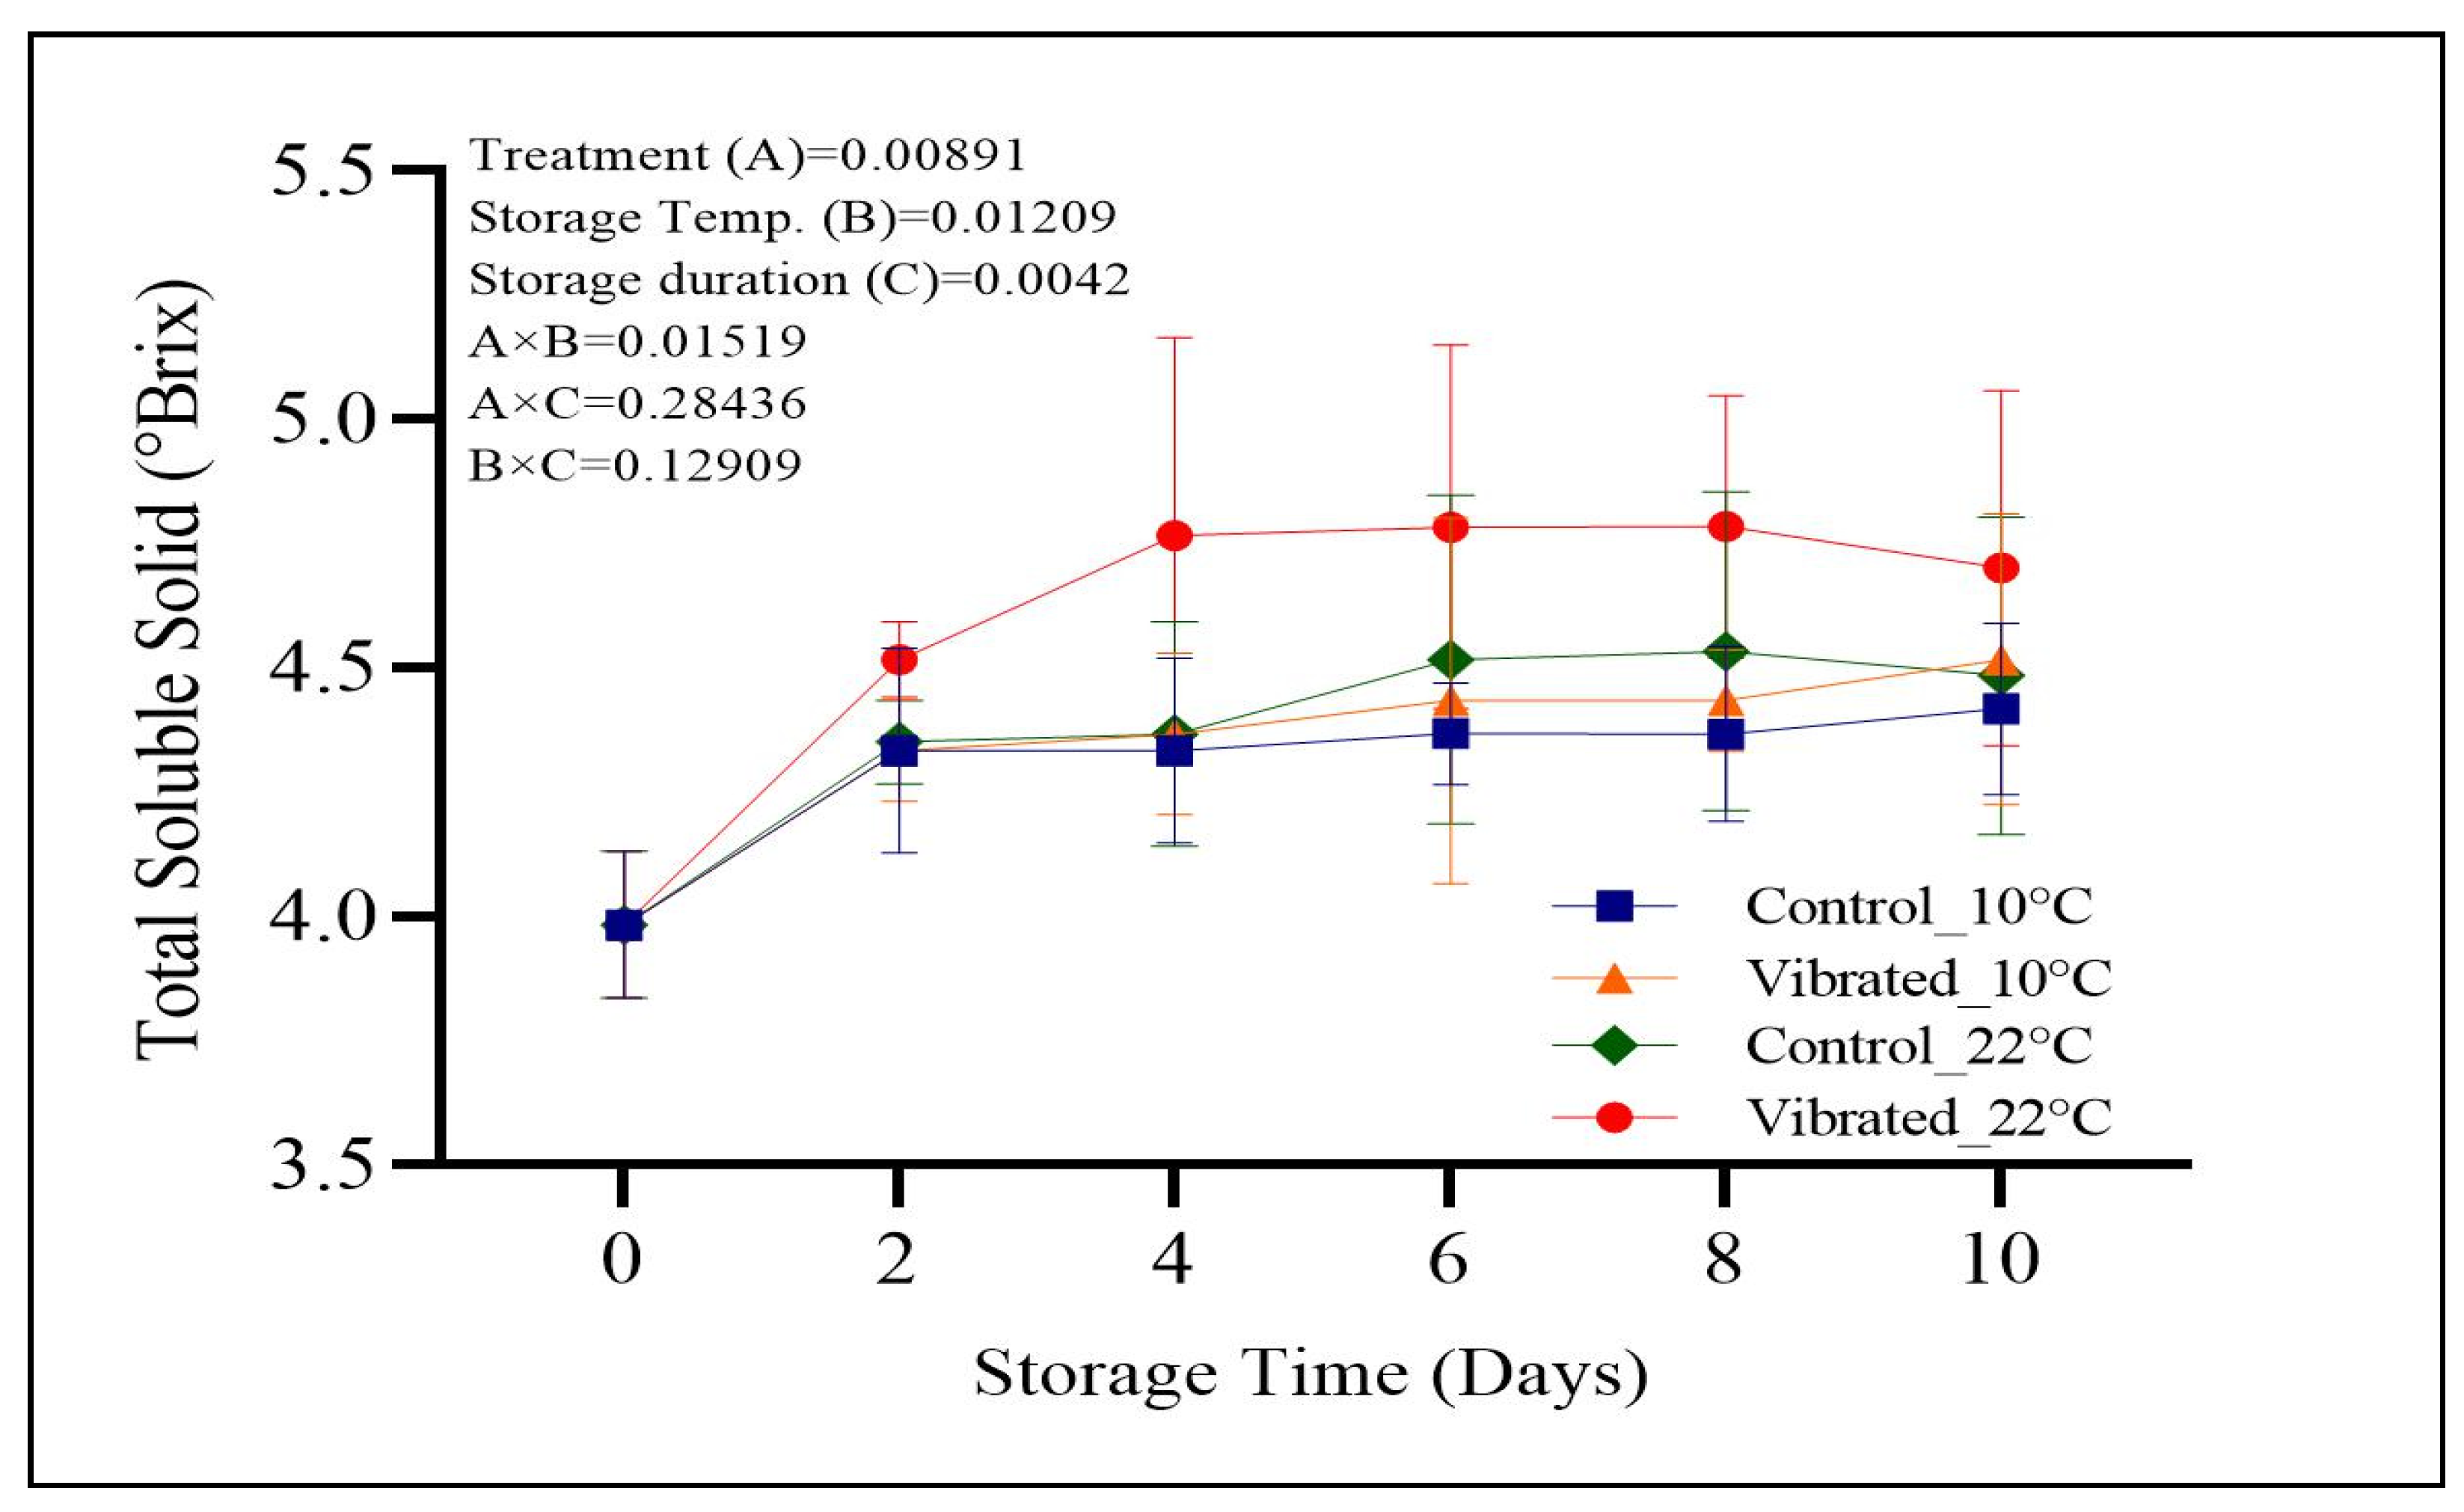
3.5. Total Soluble Solids (°Brix)
3.6. Headspace Gases
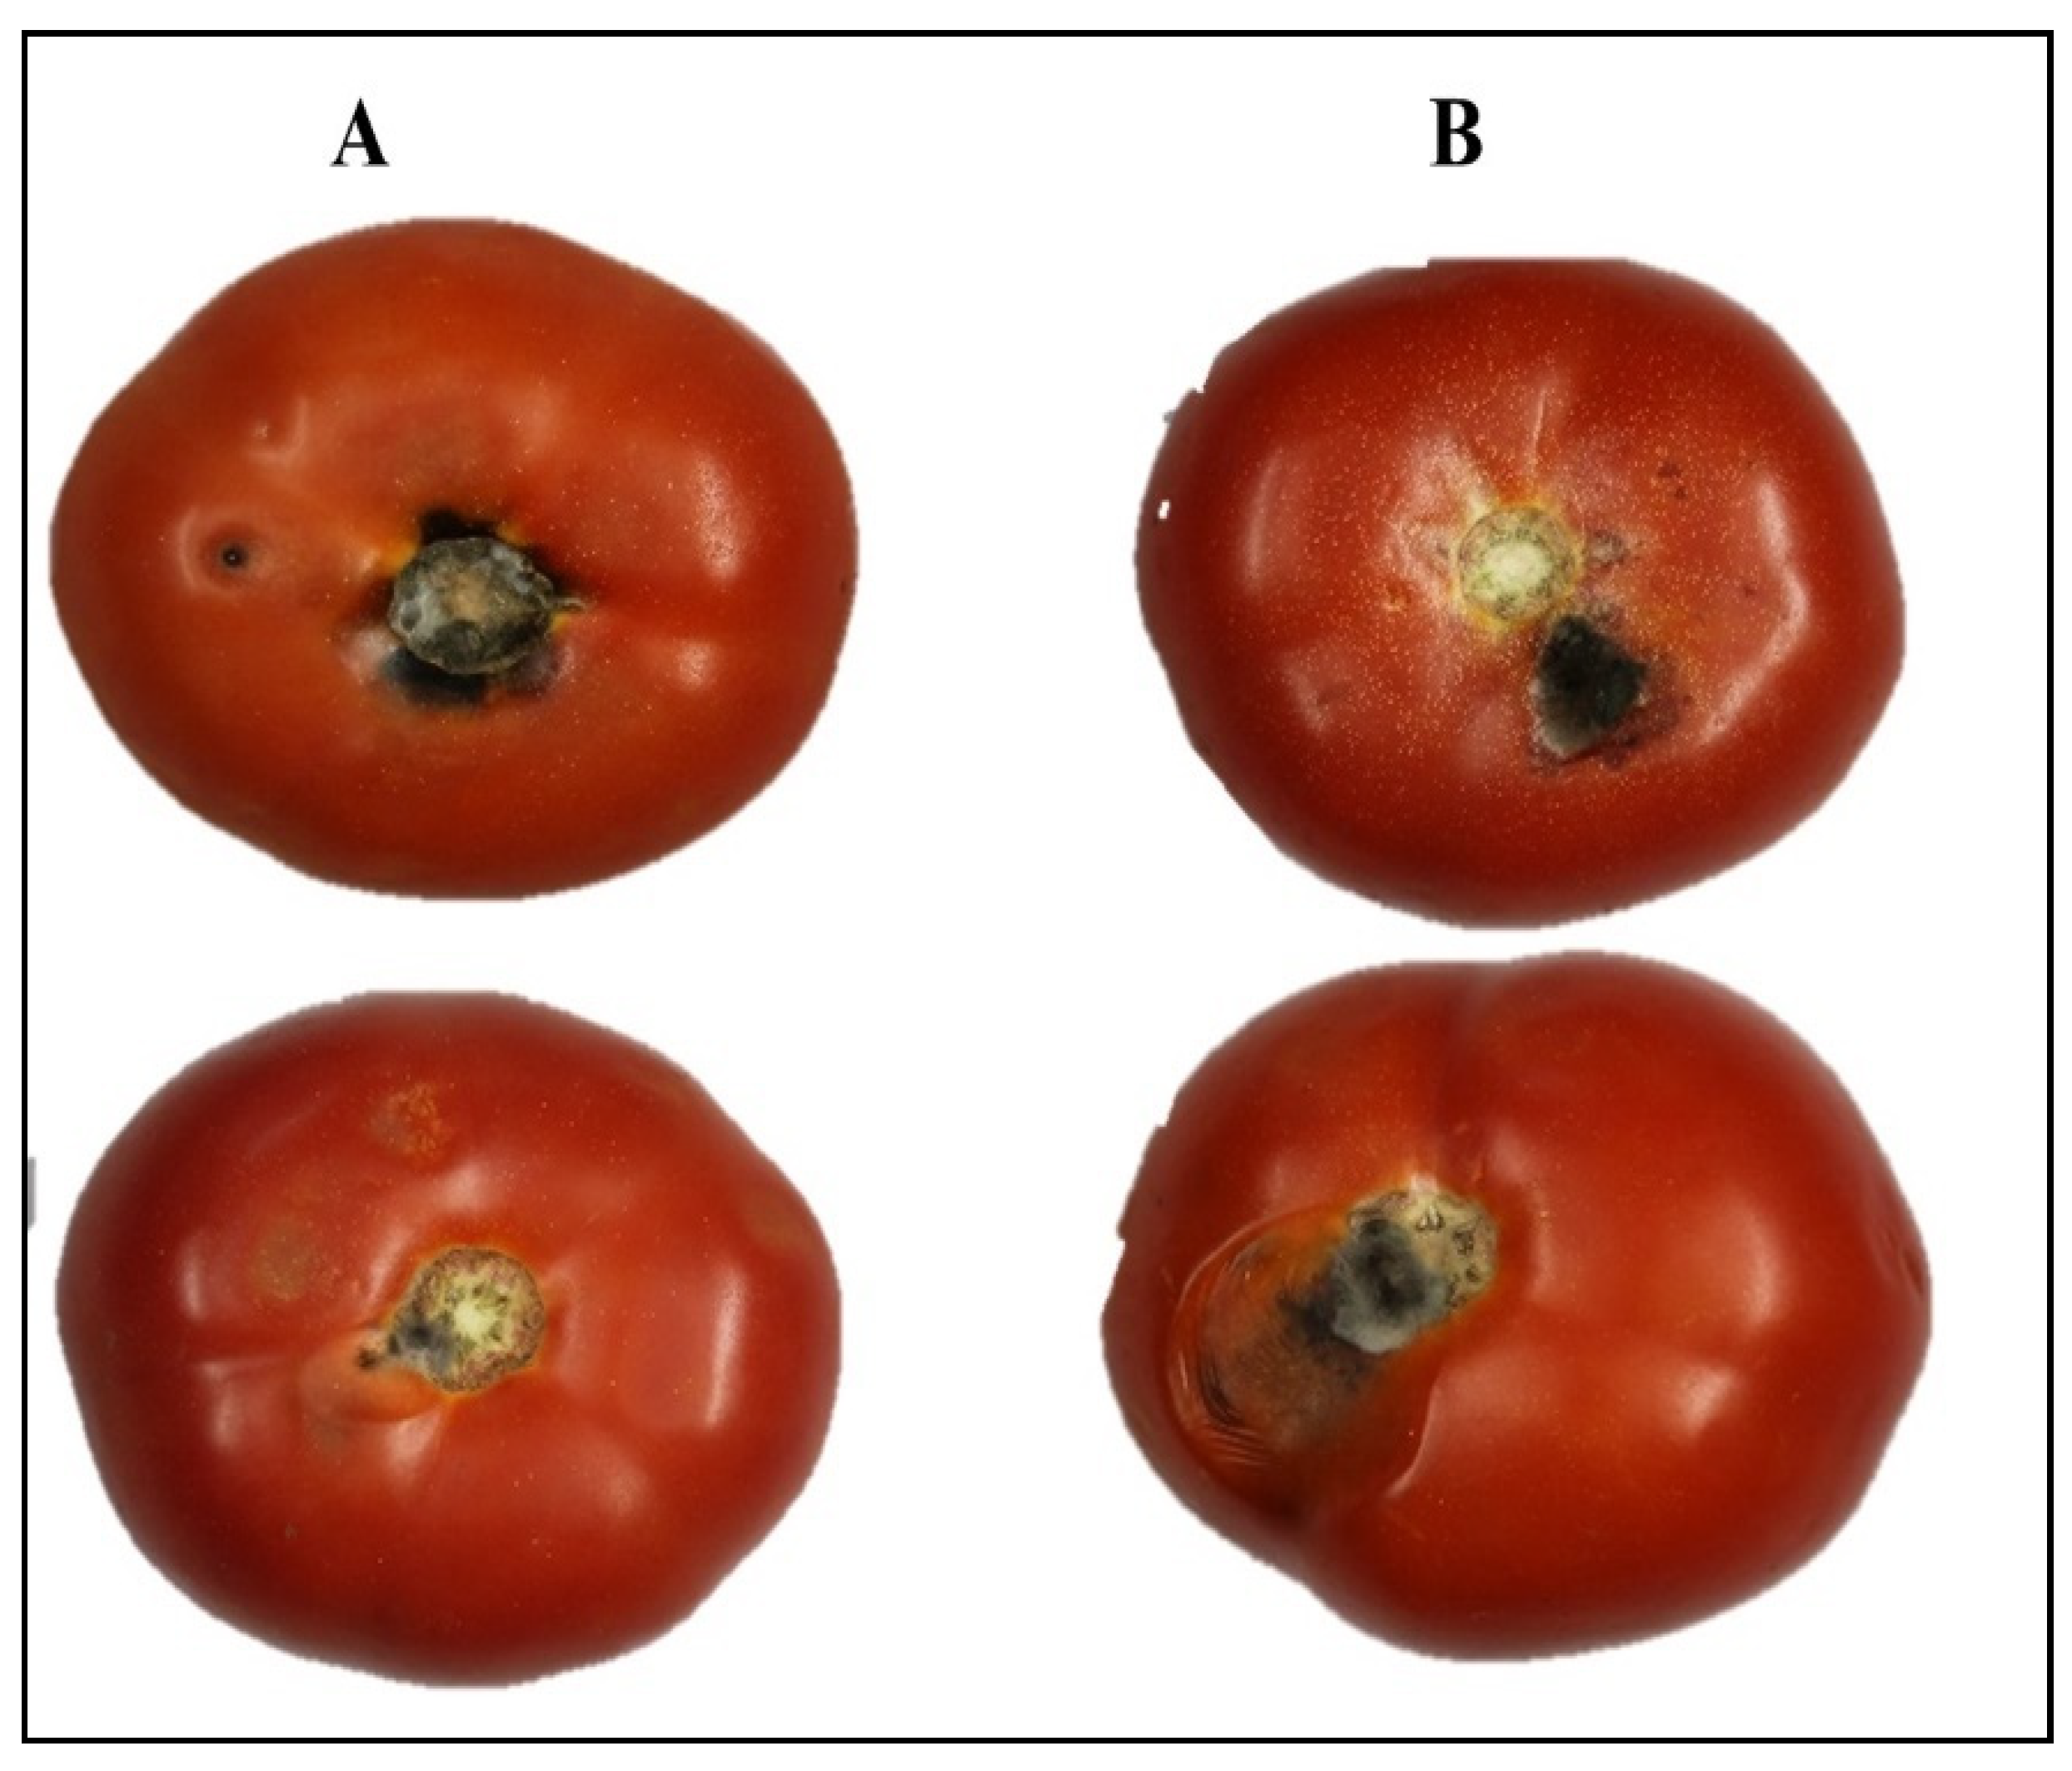
3.7. Subjective Quality Analysis/Visual Observation of Mechanical Damage
4. Conclusions
Author Contributions
Funding
Institutional Review Board Statement
Informed Consent Statement
Data Availability Statement
Acknowledgments
Conflicts of Interest
References
- Famuyini, J.; Sedara, A. Effect of Maturity Stage on Quality and Shelf Life of Tomato (Lycopersicon Esculentum Mill) Using Refrigerator Storage System. Eurasian J. Agric. Res. 2020, 4, 23–44. [Google Scholar]
- Al-Dairi, M.; Pathare, P.B.; Al-Mahdouri, A. Effect of Storage Conditions on Postharvest Quality of Tomatoes: A Case Study at Market-Level. J. Agric. Mar. Sci. 2021, 26, 13–20. [Google Scholar]
- Chero, M.J.S.; Zamora, W.R.M.; Chero, J.A.S.; Villarreyes, S.S.C. Application of the Computer Vision System to the Measurement of the CIE L* a* B* Color Parameters of Fruits. In Advances in Artificial Intelligence, Software and Systems Engineering; Ahram, T., Ed.; Advance Intelligent Systems and Computing; Springer: Cham, Switzerland, 2020; Volume 1213. [Google Scholar]
- Wu, G.; Wang, C. Investigating the Effects of Simulated Transport Vibration on Tomato Tissue Damage Based on Vis/Nir Spectroscopy. Postharvest Biol. Technol. 2014, 98, 41–47. [Google Scholar] [CrossRef]
- Cherono, K.; Sibomana, M.; Workneh, T.S. Effect of Infield Handling Conditions and Time to Pre-Cooling on the Shelf-Life and Quality of Tomatoes. Braz. J. Food Technol. 2018, 21, 1–12. [Google Scholar] [CrossRef]
- Al-Dairi, M.; Pathare, P.B.; Al-Yahyai, R. Effect of Postharvest Transport and Storage on Color and Firmness Quality of Tomato. Horticulturae 2021, 7, 163. [Google Scholar] [CrossRef]
- Wei, X.; Xie, D.; Mao, L.; Xu, C.; Luo, Z.; Xia, M.; Zhao, X.; Han, X.; Lu, W. Excess Water Loss Induced by Simulated Transport Vibration in Postharvest Kiwifruit. Sci. Hort. 2019, 250, 113–120. [Google Scholar] [CrossRef]
- Alfatni, M.S.M.; Shariff, A.R.M.; Abdullah, M.Z.; Marhaban, M.H.B.; Saaed, O.M.B. The Application of Internal Grading System Technologies for Agricultural Products–Review. J. Food Eng. 2013, 116, 703–725. [Google Scholar] [CrossRef]
- Jung, H.; Park, J.-G. Effects of Vibration Stress on the Quality of Packaged Apples During Simulated Transport. J. Biosyst. Eng. 2012, 37, 44–50. [Google Scholar] [CrossRef] [Green Version]
- Walkowiak-Tomczak, D.; Idaszewska, N.; Łysiak, G.P.; Bieńczak, K. The Effect of Mechanical Vibration During Transport under Model Conditions on the Shelf-Life, Quality and Physico-Chemical Parameters of Four Apple Cultivars. Agronomy 2021, 11, 81. [Google Scholar] [CrossRef]
- Jung, H.M.; Lee, S.; Lee, W.-H.; Cho, B.-K.; Lee, S.H. Effect of Vibration Stress on Quality of Packaged Grapes during Transportation. Eng. Agric. Environ. Food 2018, 11, 79–83. [Google Scholar] [CrossRef]
- Tao, F.; Chen, W.; Jia, Z. Effect of Simulated Transport Vibration on the Quality of Shiitake Mushroom (Lentinus edodes) during Storage. Food Sci. Nutr. 2020, 9, 1152–1159. [Google Scholar]
- Xu, F.; Liu, S.; Liu, Y.; Wang, S. Effect of Mechanical Vibration on Postharvest Quality and Volatile Compounds of Blueberry Fruit. Food Chem. 2021, 349, 129216. [Google Scholar] [CrossRef] [PubMed]
- Al-Dairi, M.; Pathare, P.B.; Al-Yahyai, R. Chemical and Nutritional Quality Changes of Tomato during Postharvest Transportation and Storage. J. Saudi Soci.Agric. Sci. 2021, 20, 401–408. [Google Scholar]
- Xu, D.; Zuo, J.; Li, P.; Yan, Z.; Gao, L.; Wang, Q.; Jiang, A. Effect of Methyl Jasmonate on the Quality of Harvested Broccoli after Simulated Transport. Food Chem. 2020, 319, 126561. [Google Scholar] [CrossRef] [PubMed]
- Chaiwong, S.; Bishop, C.F. Effect of Vibration Damage on the Storage Quality Of’elsanta’strawberry. Aust. J. Crop Sci. 2015, 9, 859–864. [Google Scholar]
- Walkowiak-Tomczak, D.; Idaszewska, N.; Bieńczak, K.; Kómoch, W. The Effect of Mechanical Actions Occurring during Transport on Physicochemical Changes in Agaricus bisporus Mushrooms. Sustainability 2020, 12, 4993. [Google Scholar] [CrossRef]
- Pathare, P.B.; Al-Dairi, M. Bruise Damage and Quality Changes in Impact-Bruised, Stored Tomatoes. Horticulturae 2021, 7, 113. [Google Scholar] [CrossRef]
- Pathare, P.B.; Al-Dairi, M.; Al-Mahdouri, A. Bruise Damage Susceptibility and Fruit Quality Assessment of Pear. Open Agric. J. 2021, 15, 82–90. [Google Scholar] [CrossRef]
- Arah, I.K.; Kumah, E.K.; Anku, E.K.; Amaglo, H. An Overview of Post-Harvest Losses in Tomato Production in Africa: Causes and Possible Prevention Strategies. J. Bio. Agric. Healthc. 2015, 5, 78–88. [Google Scholar]
- Kabir, S.N.; Rasool, K.; Lee, W.-H.; Cho, S.-I.; Chung, S.-O. Influence of Delayed Cooling on the Quality of Tomatoes (Solanum lycopersicum L.) Stored in a Controlled Chamber. AIMS Agric. Food. 2020, 5, 272. [Google Scholar] [CrossRef]
- Remini, H.; Mertz, C.; Belbahi, A.; Achir, N.; Dornier, M.; Madani, K. Degradation Kinetic Modelling of Ascorbic Acid and Colour Intensity in Pasteurised Blood Orange Juice During Storage. Food Chem. 2015, 173, 665–673. [Google Scholar] [CrossRef]
- Al-Dairi, M.; Pathare, P.B.; Al-Yahyai, R. Quality Changes Kinetic of Tomato During Postharvest Transportation and Storage. J. Food Proc. Eng. 2021, 44, e13808. [Google Scholar] [CrossRef]
- Al-Dairi, M.; Pathare, P.B. Kinetic Modeling of Quality Changes of Tomato During Storage. Agric. Eng. Int. CIGR J. 2021, 23, 183–193. [Google Scholar]
- Zhang, W.; Luo, Z.; Wang, A.; Gu, X.; Lv, Z. Kinetic Models Applied to Quality Change and Shelf Life Prediction of Kiwifruits. LWT 2021, 138, 110610. [Google Scholar] [CrossRef]
- Pathare, P.B.; Opara, U.L.; Al-Said, F.A. Colour Measurement and Analysis in Fresh and Processed Foods: A Review. Food Bioproc Technol. 2013, 6, 36–60. [Google Scholar] [CrossRef]
- Chayjan, R.A.; Alaei, B. New Model for Colour Kinetics of Plum under Infrared Vacuum Condition and Microwave Drying. Acta Sci. Pol. Technol. Aliment. 2016, 15, 131–144. [Google Scholar] [CrossRef] [Green Version]
- Pinheiro, J.; Alegria, C.; Abreu, M.; Gonçalves, E.M.; Silva, C.L. Kinetics of Changes in the Physical Quality Parameters of Fresh Tomato Fruits (Solanum lycopersicum, Cv.‘Zinac’) During Storage. J. Food Eng. 2013, 114, 338–345. [Google Scholar] [CrossRef]
- Munhuewyi, K. Postharvest Losses and Changes in Quality of Vegetables from Retail to Consumer: A Case Study of Tomato, Cabbage and Carrot. Master’s Thesis, Stellenbosch University, Stellenbosch, WC, South Africa, 2012. [Google Scholar]
- Ghazal, A.; El-Masry, G.; El-Sheikh, I.; Radwan, S. Estimation of Some Postharvest Losses in Tomato During Simulated Transport Operation. Misr J. Agric. Eng. 2017, 34, 291–316. [Google Scholar] [CrossRef]
- Endalew, E. Postharvest Loss Assessment of Tomato (Lycopersicon esculentum Mill) (Galilea Cultivar) Along the Postharvest Supply Chain, Northwest Ethiopia. Master’s Thesis, Bahir Dar University, Amhara, Ethiopia, 2020. [Google Scholar]
- Dagdelen, C.; Aday, M.S. The Effect of Simulated Vibration Frequency on the Physico-Mechanical and Physicochemical Properties of Peach During Transportation. LWT 2021, 137, 110497. [Google Scholar] [CrossRef]
- Sun, L.; Liu, S.; Fan, Z.; Li, Y.; Wang, J.; Zhong, Y.; Zhang, Q.; Duan, X. The Impact of Storage Temperature on Fruit Quality and Chilling Injury of ‘Okubao’peaches. Int. J. Food Biosci. 2018, 1, 12–18. [Google Scholar]
- Tigist, M.; Workneh, T.S.; Woldetsadik, K. Effects of Variety on the Quality of Tomato Stored under Ambient Conditions. J. Sci. Technol. 2013, 50, 477–486. [Google Scholar] [CrossRef] [PubMed] [Green Version]
- Cherono, K.; Workneh, T. The Efficacy of Postharvest Biocontrol Treatments in Controlling Spoilage of Tomato Fruit in South African Commercial Supply Chains. J. Eng. Agric. Environ. 2020, 5, 19–25. [Google Scholar] [CrossRef]
- Al-Dairi, M.; Pathare, P.B.; Al-Mahdouri, A. Impact of vibration on the quality of tomato produced by stimulated transport. In IOP Conference Series: Earth and Environmental Science; IOP Publishing: Bristol, UK; London, UK, 2021; p. 012101. [Google Scholar]
- Pathare, P.B.; Al-Dairi, M. Bruise Susceptibility and Impact on Quality Parameters of Pears During Storage. Front. Sustain. Food Syst. 2021, 5, 658132. [Google Scholar] [CrossRef]


| Top | Acceleration Interval (m/s2) | >0.0094 | 0.0099–0.0104 | 0.0104–0.0109 | 0.0109–0.0113 | 0.0113–0.0118 | 0.0118–0.0123 | 0.0123–0.0127 | 0.0127–0.0132 | 0.0132–0.0137 | 0.0137–0.0141 | 0.0141–0.0146 | 0.0146–0.0151 | 0.0151–0.0156 | 0.0156–0.0160 | <0.0160 |
| Number of Peaks | 42 | 145 | 203 | 239 | 737 | 595 | 674 | 790 | 374 | 358 | 816 | 839 | 896 | 549 | 57 | |
| Acceleration distribution (%) | 0.57 | 1.98 | 2.77 | 3.26 | 10.07 | 8.13 | 9.21 | 10.80 | 5.11 | 4.89 | 11.15 | 11.47 | 12.25 | 7.50 | 0.77 | |
| Middle | Acceleration Interval (m/s2) | >0.0247 | 0.252–0.0257 | 0.0257–0.0261 | 0.0261–0.0266 | 0.0266–0.0270 | 0.0270–0.0275 | 0.0275–0.0280 | 0.0280–0.0284 | 0.0284–0.0289 | 0.0289–0.0293 | 0.0293–0.0298 | 0.0298–0.0302 | 0.0302–0.0307 | 0.0307 | - |
| Number of peaks | 78 | 68 | 57 | 139 | 775 | 1457 | 1664 | 1539 | 815 | 245 | 168 | 131 | 85 | 93 | - | |
| Acceleration distribution (%) | 1.06 | 0.92 | 0.77 | 1.90 | 10.29 | 19.92 | 22.75 | 21.04 | 11.14 | 3.34 | 2.29 | 1.79 | 1.16 | 1.27 | - | |
| Bottom | Acceleration Interval (m/s2) | >0.0036 | 0.0039–0.0042 | 0.0042–0.0044 | 0.0044–0.0047 | 0.0047–0.0050 | 0.0050–0.0053 | 0.0053–0.0055 | 0.0055–0.0058 | 0.0058–0.0061 | 0.0061–0.0063 | 0.0063–0.0066 | 0.0066–0.0069 | 0.0069–0.0071 | <0.0071 | - |
| Number of peaks | 137 | 339 | 616 | 1156 | 1213 | 874 | 1248 | 861 | 327 | 218 | 118 | 66 | 64 | 77 | - | |
| Acceleration distribution (%) | 1.87 | 4.63 | 8.42 | 15.80 | 16.58 | 11.94 | 17.06 | 11.77 | 4.47 | 2.98 | 1.61 | 0.90 | 0.78 | 1.05 | - |
| Quality Parameter | Treatment | Temp. | Zero-Order Model | First-Order Model | ||||||
|---|---|---|---|---|---|---|---|---|---|---|
| k | R2 | X2 | RMSE | k | R2 | X2 | RMSE | |||
| Weight loss | C | 10 °C | 0.2111 | 0.9917 | 0.0012 | 0.0331 | 0.4149 | 0.9397 | 0.0325 | 0.1485 |
| 22 °C | 0.6627 | 0.9909 | 0.0790 | 0.1085 | 0.4357 | 0.9653 | 0.8850 | 0.1167 | ||
| V | 10 °C | 0.2733 | 0.9982 | 0.0270 | 0.0199 | 0.3537 | 0.9731 | 1.1982 | 0.5357 | |
| 22 °C | 0.8416 | 0.9816 | 0.1660 | 0.1966 | 0.4868 | 0.9735 | 0.0765 | 0.1037 | ||
| L* | C | 10 °C | −1.0630 | 0.9483 | 0.0213 | 0.4239 | −0.0215 | 0.9451 | 0.0001 | 0.0088 |
| 22 °C | −2.2679 | 0.9593 | 0.0817 | 0.7982 | −0.0502 | 0.9719 | 0.0003 | 0.0145 | ||
| V | 10 °C | −1.9482 | 0.9720 | 0.0404 | 0.5643 | −0.0418 | 0.9668 | 0.0002 | 0.0132 | |
| 22 °C | −2.6281 | 0.9604 | 0.1039 | 0.9109 | −0.0599 | 0.9733 | 0.0004 | 0.0169 | ||
| a* | C | 10 °C | 1.3427 | 0.9836 | 0.0187 | 0.2957 | 0.0481 | 0.9876 | 0.0001 | 0.0092 |
| 22 °C | 1.8395 | 0.9675 | 0.0683 | 0.5759 | 0.0622 | 0.9512 | 0.0010 | 0.0240 | ||
| V | 10 °C | 1.5191 | 0.9827 | 0.0246 | 0.3442 | 0.0532 | 0.9835 | 0.0002 | 0.0117 | |
| 22 °C | 2.5830 | 0.9897 | 0.0447 | 0.4506 | 0.0823 | 0.9771 | 0.0008 | 0.2154 | ||
| b* | C | 10 °C | −1.0147 | 0.9539 | 0.0409 | 0.3811 | −0.0430 | 0.9495 | 0.0007 | 0.0190 |
| 22 °C | −1.5240 | 0.9486 | 0.1120 | 0.6059 | −0.0786 | 0.9404 | 0.0023 | 0.0337 | ||
| V | 10 °C | −1.2538 | 0.9528 | 0.0627 | 0.4764 | −0.0620 | 0.9555 | 0.0010 | 0.0228 | |
| 22 °C | −1.9122 | 0.9804 | 0.0593 | 0.4616 | −0.1041 | 0.9832 | 0.0011 | 0.0232 | ||
| ∆E | C | 10 °C | 1.8760 | 0.8446 | 3.7311 | 1.3744 | 0.1539 | 0.8514 | 0.0207 | 0.0909 |
| 22 °C | 3.1374 | 0.9007 | 4.4746 | 1.7794 | 0.1761 | 0.9962 | 0.0004 | 0.0154 | ||
| V | 10 °C | 2.6917 | 0.9138 | 3.5762 | 1.4117 | 0.2040 | 0.9220 | 0.0165 | 0.0839 | |
| 22 °C | 4.1489 | 0.9559 | 3.5630 | 1.5219 | 0.2294 | 0.9997 | 6.3−5 | 0.0059 | ||
| Chroma | C | 10 °C | 0.4437 | 0.7822 | 0.0275 | 0.3998 | 0.0126 | 0.7818 | 0.0002 | 0.0113 |
| 22 °C | 0.6751 | 0.8766 | 0.0307 | 0.4327 | 0.0187 | 0.8767 | 0.0002 | 0.0119 | ||
| V | 10 °C | 0.5043 | 0.8049 | 0.0308 | 0.4240 | 0.0142 | 0.8053 | 0.0002 | 0.0119 | |
| 22 °C | 1.2289 | 0.9822 | 0.0129 | 0.2825 | 0.0328 | 0.9873 | 6.7−5 | 0.0063 | ||
| Hue | C | 10 °C | −2.6247 | 0.9867 | 0.0426 | 0.5209 | −0.0713 | 0.9809 | 0.0004 | 0.0170 |
| 22 °C | −3.6755 | 0.9707 | 0.1914 | 1.0900 | −0.1111 | 0.9784 | 0.0282 | 0.0013 | ||
| V | 10 °C | −3.1014 | 0.9780 | 0.0947 | 0.7948 | −0.0880 | 0.9797 | 0.0007 | 0.0217 | |
| 22 °C | −4.5943 | 0.9753 | 0.2494 | 1.2480 | −0.1525 | 0.9875 | 0.0014 | 0.0293 | ||
| CI | C | 10 °C | 0.1284 | 0.9669 | 0.0071 | 0.0405 | 0.0951 | 0.9799 | 0.0163 | 0.0232 |
| 22 °C | 0.2206 | 0.9671 | 0.0157 | 0.0695 | 0.1411 | 0.9759 | 0.0420 | 0.0378 | ||
| V | 10 °C | 0.1673 | 0.9708 | 0.0103 | 0.0496 | 0.1162 | 0.9793 | 0.0289 | 0.0288 | |
| 22 °C | 0.3385 | 0.9724 | 0.0302 | 0.0974 | 0.1893 | 0.9872 | 0.0443 | 0.0367 | ||
| Firmness | C | 10 °C | −0.1401 | 0.7796 | 0.0301 | 0.1272 | −0.0133 | 0.7610 | 0.0088 | 0.0414 |
| 22 °C | −0.2481 | 0.9665 | 0.0124 | 0.0788 | −0.0847 | 0.9572 | 0.0052 | 0.0306 | ||
| V | 10 °C | −0.1822 | 0.9283 | 0.0147 | 0.0865 | −0.0585 | 0.9404 | 0.0034 | 0.0251 | |
| Headspace Gases | Treatment | Temp. °C | Days of Storage | ||||
|---|---|---|---|---|---|---|---|
| 2 | 4 | 6 | 8 | 10 | |||
| O2 (%) | C | 10 °C | 16.85 ± 0.21 | 16.35 ± 0.35 | 14.85 ± 0.07 | 14.35 ± 0.21 | 13.80 ± 0.42 |
| 22 °C | 12.20 ± 2.26 | 11.50 ± 2.82 | 10.80 ± 2.12 | 8.15 ± 0.91 | 7.85 ± 1.20 | ||
| V | 10 °C | 16.00 ± 1.41 | 16.20 ± 1.13 | 15.25 ± 0.21 | 15.15 ± 0.21 | 15.60 ± 0.14 | |
| 22 °C | 11.80 ± 1.69 | 10.50 ± 0.70 | 9.55 ± 0.77 | 7.80 ± 0.14 | 8.00 ± 0.00 | ||
| CO2 (%) | C | 10 °C | 3.90 ± 0.00 | 4.25 ± 0.07 | 4.45 ± 0.07 | 4.75 ± 0.35 | 4.55 ± 0.07 |
| 22 °C | 9.15 ± 1.20 | 9.70 ± 1.83 | 11.00 ± 1.41 | 17.30 ± 0.84 | 15.30 ± 0.28 | ||
| V | 10 °C | 3.85 ± 0.07 | 3.95 ± 0.07 | 4.45 ± 0.07 | 4.55 ± 0.07 | 4.60 ± 0.00 | |
| 22 °C | 9.30 ± 0.70 | 9.80 ± 1.55 | 11.10 ± 0.14 | 17.75 ± 1.34 | 16.15 ± 0.21 | ||
| C2H4 (ppm) | C | 10 °C | 1.20 ± 0.00 | 1.20 ± 0.14 | 1.25 ± 0.07 | 1.26 ± 0.00 | 1.15 ± 0.07 |
| 22 °C | 1.25 ± 0.07 | 1.40 ± 0.00 | 1.65 ± 0.07 | 1.85 ± 0.07 | 1.40 ± 0.14 | ||
| V | 10 °C | 1.15 ± 0.21 | 1.30 ± 0.00 | 1.35 ± 0.07 | 1.55 ± 0.49 | 1.25 ± 0.14 | |
| 22 °C | 1.45 ± 0.07 | 1.45 ± 0.07 | 1.75 ± 0.07 | 3.25 ± 1.90 | 1.86 ± 0.35 | ||
Publisher’s Note: MDPI stays neutral with regard to jurisdictional claims in published maps and institutional affiliations. |
© 2021 by the authors. Licensee MDPI, Basel, Switzerland. This article is an open access article distributed under the terms and conditions of the Creative Commons Attribution (CC BY) license (https://creativecommons.org/licenses/by/4.0/).
Share and Cite
Pathare, P.B.; Al-Dairi, M. Effect of Simulated Vibration and Storage on Quality of Tomato. Horticulturae 2021, 7, 417. https://doi.org/10.3390/horticulturae7110417
Pathare PB, Al-Dairi M. Effect of Simulated Vibration and Storage on Quality of Tomato. Horticulturae. 2021; 7(11):417. https://doi.org/10.3390/horticulturae7110417
Chicago/Turabian StylePathare, Pankaj B., and Mai Al-Dairi. 2021. "Effect of Simulated Vibration and Storage on Quality of Tomato" Horticulturae 7, no. 11: 417. https://doi.org/10.3390/horticulturae7110417