1. Introduction
Aquaponics is a system of integrated, tank-based, aquatic animal (typically fish) culture and hydroponic plant culture wherein the majority of nutrients required for plant growth arise from the waste derived from feeding fish [
1,
2]. The wastes from fish production are used to form all or part of the nutrient requirement to grow plants hydroponically. Whilst aquaponics has a research-based pedigree [
3,
4,
5,
6,
7,
8,
9,
10,
11,
12,
13], the majority of the commercial scale interest is currently small, however this is being progressively translated into a burgeoning commercial industry.
Few studies are available that directly compare aquaponic plant production or growth rates to soil-based culture or hydroponic culture. Aquaponics is a water-based nutrient delivery approach, and is, therefore, similar to standard hydroponic production methods. Hydroponic plant culture methods are some of the most productive methods available for horticulture [
14], and thus serve as a good standard production approach for comparison to aquaponics. In addition, hydroponics is an established, commercial, financially viable horticultural production approach used broadly around the world, and has capital expenditure and costs of production similar to aquaponics, specifically in terms of plant culture. Therefore, if plant production rates within aquaponics can be established relative to hydroponics, this may shed some light on the potential commercial and financial viability of aquaponic plant production methods and techniques.
There is a relatively large internet- or web-based store of aquaponic information, but much of this is anecdotal, with little scientific or technical engineering basis. Claims of increased water use efficiency compared to soil-based farming [
15] are regularly made, as are claims of better sustainability and decreased environmental impact [
3,
16,
17,
18,
19]. However, little by way of comparative, scientific data are available to justify such claims. One major claim by proponents of aquaponics is that it has plant production rates that are far better than traditional, soil-based agriculture [
20,
21,
22], and better than, or comparable to, hydroponics [
13,
20,
23,
24,
25,
26]. Yet, few real scientifically-based comparative trials at commercial scales or within commercial contexts have been performed to actually support these plant production claims, and many small-scale, scientific comparisons have not been based on fully operating aquaponic systems containing fish at the time of the comparison [
13,
20,
26].
A further confounding issue is that when any scientifically-based comparative plant trials have been performed, there is a question with respect to whether the aquaponic system employed is actually an optimized version of aquaponic technology [
10,
27,
28]. This is important, because there are many different variations on aquaponic system design, many of which have never been scientifically tested against other established aquaponic designs (such as that of the long running UVI aquaponic methodology), and have never had any applied scientific analysis in terms of the associated and important determining parameters. In summary there is little, if any, true benchmark data for plant production rates determined for aquaponic systems, and if these styles of experiments have been pursued, it is usually in an environment where the aquaponic system itself is questionable in terms of its optimized productive capacity. This raises the question of whether the aquaponic method is being appropriately represented in comparisons against other plant production technologies or methods.
This study compared plant growth rates in an aquaponic system with those of the established hydroponics industry by way of a semi-commercial scale, side by side comparative approach where the two production technologies were placed in the same greenhouse space, within the same commercial context. The hydroponic system employed was an analogue of a highly successful, commercial hydroponic herb and leafy green production business located in the South Island of New Zealand (Tasman Bay Herbs (TBH)). The aquaponic system design and management approach used in the current study was evolved and developed from work associated with a scientific study that isolated several important parameters, tested those parameters, and optimized them to then demonstrate a specific increase in the efficiency of system operation via several determinants, one of which was the plant productive rate [
29]. This aquaponic system and methodology has also been further developed and applied in several commercial situations, to a point whereby it allows for the exact prediction of specific fish-to-plant ratios, and provides precise plant nutrient supply proportioning for the plants being cultured [
30].
2. Materials and Methods
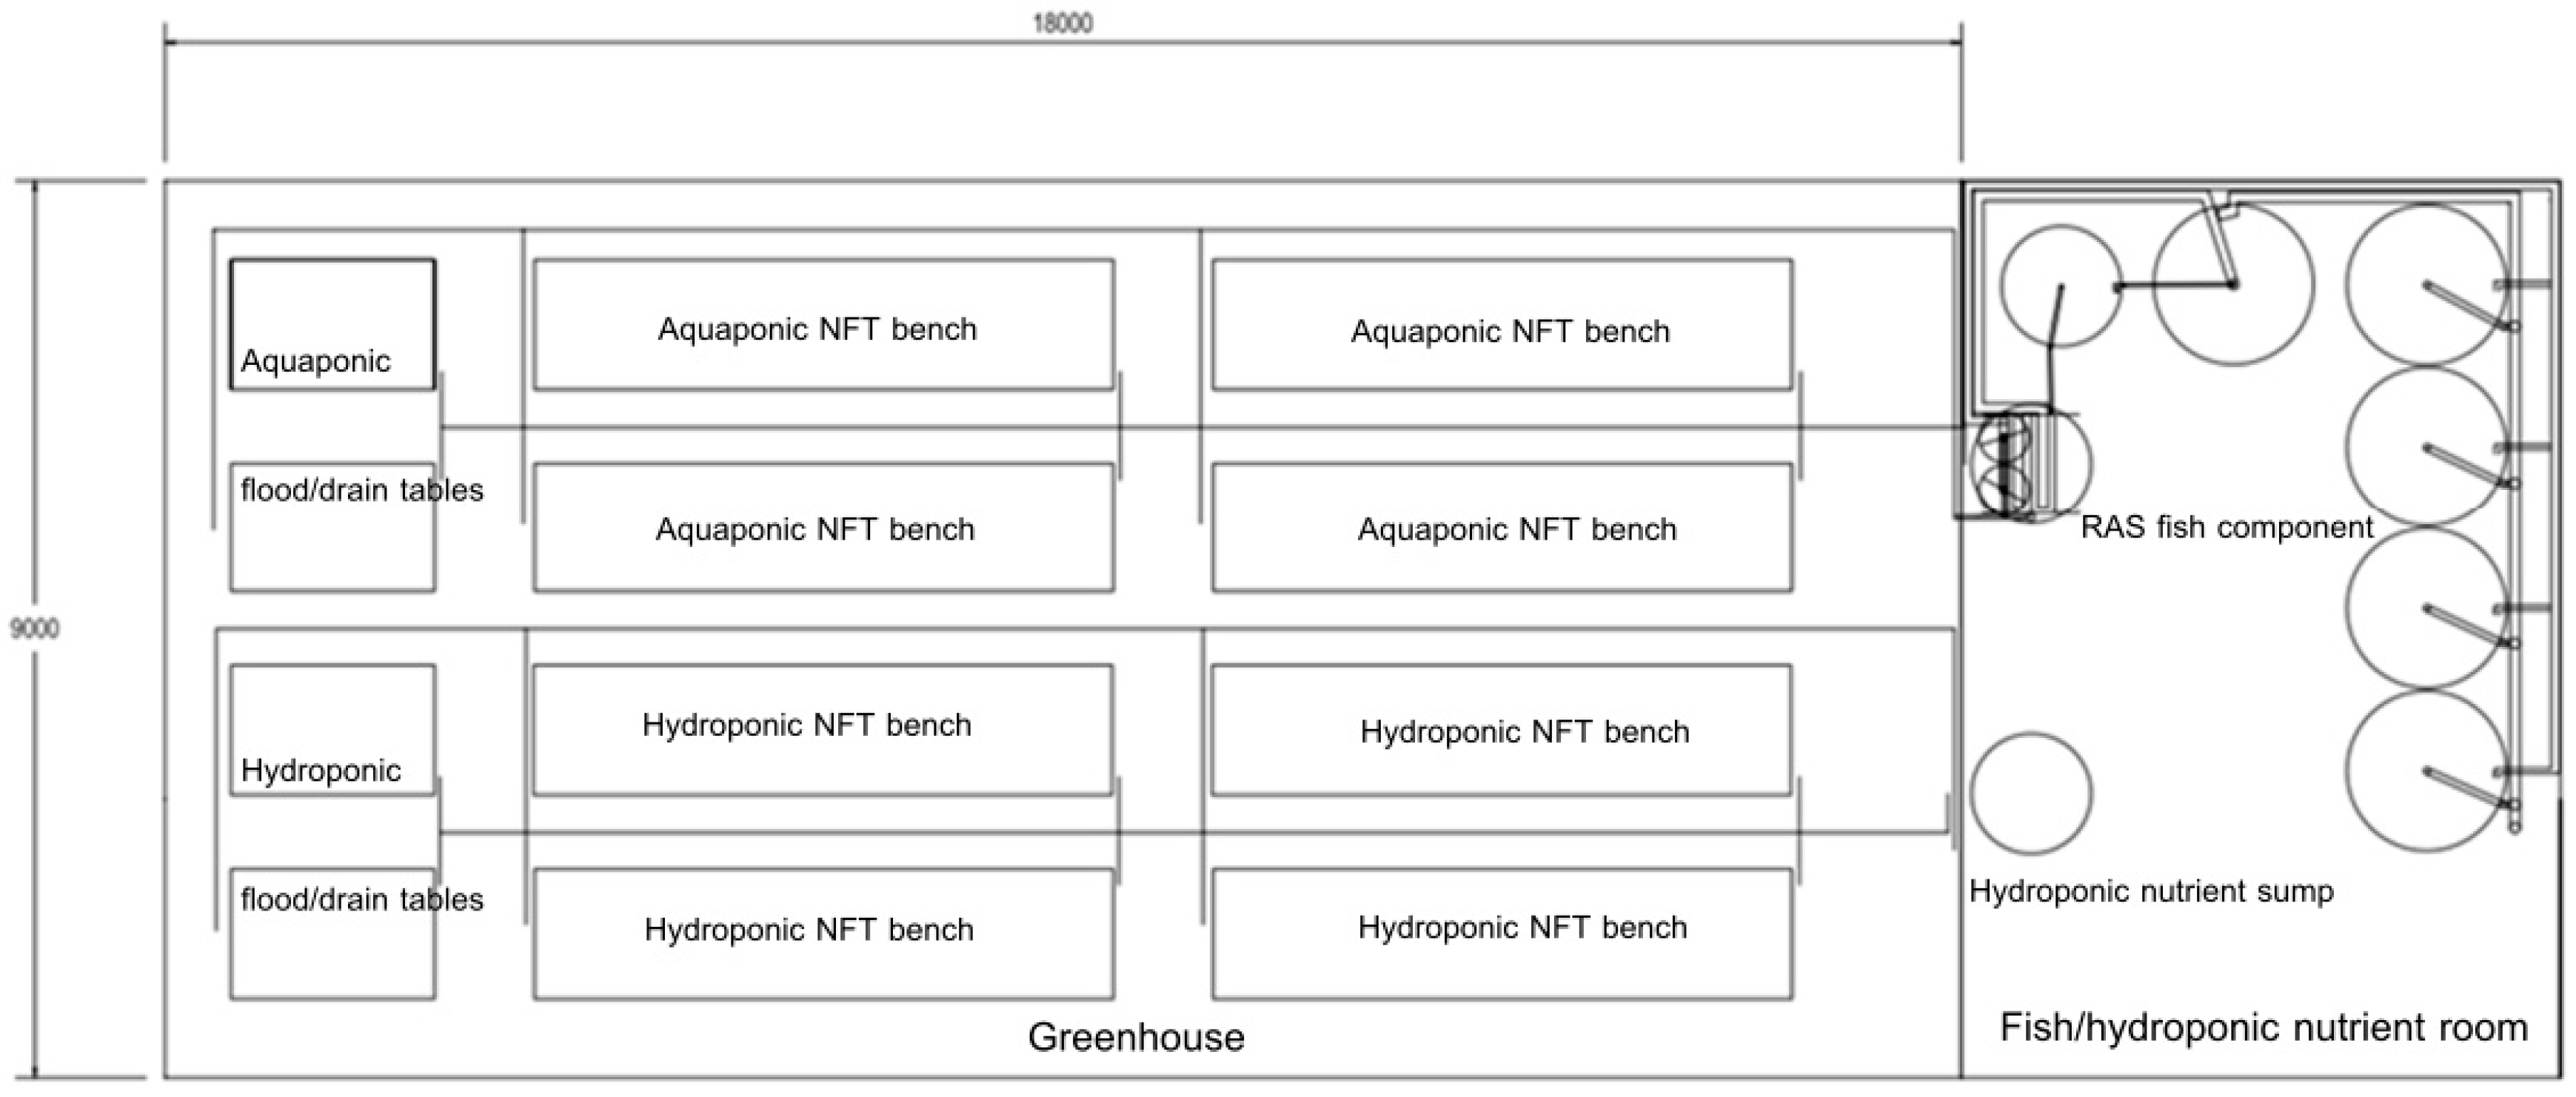
The trials were performed in a gable roofed, ridge vented, dual-layered film-covered greenhouse (9 m wide × 24 m long) set up at a commercial hydroponics business (Tasman Bay Herbs—TBH; Riwaka, New Zealand). The plant growth section of the greenhouse (9 m wide × 18 m long × 4 m high) had full side wall length, roll-up walls for optimised venting, with both these walls and the ridge vents being operated via a computer-controlled system based on greenhouse air temperatures (AutoVent 1 by Autogrow systems). The vents were programmed to be fully opened at 22 °C air temperature.
A 6-m section of the 9-m wide greenhouse was partitioned off, lined, and insulated to act as the room to contain the recirculating fish system, the hydroponic nutrient sump, and dosing system. The room was produced by constructing a ceiling with a square netted wire (hole size of approximately 200 mm × 200 mm; 18-gauge wire), and insulating above it with standard fibreglass insulation bats. The walls were similarly insulated with bats held in position by wire mesh and covered with white plastic film for moisture proofing. The floor of this fish room was completely concreted.
The plant growing zone of the greenhouse was set up so as to allow for a side by side comparison of the two test systems—standard hydroponics and aquaponics (
Figure 1).
The hydroponic system consisted of a standard sump tank (2000 L plastic-lined, concrete tank sunk into the ground) with a standard, automated part A and B dosing unit (Bluelab Dosetronic system by Blue Lab). The hydroponic system pH was controlled by an automated acid dosing unit using a mixture of 90% nitric acid and 10% phosphoric acid (the same Dosetronic system). The greenhouse hydroponic system contained four benches of NFT hydroponic channels; each bench was 6 m in length with 10 channels per bench (total surface area per bench of approximately 7.2 m2, with a total hydroponic production area of 28.8 m2). The total number of plant growth holes in this hydroponic NFT array was 1800, and the plant spacing was based on those used for commercial hydroponic herb production by TBH (i.e., 150 mm hole centres). In addition, above these channels, a smaller, nursery phase NFT channel array was placed for the early stage production of plants. Therefore, a multi-component production approach was utilised—germination benches, nursery NFT, and grow-out NFT. This configuration was based on TBH’s successful hydroponic culturing approach for herb varieties.
A nutrient solution was fed to the NFT channels via standard PVC manifold pipes and associated, dual “feeder” tubing to each individual channel. This was a recirculating NFT approach, with all of the water that exited the NFT channels being directed back to the hydroponic sump. Regular sump tank “dumping” (i.e., full nutrient tank water and nutrient replacement) was performed when the nutrient solution was deemed to have drifted from the ideal mixture of nutrient ions (approximately every six to eight weeks). The water temperature control was based on the heating of the air in the insulated room. The system layout did not represent an optimised use of the available space, as wide walkways were required for demonstration and large group access purposes.
The aquaponic system was designed utilising a design and management approach to aquaponic fish-to-plant ratio establishment developed by Aquaponic Solutions Australia, called Symbioponics
TM [
30,
31]. This aquaponic design and management approach is based on providing optimised fish-to-plant ratios and an associated management approach associated with the specific nutrient requirements required by the plant species cultured [
30].
The aquaponic system consisted of two major components—an NFT array of the same design as the hydroponic an NFT array (as outlined above), and an integrated recirculating aquaculture system (RAS) culturing fish. The aquaponic and hydroponic plant culturing components each occupied half of the greenhouse floor area.
The recirculating fish culture system consisted of fish culture tanks, a swirl sedimentation filter, a static solids screen filter (100 µm pore size), a trickling biofilter, and a sump. This fish culture system operated on its own recirculating configuration and the sump acted as the point of common water sharing between the two components.
All of the fish waste solids were separated from the main fish system water flow via a swirl filter tank and screen filters. These fish waste solids were placed into a separate, aerated bioreactor tank for re-mineralisation and eventual re-dissolution into water (aerobic re-mineralisation bioreactor). The nutrient-rich supernatant was then regularly added back into the main aquaponic system for 100% utilisation of the fish waste nutrients by the plant culturing component.
The fish species used was Grass Carp, Ctenopharyngodon idella, an Asiatic carp species. This was one of the few fish available for aquaculture in New Zealand, and was therefore adopted for this trial. The results of the fish culture and growth were collected during the entire study, but have not been reported here.
A number of comparative experiments were set up and performed using the above outlined systems. The major parameter for testing and comparison was that of plant growth, as measured by the plant weight over the same growing period. All of the seedlings were produced in the nutrient solution of the respective culturing system (i.e., hydroponic or aquaponic) on standard ebb and flow seedling production tables. The growing medium used for all of the seedlings in all of the trials was Rockwool.
All of the plant hole spaces in all of the NFT channels in both arrays (hydroponic and aquaponic) were planted with seedlings of the same age. The plant leaf/head initial weight (i.e., the weight of the leaf biomass of the seedlings at planting into the NFT stage) was determined by randomly selecting 20 seedlings from each seedling production system, removing the Rockwool block and roots, and weighing the fresh leaf material. The total seedling biomass was then used to calculate an average weight per seedling [
29].
The plants were cultured for the determined growing period (measured in days and determined by the season of culture) in the hydroponic NFT array or the aquaponic NFT array. All of the plants therefore experienced the same environmental conditions of growth within the same greenhouse, no matter what growing system (hydroponic or aquaponic) they were cultured within. At the end of the culture period, 30 plants were randomly selected from each growing system, the roots and Rockwool block were removed, and the fresh leaf tissue biomass was determined by weighing. The individual leaf biomass increase per plant was determined by subtracting the average seedling leaf fresh weight from the individually grown plant leaf fresh weight. The resultant individual leaf biomass increase for each plant was then used to calculate an average leaf biomass increase for each system (hydroponic and aquaponic). The biomass gains for each crop grown in the two systems (aquaponic and hydroponic) were reported as the plant biomass means ± standard error (SE).
Ten of the 23 herb crops compared for growth were subjectively compared for quality and suitability-for-sale by a blind analysis performed by the herb picking and selection staff at TBH. The total harvested sample of aquaponic and hydroponically cultured herbs were placed in front of the TBH selection staff, unlabelled and unidentified in terms of which growing method they were cultured within. The staff then manually selected the herbs that were deemed to be a suitable standard for packaging and sale, and separated them from those deemed unsuitable for packaging and sale. Both cohorts (suitable and unsuitable for packaging and sale, and both aquaponic and hydroponic origin) were then weighed, allowing for the percentage suitable for sale to be recorded.
The aquaponic vs. hydroponic plant growth trials that were conducted in the greenhouse from December 2009 to December 2010 were separated into three main sets, namely:
Aquaponic vs. hydroponic NFT head lettuce production comparisons
Aquaponic vs. hydroponic NFT herb species production comparisons
Aquaponic vs. hydroponic subjective herb species quality comparisons
There were seven lettuce (Lactuca sativa L.) cultivars grown—Gaugin, Princess, Explore, Ashbrook, Satre, Robinio, and Obregon—and four herb species grown—dill (Anethum graveolens L.), rocket (Eruca sativa), coriander (Coriandrum sativum L.), and parsley (Petroselinum crispum).
To summarize, in all of the comparative trials, the plants in both systems were sourced from the same seed stock. The seeds were germinated in ebb and flood benches using the associated nutrient solution (hydroponic or aquaponic). All of the seedlings were removed from the seed germination benches, and placed into the associated NFT culturing area at the same time. All of the plants from the two systems (hydroponic and aquaponic) were harvested, and the fresh weights were recorded at the same time. Therefore, all of the plants existed in their respective culturing environments (hydroponic or aquaponic) for their entire culture period, all of the plants were grown for the same culture time, and all of the data were recorded at the same time. This ensured that all of the plants from the two systems were directly comparable to each other.
4. Discussion
The results of the current trials demonstrated that the aquaponic system supported the growth of the herbs and head lettuce. In the vast majority of cases, the aquaponic method either equalled or bettered the standard hydroponic methods for the plant growth (production) of lettuce and herbs, and subjectively bettered the hydroponic method in the saleable plant quality of the herbs. Among the lettuce cultivars, in all of the comparisons, the hydroponic system did not provide one case of better production than the aquaponics. Among the herbs, 6 out of 23 comparisons resulted in a better result from the hydroponic system, with the other 17 comparisons producing either equal or better results from the aquaponics system. Two of the rocket crops performed better in the hydroponics system, and this may indicate that rocket does not adapt as well to aquaponic culture as other herbs. The six crops that performed better in hydroponics were within the Southern Hemisphere in the months of May and June (late autumn and early winter), when the aquaponic system water temperatures were falling and the fish feeding rate substantially fell, therefore, inhibiting the provision of suitable nutrients for the plants.
The lettuce production results represented the lettuce growth in both systems across all seasons. This therefore suggests that aquaponics may be reasonably expected to match traditional hydroponics in production rate, at least for the lettuce varieties used, across the entire calendar year. The herb culture comparisons were only performed across five months of the year; however, the results demonstrated that a large range of commercial herb varieties also adapted positively to the aquaponic method, and should be expected to perform very well across at least half of the calendar year.
There is little scientific precedent of aquaponic plant growth rates directly compared to the hydroponic plant growth rates or saleable plant quality. A study by Savidov [
20] compared plant growth rates (shoot height, weight) in an aquaponically-derived nutrient solution to a hydroponic solution for several crop species (cucumber (
Cucumis sativus L.), tomato (
Solanum lycopersicon L.), basil (
Ocimum basilicum L.), rosemary (
Rosmarinus officinalis L.), and
Echinacea spp.), and demonstrated that in many of the comparisons, the aquaponic nutrient produced equal or greater shoot weights (leaf weights) when compared to the hydroponic solution. However, those experiments used an aquaponic nutrient solution derived from a larger aquaponic system containing fish, and in the tests themselves, no fish were held. This meant that no ongoing nutrient supply was provided by the regular feeding of the fish, and the experiments therefore only lasted for the term that the nutrient solution would last. It is questionable whether such a method represents the plant growth potential of a fully operational aquaponic system.
Pantanella et al. [
10] compared the aquaponic plant growth and yield to a standard hydroponic nutrient solution. The aquaponics nutrient supply was tested using several different fish stocking densities (5, 8, 16, and 20 kg/m
3, respectively), and the resultant plant growth (Romaine lettuce varieties) compared to a standard hydroponic nutrient solution demonstrated the that plants in the aquaponics performed well, with no significant differences between the aquaponics and hydroponics in the plant growth rate at the higher fish stocking densities.
Delaide et al. [
13] compared the nutrient complemented RAS production water (i.e., nutrients were added to water from a fish-only, separate, stand-alone RAS to match the water nutrient mixture and strength example of Rakocy et al. [
32], denoted as an “aquaponic analogue” by Delaide et al. [
13]), fully nutrient complemented RAS production water (RAS production water with added hydroponic nutrient salts to meet a water nutrient mixture and strength as used for standard hydroponics—denoted as a “decoupled aquaponics analogue”), and a hydroponic control (standard hydroponic nutrient solution). In terms of the plant growth rate, the aquaponic water analogue equalled the hydroponic control, and the decoupled aquaponic analogue water bettered the hydroponic control. However, similar to Savidov [
20], these were not fully operating aquaponic systems containing fish, and therefore the same question arises, as to whether the results represent the plant growth potential of a fully operational aquaponic system.
Goddek and Vermuelen [
26] compared lettuce growth in a hydroponic analogue (rainwater with hydroponic nutrients added to achieve a desirable nutrient concentration or conductivity—1800 µS/cm) to that in an aquaponic analogue (30% RAS water plus 70% rainwater plus added hydroponic nutrients in order to achieve the same desirable nutrient concentration or conductivity), and demonstrated a greater growth of lettuce in the aquaponic analogue. Again, this study demonstrated the potential of aquaponics to provide advanced plant growth rates, but not within a normally operating aquaponic context with fish actively eating.
The studies of Delaide et al. [
13] and Goddek and Vermuelen [
26] were, at least in part, predicated on the fundamental notion that hydroponic standards of nutrient strength and mixture represent the “ideal” situation for water-based, terrestrial plant culture, and that, therefore, these hydroponic standards must be adhered to for ultimate aquaponic method optimisation for maximising plant growth and production. However, the nutrient strengths and mixture standards (often represented by conductivity as a measure) applied by the standard hydroponic industry were developed in a different context than aquaponics; most notably, hydroponics is a sterile (and indeed actively sterilized) aquatic environment [
14,
30], whereas aquaponics mostly utilises, and depends on, an aquatically unsterile environment with an associated dense and diverse microbiological community present [
30,
33]. Microbial assistance to nutrient uptake by terrestrial plants is a well-known assistive pathway that improves the overall plant growth rates in soil environments. Because hydroponic systems are sterile, they often require relatively high nutrient concentrations in order to achieve advanced growth rates [
14]. Aquaponic systems contain a diverse and dense community of microbial flora [
33], often with similarities to those found in soil-based systems [
30]. If it is accepted that this microbial community assists plant nutrient access and uptake in aquaponic systems [
33], and it is noted that aquaponic systems contain lower percentages of ionized or “charged” nutrients (the only nutrients that will register using conductivity as a measure) [
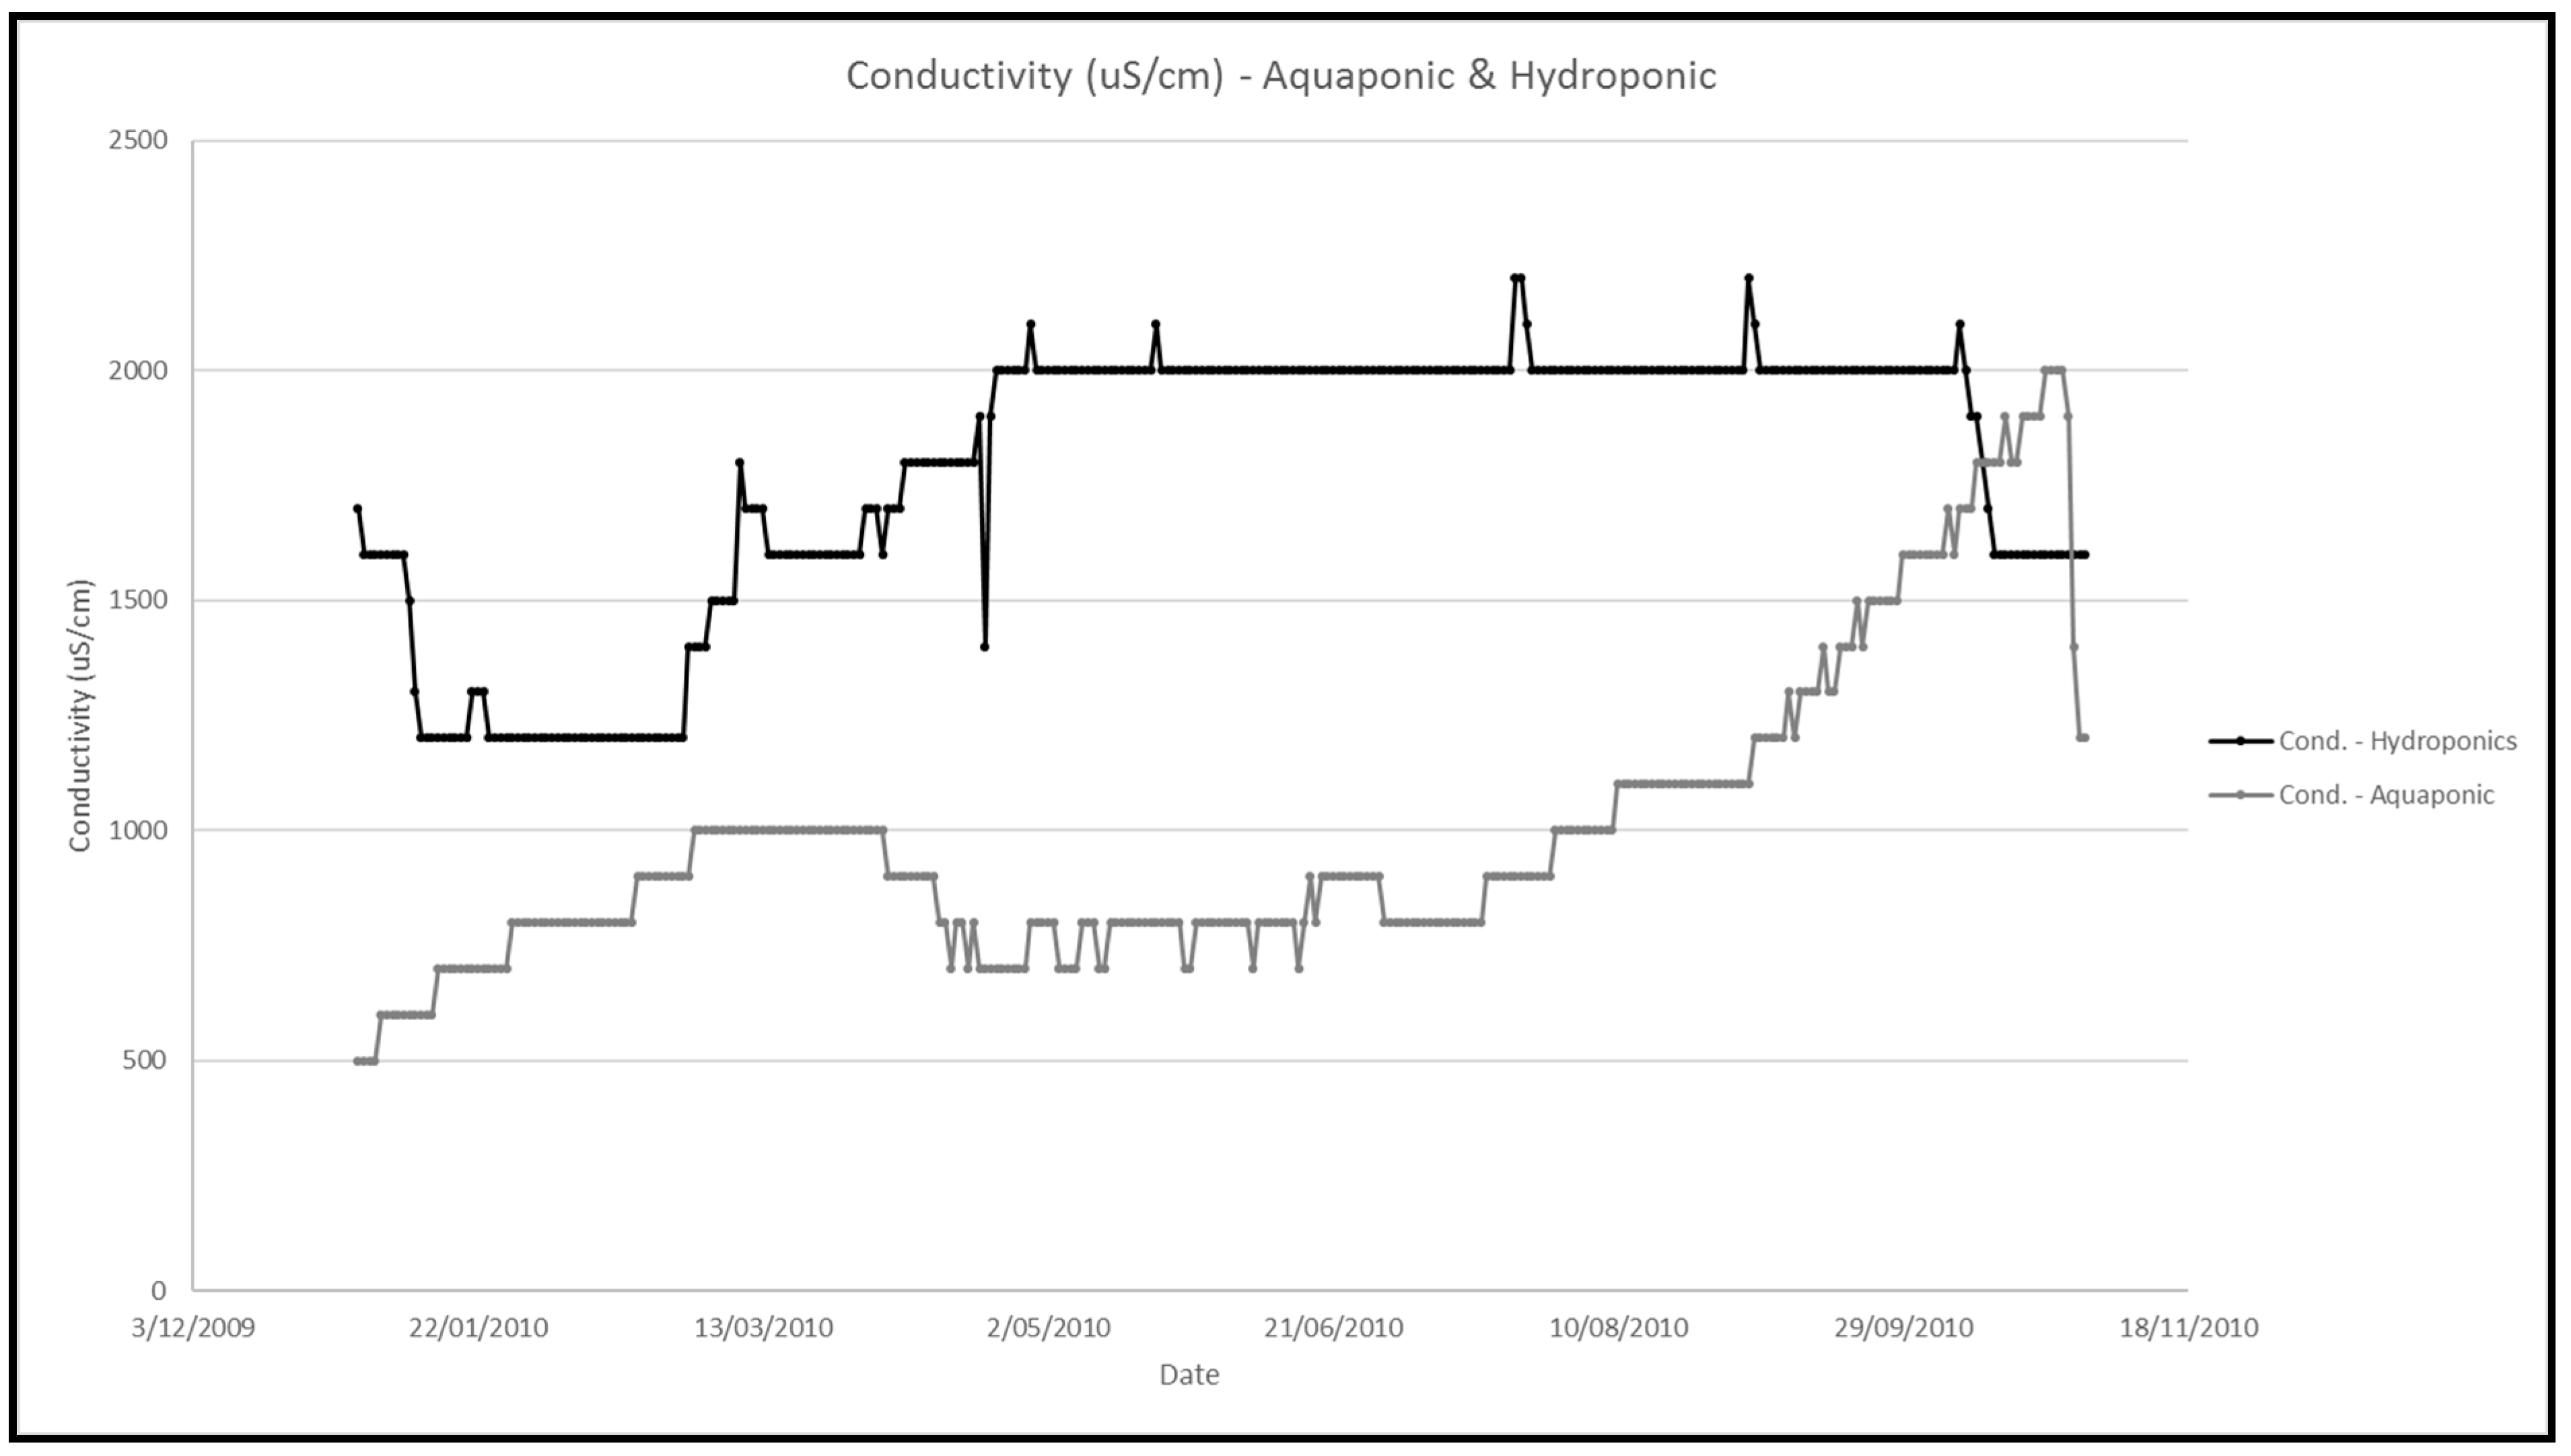
30], then it would be reasonable to surmise that aquaponic systems may be able to operate at lower nutrient concentrations (measured as conductivity) than standard hydroponic systems, and be able to achieve similar plant growth rates. The current study supports this hypothesis, because the aquaponic system operated at conductivity levels well below those of the hydroponic system (
Figure 4), yet the aquaponic system consistently produced plant growth rates equal to, and often better than, the hydroponic system to which it was directly compared. This phenomenon of increased plant growth rates with lower nutrient concentrations in aquaponic systems is not limited to the current study, with several studies demonstrating similar or better plant growth outcomes in aquaponic compared with hydroponic systems [
10,
20,
34,
35,
36,
37].
Authors of some studies [
13,
26] have argued for and used standard hydroponic nutrient solution strengths as the calibration point for the nutrient strength applied in their aquaponic analogue nutrient solutions (which, it may be argued, do not represent a true aquaponic method with the complexities associated with a multi-trophic, ecologically active approach containing actively metabolising fish, plants, and microbes), even though just as many studies [
10,
20,
34,
35,
36,
37] have demonstrated that nutrient strengths far lower than hydroponic standards produce similar, advanced plant growth rates. In addition, others have argued that one of the barriers to upscaling fully recirculating aquaponic methods is their inherently low nutrient concentrations [
2], even though the current study and the other noted studies [
10,
20,
34,
35,
36,
37] demonstrated that fully recirculating methods can produce similar, advanced plant growth results at lower nutrient concentrations. Several such methods have been replicated and up-scaled at far larger, commercial scales [
30].
The key association in traditional recirculating aquaponics providing the operational balance between fish and plant culture components of the integrated system is the fish-to-plant ratio, standardised as the feeding rate ratio [
6]. The feeding rate ratio is the grams of fish feed provided per square meter of plant growing area per day (g/m
2/day) [
6]. Therefore, it is the amount of fish feed that enters the aquaponic system on a daily basis and that is eaten and converted to waste products by the fish that determines the overall plant nutrient provision, rather than any specific stocking density of fish or any applied technological approach [
30]. From the data provided in some studies [
10,
13,
20,
26], it cannot be determined whether a realistic or adequate feeding rate ratio was actually attained, and, therefore, whether the aquaponic system [
10] or the aquaponic solution analogues [
13,
20,
26] represented plausible examples of aquaponic systems, and, hence, whether the nutrient supplies and plant performance observed were representative of real-world aquaponics system performance.
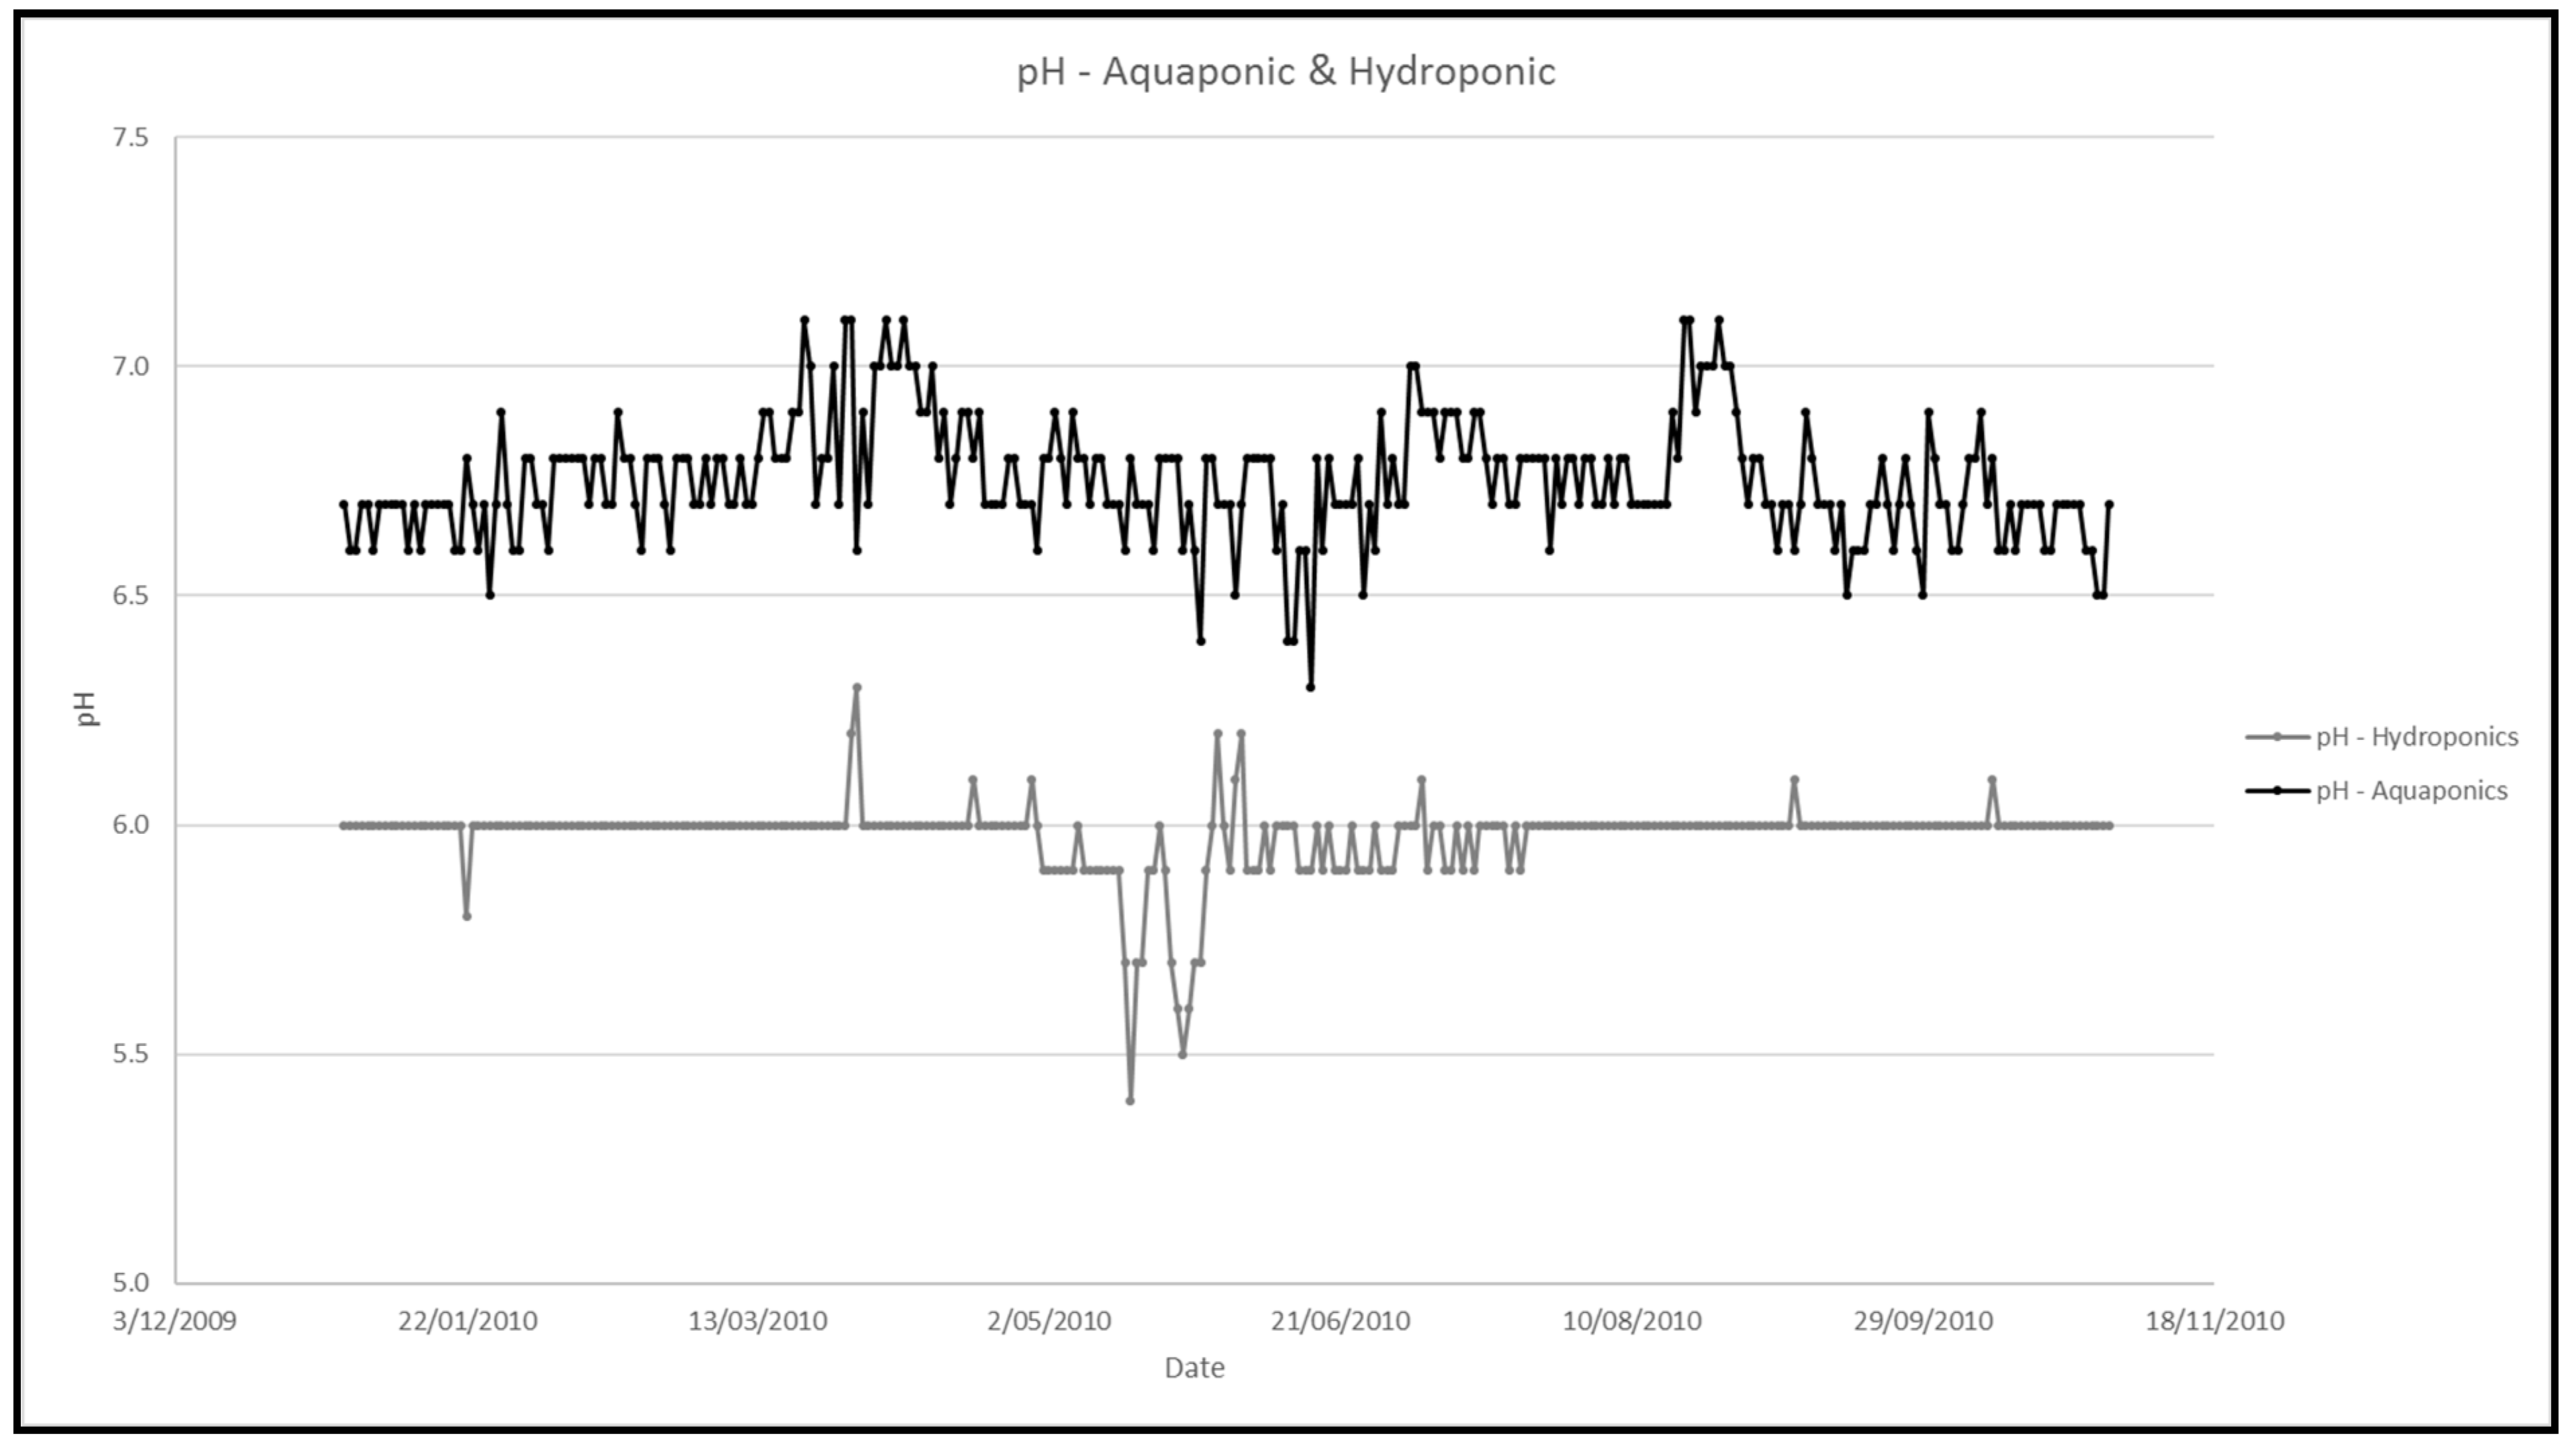
The current trial used a specific modelled aquaponic approach that was developed to provide the correct plant nutrient supply (in terms of the mixture of nutrients), which associated two main effectors—a mathematically modelled fish-to-plant ratio that is customised to each specific variety of plant and fish that is cultured, and an associated management approach whereby specific aquaponic solution pH control buffer formulations are applied based on the plant variety being cultured and on the plant’s associated, specific nutrient mixture requirements [
27,
29,
30,
31,
35]. This specific aquaponic method was evolved and developed in a scientific context in order to attempt to ensure correct and adequate plant nutrition so as to optimise plant production using the available fish waste, via nutrient mass balance modelling and balancing [
30]. This is an important point to consider when comparing hydroponic plant production with aquaponic plant production. Hydroponics is a well-developed technology and there is much precedent for intra-hydroponic method and nutrient solution plant growth comparisons [
14,
38,
39,
40]. However, aquaponics is a relatively new field, and therefore, few, if any, scientifically verified, standardised models for the technology have been produced or made publicly available. This could potentially lead to a situation where sub-standard aquaponic approaches are being compared to standardised hydroponic models, with poor outcomes for the aquaponic technique overall. Therefore, a comparison of aquaponic to hydroponics methods should only be done when the veracity and standardisation of the aquaponic technique, model, or method has been scientifically verified. As an example, Lennard [
29] specifically optimised the aquaponic system he was developing before comparing it to a standard hydroponic nutrient solution system. Via a series of experiments, he isolated and optimised a number of parameters that would lead to the optimisation of the aquaponic system for both plant growth and nutrient removal [
29]. Once the system was optimised, that study produced identical plant growth results (for a Green Oak lettuce variety) in terms of yield per square meter of plant growing area in a lab-based, aquaponic model (5.77 kg/m
2), as compared to a standard hydroponic model (5.46 kg/m
2) [
29].
Lennard [
29] demonstrated a 97% removal rate of nitrogen from an aquaponic system (when compared to a fish-only control), but also noted the potential for other nutrient deficiencies if the system was not designed and managed correctly. No plants exhibited any signs of nutrient deficiency throughout the current trials. The quality and suitability-for-sale of the aquaponically-grown herbs was confirmed in the data collected to compare the two crops (aquaponic and hydroponic) by the amount of crop that was accepted as “saleable” under the strict TBH quality standards (
Table 8). The aquaponic herb crops produced higher percentages of saleable product (after TBH grading methods were applied) in all but 1 of the 10 comparisons performed, demonstrating that the aquaponic herbs consistently outperformed their hydroponic equivalents in this measure. This demonstrates that the herb crops produced via the aquaponic method applied here possessed a quality that was suitable for the marketplace. No other studies producing quantitative or qualitative plant quality data from an aquaponic production system context have been identified.
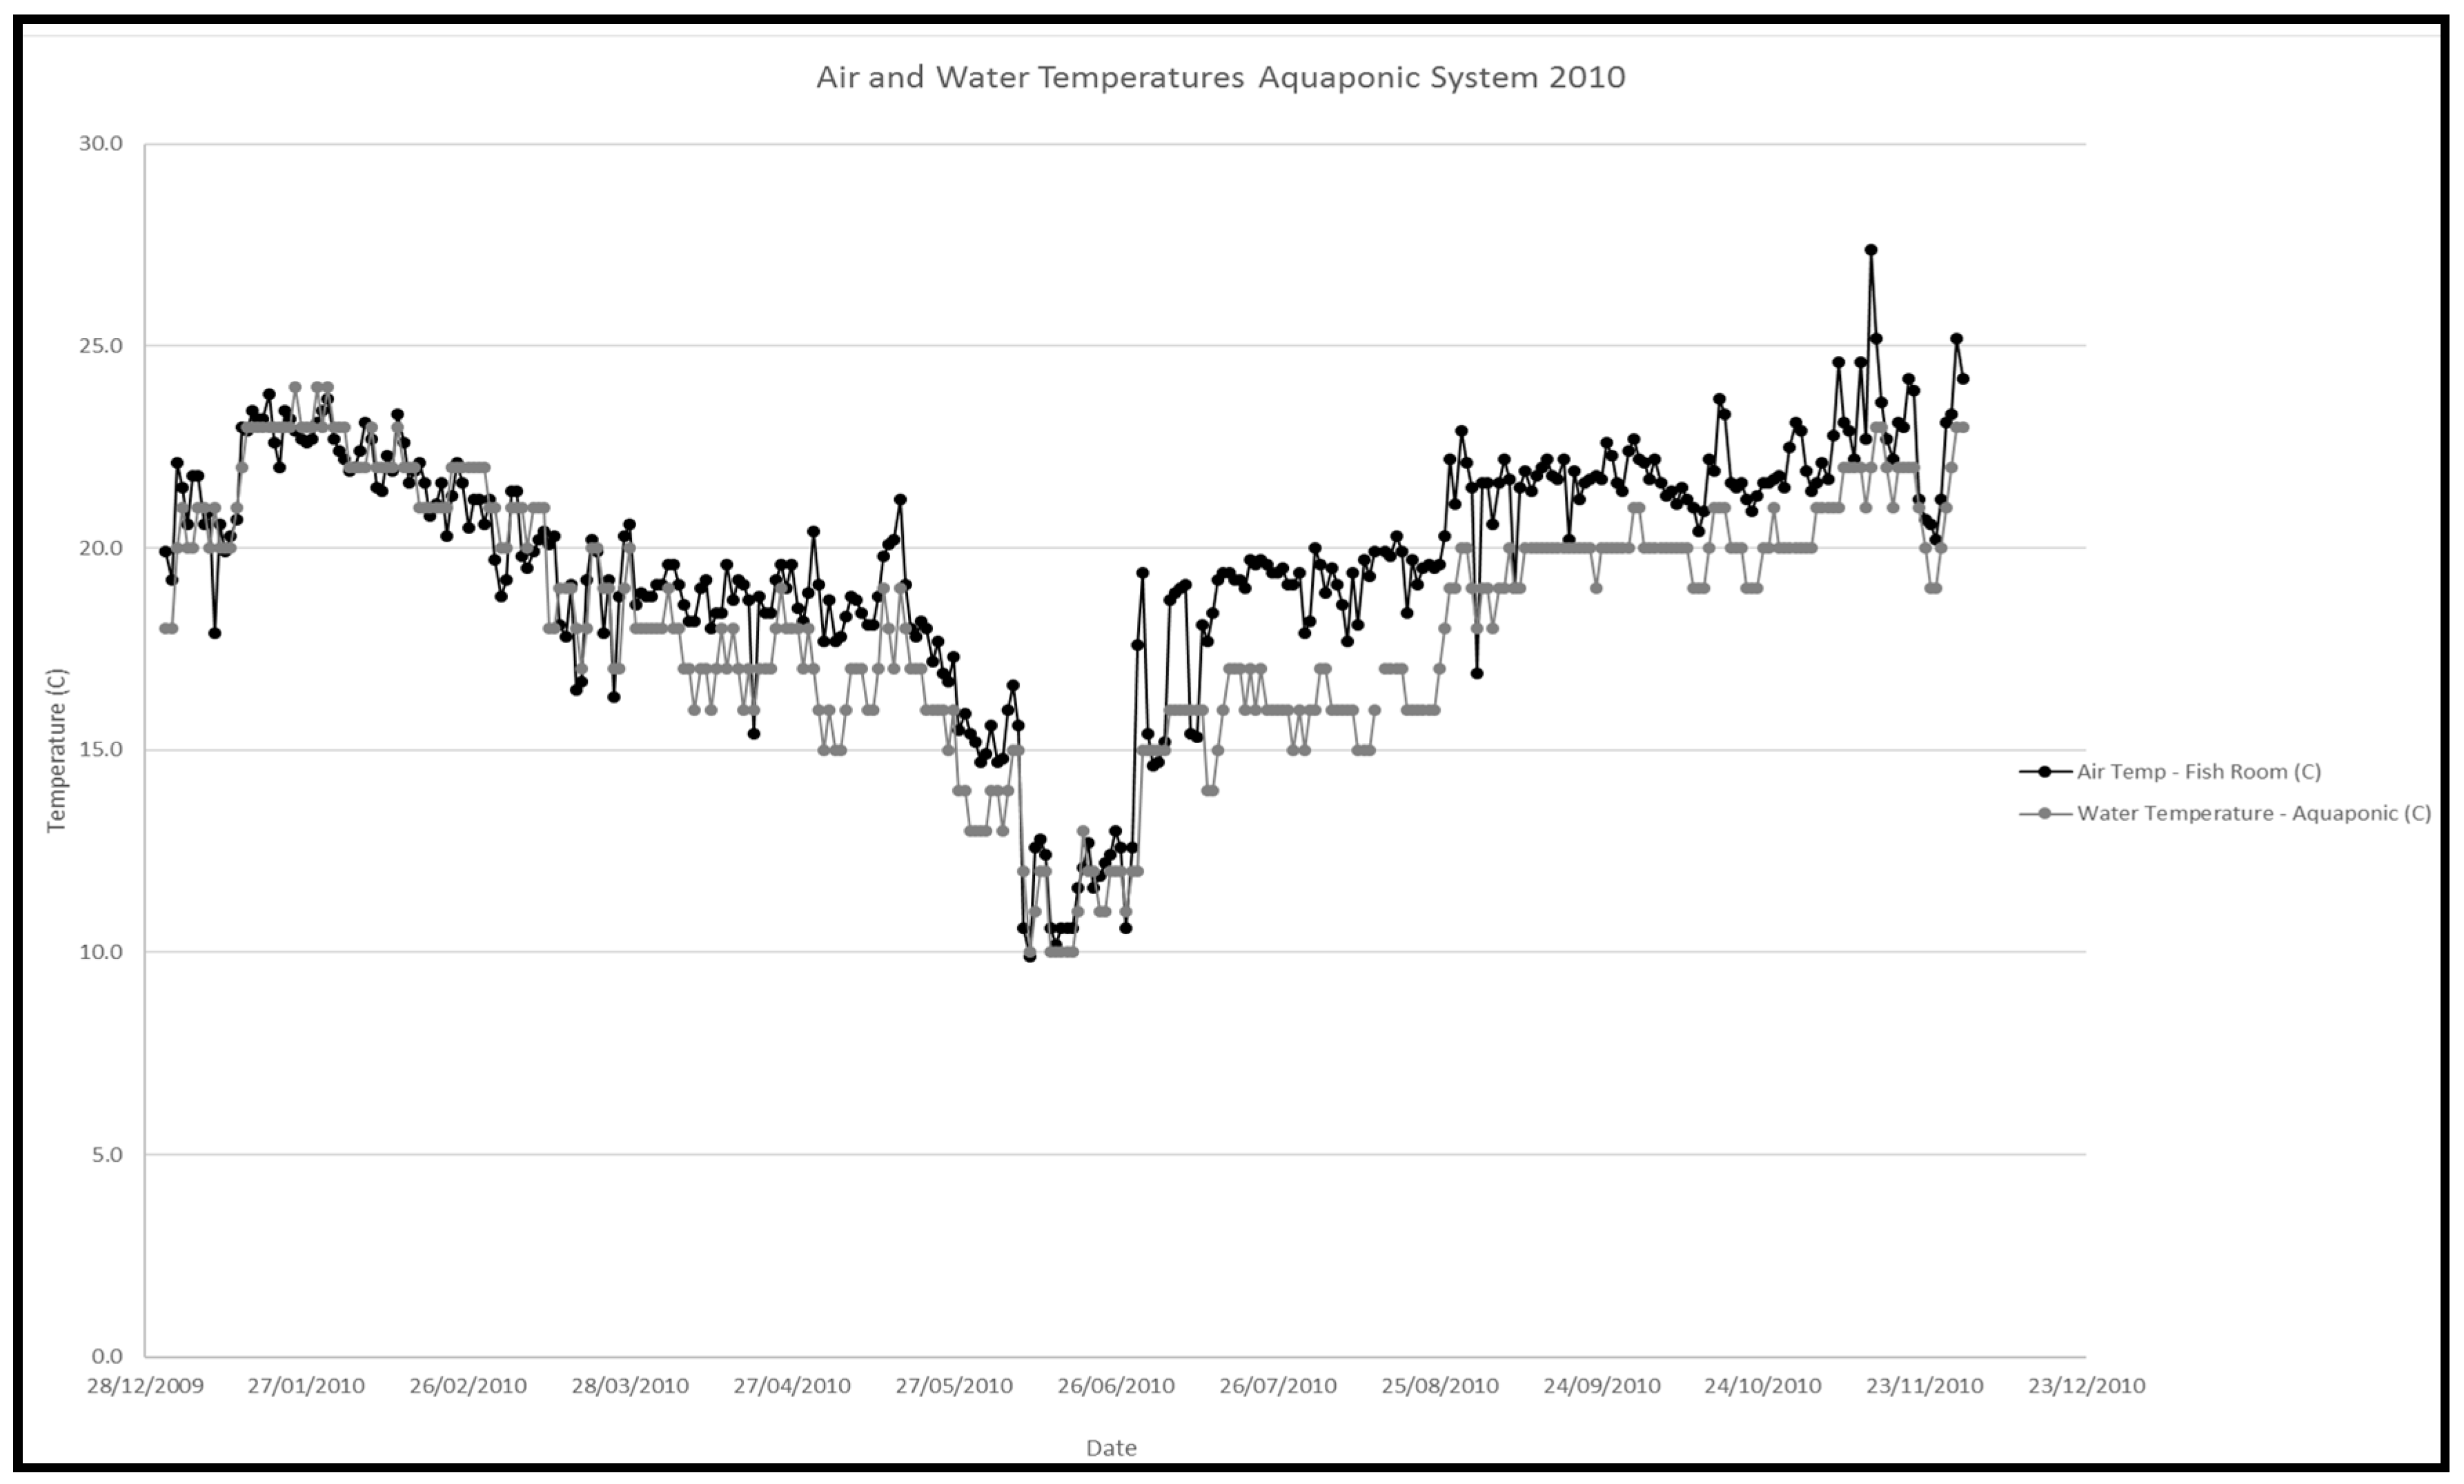
Several issues or problems were encountered during the current trials, but do not seem to have grossly affected any of the quoted production results. Problems included some poor component choices and some operational errors. The major issue related to the current trials was the employment of the NFT hydroponic culturing technique itself. The trial greenhouse did not use an active greenhouse temperature control (i.e., heating in winter, cooling in summer). As winter approached, the air temperature in the greenhouse (data not included) and fish room (
Figure 2) began to fall, and because the NFT approach had an inherent high surface area to low water volume ratio, this meant that the NFT arrays of both systems (hydroponics and aquaponics) acted as highly efficient water heat/loss devices (in effect, they acted as large radiators of water temperature). This resulted in low water temperatures in both of the systems in the colder months (
Figure 2).
Because both systems were similarly affected in terms of water temperature, the water temperature was consistently similar in both systems, so can be ruled out as a point of specific difference (hydroponic data not reported here). However, the fish used in the aquaponics system, Asian Grass Carp (
Ctenopharyngodon idella), require water temperatures above 16 °C for proper metabolism and for regular, optimised feeding behaviour [
41,
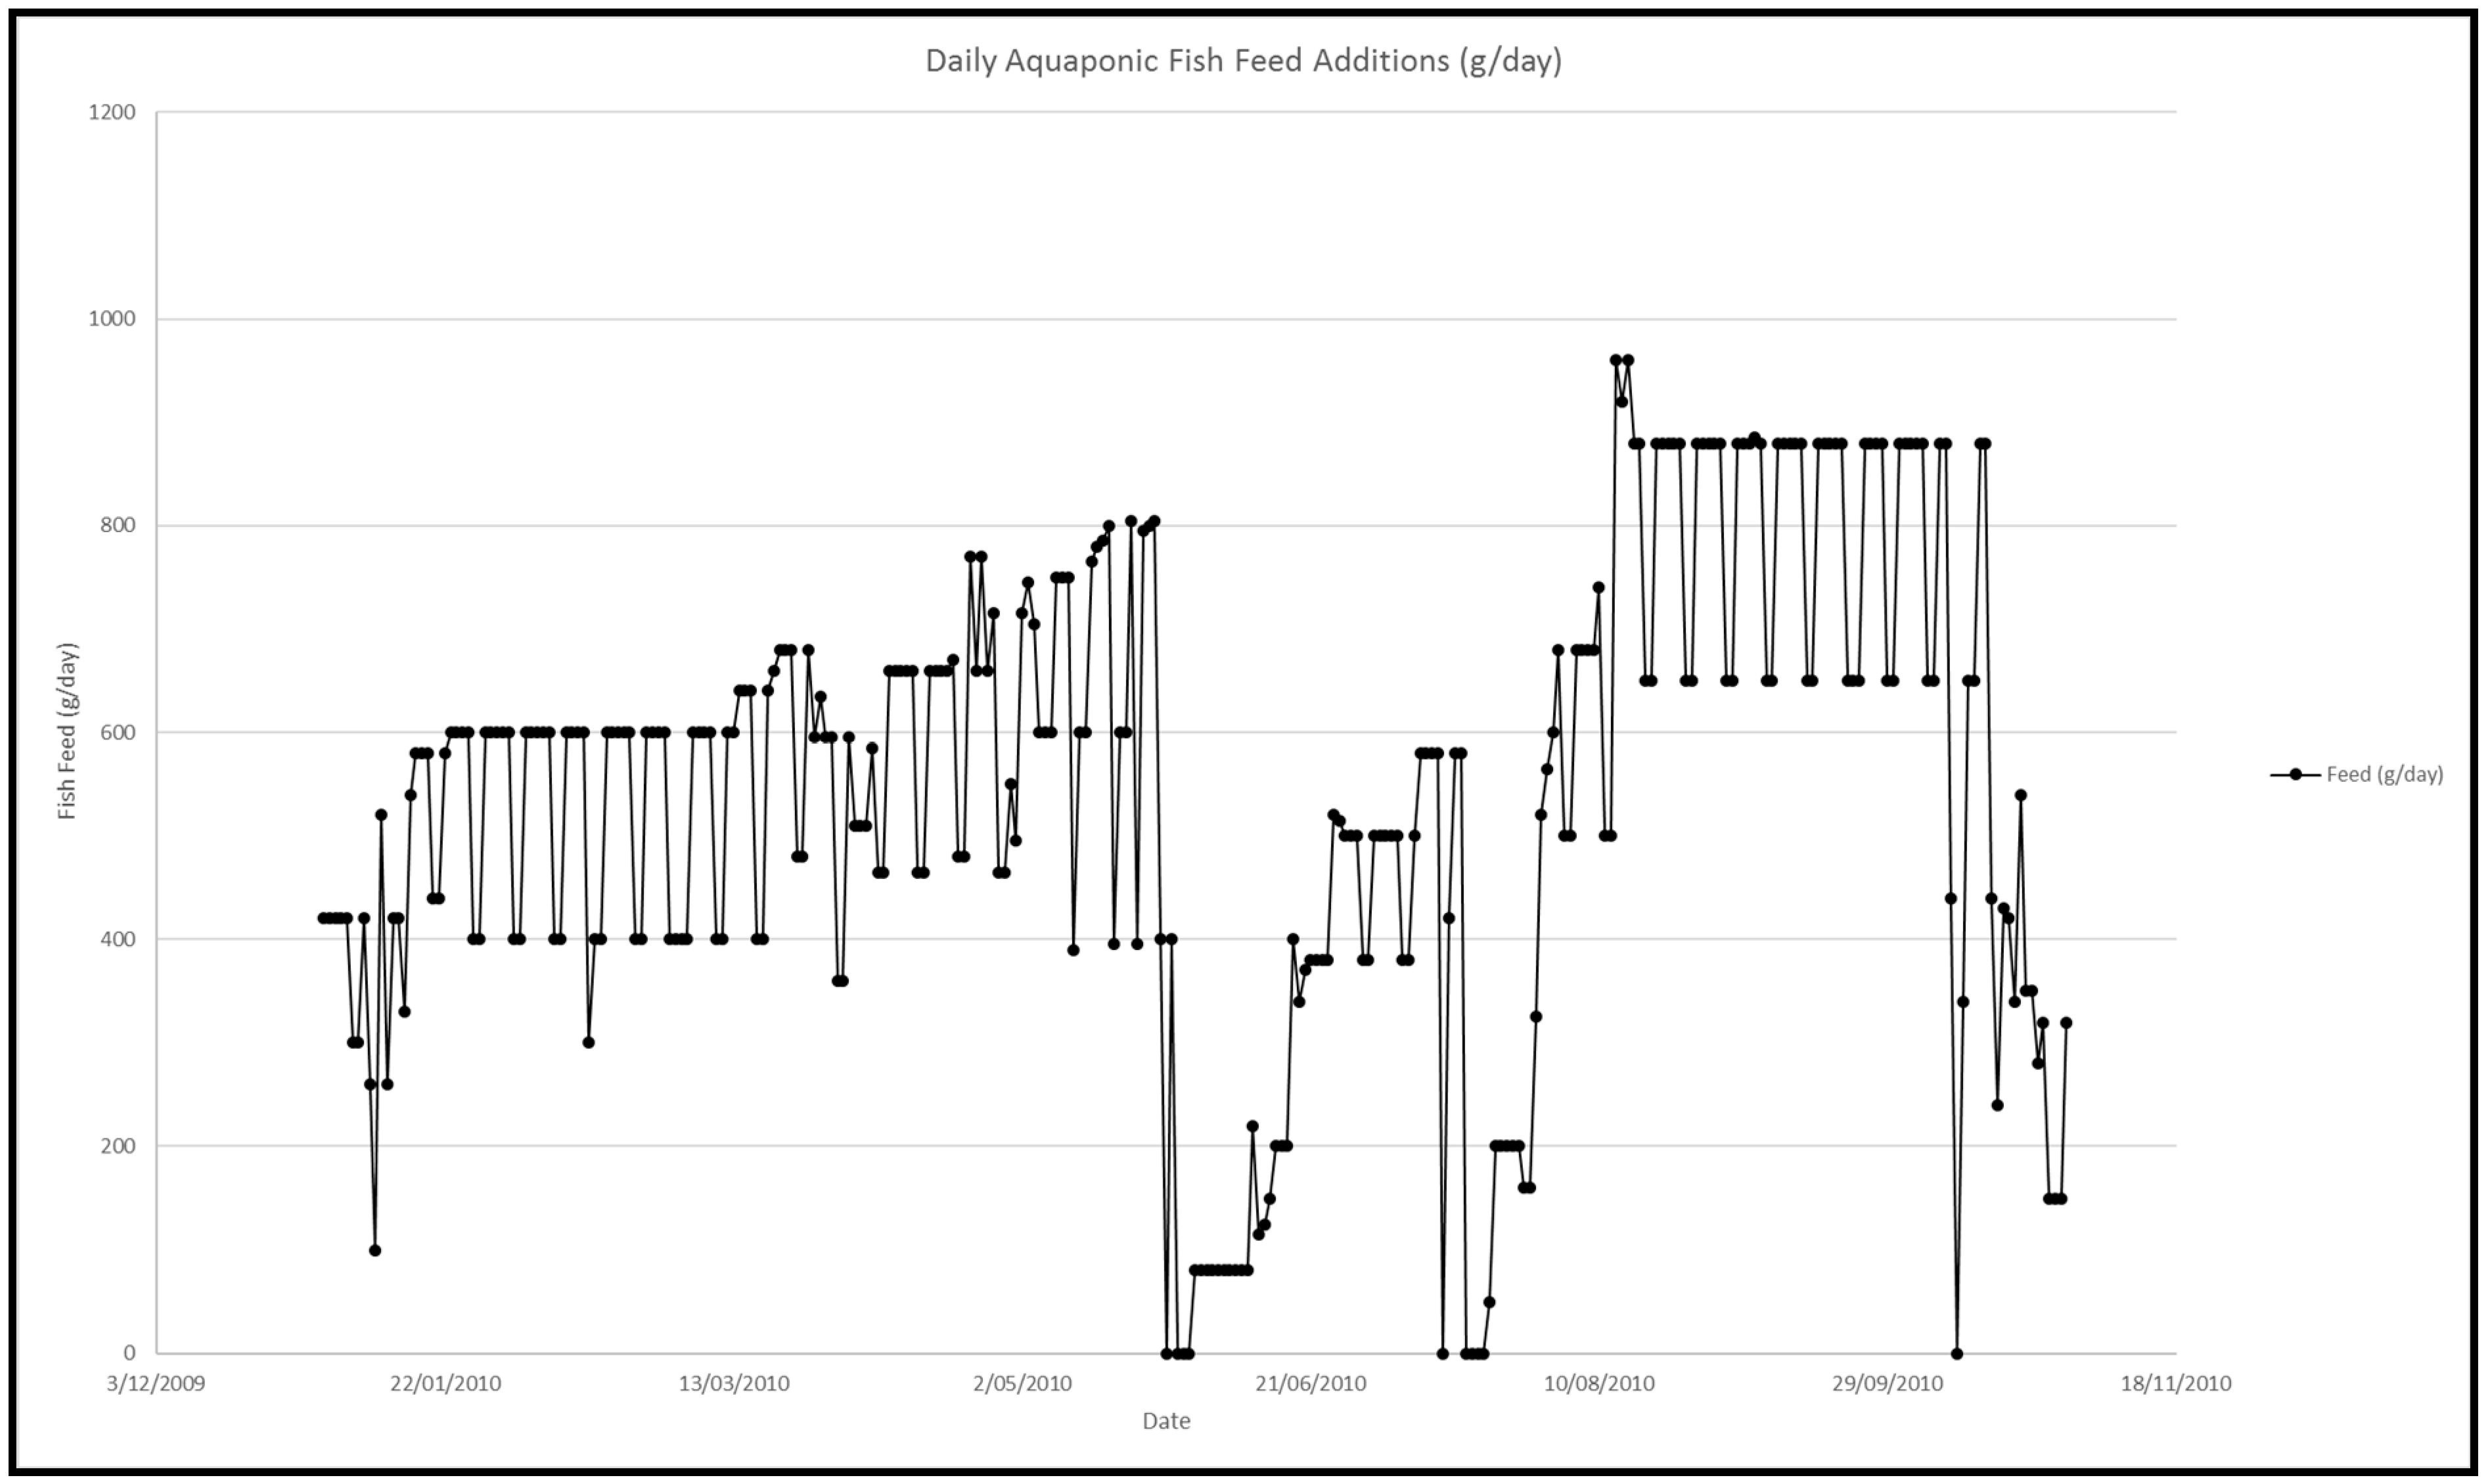
42]. Therefore, whilst the drop in water temperature did not affect the plants directly, it affected the fish. This led to a substantial lowering of the fish feeding rate (
Figure 3), and because the fish contributed the vast majority of the nutrients to the aquaponic system for plant growth, this lowered fish feeding rate led to a fall in nutrient concentrations, which arguably explains the reduced plant production in the aquaponic system throughout the winter months (
Figure 4).
The effect of the lower nutrient concentrations can be clearly seen in the NFT herb comparison results presented in
Table 7. The aquaponic system equalled or bettered the hydroponic system for the majority of comparisons until May 2010 (late autumn; early winter in the Southern Hemisphere). However, by May 2010, the water temperature in the aquaponic system had dropped enough so that the fish had stopped feeding and nutrient deficits occurred. For the last three herb comparisons, all performed during this period in late May 2010, the plant production rate in the hydroponics was far better, because sufficient nutrients were still available to the plants, whilst in the aquaponics, these nutrients were in decreasing supply as a result of the lowered fish feeding rate resulting from the water temperature drop. This state of low aquaponic nutrient concentrations persisted until October 2010 (spring in the Southern Hemisphere), when water temperatures once again rose to levels that allowed for proper fish feeding and associated waste nutrient production (
Figure 1).
This effect of water temperature and lowered or zero fish feeding was also apparent in the NFT head lettuce trials, where it is seen that the aquaponic system also began to suffer in the winter and in spring of 2010 (
Table 4 and
Table 6).
The temperature-feeding issue observed in this study suggests a major drawback with using the NFT production approach in a recirculating aquaponic context, namely the inherent inability to control the water temperature when using the NFT approach in non-temperature controlled structures or environments. It is therefore recommended that if fish with a need for specific water temperatures are used, and if closed greenhouse environmental control is not employed (i.e., air heating in winter, or cooling in summer), then the use of NFT should be minimised or avoided for the plant production component of a recirculating aquaponics system. There are fish that can tolerate and thrive in lower water temperatures (e.g., Salmonid species). However, these fish may experience difficulties in an opposite way, as NFT may also lead to high heat gain in warm air temperatures (e.g., summer), and these warm water temperatures may adversely affect colder water fish species. Further research is warranted around the optimal technical design of aquaponics systems, given the conditions of the local climate, fish species, plant culture requirements, and access to heating/cooling infrastructure. This again demonstrates that in terms of aquaponics, NFT has very tightly defined conditional requirements, and so these all need to be taken into consideration when choosing the appropriate fish species and plant culture component configuration for the aquaponic design applied.
Fish production has not been reported in this paper; however, in terms of fish production for this trial and many other aquaponic trials, it has been conclusively demonstrated that fish production rates in aquaponics can equal that of standard recirculating aquaculture [
6,
29,
32]. Moreover, as many commercial hydroponic facilities are now measured in the hectares of a productive plant growing area, for such large-scale hydroponic facilities, substantial fish production (in the 10’s or even 100′s of tonnes per annum), is technically achievable with the existing integration technology. However, the commercial production potential of fish in aquaponics has been grossly underestimated by some hydroponic authors, and the economic advantages of diversification have sometimes been entirely ignored; it has even been argued that fish will only ever be utilised as nutrient delivery devices, and that any commercial sale of the fish is a waste of time [
43]. This opinion is contributing to a potential negative economic understanding of aquaponics by both the hydroponic and recirculating aquaculture industries. Current hydroponic facilities may integrate fish production and provide a more than adequate, organic nutrient stream for plant production that meets hydroponic industry plant growth standards, as well as substantial, commercial scales of fish production, thus producing two commercial and saleable crops from the one input source—fish feed.
It is likely that at least part of the lack of support for aquaponics within the industry is due to a paucity of studies that use fully operating, integrated systems (with both plants and fish), and a lack of studies that directly compare aquaponics with conventional technologies. The current trial demonstrates that with correct aquaponic system design and management, plant growth rates may equal, and often better, those of the standard hydroponic culture. This study serves as an important step in understanding the commercial potential of integrated aquaponics as a food production system, and it is recommended that future research be conducted in order to further explore and optimise these systems.


