Article

Ultrasound-Assisted Extraction of Hydroxytyrosol from Lactiplantibacillus plantarum Fermented Olive Leaves: Process Optimization and Bioactivity Assessment

Food Engineering Department, Faculty of Engineering, Adana Alparslan Türkeş Science and Technology University, Sarıçam, Adana 01250, Turkey
*
Author to whom correspondence should be addressed.
Fermentation 2023, 9(6), 514; https://doi.org/10.3390/fermentation9060514
Submission received: 26 April 2023 / Revised: 19 May 2023 / Accepted: 24 May 2023 / Published: 26 May 2023

Abstract

:
Olive leaves are important by-products for the recovery of phenolic compounds and extracts with high phenolic content using lactic acid bacteria during fermentation. Lactiplantibacillus plantarum (L. plantarum) strains as glucosidase-positive strains are starter cultures used to control the fermentation process. The main objective of the present work is to determine the most effective strain for the biodegradation of oleuropein to hydroxytyrosol using two L. plantarum strains for the fermentation of olive leaves. Box–Behnken experimental design was applied to determine the optimum ultrasound-assisted extraction (UAE) conditions to obtain hydroxytyrosol-rich extract using the brine of the fermented leaves. L. plantarum ATCC 14917 (hydroxytyrosol; 126.89 ± 1.59 mg/L) strain showed higher oleuropeinolytic activity than L. plantarum ATCC-BAA 793 (85.93 ± 0.70 mg/L) in olive leaf brine. When the UAE method was applied, it was seen that the hydroxytyrosol concentration of samples that were inoculated with L. plantarum ATCC 14917 (362.29 ± 2.31 mg/L) compared to L. plantarum ATCC-BAA 793 (248.79 ± 4.14) increased. The optimum UAE conditions were determined as 30% amplitude-5 min-30% ethanol for ATCC 14917 and 45% amplitude-9 min-10% ethanol for BAA 793 strain. This study showed that the brines of fermented olive leaves with oleuropeinolytic strains can be considered high added value products.

1. Introduction

In recent years, interest in natural extracts from plants and by-products rich in bioactive compounds has increased in the agronomic, cosmetic, and pharmaceutical industries. This is because of the need to meet the increasing demand for natural preservatives and to produce new functional foods with significant health benefits [1]. Some of the by-products from the harvesting and industrial processing of agricultural products contain various bioactive compounds [2]. Olive leaf, which is one of these by-products, is a potentially inexpensive, renewable, and abundant source of phenolic compounds as agricultural and industrial waste. It presents potential health benefits which have been associated with the phenolic compounds in the leaves, including antioxidant, antiviral, antibacterial, and anti-inflammatory, anti-carcinogenic activities as well as beneficial cardiovascular effects [3]. The most prominent phenolics in olive leaves include hydroxytyrosol, tyrosol, rutin, and oleuropein. Among these compounds, oleuropein and hydroxytyrosol are the main degradation products of oleuropein [4].
Lactic acid bacteria (LAB) have an important potential as a biopreservative in fermented foods as they can produce a wide variety of antimicrobial compounds such as organic acids, diacetyl, acetoin, hydrogen peroxide, reuterin, antifungal peptides and bacteriocins [5]. Olives and their by-products are important sources of LAB that play an important role during fermentation and are responsible for acidifying brine and improving organoleptic properties. They are also used to improve aroma and microbiological stability during fermentation [6]. It is also important that they can hydrolyze phenolic compounds (such as oleuropein) and produce volatile molecules that positively contribute to the development of the sensory profile of the final product of table olive and by-products. Lactiplantibacillus plantarum (L. plantarum) is an important glucosidase-positive species in terms of the biodegradation capacity of oleuropein and the formation of hydroxytyrosol, which is one of the most important hydrolysis products and has many biological activities [7]. It has been reported that hydroxytyrosol has antioxidant and anti-inflammatory properties and reduces the risk of coronary heart disease and atherosclerosis [8]. The anticancer effect of hydroxytyrosol with cell-specific cytotoxic and apoptotic properties has been proven by many studies both in vitro and in vivo [9]. The hydrolysis of oleuropein depends on the activity of β-glucosidase, and esterase enzymes of LAB. By hydrolysis of oleuropein with the activity of these enzymes, glucose and aglycone are formed. These compounds are hydrolyzed by esterase enzyme to hydroxytyrosol and elenolic acid with a less bitter taste [10]. Moreover, the improvement of olives and by-products’ nutraceutical value can be induced by LABs due to higher production of hydroxytyrosol [11].
It is very important to use an appropriate extraction method to obtain bioactive compounds without structural degradation and in high yield [12]. Ultrasound-assisted extraction (UAE) has been proposed as an alternative to conventional solvent extraction due to some of its advantages such as the better recovery of targeted compounds with lower solvent consumption, faster analysis, as well as performance at lower temperatures preventing the degradation of thermally unstable components in plant matrix [13,14].
The bioconversion of oleuropein to hydroxytyrosol by fermenting olive leaves with different strains of L. plantarum and the optimization of ultrasonic-assisted extraction to obtain an extract enriched with hydroxytyrosol content in the brines of fermented olive leaves are proposed as the original aspects of this study.

2. Materials and Methods

2.1. Chemicals

Oleuropein (purity by HPLC, ≥80%) and hydroxytyrosol were supplied by Sigma-Aldrich Chemicals (St. Louis, MO, USA). Ethanol, Methanol, NaCl, and Acetonitrile (≥99.9%), MRS agar (de MAN, ROGOSA, and SHARPE), and MRS broth were purchased from Merck (Gernsheim, Germany). L. plantarum ATCC 14917 were purchased from Kimeks Chemical Materials and Sanitary Ware Co., Ltd. (İstanbul, Turkey). L. plantarum ATCC-BAA 793 was supplied by American Type Culture Collection (ATCC).

2.2. Plant Material

In the study, the Gemlik variety of olive leaves grown in the Mediterranean region was used. Olive leaves were cleaned and washed before the analysis and dried for 2 days at 40 °C in an oven (UF110, Memmert GmbH + Co. KG, Schwabach, Germany) until they reached a moisture content of 6%. Then, it was packaged and wrapped in aluminum foil and kept at −18 °C until the fermentation process. Refrigerator-freezer thermometers were used to control the temperature at −18.

2.3. Bacterial Strains and Fermentation Conditions

The strain of L. plantarum ATCC 14917 and L. plantarum ATCC-BAA 793 were used in this study. They were selected for their oleuropein-degrading capacity [10,15]. L. plantarum strains were incubated in MRS broth at 30 °C for 18–24 h, and stock cultures were prepared by transferring the activated cultures into 40% glycerol solution. The prepared stock cultures were stored at −80 °C. For the preparation of inoculum, MRS broth with 5% NaCl was used to allow the cells to adapt to the saline environment. Dried olive leaves (Olea europaea L.) in 5% NaCl brine solution were left to fermentation with L. plantarum strains (107 CFU/mL) (1%) for 21 days at 30 °C in a shaker incubator (Jeo Tech-IST4075, Daejeon, Republic of Korea). Samples were aseptically taken at 1, 3, 5, 7, and 21 days of incubation for oleuropein degradation activity, physic-chemical and microbiological analyses. To determine the fermentation time, the degradation and bioconversion of oleuropein, and the formation of hydroxytyrosol were determined by the HPLC method (Details were given in Section 2.6).

2.4. Physicochemical Analysis

Total acidity and pH analysis were performed on the fermented olive leaf brine. The pH was measured using a pH meter (Hanna Edge Dedicated pH/ORP Meter-HI2002). For the total acidity of the samples, titration was done with 0.1 N NaOH until the pH value reached 8.1 and the acidity was expressed in terms of lactic acid (%, v/v) [16].

2.5. Microbiological Analysis

The microbial enumeration of lactic acid bacteria was done by using the pour plate technique. Cultures were serially diluted (10-1 to 10-10) and plated on a Petri dish containing MRS Agar. The Petri dishes were incubated at 30 °C for 24–48 h. The results were expressed as Log CFU/mL.

2.6. Determination of Bioconversion of Oleuropein to Hydroxytyrosol

The bioconversion of oleuropein to hydroxytyrosol content was analyzed based on the method reported by Kelebek et al. [17] using high-performance liquid chromatography (HPLC) with negative ionization mode. HPLC system (Agilent Technologies, Palo Alto, CA, USA) equipped with a Windows NT- based ChemStation software was utilized, and its equipment was composed of an autosampler (G1367 E, 1260 HIP ALS), a binary pump (G1312 B, 1260 Bin pump), a degasser (G1322 A, 1260 Degasser) and a diode array detector (G1351D 1260 DAD VL). All peaks were detected in 280 nm. Before injection into the HPLC system, samples were filtered using 0.45 µm pore size membrane filter. Standard curves were obtained by using commercial standards at concentrations (100, 50, 25, 12.5, and 6.25 ppm) and the correlation coefficient (R2) was calculated. Each phenolic compound was quantified by using the calibration curves of the standard phenolic compounds.

2.7. Ultrasound-Assisted Extraction (UAE)

Ultrasound-assisted extraction (UAE) was applied for high-efficiency extraction of hydroxytyrosol, which diffuses into the brine where the leaves are fermented. Extraction was performed using an ultrasonic device (Branson Digital Sonifier SFX 250, ABD) equipped with an ultrasonic probe. The output power of the device was 250 W, and the ultrasonic frequency was 20 kHz. The ultrasonic probe was submerged at 1.5 cm depth in the samples. Sonication was conducted in pulsed mode. After extraction, extracts were lyophilized (CHRIST Alpha 1–4 LDplus).

2.8. Experimental Design

Optimum extraction conditions were determined using the Box–Behnken experimental design of the Response Surface Methodology using Design-Expert (version 7.0, Statease Inc., Minneapolis, MN, USA) program. Hydroxytyrosol content in fermented olive leaf brine was chosen as the dependent variable. A mathematical model was created with the multiple regression analysis method and the important terms in the model were determined by analysis of variance (ANOVA). The fit of the model was determined according to the “lack of fit” value that should not be statistically significant with p > 0.05. The three variables studied were ethanol/water concentration (% v/v), ultrasonication time (min), and amplitude (%). A Box–Behnken experimental design was performed with a total of 15 experiments, with 3 replicates at the center point.

3. Results

3.1. Physico-Chemical Analysis

The physicochemical analysis results of the 1st, 3rd, 7th, and 21st days of olive leaves fermented with L. plantarum ATCC 14917 and ATCC-BAA 793 are presented in 
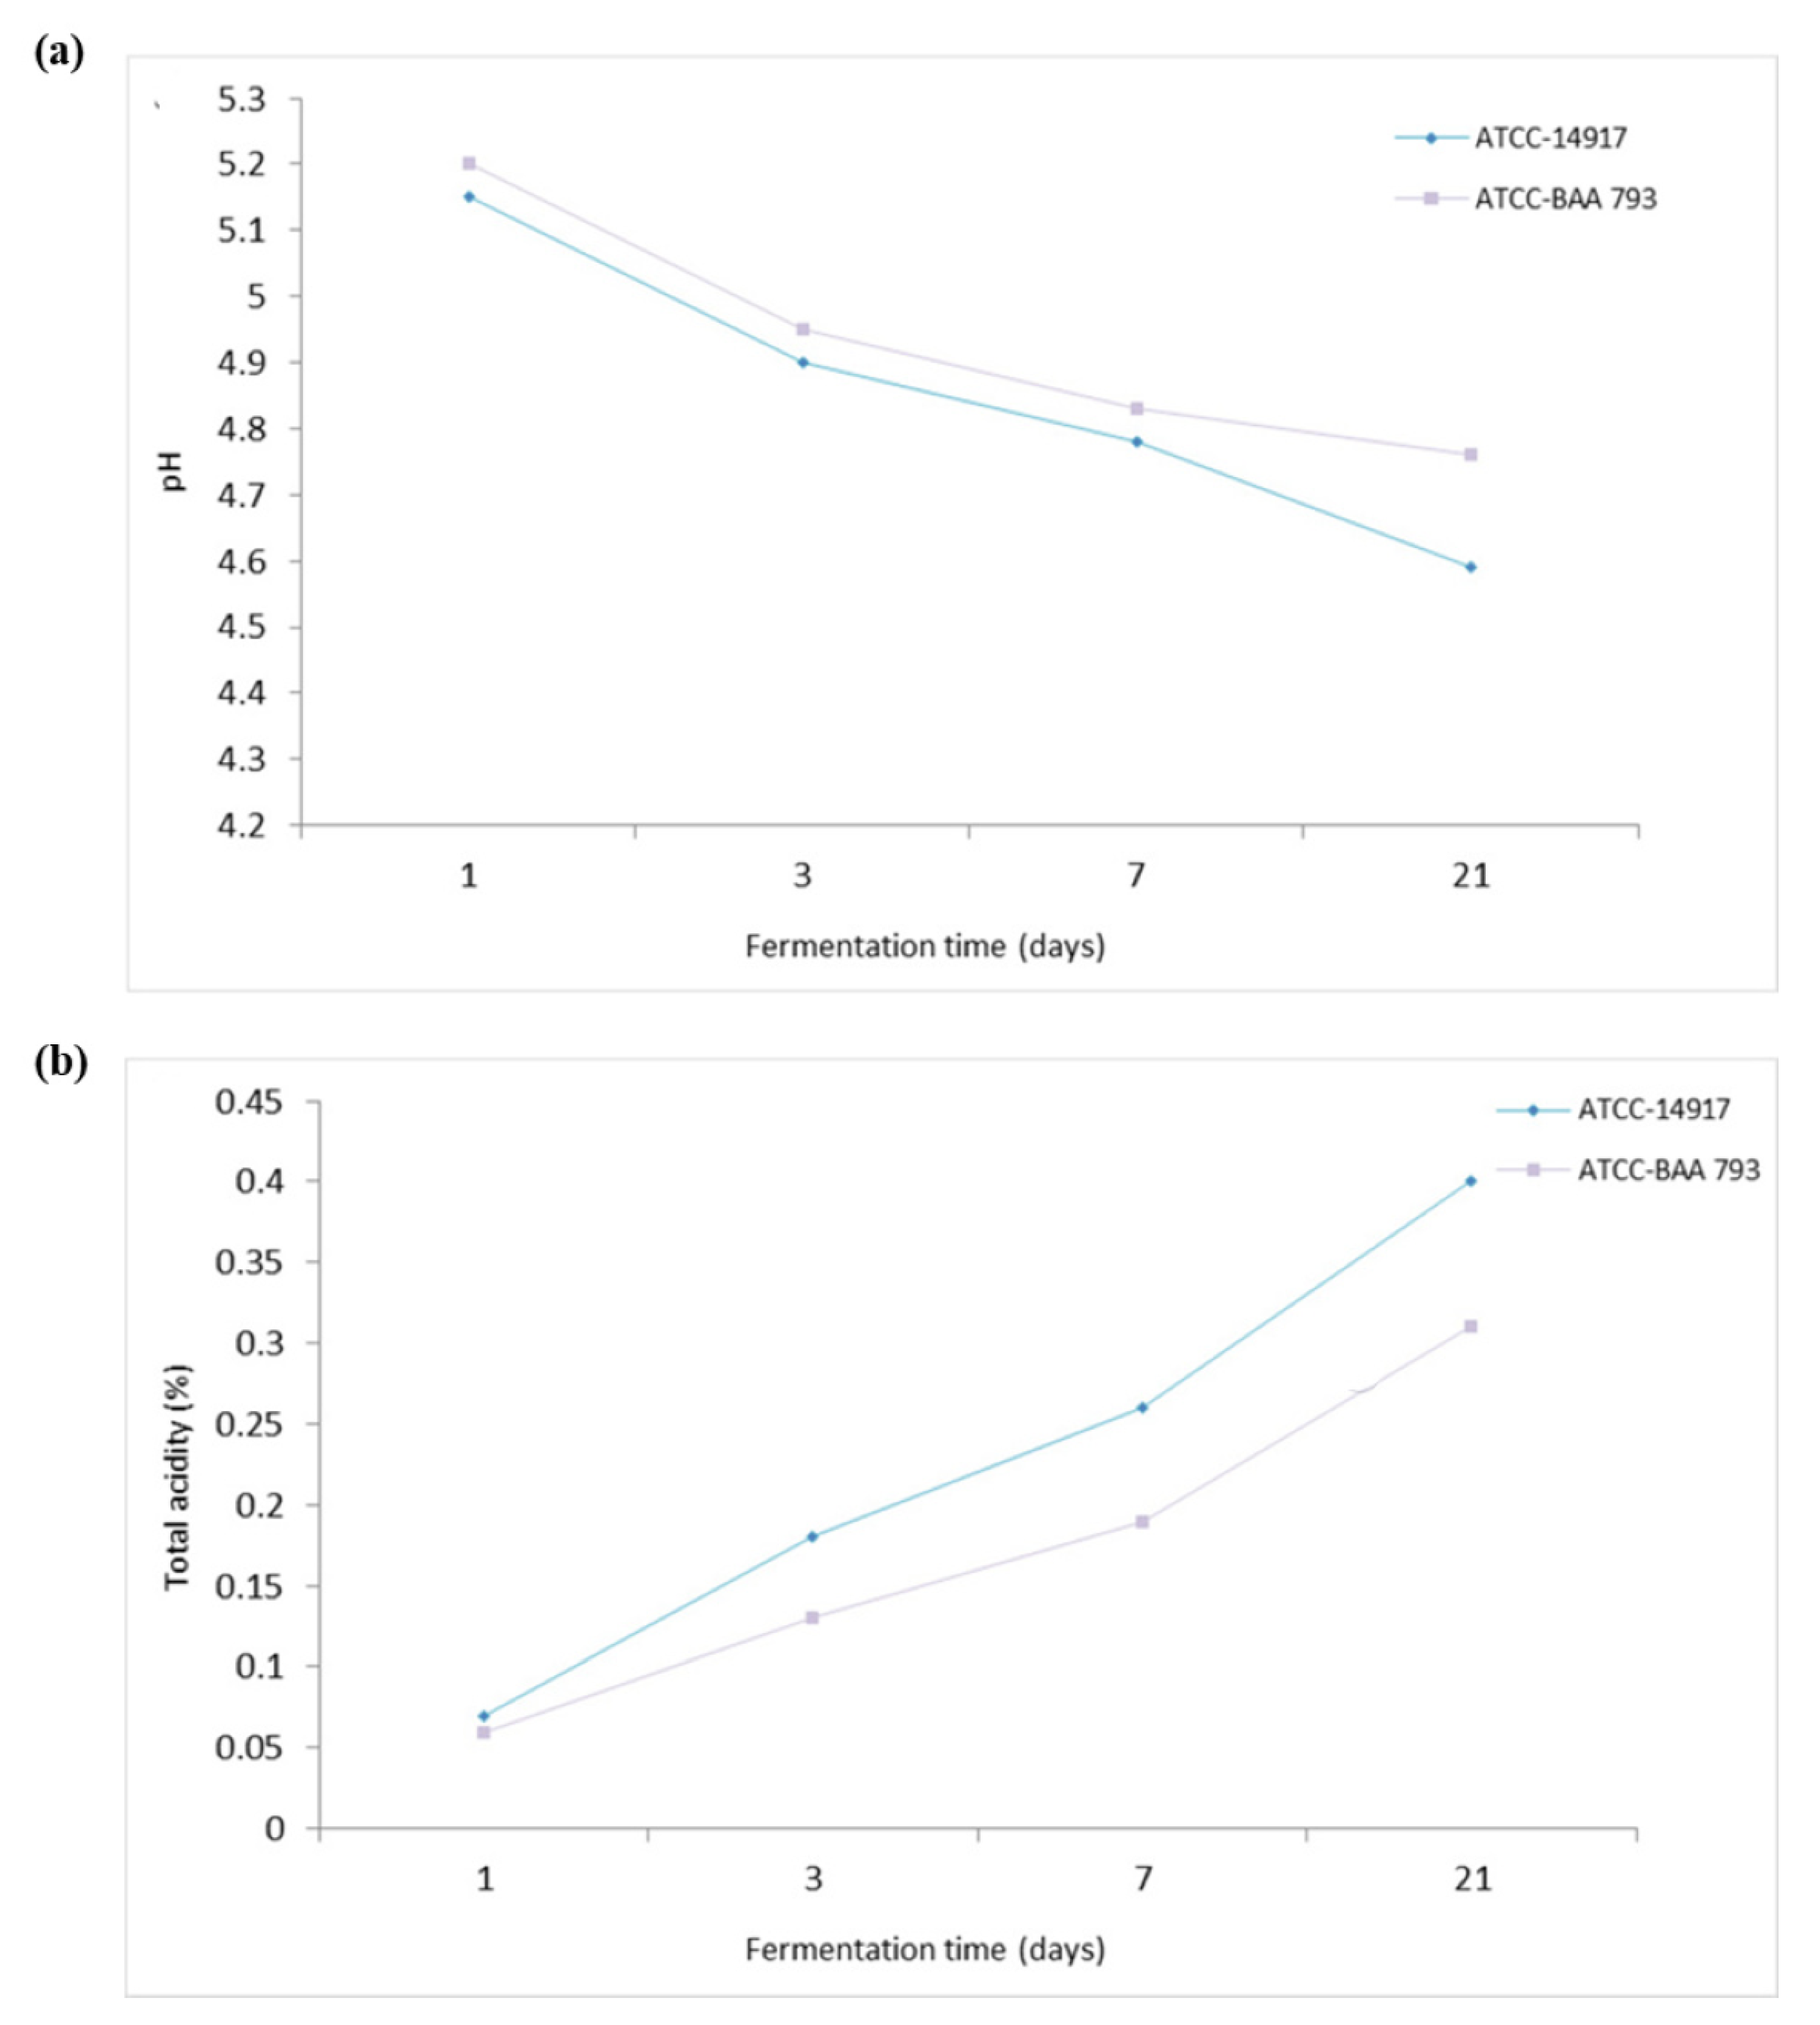
Figure 1. In parallel with a slight decrease in pH values, an increase was observed in total acidity values in fermented olive leaves. While the pH value of samples fermented with L. plantarum ATCC-14917 and L. plantarum ATCC-BAA 793 was determined as 5.15 and 5.20 on the first day of fermentation, they were found as 4.59 and 4.76, respectively without much change at the end of the 21-day fermentation process. Likewise, the acidity values, which were 0.07 and 0.06% on the 1st day of fermentation, increased at the end of the fermentation process and were found to be 0.40 and 0.31%. In all samples in which LAB were added, the total acidity value was found to be higher than the control samples (non-inoculated) (0.20%) at the end of the 21-day fermentation time. The results show that the use of LAB strain has a significant effect on acidification when compared with non-inoculated samples. The increase in acidity could be explained by the microbial activity of microorganisms, mainly LAB that metabolize sugar and other nutritional contents in the brine leading to the formation of acids and a decrease in pH [18]. In a study, oleuropein biodegradation by L. plantarum FSO175 strain was investigated during 7-day fermentation at 30 °C, and the final values of pH and free acidity were 5.7 and 0.42%, respectively [19]. In another study, olives inoculated with L. plantarum S175 showed a rapid decrease in pH from 6 to 4.5 during the first 5 days of fermentation, followed by a slight decrease to around pH 4 until the end of the fermentation process. In addition, the free acidity increased continuously and was found to be 1% at the end of the fermentation process [18]. The same behavior of pH change was observed in the present study. Olives inoculated with L. plantarum have shown more rapid acidification than spontaneous fermentation during 25 days of fermentation in a previous study [20]. A pH value of olives inoculated with the L. plantarum KLOS 1.0328 strain isolated from the Italian variety was found between 5.0 and 9.0 and the results indicated that L. plantarum KLDS 1.0328 exhibits stress tolerance under the acid and alkali stress conditions [21]. In the study comparing the spontaneous and L. pentosus inoculated fermentation of olives, the average pH value started with 5, and decreased significantly, reaching approximately 4 on the 7th day of fermentation. pH values below 4.5 inhibited the growth of Proteobacteria and other acid-sensitive bacteria [22].

3.2. Microbiological Analysis

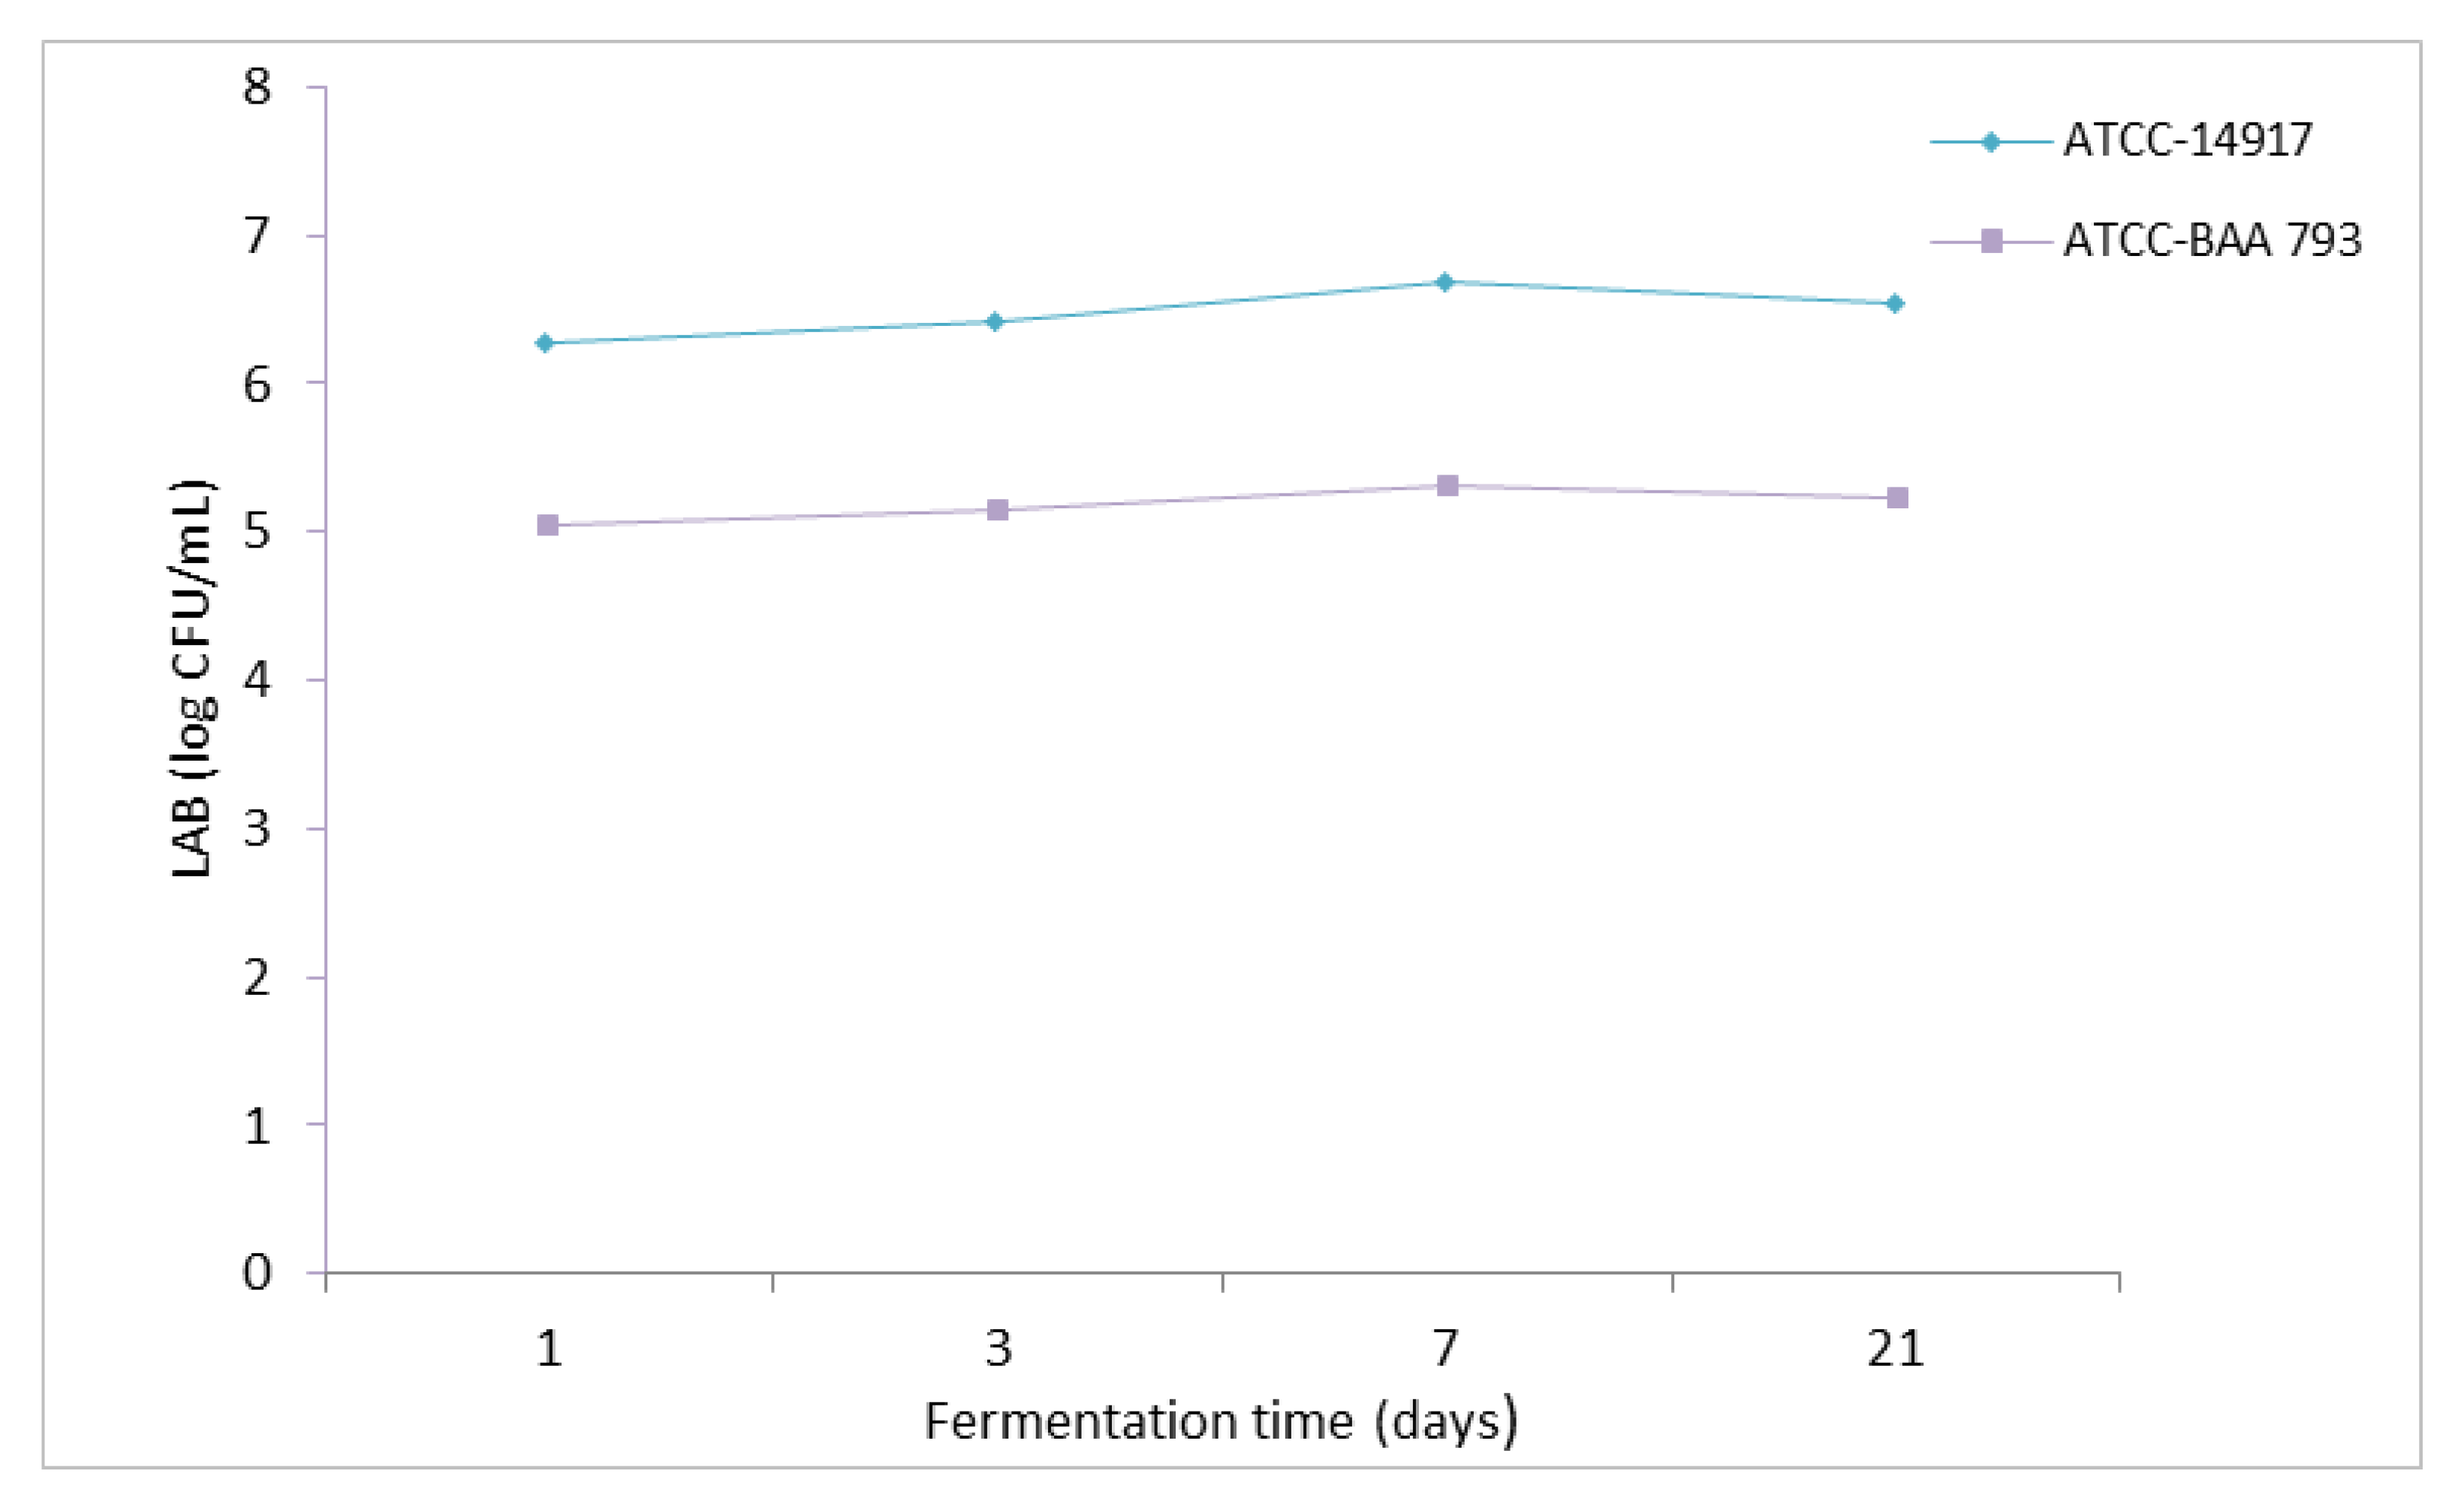
The number of LAB in the brines of fermented olive leaves varied between 5.14 and 6.68 log CFU/mL (Figure 2). The LAB counts were higher in the samples with L. plantarum ATCC 14917 compared to the L. plantarum ATCC-BAA 793. This is consistent when evaluated together with the total acidity results. The total acidity increased in the fermented leaf brine with higher LAB counts. In addition, after the first 7 days of the fermentation process, a slight decrease in the LAB number was observed at the end of the fermentation process in leaves inoculated with both bacterial strains. In another study investigating the effect of stress factors (pH, temperature, and NaCl) associated with olive fermentation on the growth and oleuropein degradation abilities of selected L. plantarum strains, all tested strains increased cell densities more than 2 log units, starting from an average of 7 logs CFU/mL in the control condition at pH 6.0 and incubation at 32 °C [23]. In general, all strains were found to be more resistant to both single and multiple stress conditions at 32 °C than at 16 °C [24]. In a study conducted on L. plantarum KLOS 10328 strain, it was determined that the strain tended to tolerate acidic stress rather than osmotic stress. It has been reported that pH values between 5.0 and 9.0 do not significantly affect the growth of isolated L. plantarum strains [24]. Our results were compatible with a study reported by Bevilacqua et al. [24] concerning the pH value (4.59–4.76) which led to less stress for the growth of L. plantarum strain.
Some studies have demonstrated the ability of L. plantarum strains to tolerate high (>8%) NaCl concentrations [25,26,
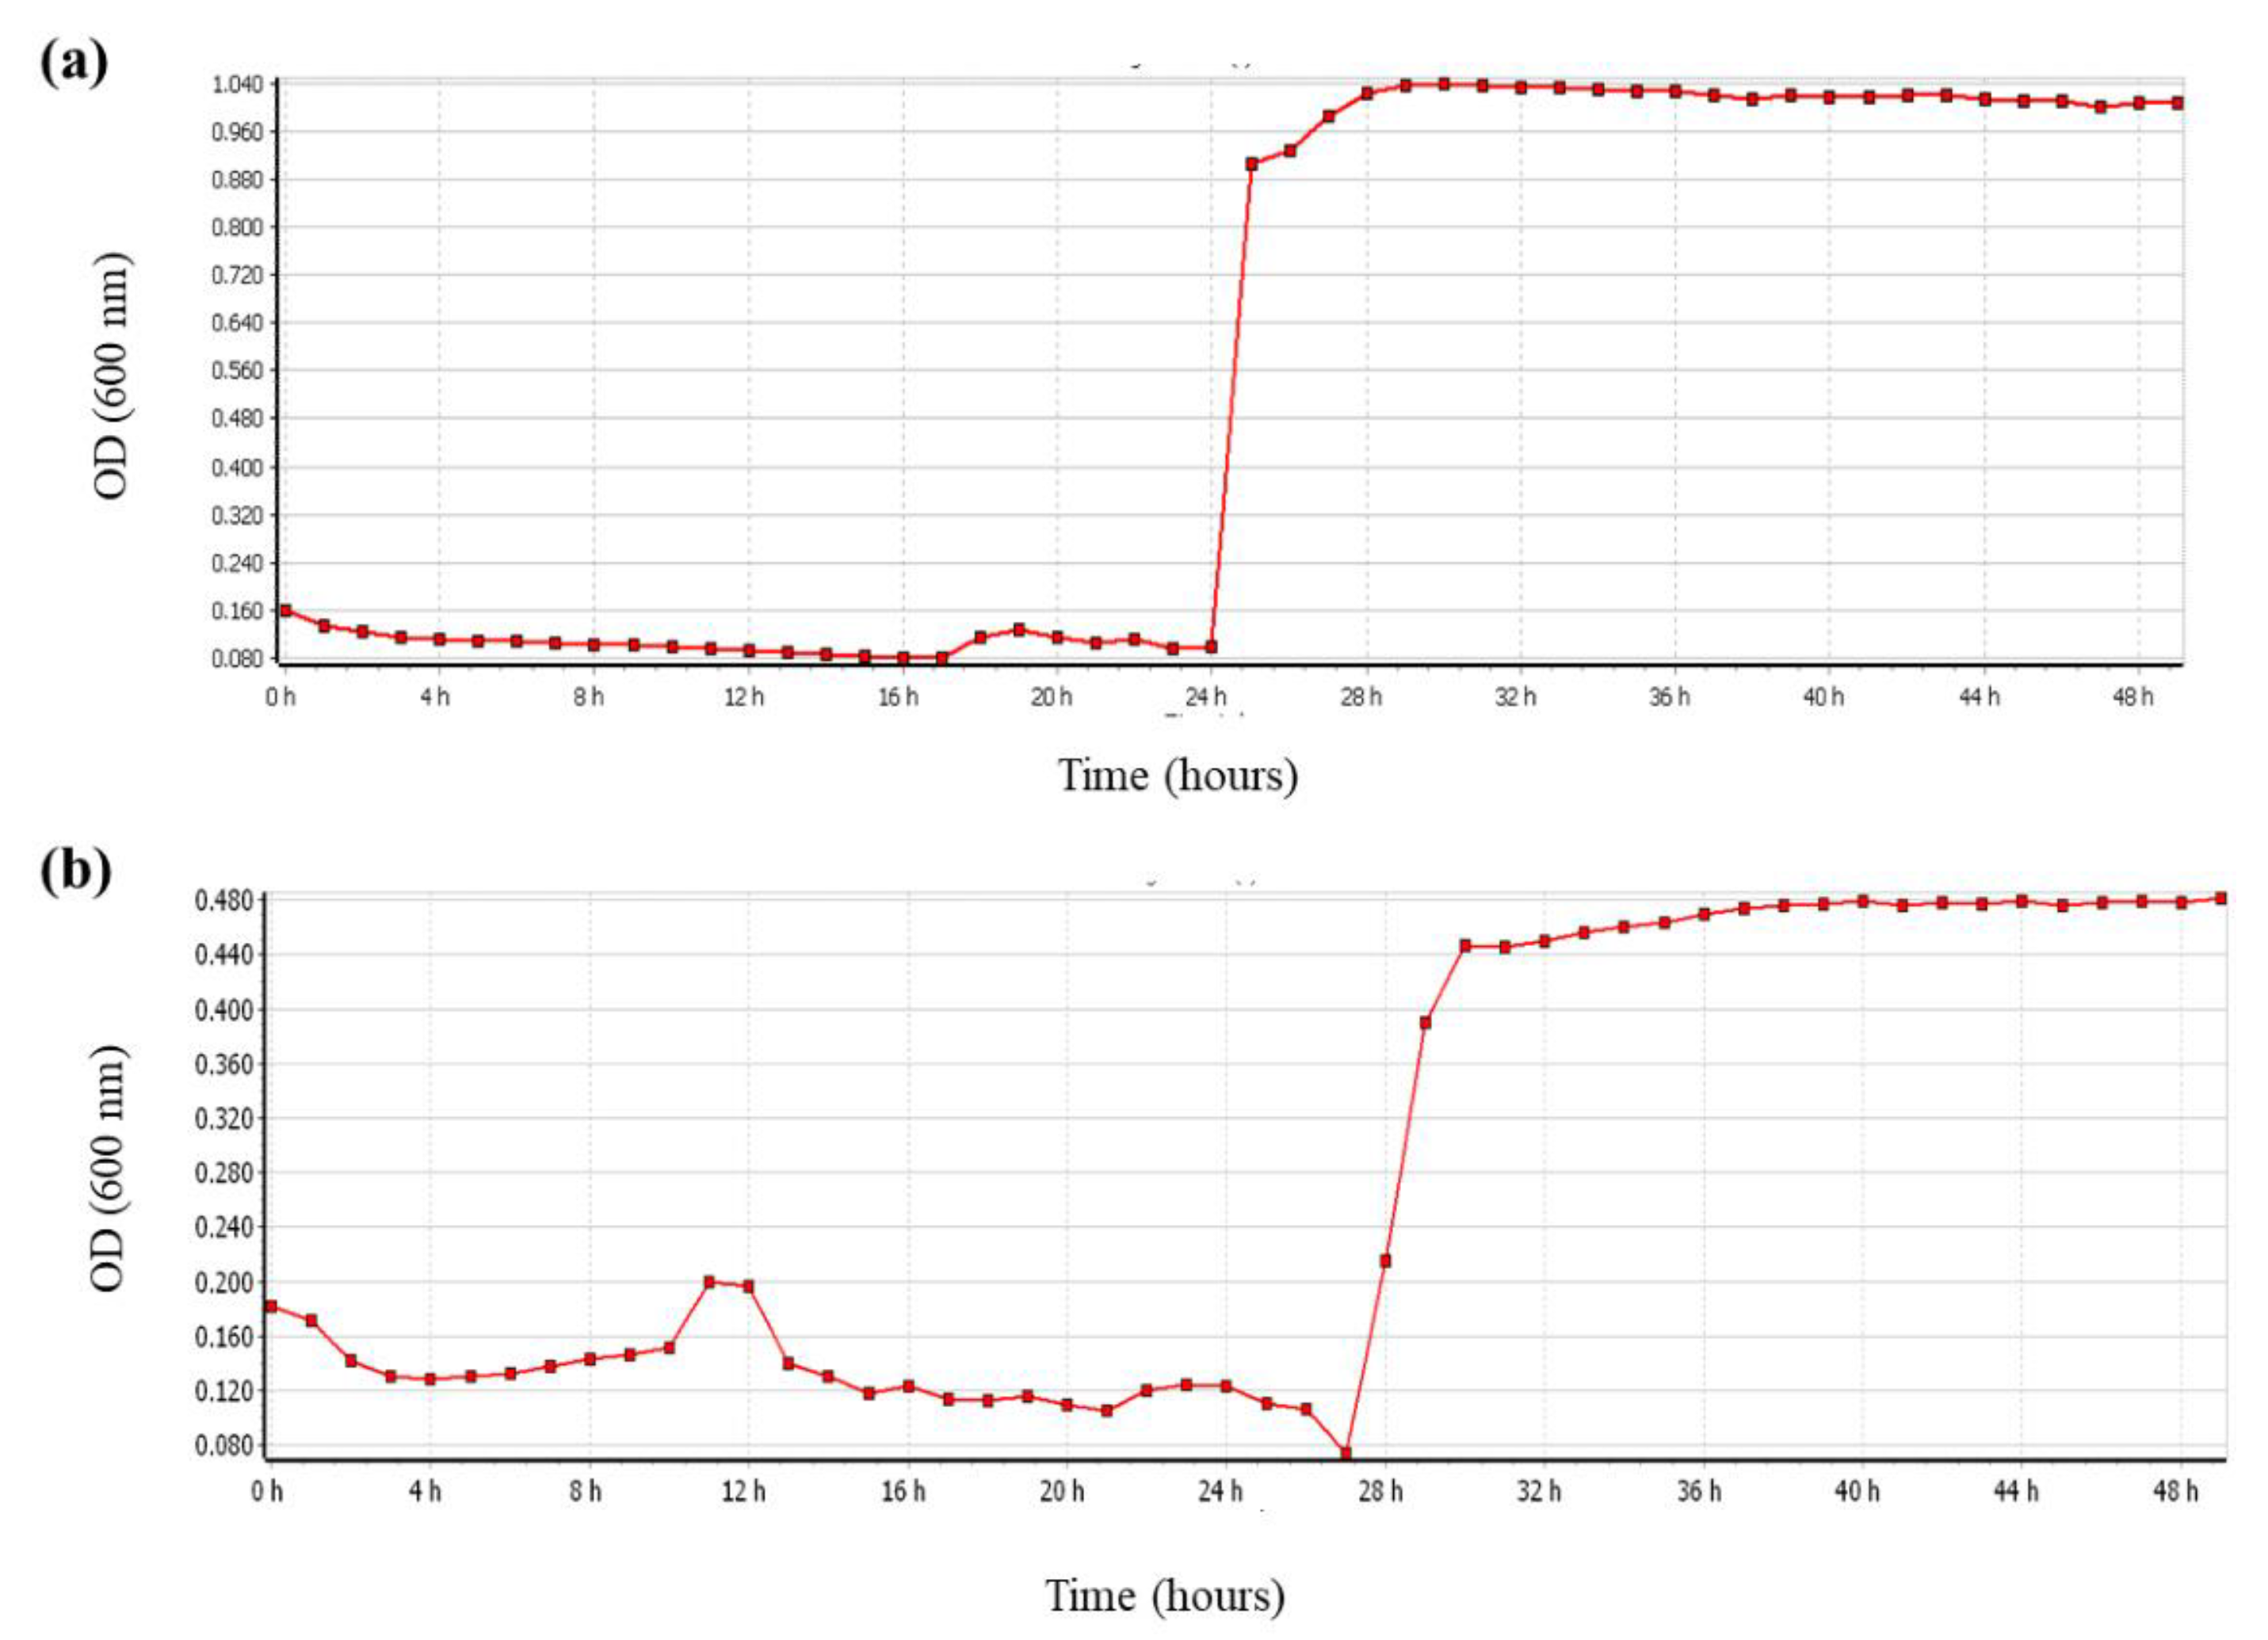
27]. In the present study, the effect of ambient conditions on bacterial growth was determined according to the growth curves of L. plantarum ATCC 14917 and L. plantarum ATCC-BAA 793 using a microplate reader. Stress conditions, such as concentration of salt (5%) and incubation temperature (30 °C), did not show a negative effect on the growth and particularly the oleuropein biodegradation capacity of L. plantarum ATCC 14917 and L. plantarum ATCC-BAA 793 (Figure 3). In another study in which the fermentation process of olives was controlled by two bacterial species (L. plantarum S175 and L. pentosus), the interaction between cell concentration and time significantly affected the development of the LAB population. This LAB population showed a slight increase from 5.7−9 × 10⁷ cfu/mL to about 109 cfu/mL during the first 15 days of the fermentation, then decreased to about 2 × 10⁵ cfu/mL at the end of the fermentation [18].

3.3. Bioconversion of Oleuropein to Hydroxytyrosol

In our study, bioconversion of oleuropein to hydroxytyrosol depending on the activity of β-glucosidase and esterase enzymes of LAB in fermented olive leaves with L. plantarum ATCC 14917 and L. plantarum ATCC-BAA 793 strains were investigated and hydroxytyrosol-rich extracts were obtained under optimized conditions. The changes in the amounts of oleuropein and hydroxytyrosol in fermented olive leaves and the brine inoculated with different L. plantarum strains are given in Table 1. When the results are examined, hydroxytyrosol is considered to be the main hydrolysis product for oleuropein degradation and this phenol diffused from olive leaves to brine. This diffusion between brine and olive leaves occurs normally due to the osmotic pressure difference [28]. As a result of this exchange of substances, oleuropein and the water-soluble components diffuse from the olive leaves to the brine. Therefore, concerning fermented olives and olive leaves, brine may be important for the recovery of phenolic compounds and to obtain extracts with high phenolic content [29].
In the first 5 days of fermentation, the content of oleuropein, which is expected to decrease as a result of biodegradation, increased until the 7th day of fermentation for both bacterial strains (Table 1). This increase in the amount of oleuropein can be explained by the higher and continuous diffusion of oleuropein by osmosis from olive leaves to the brine [25]. After the 5th day of fermentation, the oleuropein content decreased from 535.23 to 298.64 mg/mL and from 350.78 to 246.14 mg/L in the brine of fermented olive leaves inoculated with L. plantarum ATCC-14917 and L. plantarum BAA-793, respectively.
The highest enzyme activity in both bacterial strains started to occur from the 3rd day of fermentation. Depending on the reduction of oleuropein content, the amount of hydroxytyrosol, which was 28.16 and 11.83 mg/mL on the first day of fermentation increased to 126.89 and 85.93 mg/mL after 21 days of fermentation for the fermented samples with L. plantarum ATCC-14917 and L. plantarum BAA-793, respectively (Table 1). It has also been reported that longer fermentation time can lead to a 40–70% reduction in hydroxytyrosol [
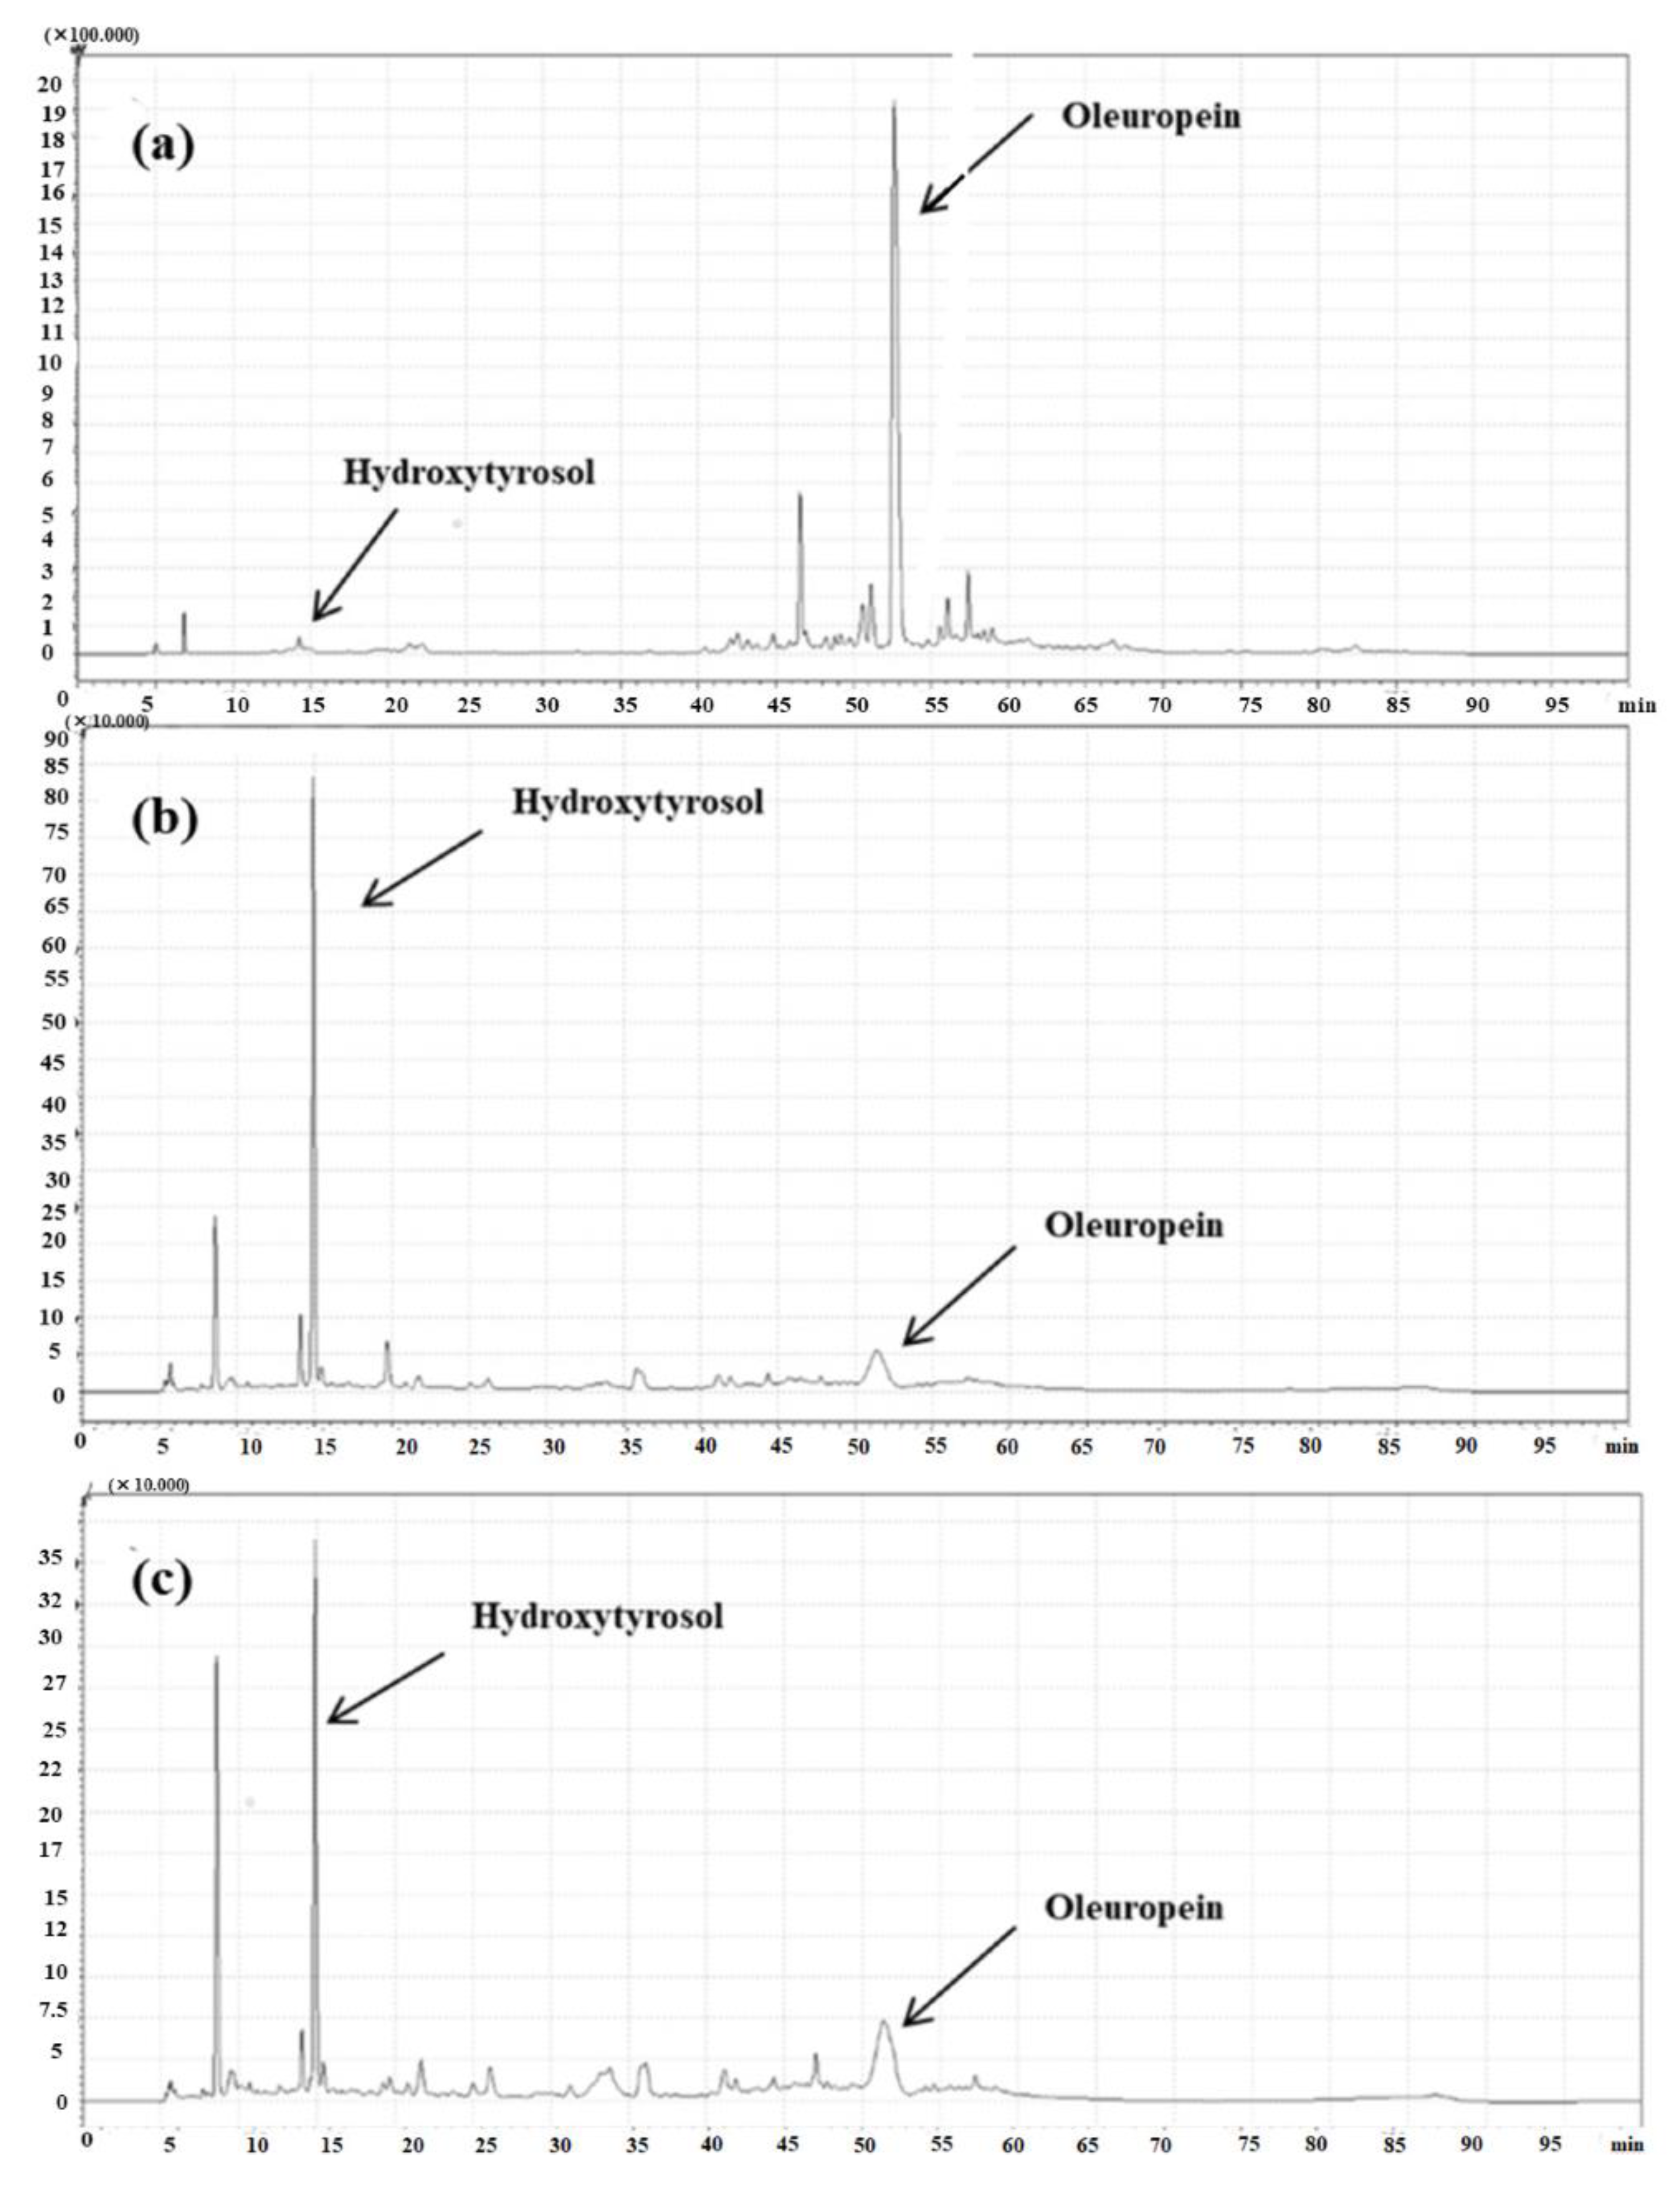
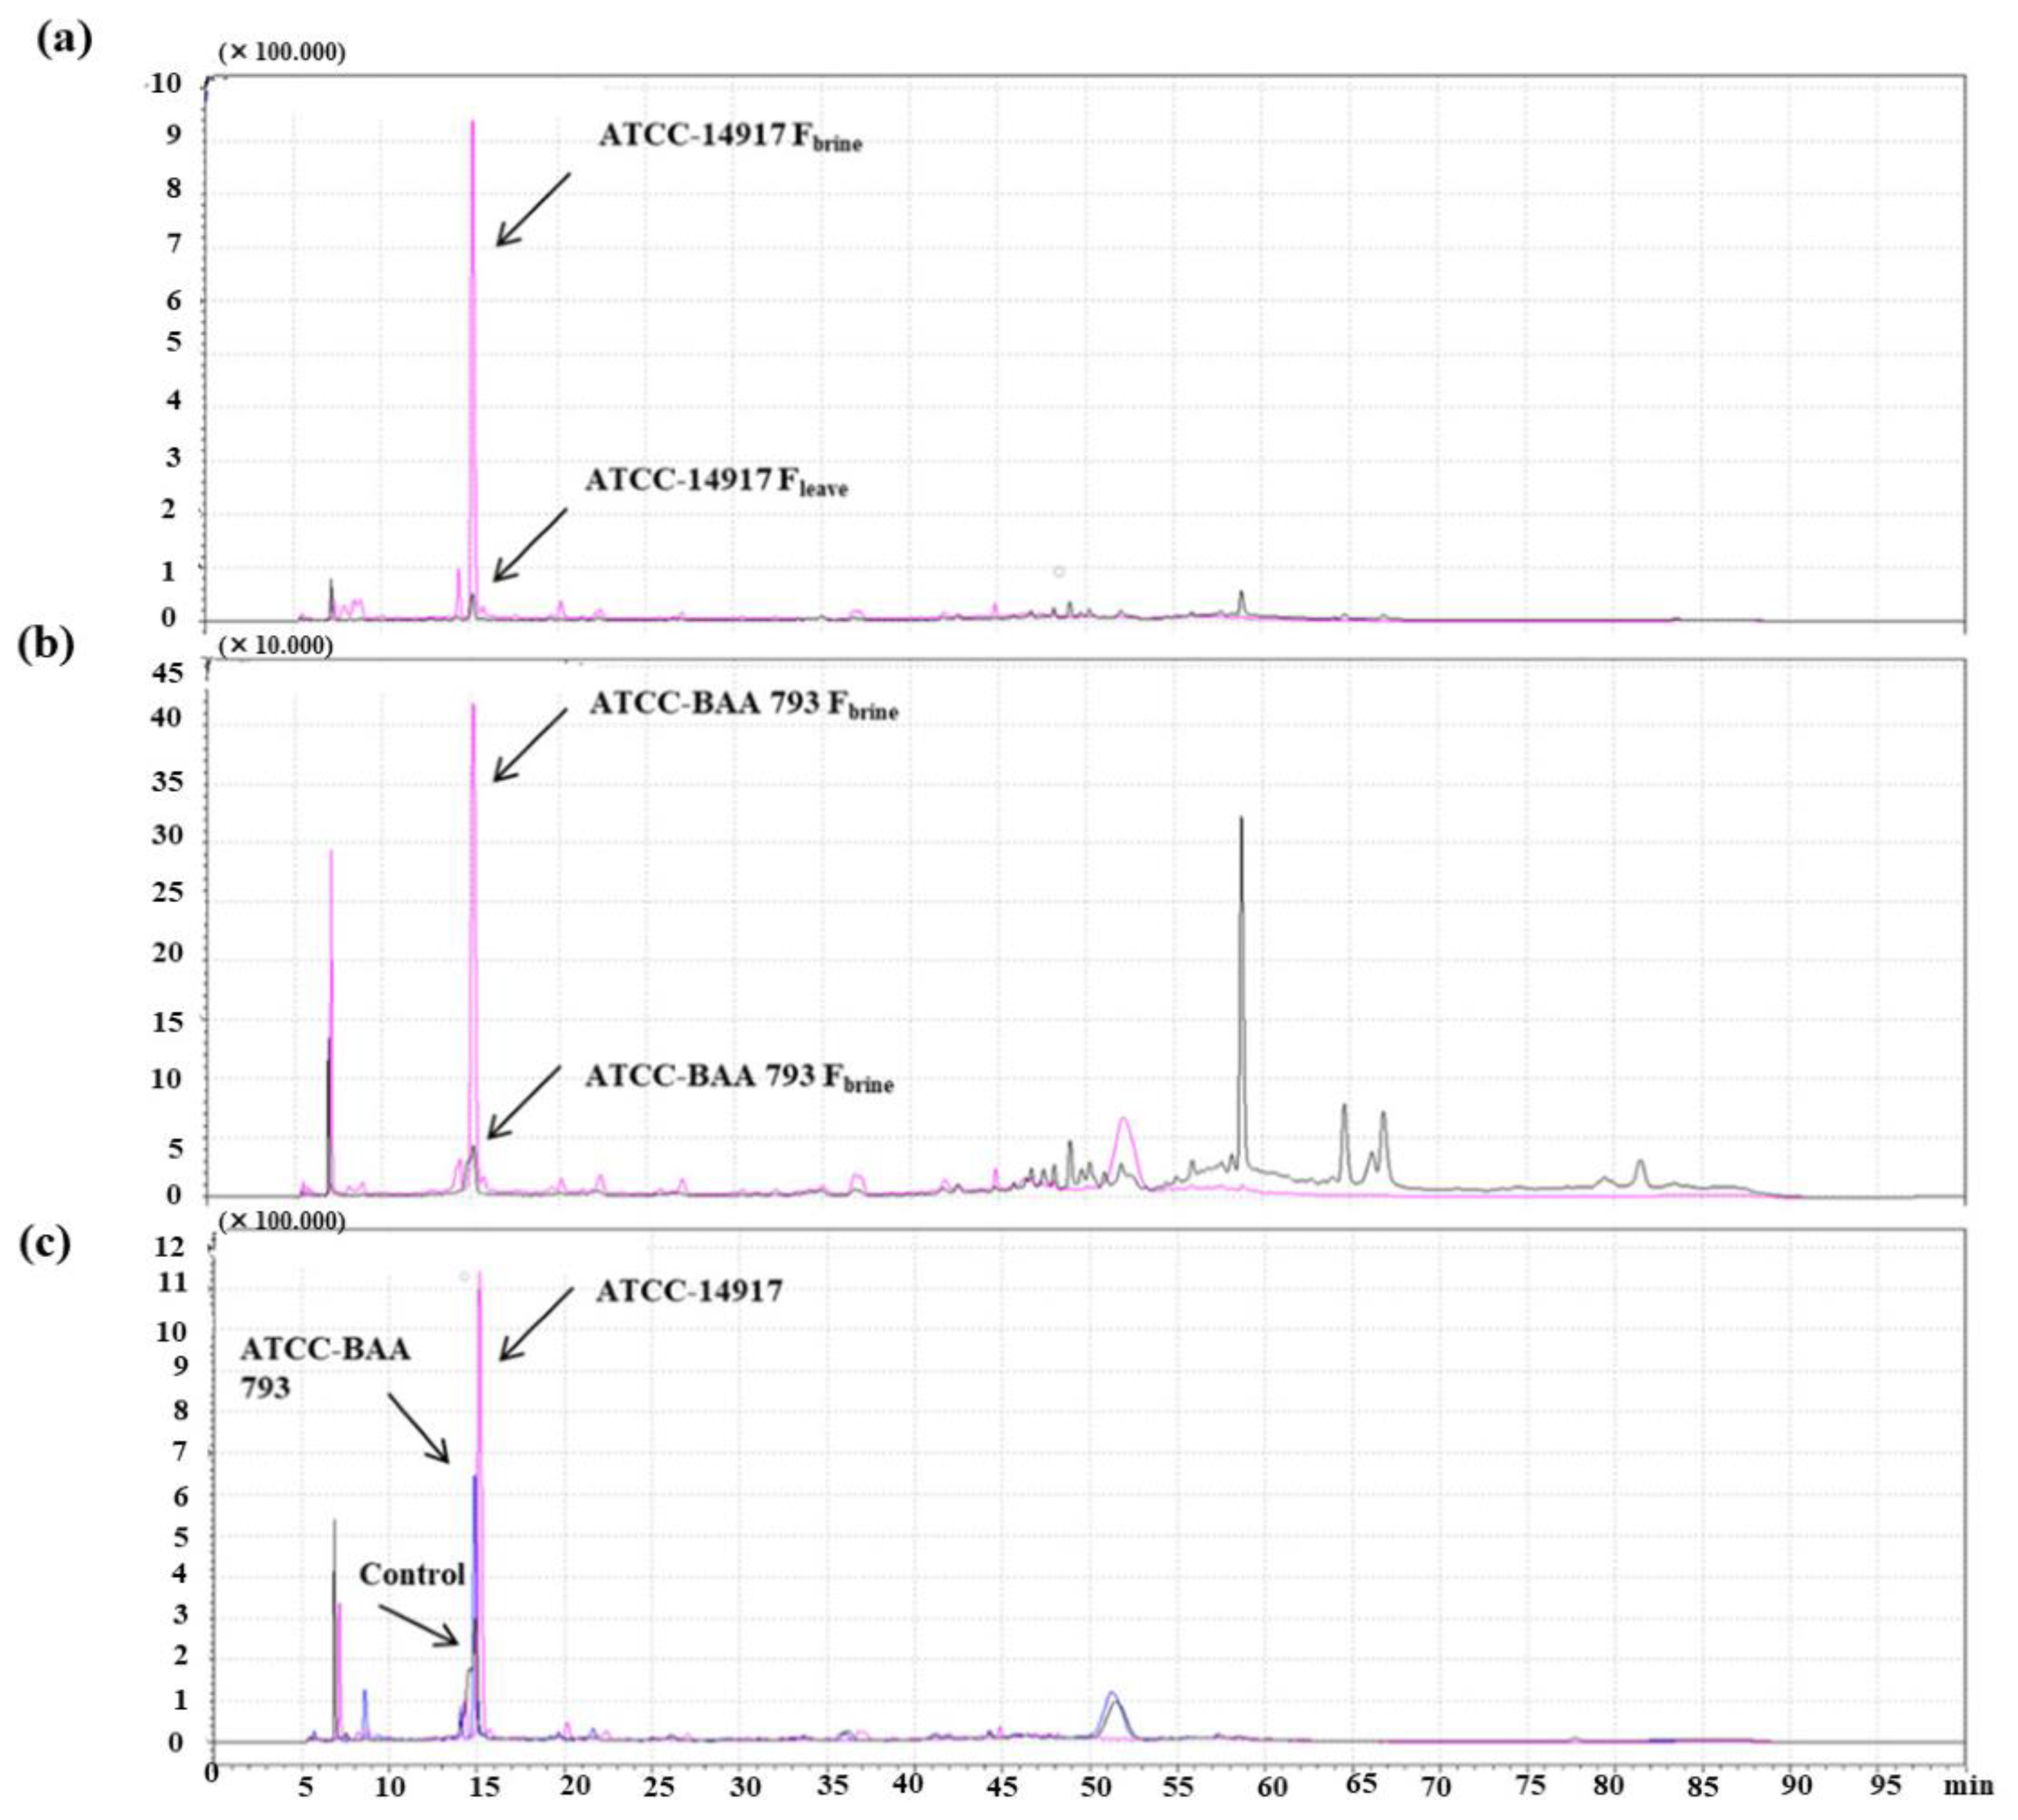
30]. In addition, regarding the oleuropeinolitic activity of both L. plantarun strain, bioconversion of oleuropein to hydroxytyrosol was shown in HPLC chromatograms (Figure 4) for control (non-inoculated) and brine of fermented olive leaves. When HPLC chromatograms were examined, as a result of the hydrolysis of the initial glycosides during fermentation, a significant difference was observed between the phenolic composition of the control and fermented olive leaf brines. Hydroxytyrosol content in fermented olive leaf brine by adding L. plantarum strain was considerably higher than the control (9.92 ± 0.09 mg/mL). Moreover, the highest hydroxytyrosol content was determined in the sample with L. plantarum ATCC 14917 (126.89 mg/mL) after 21 days of fermentation. The degradation of oleuropein was attributed to the β-glucosidase activity of the L. plantarum strain. However, some studies have shown that oleuropein degradation is not only associated with 𝛽-glucosidase and esterase but also polyphenol oxidase and peroxidase catalyze the conversion of oleuropein [31,32].

3.4. Optimization of Ultrasound-Assisted Extraction Conditions of Fermented Olive Leaves

UAE conditions were optimized for highly efficient extraction of hydroxytyrosol, which diffused from leaves to brine after the 21-day fermentation process. In the optimization study, the independent variables were determined as solvent (ethanol/water) concentration, extraction time, ultrasound power, and the dependent variable as the concentration of hydroxytyrosol. Process variables and their levels used in the Box–Behnken design for both bacteria strain are given in Table 2. It was observed that the model was not significant for the ethanol concentration range from 30–70% v/v (data not shown). Therefore, the model was reconstituted with the ethanol concentration ranging from 10 to 90% for L. plantarum ATCC-BAA 793. In the experimental plan designed for L. plantarum ATCC 14917, the hydroxytyrosol concentration was found to be between 142.24 and 244.02 mg/L, while for L. plantarum ATCC-BAA 793 it varied between 139.59 and 220.59 mg/L (Table 3). F-statistic was used to determine significant terms in the ANOVA analysis. Insignificant factors (p > 0.05) were removed from the model and then, the regression coefficients were recalculated. The adequacy of the model fit was checked for the response according to the lack of fit value. Accordingly, the error caused by the lack of fit value was found insignificant, and the variation resulting from the regression was found significant in the 95% confidence interval, ensuring the model’s suitability for optimization. To determine the optimum extraction conditions, the desirability function method was used, and the response surface plots were obtained to visualize the results clearly [33].
The sequential model sum of squares obtained for the hydroxytyrosol results of the sample extracts fermented with L. plantarum ATCC 14917 and ATCC-BAA 793 is given in Table 4 and Table 5, respectively. By applying regression analysis, the relationship between factors and response was revealed with a mathematical model. Accordingly, the linear and interaction effect terms of the factors were added to the models. The effects of the factors on the response were evaluated by considering ANOVA.
For L. plantarum ATCC 14917 fermented sample, the statistical significance of the linear and interaction effects of the factors on response is expressed in Table 6. While the lack of fit value was determined to be insignificant (p > 0.05), the model was also found to be insignificant at the 95% confidence interval (p > 0.05). It was observed that ethanol concentration and time were effective on the hydroxytyrosol content. However, the effect of the amplitude on response was not found significant. Therefore, insignificant factors (p > 0.05) were removed from the model and the regression coefficients were recalculated (Table 7). The effect of ethanol concentration and extraction time on the dependent variable was investigated in the new model created by removing the vibration amplitude. The reduced model was found significant at the 95% confidence level, while the lack of fit value was insignificant (p > 0.05). The interaction (BC) was found effective on the amount of hydroxytyrosol in the fermented samples. Furthermore, the time factor had a greater effect on the response than the ethanol concentration in the samples fermented with L. plantarum ATCC 14917. In addition, when the terms used in testing the model fit (Table 8) are examined, the fact that the Pred-R2 and R2 adj values are not close to each other shows that the fit model is not suitable for prediction.
For L. plantarum ATCC-BAA 793 fermented sample, the statistical significance of the linear and interaction effects of the factors on response is examined in Table 9. While the lack of fit value was determined to be insignificant (p > 0.05), the model was insignificant at the 95% confidence interval (p < 0.05). Moreover, insignificant factors (p > 0.05) were removed from the model and the regression coefficients were recalculated (Table 10). Ethanol concentration (p < 0.0001) was found to be more effective on the response than the time (p < 0.0244). In terms of the table used in testing the model fit (Table 11), the Pred-R2 and R2 adj values are found as close to each other and it shows that the fitted model is suitable for prediction for L. plantarum ATCC-BAA 793 fermented sample. The regression analysis of the data showed a significant effect of linear terms ethanol concentration (B), extraction time (C) and interaction (BC) on the hydroxytyrosol content of fermented extracts. Ethanol concentration and time influenced hydroxytyrosol results of samples with L. plantarum ATCC 14917 negatively while time affected hydroxytyrosol content positively in samples by adding L. plantarum ATCC BAA 793. The regression equations for the linear model obtained as a result of the regression analysis for the variables were given in Equations (1) and (2) in terms of actual variables for L. plantarum ATCC 14917 and ATCC-BAA 793, respectively.
R1(Hydroxytyrosol) = +331.21850 − 2.66250 × B-12.7950 × C + 0.20767 × B × C
R1(Hydroxytyrosol) = +241.633219 − 4.42766 × B + 3.07030 × C + 0.044260 × B2 − 0.15796 × C2
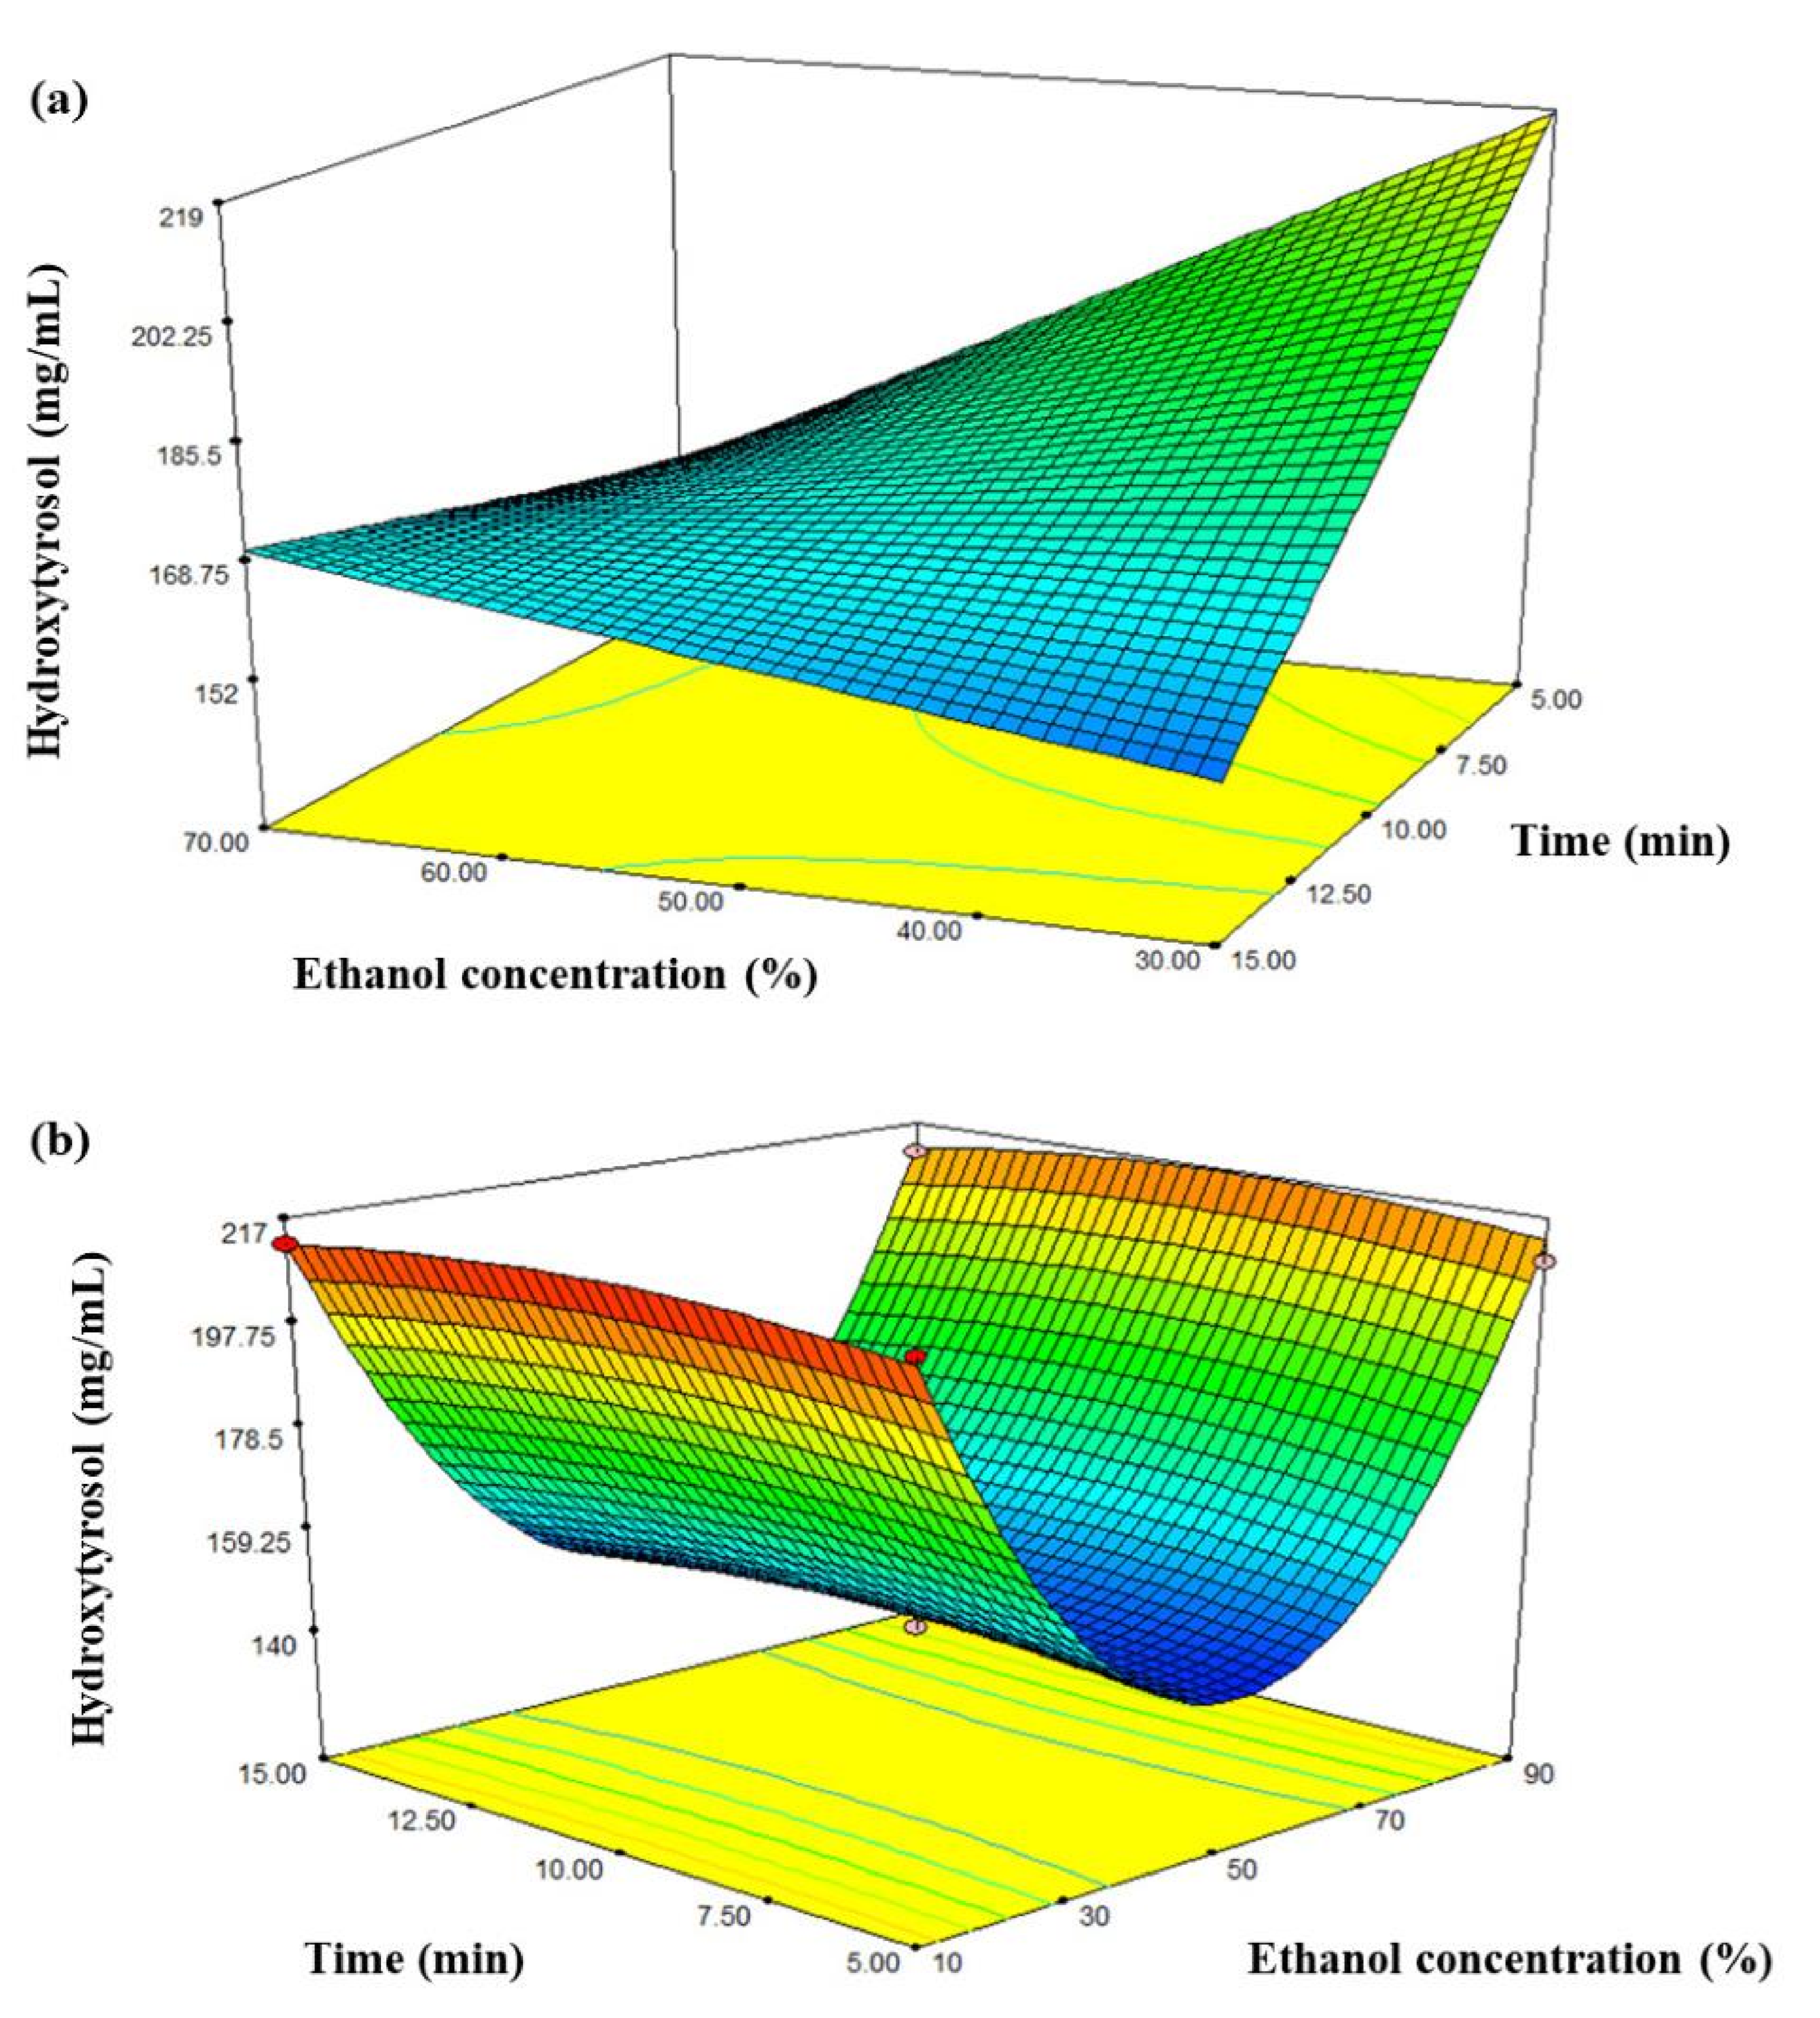
Moreover, to visualize the effects of independent variables on hydroxytyrosol content, the response surface plot was obtained (Figure 5). As shown in Figure 5a, the hydroxytyrosol concentration increased as the ethanol concentration and extraction time decreased in L. plantarum ATCC 14917 fermented olive leaf brine. On the contrary, the hydroxytyrosol concentration of the sample fermented with L. plantarum ATCC-BAA 793 increased as the ethanol concentration decreased and the extraction time increased (Figure 5b).
Based on the results of the optimization study, the optimum condition was determined as 30% amplitude—30% ethanol concentration—5 min extraction time for L. plantarum ATCC-14917, while it was found as 45% amplitude—10% ethanol concentration—9 min extraction time for L. plantarum ATCC-BAA 793 (Table 12). In addition, the desirability values at the optimum conditions were obtained as 0.746 and 0.952 for L. plantarum ATCC 14917 and L. plantarum ATCC-BAA 793, respectively.
Experimental results were obtained at the optimum point to determine the accuracy of the optimum condition. The hydroxytyrosol concentrations of fermented leaves, brine, and control (non-inoculated) extracts under optimum UAE conditions are given in Table 13. The hydroxytyrosol concentration was higher in the samples fermented with L. plantarum ATCC 14917 and L. plantarum ATCC-BAA 793 compared to the control samples (Table 13). On the other hand, the hydroxytyrosol concentrations of the Fleave-14917 and Fbrine-14917 were determined as 38.97 ± 0.86 and 362.29 ± 2.31 mg/L, respectively. Likewise, it was found to be 25.38 ± 0.53 and 248.79 ± 4.11 mg/L for the Fleave-793 and Fbrine-793. Hydroxytyrosol content in the fermented leaf brine was found to be higher than the leaves due to the diffusion of oleuropein and hydroxytyrosol from the leaves to the brine. In addition, L. plantarum ATCC 14917 (362.29 ± 2.31 mg/L) strain showed more activity in the bioconversion of oleuropein to hydroxytyrosol than L. plantarum ATCC-BAA 793 (248.79 ± 4.11) under optimum extraction conditions (Table 7). Hydroxytyrosol content of extracts obtained at the optimum point is given using HPLC chromatograms in Figure 6.
In a study in which olives were fermented using two lactobacillus strains (L. plantarum S175 and L. pentosus S100), the amount of hydroxytyrosol at the end of the fermentation process was found to be 154.2 mg/100 mL in the samples inoculated with L. plantarum S175 [7]. The researchers investigated the oleuropein degradation capacity of L. plantarum strains, and there was no significant increase in the amount of hydroxytyrosol (approximately less than 0.03 mg/mL in 72 h) in the sample by adding L. plantarum [34]. In our study, a notable increase in the amount of hydroxytyrosol (varied between 34.07 and 56.51 mg/mL in 72 h) was detected in samples fermented with L. plantarum strain when compared to the study of Iorizzo et al. [34]. In the study examining the conversion of oleuropein to hydroxytyrosol by different bacterial strains, the commercial oleuropein was used and the most effective strain was determined as L. plantarum 14917 with a hydroxytyrosol efficiency of approximately 30% and oleuropein degradation of 90% under aerobic conditions. After two weeks of fermentation, hydroxytyrosol content was found to be between 216.7 and 476.7 mg/mL for different L. plantarum strains [10]. It was seen in the present work, L. plantarum 14917 has shown less activity in the oleuropein degradation when compared with the study of Zago et al. [10]. These variations could be attributed to the characteristics of the olive fruit and its by-products, the enzymatic activities of the strains, and other different factors, and so, the degradation of oleuropein in olive leaves may differ from the degradation of commercial oleuropein.

4. Conclusions

In this study, olive leaves fermented naturally (non-inoculated) and with different strains of L. plantarum were examined in terms of bioconversion of oleuropein to hydroxytyrosol. UAE conditions were optimized to obtain an extract enriched with hydroxytyrosol content in the fermented olive leaf brine. The present study demonstrated that the selected oleuropeinolytic strains contribute to a notable rise in the hydroxytyrosol content and a great difference was observed between the hydroxytyrosol content of control and fermented olive leaf brine during bioconversion of oleuropein. Especially, L. plantarum ATCC 14917 showed more activity to obtain the high hydroxytyrosol concentration than L. plantarum ATCC-BAA 793. An increased concentration of hydroxytyrosol was obtained when UAE was carried out. Therefore, extraction conditions were optimized for olive leaf brine fermented with both L. plantarum strains. The use of these L. plantarum strains for the biological production of hydroxytyrosol from olive leaves will provide added value by utilizing olive leaves as agricultural waste in a new formulation.

Author Contributions

Visualization, C.I., P.K. and H.K.; Investigation, C.I. and P.K.; Project administration, P.K.; Methodology, C.I., P.K. and H.K.; Writing—original draft, C.I.; Data curation, P.K.; Writing—review & editing, C.I., P.K. and H.K.; Funding acquisition, P.K.; Supervision, P.K.; Software, P.K. All authors have read and agreed to the published version of the manuscript.

Funding

This study was financially supported by the Scientific and Technological Research Council of Turkey, TUBITAK (Project no: TOVAG 221O046).

Institutional Review Board Statement

Not applicable.

Informed Consent Statement

Not applicable.

Data Availability Statement

The data presented in this study are available in this article.

Conflicts of Interest

The authors declare no conflict of interest.

References

  1. Joana Gil-Chávez, G.; Villa, J.A.; Fernando Ayala-Zavala, J.; Basilio Heredia, J.; Sepulveda, D.; Yahia, E.M.; González-Aguilar, G.A. Technologies for extraction and production of bioactive compounds to be used as nutraceuticals and food ingredients: An overview. Compr. Rev. Food Sci. Food Saf. 2013, 12, 5–23. [Google Scholar] [CrossRef]
  2. Cifá, D.; Skrt, M.; Pittia, P.; Di Mattia, C.; Poklar Ulrih, N. Enhanced yield of oleuropein from olive leaves using ultrasound-assisted extraction. Food Sci. Nutr. 2018, 6, 1128–1137. [Google Scholar] [CrossRef] [PubMed]
  3. El, S.N.; Karakaya, S. Olive tree (Olea europaea) leaves: Potential beneficial effects on human health. Nutr. Rev. 2009, 67, 632–638. [Google Scholar] [CrossRef] [PubMed]
  4. Markhali, F.S.; Teixeira, J.A.; Rocha, C.M.R. Olive tree leaves-A source of valuable active compounds. Processes 2020, 8, 1177. [Google Scholar] [CrossRef]
  5. Behera, S.S.; Ray, R.C.; Zdolec, N. Lactobacillus plantarum with functional properties: An approach to increase safety and shelf-life of fermented foods. Biomed Res Int. 2018, 2018, 9361614. [Google Scholar] [CrossRef]
  6. Perpetuini, G.; Prete, R.; Garcia-Gonzalez, N.; Khairul Alam, M.; Corsetti, A. Table olives more than a fermented food. Foods 2020, 9, 178. [Google Scholar] [CrossRef]
  7. Ghabbour, N.; Lamzira, Z.; Thonart, P.; Cidalia, P.; Markaoui, M.; Asehraou, A. Selection of oleuropein-degrading lactic acid bacteria strains isolated from fermenting moroccan green olives. Grasas Aceites. 2011, 62, 84–89. [Google Scholar] [CrossRef]
  8. Nan, J.N.; Ververis, K.; Bollu, S.; Rodd, A.L.; Swarup, O.; Karagiannis, T.C. Biological effects of the olive polyphenol, hydroxytyrosol: An extra view from genome-wide transcriptome analysis. Hell. J. Nucl. Med. 2014, 17, 62–69. [Google Scholar]
  9. Attya, M.; Benabdelkamel, H.; Perri, E.; Russo, A.; Sindona, G. Effects of conventional heating on the stability of major olive oil phenolic compounds by tandem mass spectrometry and isotope dilution assay. Molecules 2010, 15, 8734–8746. [Google Scholar] [CrossRef]
  10. Zago, M.; Lanza, B.; Rossetti, L.; Muzzalupo, I.; Carminati, D.; Giraffa, G. Selection of Lactobacillus plantarum strains to use as starters in fermented table olives: Oleuropeinase activity and phage sensitivity. Food Micro. 2013, 34, 81–87. [Google Scholar] [CrossRef]
  11. Bencresciuto, G.F.; Mandal, C.; Migliori, C.A.; Cortellino, G.; Vanoli, M.; Bardi, L. Assessment of starters of lactic acid bacteria and killer yeasts: Selected strains in lab-scale fermentations of table olives (Olea europaea L.) cv. Leccino. Fermentation 2023, 9, 182. [Google Scholar] [CrossRef]
  12. Kumar, S. Analytical Techniques for Natural Product Research, 1st ed.; CABI Oxfordshire Press: Wallingford, UK, 2018; ISBN 978-1780644738. [Google Scholar]
  13. Novak, I.; Janeiro, P.; Seruga, M.; Oliveira-Brett, A.M. Ultrasound extracted flavonoids from four varieties of Portuguese red grape skins determined by reverse-phase high-performance liquid chromatography with electrochemical detection. Anal. Chim. Acta. 2008, 630, 107–115. [Google Scholar] [CrossRef]
  14. Azmir, J.; Zaidul, I.S.M.; Rahman, M.M.; Sharif, K.M.; Mohamed, A.; Sahena, F.; Jahurul, M.H.A.; Ghafoor, K.; Norulaini, N.A.N.; Omar, A.K.M. Techniques for extraction of bioactive compounds from plant materials: A review. J. Food Eng. 2013, 117, 426–436. [Google Scholar] [CrossRef]
  15. Reverón, I.; Plaza-vinuesa, L.; Santamaría, L.; Oliveros, J.C.; de las Rivas, B.; Muñoz, R.; de Felipe, F.L. Transcriptomic evidence of molecular mechanisms underlying the response of Lactobacillus plantarum wcfs1 to hydroxytyrosol. Antioxidants 2020, 9, 442. [Google Scholar] [CrossRef]
  16. Helrich, K. The Association of Official Analytical Chemists, 15th ed; AOAC international: Arlington, VA, USA, 1990. [Google Scholar]
  17. Kelebek, H.; Selli, S.; Canbas, A.; Cabaroglu, T. HPLC determination of organic acids, sugars, phenolic compositions and antioxidant capacity of orange juice and orange wine made from a Turkish cv. Kozan. Microchem. J. 2009, 91, 187–192. [Google Scholar] [CrossRef]
  18. Ghabbour, N.; Rokni, Y.; Lamzira, Z.; Thonart, P.; Chihib, N.; Peres, C.; Asehraou, A. Controlled fermentation of Moroccan picholine green olives by oleuropein-degrading Lactobacilli strains. Grasas Aceites 2016, 67, e138. [Google Scholar] [CrossRef]
  19. Ghabbour, N.; Rokni, Y. In vıtro bıodegradatıon of oleuropeın by Lactobacıllus plantarum FSO175 in stress condıtıons (pH, NaCl and Glucose). J. Microbiol Biotech Food Sci. 2020, 9, 769–773. [Google Scholar] [CrossRef]
  20. Leal-Sánchez, M.V.; Ruiz-Barba, J.L.; Sánchez, A.H.; Rejano, L.; Jiménez-Díaz, R.; Garrido, A. Fermentation profile and optimization of green olive fermentation using Lactobacillus plantarum LPCO10 as a starter culture. Food Microbiol. 2003, 20, 421–430. [Google Scholar] [CrossRef]
  21. Ma, J.; Wang, W.; Sun, C.; Gu, L.; Liu, Z.; Yu, W.; Chen, J.; Jiang, Z.; Hou, J. Effects of environmental stresses on the physiological characteristics, adhesion ability and pathogen adhesion inhibition of Lactobacillus plantarum KLDS 1.0328. Proc. Biochem. 2020, 92, 426–436. [Google Scholar] [CrossRef]
  22. Perricone, M.; Bevilacqua, A.; Corbo, M.R.; Sinigaglia, M. Use of Lactobacillus plantarum and glucose to control the fermentation of ‘Bella di Cerignola’ table olives, a traditional variety of Apulian Region (Southern Italy). J. Food Sci. 2010, 75, 430–436. [Google Scholar] [CrossRef]
  23. Vaccalluzzo, A.; Pino, A.; De Angelis, M.; Bautista-Gallego, J.; Romeo, F.V.; Foti, P.; Caggia, C.; Randazzo, C.L. Effects of different stress parameters on growth and on oleuropein-degrading abilities of Lactiplantibacillus plantarum strains selected as tailored starter cultures for naturally table olives. Microorganisms 2020, 8, 1607. [Google Scholar] [CrossRef] [PubMed]
  24. Bevilacqua, A.; Altieri, C.; Corbo, M.R.; Sinigaglia, M.; Ouoba, L.I.I. Characterization of lactic acid bacteria isolated from Italian Bella di Cerignola table olives: Selection of potential multifunctional starter cultures. J. Food Sci. 2010, 75, 536–544. [Google Scholar] [CrossRef] [PubMed]
  25. Randazzo, C.L.; Restuccia, C.; Romano, A.D.; Caggia, C. Lactobacillus casei, dominant species in naturally fermented Sicilian green olives. Int. J. Food Microbiol. 2004, 90, 9–14. [Google Scholar] [CrossRef] [PubMed]
  26. Servili, M.; Settanni, L.; Veneziani, G.; Esposto, S.; Massitti, O.; Taticchi, A.; Urbani, S.; Montedoro, G.F.; Corsetti, A. The use of Lactobacillus pentosus 1MO to shorten the debittering process time of black table olives (Cv. Itrana and Leccino): A pilot-scale application. J. Agric. Food Chem. 2006, 54, 3869–3875. [Google Scholar] [CrossRef] [PubMed]
  27. Romeo, F.; Poiana, M. Ability of commercially available Lactobacillus strains as starter in brining and debittering of table olives. Acta Aliment. 2007, 36, 49–60. [Google Scholar] [CrossRef]
  28. Özdemir, Y.; Akcay, M.E. Olive debittering methods and physical and chemical changes during debittering. In Proceedings of the Presented at National Olive Congress, Manisa, Turkey, 22–25 February 2011. [Google Scholar]
  29. Bouaziz, M.; Feki, I.; Ayadi, M.; Jemai, H.; Sayadi, S. Stability of refined olive oil and olivepomace oil added by phenolic compunds from olive leaves. Eur. J. Lipid Sci. Technol. 2010, 112, 894–905. [Google Scholar] [CrossRef]
  30. Rodríguez, H.; Curiel, J.A.; Landete, J.M.; de las Rivas, B.; de Felipe, F.L.; Gómez-Cordovés, C.; Mancheño, J.M.; Muñoz, R. Food phenolics and lactic acid bacteria. Int. J. Food Microbiol. 2009, 132, 79–90. [Google Scholar] [CrossRef]
  31. Ramírez, E.; Brenes, M.; Garćıa, P.; Medina, E.; Romero, C. Oleuropein hydrolysis in natural green olives: Importance of the endogenous enzymes. Food Chem. 2016, 206, 204–209. [Google Scholar] [CrossRef]
  32. Bautista-Gallego, J.; Arroyo-Lopez, F.N.; Rantsiou, K.; Jimenez-Diaz, R.; Garrido-Fernandez, A.; Cocolin, L. Screening of lactic acid bacteria isolated from fermented table olives with probiotic potential. Food Res. Int. 2013, 50, 135–142. [Google Scholar] [CrossRef]
  33. Candioti, L.; De Zan, M.M.; Cámara, M.S.; Goicoechea, H.C. Experimental design and multiple response optimization. Using the desirability function in analytical methods development. Talanta 2014, 124, 123–138. [Google Scholar] [CrossRef]
  34. Iorizzo, M.; Lombardi, S.J.; Macciola, V.; Testa, B.; Lustrato, G.; Lopez, F.; De Leonardis, A. Technological potential of lactobacillus strains isolated from fermented green olives: In vitro studies with emphasis on oleuropein-degrading capability. Sci. World J. 2016, 2016, 1917592. [Google Scholar] [CrossRef] [PubMed]
Figure 1. pH (a) and total acidity (b) changes of fermented olive leaf with L. plantarum ATCC 14917 and BAA-793 culture at 30 °C for 21 days.
Fermentation 09 00514 g001
Figure 2. Lactic acid bacteria (LAB) count in olive leaves inoculated with L. plantarum ATCC 14917 and L. plantarum ATCC-BAA 793.
Fermentation 09 00514 g002
Figure 3. Growth curve for L. plantarum ATCC 14917 (a) and L. plantarum ATCC-BAA 793 (b) in modified MRS broth medium.
Fermentation 09 00514 g003
Figure 4. Bioconversion of oleuropein to hydroxytyrosol in control samples (non-inoculated) (a) and the fermented olive leaf brine inoculated with L. plantarum ATCC 14917 (b) and L. plantarum ATCC-BAA 793 (c).
Fermentation 09 00514 g004
Figure 5. Three-dimensional response surface plots for hydroxytyrosol concentration of sample extracts fermented with L. plantarum ATCC 14917 (a) and L. plantarum ATCC-BAA 793 (b).
Fermentation 09 00514 g005
Figure 6. LC-DAD-ESI-MS/MS chromatograms obtained for the hydroxytyrosol content of samples at the optimum point, (a) fermented leaves and brine with L. plantarum ATCC 14917; (b) fermented leaves and brine with L. plantarum ATCC-BAA 793; (c) control (non-inoculated).
Fermentation 09 00514 g006
Table 1. Change in oleuropein and hydroxytyrosol concentration in fermented (F) olive leaves and brines during the fermentation process.
Oleuropein (mg/L)
Days
Samples13571421
Fbrine-14917153.12 ± 2.52348.19 ± 1.27583.63 ± 4.83535.23 ± 1.80395.90 ± 7.17298.64 ± 5.17
Fbrine-793110.68 ± 1.8239.68 ± 0.99342.5 ± 2.31350.78 ± 3.89300.69 ± 1.22246.14 ± 3.37
Fleave-1491758.89 ± 0.4532.35 ± 0.7429.60 ± 0.3815.92 ± 0.5215.48 ± 0.7811.08 ± 0.49
Fleave-79375.77 ± 0.1440.22 ± 0.3326.54 ± 0.4111.43 ± 0.839.37 ± 0.187 56 ± 0.21
Hydroxytyrosol (mg/mL)
13571421
Fbrine-1491728.16 ± 0.1456.51 ± 0.58109.75 ± 1.33114.88 ± 2.03122.06 ± 1.07126.89 ± 1.59
Fbrine-79311.83 ± 0.1234.07 ± 0.1050.89 ± 0.5857.43 ± 0.1478.99 ± 1.0185.93 ± 0.70
Fleave-149170.60 ± 0.220.61 ± 0.270.66 ± 0.570.70 ± 0.401.23 ± 0.181.74 ± 0.25
Fleave-7930.62 ± 0.620.64 ± 0.240.67 ± 0.370.69 ± 0.310.81 ± 0.180.95 ± 0.27
Fbrine-14917: Fermented leaf brine with L. plantarum ATCC 14917; Fbrine-793: Fermented leaf brine with L. plantarum ATCC-BAA 793; Fleave-14917: Fermented leaves with L. plantarum ATCC 14917; Fleave-793: Fermented leaves with L. plantarum ATCC-BAA 793.
Table 2. Process variables used in the Box–Behnken design for L. plantarum ATCC 14917 and L. plantarum ATCC-BAA 793.
Independent Variables Variable Level Codes
L. plantarum ATCC 14917Code−10+1
Ethanol concentrationX1305070
AmplitudeX2304050
TimeX351015
L. plantarum ATCC-BAA 793Code−10+1
Ethanol concentrationX1105090
AmplitudeX2304050
TimeX351015
Table 3. Box–Behnken Design for the hydroxytyrosol concentration of the olive leaf brine fermented with L. plantarum ATCC 14917 and L. plantarum ATCC-BAA 793 using UAE.
RunAmplitude (%)
(A)
Ethanol Concentration (%) (B)Time (min)
(C)
Hydroxytyrosol Concentration (mg/L)
L. plantarum ATCC-14917
130505173.56 ± 0.80
2505015168.35 ± 0.44
3405010170.52 ± 0.95
4507010171.14 ± 0.85
5407015169.43 ± 0.76
6305015152.98 ± 0.95
750505164.62 ± 0.34
8503010166.67 ± 0.96
9307010164.98 ± 0.49
10405010142.24 ± 0.69
11403015162.74 ± 0.81
1240305244.02 ± 0.81
13405010197.82 ± 0.92
14303010193.46 ± 0.65
1540705167.63 ± 0.95
L. plantarum ATCC-BAA 793
130505144.17 ± 0.02
2505015144.08 ± 0.05
3405010140.34 ± 0.02
4509010217.36 ± 0.11
5409015211.20 ± 0.06
6305015139.59 ± 0.12
750505143.01 ± 0.08
8501010216.31 ± 0.50
9309010220.59 ± 0.35
10405010146.54 ± 0.04
11401015212.40 ± 0.20
1240105214.50 ± 0.61
13405010147.10 ± 0.08
14301010215.63 ± 0.27
1530505144.17 ± 0.02
Numbers show average value per treatment ± standard deviation.
Table 4. The sequential model sum of squares obtained from the amounts of hydroxytyrosol of samples which was added L. plantarum ATCC 14917 under extraction conditions.
SourceSum of SquaresdfMean SquareF Valuep-Value
Mean vs. Total4.542 × 10514.542 × 105
Linear vs. Mean2283.513761.171.530.2621
2FI vs. Linear2144.533714.841.710.2410
Quadratic vs. 2FI948.443316.150.660.6101
Cubic vs.
Quadratic
842.973280.990.360.7903
Residual1545.292772.64
Total4.619 × 1051530,795.74
Table 5. The sequential model sum of squares obtained from the amounts of hydroxytyrosol of samples which was added L. plantarum ATCC-BAA 793 under extraction conditions.
SourceSum of SquaresdfMean SquareF Valuep-Value
Mean vs. Total4.940 × 10514.940 × 105
Linear vs. Mean1.6930.563.265 × 10−41.000
2FI vs. Linear16.1435.382.266 × 10−30.9998
Quadratic vs. 2FI18,942.3436314.11588.20<0.0001
Cubic vs.
Quadratic
25.5438.510.610.6717
Residual28.13214.06
Total5.130 × 1051534,198.75
Table 6. Analysis of variance (ANOVA) on the effect of model and independent variables on the response for L. plantarum ATCC 14917.
SourceSum of SquaresdfMean SquareF Valuep-Value
Model4428.056738.011.770.2228significant
A-Amplitude25.17125.170.0600.8121
B-Etanol concentration1097.9311097.932.630.1434
C-Time1160.4211160.422.780.1339
AB271.761271.760.650.4429
AC147.621147.620.350.5683
BC1725.1611725.164.140.0764
Residual3336.708417.09
Lack of fit1791.416298.570.390.8452insignificant
Pure Error1545.292772.64
Total7764.7514
Table 7. Analysis of variance (ANOVA) for reduced factor on the effect of model and independent variables on the response for L. plantarum ATCC 14917.
SourceSum of SquaresdfMean SquareF Valuep-Value
Model3983.5031327.833.860.0413significant
B-B1097.9311097.933.190.1015
C-C1160.4211160.423.380.0933
BC1725.1611725.165.020.0467
Residual3781.2511343.75
Lack of fit2235.969248.440.320.9060insignificant
Pure Error1545.292772.64
Total7764.7514
B: Ethanol concentration; C: Time.
Table 8. Terms used in testing fit of model for sample by adding L. plantarum ATCC 14917.
Standard deviation18.54
Mean174.01
R-Squared0.5130
Adj R-Squared0.3802
Pred R-Squared−0.1296
Adeq Precision6.854
C.V. %10.66
PRESS8771.44
Table 9. Analysis of variance (ANOVA) on the effect of model and independent variables on response for L. plantarum ATCC-BAA 793.
SourceSum of SquaresdfMean SquareF Valuep-Value
Model18,960.1792106.69196.25<0.0001significant
AB3.8413.840.360.5759
AC7.9917.990.740.4277
BC4.3114.310.400.5544
A212.70112.701.180.3263
B218,591.22118,591.221731.89<0.0001
C253.49153.494.980.0759
Residual53.67510.73
Lack of fit25.5438.510.610.6717insignificant
Pure Error28.13214.06
Total19,013.8514
Table 10. Analysis of variance (ANOVA) for reduced factor on the effect of model and independent variables on response for L. plantarum ATCC-BAA 793.
SourceSum of SquaresdfMean SquareF Valuep-Value
Model18,931.2544732.81573.02<0.0001significant
B218,626.75118,626.752255.22<0.0001
C257.92157.927.010.0244
Residual82.59108.26
Lack of fit54.4686.810.480.8109insignificant
Pure Error28.13214.06
Total19,013.8514
Table 11. Terms used in testing fit of model for sample by adding L. plantarum ATCC-BAA 793.
Standard deviation2.87
Mean181.47
R-Squared0.9957
Adj R-Squared0.9939
Pred R-Squared0.9904
Adeq Precision45.367
C.V. %1.58
PRESS181.72
Table 12. Optimum extraction condition in Box–Behnken experimental design created by Response Surface Methodology of samples fermented with L plantarum ATCC-14917 and L. plantarum ATCC-BAA 793.
RunAmplitude (%)Ethanol Concentration (%)Time (min)Hydroxytyrosol Content (mg/L)Desirability
L plantarum ATCC-14917
130.4330.005.00218.490.746Selected
247.5930.005.00218.490.746
330.7530.005.00218.490.746
441.4430.005.00218.490.746
542.5830.005.00218.490.746
634.9230.005.00218.490.746
747.4730.005.00218.490.746
839.9130.005.00218.490.746
935.3030.005.00218.490.746
1044.4130.005.00218.490.746
1130.2430.005.00218.490.746
1245.2730.005.00218.490.746
1331.0330.005.00218.490.746
1448.2630.005.00218.490.746
L. plantarum ATCC-BAA 793
145.4910.009.71216.7020.952Selected
231.1310.009.72216.7020.952
334.7910.009.73216.7020.952
444.5010.009.71216.7020.952
536.1010.009.73216.7020.952
639.8810.009.72216.7020.952
738.4910.009.72216.7020.952
839.8110.009.71216.7020.952
937.2110.009.72216.7020.952
1032.0110.009.74216.7020.952
1142.9510.009.73216.7020.952
1245.2110.009.72216.7020.952
1339.3110.009.72216.7020.952
1433.7810.009.61216.7020.952
Table 13. Hydroxytyrosol concentrations (mg/L) of fermented olive leaves and brines extracted at the optimum point.
SamplesHydroxytyrosol Content (mg/L)
Fbrine-14917362.29 ± 2.31
Fleaf-1491738.97 ± 0.86
Fbrine-793248.79 ± 4.11
Fleaf-79325.38 ± 0.53
Control (non-inoculated bacteria)21.47 ± 0.47
Fbrine-14917: Fermented leaf brine with L. plantarum ATCC 14917; Fbrine-793: Fermented leaf brine with L. plantarum ATCC-BAA 793; Fleaf-14917: Fermented leaves with L. plantarum ATCC 14917; Fleaf-793: Fermented leaves with L. plantarum ATCC-BAA 793.
Disclaimer/Publisher’s Note: The statements, opinions and data contained in all publications are solely those of the individual author(s) and contributor(s) and not of MDPI and/or the editor(s). MDPI and/or the editor(s) disclaim responsibility for any injury to people or property resulting from any ideas, methods, instructions or products referred to in the content.

