Article

Heterologous Biosynthesis of Hyaluronic Acid Using a New Hyaluronic Acid Synthase Derived from the Probiotic Streptococcus thermophilus

1
State Key Laboratory of Biobased Material and Green Papermaking, Qilu University of Technology, Shandong Academy of Sciences, Jinan 250353, China
2
State Key Laboratory of Materials-Oriented Chemical Engineering, College of Food Science and Light Industry, Nanjing Tech University, Nanjing 211816, China
3
College of Biological and Food Engineering, Changshu Institute of Technology, Changshu 215500, China
*
Authors to whom correspondence should be addressed.
Fermentation 2023, 9(6), 510; https://doi.org/10.3390/fermentation9060510
Submission received: 26 April 2023 / Revised: 23 May 2023 / Accepted: 23 May 2023 / Published: 25 May 2023
(This article belongs to the Special Issue Research on Microbial Protein Synthesis)

Abstract

:
Hyaluronic acid (HA) is a natural linear polysaccharide extensively used in many fields, including the food, medicine, and cosmetics industries. Currently, species that produce HA synthetase (HAS) from microbial sources are relatively small and mainly pathogenic, such as Streptococcus pyogenes and Pasteurella multicide. Moreover, there is limited research on the safe microbial sources of HAS. Thus, we characterized SthasA, a HAS derived from the probiotic Streptococcus thermophilus, and used it for the de novo synthesis of HA in a chassis strain of Bacillus amyloliquefaciens. Metabolic engineering of the precursor supply modules suggested that hasB (encoding UDPG dehydrogenase), which was derived from Corynebacterium glutamicum ATCC 13032, effectively promoted the accumulation of HA products. Furthermore, by combining the expression of the global regulatory factor CcpA, HA yield from the recombinant strain reached 3.20 g/L. Finally, we obtained a yield of 5.57 g/L HA with a molecular weight of 1.7 × 10⁶ Da using various process optimization strategies in a 5 L bioreactor. This study enriches our understanding of obtaining HAS from non-pathogenic bacteria and provides a safe and effective process for producing HA, which has the potential to promote the industrial applications of HA further.

Graphical Abstract

1. Introduction

Glycosaminoglycans (GAGs) are a class of straight-chain acidic polysaccharides that play a broad range of essential biological roles. They are widely distributed in the extracellular matrix and on the cell surfaces of animal tissues. They interact with signaling molecules and play a role in regulating cell proliferation and differentiation [1,2]. GAGs can be classified into four main classes based on their structures: hyaluronic acid (HA), heparin sulfate, chondroitin sulfate, and keratin sulfate. HA is the only non-sulfated linear polysaccharide in the GAG family that is not bound to proteins. The basic structure of HA is composed of d-glucuronic acid (GlcUA) and N-acetyl-D-glucosamine (GlcNAc), which are alternately linked by β-1,3 and β-1,4 glycosidic bonds. HA is widely used in medicine, cosmetics, and food products because of its unique viscoelasticity, hygroscopicity, non-immunogenicity, and biocompatibility properties [3,4,5]. In medical applications, HA acts as a lubricant to protect the ends of bones [6]. In cosmetics, an aqueous solution of HA is primarily used to form a viscoelastic gel that can be applied to the skin to moisturize, rejuvenate, and improve wound healing [7]. Studies on the use of HA in food have focused on increasing the amount of HA in the body via oral administration. Schwartz et al. reported that oral dietary supplements containing HA reduced facial wrinkles and increased skin elasticity and collagen content [8]. In addition, oral HA supplementation prevents symptoms such as arthritis, arteriosclerosis, and an irregular pulse.
HA is primarily derived from animal tissues and microbial fermentation processes. Due to the limited quality and quantity of raw materials, HA yield costs are high. Coupled with the frequent occurrence of animal epidemics, source cross-infection events lead to increased health and safety concerns, thus limiting the application of HA in biomedicine and clinical practice [9,10]. In recent years, microbial fermentation has gradually replaced tissue extraction as the main source of HA, mainly using the fermentation of Streptococcus zooepidemicus [11,12]. The mechanism for HA synthesis has been continuously analyzed due to the continuous developments in synthetic biology [13,14]. The use of microorganisms with well-defined genetic backgrounds and high biosecurity to synthesize HA has become a trend in developing microbial fermentation to synthesize HA. The HA synthesis pathway has been successfully developed for efficient recombinant HA yield in safe microbial hosts, such as Bacillus subtilis [15], Corynebacterium glutamicum [16], and Bacillus amyloliquefaciens [17]. As shown in our previous studies, compared to the traditional B. subtilis chassis, B. amyloliquefaciens is an important, safe microbial host that has been developed for the production of biopolymers such as HA [17], poly(γ-glutamic acid) [18,19], and other high-value-added chemicals such as ornithine [20]. Although Ma et al. confirmed that the HA synthesis pathway constructed in B. amyloliquefaciens could synthesize HA, its yield was 2.89 g/L, which was still low [17]. Therefore, mining for efficient HA synthetase (HAS) is an effective method for efficient HA biosynthesis.
Using a bioinformatics analysis of the HAS domain, this study identified HAS derived from the probiotic Streptococcus thermophilus using genomic databases. To validate the ability of this enzyme to synthesize HA, this study successfully synthesized HAS in B. amyloliquefaciens. HA synthesis was promoted by optimizing the precursor pathway, improving the supply of the precursor UDPG-GlcUA, and overexpressing transcriptional regulators. In addition, the medium in the shaker flask was optimized using statistical techniques and expanded in a 5 L fermenter to achieve efficient fermentation for HA synthesis. This study established an efficient method to produce valuable HA biopolymers using the newly discovered HAS.

2. Materials and Methods

2.1. Materials and Reagents

The DNA standard marker, 2 × Phanta® Flash Master Mix DNA polymerase, and the ClonExpress II One Step Cloning Kit were purchased from Vazyme Biotech Co., Ltd. (Nanjing, China). Restriction enzymes (NdeI and BamHI) were purchased from New England Biolabs (Beijing Co. Ltd., Beijing, China). HA standards for high-performance liquid chromatography (HPLC) analysis were purchased from Bloomchi Biotechnology Co., Ltd. (Shandong, China). The pMA5 vector was maintained in our laboratory. All other chemicals and reagents were purchased from Shanghai Macklin Biochemical Co. Ltd. (Shanghai, China). All strains and plasmids used in this study are listed in Table 1, and the primers used are listed in Table S1.

2.2. Bioinformatics Analysis

Clustal Omega (https://www.ebi.ac.uk/Tools/msa/clustalo/ accessed on 20 October 2022) was used to analyze the amino acid sequence homology. MEGA software was used to construct a phylogenetic tree. MEME (https://memesuite.org/meme/doc/meme.html accessed on 23 October 2022) was used to analyze conserved amino acid sequence motifs. Multi-sequence alignment and secondary structure prediction were performed using ESPript 3 (https://espript.ibcp.fr/ESPript/ESPript/ accessed on 1 November 2022). The CCTOP prediction server (http://cctop.enzim.ttk.mta.hu/ accessed on 2 November 2022) was used to predict the transmembrane domains. SWIS-SMODEL (https://swissmodel.expasy.org/interactive accessed on 5 November 2022) was used to perform three-level spatial structure analysis and model building. Finally, PyMOL software (Schrödinger, Schrodinger, New York, NY, USA) produced the SthasA cartoon three-level structure and a surface TV distribution map.

2.3. Construction of the Recombinant Strains

The SthasA sequence was synthesized by General Biology (Chuzhou, China). NdeI and BamHI were used to digest the pMA5 plasmids. pMA5-StA was generated by ligating linearized vectors and PCR fragments with the ClonExpress II One Step Cloning Kit, which was then transformed into E. coli DH5α cells and GM2163 for plasmid construction and demethylation. Incubation was performed at 37 °C for 12 h with a positive colony carrying the pMA5-StA plasmid in Luria–Bertani medium containing 100 mg/L ampicillin. pMA5-StA was identified using enzymatic digestion with NdeI and BamHI.
To investigate the effects of UDPG-GlcUA on HA expression, primers CghasB-F/R were used to amplify the UDPG-dehydrogenase-encoding gene tuaD (hasB) from C. glutamicum ATCC 13032, yielding the plasmid pMA5-StAB. Primers BmhasC-F/R, CghasC-F/R, BshasC-F/R, SphasC-F/R, and PahasC-F/R were used to amplify the UTP-glucose-1-phosphate uridylyltransferase-encoding gene gtaB (hasC) in B. amyloliquefaciens ATCC 13032, C. glutamicum ATCC 13032, B. subtilis 168, Sphingomonas sp. NX-3, and Pantoea alhagi NX-11. The plasmid pMA5-StABC1∼5 was produced as a result. All the plasmids were sent to General Biology (Chuzhou, China) for DNA sequencing. The resulting plasmids were transformed into B. amyloliquefaciens for HA production.

2.4. Studies on Global Transcription Regulators

B. amyloliquefaciens genomic DNA was extracted using a Novezan (Nanjing, China) Gram-positive bacterial genome extraction kit. Using the primers CcpA-F/R, CodY-F/R, ThrA-F/R, ComK-F/R, Spo0A-F/R, AbrB-F/R, FruR-F/R, and Rex-F/R, we amplified seven common global metabolic transcriptional regulators and one redox factor gene from the genome of B. amyloliquefaciens. Because transcription factors targeting both HA precursors have not been reported, four relevant transcription factors were predicted using the website (https://dbtbs.hgc.jp/ accessed on 21 November 2022) and amplified using the primers SigA-F/R, CtsR-F/R, BkdR-F/R, and GlnR-F/R. The recombinant strain B. amyloliquefaciens SE-StAB1-12 was constructed using the method described in Section 2.3. HA yield was determined, and the transcriptional regulator with the most significant effect on HA yield was screened.

2.5. Box–Behnken Design and Response Surface Methodology Experiment

The culture medium for recombinant B. amyloliquefaciens SE-StAB was optimized to improve the HA yield. Initially, single-factor experiments determined the level of each factor. The optimal medium composition is sucrose 40 g/L, yeast extract powder (YEP) 10 g/L, Mg4SO2 6 g/L, temperature 32 °C, pH 7.0, and inoculation 6%. Then, sucrose, YEP, and MgSO4·7H2O were selected as independent variables and further optimized using response surface methodology for HA yield. In this study, a Box–Behnken design (BBD) was used, and the 17 experiments are listed in Table 2. Each batch was fermented in a 250 mL Erlenmeyer flask containing 50 mL of medium and repeated three times.

2.6. HA Overproduction in a 5 L Fermenter

The fermentation of recombinant B. amyloliquefaciens SE-StAB was investigated in a 5 L fermenter. The model, BIOTECH-5BG-2, was purchased from Shanghai Baoxing Bio-device Engineering Co., Ltd. (Shanghai, China). After incubating the seed fluid for 10 h, it was inoculated into a 5 L fermenter containing 3 L of liquid at 6% of the inoculum volume for batch fermentation. Simultaneously, kanamycin sulfate and sucrose were added such that the concentration of kanamycin sulfate was 25 mg/L, and the final sucrose concentration was 40 g/L. Sodium hydroxide was used to control the pH at 7.0 ± 0.1. The ventilation and rotational velocities maintained the dissolved oxygen (DO) at 20%. The initial rotational speed and ventilation rate were set to 400 rpm and 4 vvm, respectively. During fermentation, samples were collected every 4 h, and the residual sugar, HA concentration, and dry cell weight (DCW) in the fermenting liquid were measured. Shaker fermentation was used as a control.

2.7. Analytical Method

According to the reference [17], the HA yield from the recombinant strain was determined using HPLC. The fermenting solution was diluted 5 times and centrifuged to remove bacteria. The supernatant was filtered with a 0.22 μm filter membrane and collected in a chromatographic injection bottle. A solution of 0.1 M Na2SO4 was prepared as the moving phase, with the pH adjusted to 4.0 using acetic acid at a flow rate of 0.8 mL/min. The peak region was monitored, and the HA standard was used to produce the standard curve. Upon conversion, the HA yield was obtained. DCW was determined using the constant weight method, and the cell concentration in the fermentation broth was calculated [17]. The purified HA samples were sent to Hangzhou Yanqu Information Technology Co., Ltd. (Zhejiang, China). The product was characterized and analyzed using Fourier transform infrared (FT-IR) and 1H-NMR spectroscopy to demonstrate that the purified product was indeed HA. Therefore, the screening enzyme SthasA could be used for HA synthesis in B. amyliquefaciens. All measurements were taken three times, and the SPSS 19.0 software (IBM, Chicago, IL, USA) was used for statistical analysis. All figures were drawn using Origin 2021 software (OriginLab Corporation, Northampton, MA, USA).

3. Result and Discussion

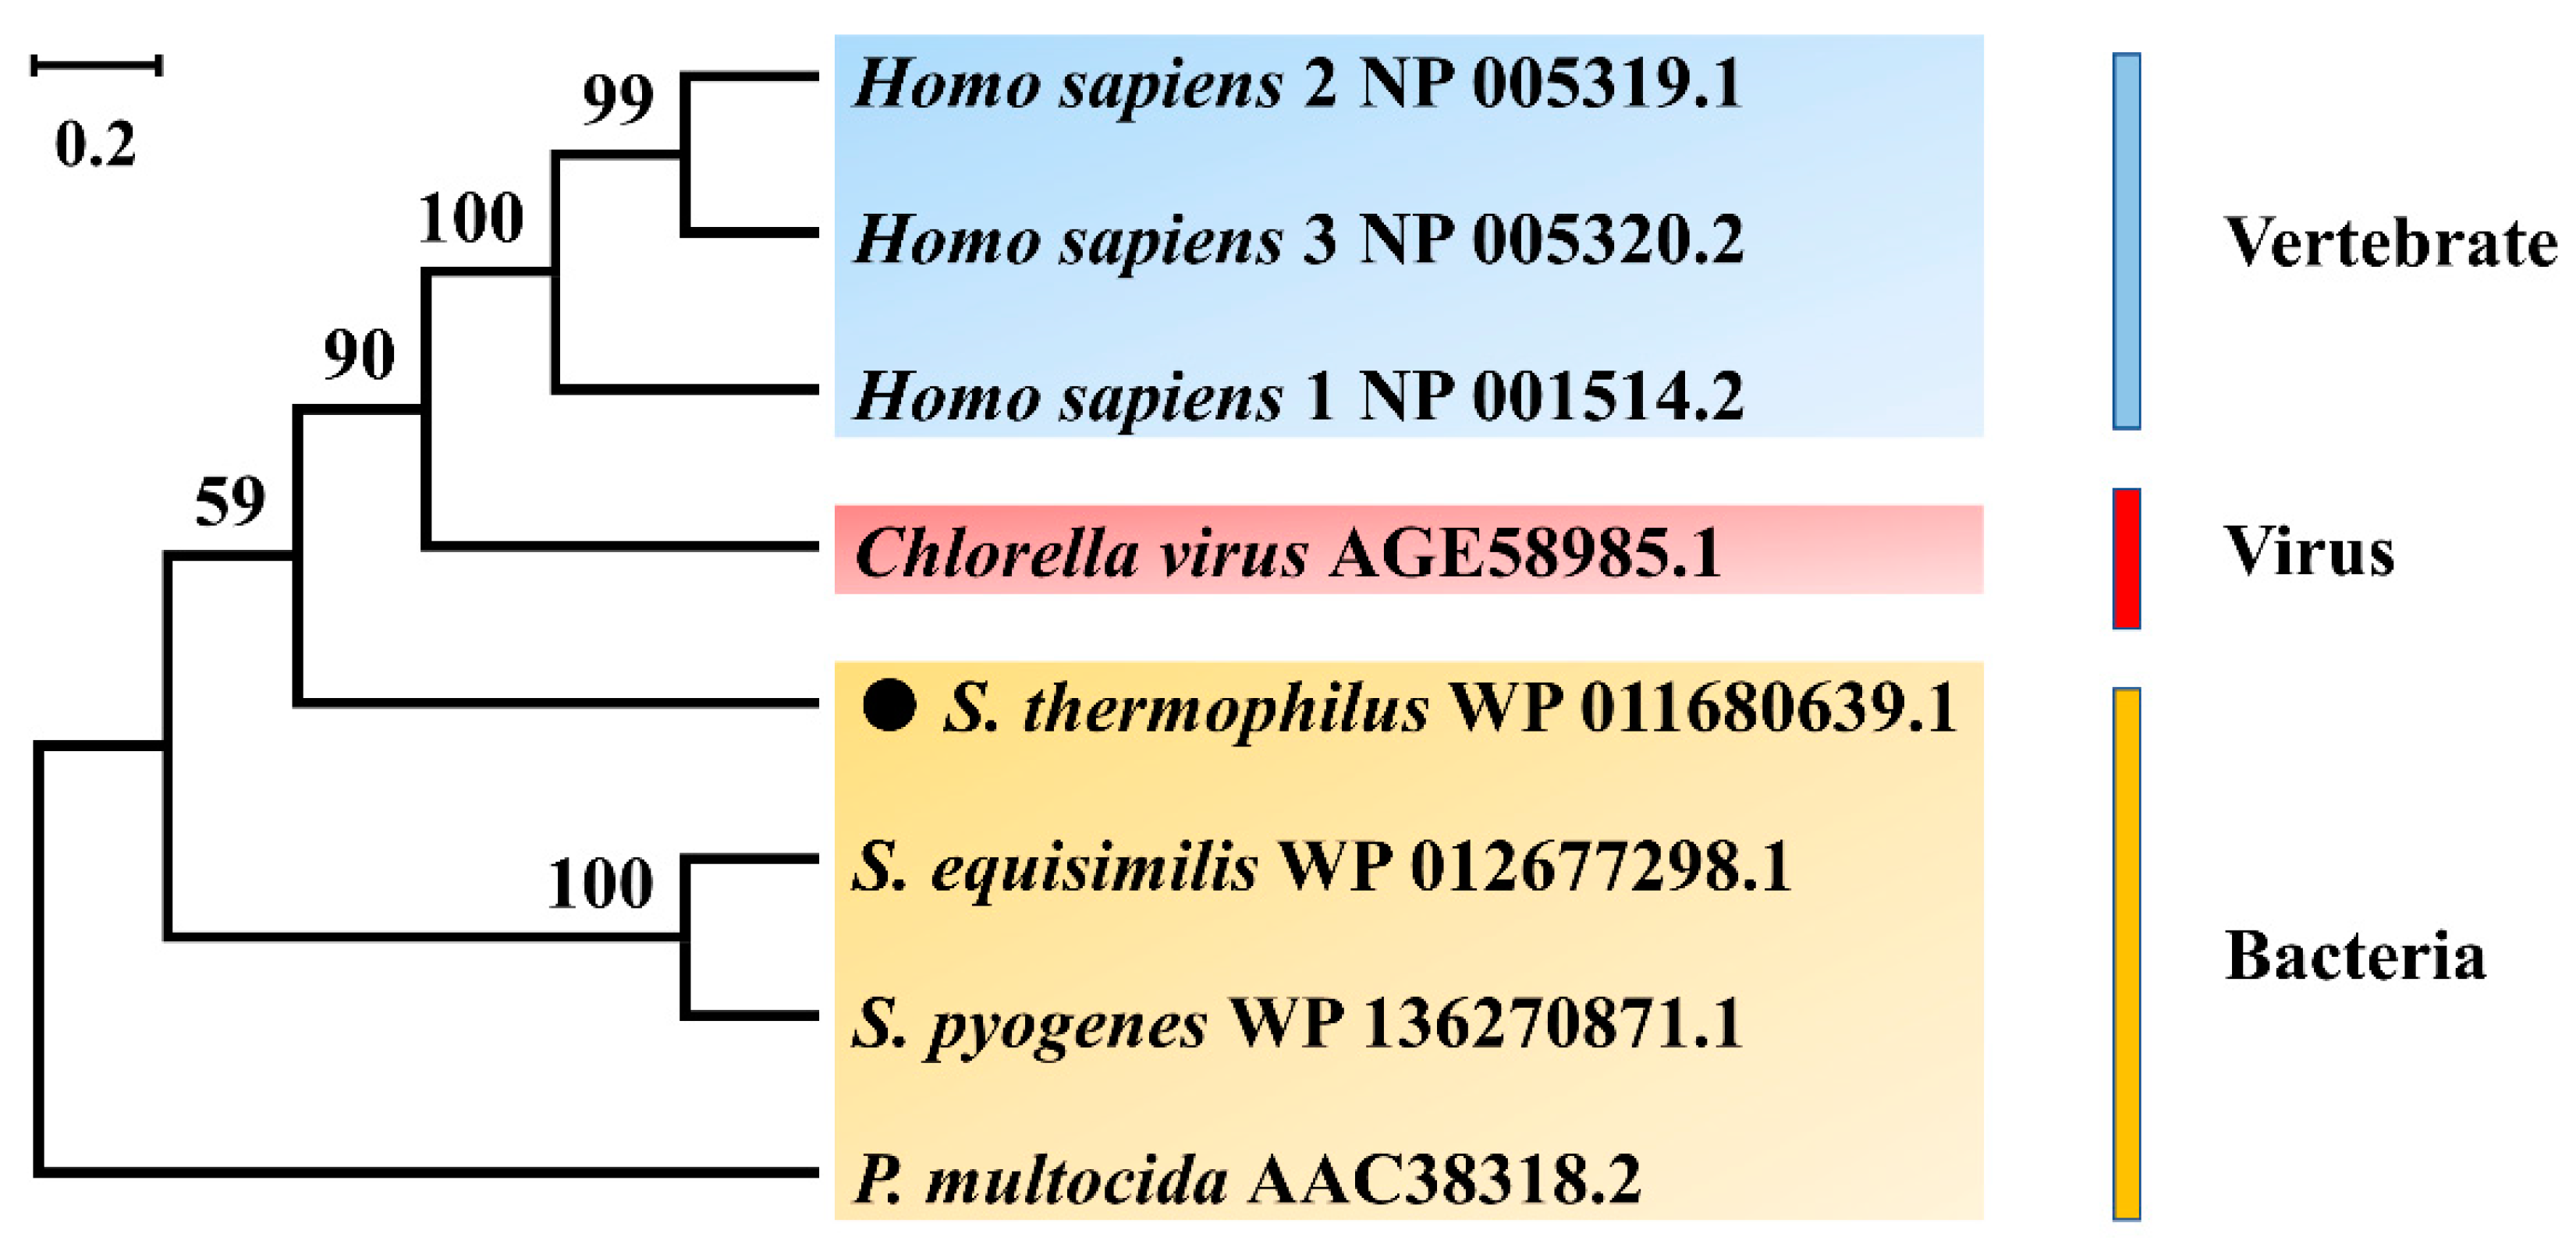
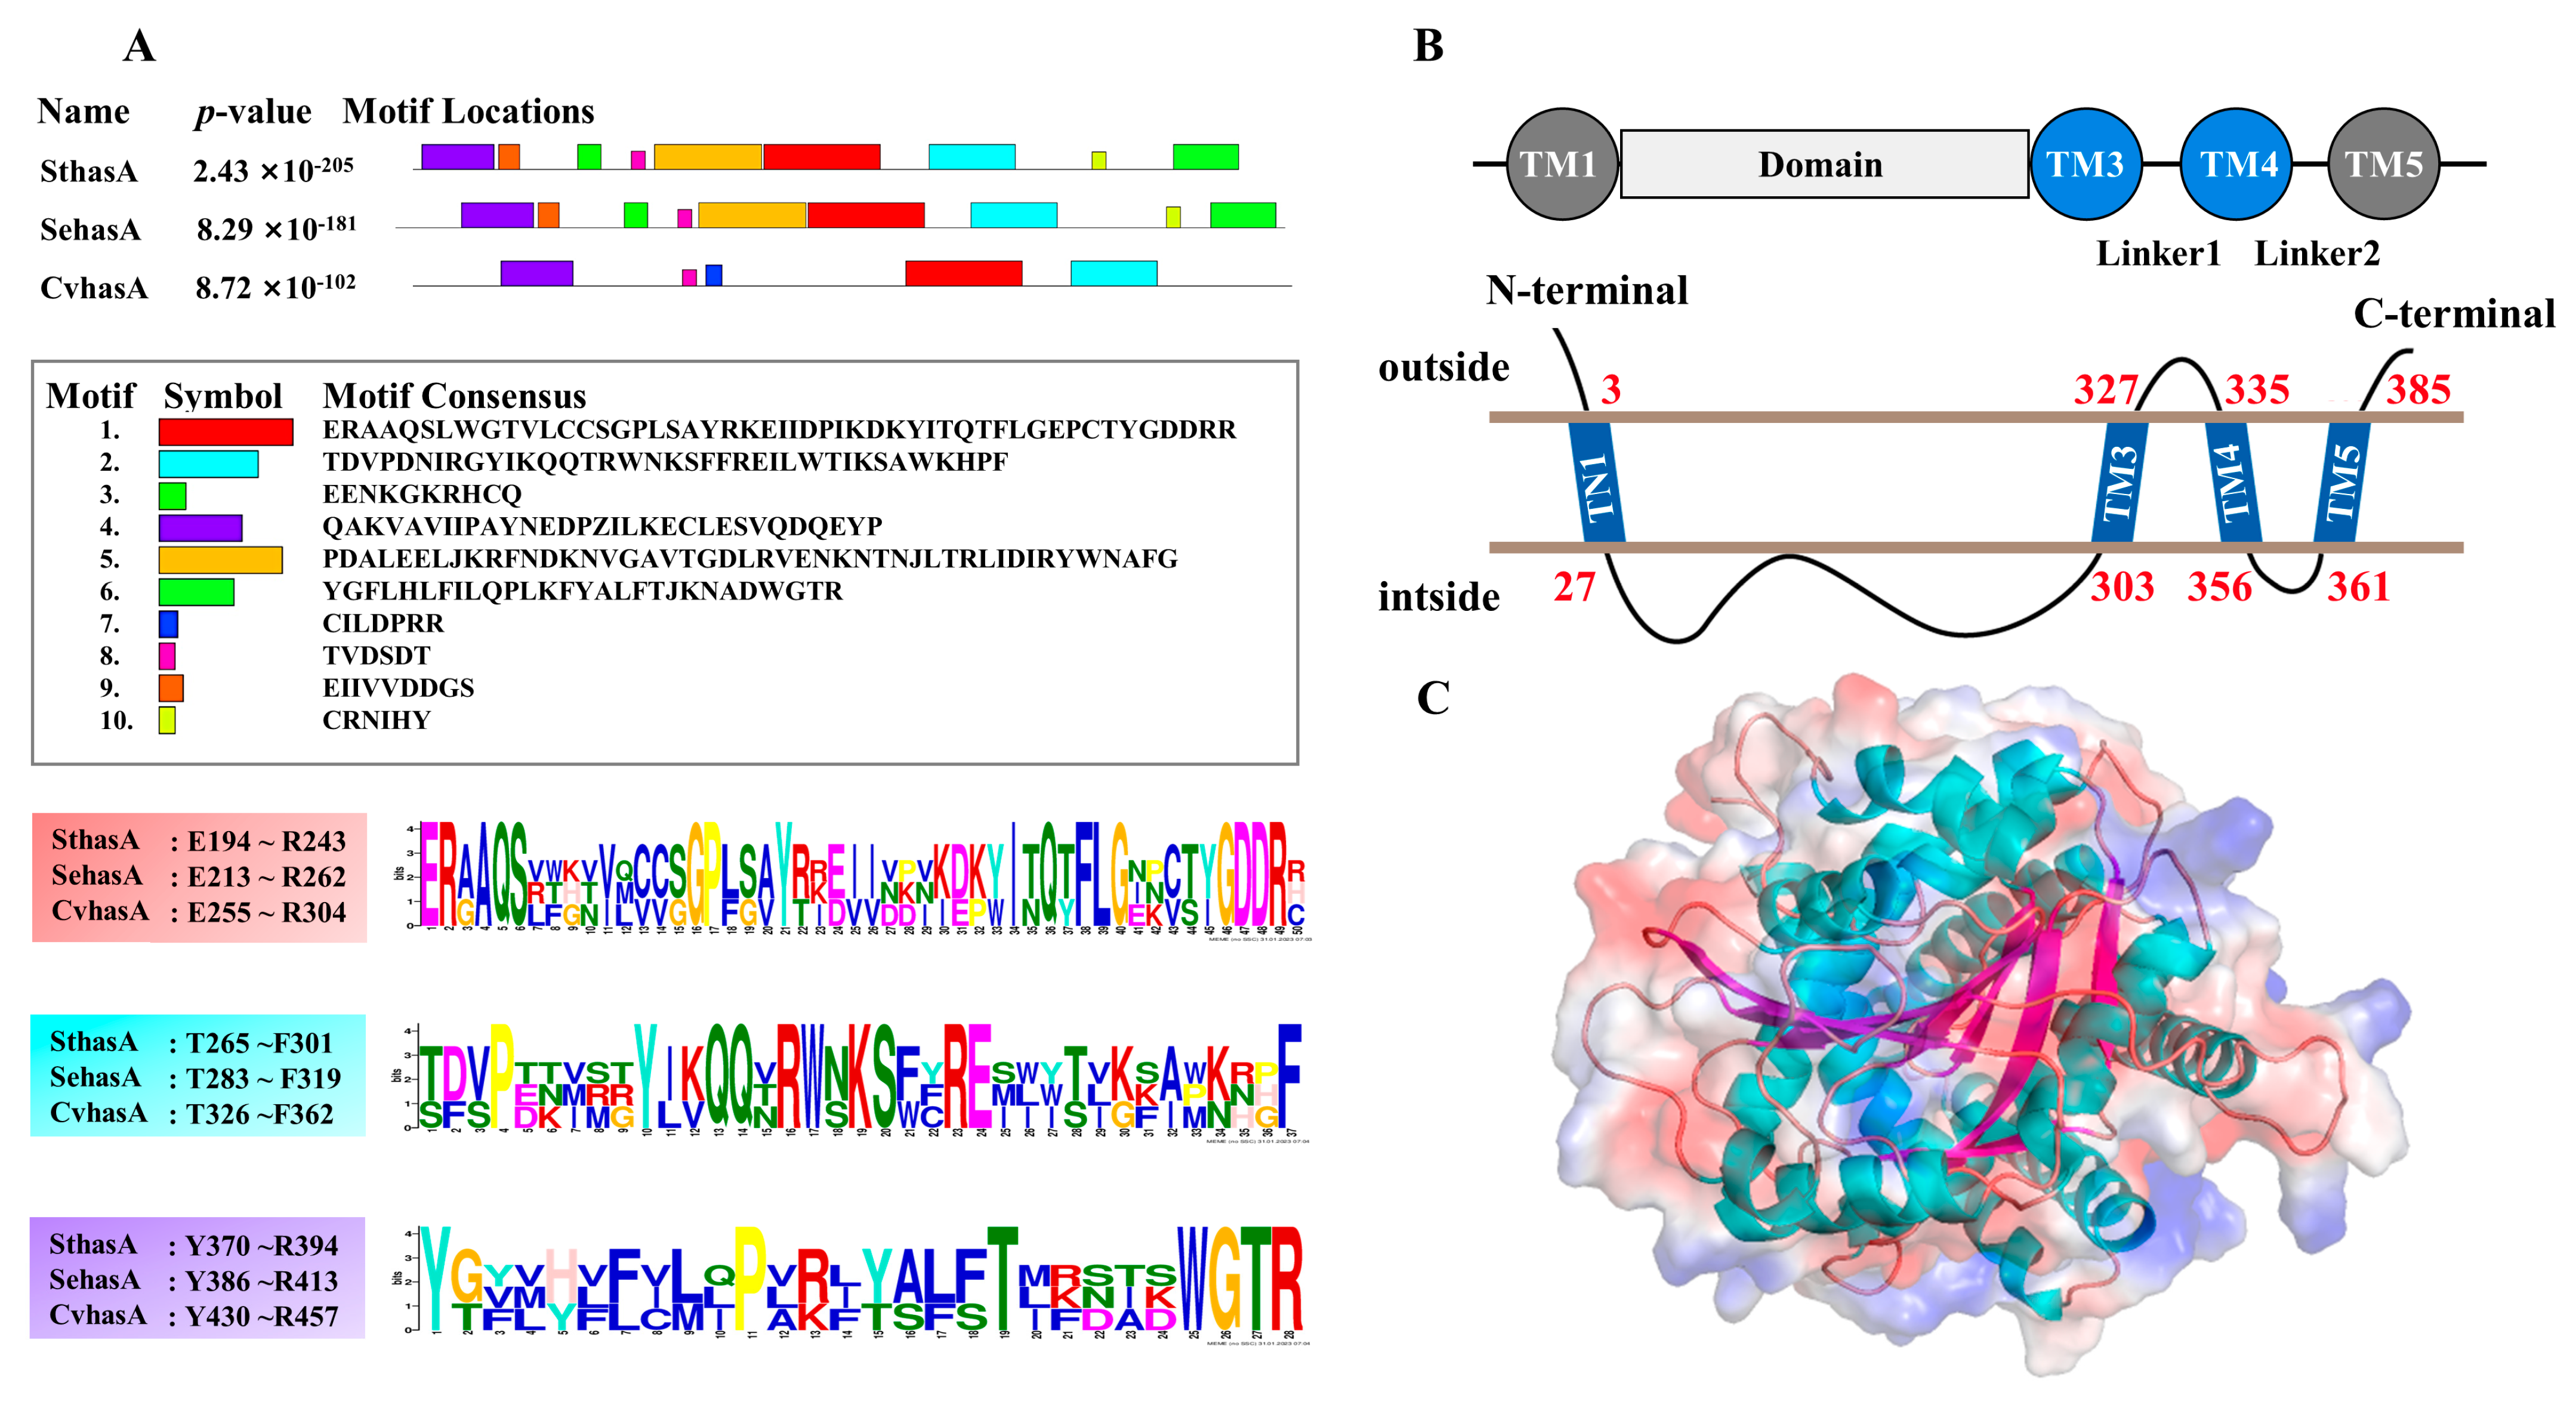
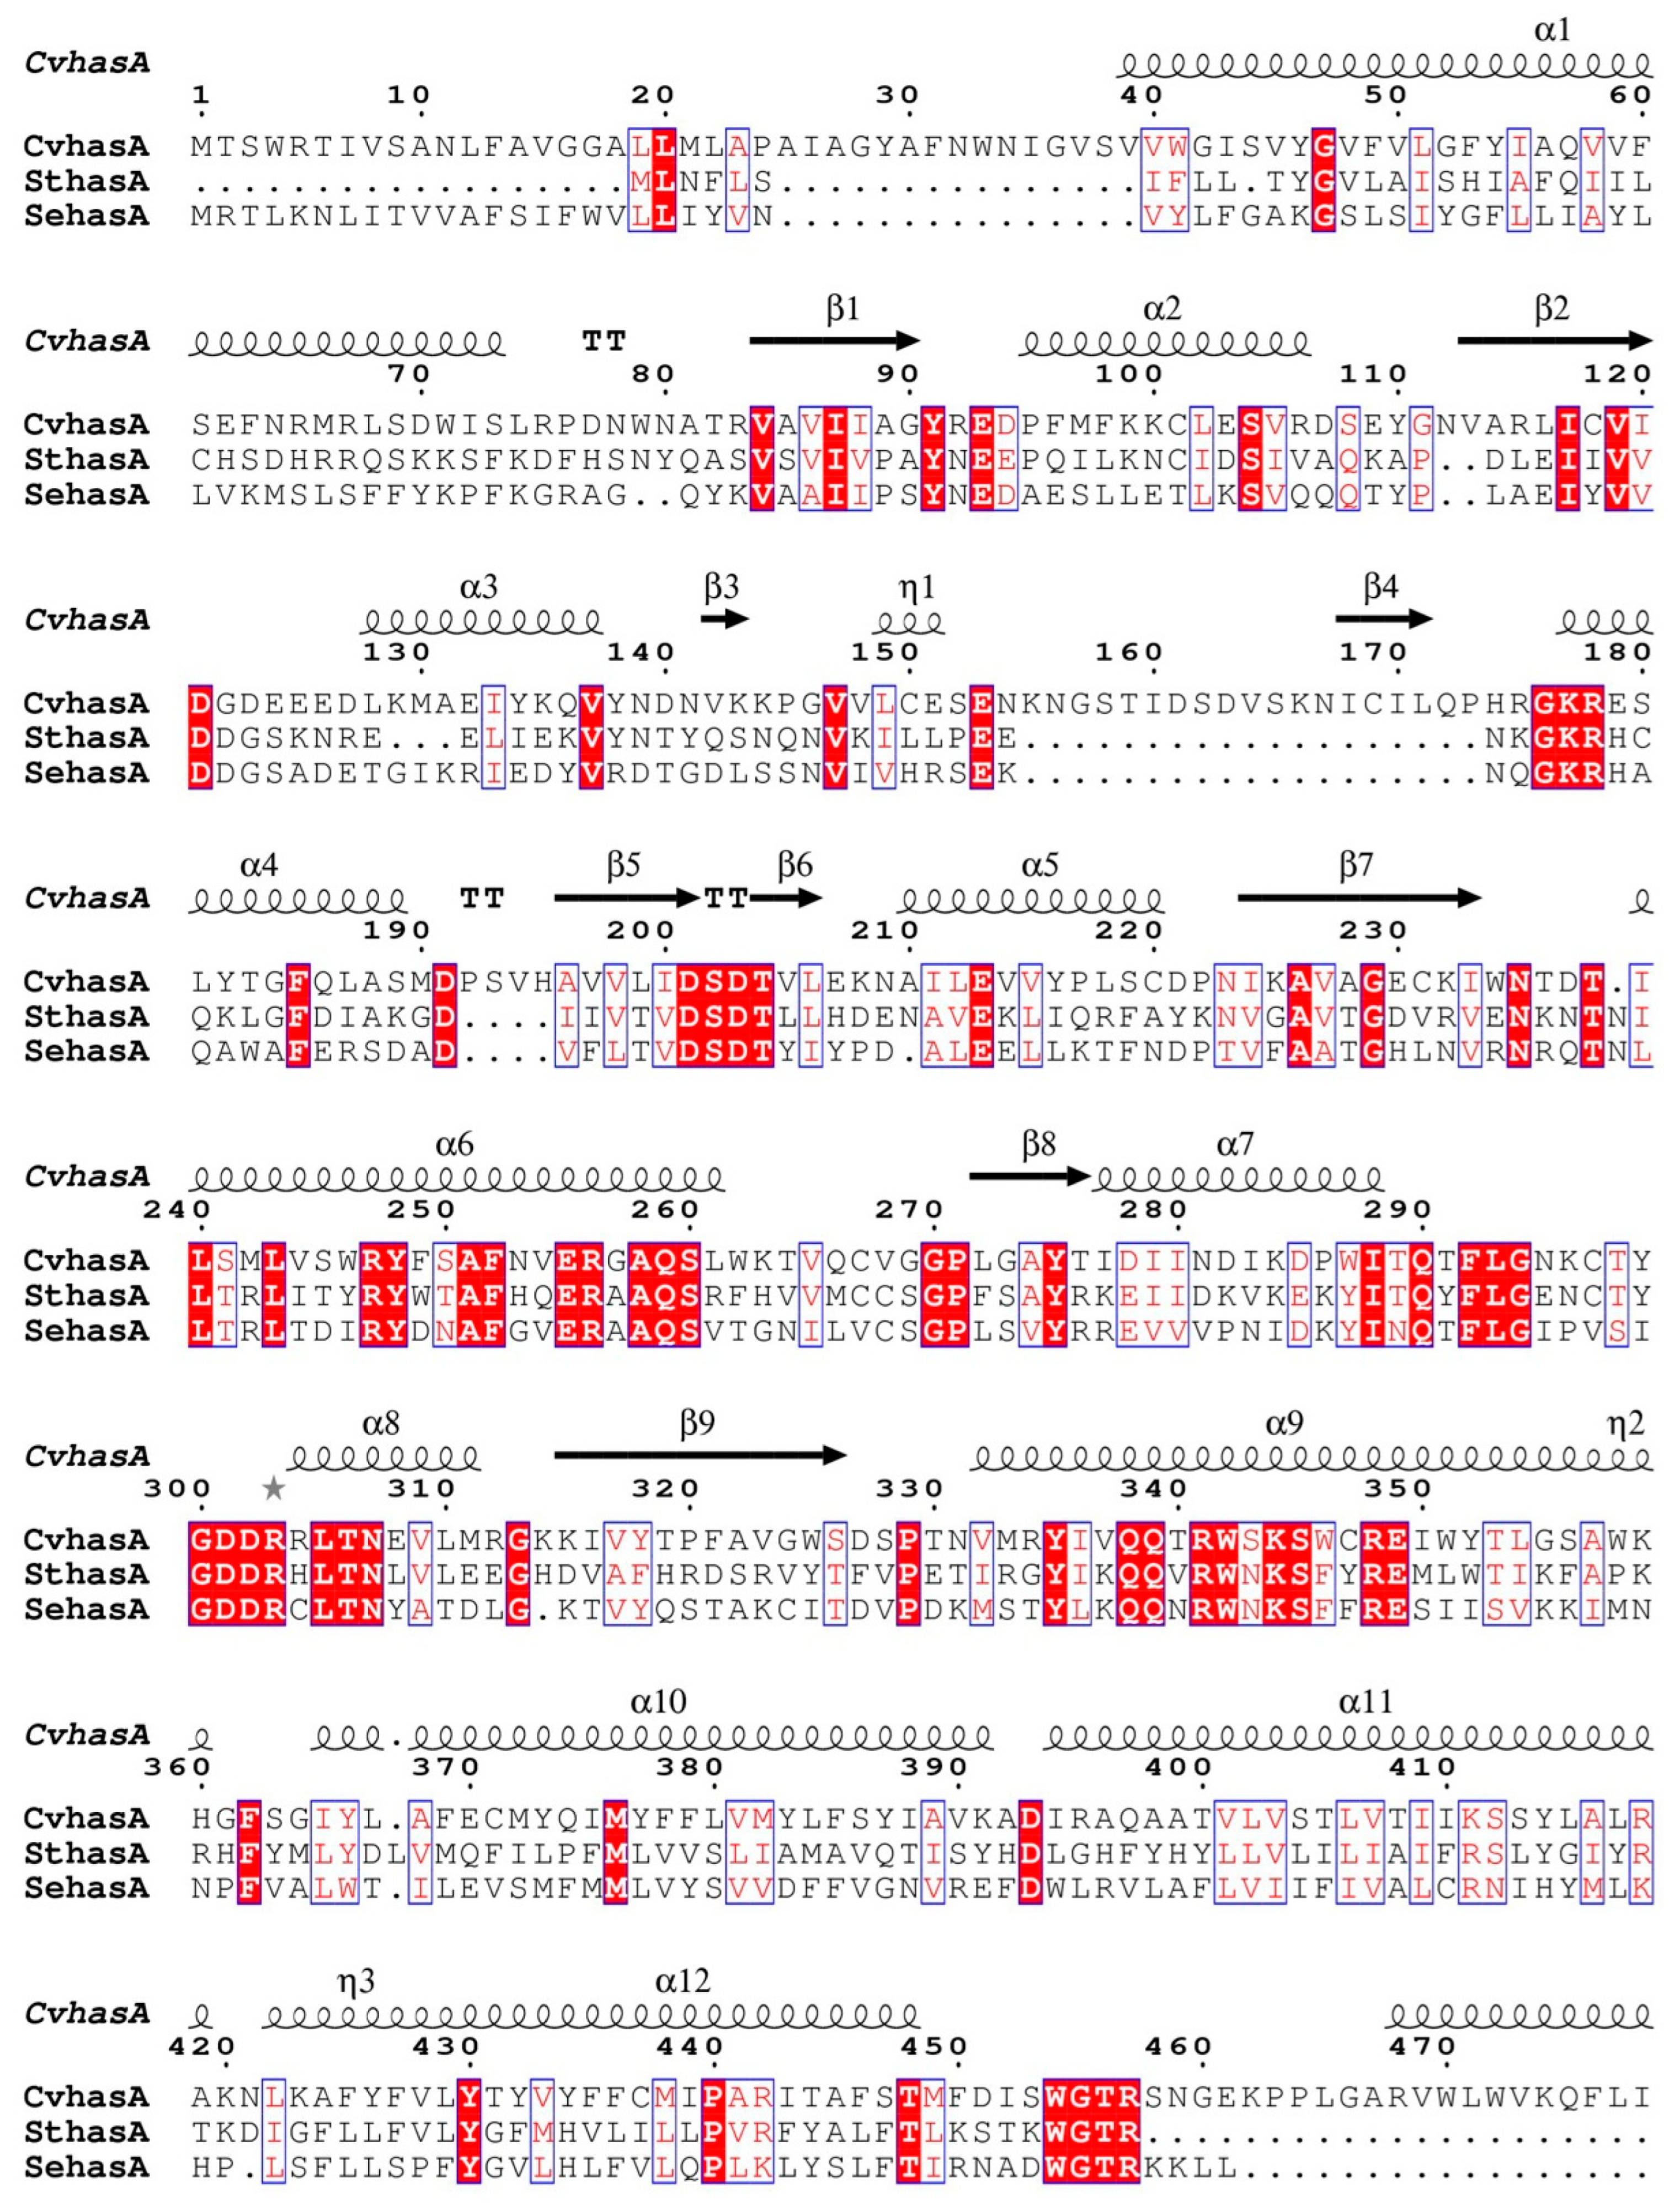
3.1. Bioinformatics Analysis of a New HAS (SthasA) from S. thermophilus

The intracellular synthesis of HA requires the involvement of several enzymes. HAS is a key enzyme in the HA synthesis pathway because it catalyzes the polymerization of two precursors, UDPG-GlcUA and UDPG-GlcNAc. HAS catalyzes seven different reactions, including binding two monomeric substrate molecules and two extended HA chain segments, glycosylation of two substrate molecules, and transmembrane transport of HA product chains. The HAS identified to date can be classified into Type I and Type II. Type I HAS is derived from (1) bacterial sources: Group A Streptococcus pyogenes (SphasA) and Group C Streptococcus equisimilis (SehasA), (2) viral sources: Chlorella virus (CvhasA), and (3) vertebrate sources: Homo sapiens (HshasA1-3), whereas Type II HAS is only derived from Pasteurella multocida (PmhasA). Amino acid sequence homology analysis revealed that the homology of SthasA with the Type II HAS PmhasA was 20.16%, whereas that with the Type I HAS HshasA1, HshasA2, HshasA3, CvhasA, SehasA, and SphasA was 29.95%, 30.00%, 30.03%, 33.59%, 33.59%, 36.62%, and 36.36%, respectively (Table S2). Khuri et al. demonstrated that branches of genetic evolutionary trees constructed from amino acid sequences of proteins reflect genetic relationships among species and serve as a basis for evaluating the functional relevance of proteins [21]; this is because genes that perform relevant physiological functions are relatively conserved due to their important protective effects during the evolutionary process of long-term adaptation to the environment. Therefore, this study used MEGA-X software to construct phylogenetic trees based on SthasA amino acid sequences. As shown in Figure 1, SthasA is very closely related to prokaryotic Streptococcus in terms of amino acid sequence alignment. In contrast, vertebrate HAS exhibits a high genetic distance from SthasA. SehasA is widely used in HA synthesis because of its high polymerization efficiency, and the crystal structure of CvhasA has been previously analyzed. Therefore, SehasA and CvhasA were selected as references for subsequent bioinformatics analyses.
The MEME website was used to analyze the conservative modular order of these HASs. The results showed that they had three identical modular sequences (Figure 2A), among which the E-value of MEME 1 was 6.2 × 10⁻²¹ (p < 0.05), showing the most significant difference and indicating that this MEME had the highest confidence level (Table S3). In CvhasA, R256 in mode sequence 1 is an important site affecting the enzyme activity, which is lost upon mutation with Lys, and C267 is an important site affecting the conserved switching ring after nucleotide binding [22]. Therefore, we hypothesized that these sites are present in SthasA, providing a basis for the directional transformation of SthasA to yield highly efficient HA. The sequence identification graph plots the residuals at each position in the sequence alignment. The accumulation of residuals at each position reflected the consistency of the residues. The size of the corresponding graphic character for each residue is proportional to the frequency at which the residue occurs at that location (Figure 2A). To identify the key catalytic groups in SthasA, multiple sequence alignment analyses of SthasA amino acid sequences were performed and secondary structures were predicted using CvhasA as a model. The secondary structure predictions show that the SthasA protein molecule contains 12 α helices, 9 β folds, and 2 β corners. The binding protein-conserving motifs 1, 2, and 4 formed similar domains based on the secondary structure of the protein, suggesting that conserved motifs play a key role in the formation of higher protein structures (Figure 3).
Structurally, unlike conventional HAS [5,22], transmembrane prediction analyses have shown that SthasA consists of only four lipid-dependent intact transmembrane domains (TM1, TM3, TM4, and TM5), and one membrane-anchoring domain (Figure 2B). Two UDPG-substrate-binding sites, two HA-monosaccharide-UDPG feeding sites, two glycosyl transferase catalytic sites, and one domain are available that assist the HA sugar chain transmembrane domain. Significant differences were observed in the catalytically conserved motifs, with the key region TM2 missing from the molecular weight (MW) regulation of HA. The fourth and fifth transmembrane domains were conserved to a certain extent, whereas the other transmembrane domains were not. Therefore, we conjecture that the first two membrane sequences of HAS are the main factors responsible for differences in HA synthesis and MW. Three-dimensional (3D) homology modeling of structural and functional proteins based on conserved amino acid sequences is important for clarifying the correlation between protein structure and function [23,24]. The tertiary structure is composed of α helix, β folding, and other secondary structures, which are then folded into a spherical, tightly wrapped three-dimensional spatial structure. Amino acid residues in the primary structure can be folded such that their side chains are close to each other, and active sites can be formed by hydrophobic action. In this study, the SWISS-MODEL tool was used to predict the tertiary structure of SthasA using CvhasA as a template (Figure 2C). The similarity between the two structures was 36%, which was the highest fit among the HA structures analyzed. Combined with the crystal structure data for CvhasA, this helped identify the key motifs involved in the polymerization of this enzyme. This enzyme is the first new Type I HAS isolated from a non-pathogenic strain, providing a rationale for further evolution of SthasA for targeted HA synthesis.

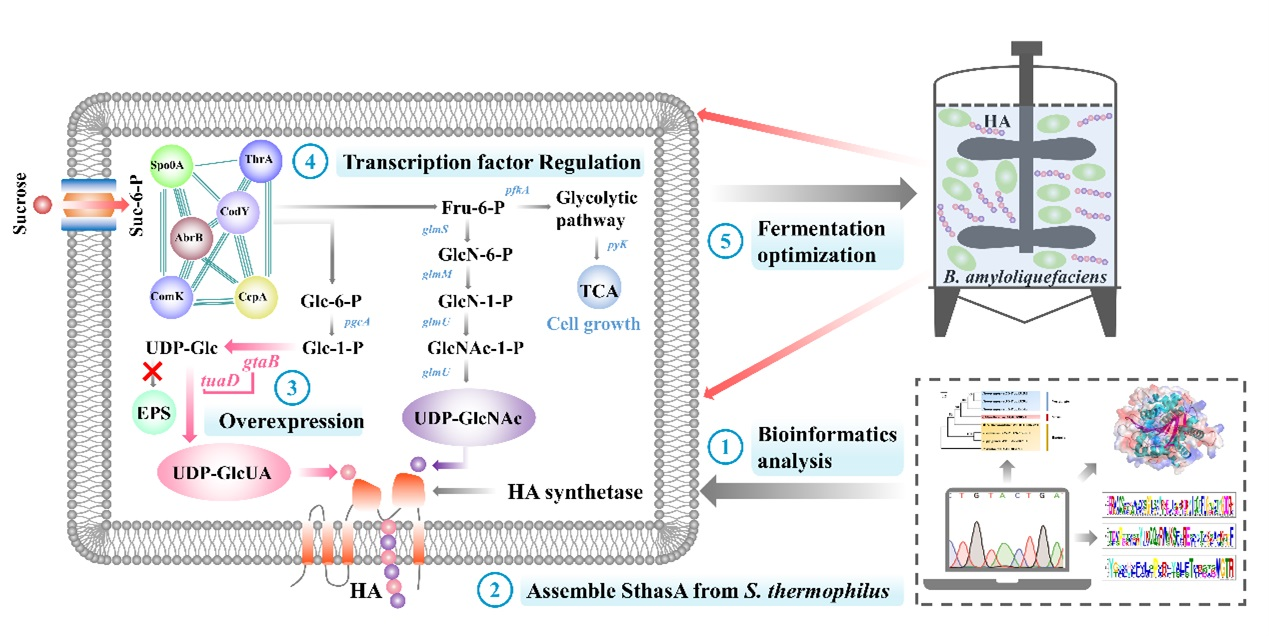
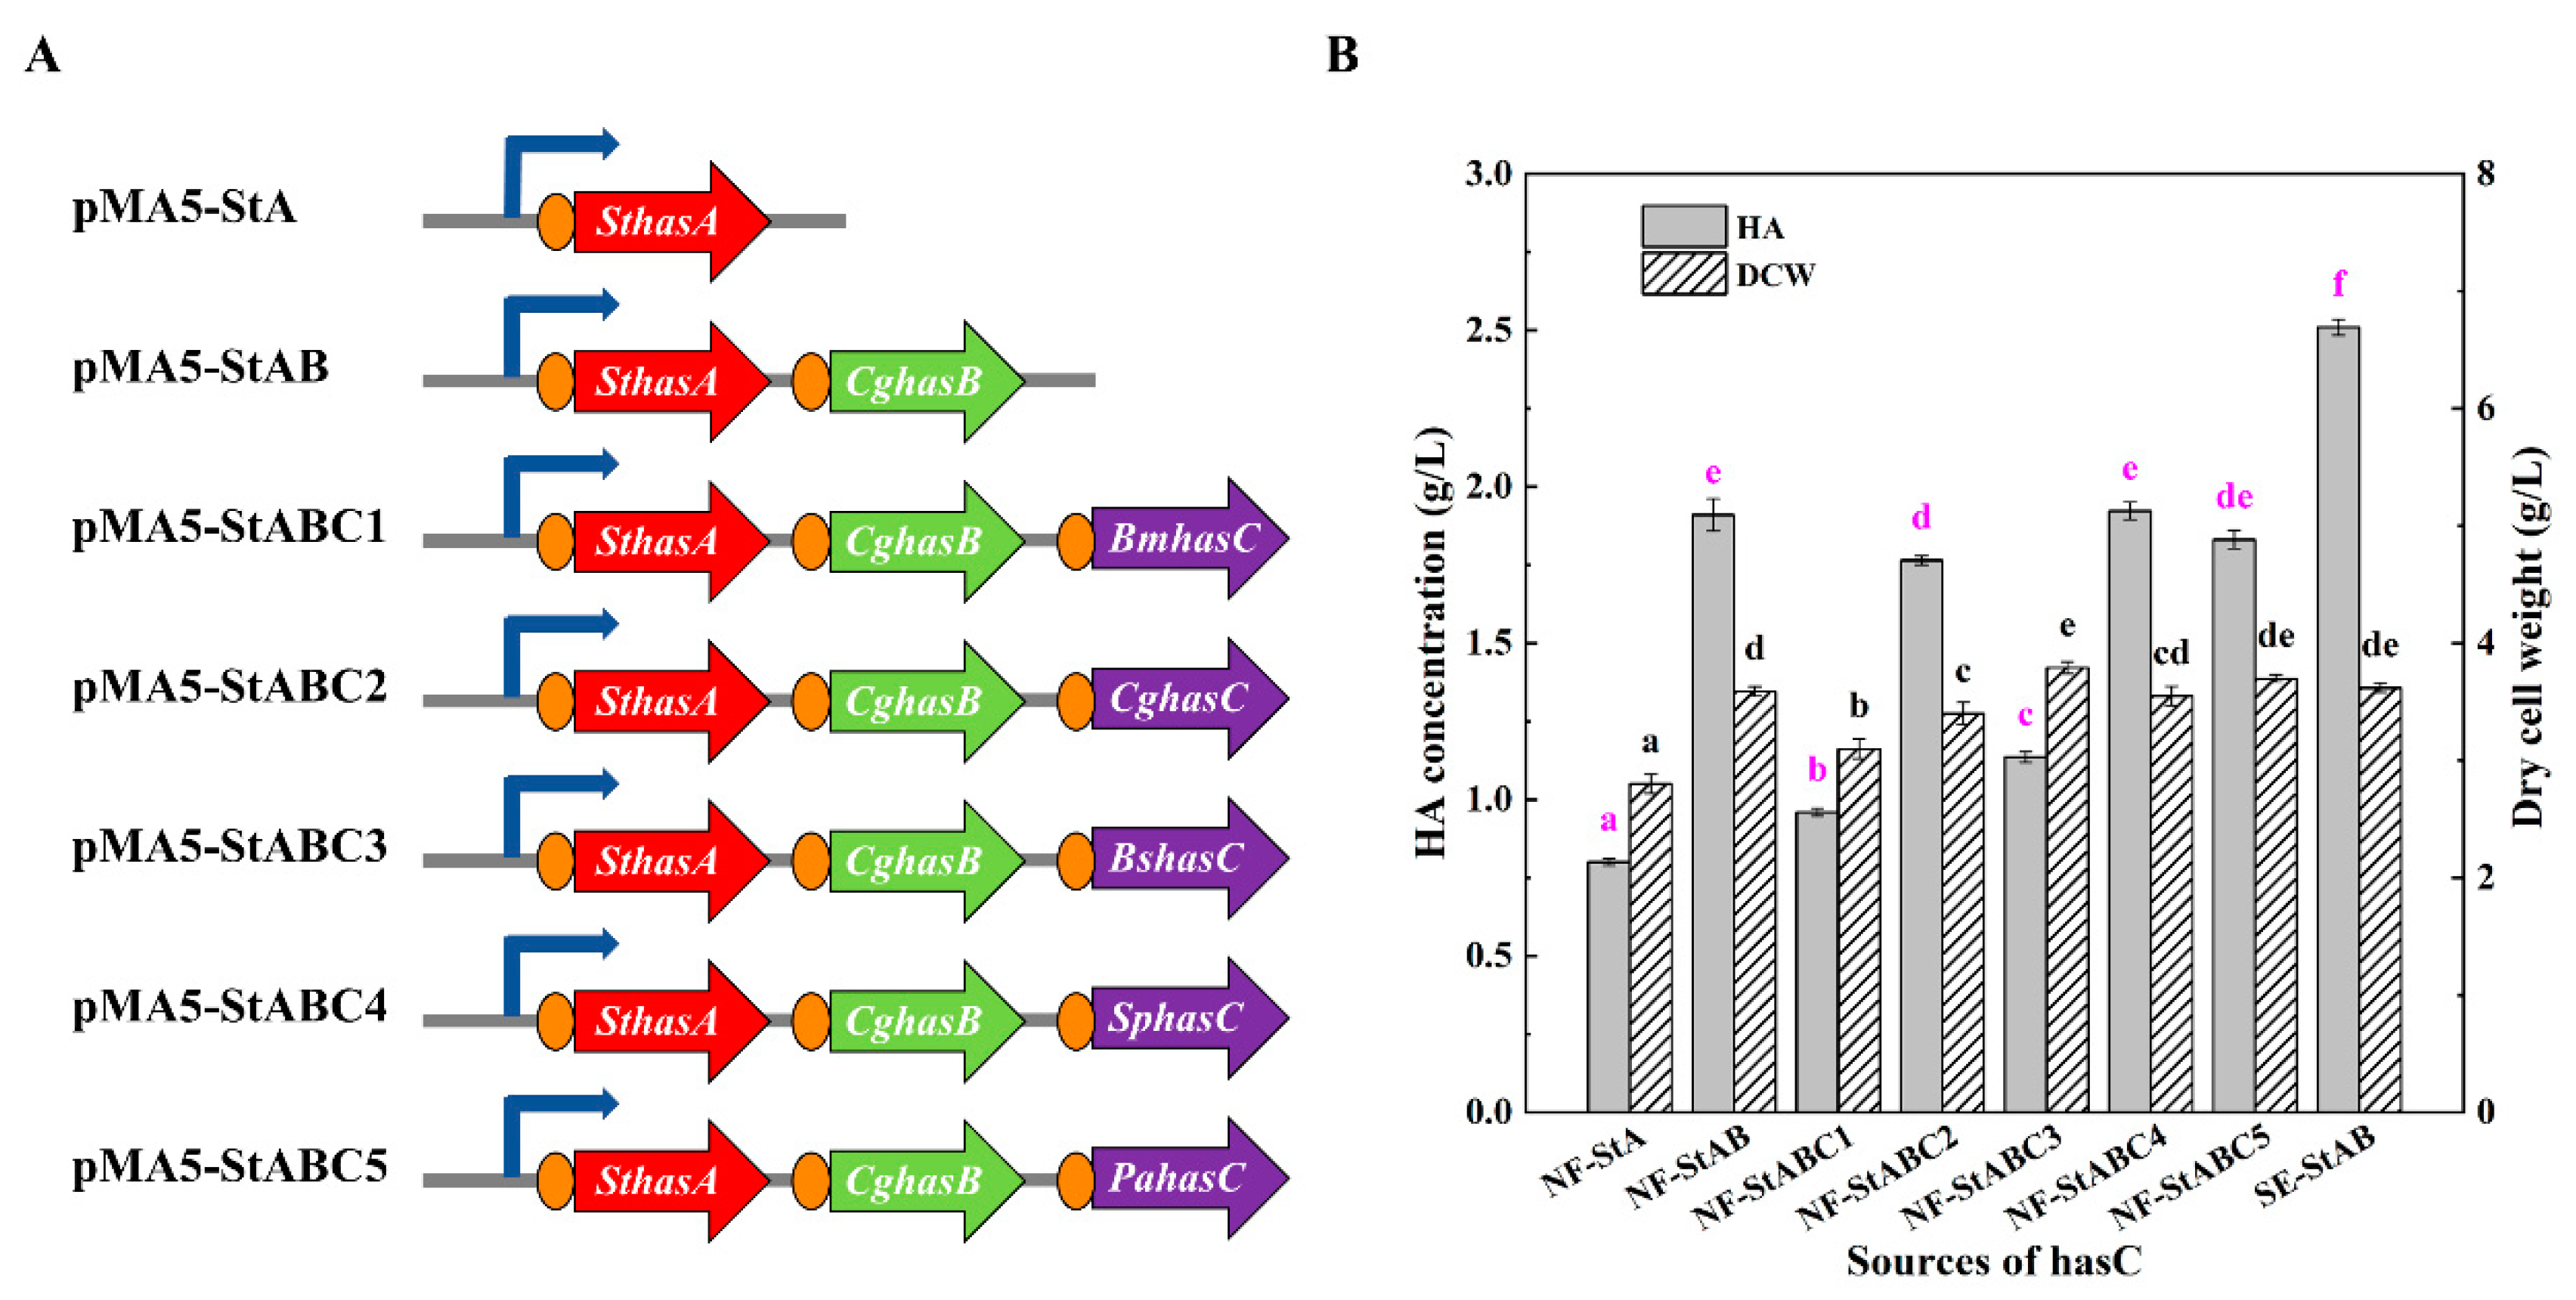
3.2. Construction and Optimization of the HA Synthesis Pathway in B. amyloliquefaciens

To further verify the ability of the HAS (SthasA) from S. thermophilus to heterosynthesize HA, we tested it in B. amyloliquefaciens NF chassis. As shown in Figure 4B, we successfully detected HA synthesis (up to 0.8 g/L) in recombinant strains with constitutive expression of SthasA genes, and it has been reported that hasB and hasC, which are HA precursors, have important effects on HA biosynthesis. To further balance growth and HA synthesis, we optimized the precursor pathway and improved the supply of UDPG-GlcUA, as shown in Figure 4A. First, hasB from C. glutamicum ATCC 13032 was further assembled, and it was observed that the introduction of hasB had the strongest promoting effect on HA biosynthesis, and the yield reached 1.91 ± 0.01 g/L, which is a 3-fold increase. The hasC sources were optimized to include BahasC (B. amyloliquefaciens ATCC 13032), CghasC (C. glutamicum ATCC 13032), BshasC (B. subtilis 168), SphasC (Sphingomonas sp. NX-3), and PahasC (Pantoeaalhagi NX-11). The introduction of hasC did not significantly affect the HA yield in the B. amyloliquefaciens strain (Figure 4B). These results indicated that hasB is a major rate-limiting enzyme in HA synthesis. In the original B. amyloliquefaciens strain, the low expression of UDPG dehydrogenase limited UDPG-GlcUA expression, inhibiting HA synthesis [25]. The inhibition is because the original hasB gene is inhibited by excessive phosphate production during fermentation [26], resulting in the underexpression of UDPG dehydrogenase in the original strain. Finally, a combination of probiotic food-grade SthasA and CghasB was selected and attached to the plasmid pMA5 using one-step cloning. The strain B. amyloliquefaciens SE, constructed in this study and lacking the oligosaccharide synthesis gene sacB and the polysaccharide operon gene epsA-O, was electrically re-transformed into B. amyolliquefaciens SE-StAB. Due to its excellent ability to synthesize HA, it was used as a new chassis strain for subsequent HA biosynthesis studies.
In addition, synthetic products of SthasA have been identified. The product synthesized from the recombinant strain was subjected to repeated alcohol precipitation, after which the protein was removed. Finally, the HA solution was added to a dialysis bag to remove small molecules in the HA solution. The purified products were initially analyzed using FT-IR and 1H-NMR. FT-IR spectroscopy is an intuitive way to characterize the structure of biopolymers and their functional groups. The FT-IR spectrum of the HA sample is shown in Figure 5A. The strong O-H stretching vibrational absorption at 3419.51 cm−1 in the HA sample indicates the presence of a COOH group. At 2797.57 cm−1, a strong characteristic absorption of C-H stretching vibrations was observed. At 1614.63 cm−1, strong C=N and C=O stretching and N-H bending vibrations were observed, indicating the presence of -CONH2. At 1356.09 cm−1, there was a stretching vibration of C-O in the carboxyl group and a C-O-C stretching vibration at 1117.07 cm−1, which is consistent with the group position of the HA standard in the reference [27]. Subsequently, the structure of the HA sample was further characterized with 1H-NMR (Figure 5B), and it was observed to be consistent with the data in the 1H-NMR spectrum of HA produced from strains reported in the literature [28]. Other miscellaneous peaks in the 1H-NMR spectra were mainly due to impurities caused by sample separation and insufficient purification. Similar cases were reported by Güngöret et al. [29]. However, in general, the chemical shift values for the H nucleus were similar. These results imply that HA is the fermentation product of the recombinant strain.

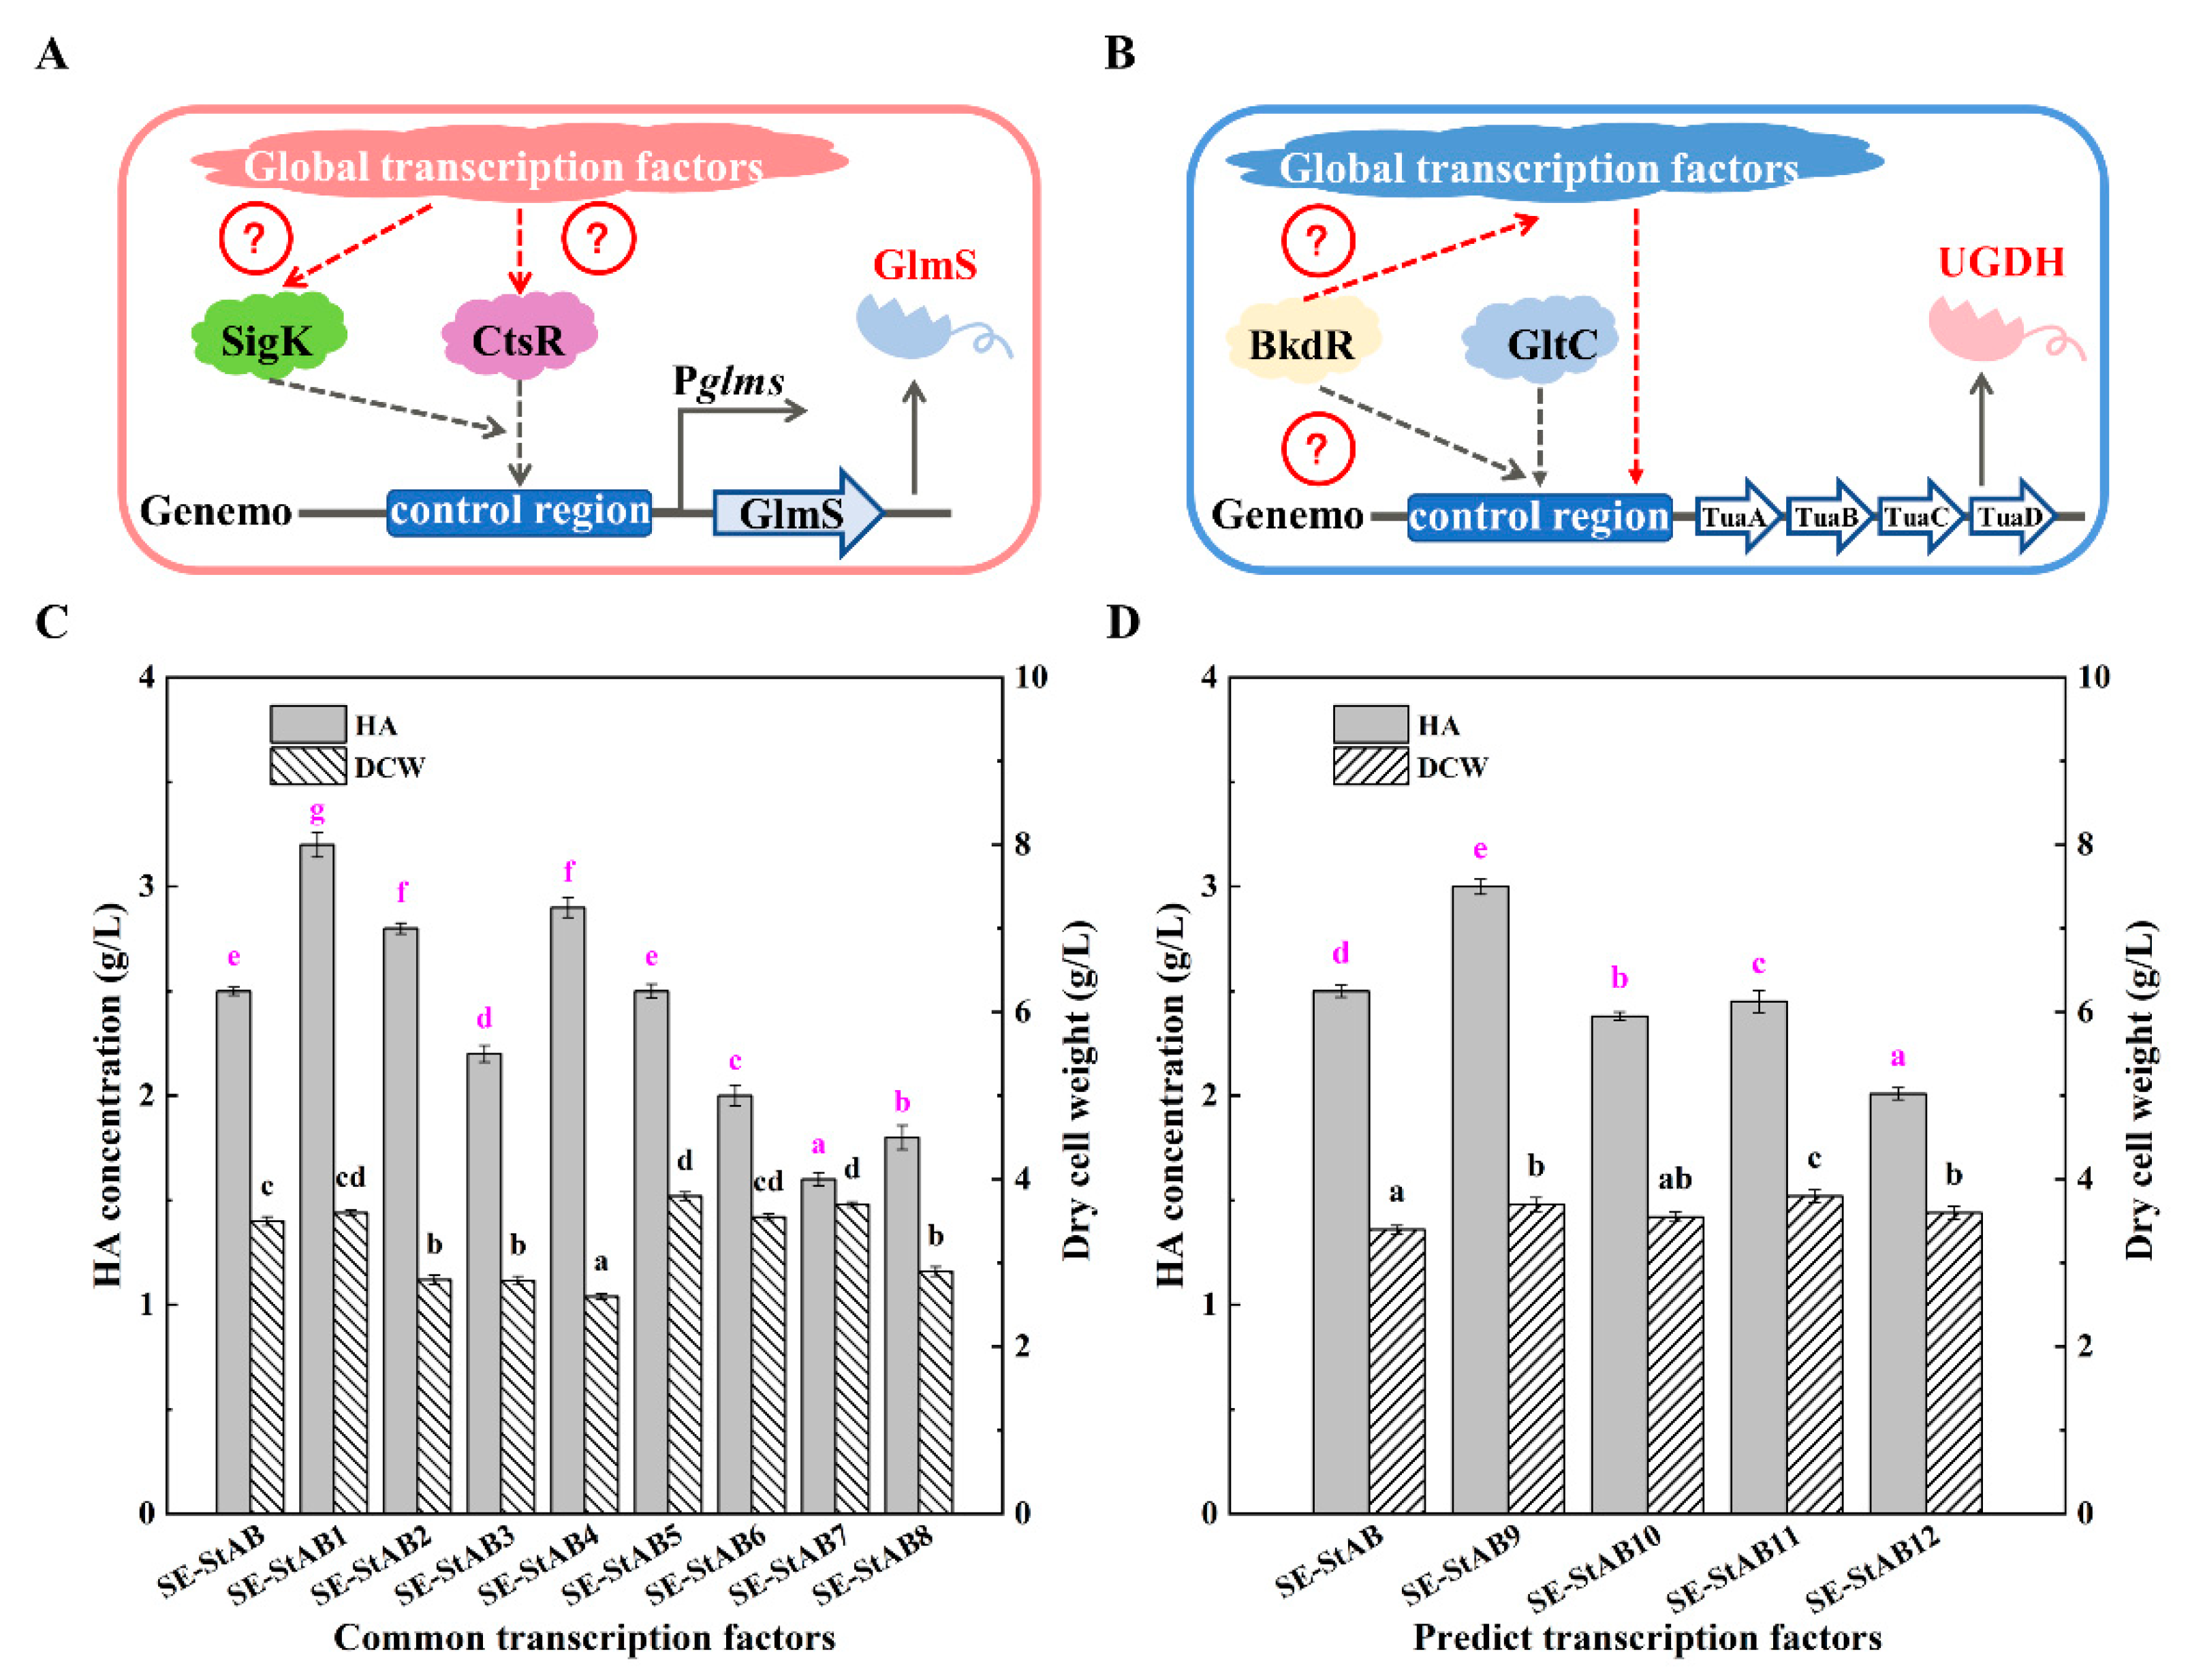
3.3. Study on Global Transcriptional Regulators of HA Synthesis in B. amyloliquefaciens

To further improve the efficiency of HA synthesis, we attempted to increase HA yield using recombinant B. amyloliquefaciens by adjusting the strategy for global regulatory factors. Global transcriptional regulatory engineering can effectively improve the synthesis of target metabolites using transcription factors with specific functions to activate or inhibit the co-expression of multiple genes in specific metabolic pathways. This strategy is currently viable for bioethanol [30] and organic acid synthesis [31]. In the HA synthesis process, except for the modification of rate-limiting components or steps described in Section 3.2, to improve HA synthesis efficiency in the B. amyloliquefaciens cell factory, we altered the regulatory network of global carbon and nitrogen metabolism by randomly expressing polytropic global transcription regulatory factors to achieve optimal nutrient intake and efficient HA biosynthesis. Therefore, a transcription prediction system for B. subtilis was used in this study. First, the effects of the common global transcription factors CcpA, CodY, ThrA, ComK, Spo0A, AbrB, and FruR and the redox factor Rex acting on carbon and nitrogen sources on HA synthesis by recombinant B. amyloliquefaciens SE-StAB were overexpressed. The results show that recombinant strains expressing CcpA (3.2 g/L), CodY (2.8 g/L), and ComK (2.9 g/L) exhibited an increase in HA yield. In contrast, the remaining strains exhibited a decrease in HA yield (Figure 6C). Considering the importance of HA precursor accumulation, we used bioinformatics analysis to predict the transcription factors SigA, CtsR, BkdR, and GlnR that regulate GlcUA and GlcNAc production in B. amyloliquefaciens (Figure 6A,B). The expression plasmids SigA, CtsR, BkdR, and GlnR were constructed and fermented to determine HA yield, and it was observed that CtsR promoted the synthesis of HA to a certain extent (3.0 g/L). At the same time, SigA, BkdR, and GlnR did not inhibit or promote HA synthesis significantly (Figure 6D). In contrast, overexpression of the transcription regulatory factor CcpA promoted HA yield by 28%, reaching 3.20 ± 0.09 g/L. Cao et al. edited metabolic regulatory networks in recombinant strains by randomly mutating and screening the global regulatory factors CcpA and CodY and then further applying mutations in CcpA and CodY, which increased the yield of green fluorescent protein (GFP), confirming that up-regulated GFP protein expression was due to a slight loss in the growth rate under mutated global regulators in the mutant strain and recombination of central nitrogen metabolism [32]. CcpA and CodY act as suppressors and activators of gene expression, respectively, by specifically binding to the sequences in or near the promoter region of the target gene. Together, these global regulatory proteins and their ligands control the intersection of large regulatory proteins that balance the utilization of available nutrient sources, systematically coordinate intracellular carbon and nitrogen fluxes, and promote cellular homeostasis by stimulating specific catabolic processes.

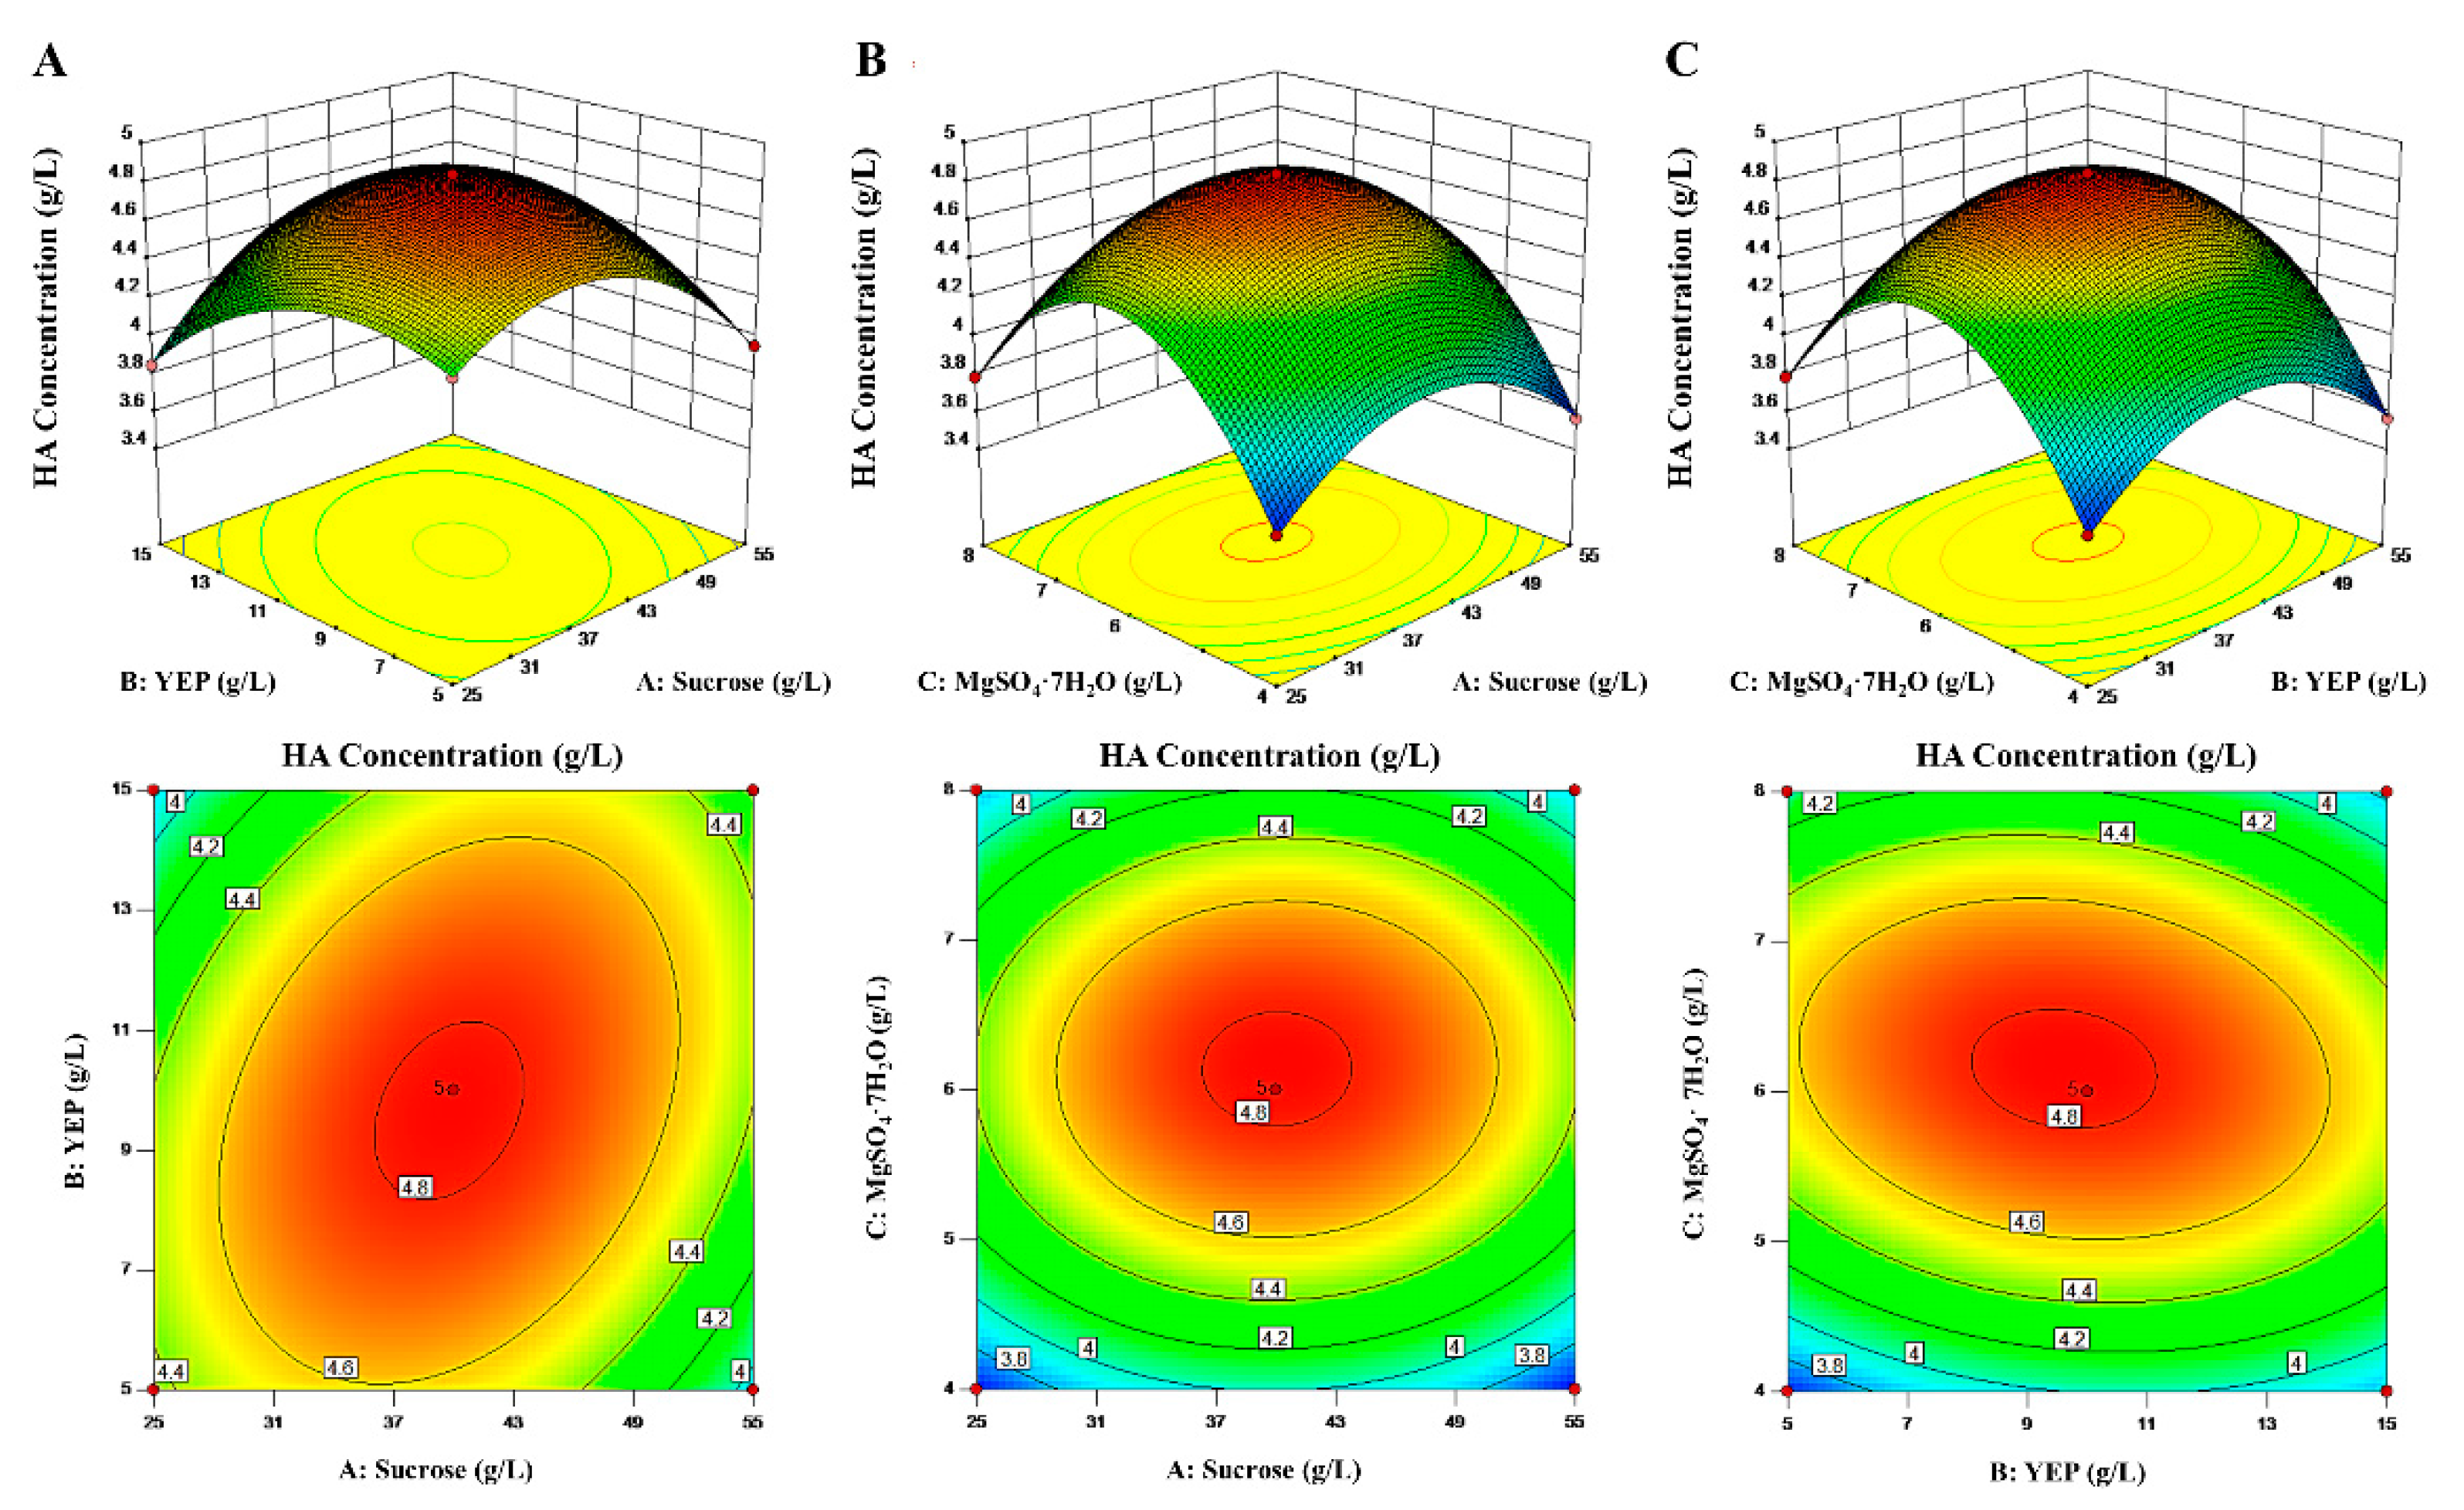
3.4. Culture Medium Optimization for HA Yield using Response Surface Methodology

In this study, the production of HA from B. amyolliquefaciens SE-StAB and fermentation by this strain are discussed. The level of synthesis by recombinant bacteria depends on the properties of the strain. Second, the composition of the medium and fermentation conditions have an important effect on the growth and metabolism of microorganisms and, thus, on the level of fermentation. In the composition of the medium, carbon and nitrogen sources and inorganic salts are the main factors that affect the microbial yield. Lai et al. studied the effect of glucose concentration on HA synthesis in recombinant E. coli BL21 cells. Nutrient-rich media with a glucose concentration of 50 g/L showed a high HA yield (0.115 ± 0.002 g/L) [33]. Temperature, pH, liquid loading, shaking speed, and other culture conditions also significantly impacted HA yield. Liu et al. studied the effects of pH, temperature, aeration, and agitation on the yield from HA synthesis using S. zooepidemicus HA-13-06 fermentation and coupled two-stage fermentation to produce HA efficiently, resulting in a yield and MW of HA of 4.75 g/L and 2.36 × 10⁶ Da, respectively [10]. Therefore, improving the HA yield from recombinant strains by optimizing the fermentation process is imperative. With bacterial content and HA yield as important indicators, the fermentation process in the shaken flask was optimized, which provided the basis for the next fermentation step. The results of the single-factor experiment show that the optimized concentrations of sucrose (Figure S1), YEP, and MgSO4·7H2O were 40, 10, and 6 g/L, respectively, and at a temperature of 32 °C, pH of 7.0, and an inoculation amount of 6%, the HA yield reached a maximum of 3.97 g/L.
Given the interplay between these factors, it is challenging to develop a theoretical model because several factors are involved in the optimization of fermentation media and culture conditions. In addition, there is typically a certain degree of error in the measured data, which affects the evaluation of the optimization results. Therefore, a response surface optimization experiment was performed using BBD to determine the optimal concentrations of sucrose, YEP, and MgSO4·7H2O. Table 2 lists the design cases and results for the 17 sets of optimization experiments. Subsequently, an analysis of variance (ANOVA) was performed on the BBD experiment to detect the influence of the above three factors on HA expression (Table 3). Using a multiple regression analysis of the experimental data, a second-order polynomial equation was obtained as follows:
HA Concentration = 4.82 + (0.001 × X1) − (0.0.037 × X2) + (0.100 × X3) + (0.210 × X1 × X 2) + (0.017 × X1 × X3) − (0.120 × X2 × X3) − (0.420 × X12) − (0.300 × X22) − (0.710 × X32)
The coefficient of determination (R2) was greater than 0.90, indicating that the regression model was highly correlated. As shown in Table 3, the coefficient of determination (R2) was 0.9997, indicating that this model could explain 99.97% of the substrate change in response to the HA yield. Furthermore, the F-value of this model was 2355.53, and the correction determination coefficient R2Adj was 0.9992, indicating that the model was plausible. Therefore, the regression model can reasonably predict HA expression within the range of the variables studied. “Probe > F” was used to determine the significance of each factor, and the interaction intensity of each independent factor was obtained. The variance analysis showed that except for X1, the “Probe > F” value of the remaining model items was below 0.05, which was a significant variable affecting the model.
The experimental data in Table 3 were analyzed using Design-Expert 10.0 software (Stat-Ease, Inc., Minneapolis, MN, USA) and the results are shown in Figure 7. The response surface plots directly reflect the influence of various factors and their interactions on HA synthesis, with the bottom contour closely reflecting the strength of the interaction between the two factors. The contour plots between sucrose and YEP and between YEP and MgSO4·7H2O were approximately slanted ellipses, indicating a significant interaction (Figure 7A,C) [34]. In contrast, the interaction between MgSO4·7H2O and sucrose concentration on the HA yield was weak, and the contour plot was almost circular (Figure 7B). According to the typical analysis, when the concentrations of the variables sucrose, YEP, and MgSO4·7H2O are 39.72, 9.58, and 6.16 g/L, respectively, the actual HA output will be 4.92 g/L, which is consistent with the predicted value (4.82 g/L), indicating that this model embodies the basic effect of optimal design. The above results show a 54% increase in HA yield compared to pre-medium optimization. Therefore, B. amyloliquefaciens SE-StAB can synthesize HA by optimizing the response surface to fully exploit sucrose and YEP.

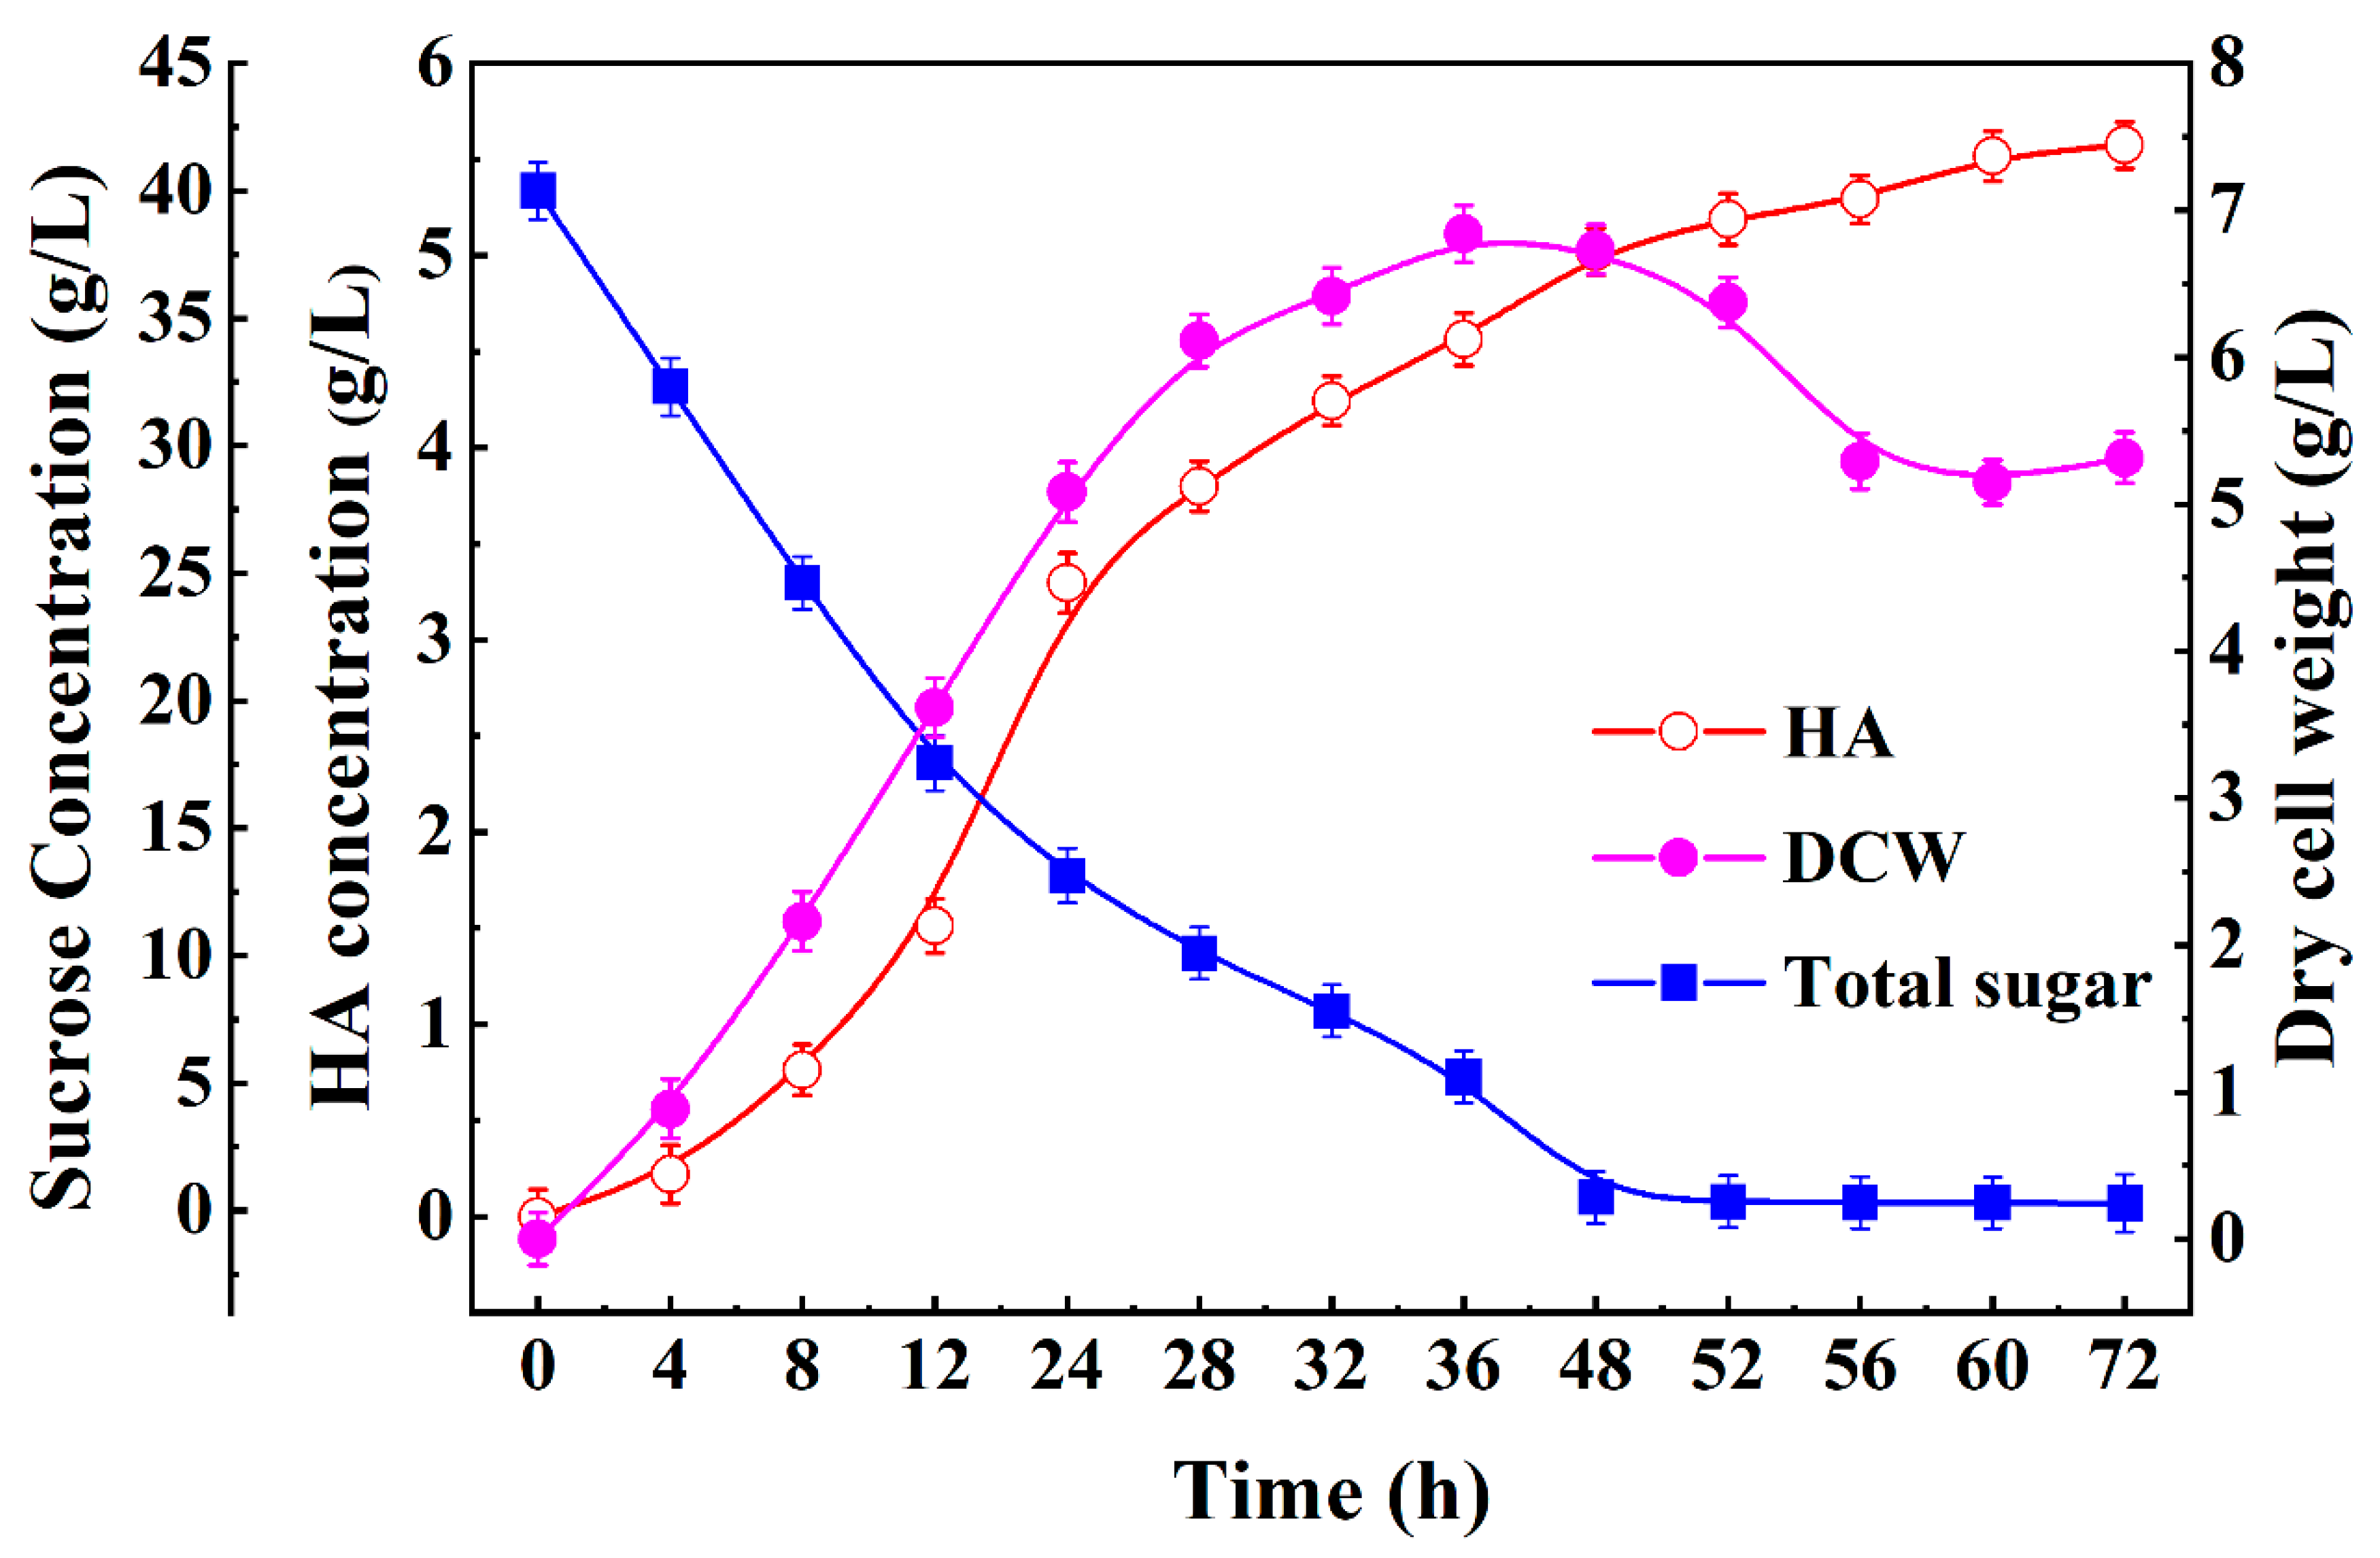
3.5. Batch Fermentation Optimization of HA Production in a 5 L Fermenter

In this study, the ability of the modified strain to synthesize HA was evaluated using a 5 L fermenter. The use of fermenters for scaled-up experiments is necessary to transition from laboratory to industrial production. In the laboratory, the amount of liquid in the flask is limited, and certain conditions, such as pH, cannot be adjusted during fermentation. However, some conditions such as temperature, pH, and DO electrodes can be used for real-time detection and adjustment during fermentation, which is important for HA yield guidance in the industry. Specifically, cells multiply rapidly as fermentation proceeds, and the continuous synthesis and secretion of viscous HA macromolecules during fermentation gives the fermentation liquid a viscous state, directly affecting the uptake of oxygen by the bacteria. In this study, the DO was achieved by controlling the rotational velocity. The rotational speed was controlled at 400 rpm during the initial fermentation and 600 rpm during the later stages. Studies have shown that higher shear rates may drive more carbon fluxes through the HA biosynthesis pathway to a certain extent without negatively affecting MW [35]. The experimental results are shown in Figure 8. Before 12 h, the strain rapidly depleted sucrose for cell growth, and HA synthesis was extremely slow. After 12 h, the clumps multiplied rapidly, and the cell density peaked at 36 h with a DCW of approximately 6.84 g/L. During this period, cell metabolism was extremely vigorous and HA was efficiently synthesized, and as a result, the HA content increased to 4.56 ± 0.09 g/L. From 36 h to 72 h, the sucrose content in the medium was almost exhausted and there was not enough energy to support the growth of the thalli, so the cell density started to decrease and tended to stabilize. At the same time, bacterial metabolic activity was reduced and the HA accumulation was slow, so fermentation stopped at 72 h. The content of HA finally stabilized at 5.57 ± 0.11 g/L in 72 h, which was 1.16-fold that of shake fermentation yield (4.81 ± 0.10 g/L). Compared to shaken flasks, the HA yield from the recombinant strain B. amyloliquefaciens SE-StAB was significantly increased with batch fermentation, suggesting that batch fermentation is highly favorable for somatic cell growth and can significantly increase the bacterial content and HA yield.
As shown in Table 4, the yield of low-molecular-weight HA is based on C. glutamicum in combination with SphasA from S. pyogenes, which is a down-regulated enzyme involved in intermediate metabolic pathways and extracellular polysaccharide biosynthesis, and hyaluronidase, which is used to destroy hyaluronic acid-coated glutamine and restore its metabolism. The yield of HA was as high as 74.1 g/L and the MW was 5.3 × 10⁴ Da [36]. High-molecular-weight HA was introduced into B. subtilis using the P. multocida-derived HAS gene, PmhasA, and key genes that encode the precursors UDPG-GlcUA, tuaD, and gtaB. By establishing a two-stage induction strategy for metabolic engineering of recombinant B. subtilis, the final yield and MW of HA reached 6.8 g/L and 4.5 × 10⁶ Da [37], respectively, after assembly and optimization of the HA synthesis pathway in B. amyloliquefaciens. Ma et al. introduced the HAS gene SehasA from S. equisimilis, expressed the key gene tuaD from C. glutamicum to construct the HAS synthesis pathway, and investigated HA yield by fermentation with a crude extract of Jerusalem artichoke inulin. The yield and MW of HA were 2.89 g/L and 1.5 × 10⁶ Da, respectively [17]. In this study, a new type of SthasA derived from the probiotic S. thermophilus was re-screened to construct the HA synthesis pathway using the precursor pathway, transcription regulatory factor optimization, and sucrose as the carbon source, with HA yield and MW of 5.57 g/L and 1.7 × 10⁶ Da, respectively. Although there is still a gap in the advanced level of macromolecular HA production in industry, there has been a further breakthrough in the expression of HA using B. amyloliquefaciens as a chassis strain; thus, there is scope for improvement. At a later stage, synthetase conversion can be considered, and degradation enzymes and other techniques can be introduced to further increase HA yield. In conclusion, we confirmed that B. amyloliquefaciens could be efficiently used as a site strain for HA synthesis using a new independently screened enzyme in B. amyloliquefaciens to achieve HA synthesis with a relatively high yield and MW. These results have laid the foundation for the industrialization of HA.

4. Conclusions

In this study, gene mining was used to discover a new SthasA derived from non-pathogenic bacteria in the probiotic S. thermophilus, enriching the existing safe microbial sources of HAS species. First, SthasA was identified in the B. amyloliquefaciens synthesis pathway, and HA synthesis was 0.8 g/L. Then, the precursor pathway was optimized, transcriptional regulatory factors were overexpressed, and the response surface was optimized to improve HA yield. In a 5 L fermenter, HA MW and yield were 1.73 × 10⁶ Da and 5.57 ± 0.11 g/L, respectively, which was 1.16-fold that obtained with shake fermentation (4.81 ± 0.10 g/L). Therefore, this study is the first to achieve the assembly and efficient expression of a probiotic source of HA synthase in food-grade, non-pathogenic B. amyloliquefaciens, providing a new method for the green and safe synthesis of HA.

Supplementary Materials

The following supporting information can be downloaded at: https://www.mdpi.com/article/10.3390/fermentation9060510/s1, Figure S1: Effect of carbon source type on hyaluronic acid yield and bacterial volume; Table S1: Primers used in this study; Table S2: Amino acid sequence homology analysis; Table S3: Top 3 most probable motifs in hyaluronic acid synthase.

Author Contributions

Q.Z.: conceptualization, investigation, data curation, software, methodology, and writing—original draft preparation. Y.M.: investigation, data curation, and methodology. D.X.: writing—review and editing and project administration. P.L.: writing—review and editing and project administration. S.L.: conceptualization, funding acquisition, and supervision. H.X.: conceptualization, funding acquisition, and supervision. Y.Q.: conceptualization, funding acquisition, and supervision. All authors have read and agreed to the published version of the manuscript.

Funding

This work was funded by the National Key Research and Development Program of China (No. 2022YFC2105202), the National Natural Science Foundation of China (No. 22008122), the Natural Science Foundation of the Jiangsu (BK20201050), the Foundation (No. GZKF202013) of State Key Laboratory of Biobased Material, and Green Papermaking, Qilu University of Technology, Shandong Academy of Sciences.

Institutional Review Board Statement

Not applicable.

Informed Consent Statement

Not applicable.

Data Availability Statement

The data are available from the corresponding author upon request.

Conflicts of Interest

The authors declare no conflict of interest.

References

  1. Kang, Z.; Zhou, Z.; Wang, Y.; Huang, H.; Du, G.; Chen, J. Bio-Based Strategies for Producing Glycosaminoglycans and Their Oligosaccharides. Trends Biotechnol. 2018, 36, 806–818. [Google Scholar] [CrossRef]
  2. Li, J.P.; Kusche-Gullberg, M. Heparan Sulfate: Biosynthesis, Structure, and Function. Int. Rev. Cell Mol. Biol. 2016, 325, 215–273. [Google Scholar] [PubMed]
  3. How, K.N.; Yap, W.H.; Lim, C.L.H.; Goh, B.H.; Lai, Z.W. Hyaluronic Acid-Mediated Drug Delivery System Targeting for Inflammatory Skin Diseases: A Mini Review. Front. Pharmacol. 2020, 11, 1105. [Google Scholar] [CrossRef] [PubMed]
  4. Lu, F.; Wu, Y.; Huang, J.; Zhang, X.; Wang, D.; Zou, Y.; Xu, W. Research Progress on Preparation and Application of Hyaluronic Acid. Sci. Technol. Food Ind. 2022, 43, 440–447. [Google Scholar]
  5. Qiu, Y.; Ma, Y.; Huang, Y.; Li, S.; Xu, H.; Su, E. Current advances in the biosynthesis of hyaluronic acid with variable molecular weights. Carbohydr. Polym. 2021, 269, 118320. [Google Scholar] [CrossRef]
  6. Ialenti, A.; Di Rosa, M. Hyaluronic acid modulates acute and chronic inflammation. Agents Actions 1994, 43, 44–47. [Google Scholar] [CrossRef]
  7. Witting, M.; Boreham, A.; Brodwolf, R.; Vávrová, K.; Alexiev, U.; Friess, W.; Hedtrich, S. Interactions of hyaluronic Acid with the skin and implications for the dermal delivery of biomacromolecules. Mol. Pharm. 2015, 12, 1391–1401. [Google Scholar] [CrossRef]
  8. Schwartz, S.R.; Hammon, K.A.; Gafner, A.; Dahl, A.; Guttman, N.; Fong, M.; Schauss, A.G. Novel Hydrolyzed Chicken Sternal Cartilage Extract Improves Facial Epidermis and Connective Tissue in Healthy Adult Females: A Randomized, Double-Blind, Placebo-Controlled Trial. Altern. Ther. Health Med. 2019, 25, 12–29. [Google Scholar]
  9. Boeriu, C.; Springer, J.; Kooy, F.; Broek, L.; Eggink, G. Production Methods for Hyaluronan. Int. J. Carbohydr. Chem. 2013, 2013, 624967. [Google Scholar] [CrossRef]
  10. Liu, J.; Wang, Y.; Li, Z.; Ren, Y.; Zhao, Y.; Zhao, G. Efficient production of high-molecular-weight hyaluronic acid with a two-stage fermentation. RSC Adv. 2018, 8, 36167–36171. [Google Scholar] [CrossRef]
  11. de Miranda, R.B.; Weimer, P.; Rossi, R.C. Effects of hydrolyzed collagen supplementation on skin aging: A systematic review and meta-analysis. Int. J. Dermatol. 2021, 60, 1449–1461. [Google Scholar] [CrossRef] [PubMed]
  12. Prasad, S.B.; Ramachandran, K.B.; Jayaraman, G. Transcription analysis of hyaluronan biosynthesis genes in Streptococcus zooepidemicus and metabolically engineered Lactococcus lactis. Appl. Microbiol. Biotechnol. 2012, 94, 1593–1607. [Google Scholar] [CrossRef]
  13. Hmar, R.V.; Prasad, S.B.; Jayaraman, G.; Ramachandran, K.B. Chromosomal integration of hyaluronic acid synthesis (has) genes enhances the molecular weight of hyaluronan produced in Lactococcus lactis. Biotechnol. J. 2014, 9, 1554–1564. [Google Scholar] [CrossRef] [PubMed]
  14. Schmid, J.; Sieber, V.; Rehm, B. Bacterial exopolysaccharides: Biosynthesis pathways and engineering strategies. Front. Microbiol. 2015, 6, 496. [Google Scholar] [CrossRef] [PubMed]
  15. Jin, P.; Kang, Z.; Yuan, P.; Du, G.; Chen, J. Production of specific-molecular-weight hyaluronan by metabolically engineered Bacillus subtilis 168. Metab. Eng. 2016, 35, 21–30. [Google Scholar] [CrossRef]
  16. Cheng, F.; Luozhong, S.; Guo, Z.; Yu, H.; Stephanopoulos, G. Enhanced Biosynthesis of Hyaluronic Acid Using Engineered Corynebacterium glutamicum Via Metabolic Pathway Regulation. Biotechnol. J. 2017, 12, 1700191. [Google Scholar] [CrossRef] [PubMed]
  17. Ma, Y.; Qiu, Y.; Yu, C.; Li, S.; Xu, H. Design and construction of a Bacillus amyloliquefaciens cell factory for hyaluronic acid synthesis from Jerusalem artichoke inulin. Int. J. Biol. Macromol. 2022, 205, 410–418. [Google Scholar] [CrossRef]
  18. Qiu, Y.; Zhu, Y.; Sha, Y.; Lei, P.; Zhengshan, L.; Feng, X.; Li, S.; Xu, H. Development of a Robust Bacillus amyloliquefaciens Cell Factory for Efficient Poly(γ-glutamic acid) Production from Jerusalem Artichoke. ACS Sustain. Chem. Eng. 2020, 8, 9763–9774. [Google Scholar]
  19. Zhu, Y.; Du, S.; Yan, Y.; Pan, F.; Wang, R.; Li, S.; Xu, H.; Luo, Z. Systematic engineering of Bacillus amyloliquefaciens for efficient production of poly-γ-glutamic acid from crude glycerol. Bioresour. Technol. 2022, 359, 127382. [Google Scholar] [CrossRef]
  20. Zhu, Y.; Hu, Y.; Yan, Y.; Du, S.; Pan, F.; Li, S.; Xu, H.; Luo, Z. Metabolic Engineering of Bacillus amyloliquefaciens to Efficiently Synthesize L-Ornithine from Inulin. Front. Bioeng. Biotechnol. 2022, 10, 905110. [Google Scholar]
  21. Khuri, S.; Bakker, F.T.; Dunwell, J.M. Phylogeny, function, and evolution of the cupins, a structurally conserved, functionally diverse superfamily of proteins. Mol. Biol. Evol. 2001, 18, 593–605. [Google Scholar] [CrossRef] [PubMed]
  22. Maloney, F.P.; Kuklewicz, J.; Corey, R.A.; Bi, Y.; Ho, R.; Mateusiak, L.; Pardon, E.; Steyaert, J.; Stansfeld, P.J.; Zimmer, J. Structure, substrate recognition and initiation of hyaluronan synthase. Nature 2022, 604, 195–201. [Google Scholar] [CrossRef] [PubMed]
  23. Broeker, N.K.; Gohlke, U.; Müller, J.J.; Uetrecht, C.; Heinemann, U.; Seckler, R.; Barbirz, S. Single amino acid exchange in bacteriophage HK620 tailspike protein results in thousand-fold increase of its oligosaccharide affinity. Glycobiology 2013, 23, 59–68. [Google Scholar] [CrossRef] [PubMed]
  24. Gelly, J.C.; Lin, H.Y.; de Brevern, A.G.; Chuang, T.J.; Chen, F.C. Selective constraint on human pre-mRNA splicing by protein structural properties. Genome Biol. Evol. 2012, 4, 966–975. [Google Scholar] [CrossRef]
  25. Widner, B.; Behr, R.; Von Dollen, S.; Tang, M.; Heu, T.; Sloma, A.; Sternberg, D.; Deangelis, P.L.; Weigel, P.H.; Brown, S. Hyaluronic acid production in Bacillus subtilis. Appl. Environ. Microbiol. 2005, 71, 3747–3752. [Google Scholar] [CrossRef] [PubMed]
  26. Lahooti, M.; Harwood, C.R. Transcriptional analysis of the Bacillus subtilis teichuronic acid operon. Microbiology 1999, 145, 3409–3417. [Google Scholar] [CrossRef]
  27. Jagadeeswara Reddy, K.; Karunakaran, K. Purification and characterization of hyaluronic acid produced by Streptococcus zooepidemicus strain 3523-7. J. BioSci. Biotechnol. 2020, 2, 173–179. [Google Scholar]
  28. Welti, D.; Rees, D.A.; Welsh, E.J. Solution conformation of glycosaminoglycans: Assignment of the 300-MHz 1H-magnetic resonance spectra of chondroitin 4-sulphate, chondroitin 6-sulphate and hyaluronate, and investigation of an alkali-induced conformation change. Eur. J. Biochemi. 1979, 94, 505–514. [Google Scholar] [CrossRef]
  29. Güngör, G.; Gedikli, S.; Toptaş, Y.; Sezgin, D.; Demirbilek, M.; Yazihan, N.; Aytar Çelik, P.; Denkbas, E.; Çabuk, A. Bacterial hyaluronic acid production through an alternative extraction method and its characterization. J. Chem. Technol. Biotechnol. 2019, 94, 1843–1852. [Google Scholar] [CrossRef]
  30. Alper, H.; Moxley, J.; Nevoigt, E.; Fink, G.R.; Stephanopoulos, G. Engineering yeast transcription machinery for improved ethanol tolerance and production. Science 2006, 314, 1565–1568. [Google Scholar] [CrossRef]
  31. Li, J.W.; Zhang, X.Y.; Wu, H.; Bai, Y.P. Transcription Factor Engineering for High-Throughput Strain Evolution and Organic Acid Bioproduction: A Review. Front. Bioeng. Biotechnol. 2020, 8, 98. [Google Scholar] [CrossRef] [PubMed]
  32. Cao, H.; Villatoro-Hernandez, J.; Weme, R.D.O.; Frenzel, E.; Kuipers, O.P. Boosting heterologous protein production yield by adjusting global nitrogen and carbon metabolic regulatory networks in Bacillus subtilis. Metab. Eng. 2018, 49, 143–152. [Google Scholar] [CrossRef] [PubMed]
  33. Lai, Z.; Teo, C.H. Cloning and expression of hyaluronan synthase (hasA) in recombinant Escherichia coli BL21 and its hyaluronic acid production in shake flask culture. Malays. J. Microbiol. 2019, 15, 575–582. [Google Scholar]
  34. Lu, X.; Zhong, Q.; Liu, J.; Yang, F.; Lu, C.; Xiong, H.; Li, S.; Zhu, Y.; Wu, L. Efficient expression of chondroitinase ABC I for specific disaccharides detection of chondroitin sulfate. Int. J. Biol. Macromol. 2020, 143, 41–48. [Google Scholar] [CrossRef] [PubMed]
  35. Westbrook, A.W.; Ren, X.; Moo-Young, M.; Chou, C.P. Application of hydrocarbon and perfluorocarbon oxygen vectors to enhance heterologous production of hyaluronic acid in engineered Bacillus subtilis. Biotechnol. Bioeng. 2018, 115, 1239–1252. [Google Scholar] [CrossRef]
  36. Wang, Y.; Hu, L.; Huang, H.; Wang, H.; Zhang, T.; Chen, J.; Du, G.; Kang, Z. Eliminating the capsule-like layer to promote glucose uptake for hyaluronan production by engineered Corynebacterium glutamicum. Nat. Commun. 2020, 11, 3120. [Google Scholar] [CrossRef]
  37. Jia, Y.; Zhu, J.; Chen, X.; Tang, D.; Su, D.; Yao, W.; Gao, X. Metabolic engineering of Bacillus subtilis for the efficient biosynthesis of uniform hyaluronic acid with controlled molecular weights. Bioresour. Technol. 2013, 132, 427–431. [Google Scholar] [CrossRef]
  38. Cheng, F.; Yu, H.; Stephanopoulos, G. Engineering Corynebacterium glutamicum for high-titer biosynthesis of hyaluronic acid. Metab. Eng. 2019, 55, 276–289. [Google Scholar] [CrossRef]
  39. Sunguroğlu, C.; Sezgin, D.E.; Aytar Çelik, P.; Çabuk, A. Higher titer hyaluronic acid production in recombinant Lactococcus lactis. Prep. Biochem. Biotechnol. 2018, 48, 734–742. [Google Scholar] [CrossRef]
Figure 1. Phylogenetic analysis of SthasA and other strains. The GenBank accession number appears at the end of the strain. The number of nodes is the percentage bootstrap value based on 1000 replications. The figure bar of 0.2 indicates the genetic distance.
Fermentation 09 00510 g001
Figure 2. Bioinformatics analysis of SthasA. (A) Conservative model sequence analysis and series identification diagram showing SthasA. (B) transmembrane structure of SthasA; and (C) 3D schematic diagram showing the prediction of SthasA.
Fermentation 09 00510 g002
Figure 3. Multiple sequence alignment analysis of amino acids and secondary structure prediction of SthasA.
Fermentation 09 00510 g003
Figure 4. HA synthesis pathway in B. amyloliquefaciens. (A) Gene combination in HA-producing operons. (B) Fragment expression of different UTP-glucose-1-phosphate uridylyltransferases. Different lowercase letters (a, b, c, d, e, f) mean significant (p < 0.05).
Fermentation 09 00510 g004
Figure 5. Characterization of the HA structure. (A) FTIR spectrum of HA purified from B. amyloliquefaciens SE-AB. (B) Proton NMR spectrum of HA purified from B. amyloliquefaciens SE-AB.
Fermentation 09 00510 g005
Figure 6. Effects of transcription factor overexpression on HA biosynthesis in B. amyloliquefaciens SE. (A) Regulators of the N-acetyl-D-glucosamine (GlcNAc) module; (B) regulators of the D-glucuronic acid (GlcUA) module; (C) fermentation results of overexpressing common transcription factors; and (D) fermentation results of the overexpression of GlcNAc and GlcUA predict transcription factors. Different lowercase letters (a, b, c, d, e, f) mean significant (p < 0.05).
Fermentation 09 00510 g006
Figure 7. Response surface curves and contour plots for HA yield by B. amyloliquefaciens SE-StAB. (A) Function for YEP and sucrose concentration when MgSO4·7H2O was maintained at 6.0 g/L; (B) function for MgSO4·7H2O and sucrose concentration when YEP concentration was maintained at 10.0 g/L; and (C) function for MgSO4·7H2O and YEP concentration when sucrose concentration was maintained at 40.0 g/L.
Fermentation 09 00510 g007
Figure 8. Time profile showing HA fermentation by B. amyloliquefaciens SE-StAB. (■) represents the total sugar concentration in the fermentation broth, (●) represents the dry cell weight (DCW), and (○) represents the concentration of HA.
Fermentation 09 00510 g008
Table 1. Strains and plasmids used in this study.
Strain or PlasmidRelevant CharacteristicsReferences
E. coli DH5αF-, φ80dlacZΔM1, Δ(lacZYA-argF) U169,
deoR, recA1, endA1, hsdR17 (rk-, mk+),
phoA, supE44, λ − thi-1, gyrA96, relA1
This lab
E. coli GM2163F-, ara-14 leuB6 thi-1 fhuA31 lacY1 tsx-78
galK2 galT22 supE44 hisG4 rpsL 136 (Strr)
xyl-5 mtl-1 dam13::Tn9 (Camr) dcm-6
mcrB1 hsdR2 mcrA
This lab
B. amyloliquefaciens NBNX-2S derivate, BamHI::PHpaII-pgsRThis lab
B. amyloliquefaciens NFNBΔpgsBCAThis lab
B. amyloliquefaciens SENFΔepsA-OΔsacBThis lab
pMA5E. coli and B. amyloliquefaciens Shuttle expression vector; AmpR, KmRThis study
pMA5-StApMA5 derivate consists of the SthasA gene
between BamHI and NdeI
This study
pMA5-StABpMA5-StA derivate consists of the tuaD gene CghasBThis study
pMA5-StABC1pMA5-StAB derivate consists of the gtaB gene BmhasCThis study
pMA5-StABC2pMA5-StAB derivate consists of the gtaB gene CghasCThis study
pMA5-StABC3pMA5-StAB derivate consists of the gtaB gene BshasCThis study
pMA5-StABC4pMA5-StAB derivate consists of the gtaB gene SphasCThis study
pMA5-StABC5pMA5-StAB derivate consists of the gtaB gene PahasCThis study
pMA5-StAB1pMA5-AB derivate consists of the translation factor gene CcpAThis study
pMA5-StAB2pMA5-AB derivate consists of the translation factor gene CodYThis study
pMA5-StAB3pMA5-AB derivate consists of the translation factor gene ThrAThis study
pMA5-StAB4pMA5-AB derivate consists of the translation factor gene ComKThis study
pMA5-StAB5pMA5-AB derivate consists of the translation factor gene Spo0AThis study
pMA5-StAB6pMA5-AB derivate consists of the translation factor gene AbrBThis study
pMA5-StAB7pMA5-AB derivate consists of the translation factor gene RexThis study
pMA5-StAB8pMA5-AB derivate consists of the translation factor gene FruRThis study
pMA5-StAB9pMA5-AB derivate consists of the translation factor gene BkdRThis study
pMA5-AB10pMA5-AB derivate consists of the translation factor gene CtsRThis study
pMA5-StAB11pMA5-AB derivate consists of the translation factor gene GltCThis study
pMA5-StAB12pMA5-AB derivate consists of the translation factor gene SigAThis study
Table 2. Experimental design and results of the Box–Behnken Design.
AssayFactorsHA Concentration (g/L)
X1X2X3ObservedPredicted
125.00 (−1)5.00 (−1)6.00 (0)4.35 ± 0.034.36
255.00 (1)5.00 (−1)6.00 (0)3.95 ± 0.063.94
325.00 (−1)15.00 (1)6.00 (0)3.85 ± 0.063.86
455.00 (1)15.00 (1)6.00 (0)4.29 ± 0.104.29
525.00 (−1)10.00 (0)4.00 (−1)3.61 ± 0.083.61
655.00 (1)10.00 (0)4.00 (−1)3.56 ± 0.113.58
725.00 (−1)10.00 (0)8.00 (1)3.79 ± 0.093.77
855.00 (1)10.00 (0)8.00 (1)3.81 ± 0.103.81
940.00 (0)5.00 (−1)4.00 (−1)3.63 ± 0.083.63
1040.00 (0)15.00 (1)4.00 (−1)3.80 ± 0.033.79
1140.00 (0)5.00 (−1)8.00 (1)4.06 ± 0.104.07
1240.00 (0)15.00 (1)8.00 (1)3.76 ± 0.103.76
1340.00 (0)10.00(0)6.00 (0)4.82 ± 0.064.82
1440.00 (0)10.00 (0)6.00 (0)4.82 ± 0.084.82
1540.00 (0)10.00 (0)6.00 (0)4.83 ± 0.104.82
1640.00 (0)10.00 (0)6.00 (0)4.81 ± 0.064.82
1740.00 (0)10.00 (0)6.00 (0)4.84 ± 0.044.82
X1, X2, and X3 are the coded values for the test variables sucrose, YEP, and MgSO4·7H2O concentrations (g/L), respectively.
Table 3. Regression analysis of the central composite design.
SourceSS aDF bMS cF-ValueProbe > F
Model3.8990.432355.53<0.0001 d
X11.7 × 10−511.69 × 10−50.0920.7702
X20.0110.0158.830.0001
X30.0810.08443.63<0.0001 d
X1X20.1810.18956.21<0.0001 d
X1X31.18 × 10−311.18 × 10−36.450.0387
X2X30.0610.06303.50<0.0001 d
X120.7310.733974.35<0.0001 d
X220.3710.372003.03<0.0001 d
X322.1512.1511729.38<0.0001 d
Residual1.28 × 10−371.83 × 10⁻⁴--
Lack of Fit8.17 × 10−432.72 × 10−42.330.2155
Pure Error4.67 × 10−441.17 × 10⁻⁴--
Cor Total3.8916---
X1, X2, and X3 are the coded values for the test variables sucrose, YEP, and MgSO4·7H2O concentrations (g/L), respectively. R2 = 0.9997, R2Adj = 0.9992, R2Pred = 0.9965. a Sum of squares. b Degree of freedom. c Mean square. d Indicate highly significant.
Table 4. Summarization of HA synthesis in recombinant strains.
StrainHAS SourceCarbon SourceYield (g/L)MW (Da)Reference
B. subtilis 168S. zooepidemicusSucrose19.386.6 × 103[15]
C. glutamicum 13032S. pyogenesGlucose74.105.3 × 104[36]
S. equisimilisGlucose28.72.1 × 105[38]
B. subtilis 168P. multocidaGlucose6.804.6 × 106[37]
L. lactis CES15S. equi subsp. zooepidemicusSucrose6.09-[39]
B. amyloliquefaciens CF-ABS. equisimilisJerusalem artichoke inulin2.891.5 × 106[17]
B. amyloliquefaciens SE-StABS. thermophilusSucrose5.781.7 × 106This study
Disclaimer/Publisher’s Note: The statements, opinions and data contained in all publications are solely those of the individual author(s) and contributor(s) and not of MDPI and/or the editor(s). MDPI and/or the editor(s) disclaim responsibility for any injury to people or property resulting from any ideas, methods, instructions or products referred to in the content.

