Article

Bioaugmentation Strategies for Enhancing Methane Production from Shrimp Processing Waste through Anaerobic Digestion

by
Valentina Mazzurco Miritana
1,*,
Alessia Gaetani
1,2,
Antonella Signorini
1,
Antonella Marone
1 and
Giulia Massini
1,*
1
Biotechnological Processes for Energy & Industry Laboratory (PBE), Department of Energy Technologies and Renewables, ENEA, Casaccia R.C., Via Anguillarese 301, 00123 Rome, Italy
2
Department of Biology and Biotechnology Charles Darwin, University of Rome La Sapienza, Piazzale A. Moro 5, 00185 Rome, Italy
*
Authors to whom correspondence should be addressed.
Fermentation 2023, 9(4), 401; https://doi.org/10.3390/fermentation9040401
Submission received: 9 March 2023 / Revised: 6 April 2023 / Accepted: 13 April 2023 / Published: 20 April 2023

Abstract

:
Bioaugmentation strategies were tested to improve energetic valorization of shrimp processing waste (SPW) by anaerobic digestion (AD). A fermenting bacteria pool (F210) obtained from coastal lake sediments and two strains of anaerobic fungi (AF), Orpynomyces sp. and Neocallimastix sp., commonly found as components of microbial community of AD plants, were used with the aim of improving the fermentative and hydrolytic phases of AD, respectively. The experiment was carried out by testing single bioaugmentation at an SPW concentration of 6.5 gVS L−1 and combined bioaugmentation at three SPW concentrations (6.5, 9.7 and 13.0 gVS L−1, respectively), in batch mode and mesophilic conditions. Cumulative CH4 productions were higher in the combined bioaugmentation tests and increased in line with SPW concentration. The F210 played a key role in enhancing CH4 production while no effect was attributable to the addition of AFs. The CH4 content (%) in the biogas increased with substrate concentrations, with average values of 67, 70, and 73%, respectively. Microbial community abundance increased in line with the SPW concentration and the acetoclastic Methanosarcina predominated within the methanogen Archaea guild in the combined bioaugmentation test (in all cases > 65%).

1. Introduction

The global consumption of aquatic food has been increasing significantly in recent years. The FAO [1] reported a doubling of per capita consumption in the last 50 years and a record in fisheries and aquaculture of 214 Mt in 2020. The FAO [1] furthermore estimates that aquatic animal production will grow by a further 14% by 2030.
Among aquatic foods, shrimps have become increasingly popular in both Asian and Western cuisines. Consequently, the global shrimp industry is also a fast-growing sector [2]; a world production of 8.12 Mt was reached in 2020 and it is expected to rise to 10.7 Mt by 2026 with considerable economic implications [1]. Shrimp processing operations are also growing, with the sale of both fresh and frozen products, generating waste with a high chitin content. It is estimated that 45–48% of shrimp raw material remain after food processing operations [3] and FAO [4] estimated a related waste generation of about 1 million tons y−1 for Asian countries alone. As a consequence, the sustainable disposal of shrimp shells is becoming an increasingly environmental concern [5,6]. In the last decade, industrial technologies have been developed for the material valorization of SPWs with the production of bioactive compounds, including chitosan, pigments, proteins, and others [7,8]. On the other hand, this option is not always sustainable due to the odors that quickly develop during SPW transport to biomaterial valorization plants. Currently, much organic waste, including food wastes, are conveyed to anaerobic plants to be energetically valorized through the anaerobic digestion (AD) process. This biotechnological treatment produces combustible biogas and fertilizing digestate, enabling organic waste to be disposed in an economically and ecofriendly way [9,10]. For these reasons, AD biotechnology allows to fulfil three fundamental objectives of the European Parliament’s environmental policies, comprising renewable energy production, greenhouse gas emission reductions, and sustainable waste management. AD is a spontaneous microbiological process that allows the liquefaction and hydrolysis of insoluble compounds and the gasification of intermediates, obtaining a biogas mainly composed of CH4 and CO2 (55–75% and 45–25%, respectively). The whole process is carried out by a complex microbial community composed of functional guilds of microorganisms that perform the different hydrolytic-fermentative and methanogenic steps of AD. In particular, the hydrolytic-fermenting and methanogenic phases are performed by microorganisms belonging to the Bacteria and Archaea domains, respectively. Moreover, the functional role of anaerobic fungi (AF), which, not only in the rumen ecosystem, but also in landfills and anaerobic digesters perform the initial degradation of complex biopolymers (e.g., lignocellulosic) with greater efficiency than any known microorganism, has recently been highlighted [11,12,13].
Currently, a great deal of interest is focused on those substrates that enable high yields and a high concentration of CH4 in biogas, the latter also with a view to in situ biogas upgrading into biomethane. Many types of organic waste have been studied and are used for biogas production, including agricultural and agro-industrial waste, industrial wastewater, sewage sludge, and food waste [14,15,16,17]. In recent years, waste from the fisheries and aquaculture industry has also been considered [18,19] with a view to simultaneously reduce environmental problems [20] and produce energy [21]. Recently, the use of shrimp shells and derivatives for bioenergy production via AD has also been proposed [8,22]. In this context, the European regulatory framework [23] regulates the use of by-products of fish processing in the feeding of biogas plants for the production of biogas and biomethane.
Shrimp shells are mainly composed of chitin, an insoluble long-chain polymer of N-acetyl-b-d-glucosamine similar to polysaccharide cellulose [24]. Chitin, however, differs from the latter mainly in its nitrogen content (C:N = 8:1). Chitin is the most widespread natural biopolymer after cellulose [25] and both chitin and cellulose are characterized by bonds β-(1–4) which strongly contribute to making them refractory to degradation. In natural environments, such as soils, but also freshwater and marine sediments, chitin degradation is carried out by microbiological processes, performed by aerobic and anaerobic microorganisms, such as fungi and bacteria [26]. They are able to degrade chitin to chitosan by deacetylation or hydrolyze it to N,N′-diacetylchitobiose and oligomers of N-acetylglucosamine using endo- and exo-chitinases [24]. In industrial plants, the difficult and slow degradation of such polymers requires the use of pretreatment approaches (i.e., mechanical, physical, high-intensity ultrasound, chemical, and biological) to overcome the challenges of biotechnological conversion [8]. Despite this, many of the pre-treatment have the disadvantage of being expensive and/or environmentally unfriendly.
With the aim of obtaining microbial communities that can cooperate efficiently in the carrying out of complex bioprocesses, such as AD, the use of selected mixed microbial pools and/or microbial communities enriched for a specific function is emerging as a line of research in the field of applied microbiology, bioprocess engineering, and biotechnology [27]. In a previous study by our group, the feasibility of biofuel production (H2 and CH4) from raw chitin material in a two-phase anaerobic bio-process has been demonstrated [28]. In that study, a biological pre-treatment of (pre)hydrolysis by an aerobic chitinolytic fungus, together with a two-phase process to separately optimize different digestion steps (hydrolytic/fermentation phase and methanogenic phase) were adopted. Hydrogen production was promoted using an efficient and highly productive inoculum, the so-called F210, enriched from costal lake sediment and selected for high H2 production [29,30]. The highest H2 (147 mL L−1) and CH4 (7713 mL L−1) levels were obtained after 24 days of dark fermentation and 83 days of digestion, respectively [28]. To avoid the multiple phases process, a different biological approach consisting of the application of bioaugmentation strategies is carried out. Indeed, bioaugmentation with specific functional strains or microbial pools has proven to be a valid strategy for enhancing AD yields, especially for recalcitrant substrates [31]. Bioaugmentation applied to AD constitutes a co-treatment approach that can replace expensive, time-consuming, and in some cases polluting pretreatments [31]. Microbial components can be found in natural ecosystems such as soils, marine, and freshwater sediments, and in highly specialized ecosystems such as the rumen, or even in engineered ecosystems such as AD plants [28,29,32]. In all these ecosystems, the environmental pressures allow the selection of microbial communities able to perform specific metabolic functions. Subsequent microbial community enrichment procedures, performed by simulating natural environments [33], can be carried out to further improve specific functions of microbial pools.
The main aim of this study was to test bioaugmentation strategies to improve CH4 production through the AD of shrimp shells. Bioaugmentation was performed using two functionally different microbial components, anaerobic fungi (AF) and a microbial pool (F210) promoting the hydrolytic and fermenting AD phases, respectively. These two microbial components were successfully used in a previous study involving the AD of lignocellulosic biomass [31].
The specific objectives were: (i) to verify the feasibility of obtaining energy from shrimp processing waste (SPW); (ii) to verify whether the efficiency of AD can be improved using AF and F210 alone or in combination; (iii) to further improve the efficiency of the process by increasing the substrate concentration; and finally, (iv) to investigate the characteristics of the main microbial components of the bioaugmented community.

2. Materials and Methods

2.1. Substrate Characteristics

The substrate used in this study consisted of shrimp operational waste, i.e., shrimp shells obtained from a local industry (Lazio region) producing peeled shrimp. The treated shrimps were fished in the Mediterranean Sea and, for the most part, belonged to the Parapenaeus longirostris species. Shrimp waste was transported to the laboratory in a refrigerated thermal container (4 °C) and immediately cleaned (only the carapace was used), washed, and dried at 60 °C for 72 h. The dry shells were then crumbled and passed through a sieve with a lumen diameter of 3.35 mm to obtain a homogenized substrate. The SPW was characterized in terms of total solids (TS) and volatile solids (VS) as well as total carbon (TC) and total nitrogen (TN). TS and VS were determined according to the standard APHA (American Public Health Association) methods [34] after SPW drying (105 °C, 48 h) and incineration at (550 °C, 4 h), respectively (3 replicates). Total carbon (TC) and total nitrogen (TN) were analyzed using a Carlo Erba EA 1108 Elemental CHN Analyzer (Carlo Erba, Milan, Italy). In the method, C and N are simultaneously determined as gaseous products. The accuracy of the method was tested for three samples (SD < 10%). The SPW main characteristics are reported in Table 1.

2.2. Microbial Sources

The microbial components used for the bioaugmentation tests consisted of a mix of two strains of anaerobic fungi (AF), a bacterial pool (F210), and AD digestate.
In particular, the AF mix consisted of pure strains of Neocallimastix sp. and Orpynomices sp. previously selected from rumen ecosystems and provided by Kahramanmaras Sectu Imam University, and stored until use at −20 °C, (15% of glycerol). These fungi were selected as they are commonly found as components of microbial community of AD plants [12].The AF cultures were then individually reactivated as reported in Miller and Wolin [35] and in line with Ferraro et al. [31]. Briefly, the two strains were reactivated and grown in serum bottles, containing 50 mL of the prescribed basal medium and 0.5 g of sterilized straw and then flushed with CO2 to establish an anoxic environment. After anaerobic incubation at 39 °C, the two cultures were used in a mixture (1:1 ratio) which obtained a final mixture concentration of 104 zoospores.
The F210 microbial pool was selected from the sediment of the eutrophic coastal lake in Fogliano (Circeo National Park, Central Italy), enriched (during 210 h) as reported in Izzo et al. [29] and stored at −20 °C (30% glycerol) until use. F210 pool was selected as a very generalist culture highly effective in H2 production from a wide range of different and complex substrates [29,31], including chitin extract [28]. The F210 was reactivated in the fermentation basal medium at 37 °C for 24 h. At the end of culture reactivation, fermentation activity was verified by measuring the concentration of H2 produced, which was about 42%. Cell abundance was determined by direct counting under an epifluorescence microscope after staining with DAPI (see below) and was 2.9 × 10⁸ cell mL−1 ± 1.6 × 10⁷. A solution with a final cell concentration of 108 cell mL−1 was used in the experiment. No Archaea were detected when analyzing this inoculum.
Before inoculation, the cultures used for the bioaugmentation tests were centrifuged and re-suspended twice in PBS to remove the culture medium.
The AD microbial community (termed M) was obtained by collecting digestate from a pilot plant located in ENEA’s Casaccia Research Centre. The plant consisted of a continuous stirred tank reactor (50 L) fed with second cheese whey, a dairy waste water rich in lactose (40–60 g L−1). The digestate used as the AD inoculum had a microbial abundance of 3.5 × 10⁸ cell mL−1 ± 2.4 × 10⁷. Considering that the cheese whey does not consist of complex biopolymers, this type of digestate was chosen assuming that it lacked or was poor in hydrolytic microorganisms, specifically to highlight the hydrolytic effect of the bioaugmenting microbial components.

2.3. Set-Up of Anaerobic Digestion Experiment

A base concentration of SPW of 6.5 gVS L−1 was applied, relying on the positive results obtained in a previous study [31] dealing with the same combined bioaugmentation strategies but using lignocellulosic substrates as complex biopolymers. A total of seven experimental conditions were set up and tested in parallel (Table 2).
Three of them using a substrate concentration of 6.5 gVS L−1 tested combined bioaugmentation, i.e., AF + F210 (AF + F210_6.5) and single bioaugmentation using F210 or alternatively, AF (F210_6.5 and AF_6.5, respectively). There was a control condition without bioaugmentation (M_6.5) and a blank with the AD inoculum and no substrate was also set up (I). In addition, two other combined bioaugmentation conditions, where the substrate concentration was increased, respectively, by half and double, i.e., AF + F210_9.7 and AF + F210_13, were also set up. In the combined bioaugmentation tests, AF and F210 cultures were used, each at 8% v/v. With the single bioaugmentation, cultures were used at 16% v/v. Methanogenic inoculum was used at 20% of the final working volume (w/v).
Each experimental condition was set up in batch mode using 120 mL serum bottles (three replicates). A final working volume of 62.5 mL was established by adding a sterile phosphate buffer solution (KH2PO4 and Na2HPO4, 0.1 M) used to maintain the pH of the medium at 6.8, preventing acidification during the AD process.
The batches were set up as follows: the serum bottles were filled with the phosphate buffer solution in accordance with the volumes of the experimental plan. The prescribed amount of substrate was then placed in each bottle and the AD inoculum was added. The bottles, plugged with caps and sealed with metal ferrules, were fluxed with N2 (10′) to establish an anaerobic condition. AF and F210 cultures were then added using a syringe.
During the experiment, the batches were kept in a thermostatically controlled bath in a mesophilic condition (37 ± 1 °C) under agitation with an orbital oscillation of 100 rpm in the dark.

2.4. Biogas and Organic Acid Detection

Biogas production was measured according to Martinez-Sibaja et al. [36], using a water displacement device—a volumetric system with water displacement equal to the amount of biogas produced. The biogas composition (i.e., H2, CH4, CO2) was determined using a gas chromatograph (Focus GC, by Thermo Fisher Scientific, Waltham, MA, USA) equipped with a thermal conductivity detector (TDC) and a 3 m stainless steel column packed with Hayesep Q (800/100 mesh). Nitrogen gas was used as a carrier at a flow rate of 35 mL min−1. The temperature of the column and injector was 120 °C while that of the TCD was 200 °C. Cumulative CH4 production was calculated with the Logan equation [37] and the values obtained were standardized to the volume of 1 L w. Biogas production and methane content were measured each day in the first experimental week. Measurements were then carried out every three days until day 20 and thereafter approximately every 7–10 days.
Volatile fatty acids (VFAs), lactic acid, and ethanol were analyzed by HPLC Thermo Spectrasystem, equipped with UV (λ = 210 nm) and refraction index detectors. An isocratic method at 75 °C has been developed using a Column Rezex ROA Organic Acid H+ (8%), size 300 × 7.8 mm Phenomenex, Torrance, CA, USA. The column was operated with a 2.5 mM H2SO4 as mobile phase (flow rate 0.6 mL min−1). Samples were centrifuged for 10 min at rpm, diluted 1:20 with mobile phase solvent and again centrifuged for 10 min at rpm before injection. For calibration, mixed standards were prepared from pure substances (p.a. grade) at concentration levels of 10, 50, 200, and 500 ppm. The analysis were performed in duplicate. A relative standard deviation ≤ 5% was obtained.

2.5. Microbial Community Analysis

Aliquots of medium samples were collected, fixed in a 4% formaldehyde solution as reported by Pernthaler et al. [38] and stored at −20 °C. Microbiological investigations were conducted using epifluorescence microscopy techniques. Microbial abundance (N. total cells mL−1) was determined in triplicate at days 8, 45, 70, and 105 after DAPI (1 μg mL−1) staining and incubating in the dark (>20′). The samples were then fixed on filters (black polycarbonate filters, pore size 0.2 μm, diameter 25 mm, Millipore, Burlington, MA, USA), mounted on microscope slides and 15 cell enumerations were performed for each slide.
The fluorescence in situ hybridization (FISH) technique was performed at days 8, 70, and 105 in accordance with Amann et al. [39] and Barra Caracciolo et al. [40], to quantify the Bacteria and Archaea component in the microbial community. Specific functional components inside the Archaea guild were investigated at day 70. Before FISH analysis, a cell extraction procedure was performed to detach and separate cells from substrate and/or inorganic particles [41] using an OptiPrep™ density gradient medium (Axis-Shield PoC As, Oslo, Norway).
Hybridization was carried out using probes EUB338, II, III, and ARC915 to detect the Bacteria and Archaea domains, respectively [42]. Within the methanogenic Archaea guild, investigations were performed using probes MS821 and MX825 to detect the acetoclastics Methanosarcina and Methanosaeta, respectively; probes MC1109, MB1174, and MG1200b were used to detect the hydrogenotrophs Methanococcus, Methanobacteriales and Methanomicrobiales, respectively. All oligonucleotide probes (50 ng mL−1), labelled with carboxyfluorescein (FAM) or indocarbocyanine (Cy3) fluorochromes, were purchased from MWG AG Biotech (Ebersberg, Germany). Finally, the slides were mounted with a few drops of VectaShield (Vector Laboratories, Newark, CA, USA) to preserve the fluorescence. Cell quantification was carried out enumerating probe-positive cells versus DAPI-stained cells.
A Zeiss Axioskop 40 (Carl Zeiss, Jena, Germany) epifluorescence microscope equipped with a ZEISS HXP 120 v Light Source, a narrow band-pass filter set for multicolor detection and a 100× objective, was used for microscopy investigations. Micrographs were obtained using the AxioVision Release 4.6.3 program.

2.6. Statistical Analysis

Analysis of variance (ANOVA) was performed with the cumulative CH4 production between the different experimental conditions in order to evaluate the differences. The statistical significance (p ≤ 0.05) of the mean data was assessed using MS Excel 2013.

3. Results and Discussion

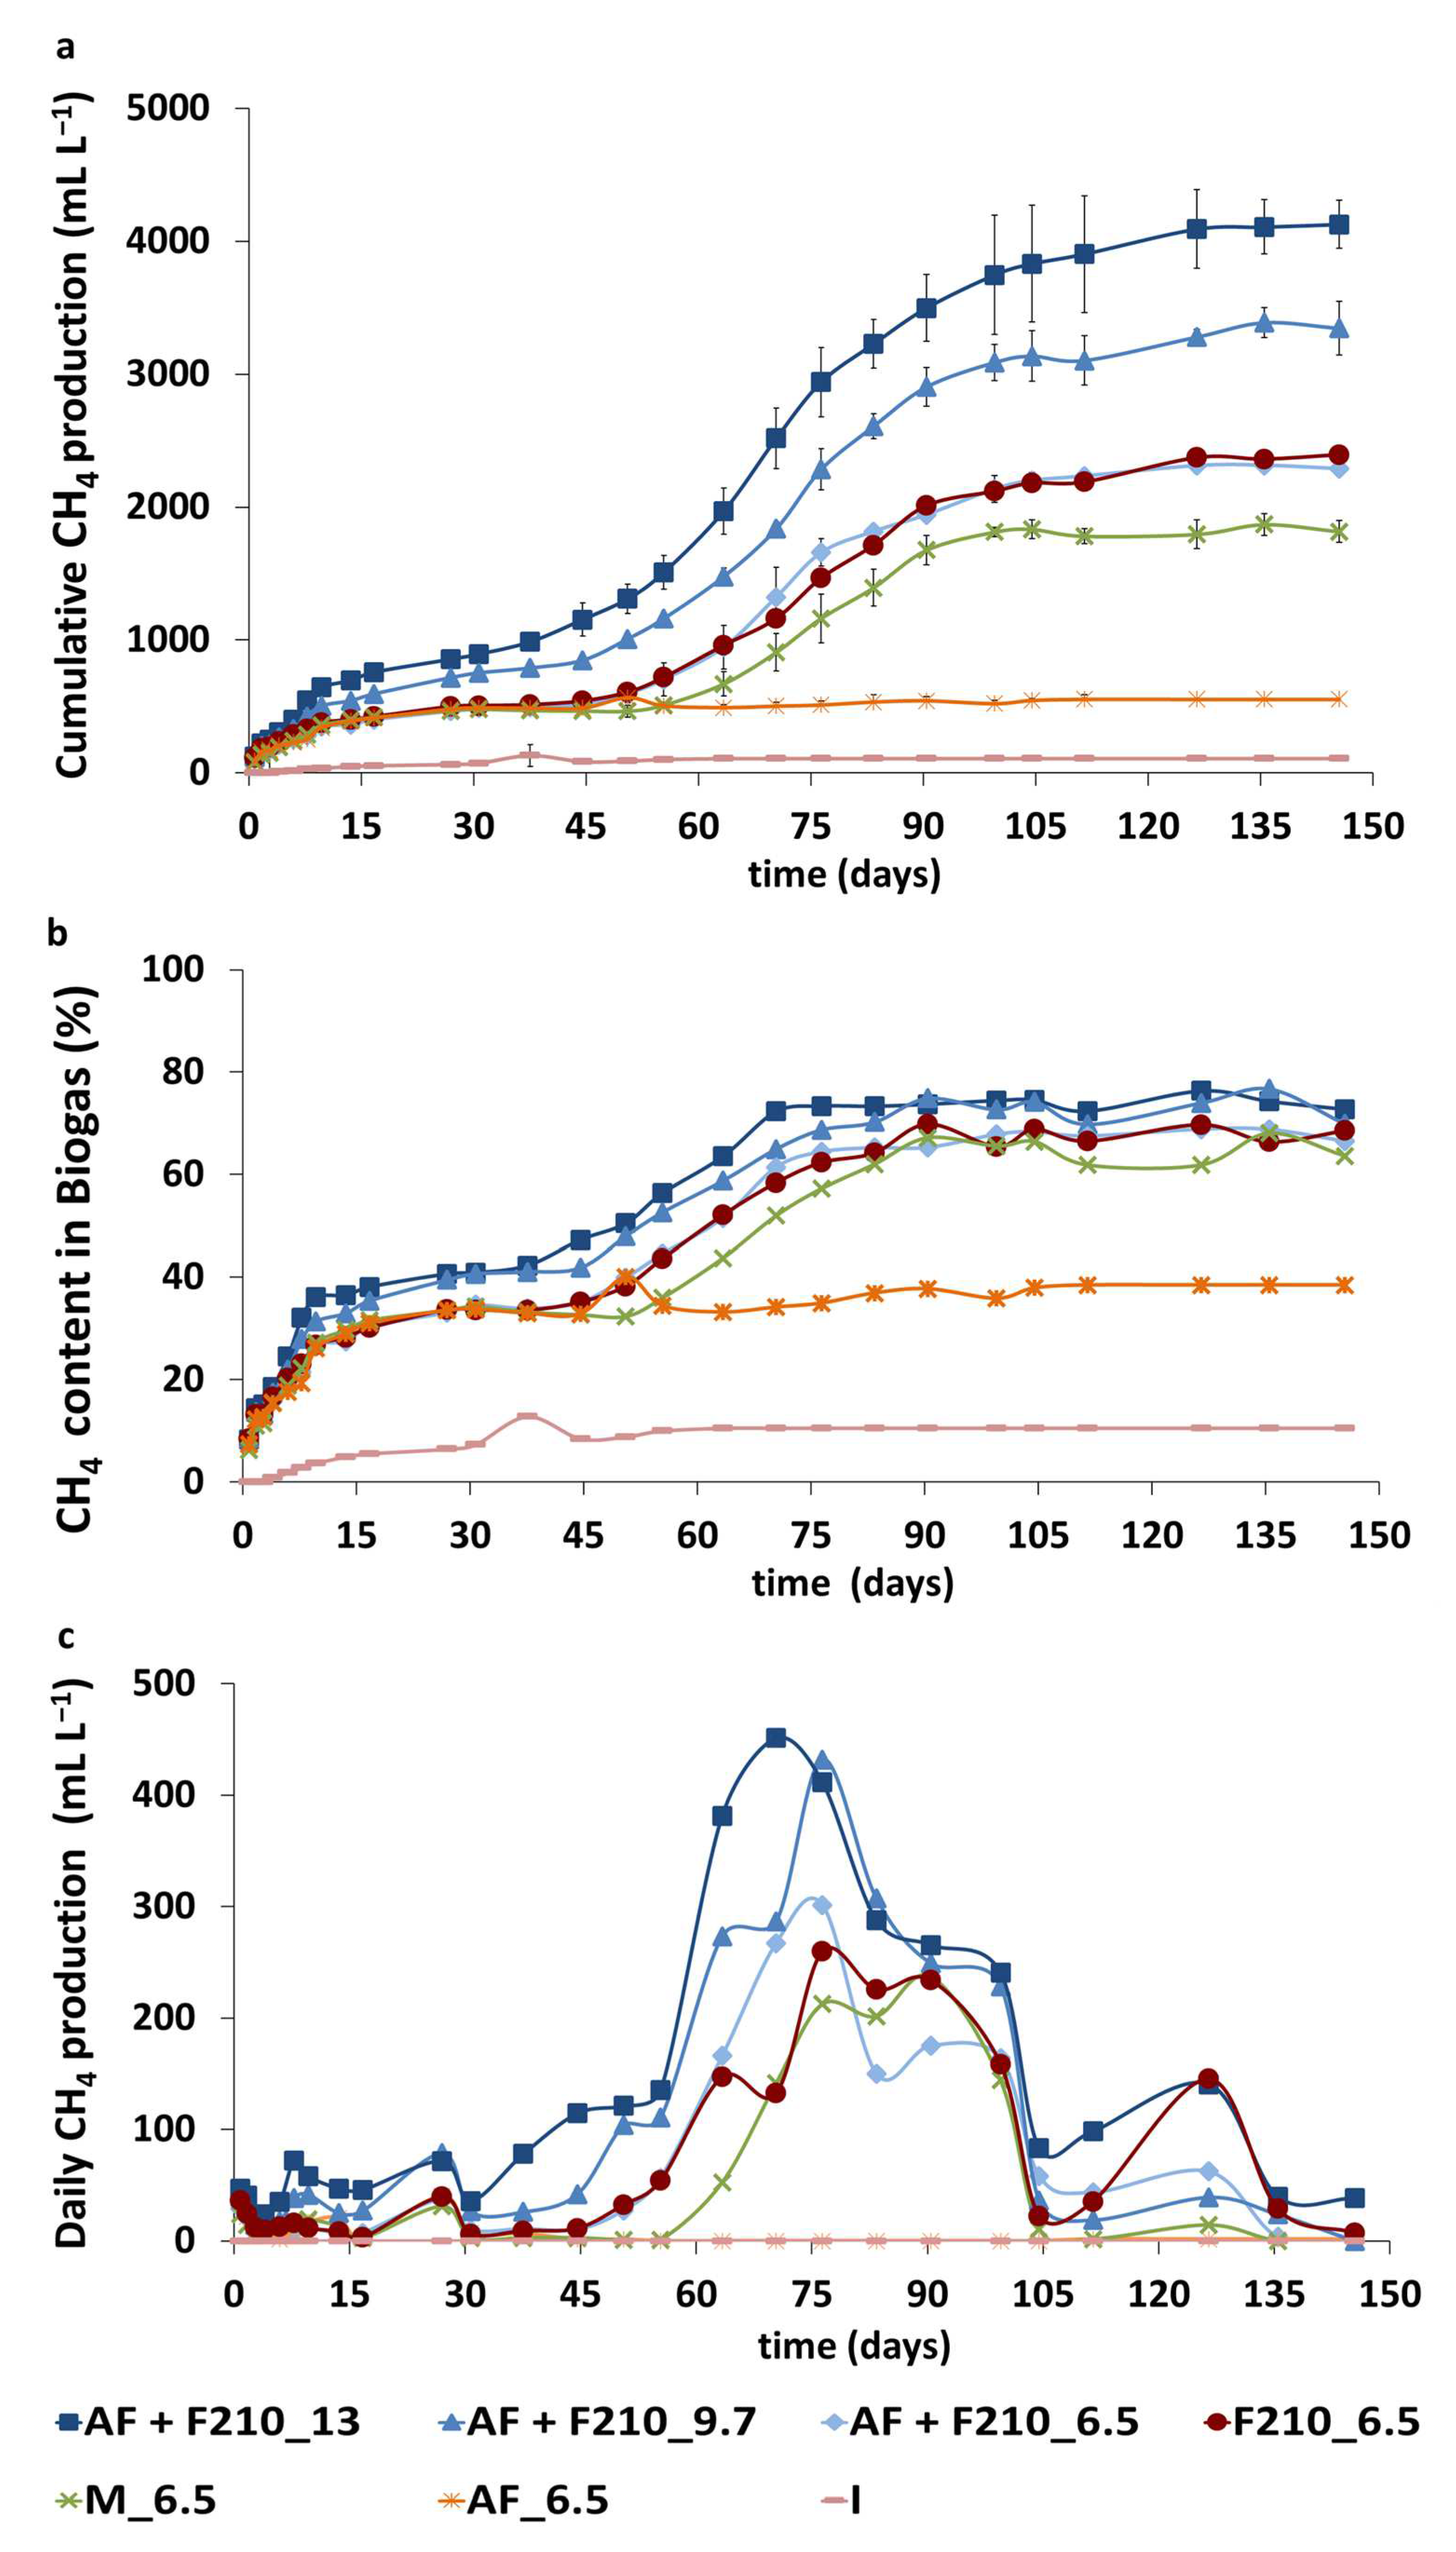
3.1. Biogas Production

Among the tests performed at a SPW concentration of 6.5 gVS L−1, the best cumulative production of CH4 was obtained from the combined bioaugmentation test, AF + F210_6.5 (Figure 1a). A final cumulative CH4 production of 2268 mL L−1 ± 21 was achieved with this test and an increase of 25% in final CH4 production was obtained compared to the unaugmented condition, M_6.5 (1817 mL L−1 ± 84). Comparatively, Gorrasi et al. [28] obtained a much higher production of CH4 equal to 7713 mL L−1. However, this result was obtained using a commercial chitin extract in a three-step process (aerobic pre-hydrolysis, fermentation, and AD) which lasted 121 days as a whole. Although the energy valorization of SPW and its wastewater by AD has recently been considered by other authors [8,22,43], to the best of our knowledge, this is the first study in which a bioaugmentation strategy is applied in order to increase the efficiency of CH4 production in a one-step process.
A bioaugmentation strategy was previously adopted in the study conducted by Ferraro et al. [31] in which the AD of lignocellulosic waste, i.e., wheat straw and spent mushroom straw, was carried out with AFs and F210 under the same experimental conditions as in the present study. In that work, considerably lower cumulative CH4 productions equal to 776.0 ± 2.1 and 619.2 mL L−1 ± 2.2, respectively, for wheat straw and spent mushroom straw were achieved. Thus, the results presented here demonstrates the feasibility of AD or SPW and encourage toward further studies for the optimization of AD process of SPW.
At day 70, the time at which CH4 production was found to be the most intense (see below), cumulative productions of AF + F210_6.5 and M_6.5 were 1323 mL L−1 ± 224 and 907 mL L−1 ± 142, respectively, showing an increase of 46% in biogas production in the combined bioaugmented test.
However, the efficacy of bioaugmentation was attributable to the F210 pool used to improve the fermenting AD phase, since at concentrations of 6.5 gVS L−1, no difference between AF + F210_6.5 and F210_6.5 was detectable in terms of CH4 production. This result also shows that the presence of the AF inoculum in the combined bioaugmentation test did not seem to generate negative interactions within the microbial community.
The lowest CH4 cumulative production was obtained from the single bioaugmented test carried out using anaerobic fungi (AF_6.5); its production was also lower than in the unaugmented condition M_6.5. At the end of the experiment, AF_6.5 produced 228% less compared to M (554 mL L−1 ± 33.4 vs. 1817 mL L−1 ± 84).
At day 70, the cumulative CH4 production of AF_6.5 was about half of that of M (503 mL L−1 ± 30 vs. 907 mL L−1 ± 142 CH4), corresponding to 80% less than the control test. It can be stated that when bioaugmenting only the hydrolytic AD phase, by means of AF, and omitting to enrich the subsequent fermenting phase with F210, an imbalance between the metabolic guilds of the microbial community is generated. In this case, the ‘bottleneck’ of the process, which generally occurs in the first phase of the AD process [44], is transferred to the following ones, as is deductible by the detection of the accumulation of acids (see below, Figure 2). Theuerl et al. [45] emphasize that the AD process can lose efficiency if the metabolic guilds that co-operate during it are not in balance with each other. A further confirmation of our experimental evidence is obtained from the study of Nkemka et al. [46]. The authors found no differences in cumulative CH4 yields between the AD test bioaugmented with an AF strain and the unaugmented one.
The combined bioaugmented tests with an increased SPW concentration, i.e., AF + F210_9.7 and AF + F210_13, reached a final CH4 cumulative production of 3346.3 mL L−1 ± 201 and 4128.0 mL L−1 ± 182, respectively, showing significantly different values, even compared to AF + F210_6.5 (p < 0.01). In AF+F210_9.7 and AF+F210_13, which received 50% and 100% higher SPW concentrations than AF + F210_6.5, CH4 cumulative production increased by 47% and 82%, respectively, in line with the increase in SPW (Figure 1b). These results suggest that the AD microbial community uses SPW efficiently, improving biogas quality in line with the increase in substrate supplied.
In this study, a CH4 content above 70% was obtained for AF + F210_9.7 and AF + F210_13 (Figure 1b), with peaks as high as 82.3% recorded in individual tests. Moreover, a CH4 concentration of more than 60% was obtained under all experimental conditions (excluding the AF + M_6.5 test), highlighting that SPW is a type of substrate with a high potential for the AD process. In the above-mentioned study by Ferraro et al. [31], the biogas CH4 concentrations did not exceed 46.1% ± 2.1.
Kundu et al. [17] state that biogas composition depends on the type of biomass used as well as the configuration of the biotechnology employed. The results show that SPW is a suitable substrate for use with the AD process to obtain methane-rich biogas. Moreover, it must be considered that the percentage of CH4 contained in biogas is a parameter of great interest from the point of view of biogas purification (up-grading) to biomethane [47,48]. Indeed, biomethane can directly replace natural gas and can be stored and distributed throughout the energy grid, using existing gas infrastructure and end-use technologies. Typically, the CH4 content of biogas produced by real plants is limited to 50–60%. This suboptimal result is due to the difficulty in combining engineering solutions with the requirements of microbiological processes [49] and much research effort needs to be dedicated to improve this value.
The most intense CH4 production, measured in terms of daily production, was recorded between days 70 and 77 in almost all tests (Figure 1c) and the highest daily production of CH4 was obtained in the conditions with the highest SPW concentration. Values of 451, 432, and 301 mL L−1 were displayed for the three combined bioaugmentation tests with different SPW concentrations, i.e., AF + F210_13, AF + F210_9.7, and AF + F210_6.5, respectively. A further peak in daily production, albeit modest, was recorded after 100 experimental days. For this reason, the experiment was continued until day 145.
The yields obtained (mL CH4 gVS−1) ranged between 322.5 ± 14 mL gVS−1 and 374.2 ± 21 mL gVS−1 for all tests with F210_6.5, with single and combined bioaugmentation. In the test bioaugmented only with AF (AF_6.5) the yield was substantially lower, i.e., 86.5 ± 5 mL gVS−1, confirming that this microbial community configuration has difficulty in being metabolically efficient.

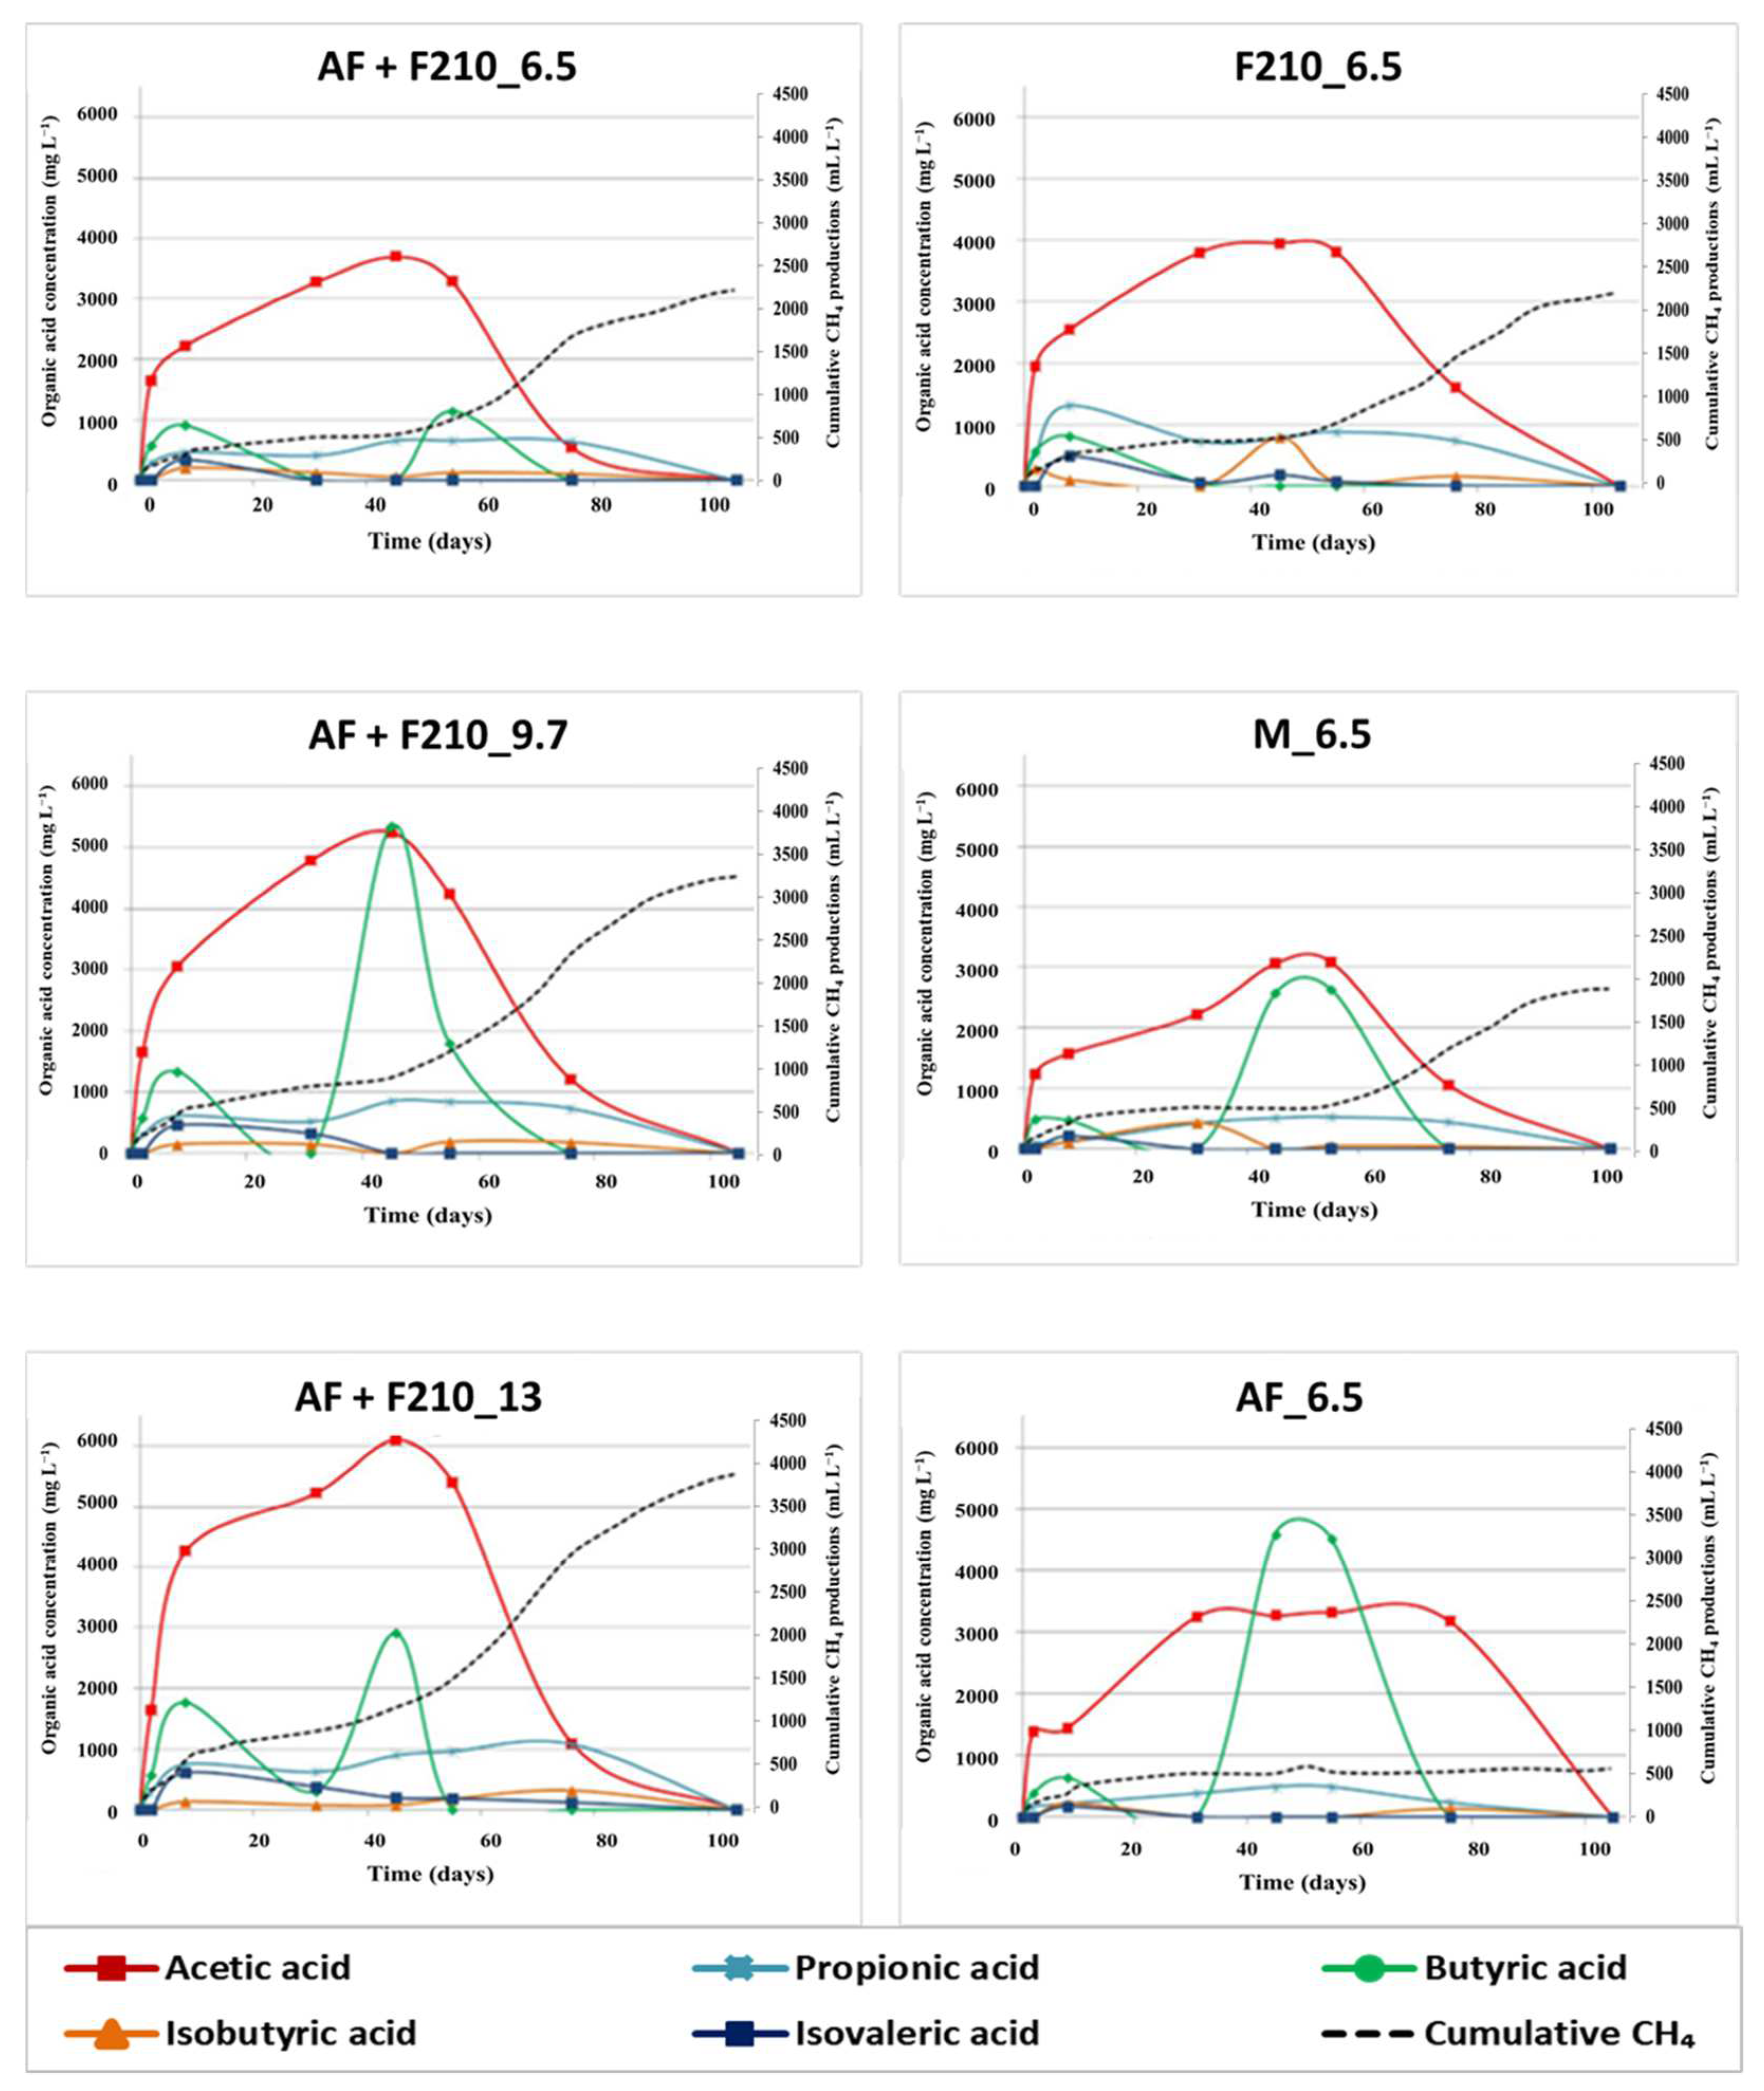
3.2. Organic Acid Measurements

Only acetic, butyric, propionic, valeric, and isovaleric acid were detected and are discussed. The analysis of the process intermediates shows that CH4 production is mainly carried out via the acetotrophic metabolic pathway (Figure 2), as expected in the mesophilic condition. The acetotrophic pathway predominates in CH4 production in real plants [50,51,52] and at least 70% of CH4 production is estimated to occur through this metabolic route. From the graphs shown in Figure 2, it can be seen that during the experiment, a decrease in acetic acid concentration was combined with an increase in CH4 production as well as biogas CH4 (Figure 1b).
A case in point was the AF test in which low CH4 production proved that this microbial community configuration was unable to counteract the acetic acid accumulation for most of the experiment.
However, a long lag phase and a delay in CH4 production was recorded in all tests, probably attributable to the imbalance of the different phases in the AD process, with a fermentation phase that was too fast compared to the metabolic capacity of the archaea, as highlighted by the general accumulation of acetic acid at least until day 50. Further investigation should also be devoted to the temporary accumulation of butyric acid.

3.3. SPW Removal and Composition

The effectiveness of the use of SPW for CH4 production is also demonstrated by the substrate removal (%) recorded at the end of the experiment and shown in Table 3.
For all tests, more than 99% of the VS and more than 97% of the TS were removed, showing that chitin, a complex biopolymer refractory to degradation, was nevertheless efficiently digested.
SPW initially used in the experiment showed a C:N ratio of 10:1, whereas at the end of the experiment, the ratio of the digestate was of 4:1 for AF + F210_13 and AF + F210_9.75, respectively, showing that the AD process depleted the carbon content in the SPW.

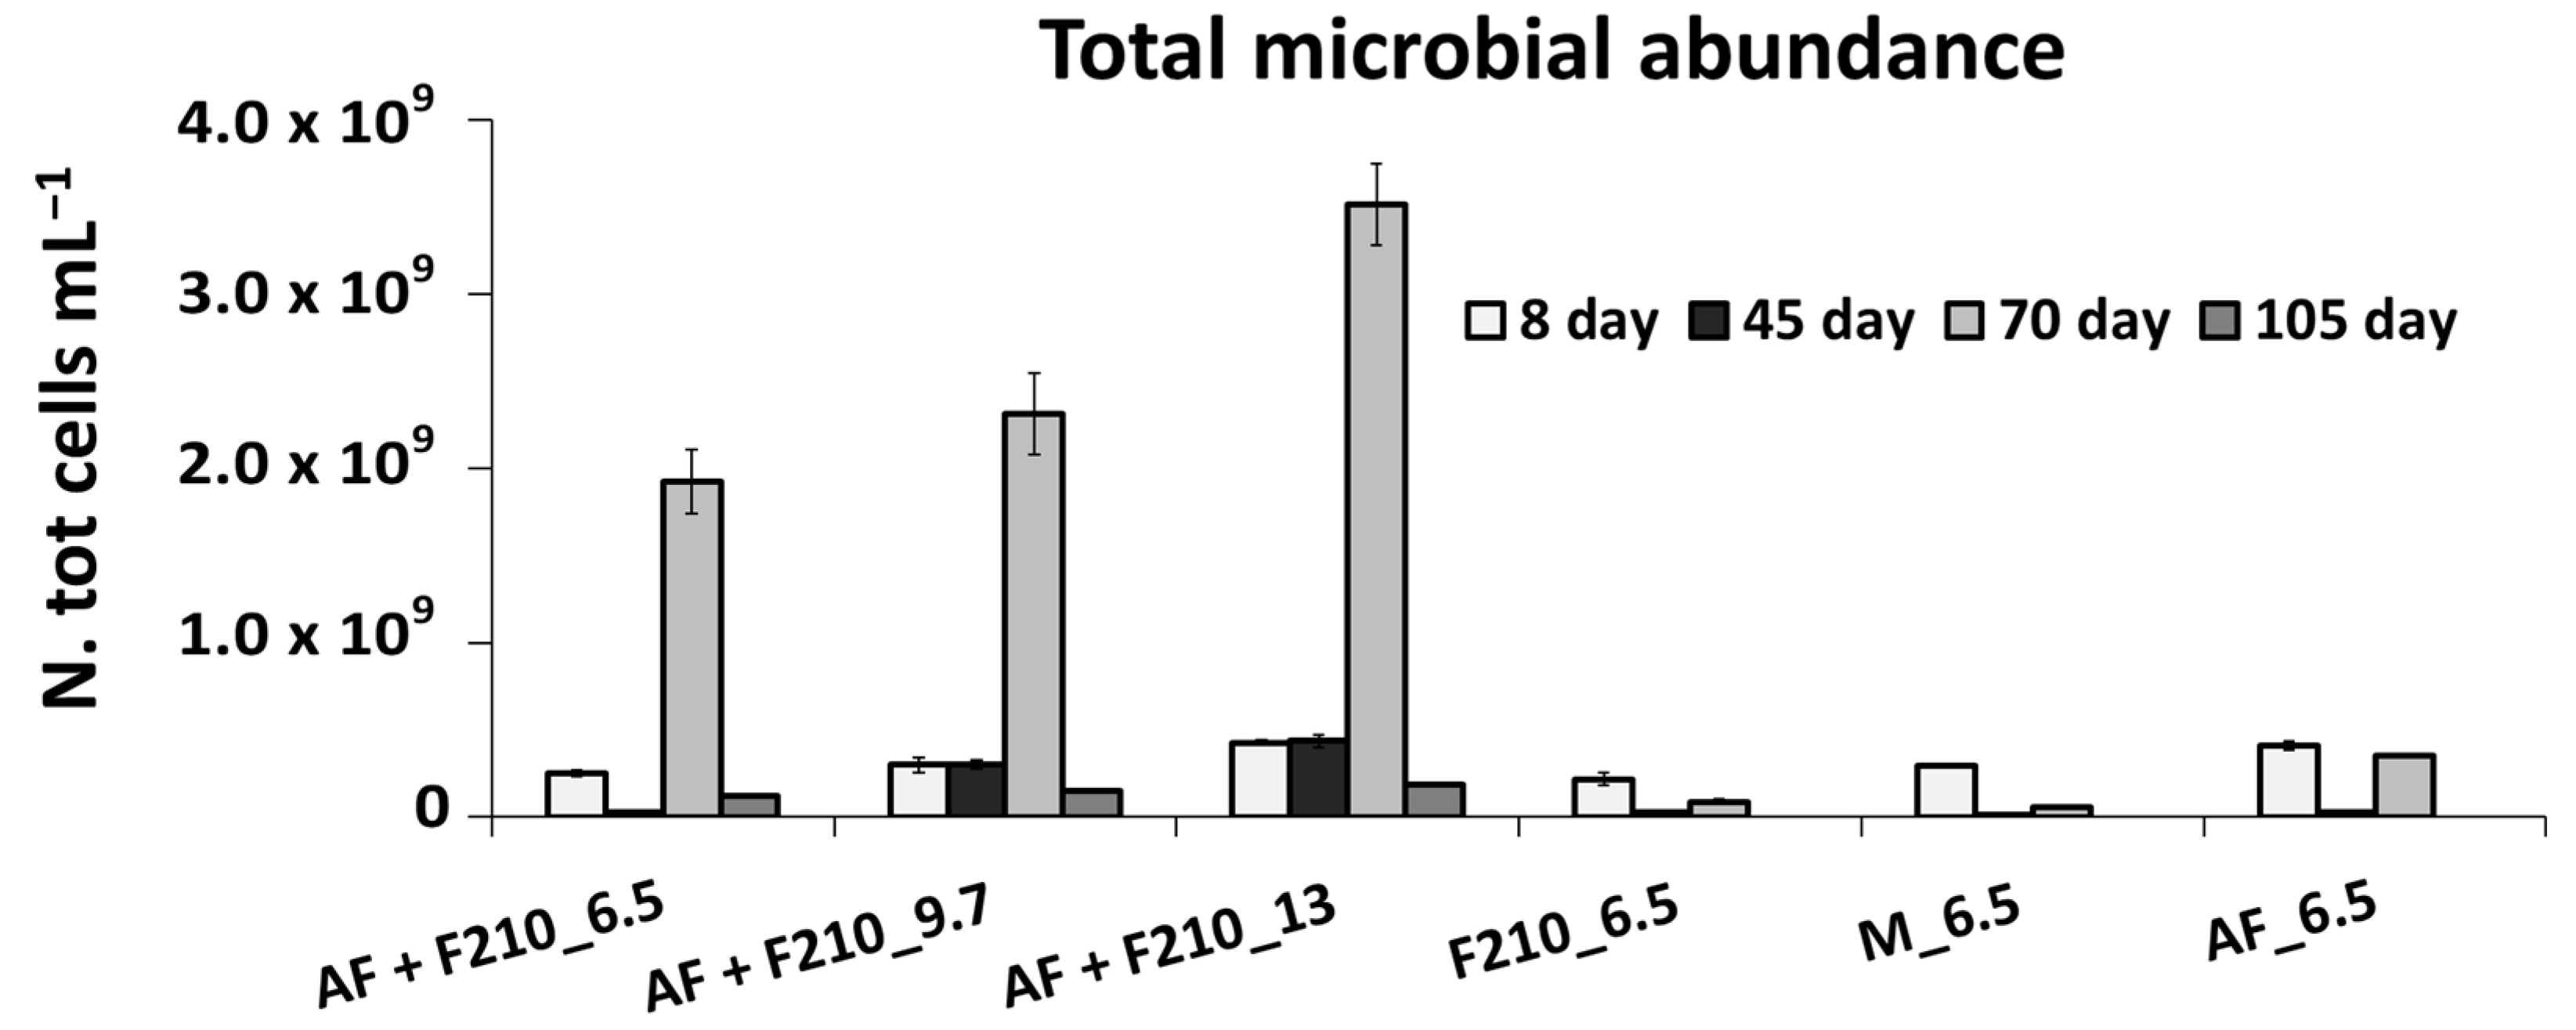
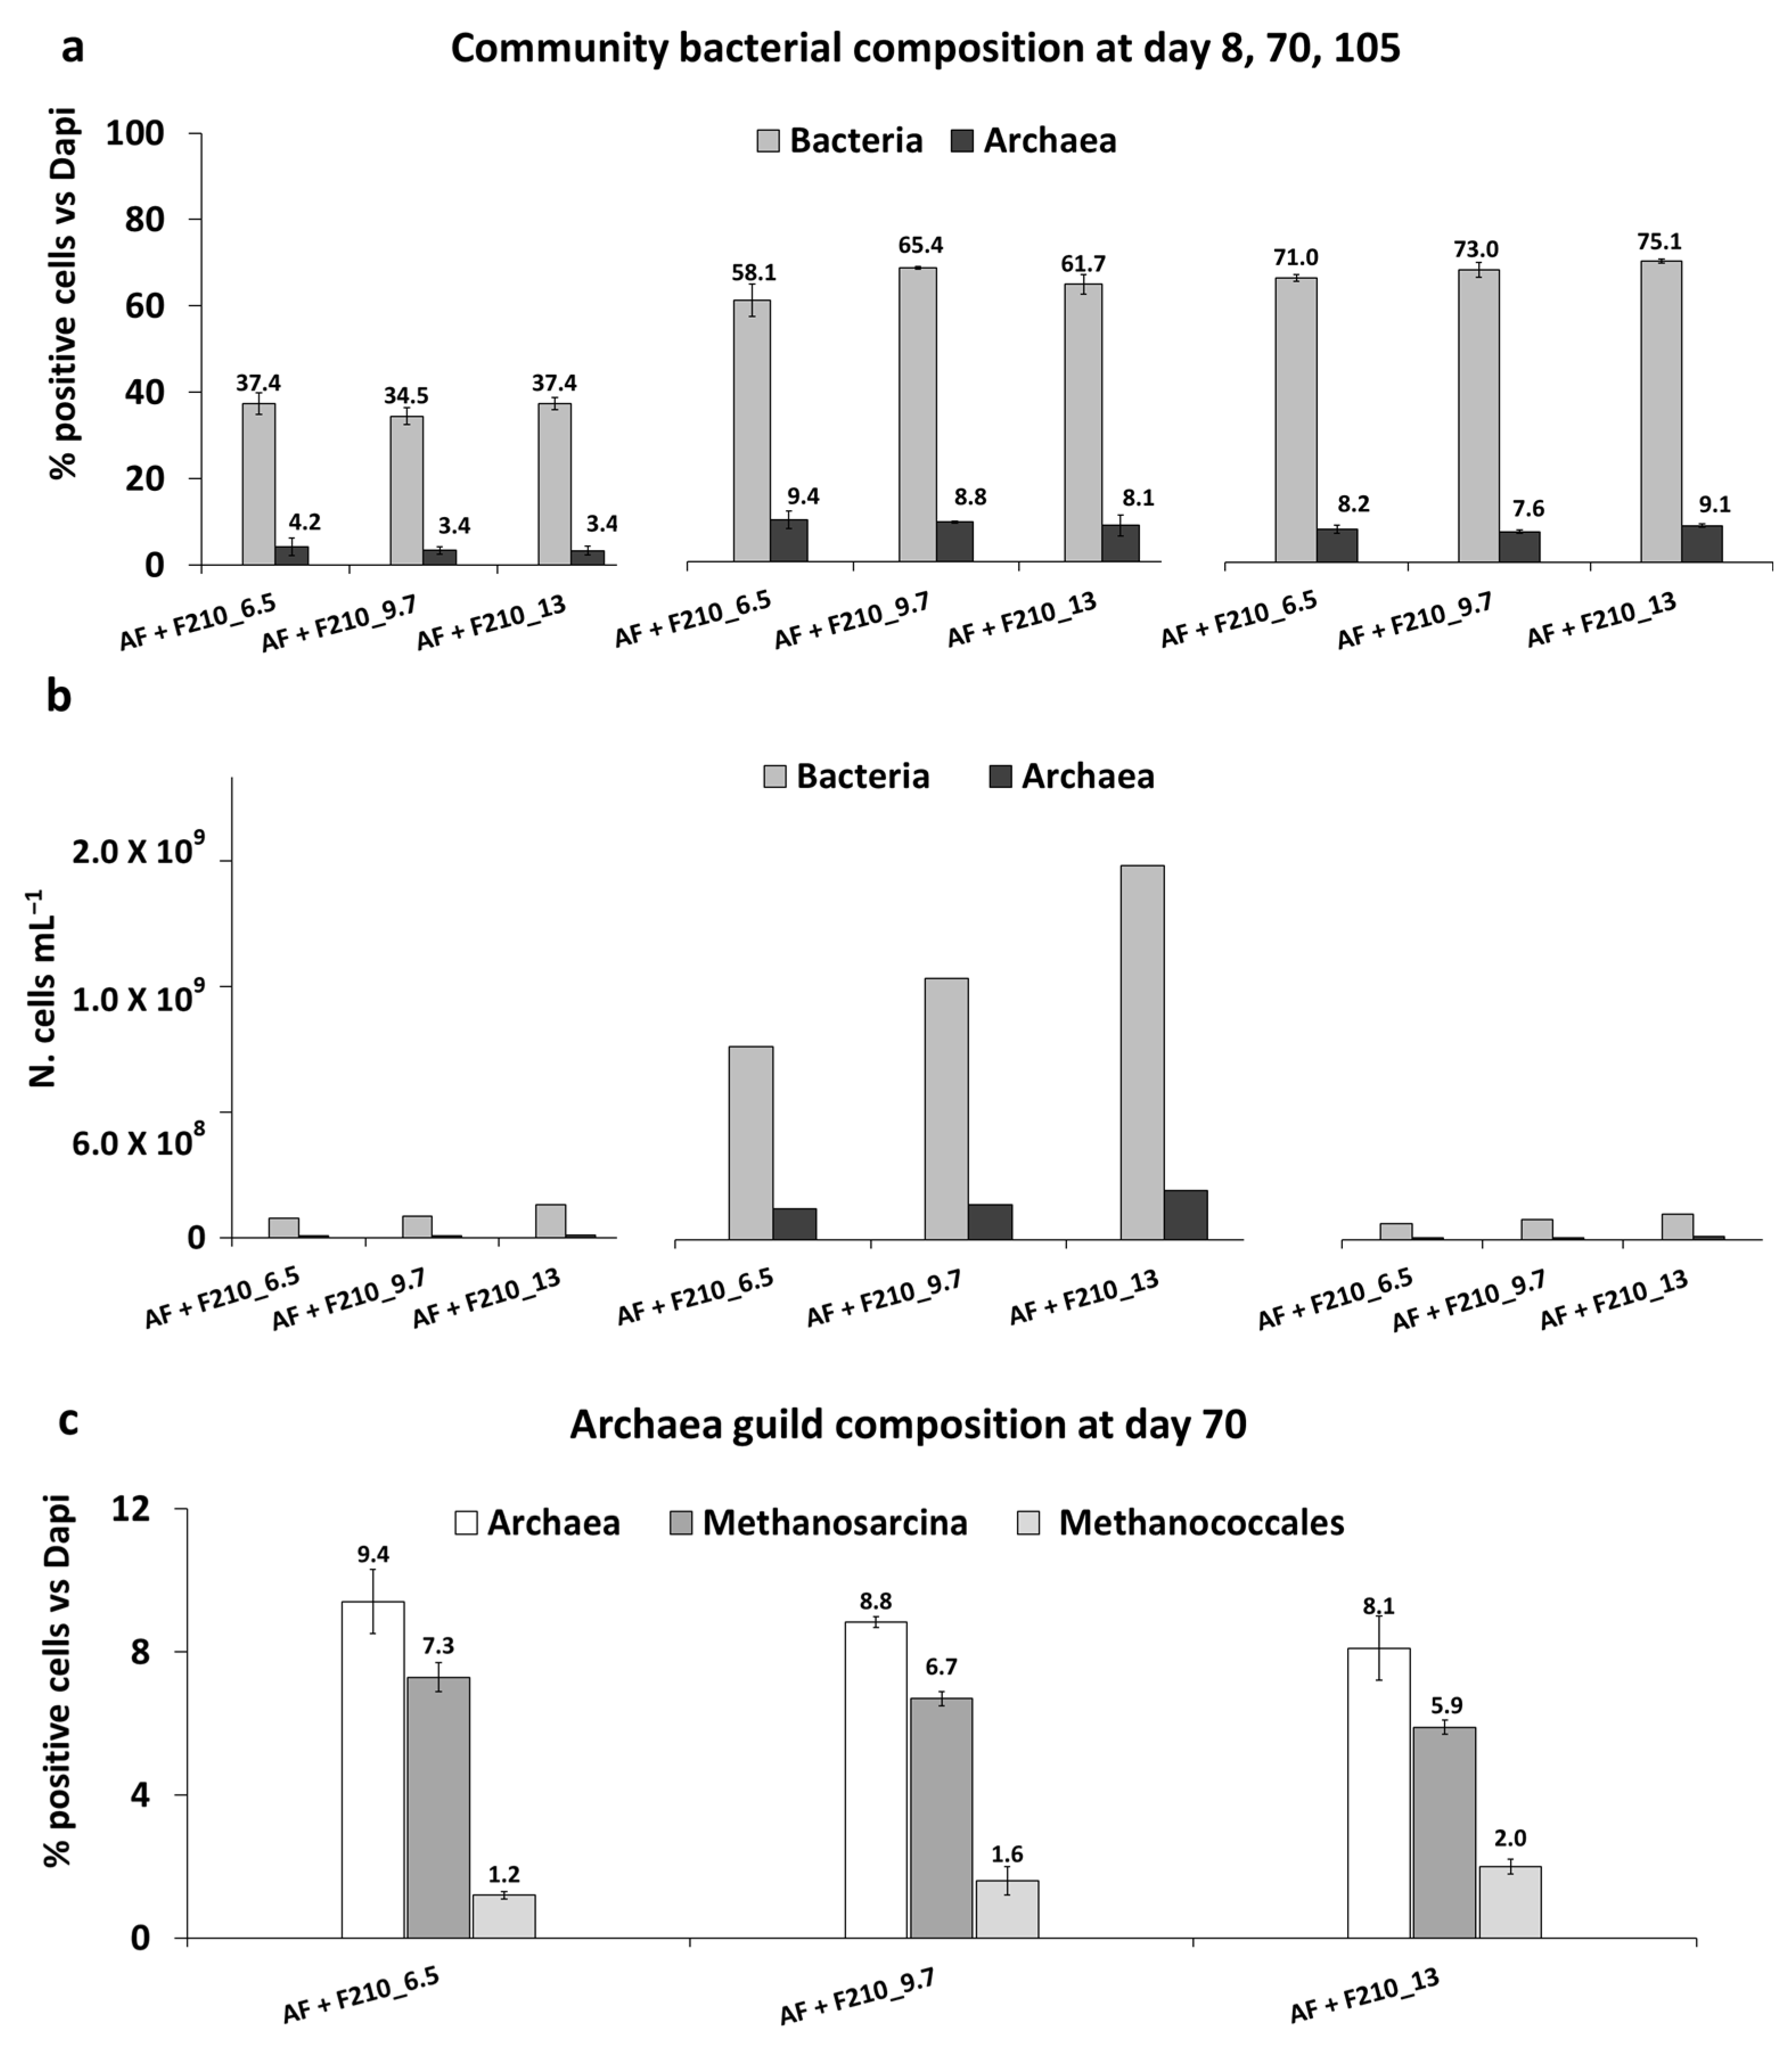
3.4. Microbiological Analysis

Microbial abundance was determined for all experimental tests at days, 8, 45, and 70, corresponding to the most significant times in terms of CH4 production, i.e., the initial phase of the experiment, the beginning of the exponential phase of CH4 production, and the moment of most intense CH4 production, respectively. For the tests with combined bioaugmentation, the values at day 105 are also reported, corresponding to the end of CH4 production. In the other tests, the microbial abundance values did not provide relevant results.
The highest values of microbial abundance were obtained for the combined bioaugmentation tests on day 70 (Figure 3), in line with the most intense CH4 production (Figure 1c); in contrast, on day 105, when no more CH4 was produced, cell abundance values decreased sharply, even when compared to the initial phase of the experiment (day 8).
The greater efficiency in SPW utilization by the microbial community in the combined bioaugmentation tests compared to the other experimental conditions is highlighted by the increase in microbial abundance in line with both the increase in supplied SPW and the cumulative methane production (Figure 1a). In the other tests, no significant increases in microbial abundance were observed, including in the F210 test. This last aspect remains to be clarified.
The results of the FISH analysis of the combined bioaugmentation tests at days 8, 70, and 105 are shown in Figure 4. An attempt was also made to detect AF zoospores using the GM5 experimental FISH probe [53], not yet inscribed in the ProbeBase (https://probebase.csb.univie.ac.at/ (accessed on 6 April 2023)). Unfortunately, no results were obtained. On the other hand, the batch configuration of the process used in this experiment suggests that the AFs should have played their role predominantly in the first experimental phase, i.e., in the preparatory phase for the exponential production of CH4 (last phase of the AD process).
During the experiment, shifts in microbial community composition were observed. At day 8, the relative abundances of Bacteria and Archaea comprised between 34 and 37% and between 3.4 and 4.2%, respectively (Figure 4a). These values were lower than those obtained by analyzing the microbial community in the digestate used as the methanogenic inoculum of the experiment; indeed, the latter, analyzed at the start of the experiment, showed a composition of 54.4% in Bacteria and 4.9% in Archaea. Furthermore, in the F210 inoculum, the fraction of Bacteria detected in relation to DAPI was 78.9%. These results confirm those reported by Demirel et al. [54], i.e., that after the experimental start of the AD process, the microbial community used as the inoculum needs some time to readapt to the upheaval caused by the experimental handling. At day 70, which is the time of most intense CH4 production, the fractions of microorganisms belonging to the Bacteria and Archaea domains increased in all the tests with relative abundance values almost double for Bacteria and more than double for Archaea, compared to day 8 (Figure 4a). These results are in line with the increased CH4 production observed in bioaugmented tests, considering that the enhancement of the initial hydrolytic phase of AD can accelerate the kinetics of acidogenic bacteria and subsequently Archaea. By day 105, a further increase in the fraction of Bacteria was detected. By contrast, a decrease in the general ratio of Bacteria/Archaea in the day 70 samples was detected in all cases compared to the initial (day 8) and final (day 105) phases of the experiment. Methanogenic Archaea are responsible for the final and determinant phase in the AD process [55], so that the relative increase in the microbial community was in line with the most intense production of CH4 observed at day 70.
Furthermore, at day 70, the total microbial abundance values for both Bacteria and Archaea (Figure 4b) were higher than at the beginning of the experiment (day 8) and at the end of CH4 production (day 105) by at least an order of magnitude; the cell abundance of both Bacteria and Archaea increased in accordance with increasing SPW concentration, so that the highest abundance values were found for the AF + F210_13.0 test, corresponding to 2.17 × 10⁹ cell mL−1 and 2.85 × 10⁸ cell mL−1 for Bacteria and Archaea, respectively (Figure 4b).
Within the methanogenic Archaea guild (Figure 4c), the functional component of the acetoclastic Archaea prevailed (>65% in all cases) in line with the results of the process intermediates that showed temporary accumulation of acetic acid and a decrease in the latter, which was related to methane production (Figure 2). All the acetoclastic Archaea detected belonged to the genus Methanosarcina; in contrast, the probe used for Methanosaeta, the other known genus of acetoclastic Archaea, did not provide positive FISH signals. Methanosarcina are recognized to be generalists in the use of acetate [56,57] as they can use other types of substrate besides acetic acid such as H2/CO2 and methyl compounds. The predominance of Methanosarcina, considered to rely overall on an ecological r strategy, with high grow rates and tolerance to stress [55] compared to other methanogens, fits well with the high concentrations of acetic acid detected [10,58]. A fraction of hydrogenotrophs was also detected in the Methanogenic guild, although related only to Methanococcales and with concentrations never exceeding 2%. Their relative abundance increased with the quantity of SPW supplied; conversely, Methanosarcina showed a decrease in conjunction with an increase in SPW, although they still predominated in the Archaea guild. Methanobacteriales and Methanomicrobiales were not detected.

4. Conclusions

This study showed that SPW is a substrate that can be successfully exploited for bioenergy production. Bioaugmentation has proven to be a valid strategy for improving CH4 production from SPW, both in terms of cumulative CH4 production and its content in the biogas. Single or combined bioaugmentation tests provided better CH4 productions than the unaugmented one, excluding the condition where only AF was used, highlighting the pivotal role of the fermenting microbial pool F210. Its presence is essential to obtain a metabolically balanced microbial community. Microbiological investigations showed that the best CH4 productions, both cumulatively at the end of the experiment and daily productions, were in line with the highest total microbial abundances detected. Furthermore, in tests with higher SPW concentrations, the total microbial abundances and those of the Bacteria and Archaea components increased.

Author Contributions

Conceptualization, G.M. and V.M.M.; methodology, G.M.; software, A.G.; validation, G.M., V.M.M. and A.G.; formal analysis, A.G.; investigation, G.M, V.M.M. and A.G.; resources, G.M.; data curation, G.M.; writing—original draft preparation, G.M. and V.M.M.; writing—review and editing, G.M. and V.M.M.; visualization, A.M. and A.S.; supervision, G.M.; project administration, G.M.; funding acquisition, G.M. All authors have read and agreed to the published version of the manuscript.

Funding

This Project “Development of systems for generating electricity from biomass and upgrading biofuels” Research for Electric System MSE/ENEA) funded by the Italian Ministry of Economic Development.

Institutional Review Board Statement

Not applicable.

Informed Consent Statement

Not applicable.

Data Availability Statement

Not applicable.

Conflicts of Interest

The authors declare no conflict of interest.

References

  1. FAO. Brief to the State of World Fisheries and Aquaculture; FAO, Fisheries and Aquaculture Department: Rome, Italy, 2022; ISBN 9789251363645. [Google Scholar]
  2. Mathew, G.M.; Mathew, D.C.; Sukumaran, R.K.; Sindhu, R.; Huang, C.C.; Binod, P.; Sirohi, R.; Kim, S.H.; Pandey, A. Sustainable and eco-friendly strategies for shrimp shell valorization. Environ. Pollut. 2020, 267, 115656. [Google Scholar] [CrossRef] [PubMed]
  3. Kandra, P.; Challa, M.M.; Kalangi Padma Jyothi, H. Efficient use of shrimp waste: Present and future trends. Appl. Microbiol. Biotechnol. 2012, 93, 17–29. [Google Scholar] [PubMed]
  4. FAO. Increased Production of Farmed Shrimp Leads to Improved International Trade. GLOBEFISH-Analysis Andinformation on World Fish Trade. 2017. Available online: https://www.fao.org/in-action/globefish/market-reports/resource-detail/en/c/989543/ (accessed on 5 April 2023).
  5. Mao, X.; Guo, N.; Sun, J.; Xue, C. Comprehensive utilization of shrimp waste based on biotechnological methods: A review. J. Clean. Prod. 2017, 143, 814–823. [Google Scholar]
  6. Suryawanshi, N.; Jujjavarapu, S.E.; Ayothiraman, S. Marine shell industrial wastes–an abundant source of chitin and its derivatives: Constituents, pretreatment, fermentation, and pleiotropic applications-a revisit. Int. J. Environ. Sci. Technol. 2019, 16, 3877–3898. [Google Scholar]
  7. Nirmal, N.P.; Santivarangkna, C.; Rajput, M.S.; Benjakul, S. Trends in shrimp processing waste utilization: An industrial prospective. Trends Food Sci. Technol. 2020, 103, 20–35. [Google Scholar]
  8. Ali, G.; Sharma, M.; Salama, E.S.; Ling, Z.; Li, X. Applications of chitin and chitosan as natural biopolymer: Potential sources, pretreatments, and degradation pathways. Biomass Convers. Biorefinery 2022, 1–15. [Google Scholar] [CrossRef]
  9. Digman, B.; Kim, D.-S. Alternative energy from food processing wastes. Environ. Prog. 2008, 27, 524–537. [Google Scholar]
  10. Xu, F.; Li, Y.; Ge, X.; Yang, L.; Li, Y. Anaerobic digestion of food waste—Challenges and opportunities. Bioresour. Technol. 2018, 247, 1047–1058. [Google Scholar] [CrossRef]
  11. Dollhofer, V.; Podmirseg, S.M.; Callaghan, T.M.; Griffith, G.W.; Fliegerová, K. Anaerobic fungi and their potential for biogas production. In Biogas Science and Technology; Springer: Cham, Switzerland, 2015; pp. 41–61. ISBN 9783319219936. [Google Scholar]
  12. Young, D.; Dollhofer, V.; Callaghan, T.M.; Reitberger, S.; Lebuhn, M.; Benz, J.P. Isolation, identification and characterization of lignocellulolytic aerobic and anaerobic fungi in one- and two-phase biogas plants. Bioresour. Technol. 2018, 268, 470–479. [Google Scholar] [CrossRef]
  13. Cheng, Y.; Shi, Q.; Sun, R.; Liang, D.; Li, Y.; Li, Y.; Jin, W.; Zhu, W. The biotechnological potential of anaerobic fungi on fiber degradation and methane production. World J. Microbiol. Biotechnol. 2018, 34, 1–8. [Google Scholar] [CrossRef]
  14. Lembo, G.; Rosa, S.; Miritana, V.M.; Marone, A.; Massini, G.; Fenice, M.; Signorini, A. Thermophilic anaerobic digestion of second cheese whey: Microbial community response to H2 addition in a partially immobilized anaerobic hybrid reactor. Processes 2021, 9, 43. [Google Scholar] [CrossRef]
  15. Atelge, M.R.; Krisa, D.; Kumar, G.; Eskicioglu, C.; Nguyen, D.D.; Chang, S.W.; Atabani, A.E.; Al-Muhtaseb, A.H.; Unalan, S. Biogas Production from Organic Waste: Recent Progress and Perspectives. Waste Biomass Valorization 2020, 11, 1019–1040. [Google Scholar] [CrossRef]
  16. Ellacuriaga, M.; García-Cascallana, J.; Gómez, X. Biogas Production from Organic Wastes: Integrating Concepts of Circular Economy. Fuels 2021, 2, 144–167. [Google Scholar] [CrossRef]
  17. Kundu, D.; Dutta, D.; Samanta, P.; Dey, S.; Sherpa, K.C.; Kumar, S.; Dubey, B.K. Valorization of wastewater: A paradigm shift towards circular bioeconomy and sustainability. Sci. Total Environ. 2022, 848, 157709. [Google Scholar] [CrossRef]
  18. Ivanovs, K.; Spalvins, K.; Blumberga, D. Approach for modelling anaerobic digestion processes of fish waste. Energy Procedia 2018, 147, 390–396. [Google Scholar] [CrossRef]
  19. Choe, U.; Mustafa, A.M.; Lin, H.; Xu, J.; Sheng, K. Effect of bamboo hydrochar on anaerobic digestion of fish processing waste for biogas production. Bioresour. Technol. 2019, 283, 340–349. [Google Scholar] [CrossRef]
  20. Chairattanawat, C.; Yulisa, A.; Hwang, S. Effect of fish waste augmentation on anaerobic co-digestion of sludge with food waste. Bioresour. Technol. 2022, 361, 127731. [Google Scholar] [CrossRef] [PubMed]
  21. Ferdeș, M.; Zăbavă, B.Ș.; Paraschiv, G.; Ionescu, M.; Dincă, M.N.; Moiceanu, G. Food Waste Management for Biogas Production in the Context of Sustainable Development. Energies 2022, 15, 6268. [Google Scholar] [CrossRef]
  22. Zappi, M.E.; Revellame, E.; Fortela, D.L.; Hernandez, R.; Gang, D.; Holmes, W.; Sharp, W.; Picou-Mikolajczyk, A.; Nigam, K.D.P.; Bajpai, R. Evaluation of the Potential to Produce Biogas and Other Energetic Coproducts Using Anaerobic Digestion of Wastewater Generated at Shrimp Processing Operations. Ind. Eng. Chem. Res. 2019, 58, 15930–15944. [Google Scholar] [CrossRef]
  23. European Commission. Direttiva (UE) 2018/2001 del Parlamento Europeo e del Consiglio, dell’11 Dicembre 2018, Sulla Promozione Dell’uso Dell’energia da Fonti Rinnovabili (Rifusione) (Testo Rilevante ai fini del SEE)2018/2001 del Parlamento Europeo e del Consiglio 2018. 2022. Available online: http://data.europa.eu/eli/dir/2018/2001/oj (accessed on 1 April 2023).
  24. Coppola, D.; Lauritano, C.; Esposito, F.P.; Riccio, G.; Rizzo, C.; de Pascale, D. Fish Waste: From Problem to Valuable Resource. Mar. Drugs 2021, 19, 116. [Google Scholar] [CrossRef]
  25. Caruso, G.; Floris, R.; Serangeli, C.; Di Paola, L. Fishery Wastes as a Yet Undiscovered Treasure from the Sea: Biomolecules Sources, Extraction Methods and Valorization. Mar. Drugs 2020, 18, 622. [Google Scholar] [CrossRef] [PubMed]
  26. De Boer, W.; Gerards, S.; Klein Gunnewiek, P.J.A.; Modderman, R. Response of the chitinolytic microbial community to chitin amendments of dune soils. Biol. Fertil. Soils 1999, 29, 170–177. [Google Scholar] [CrossRef]
  27. Ghosh, S.; Chowdhury, R.; Bhattacharya, P. Mixed consortia in bioprocesses: Role of microbial interactions. Appl. Microbiol. Biotechnol. 2016, 100, 4283–4295. [Google Scholar] [CrossRef] [PubMed]
  28. Gorrasi, S.; Izzo, G.; Massini, G.; Signorini, A.; Barghini, P.; Fenice, M. From polluting seafood wastes to energy. production of hydrogen and methane from raw chitin material by a two-phase process. J. Environ. Prot. Ecol. 2014, 15, 526–536. [Google Scholar]
  29. Izzo, G.; Rosa, S.; Massing, G.; Patriarca, C.; Fenice, M.; Fiocchetti, F.; Marone, A.; Varrone, C.; Signorini, A. From hypertrophic lagoons to bioenergy production. J. Environ. Prot. Ecol. 2014, 15, 537–546. [Google Scholar]
  30. Di Bonito, R.; Marone, A.; Massini, G.; Patriarca, C.; Rosa, S.; Signorini, A.; Varrone, C.; Viola, C.; Izzo, G. Characterization by length heterogeneity (LH)-PCR of a hydrogen-producing community obtained in dark fermentation using coastal lake sediment as an inoculum. Energy. Sustain. Soc. 2013, 3, 3. [Google Scholar] [CrossRef]
  31. Ferraro, A.; Dottorini, G.; Massini, G.; Mazzurco Miritana, V.; Signorini, A.; Lembo, G.; Fabbricino, M. Combined bioaugmentation with anaerobic ruminal fungi and fermentative bacteria to enhance biogas production from wheat straw and mushroom spent straw. Bioresour. Technol. 2018, 260, 364–373. [Google Scholar] [CrossRef]
  32. Marone, A.; Varrone, C.; Fiocchetti, F.; Giussani, B.; Izzo, G.; Mentuccia, L.; Rosa, S.; Signorini, A. Optimization of substrate composition for biohydrogen production from buffalo slurry co-fermented with cheese whey and crude glycerol, using microbial mixed culture. Int. J. Hydrogen Energy 2015, 40, 209–218. [Google Scholar] [CrossRef]
  33. Ferraro, A.; Massini, G.; Mazzurco Miritana, V.; Rosa, S.; Signorini, A.; Fabbricino, M. A novel enrichment approach for anaerobic digestion of lignocellulosic biomass: Process performance enhancement through an inoculum habitat selection. Bioresour. Technol. 2020, 313, 123703. [Google Scholar] [CrossRef]
  34. American Public Health Association. Standard Methods for the Examination of Water and Wastewater, 9th ed.; American Public Health Association: Washington, DC, USA, 1995. [Google Scholar]
  35. Miller, T.L.; Wolin, M.J. Formation of hydrogen and formate by Ruminococcus albus. J. Bacteriol. 1973, 116, 836–846. [Google Scholar] [CrossRef]
  36. Martínez-Sibaja, A.; Alvarado-Lassman, A.; Astorga-Zaragoza, C.M.; Adam-Medina, M.; Posada-Gómez, R.; Rodríguez-Jarquin, J.P. Volumetric gas meter for laboratory-scale anaerobic bioreactors. Meas. J. Int. Meas. Confed. 2011, 44, 1801–1805. [Google Scholar] [CrossRef]
  37. Logan, B.E.; Oh, S.E.; Kim, I.S.; Van Ginkel, S. Biological hydrogen production measured in batch anaerobic respirometers. Environ. Sci. Technol. 2002, 36, 2530–2535. [Google Scholar] [CrossRef] [PubMed]
  38. Pernthaler, J.; Glöckner, F.O.; Schönhuber, W.; Amann, R. Fluorescence in situ hybridization with rRNA-targeted oligonucleotide probes. Methods Microbiol. 2001, 30, 207–226. [Google Scholar] [CrossRef]
  39. Amann, R.I.; Ludwig, W.; Schleifer, K.H. Phylogenetic identification and in situ detection of individual microbial cells without cultivation. Microbiol. Rev. 1995, 59, 143–169. [Google Scholar] [CrossRef]
  40. Barra Caracciolo, A.; Giuliano, G.; Grenni, P.; Cremisini, C.; Ciccoli, R.; Ubaldi, C. Effect of urea on degradation of terbuthylazine in soil. Environ. Toxicol. Chem. 2005, 24, 1035–1040. [Google Scholar] [CrossRef] [PubMed]
  41. Barra Caracciolo, A.; Grenni, P.; Cupo, C.; Rossetti, S. In situ analysis of native microbial communities in complex samples with high particulate loads. FEMS Microbiol. Lett. 2005, 253, 55–58. [Google Scholar] [CrossRef] [PubMed]
  42. Greuter, D.; Loy, A.; Horn, M.; Rattei, T. ProbeBase-an online resource for rRNA-targeted oligonucleotide probes and primers: New features 2016. Nucleic Acids Res. 2016, 44, D586–D589. [Google Scholar] [CrossRef]
  43. Ali, G.; Ling, Z.; Saif, I.; Usman, M.; Jalalah, M.; Harraz, F.A.; Al-Assiri, M.S.; Salama, E.S.; Li, X. Biomethanation and microbial community response during agricultural biomass and shrimp chaff digestion. Environ. Pollut. 2021, 278, 116801. [Google Scholar] [CrossRef]
  44. Haitjema, C.H.; Solomon, K.V.; Henske, J.K.; Theodorou, M.K.; O’Malley, M.A. Anaerobic gut fungi: Advances in isolation, culture, and cellulolytic enzyme discovery for biofuel production. Biotechnol. Bioeng. 2014, 111, 1471–1482. [Google Scholar] [CrossRef]
  45. Theuerl, S.; Kohrs, F.; Benndorf, D.; Maus, I.; Wibberg, D.; Schlüter, A.; Kausmann, R.; Heiermann, M.; Rapp, E.; Reichl, U.; et al. Community shifts in a well-operating agricultural biogas plant: How process variations are handled by the microbiome. Appl. Microbiol. Biotechnol. 2015, 99, 7791–7803. [Google Scholar] [CrossRef]
  46. Nkemka, V.N.; Gilroyed, B.; Yanke, J.; Gruninger, R.; Vedres, D.; McAllister, T.; Hao, X. Bioaugmentation with an anaerobic fungus in a two-stage process for biohydrogen and biogas production using corn silage and cattail. Bioresour. Technol. 2015, 185, 79–88. [Google Scholar] [CrossRef] [PubMed]
  47. Adnan, A.I.; Ong, M.Y.; Nomanbhay, S.; Chew, K.W.; Show, P.L. Technologies for biogas upgrading to biomethane: A review. Bioengineering 2019, 6, 92. [Google Scholar] [CrossRef] [PubMed]
  48. Jensen, M.B.; Jensen, B.; Ottosen, L.D.M.; Kofoed, M.V.W. Integrating H2 injection and reactor mixing for low-cost H2 gas-liquid mass transfer in full-scale in situ biomethanation. Biochem. Eng. J. 2021, 166, 107869. [Google Scholar] [CrossRef]
  49. O’Flaherty, V.; Collins, G.; Mahony, T. The microbiology and biochemistry of anaerobic bioreactors with relevance to domestic sewage treatment. Rev. Environ. Sci. Biotechnol. 2006, 5, 39–55. [Google Scholar] [CrossRef]
  50. Krakat, N.; Westphal, A.; Schmidt, S.; Scherer, P. Anaerobic digestion of renewable biomass: Thermophilic temperature governs methanogen population dynamics. Appl. Environ. Microbiol. 2010, 76, 1842–1850. [Google Scholar] [CrossRef]
  51. Čater, M.; Zorec, M.; Marinšek Logar, R. Methods for Improving Anaerobic Lignocellulosic Substrates Degradation for Enhanced Biogas Production. Springer Sci. Rev. 2014, 2, 51–61. [Google Scholar] [CrossRef]
  52. Ali Shah, F.; Mahmood, Q.; Maroof Shah, M.; Pervez, A.; Ahmad Asad, S. Microbial ecology of anaerobic digesters: The key players of anaerobiosis. Sci. World J. 2014, 2014, 183752. [Google Scholar] [CrossRef]
  53. Brookman, J.L.; Mennim, G.; Trinci, A.P.J.; Theodorou, M.K.; Tuckwell, D.S. Identification and characterization of anaerobic gut fungi using molecular methodologies based on ribosomal ITS1 and 18S rRNA. Microbiology 2000, 146, 393–403. [Google Scholar] [CrossRef]
  54. Demirel, B.; Yenigün, O. Changes in microbial ecology in an anaerobic reactor. Bioresour. Technol. 2006, 97, 1201–1208. [Google Scholar] [CrossRef]
  55. De Vrieze, J.; Hennebel, T.; Boon, N.; Verstraete, W. Methanosarcina: The rediscovered methanogen for heavy duty biomethanation. Bioresour. Technol. 2012, 112, 1–9. [Google Scholar] [CrossRef]
  56. Smith, K.S.; Ingram-Smith, C. Methanosaeta, the forgotten methanogen? Trends Microbiol. 2007, 15, 150–155. [Google Scholar] [CrossRef] [PubMed]
  57. Liu, Y.; Whitman, W.B. Metabolic, phylogenetic, and ecological diversity of the methanogenic archaea. Ann. N. Y. Acad. Sci. 2008, 1125, 171–189. [Google Scholar] [CrossRef] [PubMed]
  58. Wang, P.; Wang, H.; Qiu, Y.; Ren, L.; Jiang, B. Microbial characteristics in anaerobic digestion process of food waste for methane production–A review. Bioresour. Technol. 2018, 248, 29–36. [Google Scholar] [CrossRef] [PubMed]
Figure 1. (a) Cumulative CH4 production in all experimental tests (SD, values are also shown); (b) methane content in the biogas; (c) daily production of CH4 (mL L−1). In (b,c) SD, values are less than 10%.
Fermentation 09 00401 g001
Figure 2. Organic acid concentration for combined bioaugmented tests at three SPW concentrations, i.e., AF + F210_6.5, AF + F210_9.7, and AF + F210_13 (left column) and single bioaugmentation and un-augmented tests F210, M, AF (right column).
Fermentation 09 00401 g002
Figure 3. Total microbial abundance (N. tot cells mL−1) determined by direct count after DAPI staining for all the experimental tests at days 8, 45, and 70 (white, black, and light grey bars, respectively). In addition, for all combined bioaugmented tests, i.e., AF + F210_6.5, AF + F210_9.7, and AF + F210_13, the total microbial abundance at day 105 was also determined (dark grey bar).
Fermentation 09 00401 g003
Figure 4. (a) Relative microbial community composition at day 8 (left), 70 (center), and 105 (right); (b) community composition in terms of Bacteria and Archaea abundance in the combined bioaugmented tests at day 8 (left), 70 (center), and 105 (right); values were calculated using the microbial relative abundance and the total microbial abundance; (c) relative guild composition of methanogens at day 70; only Methanosarcina (grey bars) and Methanococcales (light grey bars) were detected and are reported. Relative abundance of Archaea in the microbial community is also reported (white bars). The standard deviations of the mean percentage values calculated for each sample over three replicates are shown.
Fermentation 09 00401 g004
Table 1. Characterization of the SPW used as substrate in the AD experiment. SD values are also reported.
Total solid (gL−1)87.7 ± 0.7
Volatile Solid (gL−1)53.5 ± 0.8
Organic Carbon (%)27.3 ± 3.0
Total nitrogen (%)6.6 ± 0.7
Table 2. Framework of the experimental plan. A base concentration of SPW of 6.5 gVS L−1 was used. Moreover, the substrate concentration of the bioaugmented tests was increased by half and double the base concentration.
Microbial SourcesAcronymAFF210MSPW g L−1
Volume (%)
AF + F210 +MAF + F210_6.588206.5
AF + F210 +MAF + F210_9.788209.7
AF + F210 +MAF + F210_13882013
F210 + MF210_6.5-16206.5
MM_6.5--206.5
AF +MAF_6.516-206.5
M without SPWI--20-
Table 3. Percentage of TS and VS removed at the end of the experiment.
TS Removal (%)VS Removal (%)
SPW//
AF + F210_6.597.899.4
AF + F210_9.797.499.3
AF + F210_1397.099.0
F21097.899.5
M97.799.4
AF97.799.4
Disclaimer/Publisher’s Note: The statements, opinions and data contained in all publications are solely those of the individual author(s) and contributor(s) and not of MDPI and/or the editor(s). MDPI and/or the editor(s) disclaim responsibility for any injury to people or property resulting from any ideas, methods, instructions or products referred to in the content.

