Article

Transcriptomics-Guided Investigation of the SLCG_Lrp Regulon Provides New Insights into Its Role for Lincomycin Biosynthesis

1
Department of Chemical and Pharmaceutical Engineering, Hefei Normal University, Hefei 230601, China
2
School of Life Sciences, Institute of Physical Science and Information Technology, Anhui University, Hefei 230601, China
3
Xinyu Pharmaceutical Co., Ltd., Suzhou 234000, China
*
Author to whom correspondence should be addressed.
These authors contributed equally to this work.
Fermentation 2023, 9(4), 396; https://doi.org/10.3390/fermentation9040396
Submission received: 13 March 2023 / Revised: 10 April 2023 / Accepted: 15 April 2023 / Published: 19 April 2023
(This article belongs to the Special Issue Antibiotic Production in Streptomyces)

Abstract

:
Lincomycin industrially produced by Streptomyces lincolnensis can be adopted to treat infections caused by Gram-positive bacteria. SLCG_Lrp, a transcriptional regulator of the Lrp family, was first identified to positively regulate lincomycin biosynthesis. However, the regulatory role of SLCG_Lrp is yet to be elucidated. This study utilized RNA-seq for comparing the transcriptome profile of original-strain LCGL and the ΔSLCGL_Lrp mutant. A total of 244 genes comprising 116 downregulated and 128 upregulated genes were differentially expressed between LCGL and ΔSLCGL_Lrp. An in-depth analysis revealed that SLCG_Lrp promotes nitrate assimilation but inhibits fatty acid metabolism, as well as directly regulates five regulators participating in the modulation of multiple cellular processes. With individual inactivation of those regulatory genes in S. lincolnensis LCGL, we confirmed the FadR transcriptional regulator SLCG_2185 was obviously correlated with lincomycin production and found it to transcriptionally stimulate the lincomycin biosynthetic cluster. Furthermore, SLCG_2185 overexpression in the high-yield S. lincolnensis LA219X promoted lincomycin production by 17.8%, and SLCG_2185 being co-overexpressed with SLCG_Lrp in LA219X increased lincomycin production by 28.1% compared to LA219X. Therefore, this investigation not only provides a direction for further investigations regarding the regulation mechanism of SLCG_Lrp, but also provides a basis for guiding the further improvement of lincomycin levels.

1. Introduction

Lincomycin together with its corresponding derivatives has been extensively adopted in the form of broad-spectrum lincosamide antibiotics, which include N-methylated 4-propyl-l-proline and α-methylthiolincosaminide [1,2,3]. Typically, the lincomycin biosynthetic gene cluster (35 kb) includes 25 structural genes [4], 2 resistance genes (lmrA, lmrB), lmrC that has both regulatory and resistant features [5], and the cluster-situated regulatory gene lmbU [6]. Although the process for the lincomycin production pathway in Streptomyces lincolnensis has been widely analyzed [7], insights into the regulatory network of lincomycin biosynthesis remain relatively scarce. Since the start of the genomics era, functional investigations of antibiotic producers have improved the understanding of the regulation of secondary metabolism modulation in actinomycetes [8]. Based on transcriptomic analysis, LmbU has a global modulating effect, which helps to explain how LmbU-like proteins affect antibiotic production in actinomycetes [9]. Using the transcriptome-driven reverse-engineering strategy, we manipulated the TetR family transcriptional factor SACE_5754 together with corresponding target genes to improve the erythromycin yield [10]. Therefore, transcriptome-based target identification of transcription factors in S. lincolnensis could contribute to the understanding of lincomycin biosynthetic regulation.
Leucine-responsive regulatory protein (Lrp) is widespread in prokaryotes and involved in the regulation of multiple physiological processes in cells [11]. The Lrp family members are site-specific DNA-binding proteins consisting of an N-terminal DNA-binding domain and a C-terminal domain [11,12]. As a global regulator, Escherichia coli Lrp participates in regulating the expression of about 400 genes within E. coli, such as those associated with amino acid metabolism, transport of intracellular substances, bacterial resistance, etc. [13]. In addition to amino acid metabolism, Lrp in actinobacteria can also achieve more refined regulation of other physiological processes such as central metabolism, energy metabolism and substrate transport, etc. [14]. In recent years, studies on Lrps in actinomycetes have markedly improved understanding of the regulatory mechanisms of antibiotic biosynthesis. Regulatory factors of the Lrp family, namely, SACE_Lrp and SACE_5717, negatively regulated erythromycin production in Saccharopolyspora erythraea [15,16]. SCO3361, a SACE_Lrp homolog, regulated the actinorhodin production as well as the morphology of Streptomyces coelicolor [17]. SSP_Lrp was identified to be a negative regulator involved in spiramycin and bitespiramycin production in Streptomyces spiramyceticus [18]. SCAB_Lrp is an Lrp regulatory protein that controls the secondary metabolism, sporulation, and pathogenicity of Streptomyces scabies [19]. In S. lincolnensis, we first identified SLCG_Lrp, a transcriptional regulator of the Lrp family that positively regulates lincomycin biosynthesis [20]. However, the SLCG_Lrp-mediated regulatory landscape during lincomycin biosynthesis remains unclear.
In this study, we first used the RNA-seq technique to comprehensively understand the regulatory landscape of SLCG_Lrp. In total, 244 differentially expressed genes (DEGs) in ΔSLCGL_Lrp compared with LCGL were identified and significantly enriched through gene ontology (GO) terms and KEGG pathway analyses. Based on further electrophoretic mobility shift assays (EMSAs) and quantitative real-time PCR (RT-qPCR), we can assume that SLCG_Lrp not only directly controlled the expression of those genes involved in nitrogen and fatty acid metabolisms, but also directly modulated the transcription of five regulatory genes. With individual inactivation of those regulatory genes in S. lincolnensis LCGL, we confirmed that the FadR family transcriptional regulator SLCG_2185 was obviously correlated with lincomycin production and found it to stimulate the transcription of the lincomycin biosynthetic cluster. Our findings propose an SLCG_Lrp-regulated transcriptional regulatory network of lincomycin biosynthesis within S. lincolnensis. Finally, joint engineering of SLCG_Lrp and SLCG_2185 of productive S. lincolnensis strains resulted in boosted lincomycin yield.

2. Materials and Methods

2.1. Experimental Strains, Plasmids along with Culture

Table 1 displays all the bacterial species as well as plasmids used in this study, while Supplementary Table S1 lists all the primers used. We cultivated E. coli strains in lysogeny broth (LB) agar or liquid LB medium, and appropriate antibiotics were added when necessary [21]. S. lincolnensis together with associated derivatives was cultivated within solid MGM to achieve sporulation, on solid R5 to achieve protoplast regeneration, in liquid TSBY for growth of mycelia, and in SM medium for protoplast preparation, as indicated by previous studies [16,22].

2.2. Gene Deletion and Overexpression Mutant Establishment

To construct the SLCG_2185 disruption mutant, SLCG_2185 fragments (1.8 kb) both upstream and downstream were amplified via PCR using the S. lincolnensis LCGL genome as a template with the primers 2185-P1/P2 and 2185-P3/P4 (Table S1). Then, EcoRI/XbaI (Thermo Fisher Scientific Co., Ltd., USA) and XbaI/HindIII (Thermo Fisher) were added to digest both PCR products, respectively, and those digested fragments were subjected to ligation at associated pKC1139 digestion sites to obtain pKC1139-Δ2185. By PEG-mediated protoplast transformation, pKC1139-Δ2185 was transformed into S. lincolnensis LCGL. A 600 nt DNA fragment within SLCG_2185 in LCGL was deleted through homologous chromosomal recombination and verified through PCR with 2185-P5/P6 primers (Table S1). Similarly, the mutants ΔSLCGL_2388, ΔSLCGL_3009, ΔSLCGL_3141, and ΔSLCGL_7585 were obtained.
Using LCGL as a template, the 942 bp full-length SLCG_2185 gene fragment was amplified through PCR with 2185-P7/P8 primers (Table S1). PCR products were ligated to pIB139′s NdeI/XbaI (Thermo Fisher) sites [25], followed by the introduction of the obtained pIB139-2185 into LCGL through PEG-mediated protoplast transformation. The overexpression strain LCGL/pIB139-2185 was screened for apramycin resistance, followed by PCR verification using Apr-F/R primers (Table S1). Similarly, the overexpression strains LA219X/pIB139-2185 and LA219X/pIB139-2185-Lrp were obtained.

2.3. Fermentation and Lincomycin Determination

LCGL and its derivatives were fermented according to our prior description [23]. In brief, a 1 mL aliquot of spores was added to a flask (250 mL) that contained seed medium (30 mL) under 2-day shaking at 240 rpm at 30 °C. Subsequently, 2 mL of seed medium was added in fermentation medium (30 mL), followed by 7-day incubation at 30 °C with shaking at 240 rpm. Lincomycin was extracted using 4 volumes of ethanol and quantified by a Shimadzu H-CLASS/SQD2 HPLC system using an Extend-C18 column (5-μm, 150 × 4.6 mm) at 214 nm based on a previous method [26].

2.4. RNA-Seq

LCGL and ΔSLCGL_Lrp were isolated using a TRIzol Reagent (Invitrogen)/RNeasy Mini Kit (Qiagen) and quantified by a UV spectrophotometer (DeNovix DS-11). RNA that passed the quantification test was used for library construction. For enriching mRNA, an rRNA removal kit (Vazyme) was utilized for removing rRNA. Subsequently, fragmentation buffers were added to break mRNA into small fragments. mRNA was later utilized as the template to obtain first-strand cDNA using random primers, actinomycin D, and ProtoScript II reverse transcriptase. For synthesizing double-stranded cDNA, we introduced dACG-TP/dUTP and a mix (including buffer solution, DNA polymerase I, and Rnase H). AMPure XP beads were later added to purify double-stranded cDNA, followed by repair at the terminal, attachment using an A-tail, and ligation using a Y-shape adapter together with AMPure XP beads-based selection using fragment size. Later, USER-enzyme was introduced to degrade adapter-ligated DNA at its U-containing strand. At last, PCR amplification was carried out to enrich strand-specific libraries, followed by deep sequencing onto the Illumina Hiseq 2500 platform.
Reads that contained an adapter, those containing over 10% N (undetermined base), and those with poor quality (including over 50% bases that had mass value Qpred < 5) were removed to filter the raw sequence data. Bowtie2-2.2.3 was utilized to align clean reads against the S. lincolnensis LC-G genome (GenBank ID: 1435096411) [27]. Gene levels were quantified using FPKM (fragments per kilobase of transcript sequence per million base pairs sequenced). DEGs were selected using the thresholds of FDR ≤ 0.05 and |log2(FoldChange, FC)| > 1.

2.5. RNA Extraction and RT-qPCR Analysis

We extracted RNA from fermentation cultures of LCGL together with the corresponding derivative strains cultured for a 24 h period at 30 °C using an RNA extraction and purification kit (Invitrogen) and determined the RNA content. Each RNA sample (1000 ng) was tested with a HiScript II Q RT SuperMix kit (vazyme) to obtain cDNA, and fragments of 100–200 bp were amplified using primers (Table S1). PCR procedures were conducted as previously reported [20]. The rpoD gene was the endogenous reference for sample normalization, and data were analyzed using a comparative cycle threshold approach [28].

2.6. Protein Expression and Purification

The expression and purification of SLCG_Lrp were carried out as described in a previous study [20].

2.7. Electrophoretic Mobility Shift Assays (EMSAs)

We carried out EMSAs in line with a method described earlier in [29]. The promoters of nitrogen and lipid metabolism genes as well as five regulatory genes were amplified via PCR using LCGL genomic DNA as a template with corresponding primers (Table S1). His6-labeled SLCG_Lrp at different doses and binding buffer consisting of 5 mM MgCl2, 10 mL Tris-HCl [pH 7.5], 1 mM DTT, 50 mM KCl, 1 mM EDTA, 0.1 mg/mL BSA, and 5% glycerol were added into probes in the 20 μL mixture system. These mixtures were maintained at 30 °C for 7–10 min. After incubation, samples were applied to a 5% native PAGE gel and fractionated within pre-chilled 0.5 × TBE buffer for 40–50 min at 150 V. Finally, the images were observed and stored using ultraviolet transmission [26].

2.8. Statistical Analysis

Results were represented as means ± standard deviation of mean from biological triplicates. The unpaired two-tailed Student’s t-test was applied in analyzing significance (* p < 0.05, ** p < 0.01, *** p < 0.001).

3. Results

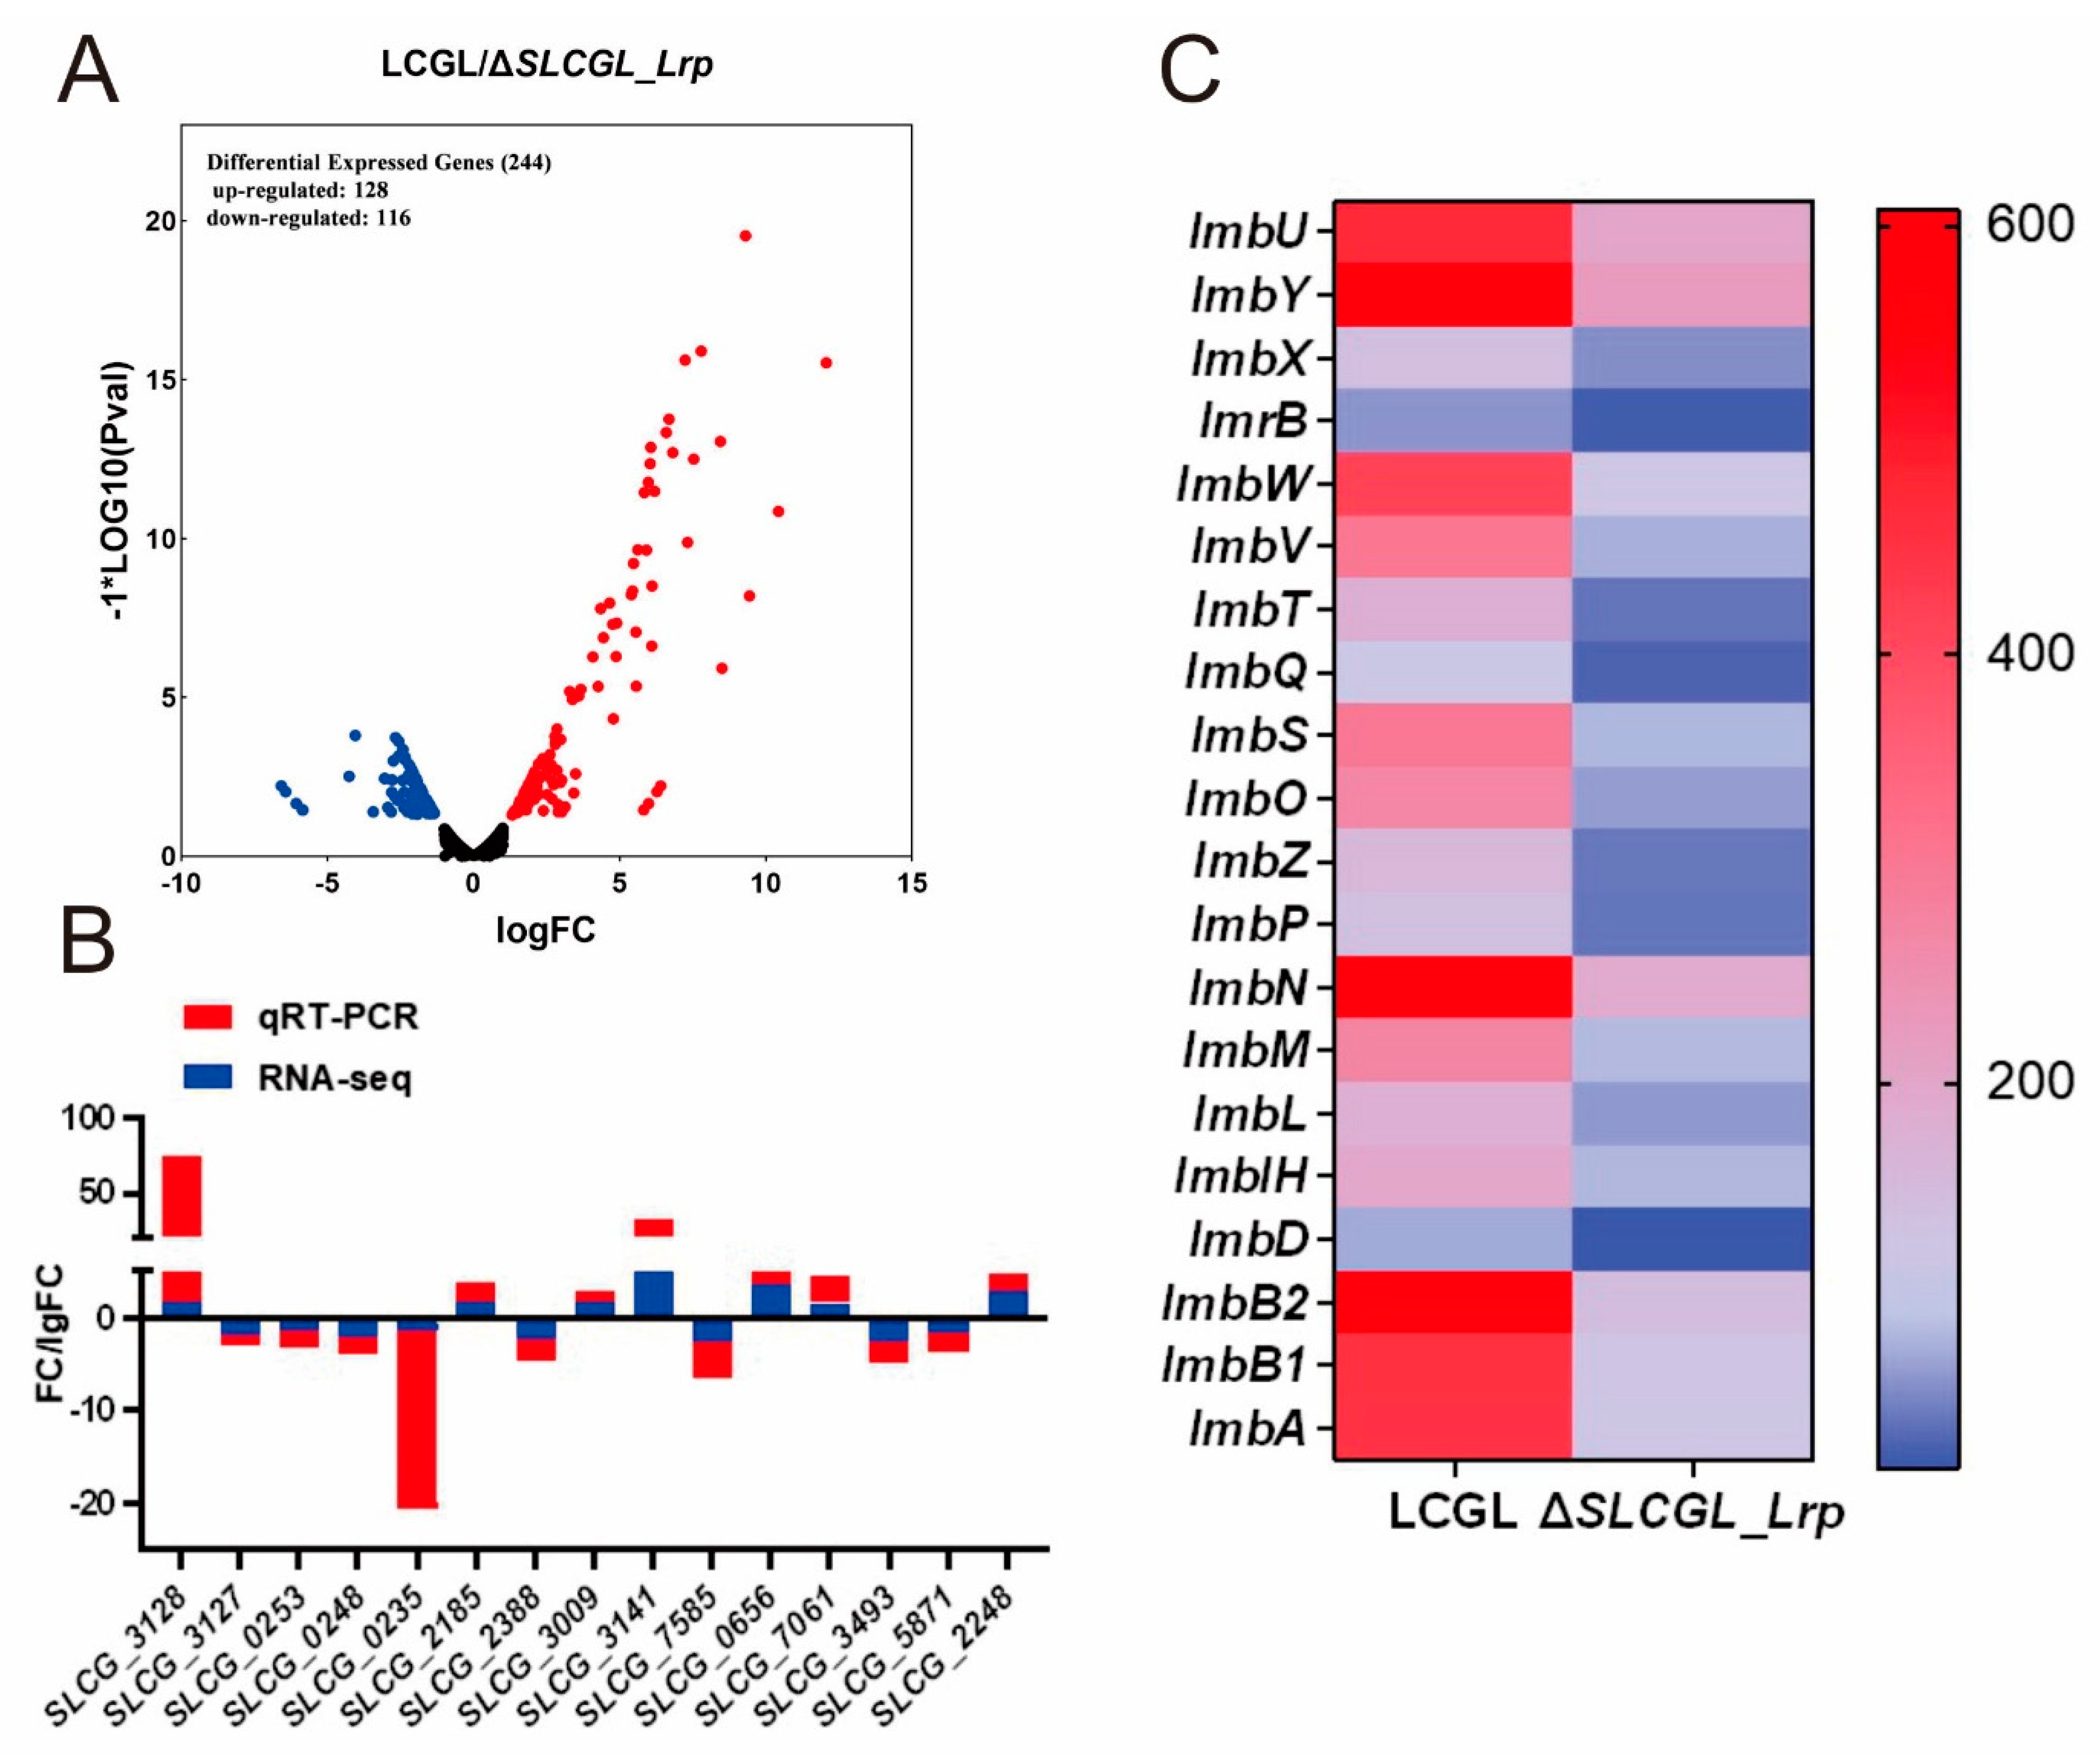
3.1. Transcriptome Analysis of LCGL and ΔSLCGL_Lrp

We used RNA-seq-based transcriptomic analysis to investigate how the deletion of SLCG_Lrp affected the transcriptome by comparing the levels of gene transcription in LCGL and ΔSLCGL_Lrp. To this aim, we collected mycelium from the LCGL and ΔSLCGL_Lrp strains in the fermentation medium at 24 h, later using these samples for RNA extraction and purification prior to RNA-seq. Raw and clean read numbers, together with Q20, Q30, and GC proportions in every library, were determined (Table S2). Altogether, 51,345,164 clean reads with 7,598,036,980 clean bases were obtained (Table S2). Our results revealed high sequencing quality, and the Q20 ratio was >97.48%. By the standards of FDR ≤ 0.05 and ∣log2(FC)∣ ≥ 1, 244 DEGs containing 116 and 128 genes with down- and upregulation were identified in ΔSLCGL_Lrp compared with LCGL, respectively (Figure 1A).
For verifying RNA-seq data accuracy, we quantitatively determined the relative expression level of 15 randomly selected DEGs (7 upregulated and 8 downregulated) (Table S3). RT-qPCR analysis yielded similar results to RNA-seq in terms of the 15 DEGs’ levels (Figure 1B). Of those 244 DEGs, 20 genes within the lincomycin biosynthetic cluster were transcriptionally downregulated, consistent with the results of a previous study [20] (Figure 1C). Therefore, high-quality RNA-seq data were obtained for functional annotation.

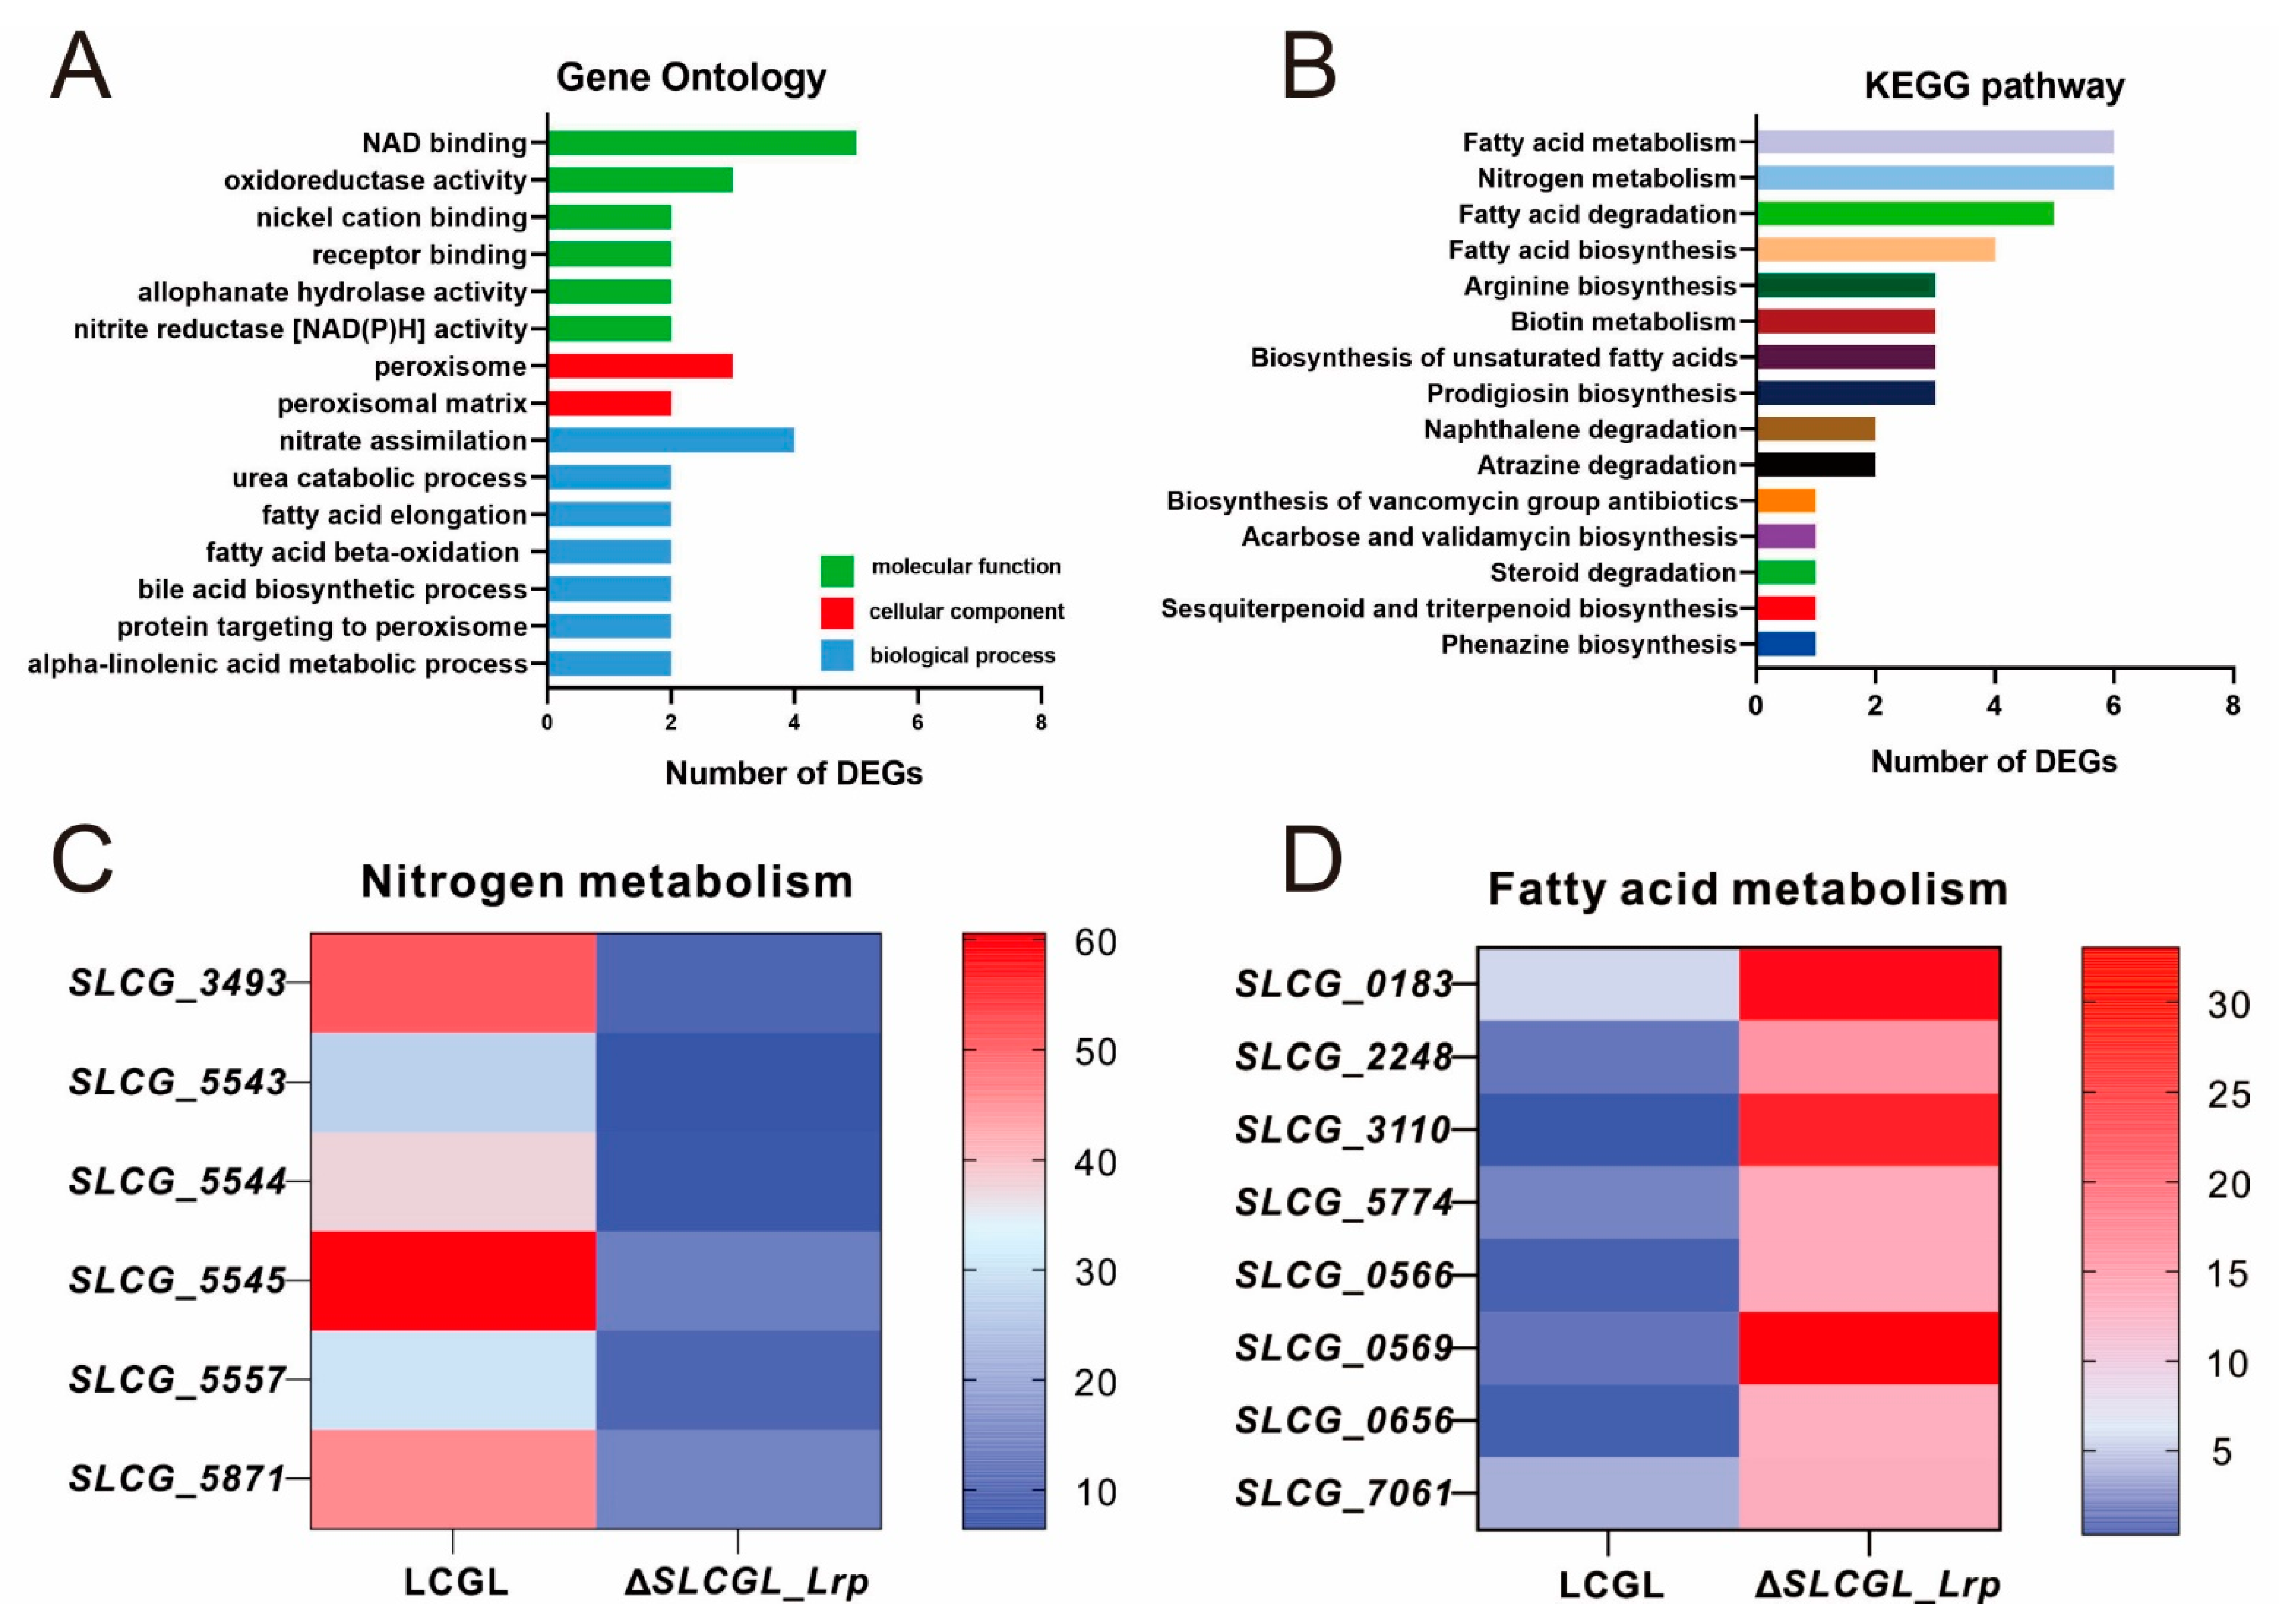
3.2. GO as Well as KEGG Analysis on DEGs

GO together with KEGG analysis was conducted on DEGs. In GO annotation (Figure 2A), DEGs showed significant enrichment (“over_represented_ p value ≤ 0.05”) in the molecular function terms “oxidoreductase activity, acting on CH-CH group of donors”, “NAD binding”, “nickel cation binding”, “receptor binding”, “allophanate hydrolase activity”, and “nitrite reductase [NAD(P)H] activity”; the cell component terms “peroxisome” and “peroxisomal matrix”; and the biological process terms “nitrate assimilation”, “fatty acid elongation”, “fatty acid beta-oxidation”, “urea catabolic process”, “bile acid biosynthetic process”, “protein targeting to peroxisome”, and “alpha-linolenic acid metabolic process”. Based on KEGG pathway analysis (Figure 2B), the above DEGs were mostly related to nitrogen and fatty acid metabolism pathways, such as “Fatty acid metabolism” (six DEGs), “Nitrogen metabolism” (six DEGs), “Fatty acid degradation” (five DEGs), and “Fatty acid biosynthesis” (four DEGs) (Figure 2C,D). Thus, SLCG_Lrp has global functions and markedly affects nitrogen and fatty acid metabolism pathways.

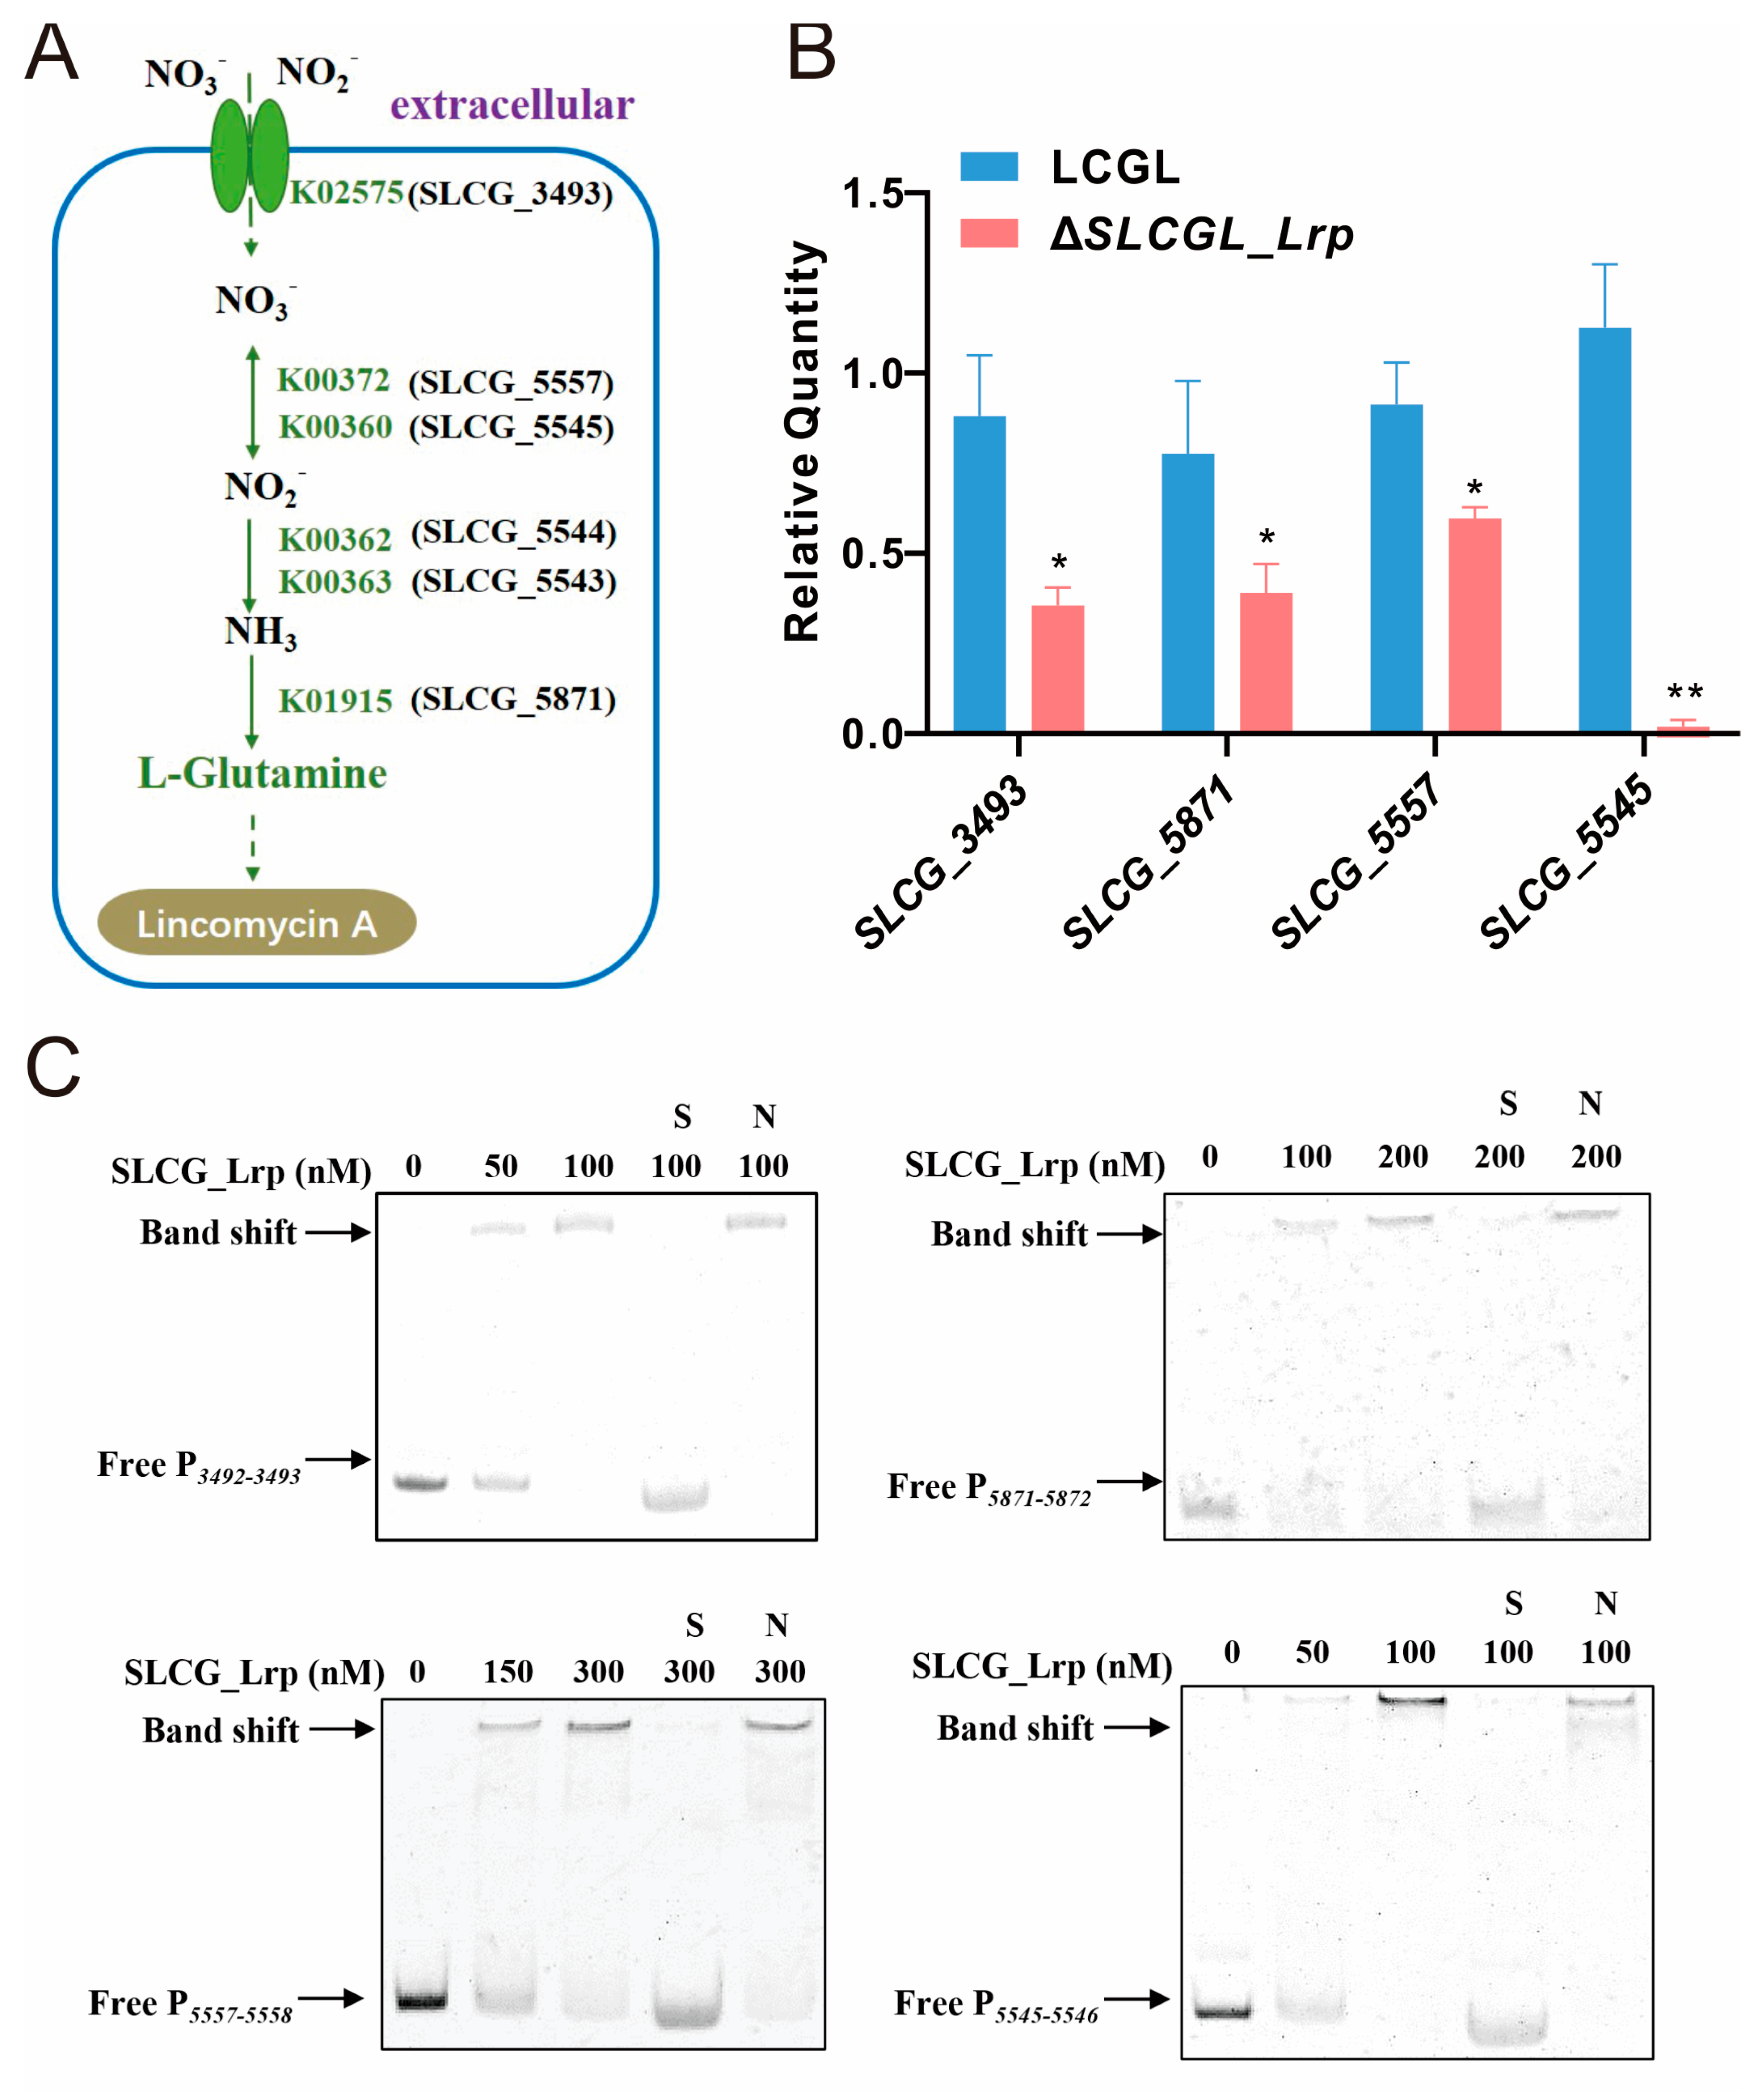
3.3. SLCG_Lrp Directly Promotes the Transcription of Nitrogen Metabolism Genes

According to transcriptomic analysis, nitrogen metabolic genes in KEGG analysis were downregulated (Table S4) and mainly involved in nitrate assimilation (Figure 3A). For investigating SLCG_Lrp’s role in regulating nitrate assimilation, DEGs’ levels associated with nitrate assimilation were determined via RT-qPCR. DEGs’ transcription expression within ΔSLCGL_Lrp, like SLCG_3493 (encoding the NarK family nitrate/nitrite MFS transporter), SLCG_5543 (encoding the nitrite reductase (NAD(P)H) small subunit), SLCG_5544 (encoding the nitrite reductase large subunit), SLCG_5545 (encoding NAD(P)/FAD-dependent oxidoreductase), SLCG_5557 (encoding nitrite reductase), and SLCG_5871 (encoding glutamine synthetase) were decreased by 59.1%, 49.4%, 34.4%, and 98.3%, respectively, relative to their respective levels in LCGL (Figure 3B). Therefore, inactivation of SLCG_Lrp negatively affects nitrate assimilation and reduces intracellular nitrogen concentration, which in turn limits the transformation of glutamate into tyrosine, decreasing the number precursors available for lincomycin biosynthesis.
To determine whether SLCG_Lrp directly promotes the transcription of SLCG_3493, SLCG_5543-5544-5545, SLCG_5557, and SLCG_5871, we examined their affinity with the aforementioned gene promoters by EMSA analyses. Based on our results, SLCG_Lrp could bind to the promoter regions of SLCG_3493, SLCG_5543-5544-5545, SLCG_5557, and SLCG_5871 (Figure 3C). In addition, 20-fold unlabeled probes can dramatically compete with labeled probes for binding to SLCG_Lrp (Figure 3C). When a nonspecific DNA, poly dI-dC, was added into the reaction system, the shifted band did not disappear. These results indicated that SLCG_Lrp can directly promote nitrogen metabolic gene transcription and affect the nitrate assimilation of S. lincolnensis.

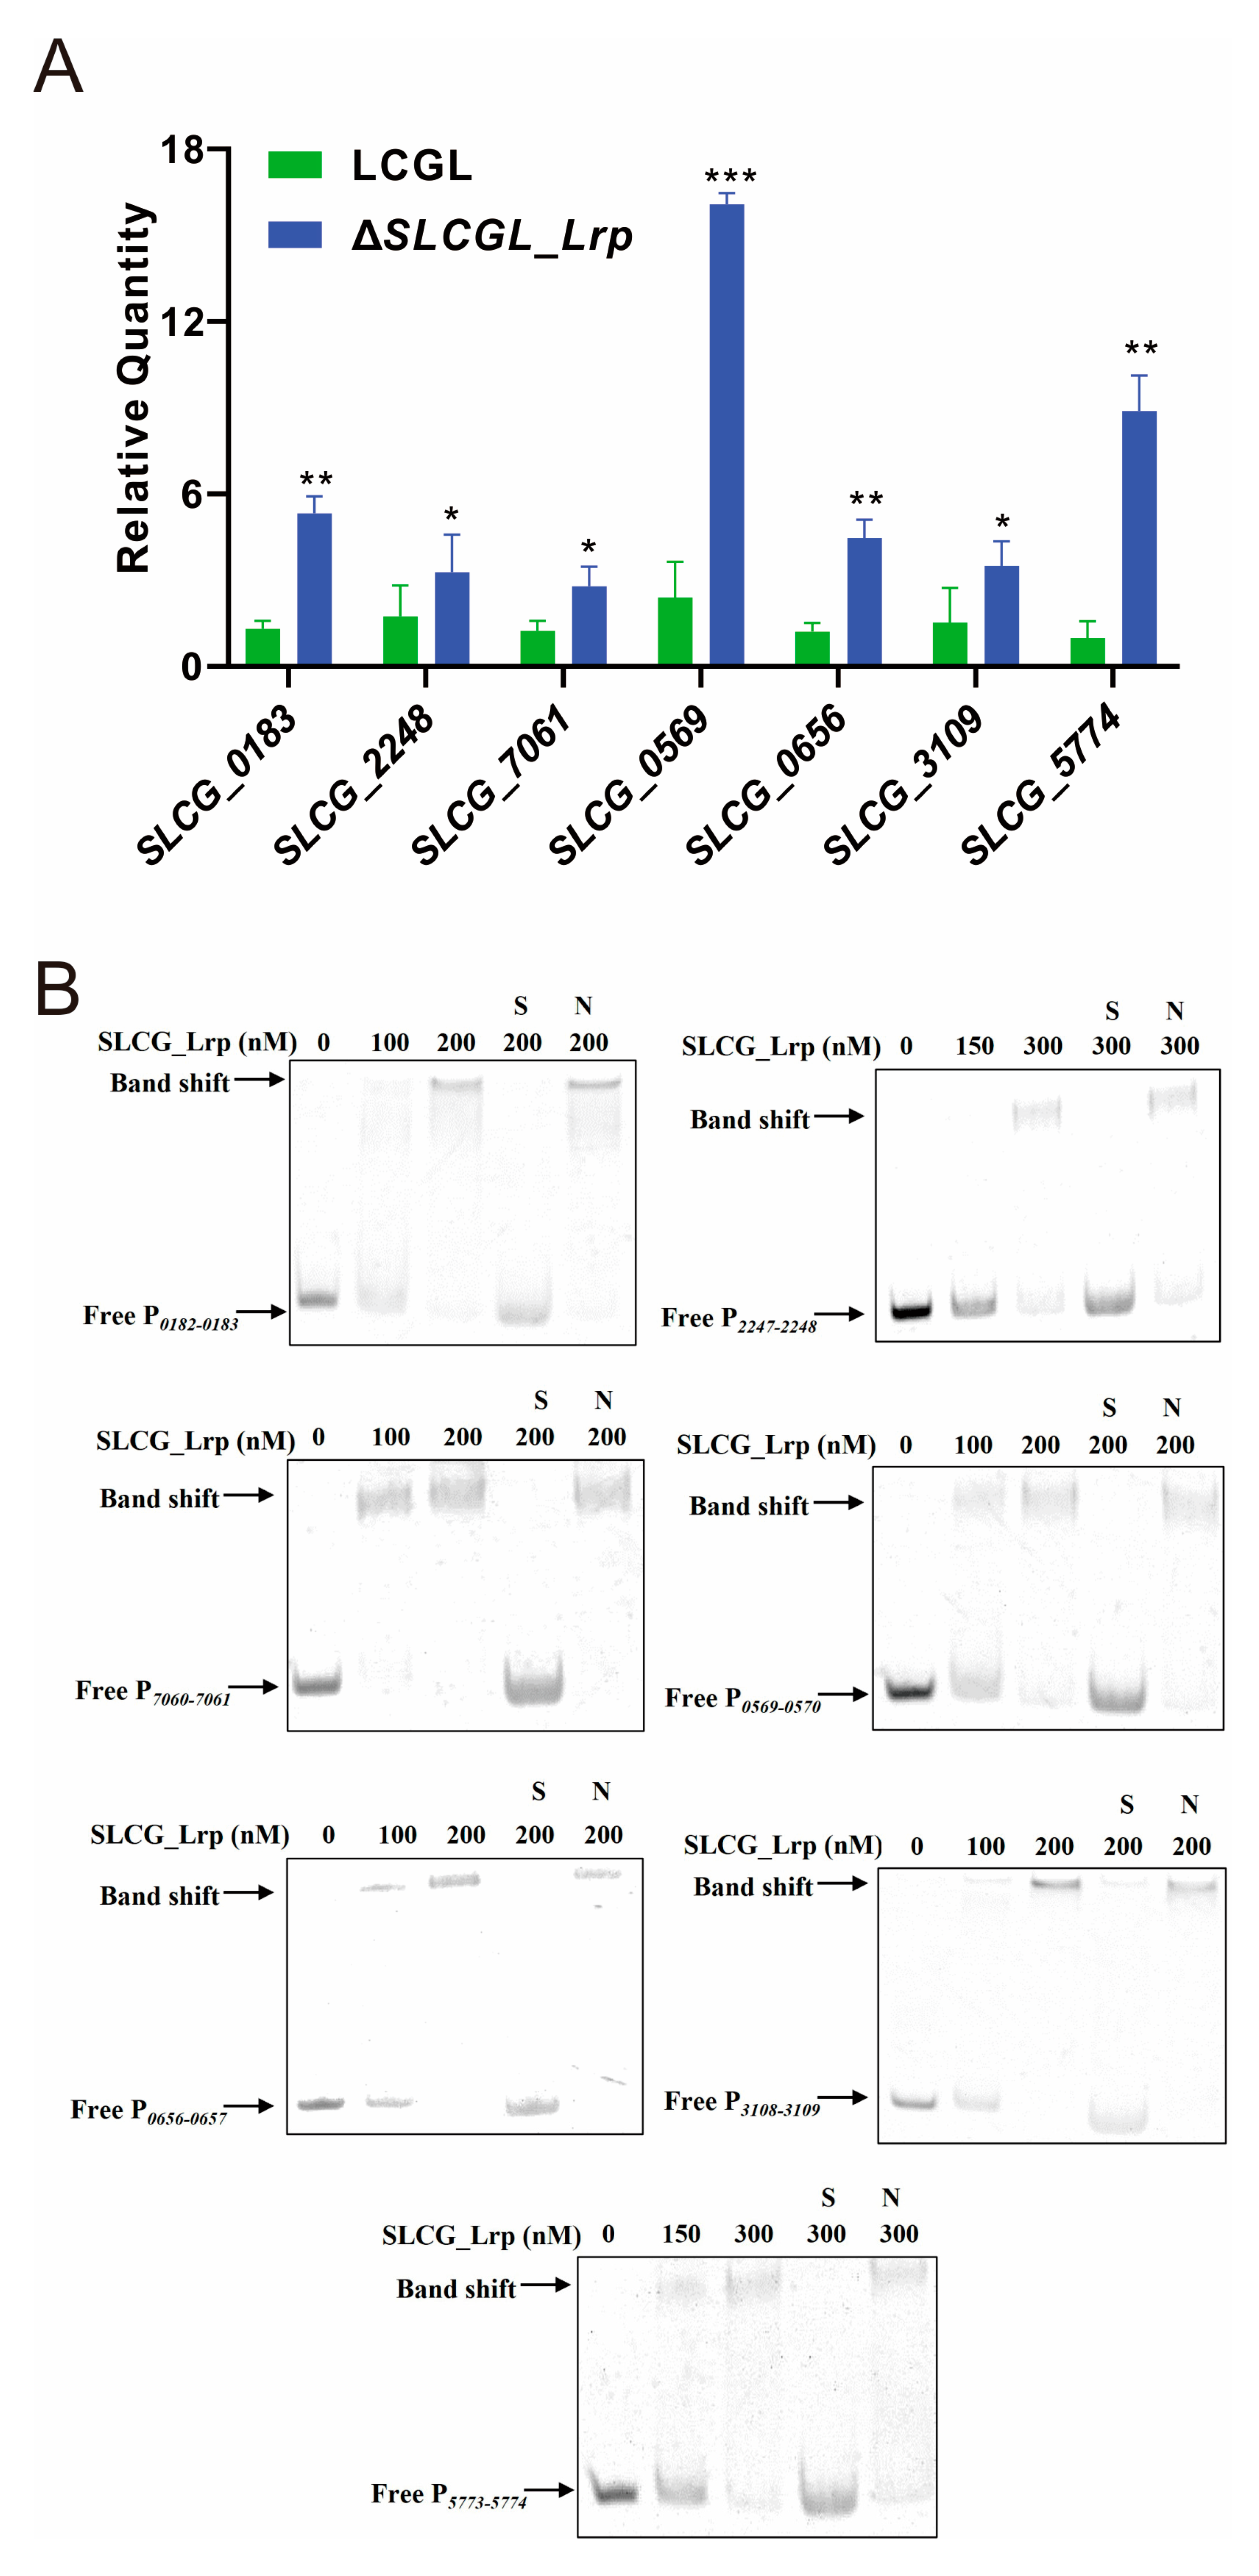
3.4. SLCG_Lrp Directly Represses the Transcription of Fatty Acid Metabolism Genes

The 28 genes significantly enriched in the KEGG analysis were mostly associated with fatty acid metabolism. These included three SDR family oxidoreductases (SLCG_0183, SLCG_2248, and SLCG_7061), acyl-CoA synthetase (SLCG_0656), thiolase domain-containing protein (SLCG_0566), crotonase/enoyl-CoA hydratase family protein (SLCG_0569), and two Zn-dependent alcohol dehydrogenases (SLCG_3110 and SLCG_5774) (Table S5). Eight of these fatty acid metabolism-related genes were subjected to RT-qPCR analysis. In the ΔSLCGL_Lrp mutant, SLCG_0183, SLCG_2248, SLCG_7061, SLCG_0659, SLCG_0656, SLCG_3110, and SLCG_5774 transcription increased by 310%, 48.5%, 124.2%, 569.6%, 289%, 50.0%, and 797.9%, respectively, relative to the respective levels in LCGL, consistent with the RNA-seq results (Figure 4A). Based on the results of the EMSA analysis, a clear shift of band was observed after incubating SLCG_Lrp using the probes P0182-0183, P2247-2248, P7060-7061, P0569-0570, P0656-0657, P3108-3109, and P5773-5774, confirming that SLCG_Lrp could bind specifically to these probes (Figure 4B). In summary, SLCG_Lrp shows direct regulation of fatty acid metabolic gene expression by binding to such genes’ promoter regions.

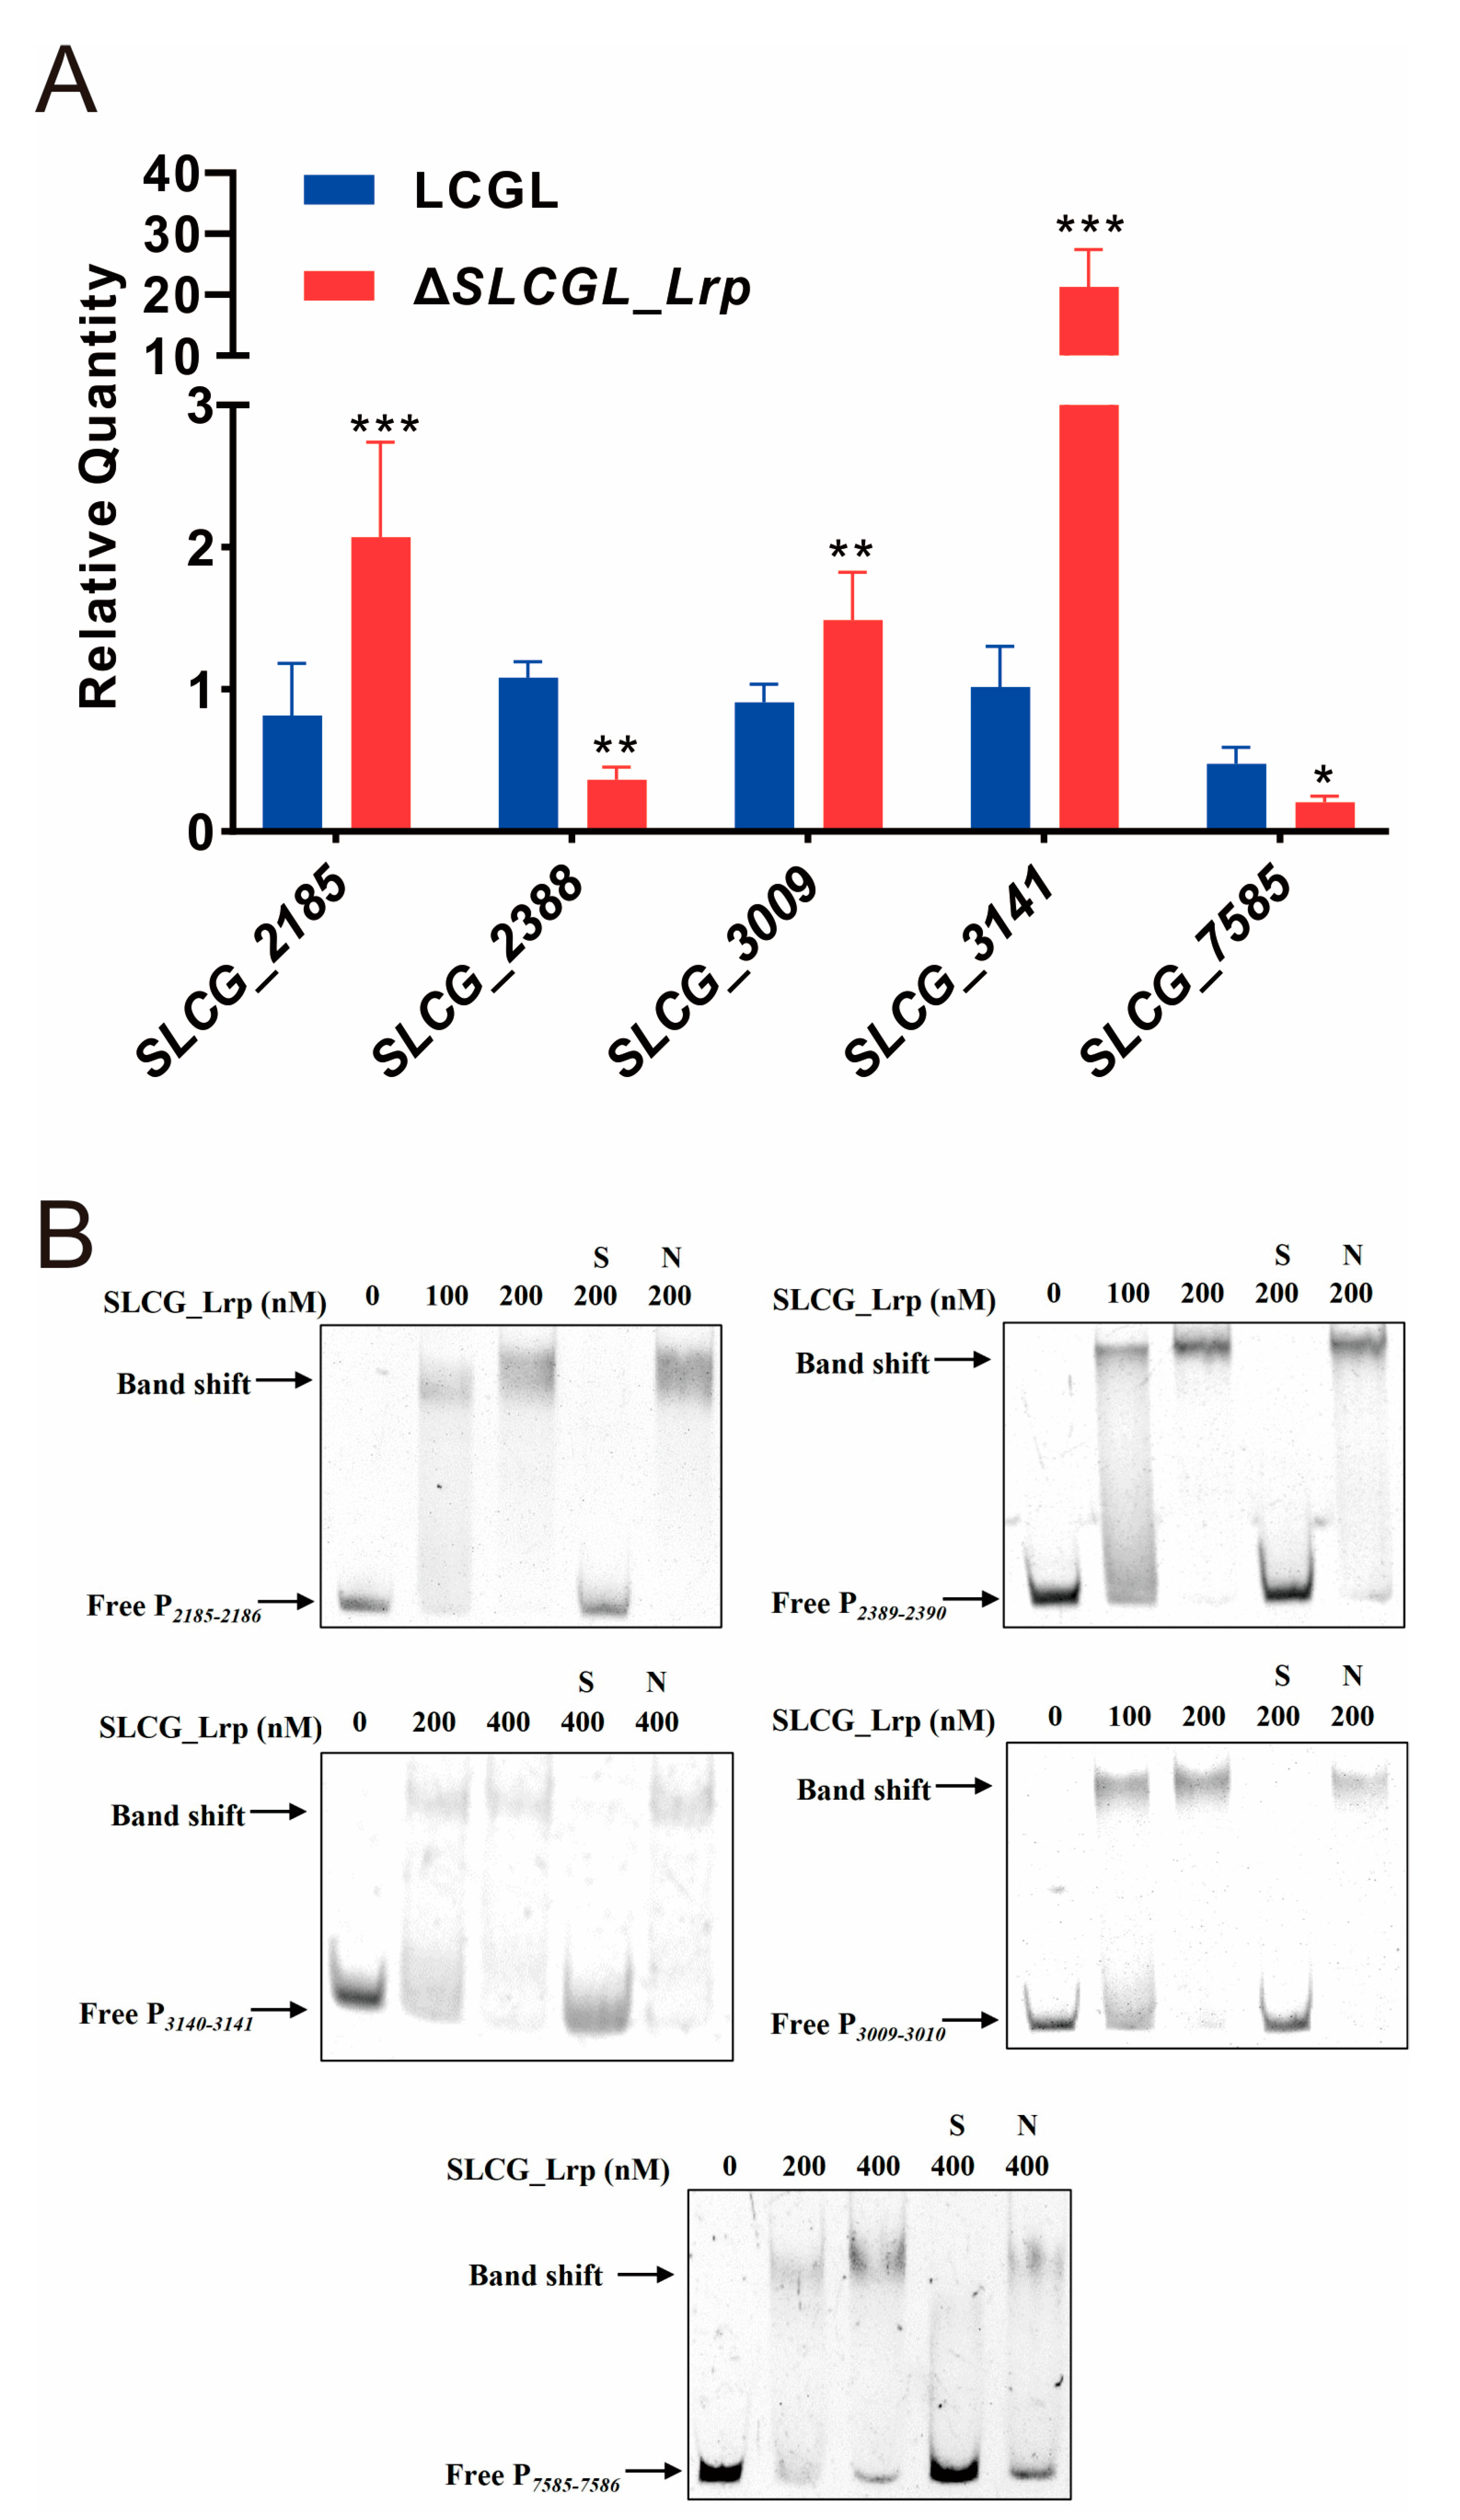
3.5. SLCG_Lrp Transcriptionally Modulates Five Regulatory Gene in S. lincolnensis

RNA-seq analysis found that five regulatory genes are transcriptionally regulated by SLCG_Lrp, namely, the FadR transcriptional regulator (SLCG_2185), PII family nitrogen regulator (SLCG_2388), XRE family transcriptional regulator (SLCG_3009), two-component system response regulator (SLCG_3141), and GntR-family transcriptional regulator (SLCG_7585) (Table S6). The transcription levels of these five regulatory genes were analyzed by RT-qPCR, confirming the results of RNA-seq (Figure 5A). Additionally, SLCG_Lrp bound specifically to promoters in SLCG_2185, SLCG_2388, SLCG_3009, SLCG_3141, and SLCG_7585 (Figure 5B). Consequently, SLCG_Lrp showed a direct effect on modulating these five regulatory genes’ transcription.
To investigate the effects of those five regulators on lincomycin production, homologous recombination was used to knock out these five regulatory genes in LCGL. Through resistance screening and PCR identification, deletion mutants of these genes were successively obtained in LCGL (Figure S1). Fermentation and HPLC analyses showed that, compared with LCGL, the Lin-A yield of ΔSLCGL_2185 decreased by 26%, that of ΔSLCGL_3141 increased by 15%, and those of ΔSLCGL_2388, ΔSLCGL_3009, and ΔSLCGL_7585 were not significantly altered (Figure 6A). Because SLCG_2185 had the most obvious effect on lincomycin production, the SLCG_2185-overexpression strain was constructed. Compared with LCGL/pIB139, Lin-A production in LCGL/pIB139-2185 was elevated by 19.8%, indicating that SLCG_2185 positively affected lincomycin biosynthesis (Figure 6B).

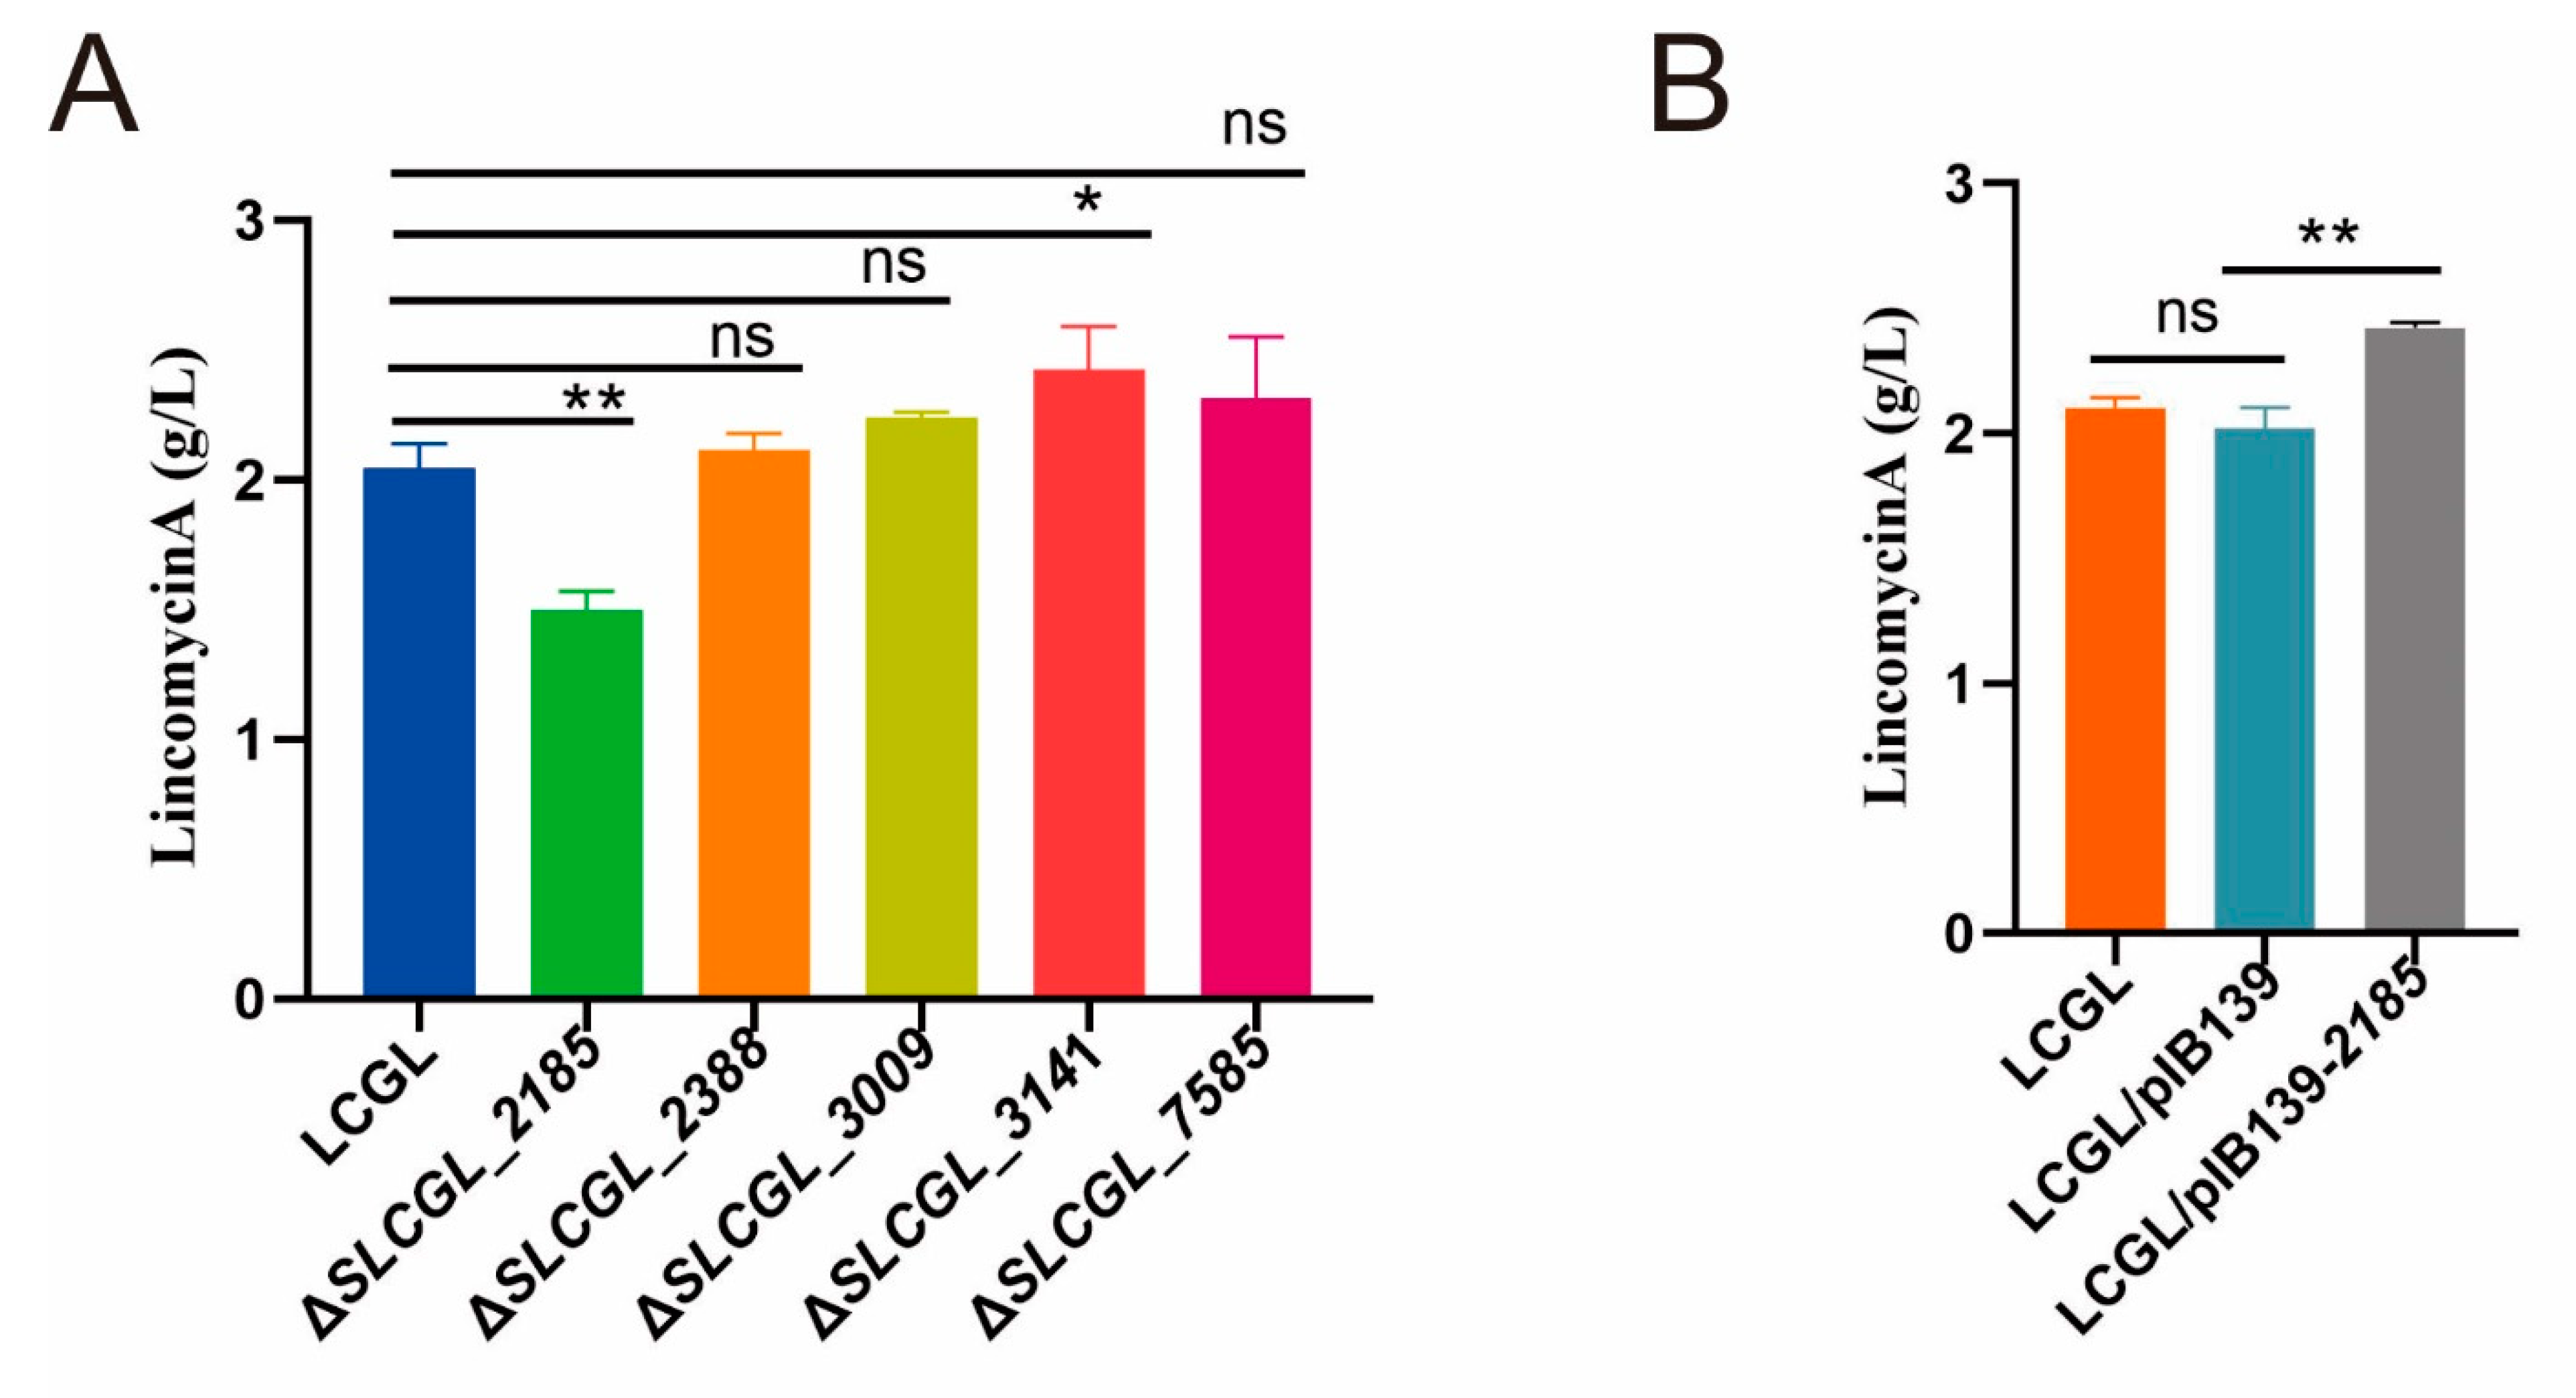
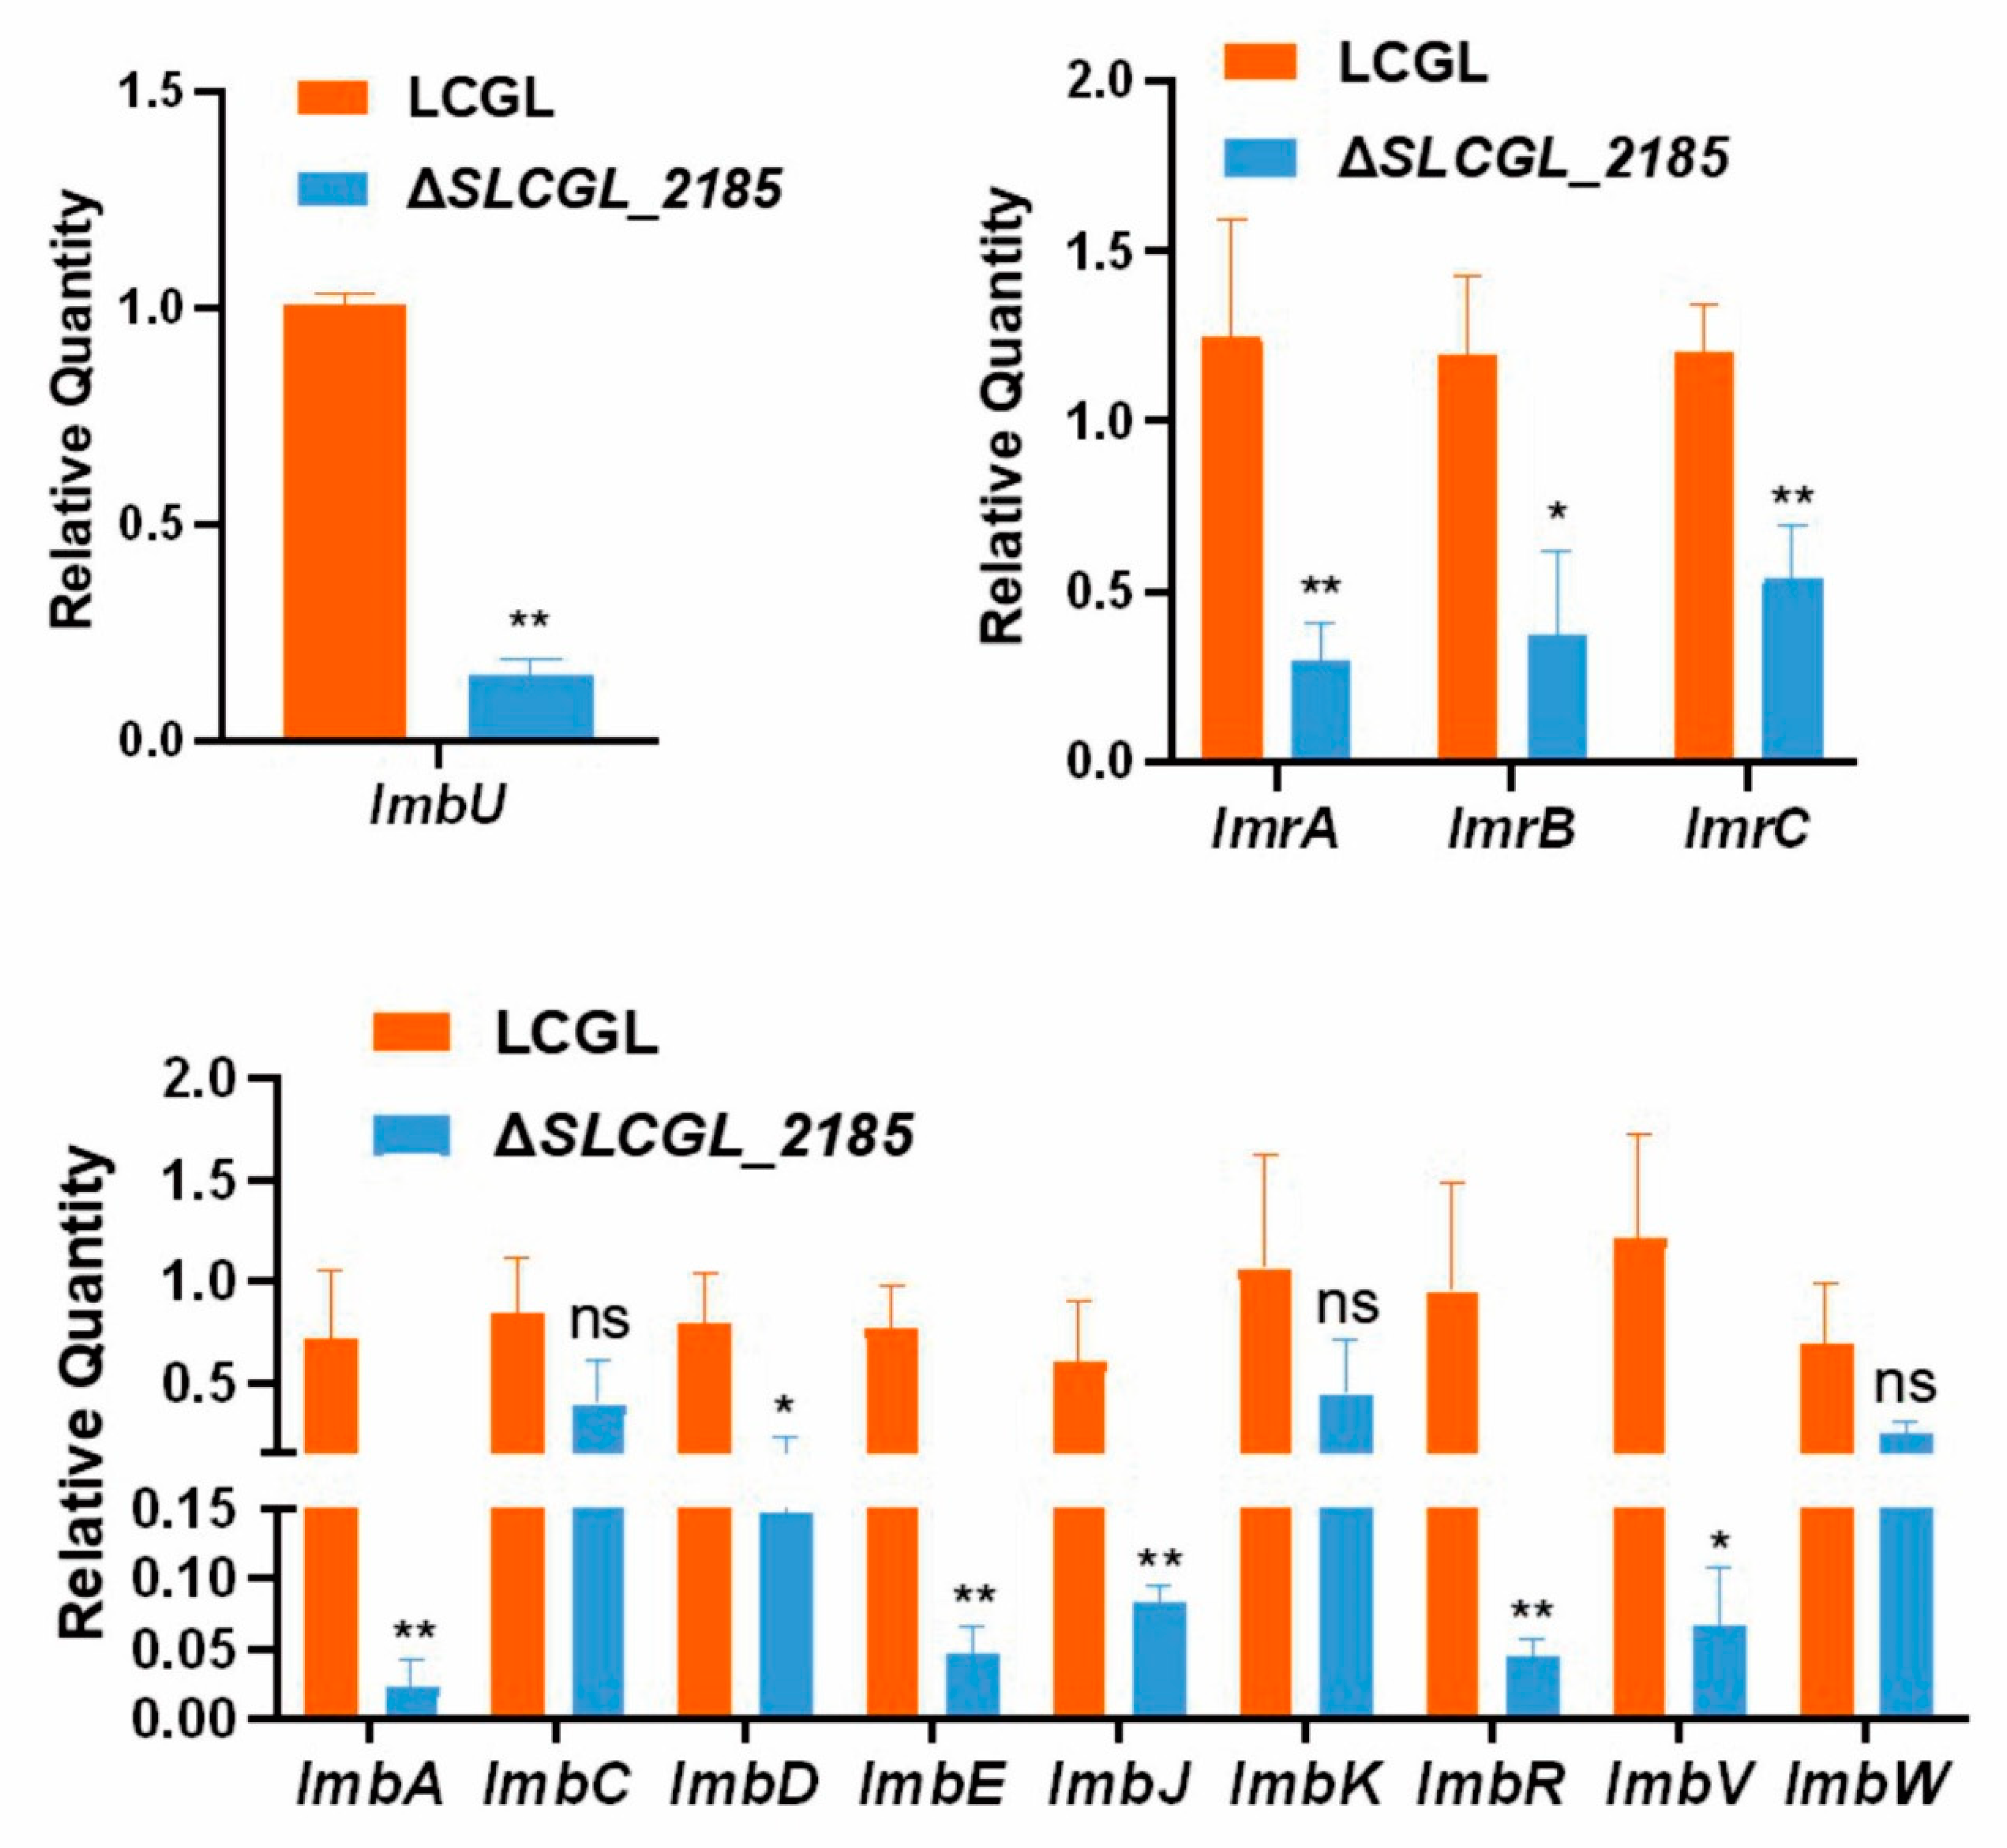
3.6. SLCG_2185 Shows Direct Transcriptional Activation on Lincomycin Biosynthetic Cluster

To investigate SLCG_2185-mediated transcriptional regulation of lincomycin, RT-qPCR analysis was performed to compare the transcriptional levels of the lincomycin biosynthetic genes of LCGL with those of ΔSLCGL_2185. The analysis demonstrated that SLCG_2185 deletion decreased the transcription levels of resistance genes and regulatory genes, together with most of structural genes within the lincomycin biosynthetic gene cluster (BGC) (Figure 7). In conclusion, SLCG_2185 positively regulates lincomycin production by enhancing lincomycin biosynthetic cluster transcription.

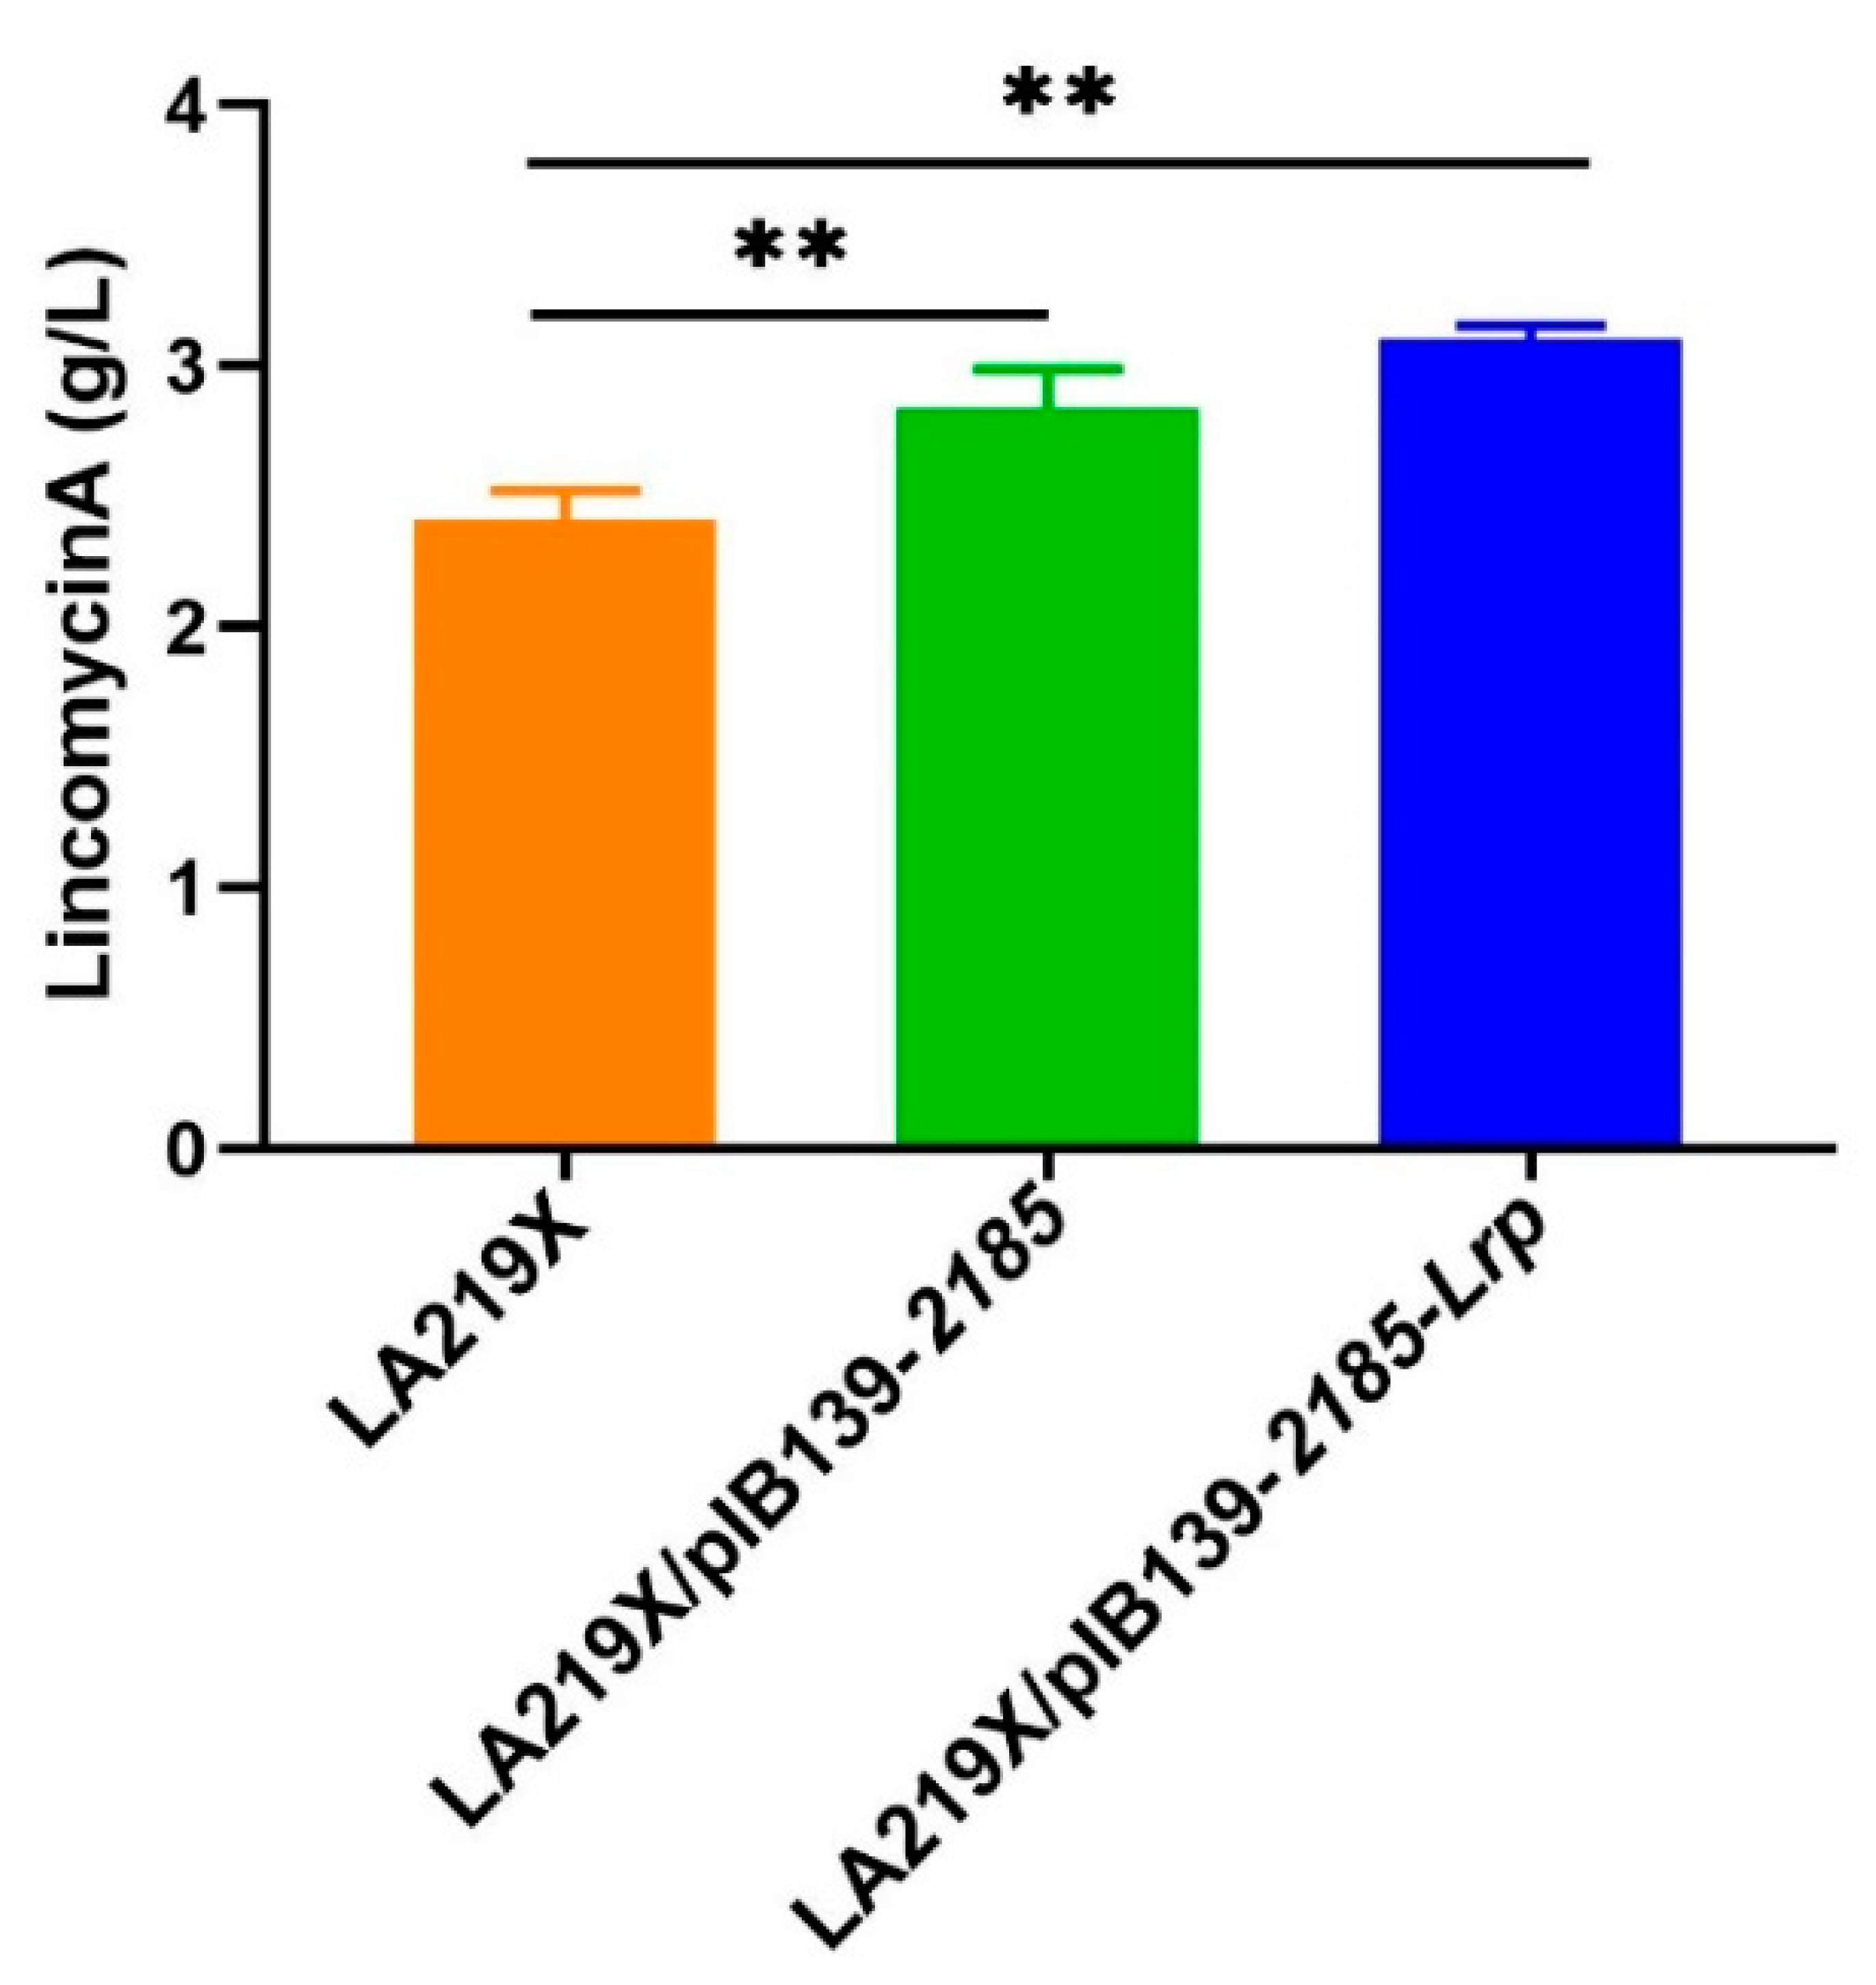
3.7. Rational Improvement of the Industrial High-Yield S. lincolnensis LA129X Strain

To verify whether SLCG_2185 has the same effect on the industrial high-yield S. lincolnensis strain LA219X, the LA219X/pIB139-2185 strain was constructed in the same way as LCGL/pIB139-2185. HPLC analysis showed that, compared with LA219X, Lin-A production increased by 17.8% in LA219X/pIB139-2185 (Figure 8). Furthermore, when pIB139-2185-Lrp was introduced into LA219X, the engineered strain LA219X/pIB139-2185-Lrp increased Lin-A production by 28.6% (Figure 8).

4. Discussion

We used RNA-seq-based transcriptomic analysis to examine how SLCG_Lrp affected the global transcriptional profile in S. lincolnensis. By sequencing six samples from LCGL and ΔSLCGL_Lrp, we acquired high-quality transcriptome data, which met the requirement for further analyses by RT-qPCR confirmation of 15 randomly selected genes. In total, 244 DEGs were identified to be associated with redox reactions, peroxisomes, nitrate assimilation, and fatty acid lengthening, among other molecular functions, cell components, and biological processes.
Lrps, widespread among prokaryotes, play roles in different biological activities [30]. Our studies on Lrps have provided the insights into regulating antibiotic production via SACE_Lrp and SACE_5717 in Sac. erythraea, SCO3361 in S. coelicolor, SSP_Lrp in S. spiramyceticus, and SLCG_Lrp from S. lincolnensis [15,16,17,18,20]. SLCG_Lrp affected lincomycin production through the direct activation of CSR lmbU, lmbA, and lmbV, three resistance genes, and the adjacent gene SLCG_3127 at the transcription level [20]. Nevertheless, the Lrp-mediated regulatory network during antibiotic biosynthesis in actinomycetes has been seldom reported. In the present study, it has been found that SLCG_Lrp not only activated the expression of nitrogen assimilation genes, but also repressed fatty acid metabolic gene transcription. Furthermore, utilizing the MEME program with the upstream regions of these genes, a consensus SLCG_Lrp-binding motif (gacctttgctCtca, g: G, C, A/T; a: A, G/C/T; c: C, A/G/T; t: T, C/G/A) was predicted (Figure S2).
Nitrate can be delivered to cells through the nitrate transporters NarK/NarK2 within actinomycetes [31]. Subsequently, nitrate is transformed into ammonia by nitrate/nitrite reductase, after which ammonia is converted into glutamine by glutamine synthetase [32]. Glutamine is then converted to glutamate via the action of glutamate synthase and used as an amino group donor to synthesize additional amino acids, such as tyrosine, by means of transamination [33]. L-tyrosine hydroxylation in L-dopa can be achieved under the action of LmbB2, which triggers N-methylated 4-propyl-L-proline moiety production in lincomycin [34]. Previously, we found that after adding 0.8% nitrate into the fermentation medium, the transcription of the nitrate and nitrite reductase genes and glutamine synthetase genes in S. lincolnensis were increased, and the yield of lincomycin was subsequently increased [33]. Herein, we found that SLCG_Lrp positively regulates the transcription of SLCG_3493 (NarK family nitrate/nitrite MFS transporter), SLCG_5543-5545 (NAD(P)/FAD-dependent oxidoreductase), SLCG_5557 (nitrite reductase), and SLCG_5871 (glutamine synthetase) in S. lincolnensis. Nitrite reductase (NAD(P)H) activity mediates the degradation of nitrite in cells, and nitrate assimilation can stimulate the accumulation of nitrogenous compounds [35]. Consequently, inactivation of SLCG_Lrp negatively affects nitrate assimilation and reduces intracellular nitrogen concentration, probably limiting the transformation of glutamate into tyrosine for decreasing the precursors for lincomycin biosynthesis.
SLCG_2185 encoded the FadR-family TF which is probably involved in the control of fatty acid pathways [36]. SLCG_2185 was validated to stimulate lincomycin production by promoting lincomycin biosynthetic genes in S. lincolnensis. However, the regulatory mechanism of SLCG_2185 for controlling the fatty acid catabolism remains obscure and needs further investigation. In addition to SLCG_2185, four other regulatory genes were also differentially regulated by SLCG_Lrp. SLCG_2388 encodes a PII family nitrogen regulator, an extensively existing signal transduction protein family of bacteria, and regulates nitrogen metabolism [37]. XRE family transcriptional regulators are a large protein family controlling various metabolic functions in bacteria [38]. In S. coelicolor, the XRE family member SCO1979 can regulate antibiotic generation [39]. Currently, we showed that SLCG_3099 (which encodes XRE family TF) silencing enhanced lincomycin production. SLCG_3141 is similar to a two-component system response regulator, which consists of two regulators that enable cell regulation through phosphorylation-mediated synergy [40]. Therefore, we can conclude that Lrps exhibits mechanistic complexity in relation to the transcriptional regulation of lincomycin biosynthesis.
Collectively, this work put forward an SLCG_Lrp-dependent regulatory network (Figure 9). SLCG_Lrp directly activated the structural, regulatory, and resistance genes within the lincomycin biosynthesis cluster, which showed direct regulation of its genes and activated SLCG_3127 for mediating the efflux of four amino acids. SLCG_Lrp directly promoted nitrogen metabolic gene transcription, whereas it directly repressed the transcription of genes of fatty acid metabolism. SLCG_Lrp upregulates the regulators SLCG_2388, and SLCG_7585, and it downregulates SLCG_2185, SLCG_3009, and SLCG_3141.

5. Conclusions

This study proved that SLCG_Lrp promotes nitrate assimilation but inhibits fatty acid metabolism, as well as upregulating two regulators that participate in the modulation of nitrogen metabolism and multiple cellular processes and downregulating three regulators related to controlling fatty acid pathways and antibiotic generation, development, and resistance. Upon SLCG_2185 and SLCG_Lrp co-overexpression, the engineered S. lincolnensis LA219X/pIB139-2185-Lrp presented a 28.1% increase compared with LA219X. In summary, uncovering the mechanisms underlying SLCG_Lrp’s role in the lincomycin biosynthesis of S. lincolnensis is beneficial for guiding the further improvement of lincomycin titers and applications.

Supplementary Materials

The following supporting information can be downloaded at: https://www.mdpi.com/article/10.3390/fermentation9040396/s1, Figure S1: Inactivation of SLCG_2185 in S. lincolnensis LCGL; Figure S2: MEME analysis of the consensus SLCG_Lrp−binding motif within promoter regions; Table S1: Primers used in this study; Table S2: Quality statistics of sequencing raw and clean data; Table S3: qRT-PCR tests verify the selection of genes; Table S4: KEGG enriched genes related to nitrogen metabolism pathway; Table S5: KEGG enriched genes related to fatty acid metabolism pathway; Table S6: Transcriptional regulators in DEGs.

Author Contributions

Conceptualization, Y.X. and H.W.; writing—original draft preparation, Y.X. and W.X.; methodology, Y.X., W.X., J.Y., B.L., M.L., M.Z., Y.Z. and R.L.; supervision, H.W. and B.Z. All authors have read and agreed to the published version of the manuscript.

Funding

This study was supported by the National Natural Science Foundation of China (32170073), the Natural Science Foundation of Anhui Province (2008085QC99, 2208085Y09), the High-level Scientific Research Foundation for the Introduction of Talent (2020rcjj36), the Key Natural Science Foundation of Anhui Province (KJ2021A0918), and the Research Foundation for Anhui Engineering Laboratory for Medicinal and Food Homologous Natural Resources Exploration (2020PT20).

Institutional Review Board Statement

Not applicable.

Data Availability Statement

The data that support the findings of this study are available from the corresponding author upon reasonable request.

Conflicts of Interest

The authors declare no conflict of interest.

References

  1. Spížek, J.; Řezanka, T. Lincomycin, cultivation of producing strains and biosynthesis. Appl. Microbiol. Biotechnol. 2003, 63, 510–519. [Google Scholar] [CrossRef] [PubMed]
  2. Zhao, Q.; Wang, M.; Xu, D.; Zhang, Q.; Liu, W. Metabolic coupling of two small-molecule thiols programs the biosynthesis of lincomycin A. Nature 2015, 518, 115–119. [Google Scholar] [CrossRef]
  3. Wu, H.; Wang, Y.; Yuan, L.; Mao, Y.; Wang, W.; Zhu, L.; Wu, P.; Fu, C.; Müller, R.; Weaver, D.; et al. Inactivation of SACE_3446, a TetR family transcriptional regulator, stimulates erythromycin production in Saccharopolyspora erythraea. Synth Syst. Biotechnol. 2016, 1, 39–46. [Google Scholar] [CrossRef] [PubMed]
  4. Koberská, M.; Kopecký, J.; Olsovská, J.; Jelínková, M.; Ulanova, D.; Man, P.; Flieger, M.; Janata, J. Sequence analysis and heterologous expression of the lincomycin biosynthetic cluster of the type strain Streptomyces lincolnensis ATCC 25466. Folia Microbiol. 2008, 53, 395–401. [Google Scholar] [CrossRef]
  5. Koberska, M.; Vesela, L.; Vimberg, V.; Lenart, J.; Vesela, J.; Kamenik, Z.; Janata, J.; Balikova Novotna, G. Beyond Self-Resistance: ABCF ATPase LmrC Is a Signal-Transducing Component of an Antibiotic-Driven Signaling Cascade Accelerating the Onset of Lincomycin Biosynthesis. mBio 2021, 12, e0173121. [Google Scholar] [CrossRef]
  6. Hou, B.; Zhu, X.; Kang, Y.; Wang, R.; Wu, H.; Ye, J.; Zhang, H. LmbU, a Cluster-Situated Regulator for Lincomycin, Consists of a DNA-Binding Domain, an Auto-Inhibitory Domain, and Forms Homodimer. Front. Microbiol. 2019, 10, 989. [Google Scholar] [CrossRef] [PubMed]
  7. Wang, M.; Zhao, Q.; Zhang, Q.; Liu, W. Differences in PLP-Dependent Cysteinyl Processing Lead to Diverse S-Functionalization of Lincosamide Antibiotics. J. Am. Chem. Soc. 2016, 138, 6348–6351. [Google Scholar] [CrossRef] [PubMed]
  8. van der Heul, H.; Bilyk, B.; McDowall, K.; Seipke, R.; van Wezel, G. Regulation of antibiotic production in Actinobacteria: New perspectives from the post-genomic era. Nat. Prod. Rep. 2018, 35, 575–604. [Google Scholar] [CrossRef]
  9. Wang, R.; Kong, F.; Wu, H.; Hou, B.; Kang, Y.; Cao, Y.; Duan, S.; Ye, J.; Zhang, H. Complete genome sequence of high-yield strain S. lincolnensis B48 and identification of crucial mutations contributing to lincomycin overproduction. Synth Syst. Biotechnol. 2020, 5, 37–48. [Google Scholar] [CrossRef]
  10. Wu, H.; Chu, Z.; Zhang, W.; Zhang, C.; Ni, J.; Fang, H.; Chen, Y.; Wang, Y.; Zhang, L.; Zhang, B. Transcriptome-guided target identification of the TetR-like regulator SACE_5754 and engineered overproduction of erythromycin in Saccharopolyspora erythraea. J. Biol. Eng. 2019, 13, 11. [Google Scholar] [CrossRef]
  11. Ziegler, C.; Freddolino, P. The leucine-responsive regulatory proteins/feast-famine regulatory proteins: An ancient and complex class of transcriptional regulators in bacteria and archaea. Crit. Rev. Biochem. Mol. Biol. 2021, 56, 373–400. [Google Scholar] [CrossRef] [PubMed]
  12. Deng, W.; Wang, H.; Xie, J. Regulatory and pathogenesis roles of Mycobacterium Lrp/AsnC family transcriptional factors. J. Cell Biochem. 2011, 112, 2655–2662. [Google Scholar] [CrossRef]
  13. Cho, B.; Barrett, C.; Knight, E.; Park, Y.; Palsson, B. Genome-scale reconstruction of the Lrp regulatory network in Escherichia coli. Proc. Natl. Acad. Sci. USA 2008, 105, 19462–19467. [Google Scholar] [CrossRef] [PubMed]
  14. Peeters, E.; Charlier, D. The Lrp family of transcription regulators in archaea. Archaea 2010, 2010, 750457. [Google Scholar] [CrossRef] [PubMed]
  15. Liu, J.; Chen, Y.; Wang, W.; Ren, M.; Wu, P.; Wang, Y.; Li, C.; Zhang, L.; Wu, H.; Weaver, D.; et al. Engineering of an Lrp family regulator SACE_Lrp improves erythromycin production in Saccharopolyspora erythraea. Metab. Eng. 2017, 39, 29–37. [Google Scholar] [CrossRef]
  16. Liu, J.; Chen, Y.; Li, L.; Yang, E.; Wang, Y.; Wu, H.; Zhang, L.; Wang, W.; Zhang, B. Characterization and engineering of the Lrp/AsnC family regulator SACE_5717 for erythromycin overproduction in Saccharopolyspora erythraea. J. Ind. Microbiol. Biotechnol. 2019, 46, 1013–1024. [Google Scholar] [CrossRef]
  17. Liu, J.; Li, J.; Dong, H.; Chen, Y.; Wang, Y.; Wu, H.; Li, C.; Weaver, D.; Zhang, L.; Zhang, B. Characterization of an Lrp/AsnC family regulator SCO3361, controlling actinorhodin production and morphological development in Streptomyces coelicolor. Appl. Microbiol. Biotechnol. 2017, 101, 5773–5783. [Google Scholar] [CrossRef]
  18. Lu, Z.; Zhang, X.; Dai, J.; Wang, Y.; He, W. Engineering of leucine-responsive regulatory protein improves spiramycin and bitespiramycin biosynthesis. Microb. Cell Fact 2019, 18, 38. [Google Scholar] [CrossRef]
  19. Liu, J.; Wang, Y.; He, H.; Dong, S.; Tang, L.; Yang, E.; Wang, W.; Zhang, B. The leucine-responsive regulatory protein SCAB_Lrp modulates thaxtomin biosynthesis, pathogenicity, and morphological development in Streptomyces scabies. Mol. Plant Pathol. 2023, 24, 167–178. [Google Scholar] [CrossRef]
  20. Xu, Y.; Tang, Y.; Wang, N.; Liu, J.; Cai, X.; Cai, H.; Li, J.; Tan, G.; Liu, R.; Bai, L.; et al. Transcriptional regulation of a leucine-responsive regulatory protein for directly controlling lincomycin biosynthesis in Streptomyces lincolnensis. Appl. Microbiol. Biotechnol. 2020, 104, 2575–2587. [Google Scholar] [CrossRef]
  21. Sambrook, J.; Fritsch, E.F.; Maniatis, T. Molecular Cloning: A Laboratory Manual; Cold Spring Harbor Laboratory Press: Cold Spring Harbor, NY, USA, 1989. [Google Scholar]
  22. Du, L.; Liu, R.; Ying, L.; Zhao, G. An Efficient Intergeneric Conjugation of DNA from Escherichia coli to Mycelia of the Lincomycin-Producer Streptomyces lincolnensis. Int. J. Mol. Sci. 2012, 13, 4797–4806. [Google Scholar] [CrossRef] [PubMed]
  23. Xu, Y.; Tan, G.; Ke, M.; Li, J.; Tang, Y.; Meng, S.; Niu, J.; Wang, Y.; Liu, R.; Wu, H.; et al. Enhanced lincomycin production by co-overexpression of metK1 and metK2 in Streptomyces lincolnensis. J. Ind. Microbiol. Biotechnol. 2018, 45, 345–355. [Google Scholar] [CrossRef] [PubMed]
  24. Bierman, M.; Logan, R.; O’brien, K.; Seno, E.; Rao, R.N.; Schoner, B. Plasmid cloning vectors for the conjugal transfer of DNA from Escherichia coli to Streptomyces spp. Gene 1992, 116, 43–49. [Google Scholar] [CrossRef] [PubMed]
  25. Wu, H.; Chen, M.; Mao, Y.; Li, W.; Liu, J.; Huang, X.; Zhou, Y.; Ye, B.; Zhang, L.; Weaver, D.; et al. Dissecting and engineering of the TetR family regulator SACE_7301 for enhanced erythromycin production in Saccharopolyspora erythraea. Microb. Cell Fact. 2014, 13, 158. [Google Scholar] [CrossRef]
  26. Xu, Y.; Ke, M.; Li, J.; Tang, Y.; Wang, N.; Tan, G.; Wang, Y.; Liu, R.; Bai, L.; Zhang, L.; et al. TetR-Type Regulator SLCG_2919 Is a Negative Regulator of Lincomycin Biosynthesis in Streptomyces lincolnensis. Appl. Environ. Microbiol. 2019, 85, e02091-18. [Google Scholar] [CrossRef] [PubMed]
  27. Langmead, B.; Salzberg, S. Fast gapped-read alignment with Bowtie 2. Nat. Methods 2012, 9, 357–359. [Google Scholar] [CrossRef]
  28. Livak, K.J.; Schmittgen, T.D. Analysis of relative gene expression data using real-time quantitative PCR and the 2− ΔΔCT method. Methods 2001, 25, 402–408. [Google Scholar] [CrossRef] [PubMed]
  29. Hellman, L.M.; Fried, M.G. Electrophoretic mobility shift assay (EMSA) for detecting protein–nucleic acid interactions. Nat. Protoc. 2007, 2, 1849–1861. [Google Scholar] [CrossRef] [PubMed]
  30. Lintner, R.; Mishra, P.; Srivastava, P.; Martinez-Vaz, B.; Khodursky, A.; Blumenthal, R. Limited functional conservation of a global regulator among related bacterial genera: Lrp in Escherichia, Proteus and Vibrio. BMC Microbiol. 2008, 8, 60. [Google Scholar] [CrossRef]
  31. Fukuda, M.; Takeda, H.; Kato, H.; Doki, S.; Ito, K.; Maturana, A.; Ishitani, R.; Nureki, O. Structural basis for dynamic mechanism of nitrate/nitrite antiport by NarK. Nat. Commun. 2015, 6, 7097. [Google Scholar] [CrossRef]
  32. Chu, S.; Zhang, D.; Wang, D.; Zhi, Y.; Zhou, P. Heterologous expression and biochemical characterization of assimilatory nitrate and nitrite reductase reveals adaption and potential of Bacillus megaterium NCT-2 in secondary salinization soil. Int. J. Biol. Macromol. 2017, 101, 1019–1028. [Google Scholar] [CrossRef] [PubMed]
  33. Meng, S.; Wu, H.; Wang, L.; Zhang, B.; Bai, L. Enhancement of antibiotic productions by engineered nitrate utilization in actinomycetes. Appl. Microbiol. Biotechnol. 2017, 101, 5341–5352. [Google Scholar] [CrossRef] [PubMed]
  34. Neusser, D.; Schmidt, H.; Spizèk, J.; Novotnà, J.; Peschke, U.; Kaschabeck, S.; Tichy, P.; Piepersberg, W. The genes lmbB1 and lmbB2 of Streptomyces lincolnensis encode enzymes involved in the conversion of L-tyrosine to propylproline during the biosynthesis of the antibiotic lincomycin A. Arch. Microbiol. 1998, 169, 322–332. [Google Scholar] [CrossRef] [PubMed]
  35. Perli, T.; van der Vorm, D.; Wassink, M.; van den Broek, M.; Pronk, J.; Daran, J. Engineering heterologous molybdenum-cofactor-biosynthesis and nitrate-assimilation pathways enables nitrate utilization by Saccharomyces cerevisiae. Metab. Eng. 2021, 65, 11–29. [Google Scholar] [CrossRef]
  36. Fujihashi, M.; Nakatani, T.; Hirooka, K.; Matsuoka, H.; Fujita, Y.; Miki, K. Structural characterization of a ligand-bound form of Bacillus subtilis FadR involved in the regulation of fatty acid degradation. Proteins 2014, 82, 1301–1310. [Google Scholar] [CrossRef]
  37. Grau, F.; Burkovski, A.; Muller, Y. Crystal structures of adenylylated and unadenylylated P protein GlnK from Corynebacterium glutamicum. Acta Crystallogr. D Struct. Biol. 2021, 77, 325–335. [Google Scholar] [CrossRef] [PubMed]
  38. Lu, H.; Wang, L.; Li, S.; Pan, C.; Cheng, K.; Luo, Y.; Xu, H.; Tian, B.; Zhao, Y.; Hua, Y. Structure and DNA damage-dependent derepression mechanism for the XRE family member DG-DdrO. Nucleic Acids Res. 2019, 47, 9925–9933. [Google Scholar] [CrossRef]
  39. Zhu, Y.; Lu, T.; Zhang, J.; Zhang, P.; Tao, M.; Pang, X. A novel XRE family regulator that controls antibiotic production and development in Streptomyces coelicolor. Appl. Microbiol. Biotechnol. 2020, 104, 10075–10089. [Google Scholar] [CrossRef]
  40. Yang, Y.; Luo, M.; Zhou, H.; Li, C.; Luk, A.; Zhao, G.; Fung, K.; Ip, M. Role of Two-Component System Response Regulator bceR in the Antimicrobial Resistance, Virulence, Biofilm Formation, and Stress Response of Group B Streptococcus. Front. Microbiol. 2019, 10, 10. [Google Scholar] [CrossRef] [PubMed]
Figure 1. Comparative transcriptome analysis of LCGL and ΔSLCGL_Lrp. (A) Volcano blots to show significant changes in gene expression between LCGL and ΔSLCGL_Lrp. Dispersion graph of the − log10 (p value) (y axis) against the log2 (fold change) (x axis) corresponding to the genes by their differential expression. The red dot shows upregulated DEGs, the blue dot indicates downregulated DEGs, and the dark gray dot is a non−significant differential. (B) Comparison of gene expression patterns obtained using RNA−seq and RT−qPCR. (C) Heat map of gene expression within the lincomycin biosynthetic gene cluster.
Fermentation 09 00396 g001
Figure 2. GO and KEGG pathway enrichment analysis of DEGs. (A) Abundant GO terms of the molecular function categories (red), cellular component categories (green), and biological process categories (blue). (B) Fifteen significant KEGG pathway associated with classification of DEGs, including nitrogen metabolism, fatty acid metabolism, arginine metabolism, biotin metabolism, etc. (C) Heat map of DEGs in the nitrogen metabolism pathway. (D) Heat map of DEGs in the fatty acid metabolism pathway.
Fermentation 09 00396 g002
Figure 3. SLCG_Lrp directly promotes the transcription of nitrogen metabolism genes. (A) Biochemical metabolism map of DEGs enriched by the nitrogen metabolic pathway. (B) RT−qPCR analysis of nitrogen metabolization genes in LCGL and ΔSLCGL_Lrp. (C) EMSA analysis of SLCG_Lrp with the promoter regions of SLCG_3493, SLCG_5871, SLCG_5557, and SLCG_5543−5544−5545. S: unlabeled specific probe (20-fold); N: nonspecific probe poly dIdC (20-fold). The mean values of three replicates are shown, with the standard deviations indicated by error bars. * p < 0.05, ** p < 0.01.
Fermentation 09 00396 g003
Figure 4. SLCG_Lrp directly represses transcription of fatty acid metabolic genes. (A) RT−qPCR analysis of fatty acid metabolism genes in LCGL and Δ SLCGL_Lrp. (B) EMSA analysis of SLCG_Lrp with the promoter regions of SLCG_0183, SLCG_2248, SLCG_7061, SLCG_0569, SLCG_0656, SLCG_3109, and SLCG_5774. S: unlabeled specific probe (20-fold); N: nonspecific probe poly dIdC (20-fold). The mean−values of three replicates are shown, with the standard deviations indicated by error bars. * p < 0.05, ** p < 0.01, *** p < 0.001.
Fermentation 09 00396 g004
Figure 5. SLCG_Lrp directly regulates the transcription of five regulatory genes in S. lincolnensis. (A) RT-qPCR analysis of five regulatory genes in LCGL and ΔSLCGL_Lrp. (B) EMSA analysis of SLCG_Lrp and promoter regions of five regulatory genes. S: unlabeled specific probe (20-fold); N: nonspecific probe poly dIdC (20-fold). The mean values of three replicates are shown, with the standard deviations indicated by error bars. * p < 0.05, ** p < 0.01, *** p < 0.001.
Fermentation 09 00396 g005
Figure 6. Lin-A production of S. lincolnensis LCGL and its derivatives. (A) Lin-A yield of LCGL and its five regulatory gene deletion mutants. (B) Lin-A production of LCGL, LCGL/pIB139, and LCGL/pIB139-2185. The mean values of three replicates are shown, with the standard deviations indicated by error bars. * p < 0.05, ** p < 0.01.
Fermentation 09 00396 g006
Figure 7. RT-qPCR analysis of lincomycin biosynthetic genes in LCGL and ΔSLCGL_2185. The mean values of three replicates are shown, with the standard deviations indicated by error bars. * p < 0.05, ** p < 0.01.
Fermentation 09 00396 g007
Figure 8. Lin-A production of S. lincolnensis LA219X and its derivatives. ** p < 0.01.
Fermentation 09 00396 g008
Figure 9. SLCG Lrp−mediated regulatory landscape in S. lincolnensis.
Fermentation 09 00396 g009
Table 1. Bacterial strains and plasmids used in this study.
Strains and PlasmidsDescriptionReference
    E. coli
DH5αF recA lacZM15[21]
BL21 (DE3)F ompT hsdSB(rB mB) dcm gal λ(DE3)Novagen
  S. lincolnensis
LCGLA lincomycin producer with artificially integrated attBΦC31 site[23]
ΔSLCGL_LrpLCGL derivative with SLCG_Lrp deleted[20]
ΔSLCGL_2185LCGL derivative with SLCG_2185 deletedThis study
ΔSLCGL_2388
ΔSLCGL_3009
ΔSLCGL_3141
ΔSLCGL_7585
LCGL derivative with SLCG_2388 deleted
LCGL derivative with SLCG_3009 deleted
LCGL derivative with SLCG_3141 deleted
LCGL derivative with SLCG_7585 deleted
This study
This study
This study
This study
LCGL/pIB139
LCGL/pIB139-2185
LCGL carrying pIB139
LCGL carrying pIB139-2185
This study
This study
LA219X
LA219X/pIB139-2185
LA219X/pIB139-2185-Lrp
A lincomycin high-yield strain with artificial integrated attBφC31 site
LA219X carrying pIB139-2185
LA219X carrying pIB139-2185-Lrp
[23]
This study
This study
    Plasmids
pKC1139ori (pSG5), aac(3)IV, lacZ[24]
pKC1139-Δ2185pKC1139 derivative containing two 1.8 kb fragments, the upstream and downstream regions of SLCG_2185This study
pKC1139-Δ2388pKC1139 derivative containing two 1.8 kb fragments, the upstream and downstream regions of SLCG_2388This study
pKC1139-Δ3009pKC1139 derivative containing two 1.8 kb fragments, the upstream and downstream regions of SLCG_3009This study
pKC1139-Δ3141pKC1139 derivative containing two 1.8 kb fragments, the upstream and downstream regions of SLCG_3141This study
pKC1139-Δ7585pKC1139 derivative containing two 1.8 kb fragments, the upstream and downstream regions of SLCG_7585This study
pIB139
pIB139-2185
pIB139-2185-Lrp
φC31 attP-int locus, acc(3)IV, oriT, PermE*
pIB139 carrying an extra SLCG_2185 for gene overexpression
pIB139 carrying an extra SLCG_2185 and SLCG_Lrp for gene overexpression
[20]
This study
This study
pET28aT7 promoter, His-tag, kanNovagen
pET28a-LrppET28a-derived plasmid carrying SLCG_Lrp[20]
Disclaimer/Publisher’s Note: The statements, opinions and data contained in all publications are solely those of the individual author(s) and contributor(s) and not of MDPI and/or the editor(s). MDPI and/or the editor(s) disclaim responsibility for any injury to people or property resulting from any ideas, methods, instructions or products referred to in the content.

