Article

Modelling of Catechin Extraction from Red Grape Solids under Conditions That Simulate Red Wine Fermentation

by
Judith Unterkofler
1,2,
David W. Jeffery
1,2,
Patrick C. Setford
2,†,
Jean Macintyre
1,3 and
Richard A. Muhlack
1,2,*
1
Australian Research Council Training Centre for Innovative Wine Production, The University of Adelaide, PMB 1, Glen Osmond, SA 5064, Australia
2
School of Agriculture, Food and Wine and Waite Research Institute, The University of Adelaide, PMB 1, Glen Osmond, SA 5064, Australia
3
Pernod Ricard Winemakers, 1914 Barossa Valley Way, Rowland Flat, SA 5352, Australia
*
Author to whom correspondence should be addressed.
Current address: Asahi Beverages, 58 Queens Bridge St., Southbank, VIC 3006, Australia.
Fermentation 2023, 9(4), 394; https://doi.org/10.3390/fermentation9040394
Submission received: 22 February 2023 / Revised: 14 April 2023 / Accepted: 18 April 2023 / Published: 19 April 2023

Abstract

:
Digital control systems are well established in many industries and could find application in the wine sector. Of critical importance to red wine quality, the efficient and targeted extraction of polyphenols from red grape solids during alcoholic fermentation could be a focus for automation. Smart technologies such as model predictive control (MPC) or fuzzy logic appear ideal for application in a complex process such as wine polyphenol extraction, but require mathematical models that accurately describe the system. The aim of this study was to derive and validate a model describing the extraction of catechin (a representative polyphenol) from red grape solids under simulated fermentation conditions. The impact of ethanol, fermentable sugar, and temperature on extraction rate was determined, with factor conditions chosen to emulate those present in industry practice. A first-order approach was used to generate an extraction model based on mass conservation that incorporated temperature and sugar dependency. Coefficients of determination (R2) for all test scenarios exceeded 0.94, indicating a good fit to the experimental data. Sensitivity analysis for the extraction rate and internal cross-validation showed the model to be robust, with a small standard error in cross-validation (SECV) of 0.11 and a high residual predictive deviation (RPD) of 17.68. The model that was developed is well suited to digital technologies where low computational overheads are desirable, and industrial application scenarios are presented for future implementation of the work.

1. Introduction

Grape and wine production is a key industry sector for Australia, with 713 million litres of red wine produced in 2022 accounting for 54.5% of the nation’s total wine production [1]. Continued innovation is an important part of the sector’s ongoing success; however, Australia’s warm climate provides challenges in terms of optimal fermentation performance, including the maceration phase of red winemaking. Together with economic and environmental challenges and the fact that grapes are a natural and ever-changing raw material, there is a need to develop greater understanding of the extraction processes occurring during red winemaking to enhance quality control of the process and the final wine quality [2].
Implementation of automated digital control systems such as so-called “smart” controllers provides an established way of ensuring a stable and efficient process, decreasing labour and material costs, controlling product quality, and facilitating plant (i.e., machinery and equipment) availability [3]. The latter is especially relevant considering the periodic and compressed nature of winemaking operations. Model predictive control (MPC) is one potential strategy that could be applied to winemaking; it is an approach to engineering process control that has been employed since the late 1970s in various process industries [3]. MPC is used to predict future system behaviour by monitoring process parameters that the model is based upon, with outcomes used as the basis for the development of a process-control strategy. Despite its history in process industries, MPC is relatively new in manufacturing [4] with few studies investigating its use in fermentation—for example, to control the fermentation process overall [5] or the temperature during wine fermentation specifically [6].
An alternative method to implement an extraction model is fuzzy logic. Fuzzy logic can be useful for implementing processes that are difficult to model or have complex behaviour. This type of control method would allow for the adjustment of extraction parameters by evaluating the degree of membership of input variables to specific linguistic categories [7].
Another relatively new approach in process control is the use of artificial intelligence (AI), more specifically machine learning (ML). ML uses large sets of previously collected data to build a model, which is then coupled with in-line measurements to predict future values and react accordingly [7]. However, as there are currently no commercially available sensors for in-line measurement of phenolic content, there is neither training data for a machine learning system nor data to react to in a process-control system.
Apart from the obvious requirement to efficiently convert fermentable sugars into alcoholic beverage during yeast fermentation, a number of extraction processes also occur that are critical to wine quality and which would benefit from targeted process control. Several quality indicators in red wine relate to the concentration of various polyphenols which can impact the perception of body, astringency, bitterness, and colour [8]. From a mouthfeel and colour stability perspective, polymeric proanthocyanidins, also known as condensed tannins, are one of the most important classes of polyphenols found in red wine. They can be found in varying concentrations (depending on grape variety) and are extracted from grape solids (skin and seeds) into the wine during fermentation [2,9,10].
While extraction models for wine polyphenols such as anthocyanins have already been developed [11,12,13,14], similar understanding of factors affecting extraction of other polyphenols during alcoholic fermentation is lacking. Therefore, catechin, a model proanthocyanidin for wine quality, was chosen for this study. Tannin and flavonoid extractions have been described to an extent [15,16], with a study showing that the tannin content in grapes has no direct relationship to the tannin content of the corresponding wine [17]. Modelling has shown that the extraction process for malvidin-3-glucoside from red grape solids is dependent on fermentation parameters such as temperature, alcohol, and sugar content [12]. While sugar and alcohol parameters logically change over the course of the fermentation process, temperature is a key parameter that can directly be altered with a process-control system. Indeed, wineries often use closed loop control systems that can cool and/or heat a must (i.e., grape juice and solids) [18]. However, adjustment of this manipulated variable for the purpose of extraction control is not automated. As there are no in-line polyphenol measurements commercially available for the wine industry at the moment, physical samples must be collected from a fermentor (typically undertaken every 12 h), evaluated sensorially by winery personnel, and then, if deemed necessary, subjected to further laboratory analysis. Manipulation of the fermentation temperature set point may then occur if these subjective measures indicate that extraction is not occurring as expected. Therefore, providing further understanding and predictive capability in relation to the extraction of polyphenols and the effects of manipulating factors would be a great benefit to industrial practice.
Currently, two different approaches have been used to model polyphenol extraction of relevance to red winemaking. The first can be characterised as a microscopic method, describing every step of the extraction in detail based on Fick’s second law (a partial differential equation) and where mass transfer parameters are defined by environmental conditions [11,12,13]. The microscopic approach, which models the fermentation process at the cellular level, is excellent due to its ability to provide a high level of detail and accuracy. However, while the microscopic approach may provide valuable insights into the fermentation process, computational requirements and microscopic model complexity can limit the scope of its application for an industrial control system. The second approach is a macroscopic method based on exponential growth functions [15,19], one of the most important and widely occurring functions in physics and biology [20]. Models proffered by Zanoni et al. [19] and Boulton et al. [15] describing the extraction of polyphenols during red must fermentation have shown that first-order models can provide a good fit, albeit with the simplifying assumption of defining the extraction rate constant k as a fixed value over the course of a whole fermentation. In the study by Zanoni et al., however, extraction rates for total phenol content between different vinifications varied by 155% without explanation [19]. More recently, Miller et al. [16] developed an extraction mechanistic model that described anthocyanin and tannin extraction solely dependent on temperature and did not take the degree of fermentation into account. This contrasts with the results of Setford et al. [12], who showed that glucose and ethanol concentrations have a demonstrable physical effect on diffusion properties for malvidin-3-glucoside, which would be expected to similarly influence extraction in the present system.
The aim of this study was to address these gaps by using the macroscopic approach to develop a simple model that predicts the extraction of catechin depending on temperature and extent of fermentation that can later be implemented into a smart process-control system. The extraction of catechin in different solutions imitating different degrees of red wine fermentation from cold maceration of grape must to finished red wine was described. A simple mathematical model describing the extraction of catechin and its influencing factors was derived and compared with experimental extraction experiments, with discussion provided on the suitability of this approach for model predicted control of industrial-scale wine fermentation.

2. Materials and Methods

2.1. Experimental

2.1.1. Simulated Catechin Extraction—Experimental Design

Aspects of this experiment setup have already been reported by Setford et al. [12]. Briefly, fresh Merlot grapes were crushed and drained. Model solutions containing the isolated grape solids (primarily seed and skin) were held in different temperature-controlled rooms to replicate maceration of grape solids in juice and fermented wine, with inclusion of a centre point to represent fermentation that was 50% complete. Each condition was conducted in duplicate with the centre point consisting of four replicates (to improve the accuracy of model fit). Different stages of fermentation were simulated with aqueous solutions containing three different levels of sugar or alcohol (0 g/L, 133 g/L, 266 g/L glucose and 0% v/v, 7% v/v, 14% v/v ethanol; centre point = 133 g/L glucose and 7% v/v ethanol). These levels are referred to in the remainder of the manuscript as “low”, “medium” and “high”. Three different temperatures (notionally, 0 °C, 10 °C and 20 °C) were targeted to approximate different stages of maceration and fermentation (including cold-soaking), with cool room temperature controllers set accordingly. These levels are also designated in our experimental design as “low”, “medium” and “high”. Data logging over the course of the experiment showed actual air temperatures of 4.4 °C, 12.2 °C and 23.1 °C, respectively, which were deemed representative of industry conditions and subsequently used for all mathematical modelling.

2.1.2. Preparation of Grape Solids

The treatment of the Merlot grapes has been previously reported by Setford et al. [12], whereby grapes were harvested by hand on 24 February 2016 and then briefly held as fresh grapes in cold storage at 4 °C prior to processing. Fresh grape bunches were manually selected and destemmed, and a total of 9.05 kg of fresh grapes were crushed using a stainless steel hand plunger. The juice was then separated from the berry solids with a 4.4 L hand-operated stainless steel basket press. The total mass of the collected grape solids was 4 kg and the volume of the remaining grape juice was 4.55 L, resulting in a solid-to-liquid ratio of 0.88 kg L−1, with total soluble solids of 14.3° Baumé, pH 3.6, and titratable acidity (to pH 8.2) of 3.9 g L−1.

2.1.3. Solid–Liquid Extractions

As reported by Setford et al. [12], immediately after crushing the grapes, 150 g of the fresh grape solids were weighed out and added to 2 L extraction vessels. To limit the reaction of proanthocyanidins and other extracted compounds, a lower solid–liquid ratio than contained in a typical red wine fermentation was utilised. Approximately 48 h prior to the grape crushing and pressing, the extraction solutions were prepared and stored in the respective temperature-controlled rooms to equilibrate them to ambient temperatures. To each 2 L vessel containing grape solids, 1.5 L of the liquid solution were added based on the experimental design to begin the extraction process. Each treatment was continuously stirred at a speed of approximately 300 rpm to achieve a well-mixed homogenous system and exclude mixing as an extraction-enhancing parameter. Stirrers were built in-house purposely for this experiment using a Powertech MP3209 12 V motor speed controller connected directly to a Powertech YM2718 12 V 6500 rpm DC motor (Jaycar Electronics, Adelaide, Australia), which was coupled to a 6 cm-diameter stainless steel four-bladed ribbon anchor-type stirrer. Samples of 10 mL were taken throughout the extraction process during the first three days, when most of the extraction takes place. More frequent samples were taken within the first 24 h of the extraction to generate more appropriate concentration curves. Ultimately, samples were taken after 1, 3, 6, 10, 16, 22, 28, 34, 41, 48, and 69.5 h. Samples were immediately centrifuged at 3220 rcf for 10 min and the supernatant was removed and stored at −20 °C until analysis by HPLC. The extraction trials were carried out in February and March of 2016.

2.1.4. Catechin Quantification

Samples from the extraction experiments were thawed under ambient conditions, centrifuged at 9300 rcf, and 1.5 mL of supernatant was transferred to amber HPLC vials for analysis as described by Setford et al. [12]. Briefly, an Agilent 1100 HPLC system was used with a Synergi Hydro-RP column (150 mm × 2 mm, 4 µm particle size, Phenomenex, Lane Cove, NSW, Australia) and 20 µL injection volume, with chromatograms recorded at 280 nm to quantify catechin. An external 6-point calibration curve of catechin (analytical grade, Sigma-Aldrich, Castle Hill, NSW, Australia) was prepared and analysed in the same batch as the samples. Data acquisition and processing were performed using Agilent ChemStation software (version B.01.03).

2.2. Extraction Model Development

As previously discussed in the introduction, research has demonstrated that first-order models can provide a good fit for polyphenol extraction, although they do not account for the main dependencies of the extraction rate. Hence, the model presented herein was developed to allow the rate constant k to vary based on external parameters of temperature, ethanol concentration, and glucose concentration, thereby addressing the perceived limitations of the other wine extraction studies mentioned that utilise a first-order approach.
In contrast to the microscopic approach of Setford et al. [12] to describe extraction (which uses a partial differential equation [21] based on Fick’s second law of diffusion [11]), the present work used a macroscopic approach for catechin extraction during wine fermentation based on principles of mass conservation [22]. The process of diffusion describes the movement of molecules at the microscopic level based on their kinetic energy. The average kinetic energy of a molecule is proportional to temperature, which explains the temperature dependence of extraction [23]. The conservation of mass approach is based on the number of catechin molecules that are extracted and thus have to pass into the liquid phase. Cussler [22] stated that diffusion models and mass conservation models are directly linked, with the choice of model depending on application suitability. In the present case, catechin was extracted into the liquid (C) from grape skin and seed (pomace, P) with extraction rate constant k:
P k C .
P0 denotes the extractable amount of catechin in grape skin and seed at the beginning, and P(t) denotes the amount at time t. The total amount of catechin in grape skin and seed is hence P0 +  P(t). The amount of catechin extracted in the liquid is denoted by C(t). The instantaneous change in quantity over time is assumed proportional to the quantity currently present, with the proportionality provided by the extraction rate constant k [22], which is independent of time but varies for different values of temperature [23] and solvent concentrations (ethanol) [24]. Due to the conversion of sugar into ethanol during alcoholic fermentation [15], concentrations of these two components are directly connected. With these notations and assumptions, the symbolic Equation (1) can be formulated through the following first-order system of ordinary differential equations (ODEs) with initial values P0 and C0 at t = 0.
d P t d t = k P t ,   where   P 0 : = P 0 > 0 ,
d C t d t = k P t ,   where   C 0 : = C 0 0 .
The solution of differential Equation (2) is
P t = P 0 e k t .
Inserting this solution into Equation (3) and integrating yields
C t = P 0 e k t + d .
The integration constant d is determined at t = 0 as d = C0 + P0:
C t = C 0 + P 0 1 e k t .
Introducing C (= C0 + P0), this solution can be rewritten in the form of
C t = C 0 + C C 0 1 e k t .
Equation (4) shows that extractable catechin amount, P(t), degrades exponentially from P0 to zero with rate k, and Equation (7) shows that the extracted catechin amount, C(t), increases from C0 to the maximal value C accordingly with the degradation of P(t). There are three free parameters (k, C0 and C) for fitting the curve C(t) with measured data. Adding Equations (2) and (3) shows that the sum P(t) + C(t) = P0 + C0 = constant = C. This demonstrates that the law of mass conservation is fulfilled. In an ideal experiment, C0 is zero and practically it is close to zero, such that C is equal to P0. Usually, only the concentration of a substance in solution is measured rather than its total mass. The catechin concentration C ˜ t in the solution is hence provided by
C ˜ t : =   C t V l ,
where Vl is the fixed volume (1.5 L in these experiments). The loss by periodically removing samples is neglected as this volume (10 mL) was notably lower than the total volume overall.
The amount P0 (≈ C) that can be extracted depends on temperature and ethanol concentration [25,26]. As sugar is fermented into alcohol, the concentrations of these two components are dependent on each other in a real wine fermentation, but considering that the objective of this study was to develop a model for future control system application, only one of these needs to be included in the model. Since sugar/glucose measurements are already routinely collected by wineries for monitoring fermentation progress, the rate constant k was investigated in dependence of temperature (T) and glucose concentration (G). Equation (7) corresponds to equations stated for flavonoid extraction derived from grape skin by Boulton et al. [15] and total phenolic content by Zanoni et al. [19]. However, unlike those studies where k was taken to be a fixed value, k was assumed here (from work by Setford et al. [12]) to vary based on temperature T and glucose concentration G, which defines a function k of these two variables. This function was then approximated by a Taylor polynomial of second order and coefficients were computed by fitting. This will yield different mathematical solutions of function C(t) for different values of k. Dimensionless temperature and glucose concentrations (Table 1 and Table 2) were used to preserve dimensional consistency as shown by respective Equations (9) and (10):
T ˜ : = T T 0 T 0 T 0 ,
G ˜ : = G G 0 G 0 G 0 ,
with T0 and G0 being defined as the centre point of the system at the medium temperature condition (12.2 °C).
For every fixed pair of values ( T ˜ , G ˜ ), a value for k was then obtained by the fit using Equation (7). Then, the function k ( T ˜ , G ˜ ) can be fitted with these values for k using Equation (11). Using the collected data for k, the constants c1 to c6 can be computed by non-linear regression:
k T ˜ ,   G ˜ = c 1 + c 2 T ˜ + c 3 G ˜ + c 4 T ˜ 2 + c 5 G ˜ 2 + c 6 T ˜ G ˜ .
C ˜ , the maximal extractable catechin concentration, is also dependent on the temperature and glucose concentration [25], hence a Taylor polynomial of second order was again used, with parameters likewise determined by non-linear regression:
C ˜ T ˜ ,   G ˜ = d 1 + d 2 T ˜ + d 3 G ˜ + d 4 T ˜ 2 + d 5 G ˜ 2 + d 6 T ˜ G ˜ .

2.3. Model Fitting and Statistical Analysis

The fitting of k and C ˜ ∞ from Equation (7) was performed in Matlab (version R2018b) using the cftool function with a least squares algorithm [27]. Given a number of data points, the least squares algorithm computes the shape of a function that best fits those data points. The sum of the distances of the data points to the function is minimal [27,28]. Model fitting of Equations (11) and (12) was undertaken in Matlab by applying the Levenberg–Marquardt algorithm [29] for non-linear regression via code due to the limited number of data points. It can be used to solve non-linear least squares problems [27].
For each of the experimental data sets, a coefficient of determination (R2) and root mean square error (RMSE) were calculated:
R M S E = 1 N i = 1 N C p r e d , i C o b s , i 2 ,
R 2 = 1 i = 1 N C p r e d , i C o b s , i 2 i = 1 N C p r e d , i C ¯ o b s , i 2 ,
where N is the number of replicates, C p r e d , i is the concentration predicted by the model,   C o b s , i is the experimentally observed concentration, and C ¯ o b s , i is the mean of the observed concentrations [30].
The formula obtained in Equation (14) was employed as this is a commonly used and widely accepted formula in regression analysis and was chosen because it provides a measure of the proportion of variance in the dependent variable that is explained by the independent variable [30].
Model robustness was evaluated via a sensitivity analysis [31] by adjusting k by different percentages (10%, 30%, and 50%), re-running the model with the adjusted values, and recalculating the R2.

2.4. Control System Design

Control system design is defined as the process of creating a mathematical model that describes the behaviour of a physical system or process, which can then be used to design a control system to regulate or optimise that system or process using mathematical equations to represent the input–output relationship of the system and identifying the relevant control variables and control strategies that can achieve the desired system behaviour [32]. Control system design and associated modelling involves both identification and validation phases. The identification phase is the process of creating a mathematical model that describes the behaviour of a physical system or process based on experimental data. This typically involves selecting an appropriate model structure, estimating model parameters, and evaluating the goodness of fit between the model and experimental data. The validation phase involves assessing the performance of the identified process model under new conditions to ensure that it accurately represents the behaviour of the control system or process. This may involve testing the model under different input conditions, comparing model predictions with experimental data, and assessing the model’s sensitivity to modeling assumptions and parameter values [33].
The identification phase of this study involved the creation of a mathematical model based on experimental data. Subsequently, the validation phase was conducted using internal cross-validation, which is a widely recognised technique for assessing the performance of a model using the same data set that was utilised for training the model. This approach entails dividing the data into several subsets, reserving one subset for validation and employing the remaining subsets for training purposes. The model was then trained and evaluated multiple times, with each subset being utilised as the validation set. This technique is effective in preventing overfitting and providing an approximation of the model’s overall performance in real-world scenarios [34]. To assess the performance of the model in predicting the data, the coefficient of determination in calibration (R2cal), the standard error in cross validation (SECV), and the residual predictive deviation (RPD) were calculated. The RPD is calculated as the ratio of the standard deviation of the reference (experimental) values to the SECV. A robust model is indicated by a relatively high RPD value compared to that of the SECV [35].

3. Results and Discussion

3.1. Experimental Catechin Extrction and Model Performance

The extraction of catechin from fresh Merlot grape solids was examined at different temperatures in simulated juice (sim-juice), mid-ferment (sim-mid-ferment), and wine (sim-wine) conditions. A summary of the experimental conditions and associated model parameters is provided in Table 3. Extracted Catechin amounts for simulated juice, simulated wine and simulated mid-ferment conditions can be found in Supplementary Material (Table S1–S3).
Model fit was assessed from R2 and RMSE values obtained from the experimental data as described in Equations (13) and (14). Small RSME values and R2 > 0.94 were observed in all cases (Table 3).
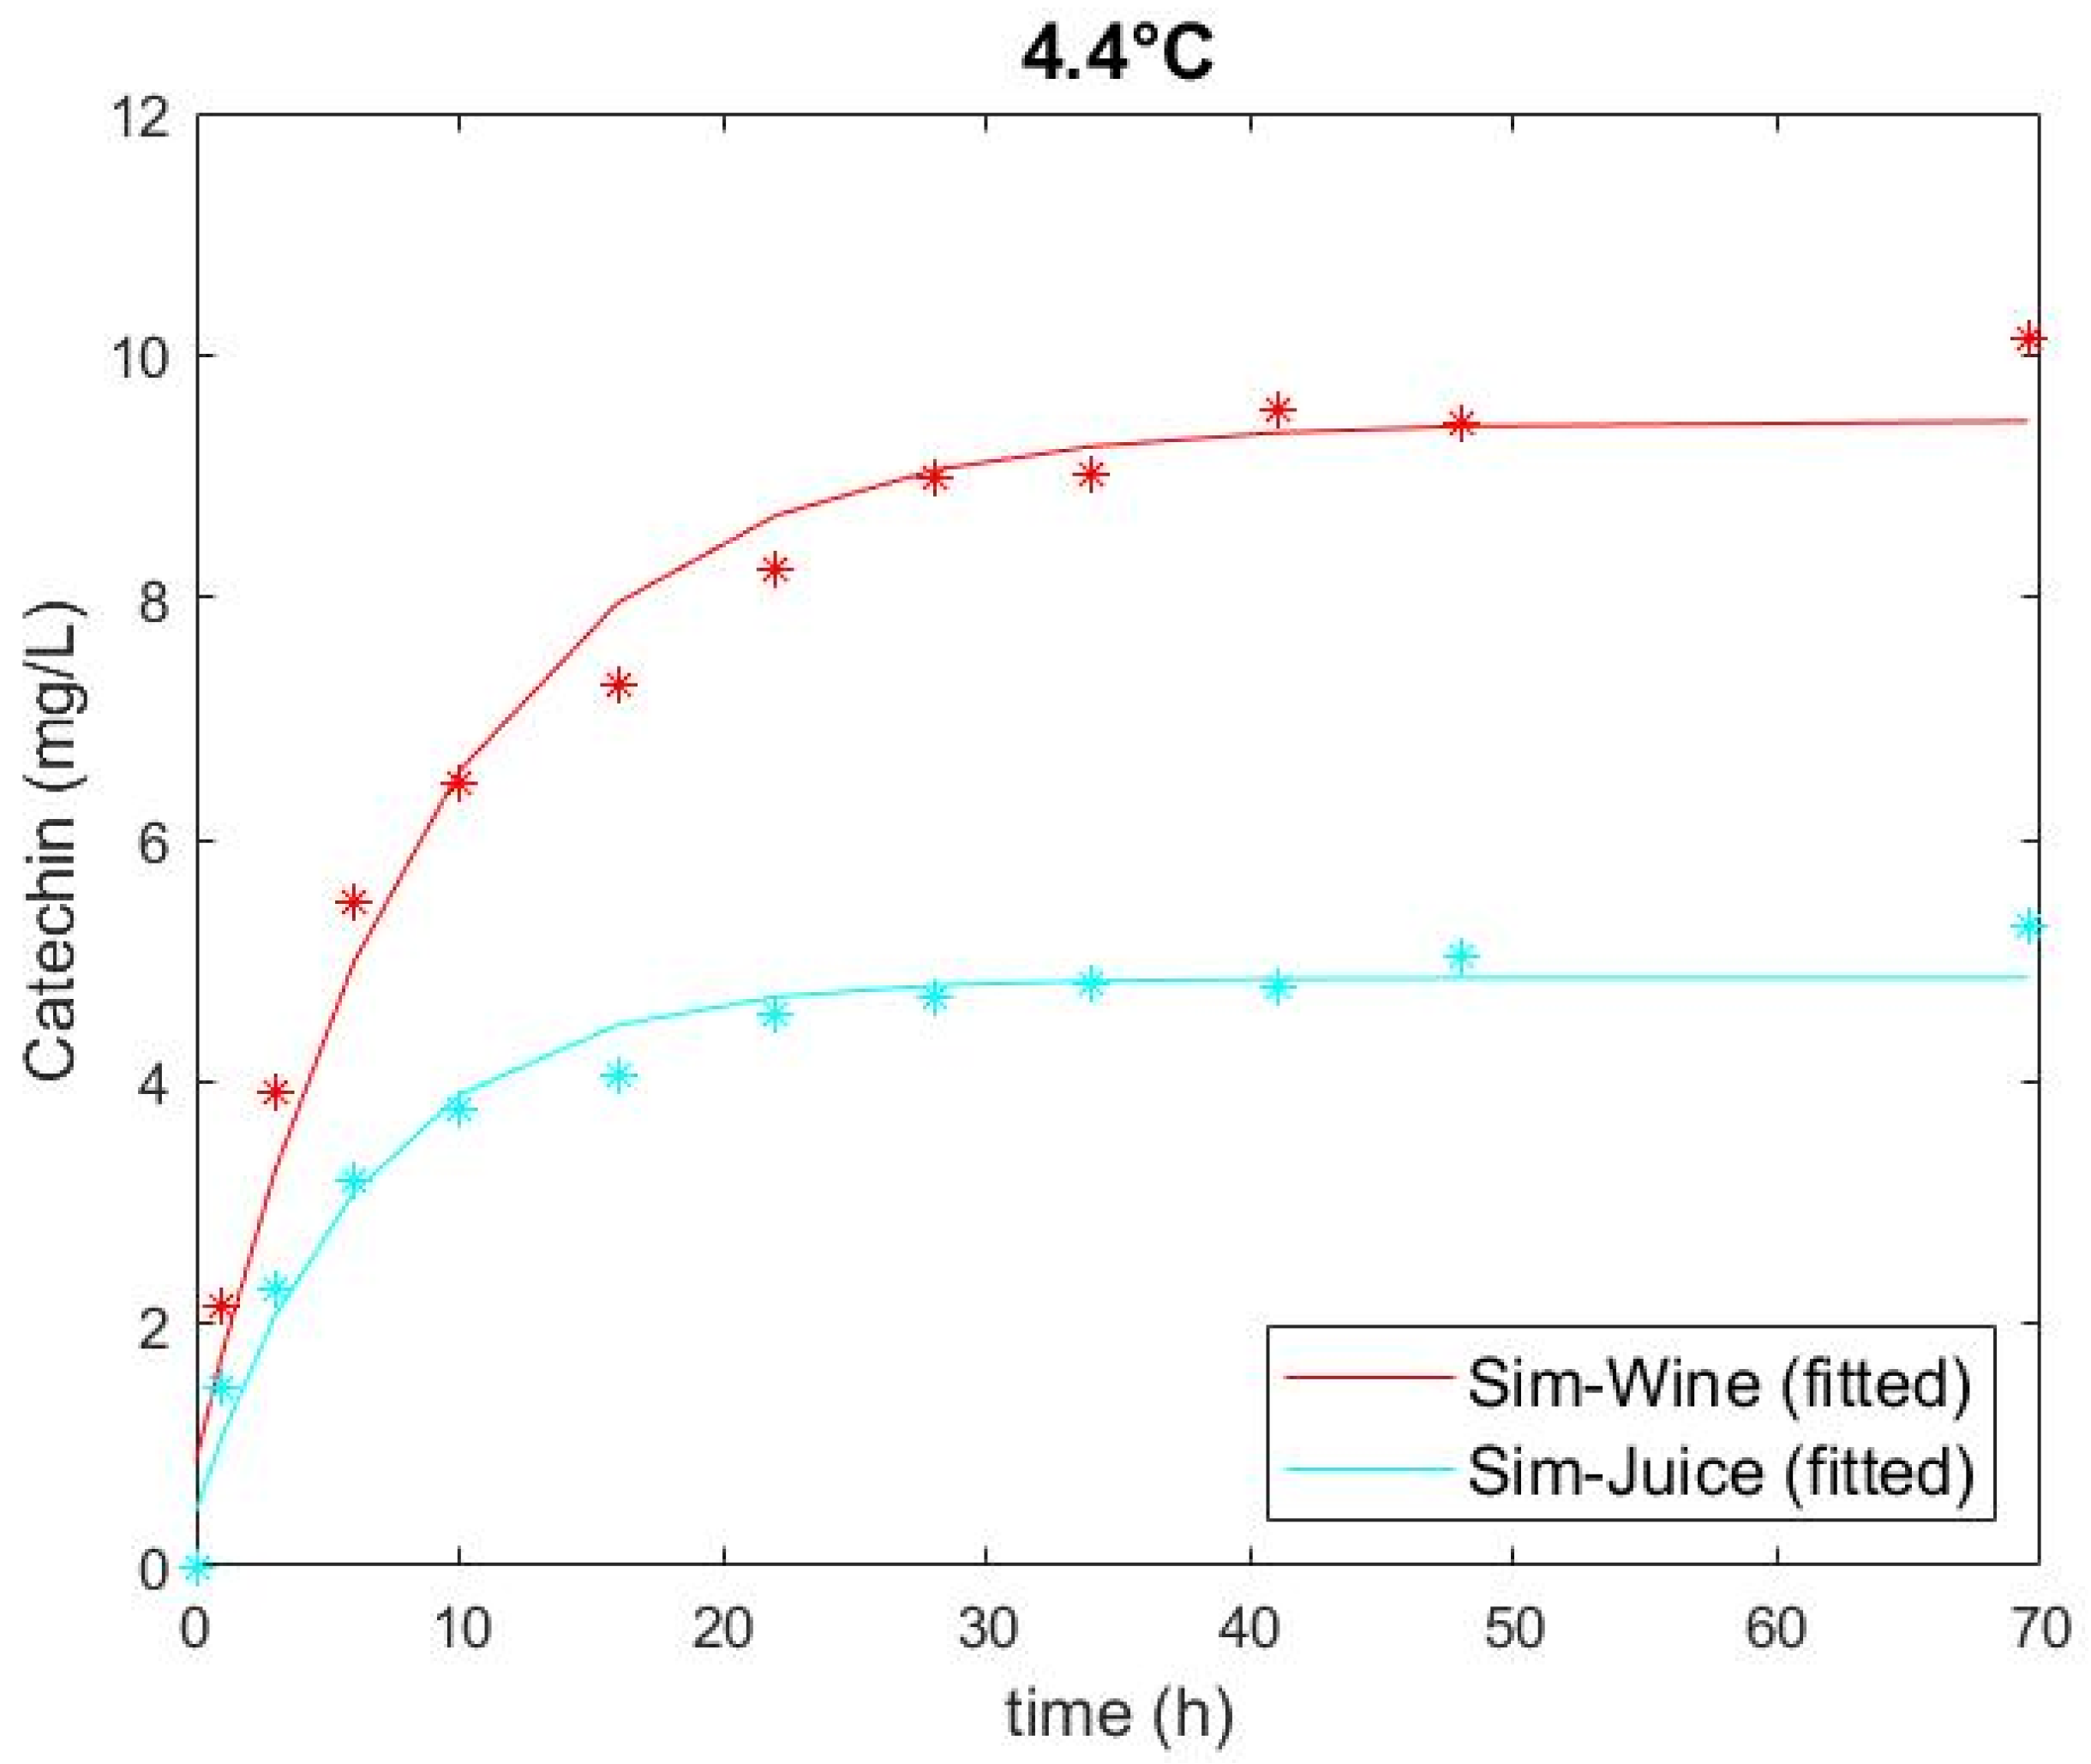
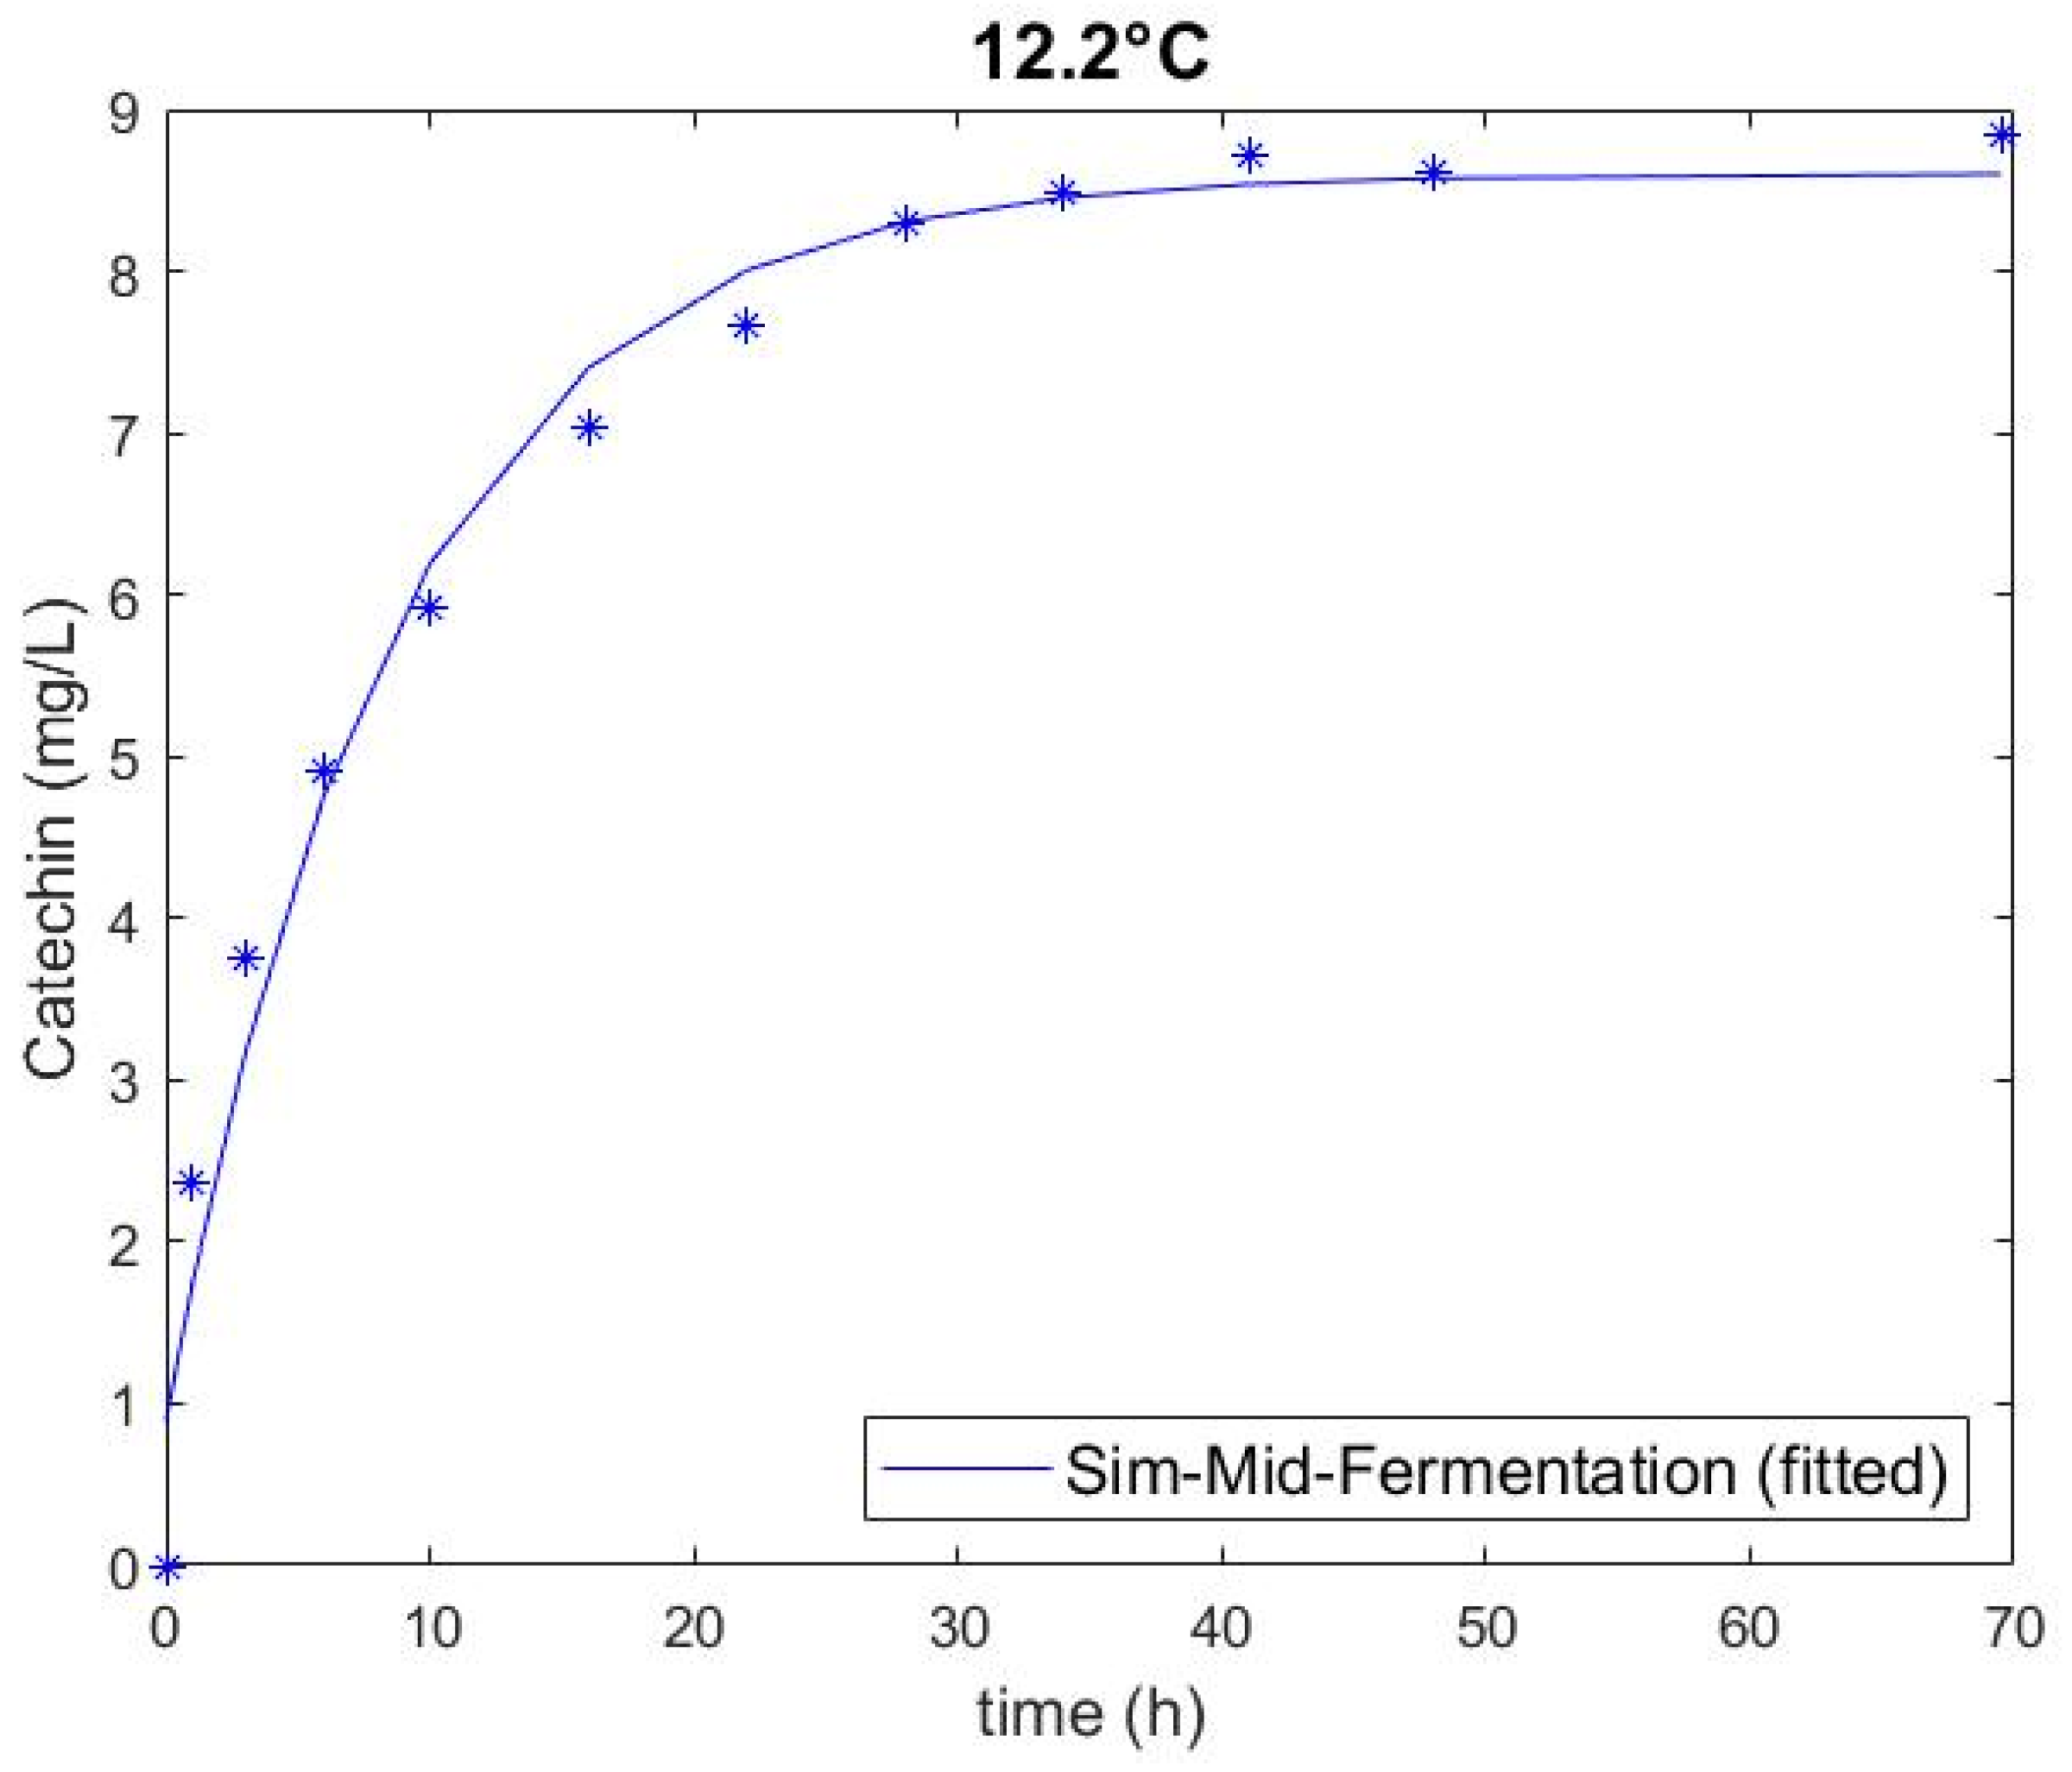
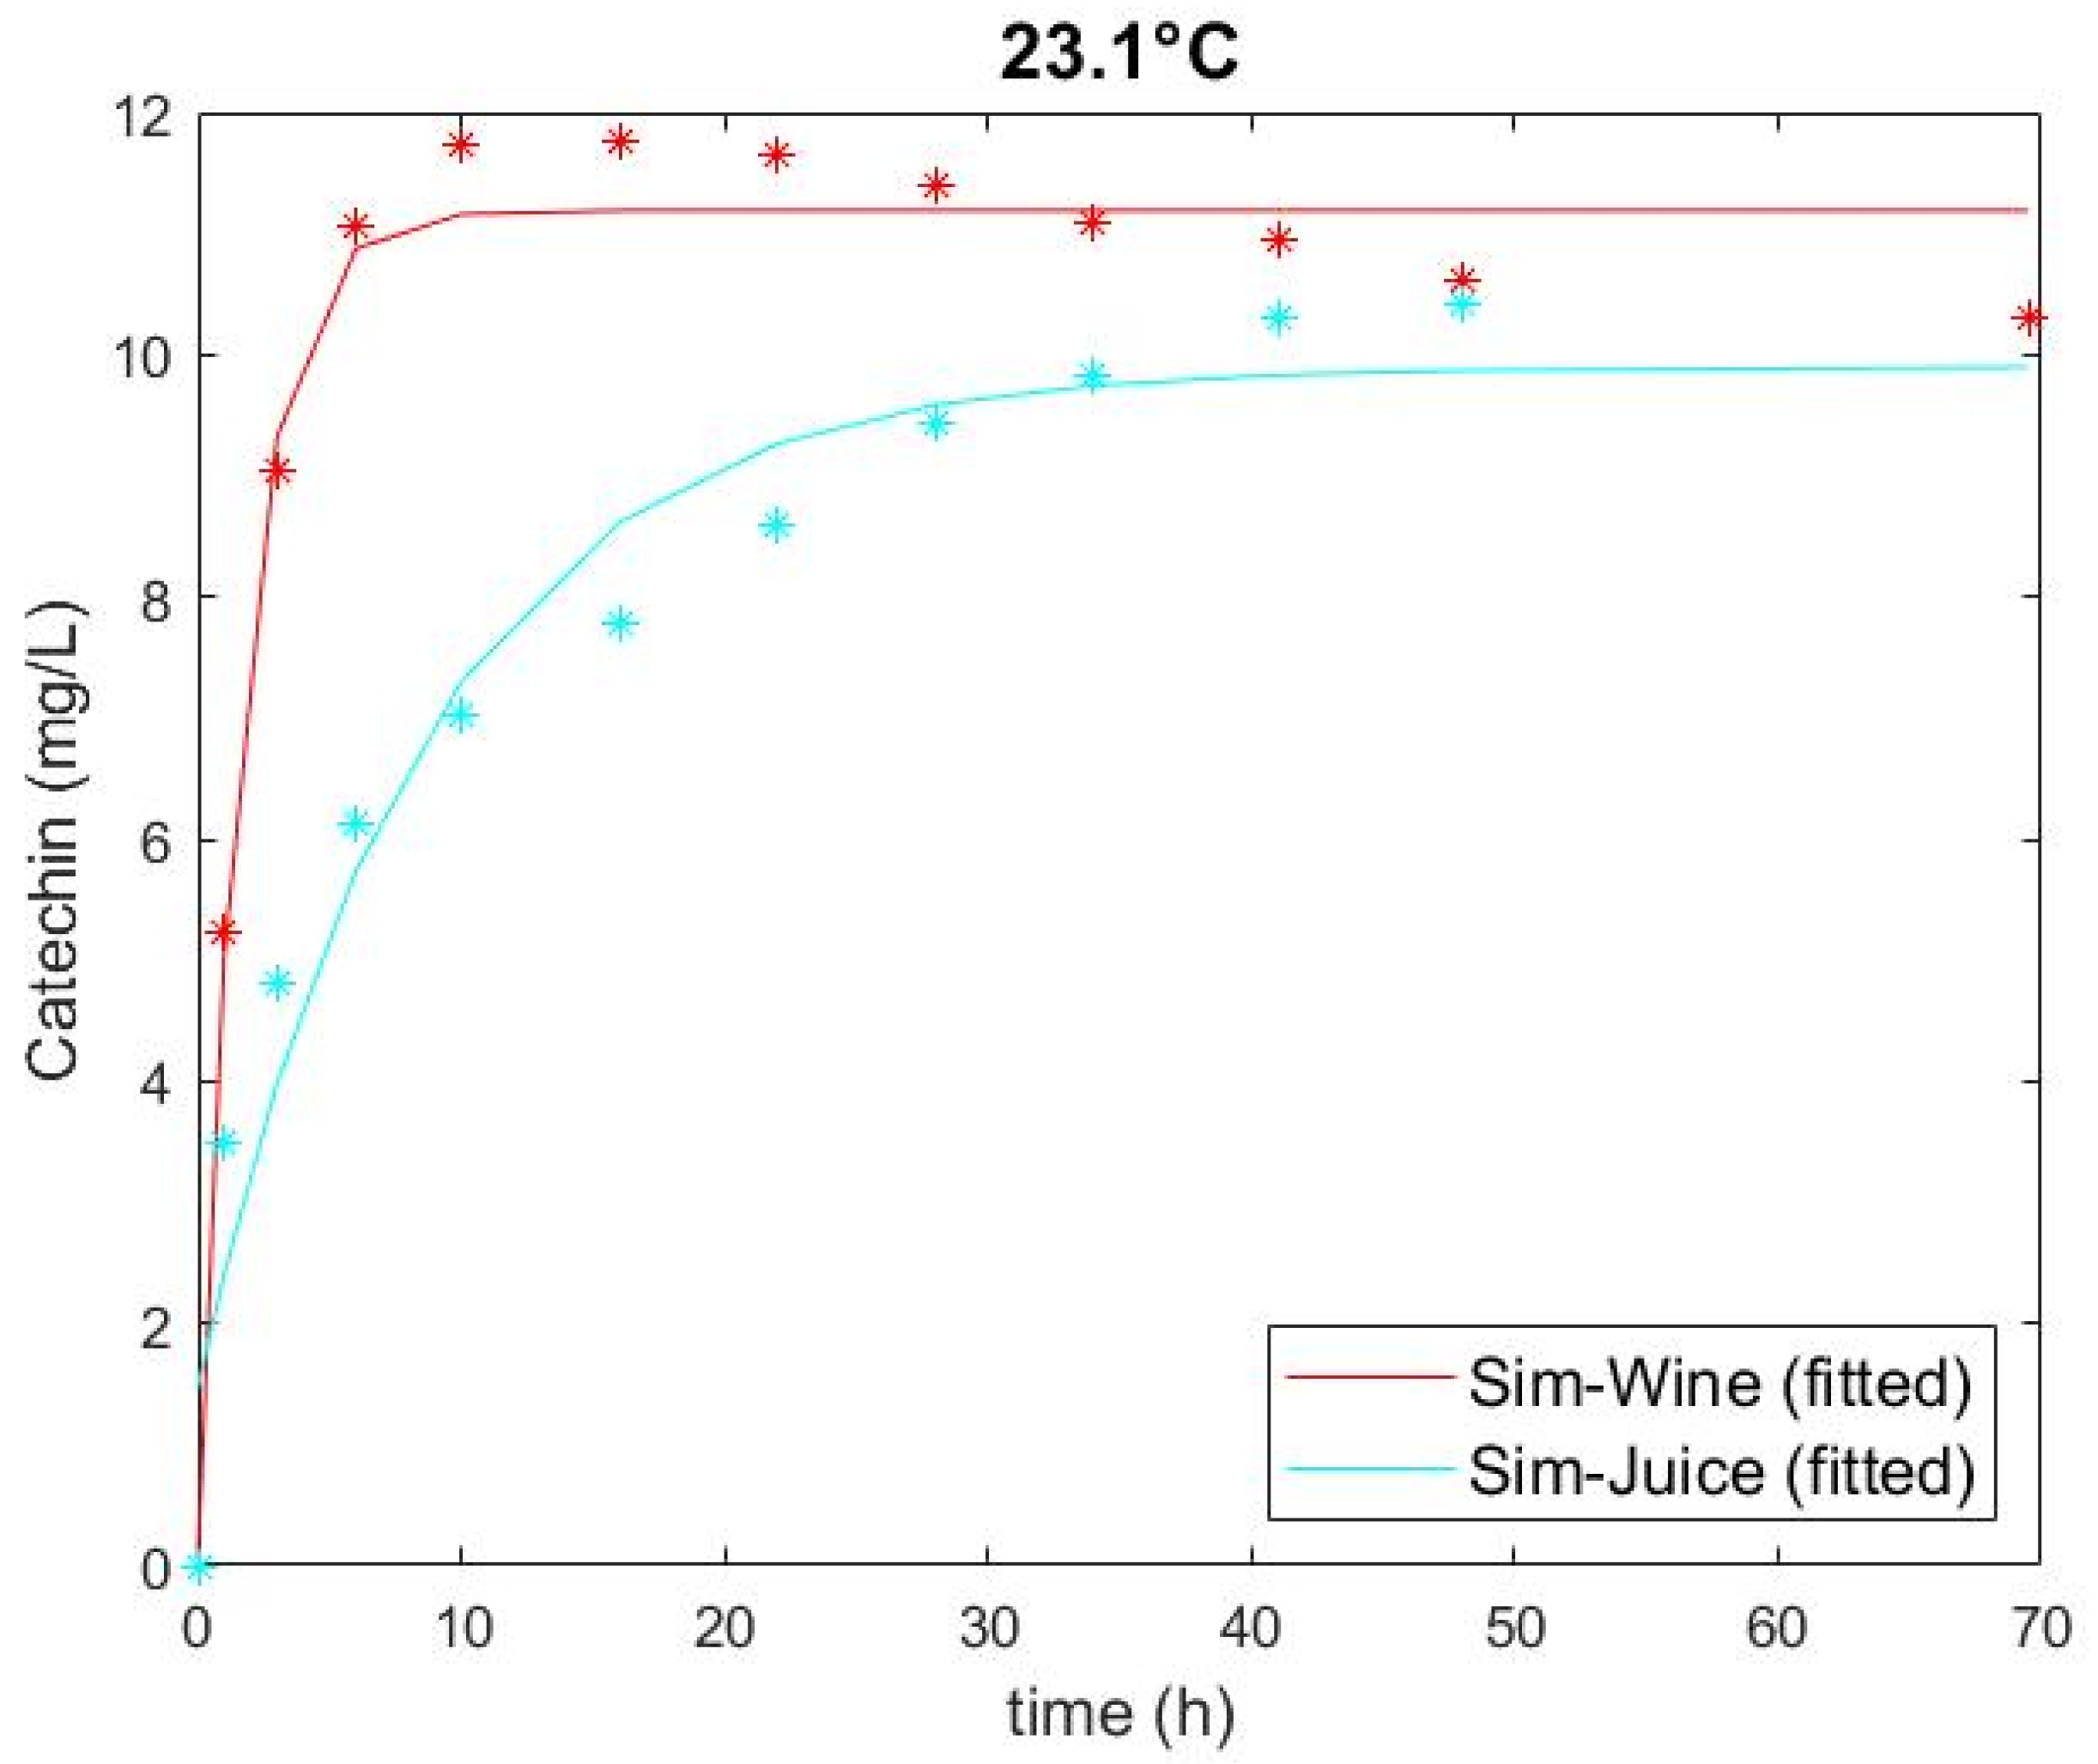
Extracted catechin amounts obtained through the experiment and predicted through the model are plotted in Figure 1, Figure 2 and Figure 3 and show a good fit. The two highest extraction rates were achieved at the highest temperature for conditions with a low glucose (i.e., high ethanol) and a high glucose solution (Figure 3), highlighting that temperature had the greatest impact on extraction of all factors of the experiments. This observation corresponds with the data of Setford et al. [12] for the extraction of malvidin-3-glucoside. There is also a clear distinction between solutions containing high and low glucose (i.e., low and high ethanol), which can be ascertained by comparing Figure 1 and Figure 3. Extraction in simulated wine was higher at both temperatures than that in simulated juice. The standard error of the duplicate/quadruplicate data sets was between 0.25 and 0.53 mg/L of catechin, with an average error of 7% over all data sets.
The figures also show that the curves for the extracted amount of catechin have approached an asymptotic maximum over the course of the experiments, indicating an adequate experiment runtime. As seen in Figure 3, the model fit appears to be inferior for the high temperature as it underpredicts catechin extraction in simulated wine at earlier time points. Subsequently, the curve decreases, likely due to reactions such as oxidation or polymerisation with other compounds [8,15,36]. Nonetheless, an R2 of 0.98 and a small RSME for these conditions indicate an appropriate model fit. The extraction curve for simulated juice at high temperature showed similar behaviour, but likewise had a favourable R2 of 0.94 and a small RSME, demonstrating a satisfactory fit overall.
Previous work characterised the extraction of malvidin-3-glucoside (a polyphenol important to red wine colour) as a first-principles mass-transfer model based on Fick’s second law (a partial differential equation). However, as mentioned in the introduction, this approach is computationally demanding, making it less suitable for future incorporation into a process-control system [11,12,13]. To address this shortcoming, the macroscopic model used in the present study describes the extraction of catechin as a first-order process, which is an approach consistent with other wine-related extraction studies by Zanoni et al. and Boulton et al. [15,19], as well as those focused on other extraction phenomena, including coffee [37] and essential oil [38]. The study of Meziane et al. [38], which compared various modelling approaches to describe 132 essential oil extraction kinetic curves, concluded not only that a simple first-order model showed a good fit (R2 of 0.98 in more than 91% of the cases), but also that the more complex models converged to the first-order model after a short time. According to Simonin, first- and second-order rate laws are both valid to describe reaction kinetics; however, second order is unable to describe steep extraction rates in short times [39] as seen in the current experiments. Previous models used in other wine-related extraction studies, however, do not account for any dependencies of the extraction rate.
As discussed in Section 2.2, the dependence of the rate constant k on T and G was described using a Taylor polynomial of second order according to Equation (11). In the same manner, the maximum extracted catechin concentration as a function of glucose and temperature was also determined (Equation (12)). Table 4 and Table 5 show the fitted Taylor coefficients c1 to c6 describing the extraction rate k, and d1 to d6, describing the maximum extracted catechin C ˜ ∞.
Inserting the values from Table 4 into Equation (11) yields
k T ˜ ,   G ˜ = 0.116 + 0.090 T ˜ 0.087 G ˜ + 0.225 T ˜ 2 0.021 G ˜ 2 0.170 T ˜ G ; ˜
performing the same with values from Table 5 and Equation (12) yields
C ˜ T ˜ ,   G ˜ = 8.603 + 2.07 2 T ˜ 1.61 0 G ˜ + 0.544 T ˜ 2 0.344 G ˜ 2 + 1.079 T ˜ G ˜ .
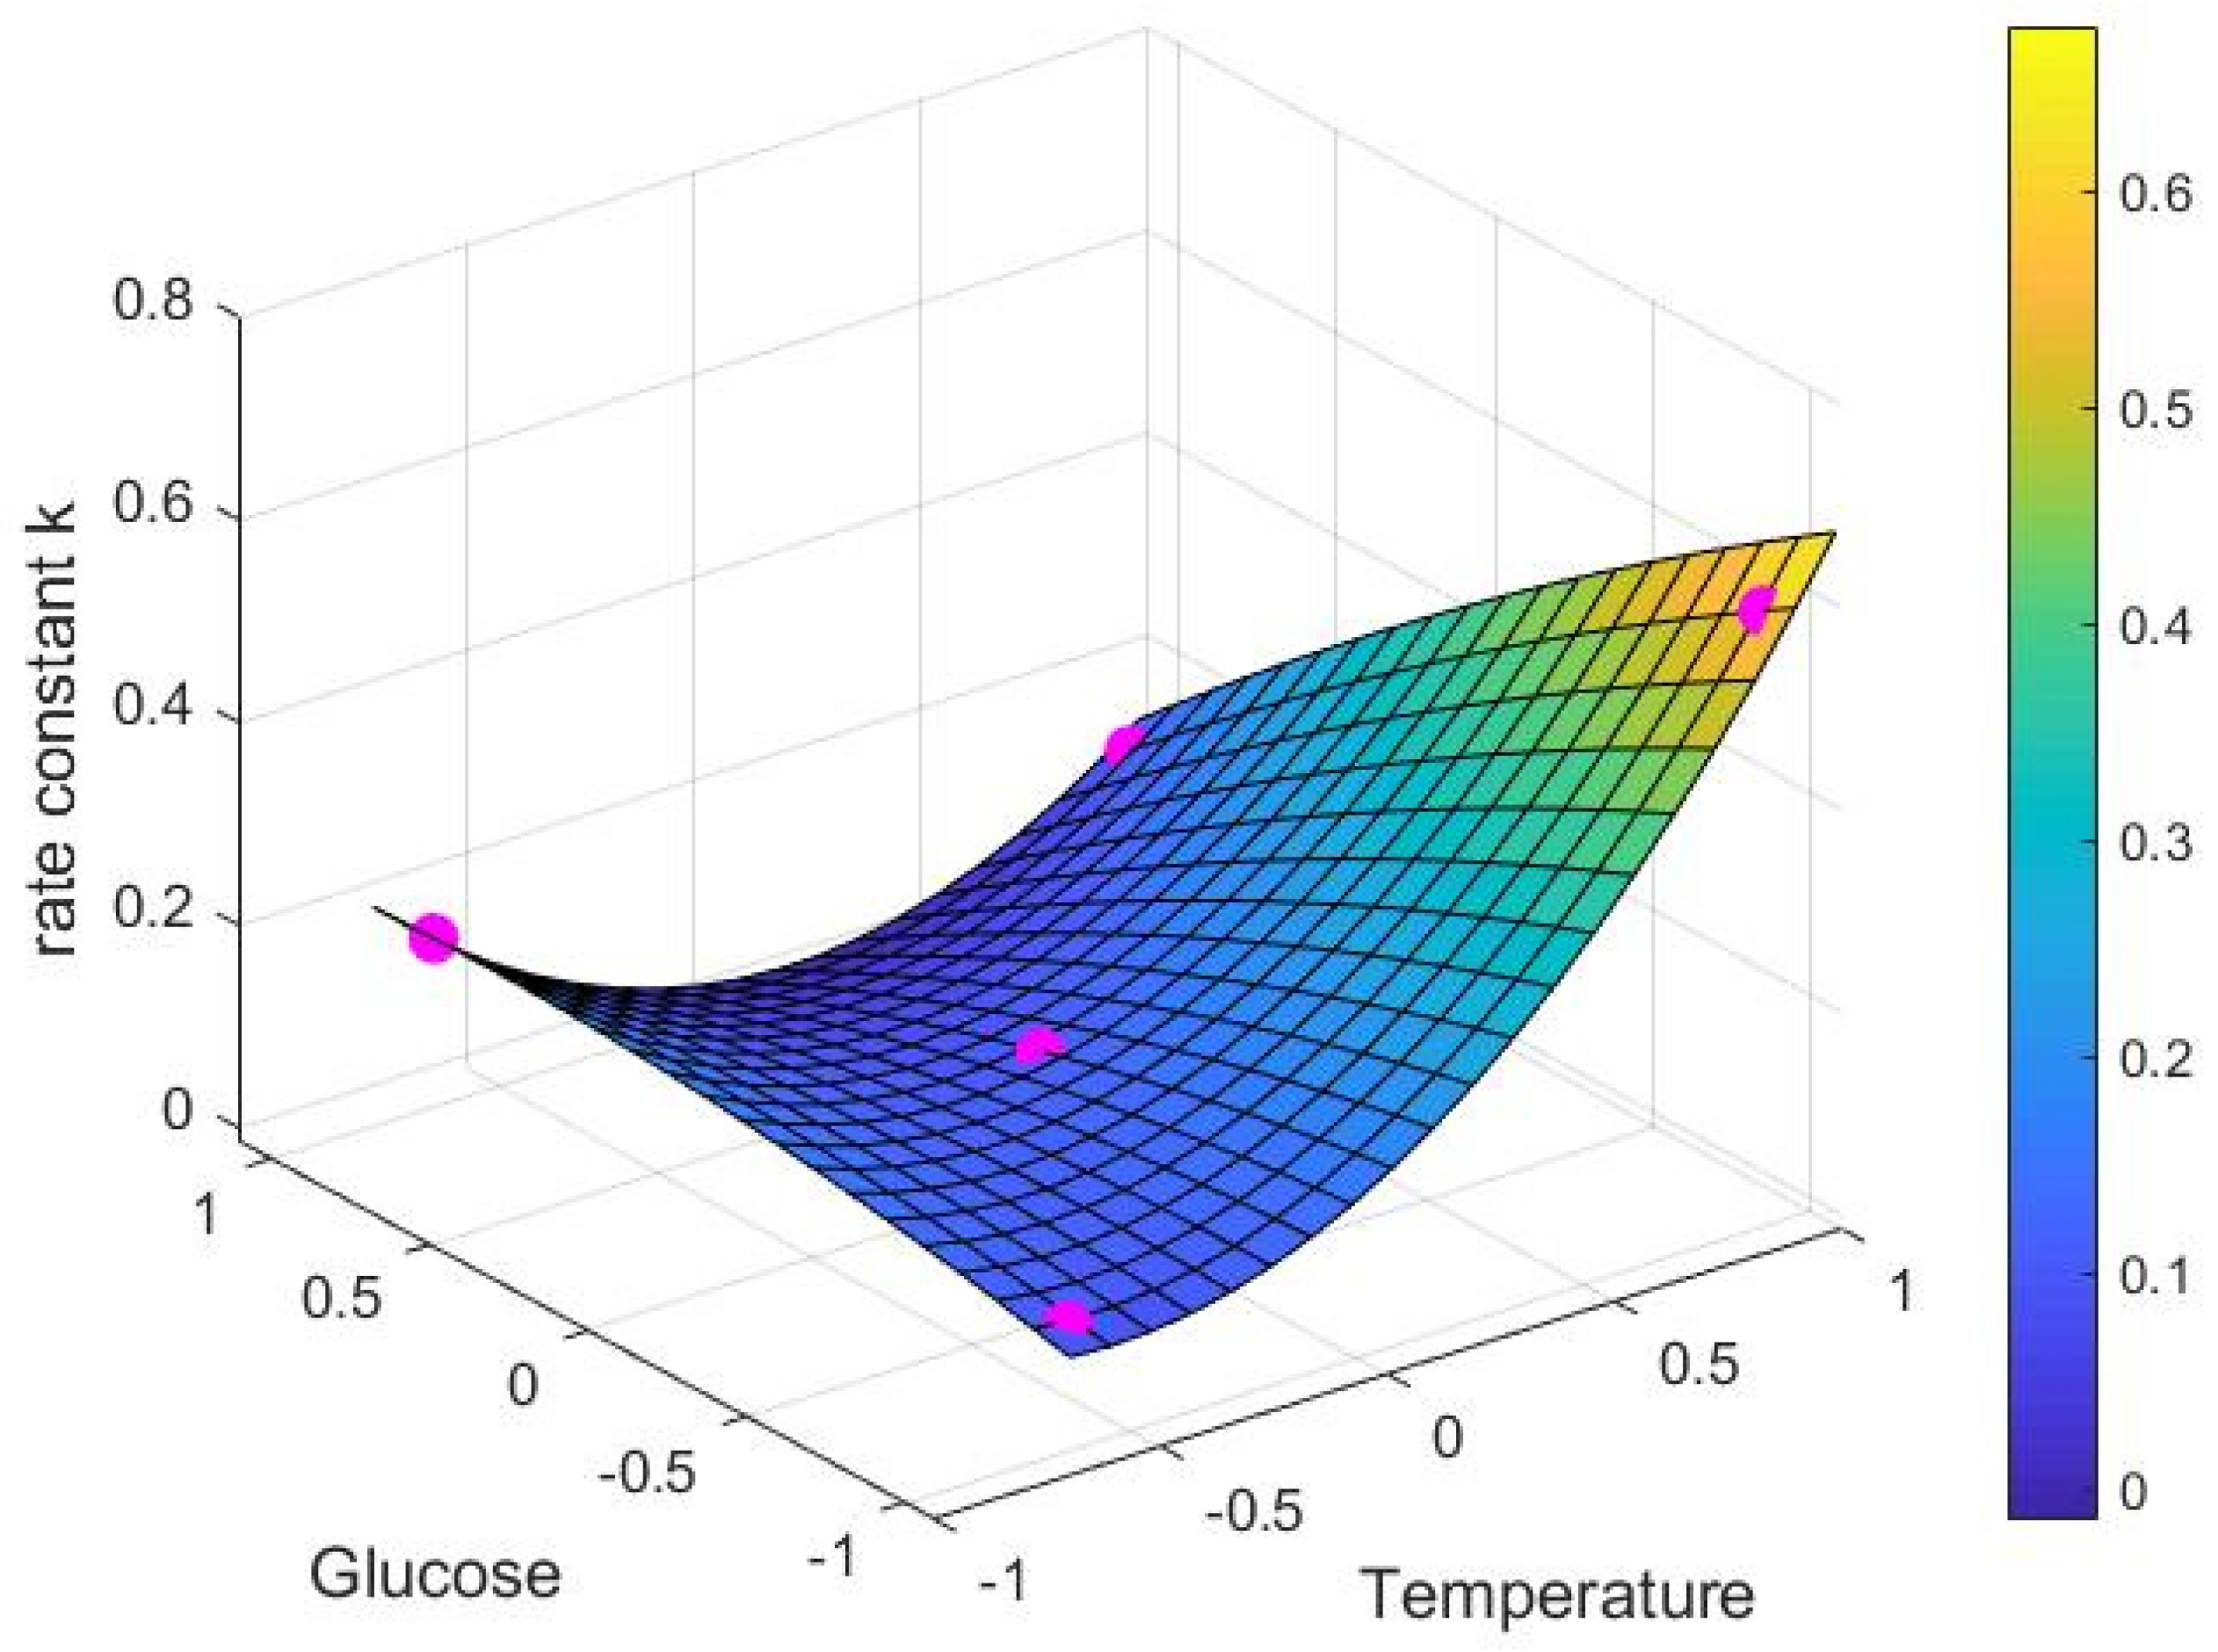
Equations (14) and (15) were then used to develop the surface response models Figure 4 and Figure 5 which also show the experimental data points. Surface plots were used to visualise the behaviour of the non-linear system and to explore the relationships between the three variables.
The extraction rate in the absence of glucose (i.e., high alcohol) and at high temperature as seen in Figure 4 is by far the highest under the conditions trialled. Aside from this, however, the extraction rate for simulated juice (high sugar, no alcohol) at low temperatures was higher than for other points in the system, although this needs to be considered along with the much smaller maximum extractable amount of catechin as shown in Figure 5. Together, the results indicate that extraction rate alone does not fully define the extraction behaviour of catechin.
With k T ˜ ,   G ˜   (Equation (15)) and C ˜ T ˜ ,   G ˜   (Equation (16)), the final form for the concentration derived from Equation (7) describes the function C ˜ (t) for any fixed condition of T and G:
C ˜ t , T ˜ ,   G ˜ = C ˜ 0 + C ˜ T ˜ , G ˜ C ˜ 0 1 e k T ˜ , G ˜ t .
Finally, as the experimental setup used a diluted system to limit the reaction of proanthocyanidins and other extracted compounds, a dilution factor α = Vundiluted/Vl = 8.79 must be included in the calculation for C ˜ corr T ˜ ,   G ˜ to estimate the maximum extractability of catechin that could be observed in undiluted industrial red wine fermentation:
C ˜ c o r r T ˜ ,   G ˜ = 8.79 8.603 + 2.072 T ˜ 1.610   G ˜ + 0.544   T ˜ 2 0.344   G ˜ 2 + 1.079 T ˜ G ˜ .
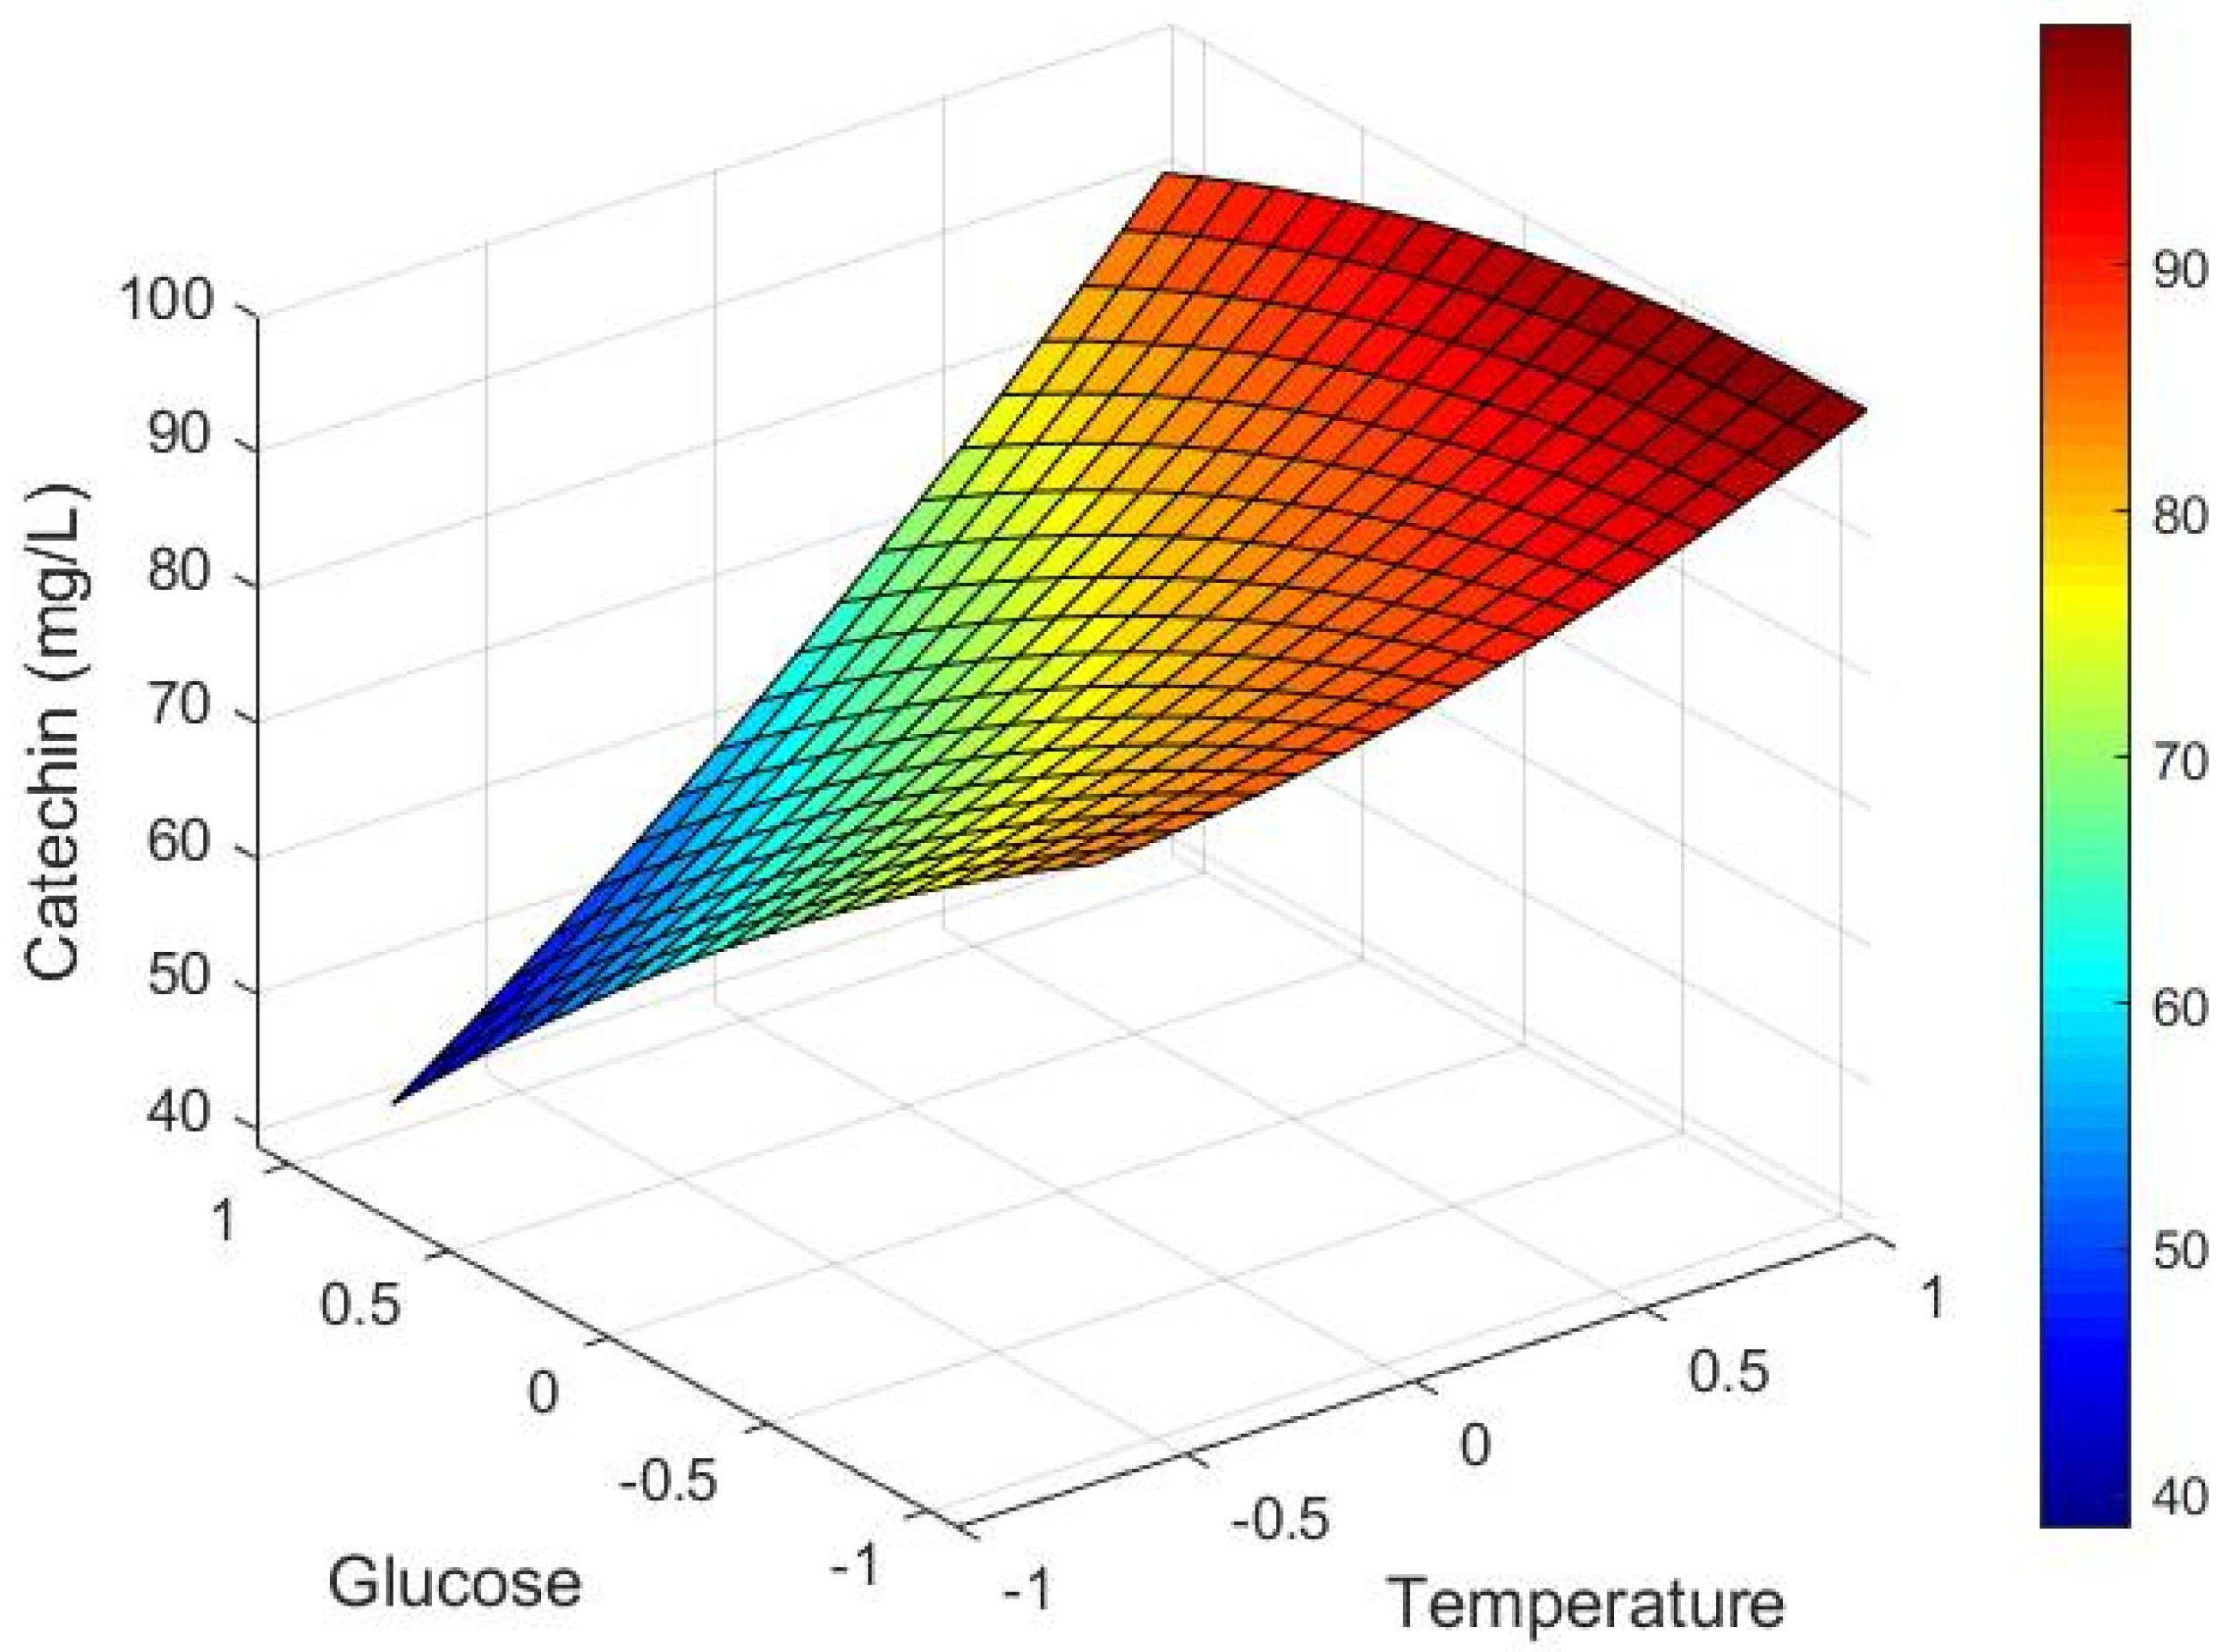
Figure 6 shows the predicted maximum extracted catechin concentration according to Equation (18) after 69.5 h for solutions of different sugar compositions and temperatures. The extracted concentration is lowest at low temperature and high sugar (i.e., low alcohol), which represents the simulation of a “cold soak” prior to the onset of fermentation.
These results are in accordance to the findings Setford et al. [12], who similarly showed that pre-fermentative maceration techniques at cold temperatures have little impact on the final anthocyanin concentration of a wine must before skin removal. There is also accord with the review of Sacchi et al. [40], which highlights that cold soaking has either no effect or can negatively affect the polyphenol composition of a red wine. Occurring once sugars have been fermented (i.e., high alcohol) and at the high temperature, the predicted maximum extracted catechin concentration from the corrected model of 98.4 mg/L (Figure 6) corresponds relatively well with data from Nagel et al. [41], who also reported catechin concentration post fermentation in Merlot of an amount of 108.7 mg/L. In other cases, catechin concentration in finished wine shows some variation for the same variety but different country, with reported amounts in Merlot wine from France of 25.5 mg/L [42] compared to Canada with >160 mg/L [43]. These outcomes could be due to regional or climate differences that influence polyphenol content of the grapes or through different extraction conditions, particularly temperature, as discussed in this work. For example, studies have also investigated the effect of berry ripeness on tannin extraction, with Bindon et al. noting changes in cell wall porosity that could affect extraction from grape skin [44]. In contrast, Rousserie et al. reported no impact of berry ripeness on the extraction of tannins from seeds [45]. Beyond normal physiological differences, VanderWeide et al. [46] investigated storage temperature conditions (freezing and/or heating) of seeds on tannin extractability, concluding that freezing can advance the maturation of under-ripe grape seeds and that can impact extractability. Another major factor contributing to the phenolic composition of finished wine relates to various post-fermentation treatments (beyond the focus of this study) such as micro-oxygenation, oak chip maceration, and barrel maturation [8,47]. Further research and industry validation of the proposed model may be warranted to confirm model stability at scale.
A preliminary assessment of the potential impact of these sources of variability was investigated by means of a sensitivity analysis [31], undertaken by adjusting extraction rate k by different percentages as described in Section 2.3. Even at a +50% adjustment, the R2 values ranged between 0.93 and 0.96, suggesting a high degree of model robustness. Table S4 containing the re-calculated R2 values can be found in Supplementary Materials. Additionally, an internal cross-validation method was used to test and validate the model, as explained in Section 2.4. The data were divided into ten subsets, one of which was reserved for validation while the remaining nine subsets were utilised for training. This process was repeated multiple times, with each subset serving as the validation set. The R2cal, the SECV, and the RPD were calculated. The R2cal obtained from this validation was 0.93, which is considered to be a good value. The high RPD of 17.68 compared to the small SECV of 0.11 indicate a robust model.

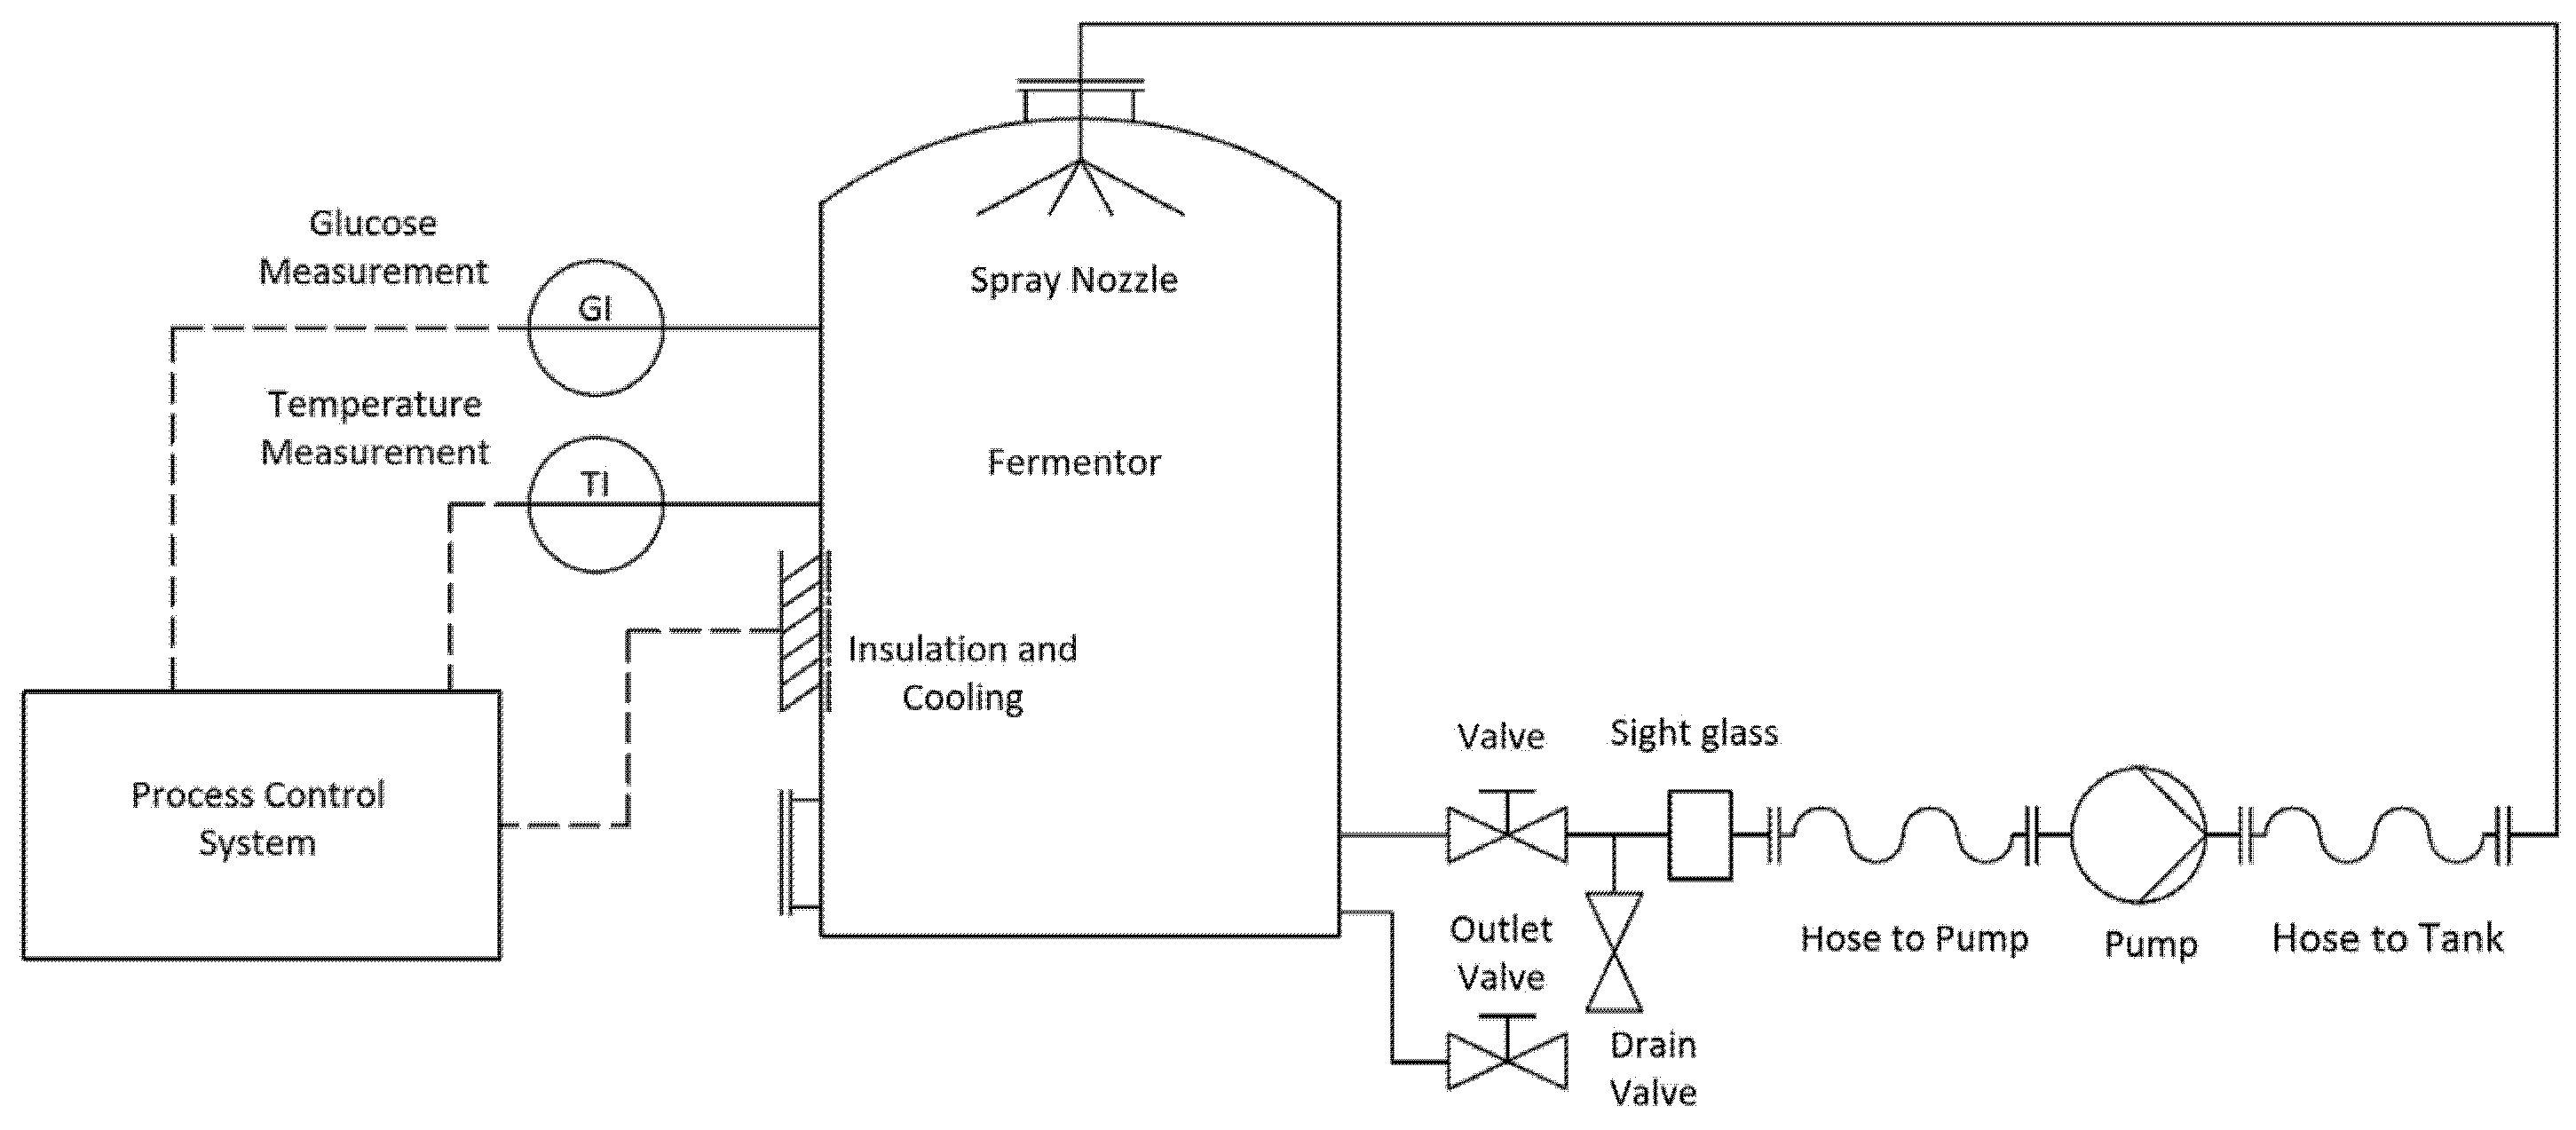
3.2. Industrial Application: Future Implementation of Models for Process Control

The proposed model yields extraction rate k from measurements of temperature and glucose. This enables a process-control system to increase or decrease the extraction rate by changing the temperature via a cooling or a heating system. Figure 7 depicts a process instrumentation diagram (PID) of a red wine fermentor, whereby temperature and glucose measurements influence the utilisation of a cooling system through a process-control system.
Notably, the value of catechin predicted by the model cannot be measured by in-line sensors as currently none are available for commercial use. Therefore, the only opportunity at the present time for the prediction to be verified empirically is by using a physical sample which is then separately analysed in the winery laboratory. Wineries already typically take samples every 12 h (for quality assurance purposes) during a fermentation that lasts on average between 5 and 14 days [15]. It would be ideal to obtain more frequent measurements, particularly during the first 12–24 h of the fermentation as used in the development of the model.
More generally, the production throughput of a commercial winery is limited in part by the fixed number of fermentation tanks. This is being exacerbated by climate change, resulting in higher sugar concentrations in berries and vintage compression (i.e., varieties ripening earlier and their optimal picking times overlapping more during the harvest period) that cause production issues and uncertainty for wine producers [2,18]. Optimizing both fermentation time and the extraction of compounds that contribute to wine quality is seen as a key area for development that could mitigate some of the pressures being experienced by producers. Choosing to express the model as dependent on sugar concentrations instead of alcohol means allowing it to adapt to increased sugar concentrations and predict the maximum extractable catechin amount more accurately. Moreover, apart from undertaking temperature measurements on fermentation tanks, wineries typically carry out measurements of the juice/must properties off-line in a laboratory rather than at the fermentation vessel itself. In 2020, only a single winery in Australia monitored the conversion of sugar to ethanol using in-line sensors [48]. This can lead to significant delays between sampling of the must and decision-making by the winemaker who determines the maceration regime based on their personal experience and expertise, although this can be restricted by equipment and labour availability. Therefore, there are obvious benefits to automating analysis through in-line measurements and implementing automatic process control to ensure product quality while decreasing time and labour and facilitating production plant availability. Process control and in-line measurements can also increase quality control, reproducibility and maximise the efficiency of the raw resources used.
Specifically, the proposed model developed in this work is well suited to smart digital control technologies, especially where low computational overheads are desirable and small single board microcontrollers are to be deployed throughout a winery. Advanced control strategies such as MPC have already been implemented in various food production industry applications, such as extrusion and drying processes, bread baking, and milk powder and lactic acid production, as well as controlling alcoholic fermentations [49]. Mjalli et al. [50] showed that an MPC is preferable over a feedback linearisation control of continuous alcoholic fermentation because of its more stable performance and ability to make adjustments in controller behaviour. As a starting point, the model presented in this paper uses time, temperature and sugar as the variables, and so a future process-control system with integrated fuzzy/MPC coupled with in-line measurements for temperature and sugar would suffice to predict the extraction of catechin. This could conceivably form the basis for more advanced AI and ML control techniques and be extended to incorporate other important red wine polyphenols. Temperature measurements are readily available and already implemented in most commercial winery settings. Sugar measurements might not be as common in winery applications as of yet, but are available at a relatively low cost and are also beneficial for fermentation monitoring and control [51,52]. Implementation of these two in-line measurements and the here described model into a process-control system of a winery provides a pathway to optimise fermentation quality and streamline production. Although the regression coefficients remain constant with the experimental data presented in this study, adaptation may be necessary in later industrial implementation. One possible way to achieve this is by incorporating the data obtained by the in-line temperature and sugar measurements, as well as the manual catechin measurements, into a machine learning (ML) algorithm to reconfigure the regression coefficients accordingly. Possible ML algorithms suitable for this include Artificial Neural Networks (ANNs), which aim to replicate the behaviour of the human brain by constructing a system of interconnected nodes that can learn from input data or Gradient Boosting (GB), which is commonly used to solve regression problems by combining the results of multiple weak learners to create a strong learner, which is then capable of accurately predicting the outcome variable [34,53]. Additional modelling of unmixed as well as mixed systems could predict extraction and assist with fermentation cap management by deciding on pump over regimes, for example, with the goals of achieving optimal extraction of polyphenols such as tannins.

4. Conclusions

A simple first-order model to accurately describe the extraction of catechin throughout the course of red wine fermentation was developed. Temperature and glucose/ethanol dependencies of the extraction rate were well modelled using a second-order Taylor expansion. Maximum extraction rates occurred at high temperature and high ethanol levels. The model proved to be a good fit, resulting in high R2 (>0.94) and low RMSE values in all cases. The robustness of the model was evaluated using four metrics. R2cal obtained from this validation was 0.93, indicating good performance. The standard error in cross-validation (SECV) was calculated to be 0.11, and the residual predictive deviation (RPD) was calculated to be 17.68, which suggests a robust model. In addition, a sensitivity analysis on extraction rate k determined that even at a +50% adjustment to the fitted values, R2 was maintained between 0.93 and 0.96, suggesting a high degree of model robustness.
Application of the same approach to describe the extraction of other important polyphenols during red wine fermentation should be investigated further and the overall concept incorporated into an integrated process-control system. In tandem, optimisation of a sensor for in-line polyphenol measurements would help with verification of the model and further improve process control on the basis of sensorially relevant chemical measures.

Supplementary Materials

The following supporting information can be downloaded at: https://www.mdpi.com/article/10.3390/fermentation9040394/s1, Table S1. Extracted catechin amounts for simulated juice (266 g/L glucose; 0% v/v ethanol) and simulated wine (0 g/L glucose; 14% v/v ethanol) at low temperature (4.4 °C). Table S2. Extracted catechin amounts for the simulated mid-ferment (133 g/L glucose; 7% v/v ethanol) at medium temperature (12.2 °C). Table S3. Extracted catechin amounts for simulated juice (266 g/L glucose; 0% v/v ethanol) and simulated wine (0 g/L glucose; 14% v/v ethanol) at high temperature (23.1 °C). Table S4. Recalculated R2 values obtained by adjusting k by different percentages (10%, 30%, and 50%) and re-running the model with the new values.

Author Contributions

Conceptualization, J.U., D.W.J. and R.A.M.; methodology, J.U. and R.A.M.; software, J.U.; validation, J.U. and R.A.M.; formal analysis, J.U. and R.A.M.; investigation, J.U., P.C.S. and R.A.M.; resources, R.A.M., and D.W.J.; data curation, P.C.S. and J.U.; writing—original draft preparation, J.U.; writing—review and editing, J.U., P.C.S., R.A.M., D.W.J. and J.M. ; visualization, J.U.; supervision, R.A.M., D.W.J. and J.M.; project administration, R.A.M.; funding acquisition, R.A.M., D.W.J. and J.M. All authors have read and agreed to the published version of the manuscript.

Funding

This research was conducted by the Australian Research Council Training Centre for Innovative Wine Production (www.ARCwinecentre.org.au; project number IC170100008), funded by the Australian Government with additional support from Wine Australia, Waite Research Institute, and industry partners.

Institutional Review Board Statement

Not applicable.

Informed Consent Statement

Not applicable.

Data Availability Statement

The data presented in this study are available in Supplementary Materials and can be accessed from the link provided above.

Acknowledgments

Special thanks to Karl Unterkofler for providing assistance and advice with Matlab applications. The University of Adelaide is a member of the Wine Innovation Cluster.

Conflicts of Interest

The authors declare they have no known competing financial interests that may have influenced the work.

Nomenclature

CCatechin amount (mg)
C0Initial catechin amount (mg)
C ˜ Catechin concentration (mg/L)
C ˜   Maximal extractable catechin concentration (mg/L)
C ˜ c o r r Maximal extractable catechin concentration in undiluted industrial red wine fermentation (mg/L)
C p r e d , i Catechin concentration predicted by model (mg/L)
C o b s , i Catechin concentration observed experimentally (mg/L)
C ¯ o b s , i Mean of the catechin concentration observed experimentally (mg/L)
c1-c6Constants describing catechin extraction rate
d1-d6Constants describing maximum extracted catechin
GGlucose concentration (g/L)
G0Glucose concentration at centre point of the system (g/L)
G ˜ Dimensionless glucose
kCatechin extraction rate (1/h)
NNumber of replicates
P(t)Extractable amount of catechin in grape pomace at time t (mg)
R2Coefficient of determination
RMSERoot mean square error
tTime (h)
TTemperature (°C)
T0Temperature at centre point of the system (°C)
T ˜ Dimensionless temperature

References

  1. Australia, W. Australian Wine: Production, Sales and Inventory 2021–22; Wine Australia: Adelaide, Australia, 2022. [Google Scholar]
  2. Unterkofler, J.; Muhlack, R.A.; Jeffery, D.W. Processes and purposes of extraction of grape components during winemaking: Current state and perspectives. Appl. Microbiol. Biotechnol. 2020, 104, 4737–4755. [Google Scholar] [CrossRef] [PubMed]
  3. Corriou, J.-P. Process Control, 2nd ed.; Springer: London, UK, 2009; ISBN 9783319611426. [Google Scholar]
  4. Schwenzer, M.; Ay, M.; Bergs, T.; Abel, D. Review on model predictive control: An engineering perspective. Int. J. Adv. Manuf. Technol. 2021, 117, 1327–1349. [Google Scholar] [CrossRef]
  5. Chai, W.Y.; Teo, K.T.K.; Tan, M.K.; Tham, H.J. Model Predictive Control in Fermentation Process—A Review. AIP Conf. Proc. 2022, 2610, 070008. [Google Scholar] [CrossRef]
  6. Fabri, S.G.; Agius, J.; Ghirlando, R.; Axisa, R. Modelling and temperature control of a wine fermentation process with solar cooling. In Proceedings of the 2016 24th Mediterranean Conference on Control and Automation (MED), Athens, Greece, 21–24 June 2016; pp. 985–990. [Google Scholar] [CrossRef]
  7. Jang, J.R. ANFIS: Adaptive-network-based fuzzy inference system. IEEE Trans. Syst. Man. Cybern. 1993, 23, 665–685. [Google Scholar] [CrossRef]
  8. Waterhouse, A.L.; Sacks, G.L.; Jeffery, D.W. Understanding Wine Chemistry; John Wiley & Sons Ltd.: Hoboken, NJ, USA, 2016; ISBN 9781118627808. [Google Scholar]
  9. Cheynier, V.; Dueñas-Paton, M.; Salas, E.; Maury, C.; Souquet, J.M.; Sarni-Manchado, P.; Fulcrand, H. Structure and Properties of Wine Pigments and Tannins. Am. J. Enol. Vitic. 2006, 57, 298–305. [Google Scholar] [CrossRef]
  10. Ribéreau-Gayon, P.; Glories, Y.; Maujean, A.; Dubourdieu, D. Handbook of Enology, Volume 2: The Chemistry of Wine Stabilization and Treatments, 2nd ed.; John Wiley & Sons, Ltd.: Chichester, UK, 2006; Volume 2, ISBN 9780470010396. [Google Scholar]
  11. Setford, P.C.; Jeffery, D.W.; Grbin, P.R.; Muhlack, R.A. Mass transfer of anthocyanins during extraction from pre-fermentative grape solids under simulated fermentation conditions: Effect of convective conditions. Molecules 2019, 24, 73. [Google Scholar] [CrossRef]
  12. Setford, P.C.; Jeffery, D.W.; Grbin, P.R.; Muhlack, R.A. Modelling the mass transfer process of malvidin-3-glucoside during simulated extraction from fresh grape solids under wine-like conditions. Molecules 2018, 23, 2159. [Google Scholar] [CrossRef]
  13. Setford, P.C.; Jeffery, D.W.; Grbin, P.R.; Muhlack, R.A. Mathematical modelling of anthocyanin mass transfer to predict extraction in simulated red wine fermentation scenarios. Food Res. Int. 2019, 121, 705–713. [Google Scholar] [CrossRef]
  14. Setford, P.C.; Jeffery, D.W.; Grbin, P.R.; Muhlack, R.A. A new approach to predicting the extraction of malvidin-3-glucoside during red wine fermentation at industrial-scale. Food Bioprod. Process. 2022, 131, 217–223. [Google Scholar] [CrossRef]
  15. Boulton, R.B.; Singleton, V.L.; Bisson, L.F.; Kunkee, R.E. Principles and Practices of Winemaking; Springer: Boston, MA, USA, 1999; ISBN 978-1-4419-5190-8. [Google Scholar]
  16. Miller, K.; Noguera, R.; Beaver, J.; Medina-Plaza, C.; Oberholster, A.; Block, D. A mechanistic model for the extraction of phenolics from grapes during red wine fermentation. Molecules 2019, 24, 1275. [Google Scholar] [CrossRef]
  17. Abi-Habib, E.; Vernhet, A.; Roi, S.; Carrillo, S.; Veran, F.; Ducasse, M.-A.; Poncet-Legrand, C. Diffusion of phenolic compounds during a model maceration. J. Sci. Food Agric. 2022, 103, 2004–2013. [Google Scholar] [CrossRef]
  18. Luna, R.; Lima, B.M.; Cuevas-valenzuela, J.; Normey-rico, J.E.; Pérez-correa, J.R. Optimal Control Applied to Oenological Management of Red Wine Fermentative Macerations. Fermentation 2021, 7, 94. [Google Scholar] [CrossRef]
  19. Zanoni, B.; Siliani, S.; Canuti, V.; Rosi, I.; Bertuccioli, M. A kinetic study on extraction and transformation phenomena of phenolic compounds during red wine fermentation. Int. J. Food Sci. Technol. 2010, 45, 2080–2088. [Google Scholar] [CrossRef]
  20. Hobbie, R.K.; Roth, B.J. Intermediate Physics for Medicine and Biology, 4th ed.; Springer: New York, NY, USA, 2007; ISBN 978-0-387-30942-2. [Google Scholar]
  21. Strauss, W.A. Partial Differential Equations: An Introduction, 2nd ed.; John Wiley & Sons, Ltd.: Hoboken, NJ, USA, 2007; Volume 5, ISBN 9781119130536. [Google Scholar]
  22. Cussler, E.L. Diffusion: Mass Transfer in Fluid Systems, 3rd ed.; Cambridge University Press: Cambridge, UK, 2009; ISBN 9780521871211. [Google Scholar]
  23. Feynman, R.P.; Leighton, R.B.; Sands, M. The Feynman Lectures on Physics; California Institute of Technology: Pasadena, CA, USA, 1963; Volume 1, ISBN 978-0201021165. [Google Scholar]
  24. Haynes, W.M.; Lide, D.R.; Bruno, T.J. CRC Handbook of Chemistry and Physics, 97th ed.; CRC Press: Boca Raton, FL, USA, 2016; ISBN 9781498754293. [Google Scholar]
  25. Shi, J.; Yu, J.; Pohorly, J.; Young, J.C.; Bryan, M.; Wu, Y. Optimization of the extraction of polyphenols from grape seed meal by aqueous ethanol solution. J. Food Agric. Environ. 2003, 1, 42–47. [Google Scholar]
  26. Hernández-Jiménez, A.; Kennedy, J.A.; Bautista-Ortín, A.B.; Gómez-Plaza, E. Effect of ethanol on grape seed proanthocyanidin extraction. Am. J. Enol. Vitic. 2012, 63, 57–61. [Google Scholar] [CrossRef]
  27. The MathWorks Inc. Deep Learning Toolbox: User’s Guide (R2018a). Available online: https://au.mathworks.com/help/optim/ug/least-squares-model-fitting-algorithms.html (accessed on 13 December 2022).
  28. Strang, G. Introduction to Linear Algebra, 4th ed.; Wellesley-Cambridge Press: Wellesley, MA, USA, 2009; ISBN 0980232716. [Google Scholar]
  29. Marquardt, D.W. An algorithm for least-squares estimation of nonlinear parameters. J. Soc. Ind. Appl. Math. 1963, 11, 431–441. [Google Scholar] [CrossRef]
  30. Phipps, M.C.; Quine, M.P. A Primer of Statistics: Data Analysis, Probability, Inference, 3rd ed.; Prentice Hall: Sydney, Australia, 1998; ISBN 0724809619. [Google Scholar]
  31. Montgomery, D.C. Design and Analysis of Experiments, 8th ed.; John Wiley & Sons: Hoboken, NJ, USA, 2013; ISBN 9781118146927. [Google Scholar]
  32. Franklin, G.F.; Powell, J.D.; Emami-Naeini, A. Feedback Control of Dynamic Systems, 7th ed.; Pearson Education: London, UK, 2015; ISBN 1292068906. [Google Scholar]
  33. Lennart, L. System Identification, 2nd ed.; Pearson: London, UK, 1998; ISBN 0136566952. [Google Scholar]
  34. Ibrahim, J.; Chen, M.-H.; Sinha, D. The Elements of Statistical Learning, 2nd ed.; Springer: Berlin/Heidelberg, Germany, 2009; Volume 27, ISBN 9781441968241. [Google Scholar]
  35. Cozzolino, D.; Dambergs, R.G.; Janik, L.; Cynkar, W.U.; Gishen, M. Analysis of grapes and wine by near infrared spectroscopy. J. Near Infrared Spectrosc. 2006, 14, 279–289. [Google Scholar] [CrossRef]
  36. Tindal, R.A.; Jeffery, D.W.; Muhlack, R.A. Mathematical modelling to enhance winemaking efficiency: A review of red wine colour and polyphenol extraction and evolution. Aust. J. Grape Wine Res. 2021, 27, 219–233. [Google Scholar] [CrossRef]
  37. Wang, X.; Lim, L.-T. Modeling study of coffee extraction at different temperature and grind size conditions to better understand the cold and hot brewing process. J. Food Process Eng. 2021, 44, e13748. [Google Scholar] [CrossRef]
  38. Meziane, I.A.A.; Bali, N.; Belblidia, N.-B.; Abatzoglou, N.; Benyoussef, E.H. The first-order model in the simulation of essential oil extraction kinetics. J. Appl. Res. Med. Aromat. Plants 2019, 15, 100226. [Google Scholar] [CrossRef]
  39. Simonin, J.P. On the comparison of pseudo-first order and pseudo-second order rate laws in the modeling of adsorption kinetics. Chem. Eng. J. 2016, 300, 254–263. [Google Scholar] [CrossRef]
  40. Sacchi, K.L.; Bisson, L.F.; Adams, D.O. A review of the effect of winemaking techniques on phenolic extraction in red wines. Am. J. Enol. Vitic. 2005, 56, 197–206. [Google Scholar] [CrossRef]
  41. Nagel, C.W.; Wulf, L.W. Changes in the Anthocyanins, Flavonoids and Hydroxycinnamic Acid Esters during Fermentation and Aging of Merlot and Cabernet Sauvignon. Am. J. Enol. Vitic. 1979, 30, 111–116. [Google Scholar] [CrossRef]
  42. Landrault, N.; Poucheret, P.; Ravel, P.; Gasc, F.; Cros, G.; Teissedre, P.L. Antioxidant capacities and phenolics levels of French wines from different varieties and vintages. J. Agric. Food Chem. 2001, 49, 3341–3348. [Google Scholar] [CrossRef] [PubMed]
  43. Faustino, R.S.; Sobrattee, S.; Edel, A.L.; Pierce, G.N. Comparative analysis of the phenolic content of selected Chilean, Canadian and American Merlot red wines. Mol. Cell. Biochem. 2003, 249, 11–19. [Google Scholar] [CrossRef]
  44. Bindon, K.A.; Madani, S.H.; Pendleton, P.; Smith, P.A.; Kennedy, J.A. Factors affecting skin tannin extractability in ripening grapes. J. Agric. Food Chem. 2014, 62, 1130–1141. [Google Scholar] [CrossRef]
  45. Rousserie, P.; Lacampagne, S.; Vanbrabant, S.; Rabot, A.; Geny-Denis, L. Influence of berry ripeness on seed tannins extraction in wine. Food Chem. 2020, 315, 126307. [Google Scholar] [CrossRef]
  46. VanderWeide, J.; Del Zozzo, F.; Nasrollahiazar, E.; Kennedy, J.A.; Peterlunger, E.; Rustioni, L.; Sabbatini, P. Influence of freezing and heating conditions on grape seed flavan-3-ol extractability, oxidation, and galloylation pattern. Sci. Rep. 2022, 12, 3838. [Google Scholar] [CrossRef]
  47. Oberholster, A.; Elmendorf, B.L.; Lerno, L.A.; King, E.S.; Heymann, H.; Brenneman, C.E.; Boulton, R.B. Barrel maturation, oak alternatives and micro-oxygenation: Influence on red wine aging and quality. Food Chem. 2015, 173, 1250–1258. [Google Scholar] [CrossRef]
  48. Nordestgaard, S. Inspirations from the past and opportunities for the future part 2: In-tank fermentation monitoring and continuous processes. Aust. N. Z. Grapegrow. Winemak. 2020, 677, 50–56. [Google Scholar]
  49. Kondakci, T.; Zhou, W. Recent applications of advanced control techniques in food industry. Food Bioprocess Technol. 2017, 10, 522–542. [Google Scholar] [CrossRef]
  50. Mjalli, F.S.; Al-Asheh, S. Neural-networks-based feedback linearization versus model predictive control of continuous alcoholic fermentation process. Chem. Eng. Technol. 2005, 28, 1191–1200. [Google Scholar] [CrossRef]
  51. Scrimgeour, N. Evaluating the Viability of Process Sensor Technologies for Measurement of Sugar Levels during Fermentation; Australian Wine Research Institute: Adelaide, Australia, 2015. [Google Scholar]
  52. Jaywant, S.A.; Singh, H.; Arif, K.M. Sensors and instruments for brix measurement: A review. Sensors 2022, 22, 2290. [Google Scholar] [CrossRef] [PubMed]
  53. Nichols, J.A.; Herbert Chan, H.W.; Baker, M.A.B. Machine learning: Applications of artificial intelligence to imaging and diagnosis. Biophys. Rev. 2019, 11, 111–118. [Google Scholar] [CrossRef] [PubMed]
Figure 1. Catechin extraction in simulated juice (266 g/L glucose) and simulated wine (14% v/v ethanol) at 4.4 °C, showing experimental values (symbol) and fitted models (solid line).
Fermentation 09 00394 g001
Figure 2. Catechin extraction in simulated mid-fermentation (133 g/L glucose, 7% v/v ethanol) at 12.2 °C, showing experimental values (symbol) and fitted model (solid line).
Fermentation 09 00394 g002
Figure 3. Catechin extraction in simulated juice (266 g/L glucose) and simulated wine (14% v/v ethanol) at 23.1 °C, showing experimental values (symbol) and fitted models (solid line).
Fermentation 09 00394 g003
Figure 4. Catechin extraction rate constant k (1/h) depending on dimensionless glucose ( G ˜ ) and temperature ( T ˜ ) values, showing experimental data () and model response surface.
Fermentation 09 00394 g004
Figure 5. Maximum extracted catechin concentration C ˜ ∞ (mg/L) depending on dimensionless glucose ( G ˜ ) and temperature ( T ˜ ) values, showing experimental data () and model response surface.
Fermentation 09 00394 g005
Figure 6. Model response surface for predicted maximum extracted catechin concentration corrected for dilution C ˜ c o r r T ˜ ,   G ˜ (mg/L) depending on dimensionless glucose ( G ˜ ) and temperature ( T ˜ ) values.
Fermentation 09 00394 g006
Figure 7. Process instrumentation diagram (PID) of a typical red wine fermentor, showing glucose and temperature measurements influencing the utilisation of cooling system via a process-control system.
Fermentation 09 00394 g007
Table 1. Summary of the temperature conditions used, with corresponding dimensionless temperature ( T ˜ ) values based on Equation (8).
T (°C) T ˜
T(low)4.4−0.639
T(med)12.20
T(high)23.10.893
Table 2. Summary of glucose (g/L) conditions used, with corresponding dimensionless glucose ( G ˜ ) values based on Equation (9).
G (g/L) G ˜
G(low)0−1
G(med)1330
G(high)2661
Table 3. Summary of trial conditions (simulated juice (sim-juice), mid-ferment (sim-mid-ferment), and wine (sim-wine)) and model parameters.
Trial ConditionsModel ParametersModel Fit
Temp. (°C)Glucose (g/L)Ethanol (% v/v) C ˜ 0 (mg/L) C ˜ (mg/L) k (1/h)RMSER2
Sim-JuiceLow (4.4)26600.4524.8560.1520.2680.971
Sim-WineLow (4.4)0140.8679.4570.1090.4800.976
Sim-Mid-FermentMed (12.2)13370.8898.6030.1160.4070.979
Sim-JuiceHigh (23.1)26601.4739.8980.1180.7370.944
Sim-WineHigh (23.1)0140.05911.1900.5950.4510.984
Table 4. Fitted values for the rate constants c1, c2, c3, c4, c5 and c6 describing the extraction rate from Equation (11).
ConstantFitted Value (h−1)
c10.116
c20.090
c3−0.087
c40.225
c5−0.021
c6−0.170
Table 5. Fitted values for the rate constants d1, d2, d3, d4, d5 and d6 describing the maximum extracted catechin from Equation (12).
ConstantFitted Value (mg/L)
d18.603
d22.072
d3−1.610
d40.544
d5−0.344
d61.079
Disclaimer/Publisher’s Note: The statements, opinions and data contained in all publications are solely those of the individual author(s) and contributor(s) and not of MDPI and/or the editor(s). MDPI and/or the editor(s) disclaim responsibility for any injury to people or property resulting from any ideas, methods, instructions or products referred to in the content.

