
Impact of Rumen Fluid Storage on In Vitro Feed Fermentation Characteristics
by
 , , , and
Bereket Zeleke Tunkala
1,*,
Kristy DiGiacomo
1,
Pablo S. Alvarez Hess
2,
Frank R. Dunshea
1,3 and
Brian J. Leury
1,* 1
Faculty of Science, The University of Melbourne, Parkville, VIC 3010, Australia
2
Agriculture Victoria Research, 1301 Hazeldean Road, Ellinbank, VIC 3821, Australia
3
Faculty of Biological Sciences, The University of Leeds, Leeds LS2 9JT, UK
*
Authors to whom correspondence should be addressed.
Fermentation 2023, 9(4), 392; https://doi.org/10.3390/fermentation9040392
Submission received: 30 March 2023
/
Revised: 12 April 2023
/
Accepted: 17 April 2023
/
Published: 19 April 2023
(This article belongs to the Special Issue In Vitro Fermentation, 2nd Edition)
Abstract
:Storing rumen fluid (RF) has the potential to standardize subsequent in vitro feed fermentation studies. The first phase of this experiment aimed to evaluate the effect of two RF storage methods on gas composition and dry matter disappearance (DMD) in wheat grain and lucerne hay under in vitro fermentation. The storage methods were as follows: (1) snap-freezing RF using liquid nitrogen and then storing it at −80 °C (−80 °C); and (2) mixing RF with 5% dimethyl sulfoxide (DMSO), subsequently freezing it at −20 °C (D−20 °C), and comparing it to fresh RF on days 1, 14, and 30 post collection. The objective of the second phase was to quantify the impact of preserving the RF for 180 days at D−20 °C on the in vitro fermentation parameters. The methane composition was lower (p < 0.001) in both the preserved RFs than in the fresh RF. There was no difference (p < 0.05) in DMD values between days 14 and 30. The average cumulative gas production and DMD from the RF stored at D−20 °C was higher than that from the RF stored at −80 °C. Moreover, there was no difference between day 30 and day 180 in the total gas production and lag time when fermenting with RF preserved at D−20 °C. Therefore, storing RF at D−20 °C is preferable to storing it at −80 °C when access to fresh RF is limited.
1. Introduction
In vitro fermentation procedures are used as a source of information for assessing the fermentability and nutritional value of potential feeds and feed additives [1,2] and require the collection of rumen fluid (RF). RF storage may help to reduce collection times, minimize the cost of handling cannulated animals, reduce the ethical concerns associated with cannulation, and avoid the impact of seasonal factors on RF quality [3,4,5]. Moreover, storing RF has the potential to standardize subsequent in vitro feed fermentation studies by reducing the need for frequent access to fistulated animals and decreasing variations in RF quality [6,7].
Most studies evaluating preserved RF have done so only over a short time (48 h to 7 days) [8,9], or without cryoprotectants [10]. Cryoprotectants such as sucrose, glycerol, and 5% dimethyl sulfoxide (DMSO) are able to protect the cell membranes of micro-organisms during freezing by reducing cell dehydration and intracellular ice crystal formation [11,12]. DMSO is a more effective cryoprotectant than some others, such as glycerol, due to its rapid diffusion through cell membranes and its ability to reduce the formation of intracellular ice crystals [5,13]. However, there is no published information on the storage of RF using DMSO as a preservative for more than 30 days.
In a previous study, Tunkala, et al. [14] evaluated a series of storage techniques and observed that RF preserved by mixing with 5% DMSO (v/v) and then freezing at −20 °C (D−20 °C) and RF preserved by snap-freezing using liquid nitrogen and storing at −80 °C (−80 °C) showed the best performance when compared with RF stored according to other methods. However, these methods were not evaluated for gas composition and dry matter disappearance (DMD). Therefore, the aims of this experiment were twofold. Firstly, to evaluate the effects of these RF storage methods on gas composition and DMD for 14 days and 30 days. Secondly, to evaluate the impact of using RF mixed with 5% DMSO and then frozen at −20 °C (D−20 °C) for an extended period of 180 days on various in vitro feed fermentation parameters.
2. Materials and Methods
All procedures were conducted in accordance with the Australian Code of Practice for the Care and Use of Animals for Scientific Purposes [15]. Approval to conduct the experiment was obtained from the Agricultural Research and Extension Animal Ethics Committee of the Department of Jobs, Precincts and Regions.
2.1. Experiment Design
Wheat grain and lucerne hay were used as the substrates to be fermented, representing concentrates and forage feeds. The D−20 °C and −80 °C RF storage methods were selected as they were the two best-performing methods in our previous experiment [14] in terms of in vitro fermentation characteristics, such as gas production, protozoa counting, fatty acids, and ammonia-N concentration. Therefore, two substrates (wheat grain and lucerne hay), three RF types (fresh RF, RF preserved at D−20 °C, and RF preserved at −80 °C), and three storage periods (1 day, 14 days, and 30 days) were computed in a 2 × 3 × 3 factorial design in the first phase of this study. Fresh RF was used for incubation on day 1 as a control, and preserved RF was used in other periods. The above substrates were fermented again on the 180th day post collection using RF preserved at D−20 °C in the second phase. The D−20 °C storage method was selected for the second phase because it performed better than the −80 °C storage method.
2.2. Chemical Composition
The samples of wheat grain and lucerne hay were analyzed using near-infrared spectroscopy for dry matter, dry matter digestibility, fat, neutral detergent fiber (NDF), acid detergent fiber (ADF), non-fiber carbohydrate (NFC), and ash in a commercial laboratory (FeedTest Laboratory, Agrifood Technology, Werribee, Victoria). Crude protein was estimated according to the Kjeldahl method (method 954.01) [16].
The dry organic matter digestibility (DOMD) and metabolizable energy (ME) were determined using the formulae from SCA [17] and AFFIA [18], respectively.
where DMD represents dry matter digestibility.
where DOMD represents dry organic matter digestibility and fat % based on the chemical composition analysis of substrates.
DOMD = 0.95DMD% − 0.9
ME = 0.858 + (0.138 × DOMD%) + (0.272 × Fat%)
2.3. Rumen Fluid Collection
The RF was collected, transported, pooled, and filtered according to the procedure described by Gonzalez-Rivas, et al. [19]. Four cannulated mid-lactation Holstein Friesian dairy cows at Agriculture Victoria (Ellinbank, Victoria) served as the donors in equal proportions, and a total of four liters of RF was collected twice in the morning before feeding, as recommended by Belanche, et al. [20]. The cows grazed a perennial ryegrass (Lollium perenne L.) pasture, and a wheat and barley grain mix (6 kg DM per day per cow) was supplied in the milking parlor. A handful of solid rumen content was placed in each two-liter bottle to maintain the microbial profile [9]. The bottles were capped with one-way gas lids and transported to the laboratory in a pre-warmed incubator (Premium blanket warmer, Thermoline Scientific, Wetherill Park, NSW, Australia) at 39 °C.
The RF was mixed and filtered through two layers of cheesecloth to separate the liquid RF and the residual solids. The liquid portion was sub-divided into 12 pre-warmed 0.5 L bottles. Two of these 0.5 L bottles were used as fresh RF and incubated in two consecutive runs on the same day they were collected. Another six 0.5 L bottles of RF were stored at −20 °C after mixing with 5% DMSO (CSA Scientific, 500 mL, Chemsupply, Gillman, Australia) for the D−20 °C treatment. The remaining four 0.5 L bottles of RF were snap-frozen using liquid nitrogen and stored at −80 °C, to be used for the −80 °C treatment. Four bottles of RF stored at D−20 °C and another four stored at −80 °C were used on days 14 and 30. The last two bottles of RF were stored frozen at D−20 °C and were used on 180th day post collection. The RF manipulations were performed under continuous flushing of carbon dioxide.
2.4. Incubation
The substrates were ground to pass through a 1 mm sieve, and 1 g was placed in 250 mL ANKOM bottles with 75 mL of buffer solution dispensed to the bottles using a liquid dispenser. The Kansas buffer solution with a 6.8 pH value was used [21,22]. The RF was thawed in three steps. First, it was placed in a 4 °C refrigerator for 30 min, then it was placed in a cold water bath (around 15 °C) for 30 min, and finally the water bath was turned up to 39 °C to warm the water gradually and thaw the RF for one additional hour.
Twenty-five ml of RF was added to the substrate and buffer mixture. The bottles were capped with pressure sensor modules of the ANKOM system, and carbon dioxide was flushed into the bottles before they were placed in water baths (20-L Analogue Waterbath, WB20; Ratek Instruments Pty Ltd., Boronia, VIC, Australia) pre-warmed to 39 °C. Four blank bottles were also incubated with buffer and RF as a control. The incubation was carried out in two runs for 24 h with a total of eight replicates per treatment. The incubations using RF preserved at −80 °C and D−20 °C were conducted simultaneously using the same sources of RF.
The gas pressure measured by the ANKOM gas production system was converted to moles of gas produced using the ‘ideal’ gas law and Avogadro’s law [22].
where n = quantity of gas in moles, P = pressure in psi (1 psi = 6.8948 kPa), V = gas volume (mL), R = gas constant (8.1345 L kPa/K∙mol), and T = temperature in Kelvin. This was then converted to volume (mL) of gas produced using Avogadro’s law, where 1 mol of gas holds 25.6 L at 39 °C (312 Kelvin), with pressure converted to kilopascals; therefore, gas measured in moles was converted to gas volume in milliliters as follows:
n = P(V/RT)
Gas volume (mL) = n × 22.4 L × 1000
2.5. Variables Measured
Gas is accumulated in the headspace and vented through the valve of each ANKOM gas production module. Gas production data were collected every five minutes through an automated pressure sensor connected to the computer via a wireless connection. The lag time and gas production rate were computed using GenStat with the Gompertz model:
in which A is the y-intercept, B is the rate of gas production (mL/h), C is the maximum gas produced (maximum gas mL/g DM), X is the total time (h) of incubation, and M is the time (h) at which the maximum rate of gas production is reached.
y = A + Cexp{−exp[−B(X − M)]}
The post-fermentation pH value of the RF was measured using a pH meter (Oakton® Acorn™ series pH 6 m, Sigma-Aldrich, North Ryde, Australia). The gas sample collection and analysis followed the laboratory procedure previously described by Alvarez Hess, et al. [23]. Briefly, a gas sample was collected manually through the vent valve adapter of the module using a needle and an air-tight glass syringe (SGE International Pty Ltd., Ringwood, VIC, Australia). The gas samples were transferred into pre-vacuumed exetainers® screw capped with septa (12 mL soda glass vial, Labco Ltd., Buckinghamshire, UK). The exetainers® were pre-vacuumed with a pressure of <5 × 10⁻³ torr using the vial evacuation manifold. The samples’ methane, carbon dioxide, and nitrous oxide proportions were determined using a gas chromatograph (7890A Agilent, Santa Clara, CA, USA) equipped with an autosampler and flame ionization detector.
A filter bag with a pore size of 25 μm (F57 ANKOM bag, ANKOM Technology, Macedon, NY, USA) was used to quantify the DMD of the incubated feeds according to the method described by Prates, de Oliveira, de la Fuente Oliver, Abecia, and Fondevila [8]. Heat-sealed F57 filter bags were incubated holding 1 g of substrate in a 250 mL ANKOM bottle with 100 mL of 3:1 ratio buffer media to RF solution. The filter bags were washed slightly using cold water in a plastic water diffuser (tattoo squeeze) after 24 h of incubation, and the residue was dried in a 60 °C incubator for 48 h. The samples were weighed for the remaining dry matter and computed from the initial weight using the following equation [14,24].
where W1 is the weight (g) of the empty filter bag, W2 is the weight (g) of the substrate, and W3 is the weight (g) of the final oven-dried bag with the feed residue.
% DMD = ((W1 + W2) − W3) × 100
The partition factor (PF) was calculated as DMD (mg) divided by the ml of gas produced in vitro after 24 h of incubation [25], quantifying in vitro fermentation efficiency.
In addition to the above variables, volatile fatty acids (VFA) and ammonia-N concentrations were estimated after the 180th day of storage in the second phase of this study. The VFAs were determined using a gas chromatograph fitted with a flame ionization detector [26] and using methyl valerate as the internal standard. The ammonia concentration was quantified using the colorimetric technique with a multiscan colorimetric plate reader (Thermo Multiskan Spectrum, Thermo Fisher Scientific, Waltham, MA, USA), according to the process described by Weatherburn [27].
2.6. Data Analysis
The data on gas production, composition, lag time, gas production rate, DMD, pH, ammonia-N, and VFA were analyzed via unbalanced ANOVA using the GenStat V18 statistical package:
where Y is the continuous dependent variable, µ is the overall mean of the population, Si is the fixed effect of the substrate (i = wheat, lucerne hay), Pj is the fixed effect of the RF storage method (j = fresh RF, D−20 °C, and −80 °C), Dk is the fixed effect of the duration of storage (k = 1 day, 14 days, 30 days, or 180 days), (SPD)ijk is the interaction effect between the independent variables, and e is the residual error.
Yijk = µ + Si + Pj + Dk + (SPD)ijk + eijk
Each ANKOM module was used as a unit of analysis to test the variation and compare the mean differences for p-values less than 5%. The treatment structure was substrate × storage methods × days of storage, with the ANKOM systems (n = 2) as a blocking factor. Interactions between fixed effects were analyzed for each variable using the Linear Mixed Model of GenStat [28].
3. Results
The chemical compositions of the wheat grain and lucerne hay used as substrates in this experiment are presented in Table 1. The crude protein, NDF, ADF, fat, and ash content of the lucerne hay was greater than that of the wheat grain, while the wheat grain possessed higher NFC, ME, dry matter digestibility, and organic matter digestibility compared with the lucerne hay.
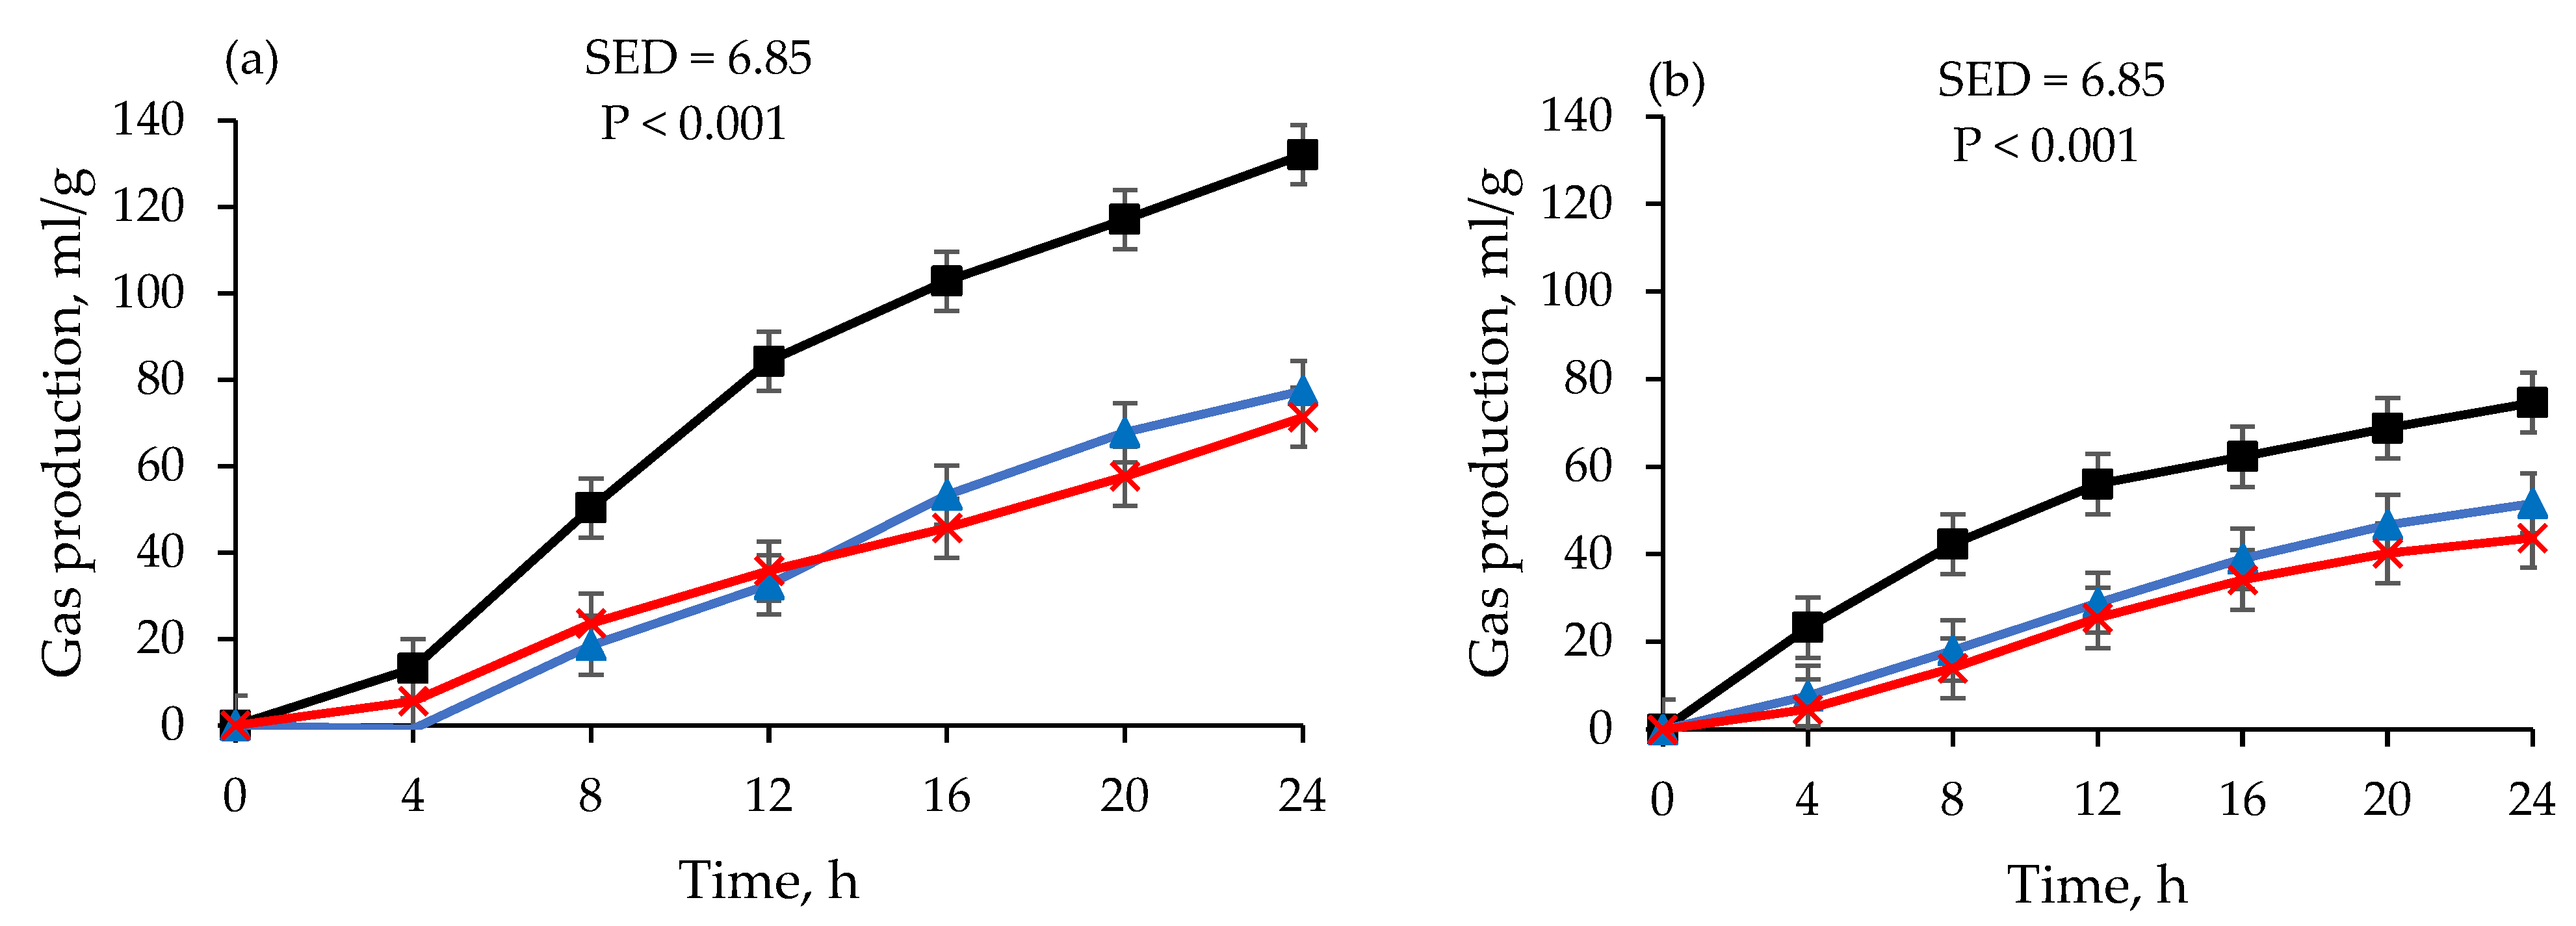
The effects of using RF preserved at −80 °C across storage periods (14 days and 30 days) on the fermentation parameters are presented in Table 2 and Figure 1. The gas production, methane concentration, and DMD of the feeds fermented using the fresh RF were larger than those of the feeds fermented using RF preserved at −80 °C (p < 0.001). There was no difference between gas production values on days 14 and 30 for −80 °C. The lag time of the feeds fermented using the fresh RF was lower (p < 0.001) than that of the feeds fermented using RF preserved at −80 °C. The gas production rate was decreased, and the pH was increased when RF preserved at −80 °C was used (p < 0.001). There was no difference between the fermentation parameters on days 14 and 30 for DMD and methane for either feed. The partition factor of the wheat grain fermented using RF preserved at −80 °C did not differ on days 14 and 30.
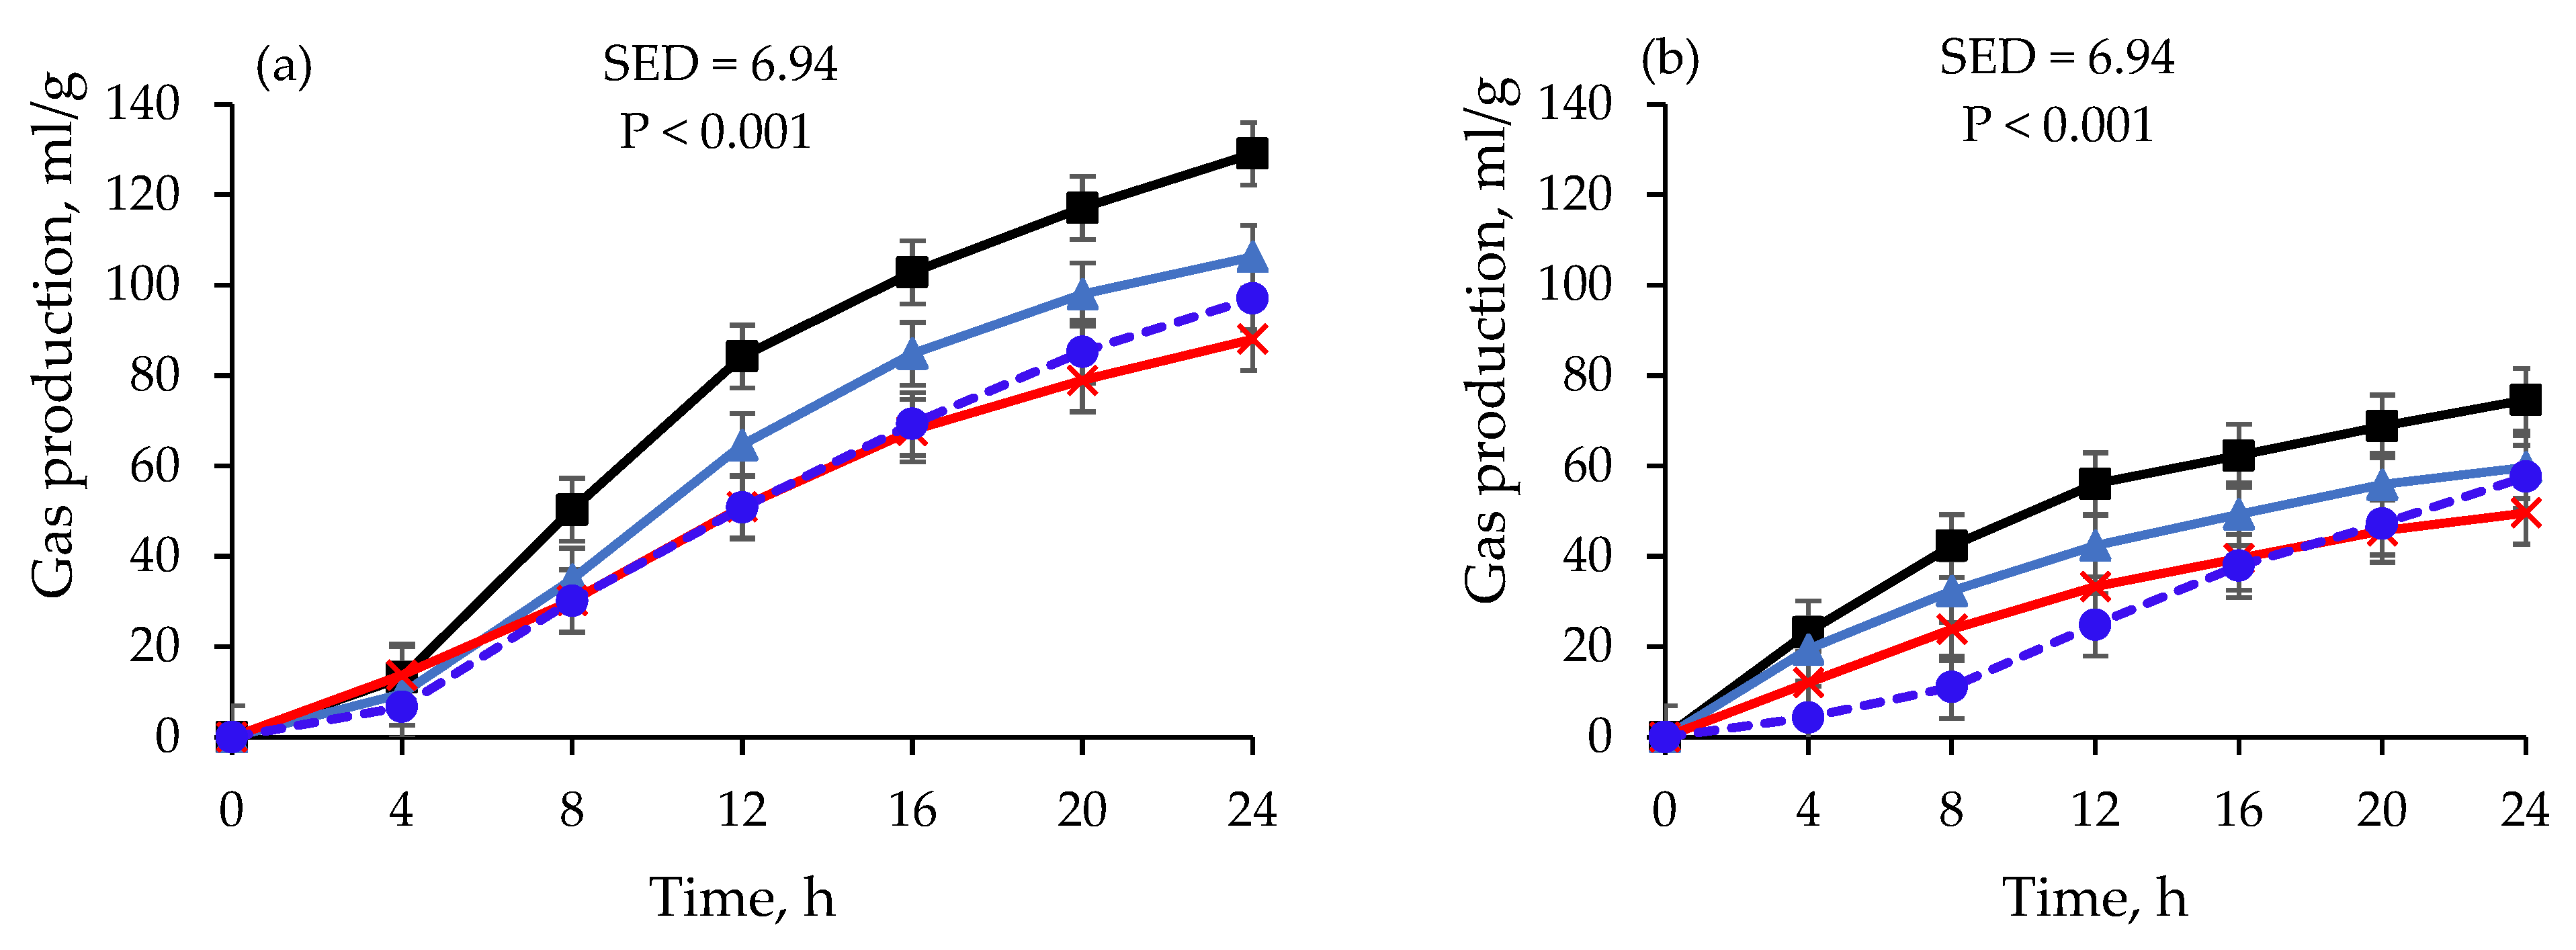
The volume and rate of the gas production, amount of methane, and DMD of the incubations using the RF preserved at D−20 °C were lower (p < 0.001) compared with the incubations using the fresh RF (Table 3). In contrast, compared with the incubations using the preserved RF, the incubations using the fresh RF had lower (p < 0.001) lag time, pH, carbon dioxide, and PF for both feeds. The gas production of the wheat grain fermented using the RF preserved at D−20 °C for 30 days was 106.3 mL/g and was reduced (p < 0.001) by 8.5% after using the same RF preserved for 180 days (Table 3 and Figure 2). There was no difference between the gas production from the lucerne hay fermented using the RF preserved at D−20 °C for 14 days, 30 days, and 180 days.
The wheat grain lag time (h) was longer (p < 0.001) when the RF preserved at D−20 °C was used than when the fresh RF was used; however, no difference was observed between successive runs of lucerne hay (days 14, 30, and 180) fermented using the same RF (it ranged from 0.31 h to 0.80 h). The lucerne hay lag time was lower (p < 0.001) than that of the wheat grain in all the fermentation periods. Conversely, the gas production rate (mL/h) was greater (p < 0.001) when the fresh RF was used for the incubation of both feeds than when the RF preserved at D−20 °C was used. Moreover, the lucerne hay gas production rate showed a linear reduction as the RF storage period increased, and was lower (p < 0.001) than that of the wheat grain for all storage times.
The DMD values were the same for the wheat grain fermented using the fresh RF and the RF preserved at D−20 °C for 14 days, and for the lucerne hay at days 14 and 30. The DMD declined (p < 0.001) by 8.5% for the wheat grain and 6.2% for the lucerne hay when the RF stored at D−20 °C for 180 days was used instead of that stored for 30 days. The methane percentage of the wheat grain (8.79%) and the lucerne hay (6.33%) fermented using the fresh RF was larger (p < 0.001) than that fermented using the RFs preserved at D-20 °C, while there was no difference in methane production between days 14 and 30 for either feed. The percentage of methane in the total gas production was below 1% for both feeds fermented using the RF preserved at D−20 °C for 180 days.
The partition factor was the same between days 30 and 180 for the wheat grain, and between days 14 and 180 for the lucerne hay fermented using the RF preserved at D−20 °C. The ammonia-N values fell (p < 0.001) for the lucerne hay over the preservation days, but was stable for the wheat grain fermented using the RF stored at D−20 °C. The ammonia-N concentration of the lucerne hay (0.26 mL/g) was larger (p < 0.001) than that of the wheat grain (0.22 mL/g) fermented using the RF preserved for 180 days at D−20 °C. There was significant interaction (p < 0.05) between the feeds and the duration of RF storage at D−20 °C, except for the pH and DMD parameters.
The total VFA values of the wheat grain and lucerne hay incubated using the RF preserved at D−20 °C for 180 days were 86.8 mM/L and 79.3 mM/L, respectively (Figure 3). The acetic acid produced from the wheat grain (37.3 mM/L) was greater (p < 0.001) than that of produced from the lucerne hay (31.8 mM/L), and the propionic acid produced from the wheat grain (24.4 mM/L) was lower (p < 0.001) than that produced from the lucerne hay (36.9 mM/L). The isobutyric, butyric, isovaleric, and valeric acid contents (mM/L) from the feeds fermented using the RF preserved for 180 days at D−20 °C were 2.98, 3.63, 1.55, and 2.00 for the lucerne hay and 11.8, 6.62, 3.54, and 3.10 for the wheat grain, respectively.
Comparing −80 °C and D−20 °C (Table 2 and Table 3), the incubations using the RF stored at D−20 °C had greater (p < 0.001) gas volume and rate of production than those of the RF stored at −80 °C for both feeds over the days of storage, except for the lucerne hay on day 30. The lag time for the feeds fermented using the RF preserved at D−20 °C was lower than that of the feeds fermented using the RF stored at −80 °C. There was no difference between D−20 °C and −80 °C in terms of concentration of methane and carbon dioxide on days 14 and 30. However, the DMD of both feeds was higher (p < 0.001) for the RF stored at D−20 °C than for the RF stored at −80 °C, and the PF of both of the feeds fermented at D−20 °C was also lower (p < 0.05) than that of the feeds fermented at −80 °C.
4. Discussion
The cumulative gas production after 24 h was lower when using the preserved RF than when using the fresh RF. Previous researchers have reported similar results for gas production with various feeds fermented in fresh and preserved RF [14,29,30]. The differences in microbial concentration caused by mechanical damage to cell structures from cold shock could be the reason for the reduced gas production when using preserved RF [29,31]. Nevertheless, despite the effect of the cold shock on the micro-organisms, the RF stored under both storage conditions utilized in the present experiment still possessed substantial fermentative capacity. Moreover, there was no difference between the gas production values of either feed after using the RF preserved at D−20 °C for 30 days and 180 days. The niche of the microbes most affected during the storage could have been occupied by the less affected groups, resulting in stable fermentation [8] and implying the possibility of using preserved RF for up to 180 days.
Lag time (h) is the time prior to gas production, or the initial delay before the release of gas begins [32,33]. The micro-organisms re-establish the required inputs, multiply, and grow during the lag time to enable the fermentation of the substrate [34]. The lag time was lower when the feeds were fermented using the fresh RF, and it was stable between day 30 and day 180 for the wheat grain, while for the lucerne hay fermented at D−20 °C, it was stable between day 1 and day 180. This stability demonstrated the potential of D−20 °C RF storage to maintain microbial density and diversity. Moreover, the lag time of the lucerne hay was shorter compared with that of the wheat grain. The excessive availability of soluble starch in the wheat grain can lower the pH, resulting in reduced microbial activity and degradation in the initial phase [35]. Additionally, when concentrates such as wheat grain are fermented, the microbial population needs to be altered towards osmophilic and sugar-loving microbes such as protozoa before fermentation commences [9]. Thus, this result confirms that lag time is affected by the differences in substrate quality [36,37].
Methane and carbon dioxide compositions are used as a source of information for the examination of potential feeds and feed additives that can reduce greenhouse gas emissions from livestock [1,2]. However, reports on the impact of RF storage on methane and carbon dioxide production from in vitro experiments are limited. The proportion of methane gas decreased by over 50% in both feeds following the use of the preserved RF and reached below 1% when using the RF preserved for 180 days. This shows that methanogens are highly susceptible to the process of cold storage and thawing, and this can be attributed to a reduction in the protozoa population caused by freezing [10,14] as protozoal concentration and methane emissions are linearly correlated [38]. A study by Belanche, Palma-Hidalgo, Nejjam, Serrano, Jimenez, Martin-Garcia, and Yanez-Ruiz [9] also demonstrated declining methanogens in frozen RF. The reduction in methanogens resulted in a lower methane concentration and an increased percentage of carbon dioxide in gas samples collected after using preserved RF. Therefore, preserved RF muse be used with caution in methane studies.
The interactions between RF storage methods, feeds, and duration of storage could be attributed to differences in microbial concentration between the fresh and preserved RFs and differences in chemical composition between the feeds. Therefore, it was not surprising that the duration of storage was inversely related to the volume of gas production and methane concentration. Confirming the interaction, the carbon dioxide percentages and PF values increased with the increasing duration of RF storage for both feeds.
The use of 5% DMSO as an additive for RF storage limits the effect of cell dehydration during freezing and prevents intracellular ice crystal formation [13]. Abdel-Aziz, et al. [39] and Denek, Can, and Avci [5] demonstrated that DMSO was a more effective cryoprotectant than glycerol because of its rapid diffusion into cells, whereby it protects the cell membranes of micro-organisms and allows a superior protozoa recovery rate. Moreover, the RF mixed with 5% DMSO and frozen at −20 °C exhibited higher fermentation parameters than the RF preserved at −80 °C (with and without DMSO) and at D−20 °C [14], suggesting that the effect of DMSO depends on the storage temperature.
There was no difference between the storage methods in terms of the concentration of methane and carbon dioxide on days 14 and 30. However, the incubations using the RF stored at D−20 °C had greater gas volume, gas production rate, and DMD values than the incubations using the RF stored at −80 °C for both feeds over all the days of storage, and hence, reduced PF values. The lag time was also lower for the feeds fermented using the RF preserved at D−20 °C as the reactivation and proliferation of micro-organisms required less time than in the case of the feeds fermented using the RF stored at −80 °C. These findings support those of a previous study [14], which suggested D−20 °C as a modest option for RF storage.
The DMD of the fresh RF was greater than that of the preserved RF, and it further reduced with the increasing storage period. This was possible because a higher amount of dry matter could be consumed by active and concentrated micro-organisms in the fresh RF, and the longer RF storage period reduced the microbial population [14]. This finding is consistent with the study of [10], in which it was demonstrated that fresh RF resulted in higher DMD, followed by RF preserved at −20 °C for rapeseed meal and grass nuts. Prates, de Oliveira, de la Fuente Oliver, Abecia, and Fondevila [8] also reported that the DMD of fresh RF was greater than that of RF preserved using liquid nitrogen. However, there was no difference in the DMD values on days 14 and 30 between the different storage methods.
The PF values increased for the preserved RF compared with those of the fresh RF as a response to the declining gas production; however, it was stable for the lucerne hay incubated at D−20 °C on days 14, 30, and 180. The PF of the wheat grain did not differ between fermentations on days 30 and 180 of RF storage at D−20 °C. Lower PF indicates a lower dry matter requirement for gas production [25,40]. Therefore, the efficiency of the fresh RF is higher in terms of dry matter conversion and gas production. The stable PF value of the feeds fermented at D−20 °C validates the possibility of using D−20 °C for in vitro feed fermentation as a storage method.
The freezing of RF can reduce ammonia-N by minimizing protein metabolism [9], which explains the ammonia-N reduction when the RF preserved at 180 days was compared with the fresh RF. The decline in ammonia-N concentration with increased storage duration is consistent with a prior study by Tunkala, DiGiacomo, Hess, Dunshea, and Leury [14]. However, there was no difference between the ammonia-N values of the lucerne hay incubated using the RF preserved for 180 days (0.29 mL/g) compared with that incubated for 30 days (0.32 mL/g) at D−20 °C, indicating the potential of D−20 °C for 180 days as an RF storage method.
The total VFA declined for the feeds fermented using the RF preserved for 180 days at D−20 °C, and the reduction reached 20–25% for both feeds compared with the RF stored for 14 days and 30 days in the study by Tunkala, DiGiacomo, Hess, Dunshea, and Leury [14]. However, the VFA values from the feeds fermented using the RF stored at D−20 °C for 180 days indicates the survival of a sufficient quantity of beneficial micro-organisms required for feed fermentation.
The differences between the wheat grain and lucerne hay in in vitro fermentation parameters were expected. The wheat grain promoted higher fermentation in terms of gas production, DMD, and the proportion of methane gas in both the fresh and preserved RFs as the NFC content and the organic and dry matter digestibility of the wheat grain were greater than those of the lucerne hay. NFC and feed digestibility are positively correlated with the volume of cumulative gas [41,42] and methane production [43,44]. The lucerne hay produced a greater carbon dioxide percentage and PF, and a lower lag time. The lower digestibility and the higher ADF and NDF contents of the lucerne hay may also account for the increased PF in the lucerne hay. PF is inversely proportional to cumulative gas production, as energy is consumed to produce gas [3,40]. Therefore, the differences between the fermented feeds may be attributed to variations in their chemical composition.
In summary, the effect of the storage methods was consistent in magnitude for each substrate in terms of the variables used, excepting the insignificant differences between both methods in terms of gas composition values. All the quantified parameters of the substrates incubated using the preserved RF were lower than those of the substrates incubated using the fresh RF. However, D−20 °C produced fewer PF differences in both feeds, and the gas volume, rate of gas production, and DMD of the substrates fermented at D−20 °C were higher than those of the substrates fermented at −80 °C. Moreover, for the feeds fermented using the RF preserved at D−20 °C, there was no difference between day 30 and day 180 in total gas production for either feed, in PF for the wheat, or in ammonia-N for the lucerne hay. The lag times of the feeds fermented using the RF stored at D−20 °C were also lower than those of the feeds fermented using the RF stored at −80 °C. Therefore, D−20 °C showed relatively better performance than −80 °C and has the potential to be used as an RF storage method for up to 180 days. Future work may focus on whether extended fermentation beyond 24 h with preserved RF may yield fermentation characteristics quantitatively similar to those of fresh RF fermented for 24 h.
5. Conclusions
The general trend of in vitro fermentation parameters was that the fresh RF had greater gas production, DMD, and PF values, followed by the RF stored at D−20 °C and the RF stored at −80 °C. Therefore, storing RF at D−20 °C is preferable to storing it at −80 °C. Moreover, D−20 °C can preserve RF for up to 180 days for the in vitro screening of feeds when access to fresh RF is limited. Nevertheless, additional RF storage studies are required to minimize the existing differences between fresh and preserved RF in terms of in vitro feed fermentation characteristics. Further research on the microbial quality and enzymatic activities of preserved RF could also help us to understand the basic chemical and biological changes that occur during and after the storage process.
Supplementary Materials
The following supporting information can be downloaded at: https://www.mdpi.com/article/10.3390/fermentation9040392/s1.
Author Contributions
Conceptualization, B.Z.T. and P.S.A.H.; methodology, B.Z.T., P.S.A.H., K.D., F.R.D. and B.J.L.; formal analysis, B.Z.T., P.S.A.H. and F.R.D.; investigation, B.Z.T.; data curation, B.Z.T. and P.S.A.H.; writing—original draft preparation, B.Z.T.; writing—review and editing, P.S.A.H., K.D., F.R.D. and B.J.L.; project administration, B.J.L. and K.D.; funding acquisition, B.J.L., F.R.D. and K.D. All authors have read and agreed to the published version of the manuscript.
Funding
This work was supported by the Melbourne Research Scholarship for graduate study at the University of Melbourne.
Institutional Review Board Statement
All procedures were conducted in accordance with the Australian Code of Practice for the Care and Use of Animals for Scientific Purposes [29]. Approval to conduct the experiment was obtained from the Agricultural Research and Extension Animal Ethics Committee of the Department of Jobs, Precincts and Regions, ethics number 1513585.1.
Data Availability Statement
The data presented in this study are available and have been uploaded as “Supplementary Files”.
Acknowledgments
The authors are grateful to the DJPR Ellinbank farm management and staff for their assistance with rumen fluid collection.
Conflicts of Interest
The authors declare no conflict of interest.
References
- Navarro-Villa, A.; O’brien, M.; López, S.; Boland, T.; O’kiely, P. Modifications of a gas production technique for assessing in vitro rumen methane production from feedstuffs. Anim. Feed Sci. Technol. 2011, 166, 163–174. [Google Scholar] [CrossRef]
- Danielsson, R.; Ramin, M.; Bertilsson, J.; Lund, P.; Huhtanen, P. Evaluation of a gas in vitro system for predicting methane production in vivo. J. Dairy. Sci. 2017, 100, 8881–8894. [Google Scholar] [CrossRef] [PubMed]
- Getachew, G.; Robinson, P.H.; DePeters, E.J.; Taylor, S.J. Relationships between chemical composition, dry matter degradation and in vitro gas production of several ruminant feeds. Anim. Feed Sci. Technol. 2004, 111, 57–71. [Google Scholar] [CrossRef]
- Chaudhry, A. Slaughtered cattle as a source of rumen fluid to evaluate supplements for in vitro degradation of grass nuts and barley straw. Open. Vet. J. 2008, 2, 16–22. [Google Scholar] [CrossRef]
- Denek, N.; Can, A.; Avci, M. Frozen rumen fluid as microbial inoculum in the two-stage in vitro digestibility assay of ruminant feeds. S. Afr. J. Anim. Sci. 2010, 40, 251–256. [Google Scholar] [CrossRef]
- Luchini, N.; Broderick, G.; Combs, D. Preservation of ruminal microorganisms for in vitro determination of ruminal protein degradation. J. Anim. Sci. 1996, 74, 1134–1143. [Google Scholar] [CrossRef]
- Mould, F.; Kliem, K.; Morgan, R.; Mauricio, R. In vitro microbial inoculum: A review of its function and properties. Anim. Feed Sci. Technol. 2005, 123, 31–50. [Google Scholar] [CrossRef]
- Prates, A.; de Oliveira, J.; de la Fuente Oliver, G.; Abecia, L.; Fondevila, M. Validation of sheep rumen fluid frozen in liquid N as inoculum for in vitro gas production trials. In Options Méditerranéennes. Series A: Mediterranean Seminars; International Centre for Advanced Mediterranean Agronomic Studies: Paris, France, 2011; Volume 99, pp. 141–147. [Google Scholar]
- Belanche, A.; Palma-Hidalgo, J.M.; Nejjam, I.; Serrano, R.; Jimenez, E.; Martin-Garcia, I.; Yanez-Ruiz, D.R. In vitro assessment of the factors that determine the activity of the rumen microbiota for further applications as inoculum. J. Sci. Food Agric. 2018, 99, 163–172. [Google Scholar] [CrossRef]
- Chaudhry, A.; Mohamed, R. Fresh or frozen rumen contents from slaughtered cattle to estimate in vitro degradation of two contrasting feeds. Czech J. Anim. Sci. 2012, 57, 265–273. [Google Scholar] [CrossRef]
- Tanasawa, I. Things we do not know about cryopreservation of biological organs. Ann. N. Y. Acad. Sci. 1998, 858, 227–234. [Google Scholar] [CrossRef]
- Kisidayova, S.M.T.; Varadyova, Z. Preliminary results of the regeneration of the in vitro rumen ciliate cultures–Effect of their cytoresistance. Endocytobiosis Cell. Res. 2006, 17, 146–149. [Google Scholar]
- Nsabimana, E.; Kišidayová, S.; Macheboeuf, D.; Newbold, C.; Jouany, J. Two-step freezing procedure for cryopreservation of rumen ciliates, an effective tool for creation of a frozen rumen protozoa bank. Appl. Environ. Microbiol. 2003, 69, 3826–3832. [Google Scholar] [CrossRef] [PubMed]
- Tunkala, B.Z.; Di Giacomo, K.; Hess, P.S.A.; Dunshea, F.R.; Leury, B.J. Rumen fluid preservation for in vitro gas production systems. Anim. Feed Sci. Technol. 2022, 292, 115405. [Google Scholar] [CrossRef]
- National Health and Medical Research Council. Australian Code for the Care and Use of Animals for Scientific Purposes; National Health and Medical Research Council: Canberra, Australia, 2013. [Google Scholar]
- Horwitz, W. Official methods of analysis of AOAC International. In Agricultural Chemicals, Contaminants, Drugs; Horwitz, W., Ed.; AOAC International: Gaithersburg, MD, USA, 1997; Volume I, p. 2010. [Google Scholar]
- SCA. Feeding Standards for Australian Livestock. Ruminants; Csiro Publishing: Melbourne, Australia, 1990. [Google Scholar]
- AFFIA. Australian Fodder Industry Association—Laboratory Methods Manual; AFFIA: Melbourn, Australia, 2014. [Google Scholar]
- Gonzalez-Rivas, P.; DiGiacomo, K.; Giraldo, P.; Leury, B.; Cottrell, J.; Dunshea, F. Reducing rumen starch fermentation of wheat with three percent sodium hydroxide has the potential to ameliorate the effect of heat stress in grain-fed wethers. J. Anim. Sci. 2017, 95, 5547–5562. [Google Scholar] [CrossRef]
- Belanche, A.; Doreau, M.; Edwards, J.E.; Moorby, J.M.; Pinloche, E.; Newbold, C.J. Shifts in the rumen microbiota due to the type of carbohydrate and level of protein ingested by dairy cattle are associated with changes in rumen fermentation. J. Nutr. 2012, 142, 1684–1692. [Google Scholar] [CrossRef]
- Marten, G.C.; Barnes, R.F. Prediction of energy digestibility of forages with in vitro rumen fermentation and fungal enzyme systems. In Standardization of Analytical Methodology for Feeds: Proceedings of a Workshop Held in Ottawa, Canada, 12–l4 March 1979, Ottawa, ON, Canada; IDRC: Ottawa, ON, Canada, 1979; 128p. [Google Scholar]
- ANKOM. ANKOM Gas Production System Operator’s Manual; ANKOM Technology: Macedon, NY, USA, 2018. [Google Scholar]
- Alvarez Hess, P.S.; Eckard, R.J.; Jacobs, J.L.; Hannah, M.C.; Moate, P.J. Comparison of five methods for the estimation of methane production from vented in vitro systems. J. Sci. Food Agric. 2019, 99, 109–116. [Google Scholar] [CrossRef]
- Park, K.R.; Park, C.S.; Kim, B.G. An enzyme complex increases in vitro dry matter digestibility of corn and wheat in pigs. Springerplus 2016, 5, 1–7. [Google Scholar] [CrossRef]
- Blümmel, M.; Makkar, H.; Becker, K. In vitro gas production: A technique revisited. J. Anim. Physiol. Anim. Nutr. 1997, 77, 24–34. [Google Scholar] [CrossRef]
- Jouany, J. Volatile fatty acid and alcohol determination in digestive contents, silage juices, bacterial cultures and anaerobic fermentor contents, in microbial fermentation, biological liquids, analytic method using gas-liquid chromatography. Sci. Des Aliment. 1982, 2, 131–144. [Google Scholar]
- Weatherburn, M. Phenol-hypochlorite reaction for determination of ammonia. Anal. Chem. 1967, 39, 971–974. [Google Scholar] [CrossRef]
- EndNote Team. EndNote, X9 ed. Philadelphia, USA, 2013.
- Hristov, A.N.; McAllister, T.A.; Xu, Z.; Newbold, C.J. Proteolytic activity in ruminal fluid from cattle fed two levels of barley grain: A comparison of three methods of determination. J. Sci. Food Agric. 2002, 82, 1886–1893. [Google Scholar] [CrossRef]
- Hervás, G.; Frutos, P.; Giráldez, F.J.; Mora, M.J.; Fernández, B.; Mantecón, Á.R. Effect of preservation on fermentative activity of rumen fluid inoculum for in vitro gas production techniques. Anim. Feed Sci. Technol. 2005, 123–124, 107–118. [Google Scholar] [CrossRef]
- Furchtenicht, J.E.; Broderick, G.A. Effect of inoculum preparation and dietary energy on microbial numbers and rumen protein degradation activity. J. Dairy. Sci. 1987, 70, 1404–1410. [Google Scholar] [CrossRef] [PubMed]
- Mauricio, R.M.; Owen, E.; Mould, F.L.; Givens, I.; Theodorou, M.K.; France, J.; Davies, D.R.; Dhanoa, M.S. Comparison of bovine rumen liquor and bovine faeces as inoculum for an in vitro gas production technique for evaluating forages. Anim. Feed Sci. Technol. 2001, 89, 33–48. [Google Scholar] [CrossRef]
- Elghandour, M.; Vázquez, J.; Salem, A.; Kholif, A.; Cipriano, M.; Camacho, L.; Márquez, O. In vitro gas and methane production of two mixed rations influenced by three different cultures of Saccharomyces cerevisiae. J. Appl. Anim. Res. 2017, 45, 389–395. [Google Scholar] [CrossRef]
- Ingraham, J.; Maaløe, O.; Neidhardt, F. Growth of cells and cultures. In Growth of the Bacterial Cell; Sinauer Associates: Boston, MA, USA, 1983. [Google Scholar]
- Lee, M.R.; Merry, R.J.; Davies, D.R.; Moorby, J.M.; Humphreys, M.O.; Theodorou, M.K.; MacRae, J.C.; Scollan, N.D. Effect of increasing availability of water-soluble carbohydrates on in vitro rumen fermentation. Anim. Feed Sci. Technol. 2003, 104, 59–70. [Google Scholar] [CrossRef]
- Cone, J.W.; van Gelder, A.H.; Visscher, G.J.; Oudshoorn, L. Influence of rumen fluid and substrate concentration on fermentation kinetics measured with a fully automated time related gas production apparatus. Anim. Feed Sci. Technol. 1996, 61, 113–128. [Google Scholar] [CrossRef]
- France, J.; Dijkstra, J.; Dhanoa, M.S.; Lopez, S.; Bannink, A. Estimating the extent of degradation of ruminant feeds from a description of their gas production profiles observed in vitro: Derivation of models and other mathematical considerations. Br. J. Nutr. 2000, 83, 143–150. [Google Scholar] [CrossRef]
- Guyader, J.; Eugène, M.; Noziere, P.; Morgavi, D.; Doreau, M.; Martin, C. Influence of rumen protozoa on methane emission in ruminants: A meta-analysis approach1. Animal 2014, 8, 1816–1825. [Google Scholar] [CrossRef]
- Abdel-Aziz, H.; Hassan, H.; Abd-El-Raof, Y.; Abou-Zeina, H.A.; Galbt, S. Trails for cryopreservation of rumen protozoa in sheep. Glob. Vet. 2007, 1, 9–16. [Google Scholar]
- Harikrishna, C.; Mahender, M.; Reddy, Y.R.; Prakash, M.G.; Sudhakar, K.; Pavani, M. Evaluation of in vitro gas production and nutrient digestibility of complete diets supplemented with different levels of thermotolerant yeast in Nellore rams. Vet. World 2012, 5, 477–485. [Google Scholar] [CrossRef]
- Menke, K.H.; Stengass, H. Estimation of the energetic feed value obtained from chemical analysis and in vitro gas production using rumen fluid. Anim. Res. Dev. 1988, 28, 7–55. [Google Scholar]
- Rymer, C.; Huntington, J.A.; Williams, B.A.; Givens, D.I. In vitro cumulative gas production techniques: History, methodological considerations and challenges. Anim. Feed Sci. Technol. 2005, 123–124, 9–30. [Google Scholar] [CrossRef]
- Meale, S.; Chaves, A.; Baah, J.; McAllister, T. Methane production of different forages in in vitro ruminal fermentation. Asian-Australas. J. Anim. Sci. 2012, 25, 86. [Google Scholar] [CrossRef]
- Kim, S.H.; Mamuad, L.L.; Jeong, C.D.; Choi, Y.J.; Lee, S.S.; Ko, J.Y.; Lee, S.S. In vitro Evaluation of Different Feeds for Their Potential to Generate Methane and Change Methanogen Diversity. Asian-Australas. J. Anim. Sci. 2013, 26, 1698–1707. [Google Scholar] [CrossRef] [PubMed]
Figure 1.
Gas production curves for 24 h incubation of feedstuffs ((a) wheat grain and (b) lucerne hay) at 39 °C using fresh rumen fluid on day 1 (![Fermentation 09 00392 i001]() ) and rumen fluid snap-frozen using liquid nitrogen and stored at −80 °C (−80 °C) for 14 days (
) and rumen fluid snap-frozen using liquid nitrogen and stored at −80 °C (−80 °C) for 14 days (![Fermentation 09 00392 i002]() ) and 30 days (
) and 30 days (![Fermentation 09 00392 i003]() ) at varying incubation times. Data at day 1 are for fresh RF. Data are least-square means of gas production after converting gas pressure into gas volume using Avogadro’s law.
) at varying incubation times. Data at day 1 are for fresh RF. Data are least-square means of gas production after converting gas pressure into gas volume using Avogadro’s law.
 ) and rumen fluid snap-frozen using liquid nitrogen and stored at −80 °C (−80 °C) for 14 days (
 ) and 30 days (
 ) at varying incubation times. Data at day 1 are for fresh RF. Data are least-square means of gas production after converting gas pressure into gas volume using Avogadro’s law.
Figure 1.
Gas production curves for 24 h incubation of feedstuffs ((a) wheat grain and (b) lucerne hay) at 39 °C using fresh rumen fluid on day 1 (![Fermentation 09 00392 i001]() ) and rumen fluid snap-frozen using liquid nitrogen and stored at −80 °C (−80 °C) for 14 days (
) and rumen fluid snap-frozen using liquid nitrogen and stored at −80 °C (−80 °C) for 14 days (![Fermentation 09 00392 i002]() ) and 30 days (
) and 30 days (![Fermentation 09 00392 i003]() ) at varying incubation times. Data at day 1 are for fresh RF. Data are least-square means of gas production after converting gas pressure into gas volume using Avogadro’s law.
) at varying incubation times. Data at day 1 are for fresh RF. Data are least-square means of gas production after converting gas pressure into gas volume using Avogadro’s law.
) and rumen fluid snap-frozen using liquid nitrogen and stored at −80 °C (−80 °C) for 14 days () and 30 days () at varying incubation times. Data at day 1 are for fresh RF. Data are least-square means of gas production after converting gas pressure into gas volume using Avogadro’s law.
Figure 2.
Gas production curves for 24 h incubation of feedstuffs ((a) wheat grain and (b) lucerne hay) at 39 °C using fresh rumen fluid on day 1 (![Fermentation 09 00392 i004]() ) and rumen fluid treated with DMSO and kept at D−20 °C for 14 days (
) and rumen fluid treated with DMSO and kept at D−20 °C for 14 days (![Fermentation 09 00392 i005]() ), 30 days (
), 30 days (![Fermentation 09 00392 i006]() ), and 180 days (
), and 180 days (![Fermentation 09 00392 i007]() ) at varying incubation times. Data at day 1 are for fresh rumen fluid. Data are least-square means of gas production after converting gas pressure into gas volume using Avogadro’s law.
) at varying incubation times. Data at day 1 are for fresh rumen fluid. Data are least-square means of gas production after converting gas pressure into gas volume using Avogadro’s law.
 ) and rumen fluid treated with DMSO and kept at D−20 °C for 14 days (
 ), 30 days (
 ), and 180 days (
 ) at varying incubation times. Data at day 1 are for fresh rumen fluid. Data are least-square means of gas production after converting gas pressure into gas volume using Avogadro’s law.
Figure 2.
Gas production curves for 24 h incubation of feedstuffs ((a) wheat grain and (b) lucerne hay) at 39 °C using fresh rumen fluid on day 1 (![Fermentation 09 00392 i004]() ) and rumen fluid treated with DMSO and kept at D−20 °C for 14 days (
) and rumen fluid treated with DMSO and kept at D−20 °C for 14 days (![Fermentation 09 00392 i005]() ), 30 days (
), 30 days (![Fermentation 09 00392 i006]() ), and 180 days (
), and 180 days (![Fermentation 09 00392 i007]() ) at varying incubation times. Data at day 1 are for fresh rumen fluid. Data are least-square means of gas production after converting gas pressure into gas volume using Avogadro’s law.
) at varying incubation times. Data at day 1 are for fresh rumen fluid. Data are least-square means of gas production after converting gas pressure into gas volume using Avogadro’s law.
) and rumen fluid treated with DMSO and kept at D−20 °C for 14 days (), 30 days (), and 180 days () at varying incubation times. Data at day 1 are for fresh rumen fluid. Data are least-square means of gas production after converting gas pressure into gas volume using Avogadro’s law.
Figure 3.
The amount of volatile fatty acids (VFAs) produced from (a) wheat grain and (b) lucerne hay after 24 h fermentation using rumen fluid, either fresh or treated with DMSO and kept at D−20 °C for 180 days. Data are least-square means of different VFAs in the substrate.
Figure 3.
The amount of volatile fatty acids (VFAs) produced from (a) wheat grain and (b) lucerne hay after 24 h fermentation using rumen fluid, either fresh or treated with DMSO and kept at D−20 °C for 180 days. Data are least-square means of different VFAs in the substrate.


Table 1.
Chemical composition of wheat grain and lucerne hay used as substrates.
| Parameter | Lucerne Hay | Wheat Grain |
|---|---|---|
| Dry Matter | 95.2 | 90.3 |
| Moisture | 4.8 | 9.7 |
| Crude Protein | 22.5 | 13.5 |
| ADF | 24.6 | 4.9 |
| NDF | 39.9 | 11.1 |
| Fat | 4.1 | 1.5 |
| Ash | 9.9 | <1.0 |
| NFC | 23.7 | 75.9 |
| Dry matter digestibility | 65.1 | 94.3 |
| Organic matter digestibility 1 | 62.0 | 92.7 |
| ME 1 | 9.60 | 14.2 |
1 calculated values; ADF: acid detergent fiber; NDF: neutral detergent fiber; NFC: non-fiber carbohydrate; ME: metabolizable energy. The dry matter and moisture were measured as a percentage of the sample. The crude protein, ADF, NDF, fat, ash, NFC, dry matter digestibility, and organic matter digestibility were measured as a percentage of dry matter. The ME was measured as megajoules of energy per kilogram of dry matter (MJ/kg DM).
Table 2.
The effects of feedstuffs (wheat grain vs. lucerne hay) and rumen fluid storage days (14 days and 30 days) using RF snap-frozen in liquid nitrogen and preserved at −80 °C on fermentation parameters 1.
Table 2.
The effects of feedstuffs (wheat grain vs. lucerne hay) and rumen fluid storage days (14 days and 30 days) using RF snap-frozen in liquid nitrogen and preserved at −80 °C on fermentation parameters 1.
| Parameter | Wheat Grain | Lucerne Hay | SED 2 | S | D | S × D | ||||
|---|---|---|---|---|---|---|---|---|---|---|
| 1 | 14 | 30 | 1 | 14 | 30 | |||||
| Gas production, mL/g | 132.9 | 78.2 | 71.3 | 71.6 | 51.7 | 44.8 | 6.85 | <0.001 | <0.001 | 0.065 |
| Lag time, h | 0.75 | 5.26 | 5.20 | 0.45 | 1.37 | 1.39 | 0.195 | <0.001 | <0.001 | <0.001 |
| Gas prod. rate, mL/h | 5.39 | 3.26 | 2.97 | 3.01 | 2.12 | 1.83 | 0.293 | <0.001 | <0.001 | 0.018 |
| pH | 5.48 | 5.61 | 5.67 | 6.11 | 6.23 | 6.28 | 0.009 | <0.001 | <0.001 | 0.052 |
| DMD, % | 58.6 | 53.9 | 53.1 | 56.0 | 49.1 | 48.5 | 1.63 | <0.001 | <0.001 | 0.51 |
| Methane, % gas | 8.79 | 3.62 | 3.03 | 6.33 | 3.79 | 2.75 | 1.980 | 0.42 | 0.003 | 0.56 |
| CO2, % gas | 91.2 | 96.4 | 97.0 | 93.7 | 96.2 | 97.3 | 2.03 | 0.32 | 0.007 | 0.77 |
| Partition factor, mg/mL | 4.80 | 7.22 | 7.47 | 8.04 | 9.56 | 11.3 | 0.660 | <0.001 | <0.001 | 0.54 |
1 All measures taken after 24 h of fermentation and pooled across day of treatment. 2 Standard error of the difference for substrate (S) × days of storage (D).
Table 3.
The effects of feedstuffs (wheat grain vs. lucerne hay) and rumen fluid storage conditions (fresh rumen fluid vs. rumen fluid mixed with 5% DMSO and stored at −20 °C) across storage days 1, 14, 30, and 180 on fermentation parameters 1.
Table 3.
The effects of feedstuffs (wheat grain vs. lucerne hay) and rumen fluid storage conditions (fresh rumen fluid vs. rumen fluid mixed with 5% DMSO and stored at −20 °C) across storage days 1, 14, 30, and 180 on fermentation parameters 1.
| Parameter | Wheat Grain | Lucerne | SED 2 | S | D | S × D | ||||||
|---|---|---|---|---|---|---|---|---|---|---|---|---|
| 1 | 14 | 30 | 180 | 1 | 14 | 30 | 180 | |||||
| Gas production, mL/g | 132.9 | 88.3 | 106.3 | 97.3 | 71.6 | 60.3 | 54.9 | 57.5 | 6.94 | <0.001 | <0.001 | 0.015 |
| Lag time, h | 0.73 | 2.04 | 3.69 | 3.90 | 0.45 | 0.52 | 0.31 | 0.80 | 0.699 | <0.001 | <0.001 | <0.001 |
| Gas prod. rate, mL/h | 5.38 | 3.69 | 4.43 | 4.10 | 3.00 | 2.53 | 2.08 | 2.41 | 0.269 | <0.001 | <0.001 | 0.023 |
| pH | 5.48 | 5.61 | 5.59 | 5.58 | 6.11 | 6.22 | 6.25 | 6.28 | 0.092 | <0.001 | <0.001 | 0.64 |
| DMD, % | 58.6 | 57.3 | 55.1 | 50.4 | 56.0 | 52.0 | 52.0 | 48.8 | 1.53 | <0.001 | <0.001 | 0.58 |
| Methane, % gas | 8.79 | 3.72 | 3.13 | 0.66 | 6.33 | 1.83 | 2.62 | 0.42 | 0.337 | <0.001 | <0.001 | 0.002 |
| Carbon dioxide, % gas | 91.2 | 96.3 | 96.9 | 99.3 | 93.7 | 98.2 | 97.4 | 99.6 | 0.34 | <0.001 | <0.001 | 0.002 |
| Partition factor, mg/mL | 4.80 | 6.85 | 5.20 | 5.14 | 8.04 | 8.87 | 10.5 | 8.48 | 0.581 | <0.001 | <0.001 | 0.001 |
| Ammonia-N, mL/g | 0.29 | 0.26 | 0.25 | 0.22 | 0.95 | 0.69 | 0.31 | 0.29 | 0.016 | <0.001 | <0.001 | 0.003 |
1 All measures taken after 24 h of fermentation and pooled across day of treatment. 2 Standard error of the difference for substrate (S) × days of storage (D).
Disclaimer/Publisher’s Note: The statements, opinions and data contained in all publications are solely those of the individual author(s) and contributor(s) and not of MDPI and/or the editor(s). MDPI and/or the editor(s) disclaim responsibility for any injury to people or property resulting from any ideas, methods, instructions or products referred to in the content. |
© 2023 by the authors. Licensee MDPI, Basel, Switzerland. This article is an open access article distributed under the terms and conditions of the Creative Commons Attribution (CC BY) license (https://creativecommons.org/licenses/by/4.0/).
Share and Cite
MDPI and ACS Style
Tunkala, B.Z.; DiGiacomo, K.; Alvarez Hess, P.S.; Dunshea, F.R.; Leury, B.J. Impact of Rumen Fluid Storage on In Vitro Feed Fermentation Characteristics. Fermentation 2023, 9, 392. https://doi.org/10.3390/fermentation9040392
AMA Style
Tunkala BZ, DiGiacomo K, Alvarez Hess PS, Dunshea FR, Leury BJ. Impact of Rumen Fluid Storage on In Vitro Feed Fermentation Characteristics. Fermentation. 2023; 9(4):392. https://doi.org/10.3390/fermentation9040392
Chicago/Turabian StyleTunkala, Bereket Zeleke, Kristy DiGiacomo, Pablo S. Alvarez Hess, Frank R. Dunshea, and Brian J. Leury. 2023. "Impact of Rumen Fluid Storage on In Vitro Feed Fermentation Characteristics" Fermentation 9, no. 4: 392. https://doi.org/10.3390/fermentation9040392
Note that from the first issue of 2016, this journal uses article numbers instead of page numbers. See further details here.