Article

A Study of the Metabolic Profiles of Penicillium dimorphosporum KMM 4689 Which Led to Its Re-Identification as Penicillium hispanicum

by
Liliana E. Nesterenko
1,2,
Roman S. Popov
1,
Olesya I. Zhuravleva
1,2,
Natalya N. Kirichuk
1,
Viktoria E. Chausova
1,
Kirill S. Krasnov
3,
Mikhail V. Pivkin
1,
Ekaterina A. Yurchenko
1,
Marina P. Isaeva
1 and
Anton N. Yurchenko
1,*
1
G.B. Elyakov Pacific Institute of Bioorganic Chemistry Far Eastern Branch of Russian Academy of Science, Prospect 100-Letiya Vladivostoka, 159, 690022 Vladivostok, Russia
2
Institute of High Technologies and Advanced Materials, Far Eastern Federal University, 10 Ajax Bay, Russky Island, 690922 Vladivostok, Russia
3
Institute of Theoretical and Experimental Biophysics, Russian Academy of Sciences, Institutskaya ul., 3, 142290 Pushchino, Russia
*
Author to whom correspondence should be addressed.
Fermentation 2023, 9(4), 337; https://doi.org/10.3390/fermentation9040337
Submission received: 28 January 2023 / Revised: 23 March 2023 / Accepted: 24 March 2023 / Published: 28 March 2023
(This article belongs to the Special Issue New Research on Fungal Secondary Metabolites)

Abstract

:
Changes in cultivation conditions, in particular salinity and temperature, affect the production of secondary fungal metabolites. In this work, the extracts of fungus previously described as Penicillium dimorphosporum cultivated in various salinity and temperature conditions were investigated using HPLC UV/MS techniques, and their DPPH radical scavenging and cytotoxicity activities against human prostate cancer PC-3 cells and rat cardiomyocytes H9c2 were tested. In total, 25 compounds, including 13 desoxyisoaustamide-related alkaloids and eight anthraquinones, were identified in the studied extracts and their relative amounts were estimated. The production of known neuroprotective alkaloids 5, 6 and other brevianamide alkaloids was increased in hypersaline and high-temperature conditions, and this may be an adaptation to extreme conditions. On the other hand, hyposalinity stress may induce the synthesis of unidentified antioxidants with low cytotoxicity that could be very interesting for future investigation. The study of secondary metabolites of the strain KMM 4689 showed that although brevianamide-related alkaloids and anthraquinone pigments are widely distributed in various fungi, these metabolites have not been described for P. dimorphosporum and related species. For this reason, the strain KMM 4689 was re-sequenced using the β-tubulin gene and ITS regions as molecular markers and further identified as P. hispanicum.

1. Introduction

Marine microorganisms have received increasing attention due to their features of metabolism, which have been acquired as an adaptation to prevailing extreme conditions in the marine environment [1]. The versatility of metabolic pathways helps filamentous fungi to adapt to changing environmental conditions and can be used to achieve the tasks of the biotechnological production of drugs [2]. Changing the cultivation conditions such as the composition of nutrients, salinity, pH and temperature is one of the options for the OSMAC (one strain–many compounds) approach for the investigation of fungal secondary metabolites [3]. It was first formulated 20 years ago [4] and has proved to be very effective since [5]. For example, cultivation of Aspergillus aculeatus strain in high-salinity conditions resulted in the up-regulation of aspergillusol, secalonic acid D and aculens C and D production [6]. A high level of NaCl in a culture of Asteromyces cruciatus induced the production of new metabolite primarolide A, and additional using of epigenetic modificator suberoylanilide hydroxamic acid resulted in new primarolide B isolation [7].
Previously, we found that the marine coral-derived strain of fungus Penicillium dimorphosporum produces a number of new deoxyisoaustamide alkaloids with neuroprotective or cytotoxic properties [8,9]. Interestingly, the neuroprotective effect against paraquat toxicity is observed only for 16,17-dihydroxy-deoxydihydroisoaustamide derivatives. Of course, many secondary metabolites from micro- and macroorganisms and their synthetic derivatives have shown neuroprotective or cytotoxic activity. Therefore, the need for a more detailed study of yet another neuroprotective or anticancer natural compound can be questioned. However, it is clear that with a greater number of molecules with a well-established mechanism of action available, more effective development of real drugs through modern methods of bioinformatics and drug design can be realized. Additionally, from this point of view, these compounds are of particular interest. However, the low production of these substances by the fungus makes the study of their bioactivity very limited.
Thus, this study aimed to investigate how the change in culture conditions of the marine fungus Penicillium dimorphosporum KMM 4689 affects the production of known bioactive compounds and other secondary metabolites of this fungus.

2. Materials and Methods

2.1. General Experimental Procedures

Microscopic examination and photography of fungal cultures were performed with an Olympus CX41 microscope fitted with an Olympus SC30 digital camera. Detailed examination of ornamentation of the fungal conidia was performed using scanning electron microscopy (SEM) EVO 40.
Low-pressure liquid column chromatography was performed using a Gel ODS-A (12 nm, S—75 um, YMC Co., Ishikawa, Japan). Plates precoated with Si gel (5–17 μm, 4.5 cm × 6.0 cm, Imid Ltd., Krasnodar, Russia) were used for thin-layer chromatography.

2.2. Fungal Strain

The fungal strain was isolated from unidentified soft coral sample collected in the South China Sea (Con Co Island, Vietnam) during the 49th expedition of the R/V Akademik Oparin. The strain was earlier identified based on molecular features (ITS regions) as Penicillium dimorphosporum [8]. The fungal strain is stored in the Collection of Marine Microorganisms (PIBOC FEB RAS, Vladivostok, Russia) under the code KMM 4689 and in the Collection of Nhatrang Institute of Technology Research and Applications under the code VO49-30.5.

2.3. Cultivation of Fungus

The fungus was cultured for 21 days at 22 °C or 30 °C in 500 mL Erlenmeyer flasks, each containing rice (20.0 g), yeast extract (20.0 mg), KH2PO4 (10 mg) and various amount of sea salt. Detailed fermentation conditions are described in Table 1. Sea salt was obtained through evaporation of natural sea water (Vodolaznaya bay, Troitsa bay, the Sea of Japan, April 2021). The natural salinity of the water used was 37.8 mg/mL.

2.4. Extraction

At the end of the incubation period, each mycelium and medium were homogenized and extracted with EtOAc (2 × 75 mL). The obtained extracts were concentrated to dryness. The residues (Table 1) were dissolved in methanol and purified using column chromatography on a Gel ODS-A in methanol.

2.5. HPLC UV

HPLC UV was carried out on an Agilent 1260 Infinity II chromatograph with a UV detector Agilent 1260 VWD (Agilent Technologies, Waldbronn, Germany) using a Supelco Discovery C-18 analytical column (5 μm, 4.6 mm × 250 mm) in a methanol/water gradient (20% MeOH—10 min, 20–100% MeOH—30 min, 100–20% MeOH—5 min). Detection was performed at 220 and 290 nm. The extract concentration was 2 mg per 30 µL for injection. The flow rate was 0.8 mL/min. A qualitative and quantitative analysis of HPLC UV chromatograms was performed using Agilent OpenLab software (version 2.4). The obtained data were exported into MS Excel for further calculation of the number of peaks and their total area. Peaks with a relative area less than 1% were considered noise and were eliminated.

2.6. HPLC MS

Analysis was performed using a Bruker Elute UHPLC chromatograph (Bruker Daltonics, Bremen, Germany) connected to a Bruker Impact II Q-TOF mass spectrometer (Bruker Daltonics, Bremen, Germany). An InfinityLab Poroshell 120 SB-C18 column (2.1 mm × 150 mm, 2.7 μm, Agilent Technologies, Santa Clara, CA, USA) was used for chromatographic separation. The mobile phases were 0.1% formic acid in H2O (eluent A) and 0.1% formic acid in MeCN (eluent B). The gradient program was as follows: from 10% to 45% eluent B from 0 to 10 min, from 45% to 100% eluent B from 10 to 20 min, isocratic at 100% of eluent B from 20 to 25 min, from 100% to 10% eluent B from 25 to 25.2 min. After returning to the initial conditions, the equilibrium was achieved after 5 min. Chromatographic separation was performed at a 0.4 mL/min flow rate at 40 °C. The injection volume was 2 μL.
The mass spectrometry detection was performed using an ESI ionization source in positive ion mode. The optimized ionization parameters for ESI were as follows: a capillary voltage of 4.5 kV, nebulization with nitrogen at 2.5 bar, dry gas flow of 6 L/min at a temperature of 200 °C. The mass spectra were recorded within an m/z mass range of 50–2000 (scan time 1 s). Collision-induced dissociation (CID) product ion mass spectra were recorded in auto-MS/MS mode with a collision energy ranging from 15 eV at 100 m/z to 120 eV at 1500 m/z (the exact collision energy setting depended on the molecular masses of precursor ions). The precursor ions were isolated with an isolation width of 4 Th.
The mass spectrometer was calibrated using the ESI-L Low Concentration Tuning Mix (Agilent Technologies, Santa Clara, CA, USA). The instrument was operated using otofControl (ver. 4.1, Bruker Daltonics, Bremen, Germany) and data were analyzed using the DataAnalysis Software (ver. 4.4, Bruker Daltonics, Bremen, Germany).

2.7. Data Analysis

UHPLC-Q-TOF data were converted from Bruker “.d” formatting to “.mzXML” using MSConvert 3.0 (part of ProteoWizard 3.0 package, Palo Alto, California, USA) [10] and further processing was performed with MZMine (version 2.53) [11]. The MZMine processing settings were follows: mass detection was carried out at the MS1 level and MS2 level with noise level thresholds of 60 and 40, respectively. Chromatograms were made with the ADAP Chromatogram Builder Module [12] with the following parameters: min group size in # of scans was set to 6, group intensity threshold and min highest intensity were set to 130 and 300, respectively, m/z tolerance was set to 0.05 m/z. The chromatogram deconvolution module was used with the ADAP algorithm with a signal/noise threshold of 8, min feature height of 300, coefficient/area threshold of 40, peak duration range was set from 0 to 2.0 and RT wavelet range was set from 0 to 0.1. The m/z center calculation was set to MEDIAN. The Isotopics peaks grouper module was used with an m/z tolerance of 5 ppm, retention time tolerance of 0.1 min, the monotonic shape function set to true, a maximum charge of 2 and the representative isotope set to the most intense. Alignment was achieved with the Join aligner function with an m/z tolerance of 5 ppm, a weight for m/z at 50, a retention time tolerance of 0.1 min and a weight for RT at 50. The Require same charge state, Require same ID and the Compare spectra similarity functions were set to false. The aligned feature list was exported by the Export/Submit to “GNPS-FBMN” module with the Merge MS/MS (experimental) function with the following parameters: Select spectra to merge was set to across samples, the m/z merge mode was set to weighted average (remove outliers), the intensity merge mode was set to sum intensities, the expected mass deviation was set to 5 ppm, the cosine threshold was set to 70%, the peak count threshold was set to 20%, the isolation window offset (m/z) was set to 0 and the isolation window width (m/z) was set to 3.

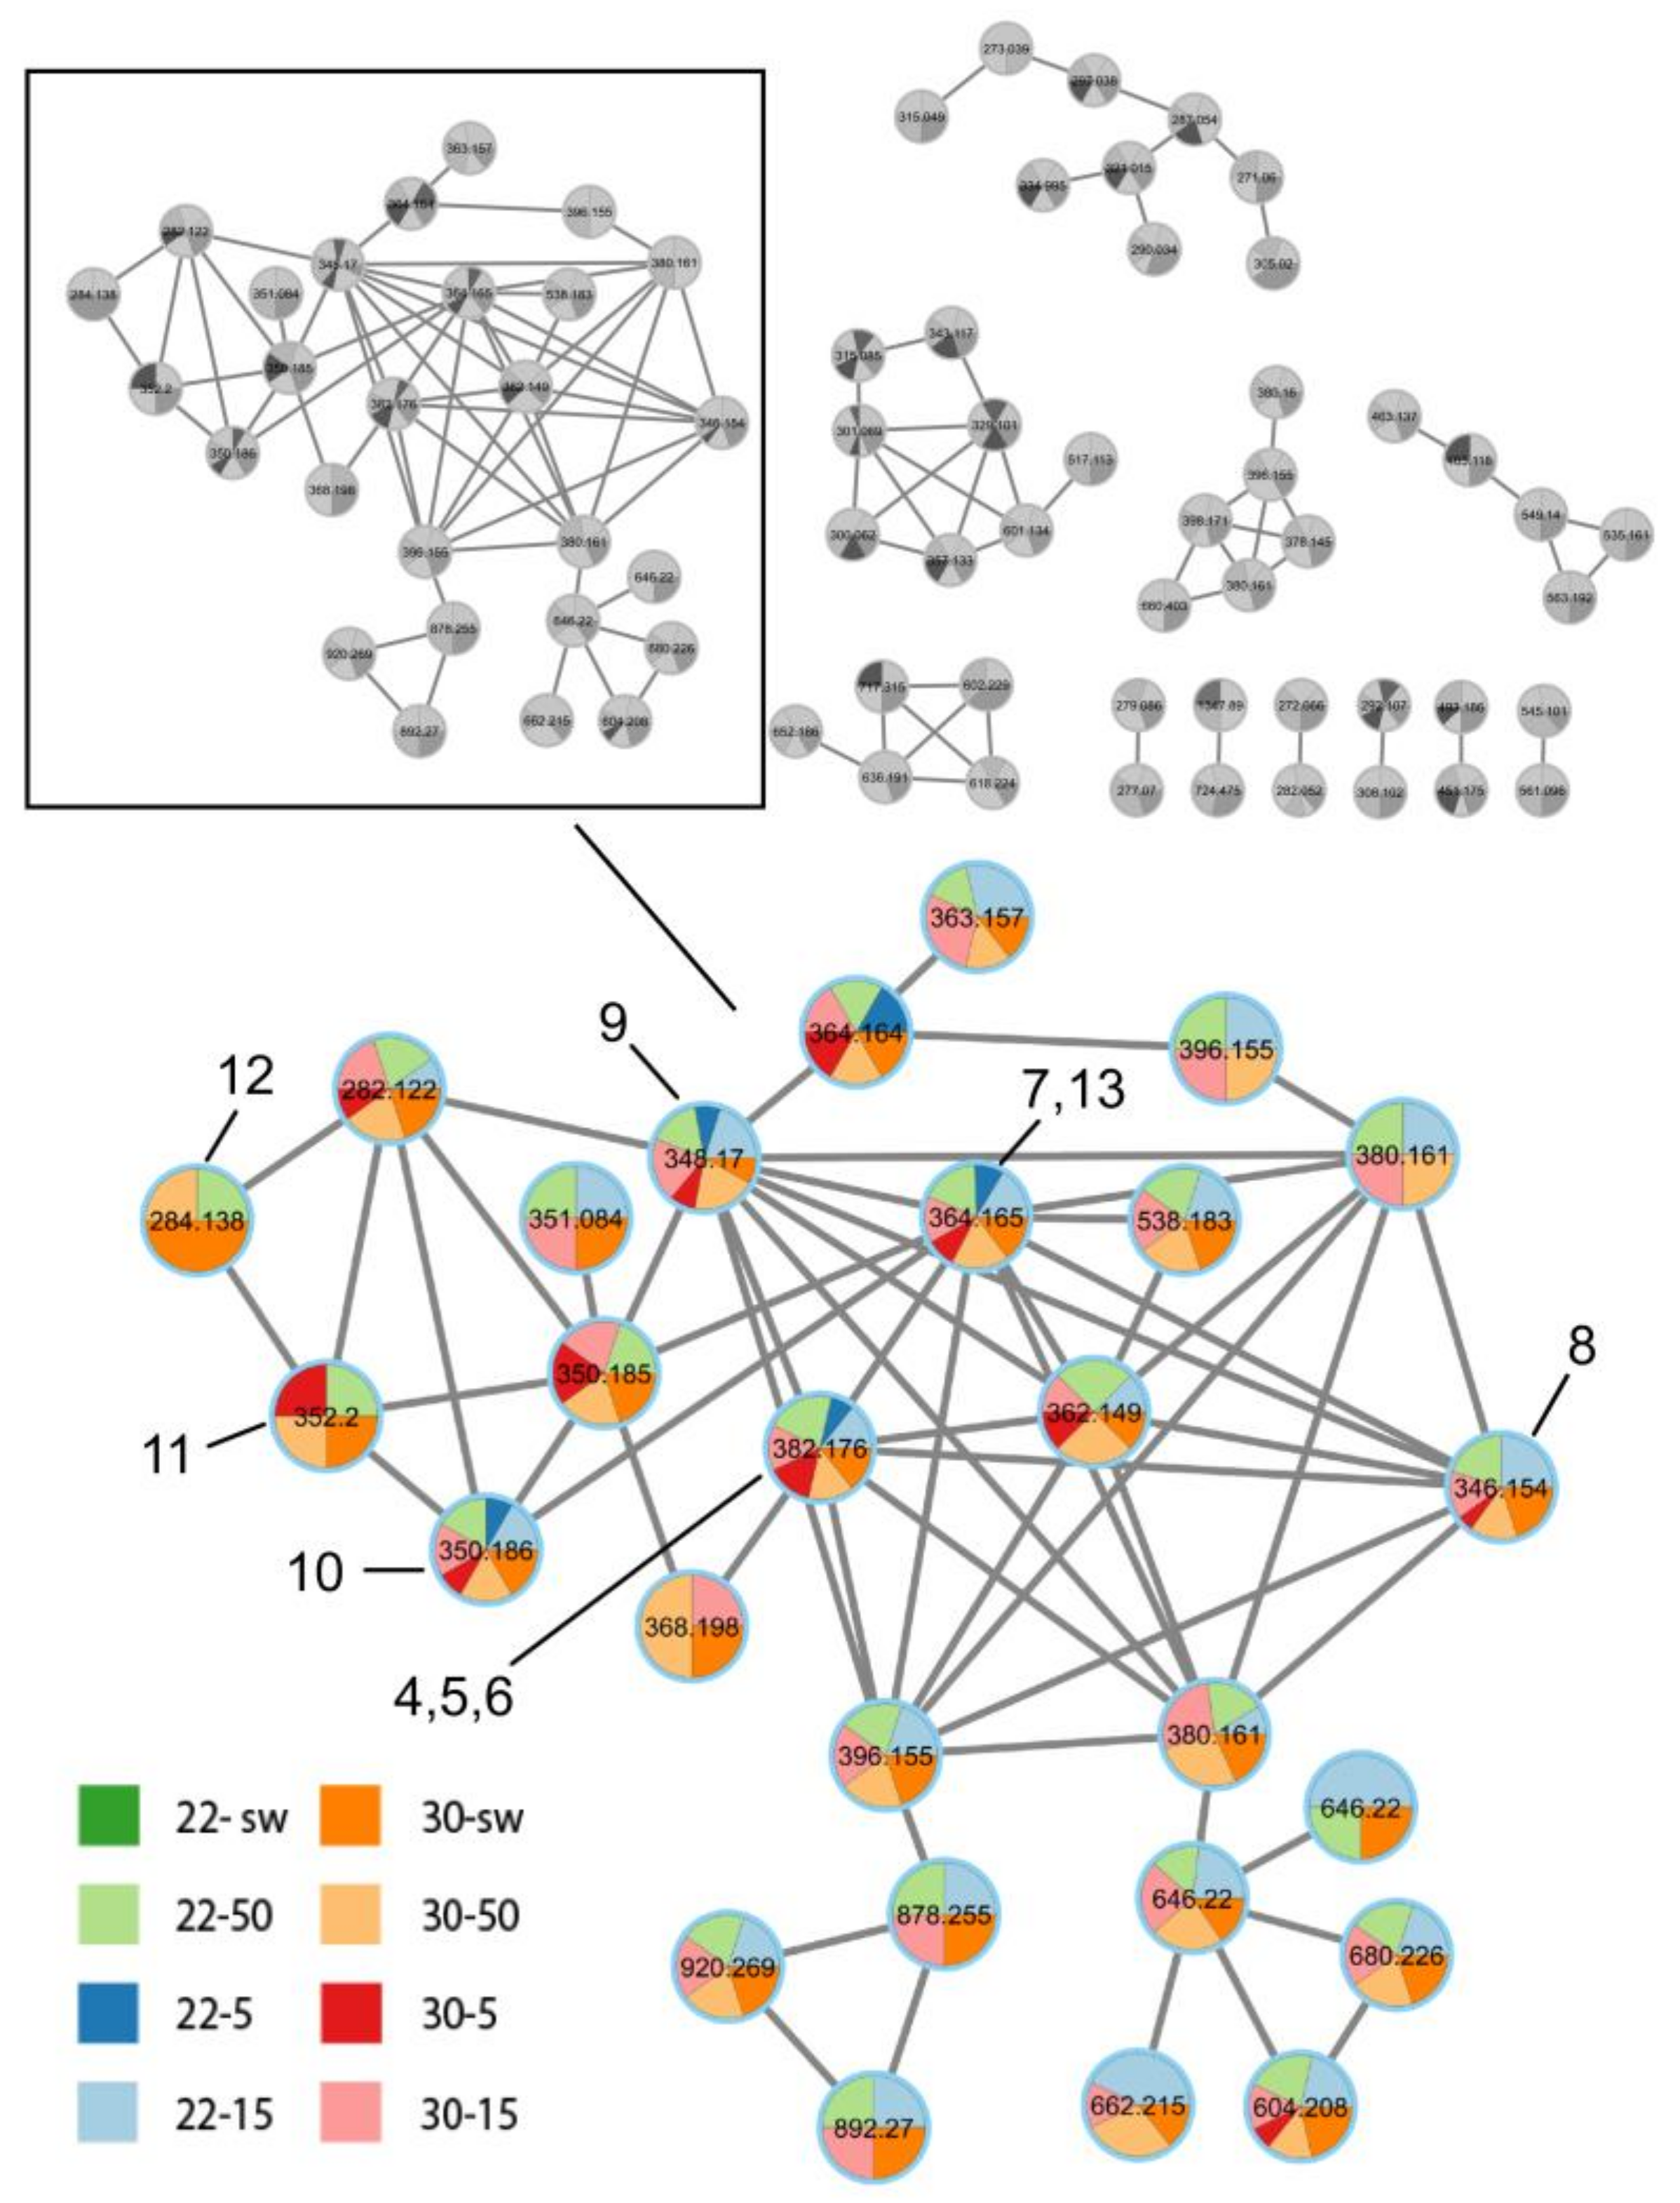
2.8. Molecular Networking and Spectral Library Search

Feature-based molecular networking (FBMN) was generated with the pre-processed data on the Global Natural Products Social Molecular Networking (GNPS) website (https://gnps.ucsd.edu, accessed on 24 October 2022) [13,14]. The molecular networking module was used to visualize the molecular network. The precursor ion mass tolerance and fragment ion mass tolerance were both set to 0.02 Da. The network edges were set to have a cosine score of 0.4 or above, with a minimum of three matched peaks. The next parameters were also specified: minimum matched fragment ions and minimum cluster size were both set to 4. Other parameters were maintained as default. Annotation of the MS/MS spectra was carried out with the DEREPLICATOR tool. Visualization of the network was carried out with Cytoscape 3.9.1 [15].
Dereplication of the MS/MS spectra was carried out using the GNPS module Library Search. All parameters were maintained as default.
Metabolite dereplication was also carried out with an in-house MS/MS spectral library, comparing experimental spectra and retention times (RT) with the spectra and RT obtained for reference compounds 110 [8].

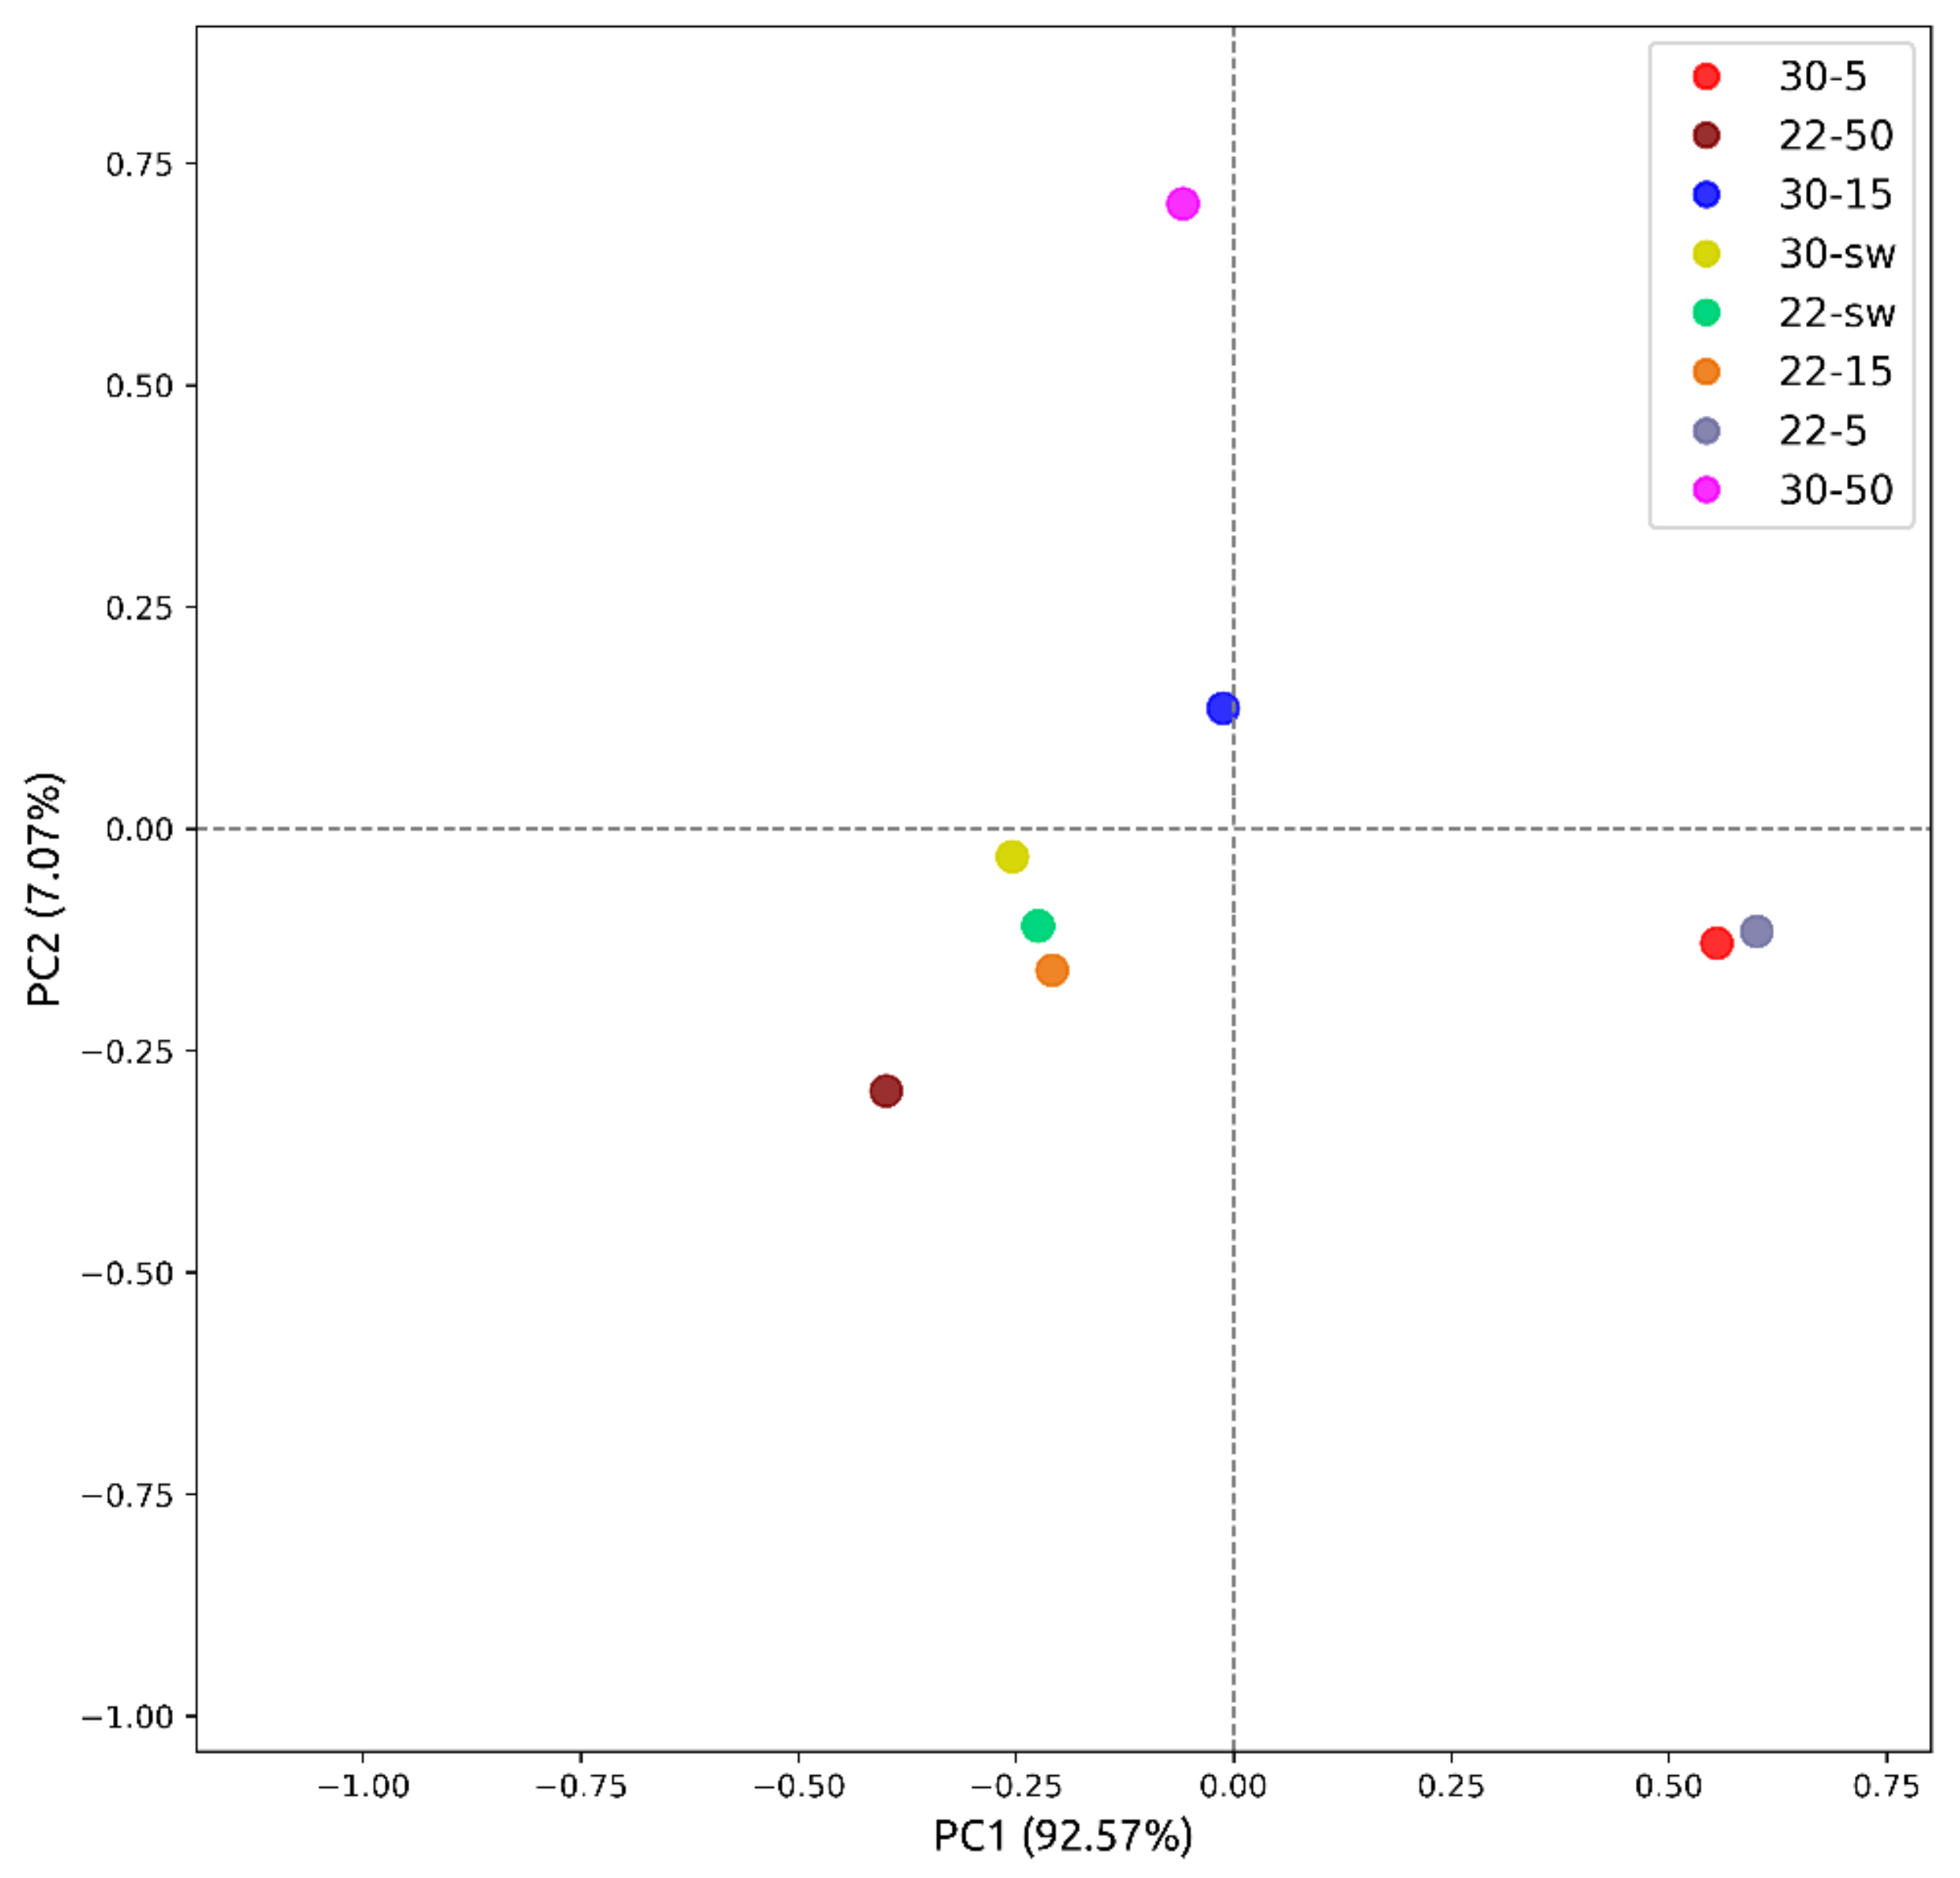
2.9. Principal Component Analysis ((PCA)

PCA was performed using the python package Scikit-Learn (v.1.2.1) [16]. A PCA model was established to assess the distribution of samples and based on detected metabolites in each sample. Visualization of principal component plot was performed using the python package bioinfokit (v.2.1.0) [17].

2.10. Bioasays

2.10.1. Cell Culture

The human prostate cancer cells PC-3 were purchased from ATCC (American Type Culture Collection, Manassas, VA, USA). The rat cardiomyocytes H9c2 cells were kindly provided by Prof. Dr. Gunhild von Amsberg from Martini-Klinik Prostate Cancer Center, University Hospital Hamburg-Eppendorf, Hamburg, Germany. The PC-3 and H9c2 cells were cultured in DMEM containing 10% fetal bovine serum (Biolot, St. Petersburg, Russia) and 1% penicillin/streptomycin (Biolot, St. Petersburg, Russia) at 37 °C in a humidified atmosphere with 5% (v/v) CO2. The cells were incubated in cultural flasks until sub-confluent (~80%).

2.10.2. Cell Viability Assay

The PC-3 cells (5 × 10³ cells/well) and H9c2 cells (3 × 10³ cells/well) were seeded in a 96-well plate and incubated overnight. Then, the extracts at a concentration of 10 μg/mL were added and the cells were further incubated for an additional 24 h. After that, cell viability was determined using the MTT (3-(4,5-dimethylthiazol-2-yl)-2,5-diphenyltetrazolium bromide) method according to the manufacturer’s instructions (Sigma-Aldrich, St. Louis, MO, USA). Absorbance of the converted formazan was measured using a Multiskan FC microplate photometer (Thermo Scientific, Waltham, MA, USA) at λ = 570 nm. The results are presented as percentages of control data.

2.10.3. Cell-Free DPPH Assay

The extract solutions at a concentration of 1.25 μg/mL (120 µL) were dispensed into the wells of a 96-well microplate. In total, 30 µL of the DPPH (Sigma-Aldrich, Steinheim, Germany) solution in MeOH (1.5 × 10⁻⁴ M) was added to each well. Concentrations of compounds in the mixture were 1 µg/mL. Pure DMSO was used as a control. The mixture was shaken and left to stand for 30 min, and the absorbance of the resulting solution was measured at 520 nm with a microplate reader MultiscanFC (Thermo Scientific, USA). The radical scavenging activity of all extracts is presented as per cent of DMSO data.

2.11. DNA Extraction and Amplification

Genomic DNA was isolated from fungal mycelium grown on MEA (malt extract agar) at 25 °C for 7 days, using the MagJET Plant Genomic DNA Kit (Thermo Fisher Scientific, Waltham, MA, USA), according to the manufacturer’s protocol. PCR was conducted using GoTaq Flexi DNA Polymerase (Promega, Madison, WI, USA). For amplification of the internal transcribed spacer (ITS) region, the primer pair 1400-F (5′-CTGCCCTTTGTACACACCGCCCGTC-3′) [18] and D2CR (5′-CCTTGGTCCGTGTTTCAAGA-3′) was used [19]. The reaction profile was 95 °C for 300 s, 35 cycles of 94 °C for 20 s, 55 °C for 20 s, and 72 °C for 90 s and finally 72 °C for 300 s. For amplification of the partial beta/β-tubulin gene region, the primer pair Bt-2a and Bt-2b was used [20]. The reaction profile was 95 °C for 300 s, 35 cycles of 94 °C for 20 s, 55 °C for 20 s, and 72 °C for 60 s and finally 72 °C for 300 s. The amplified ITS region and partial beta/β-tubulin genes were purified with the ExoSAP-IT™ PCR Product Cleanup Reagent (Thermo Fisher Scientific, Waltham, MA, USA). Sequencing was bidirectional performed with the same primers on an Applied Biosystems SeqStudio Genetic Analyzer (Thermo Fisher Scientific, Waltham, MA, USA) using the Big Dye Terminator reagent kit, version 3.1. Gene sequences were deposited in GenBank under accession numbers MW325972 for the ITS gene region and OP407668 for the partial β-tubulin gene region (Table 2).

2.12. Phylogenetic Analysis

The ITS region and partial β-tubulin gene sequences were aligned with MEGA X software version 11.0.9 [21] using the Clustal W algorithm. The available homologs were searched in the GenBank database (http://ncbi.nlm.nih.gov, accessed on 15 September 2022) using the BLASTN algorithm (http://www.ncbi.nlm.nih.gov/BLAST, accessed on 15 September 2022). The phylogenetic analysis was conducted using MEGA X software [21]. The ITS region and partial β-tubulin gene sequences were concatenated into one alignment. A phylogenetic tree was constructed according to the maximum likelihood (ML) algorithm based on the Tamura–Nei model [22]. The topology of the tree was evaluated with 1000 bootstrap replicates. Talaromyces marneffei was used in the phylogenetic analysis as the outgroup (Table 2).
The ITS region sequences of members of the genus Penicillium section Ramigena series Ramigena and section Exilicaulis series Erubescens were aligned using the Clustal W algorithm. The ML tree of ITS region sequences was reconstructed based on the Tamura–Nei model [22] and evaluated with 1000 bootstrap replicates.

3. Results

3.1. The Effect of Culture Conditions on Metabolic Profile of Fungal Extracts and Its Bioactivity
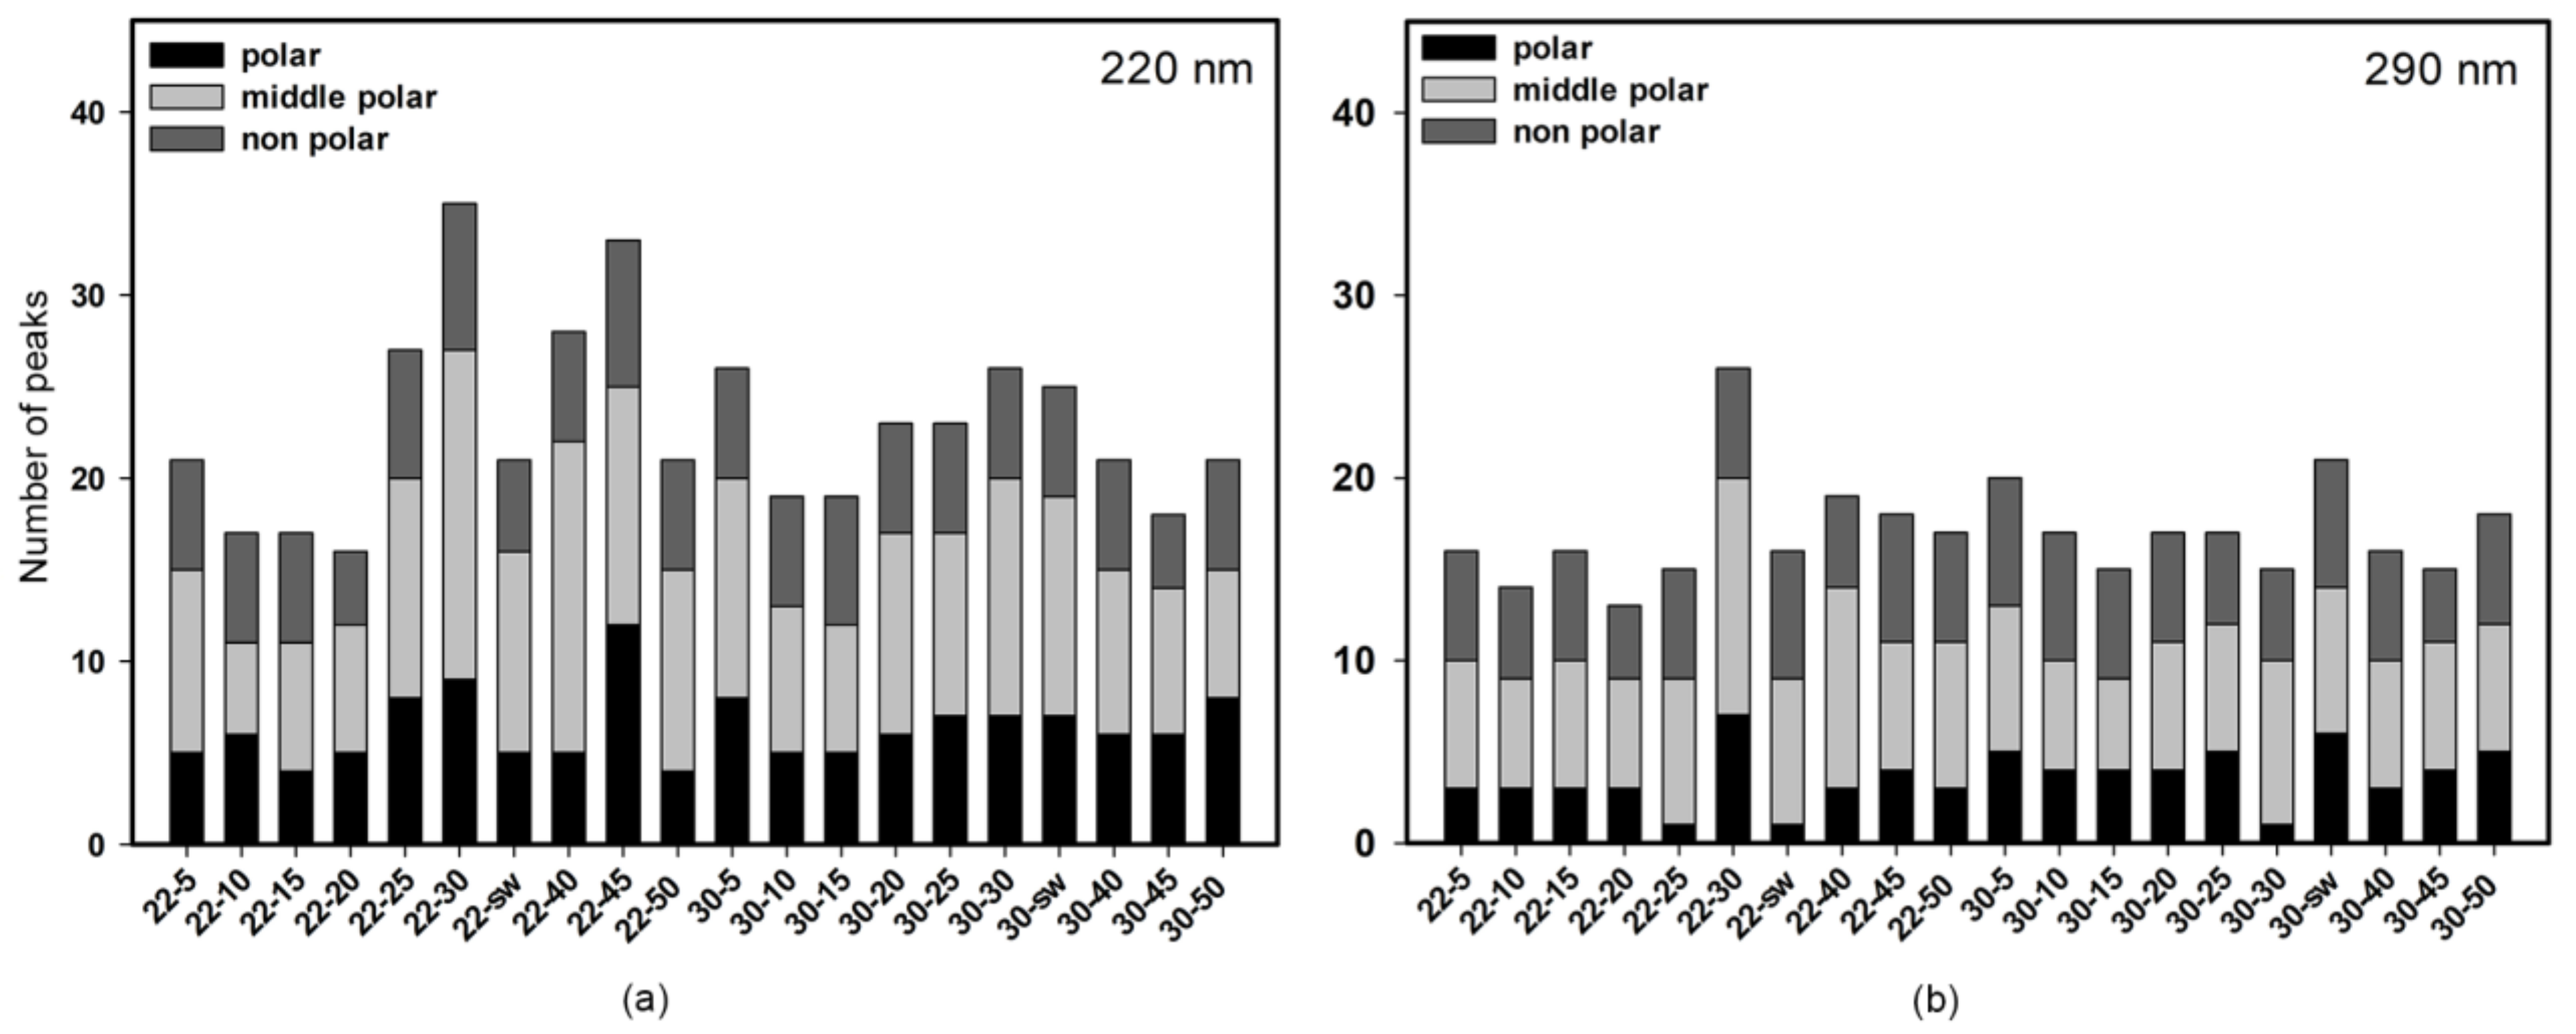
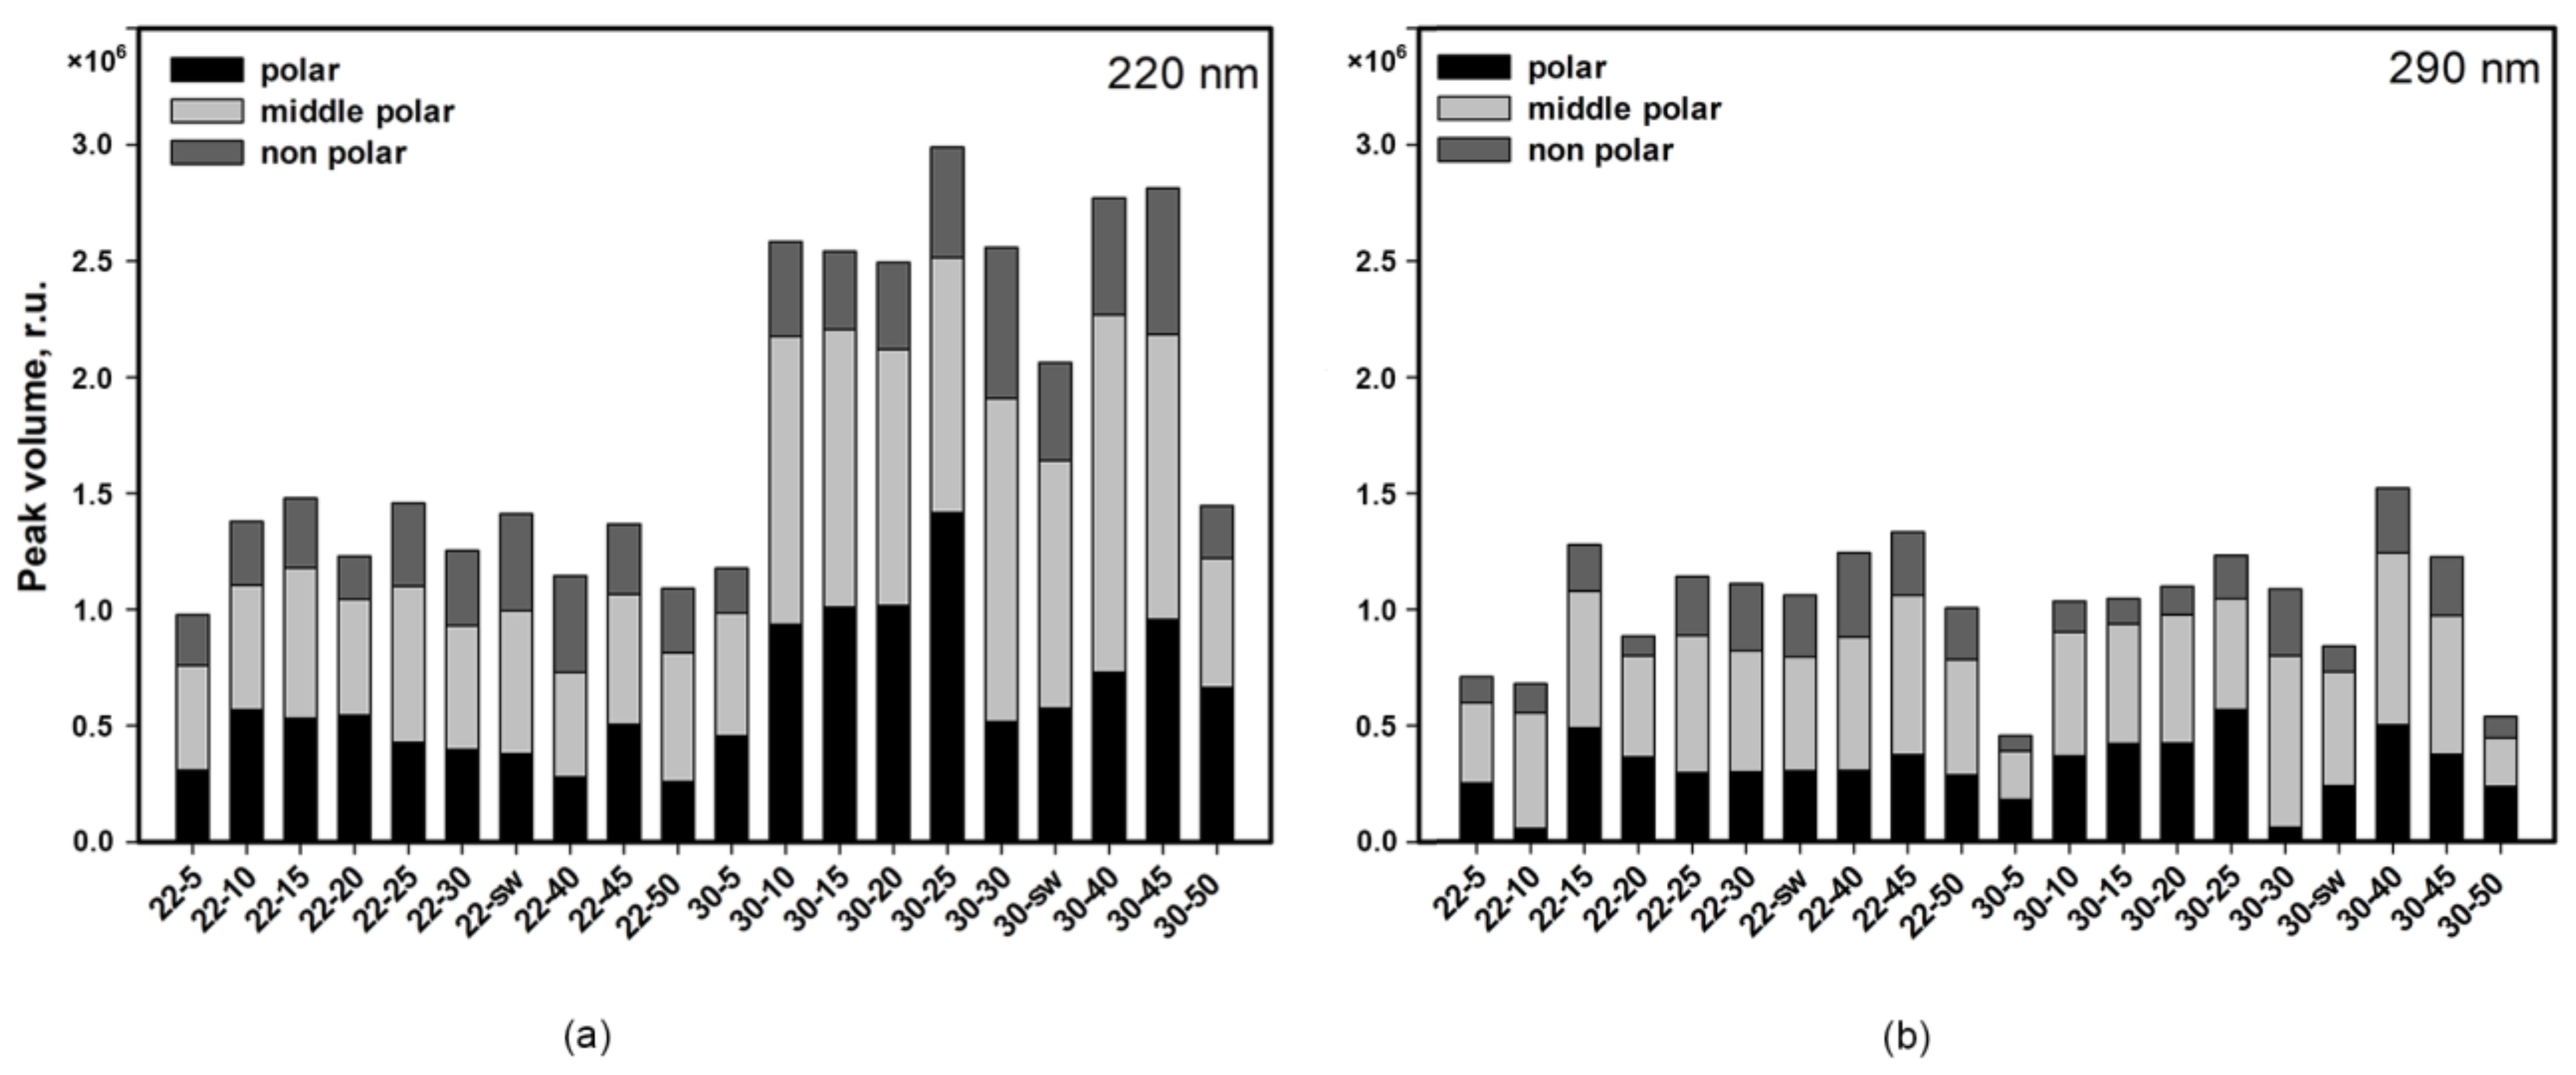
3.1.1. HPLC UV

The purified extracts were analyzed through HPLC UV at 290 and 220 nm. The chromatograms of extracts from fungus cultivated with sea water at 22 °C and at 30 °C are presented in Figure 1 and other chromatograms are shown in the Supplementary Materials (Figures S1–S20).
The HPLC UV data showed that cultivation at 30 °C resulted in a more varied metabolite profile of fungal extract, especially in the polar field.
Each chromatogram was divided into three zones: polar (0–30 min, 20%–70% of MeOH), mid-polar (30–40 min, 70%–100% of MeOH) and non-polar (40–55 min, 100% MeOH). The total number of peaks in each zone and their total area were calculated and are presented in Figure 2 and Figure 3, respectively.
A change in the concentration of sea salt during cultivation at both 22 °C and 30 °C had no significant effect on the number of peaks in the non-polar region.
Reducing the concentration of sea salt from 30 to 10 mg/mL (hypo salinity) at 22 °C led to a decrease in the number of peaks in the mid-polar region. The number of peaks in this region for fungal extracts cultivated at 30 °C and with a decrease in sea salt concentration from 30 to 10 mg/mL also decreased. However, with a further decrease in the salt concentration from 10 to 5 mg/mL, the number of peaks increased.
An increase in the concentration of sea salt at 22 °C hardly changed the number of peaks in the mid-polar region, while an increase in the concentration of sea salt at 30 °C caused a decrease in the number of such peaks.
The greatest changes in the number of peaks were observed in the polar region of the chromatograms.
A slight decrease in sea salt concentration to 20–25 mg/mL at 22 °C led to an increase in the number of peaks, and with a further decrease in the salt concentration, the number of peaks was similar to the base conditions (natural sea water). At an increased cultivation temperature, a decrease in the concentration of sea salt led to a gradual increase in the number of peaks, reaching the highest value at 5 mg/mL. This was observed at both wavelengths.
Increasing the sea salt concentration to 45 mg/mL at 22 °C resulted in a significant increase in the number of peaks, but a further increase to 50 mg/mL resulted in a decrease in the number of peaks. Increasing the concentration of sea salt at 30 °C did not lead to any noticeable change at a wavelength of 220 nm, but caused a decrease in the number of peaks at 290 nm.
The change in the total area of the peaks with a change in the conditions for the fungus cultivation was especially noticeable in the polar zone. A decrease in the salt concentration at 22 °C led to slight fluctuations in the areas of these peaks, recorded at 220 nm. At the same time, a decrease in the salt concentration to 5–10 mg/mL at 22 °C led to a significant decrease in the areas of the peaks at 290 nm.
A change in the salt concentration at 30 °C also led to nonlinear changes in the area of the peaks in the polar region at both wavelengths. Changes in peak area in the mid-polar and non-polar regions were small except for extracts of the fungus cultivated at 5 and 50 mg/mL. In these cases, a sharp decrease in the area of the peaks was observed over the entire range of polarity, and this was recorded at both wavelengths. At the same time, the masses of these extracts were similar to the masses of extracts obtained using natural sea water, and significantly higher than at all other sea salt concentrations.
Thus, HPLC UV data showed that the cultivation conditions significantly change the metabolite profiles of fungal extracts.

3.1.2. Bioactivity of Extracts
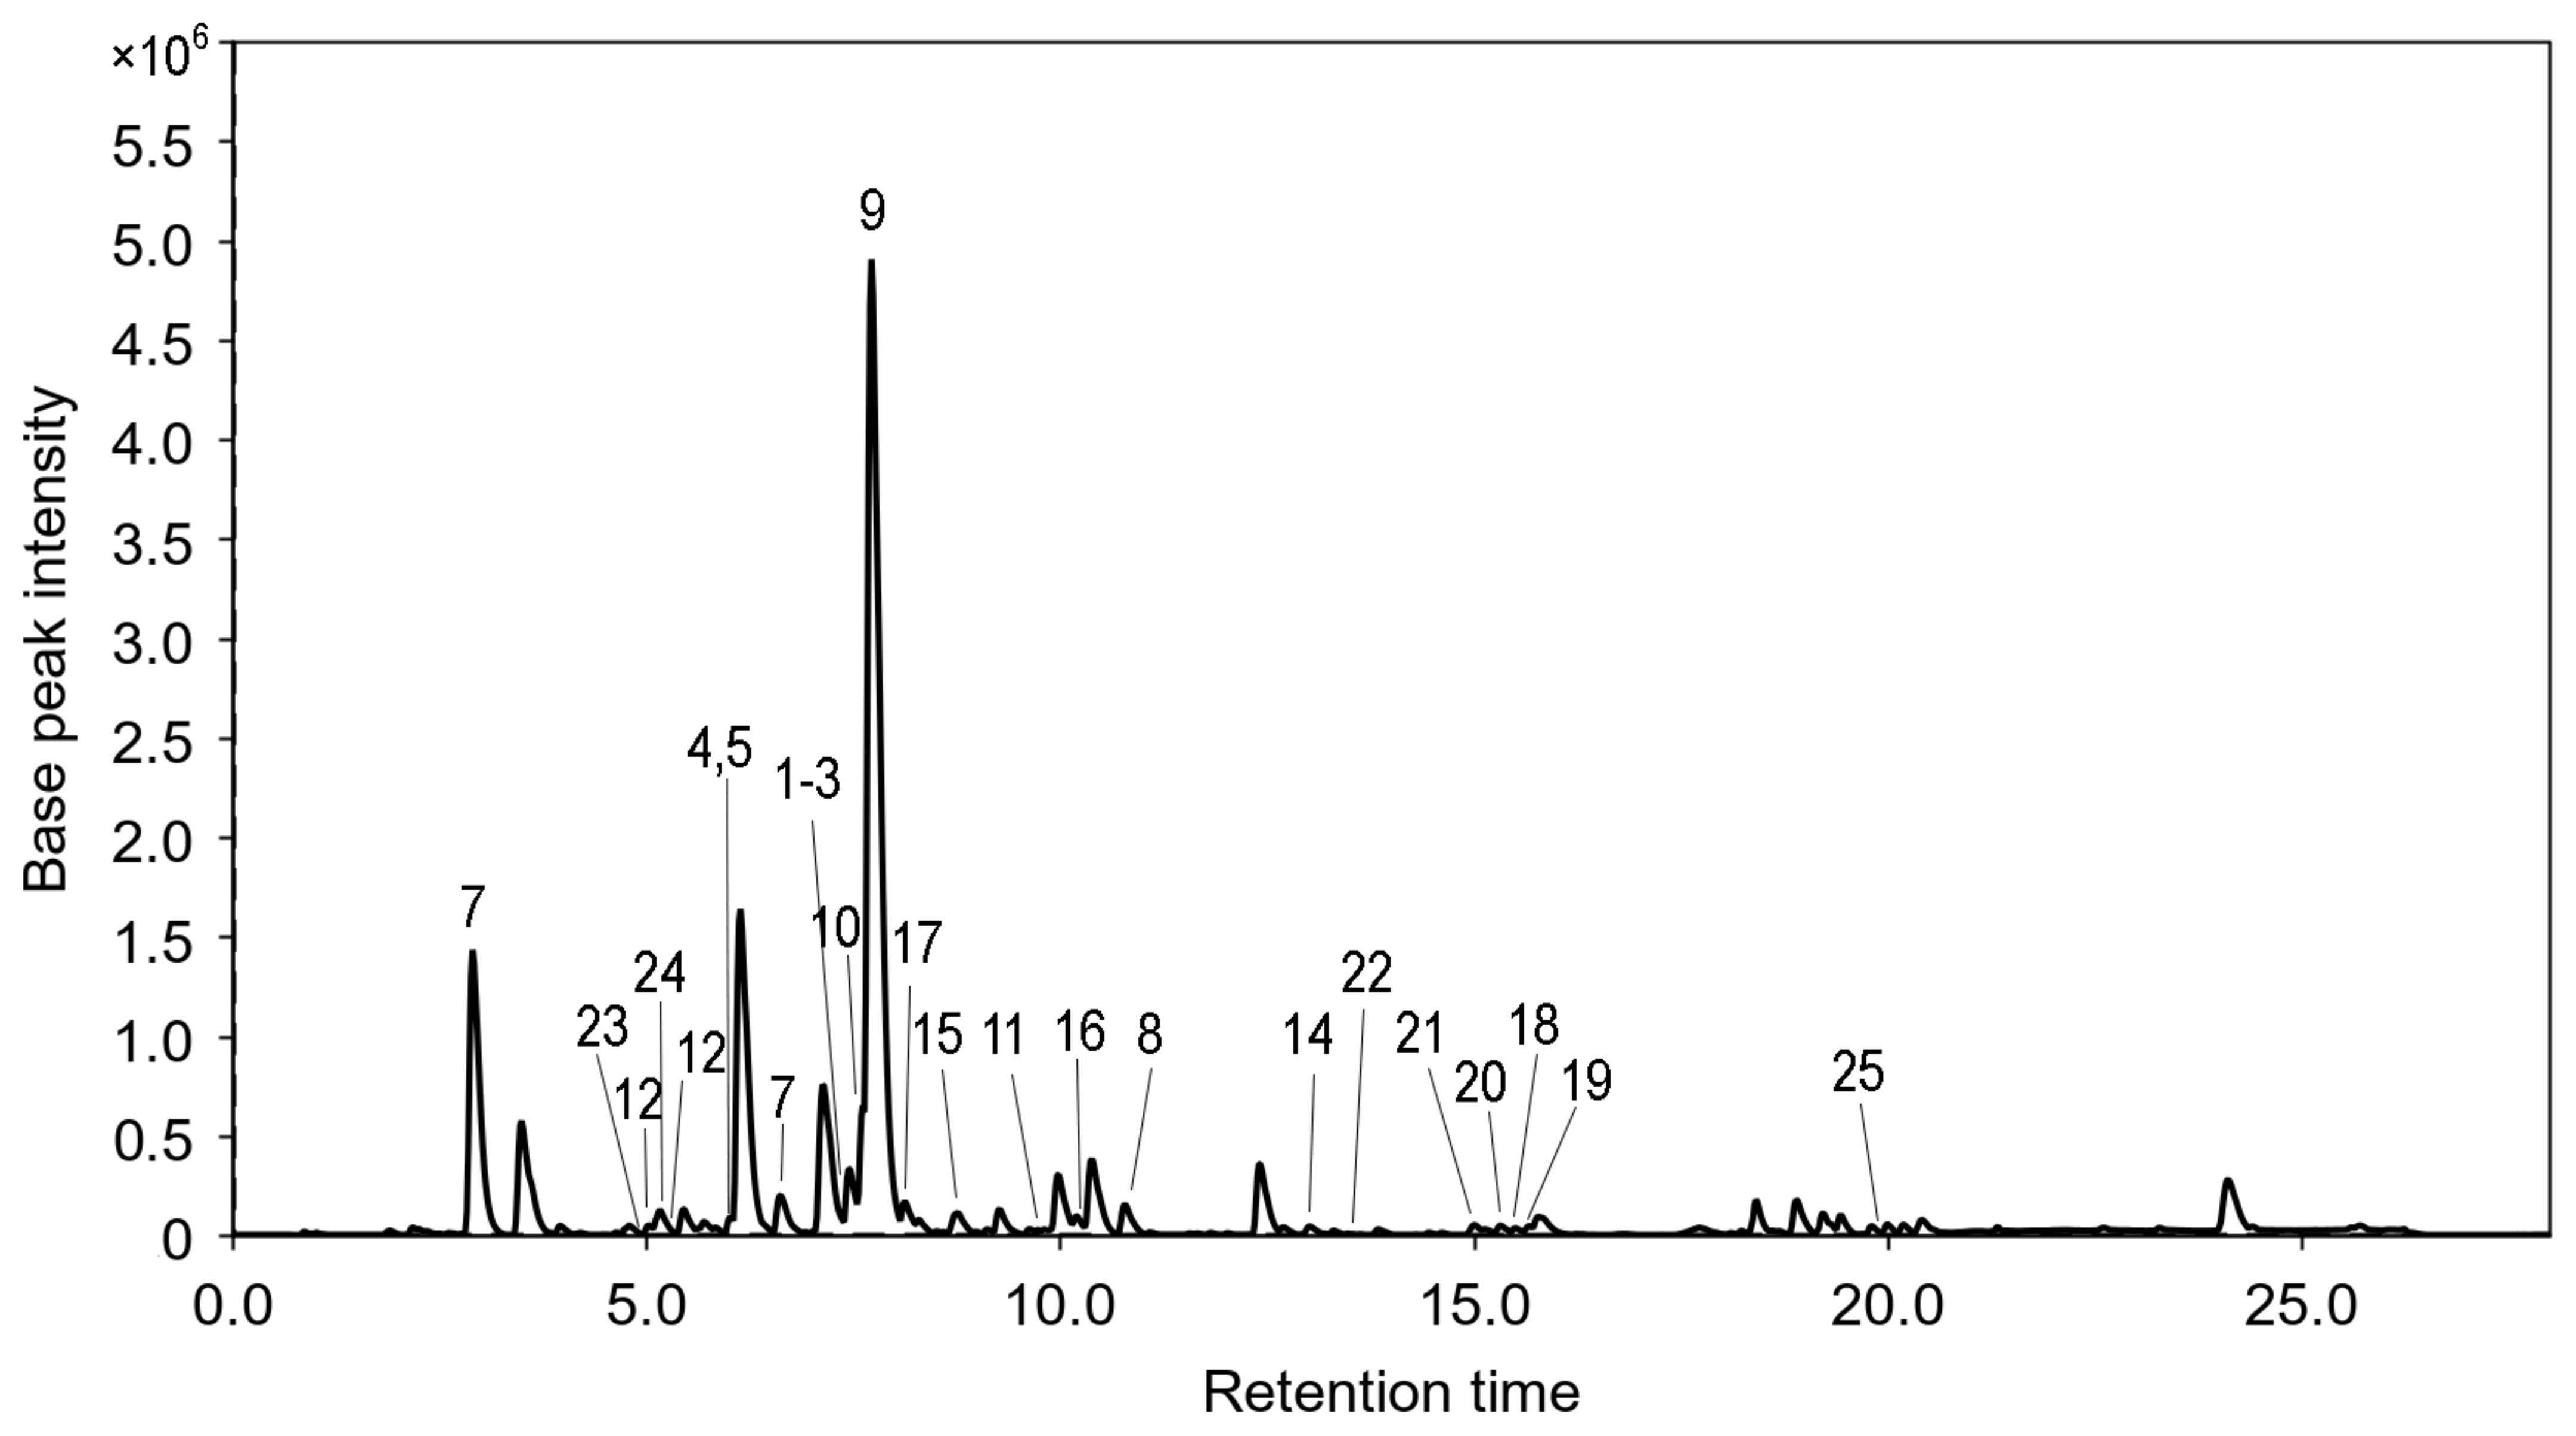
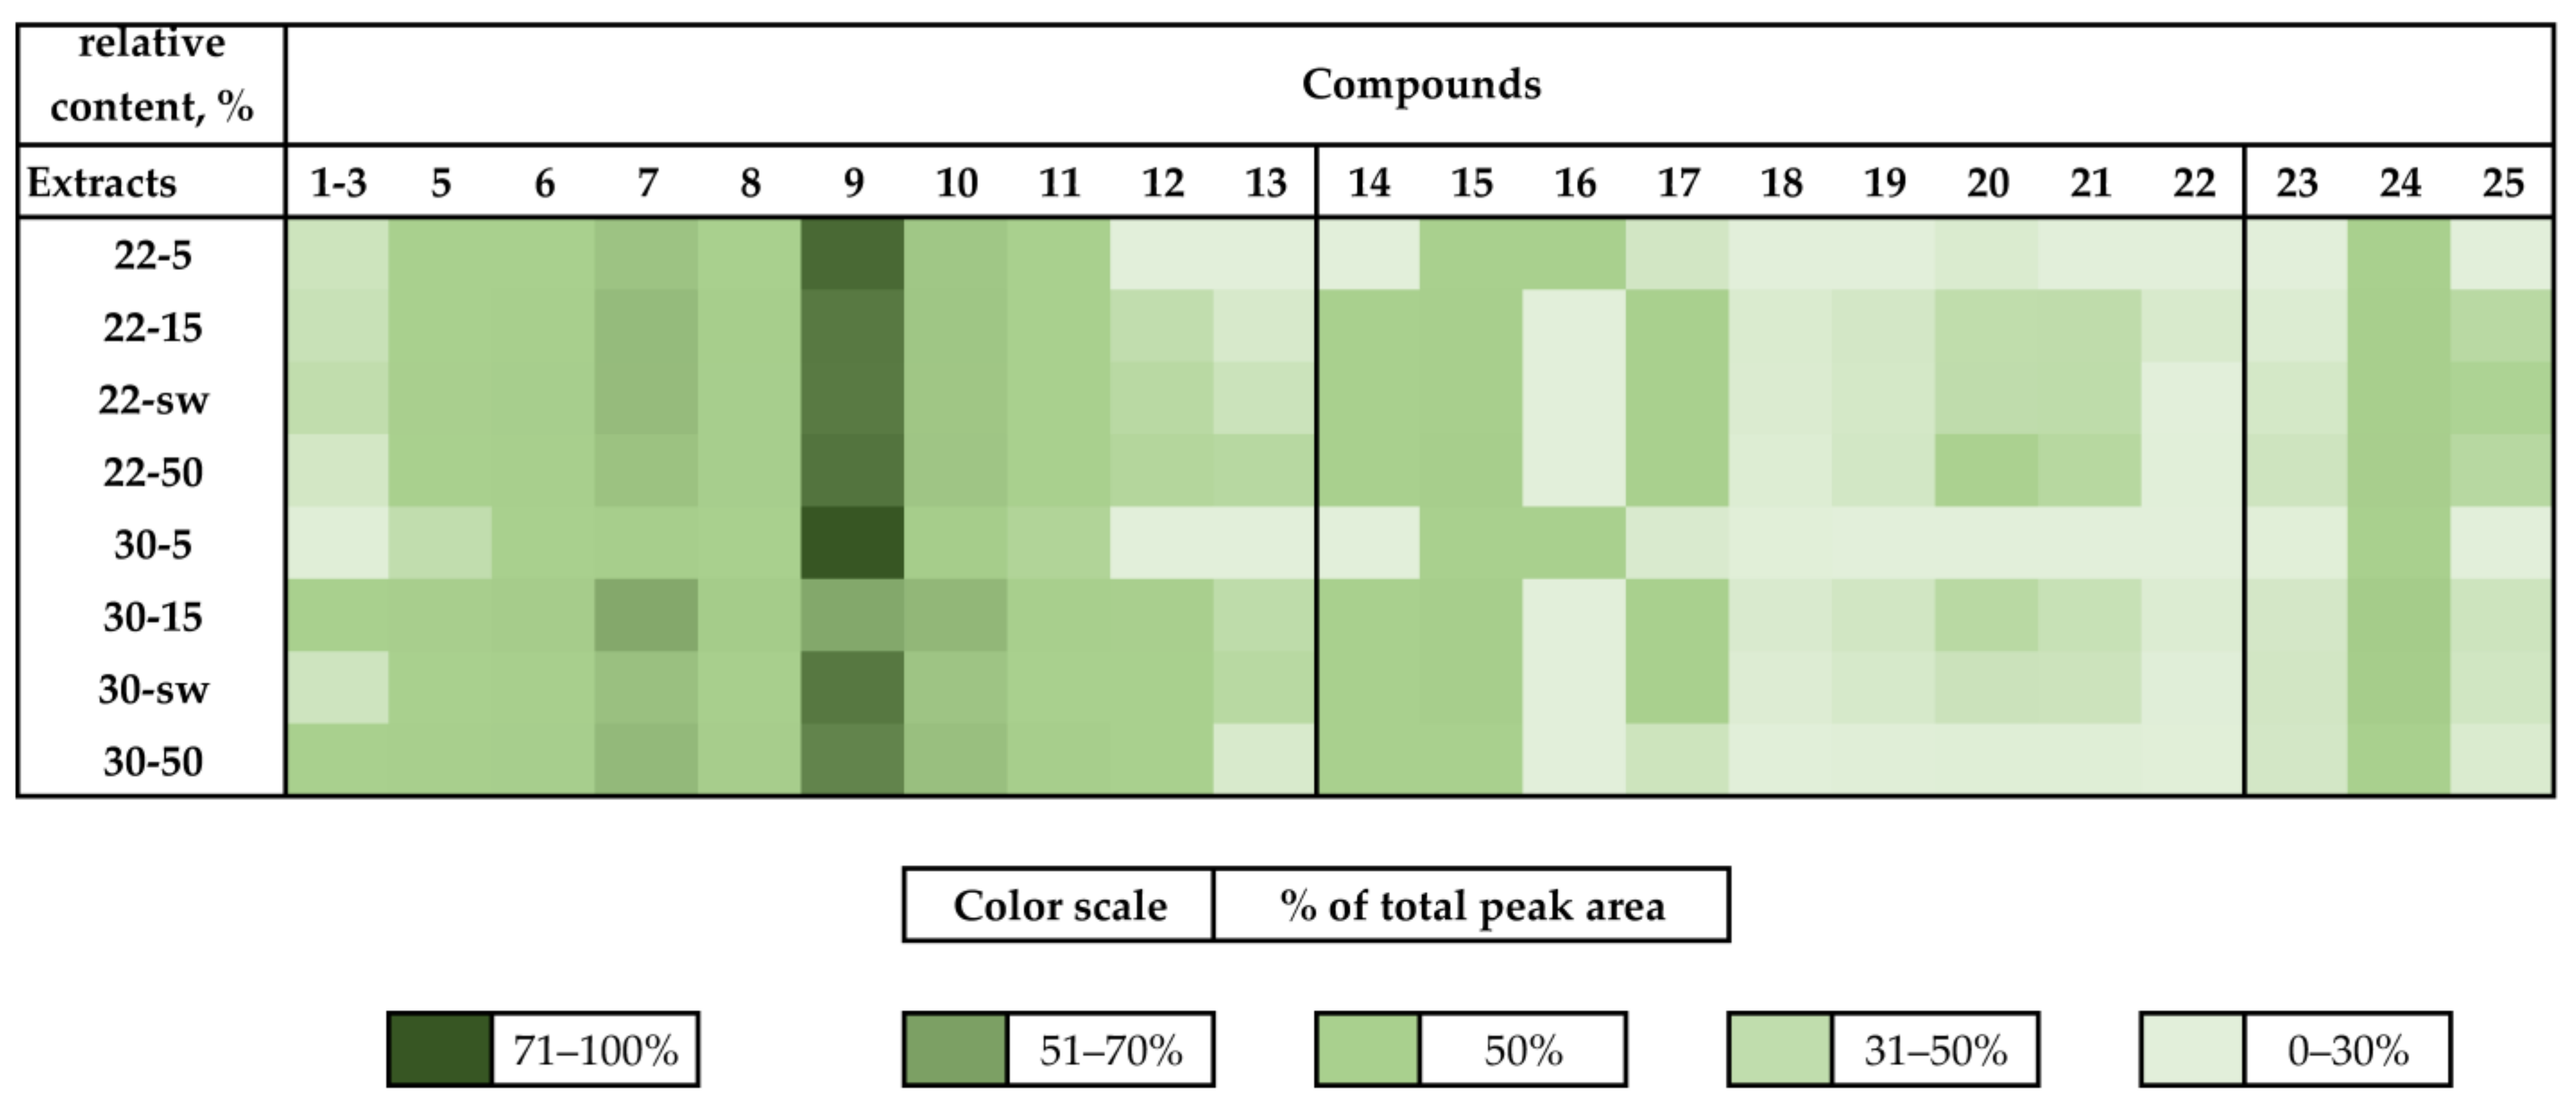
The scavenging activity of all extracts for DPPH radicals in cell-free tests as well as their cytotoxic effects on human prostate cancer PC-3 and rat normal cardiomyocytes H9c2 line are presented in Table 3.
The DPPH radical scavenging activity of all tested extracts was different. From the extracts of fungus cultivated at 22 °C, a weak activity was observed for the 22-30 and 22-sw extracts. The extracts from 22-10 to 22-45 showed middle activity and the 22-5 and 22-50 extracts showed the most DPPH radical scavenging effect. From the extracts of fungus cultivated at 30 °C, most active extracts were also 30-5. The extracts from 30-15 to 30-45 showed moderate DPPH radical scavenging effects and extracts 30-15 and 30-50 shown weak activity in this test.
The cytotoxic activity of the extracts was not high. Most of the extracts decreased PC-3 and H9c2 cells viability by 23–50%. Extract 22-50 decreased the viability of PC-3 cells by 72%, while it decreased H9c2 cell viability by only 37%. Surprisingly, extract 22-5 showed minimal cytotoxicity against both cell lines.
The hyposalinity as well as hypersalinity at 22 °C resulted in higher DPPH radical scavenging activity of the extracts. The hyposalinity conditions, but not hypersalinity, at 30 °C also increased the DPP-radical scavenging activity of extracts. Similar conclusions about the influence of culture conditions on the cytotoxic activity of the extracts cannot be drawn.

3.1.3. HPLC MS

For detailed analysis of the metabolite profiles, the extracts of fungal cultures at 22 °C and 30 °C with 5, 15, 37.8 (sw) and 50 µg/mL of sea salt were studied using the HPLC MS method. The UHPLC MS chromatogram of the 22-sw extract as an example is presented in Figure 4 and chromatograms of the 22-5, 22-15, 22-50, 30-5, 30-15, 30-sw and 30-50 extracts are presented in Figures S21–S28.
In total, 25 known compounds such as indolediketopiperazine alkaloids 1–13, anthraquinone derivatives emodine (14) [23], citreorosein (15) [24], 2-chlorocitreorosein (16) [25], endocrocin (17) [26] and nephrolaevigatins A–D (1821) [27], secalonic acid D (22) [28], cinnamic acid (23) and isochromen (24) derivatives and unidentified ergostane derivative (25) (Figure 4, Appendix A) were identified in various combination in the studied extracts.
The main peak in all obtained HPLC MS chromatograms was detected at 7.7 min. The base peak with m/z 348.1697 corresponded to the molecular formula C21H21N3O2, the same as (+)-deoxyisoaustamide (9), which was previously isolated from this strain. This was additionally proven through comparison of experimental MS/MS spectra and RT with an in-house database (Figure S37).
The peak detected at 2.9 min with m/z 364.1645 corresponded to the molecular formula C21H21N3O3, the same as 3β-hydroxydeoxyisoaustamide (7), which was previously isolated from this strain. This was additionally proven through comparison of experimental MS/MS spectra and RT with an in-house database (Figure S36). One more closely related alkaloid austamide (13) with the same molecular formula was identified for the peak at 5.2 min with m/z 364.1654 using the GNPS database.
The peak detected at 7.6 min with m/z 350.1870 corresponded to the molecular formular C21H23N3O2, the same as deoxydihydroisoaustamide (10), which was previously isolated from this strain [8]. This was additionally proven through comparison of experimental MS/MS spectra and RT with an in-house database (Figure S38).
The peak detected at 10.8 min with m/z 346.1562 corresponded to the molecular formular C21H19N3O2, the same as deoxy-14,15-dehydroisoaustamide (8), which was previously isolated from this strain [9]. Unfortunately, we did not have a reference compound to obtain MS/MS data and retention times to uniquely identify this compound.
The peak detected at 7.3 min with m/z 396.194 corresponded to the molecular formula C22H25N3O4, which can be associated with three stereoisomeric alkaloids previously isolated from this strain: 16α-hydroxy-17β-methoxy-deoxydihydroisoaustamide (1), 16β-hydroxy-17α-methoxy-deoxydihydroisoaustamide (2) and 16α-hydroxy-17α-methoxy-deoxydihydroisoaustamide (3). This was additionally proven through comparison of experimental MS/MS spectra and RT with an in-house database (Figures S30–S32). The RT of reference compounds were very close; therefore, all three compounds can be contained in one peak of the extract HPLC MS chromatograms.
The peaks detected at 6.0 and 6.6 min with m/z 396.194 corresponded to the molecular formula C21H23N3O4, which can be associated with the stereoisomeric alkaloids previously isolated from this strain 16,17-dihydroxy-deoxydihydroisoaustamide (4), 16β,17α-dihydroxy-deoxydihydroisoaustamide (5) and 16α,17α-dihydroxy-deoxydihydroisoaustamide (6). The comparison of experimental MS/MS spectra and RT with the values obtained for reference compounds showed that RT 6.0 and 6.6 min correspond to 16β,17α-dihydroxy-deoxydihydroisoaustamide (5) and 16α,17α-dihydroxy-deoxydihydroisoaustamide (6) (Figures S34 and S35). The peak detected at 6.2 min with same m/z likely corresponds to 16,17-dihydroxy-deoxydihydroisoaustamide (4) (Figure S33), but this peak was only detected in extracts in trace quantities and we have no MS/MS for exact identification.
The peak detected at 9.6 min (m/z 352.2010) corresponded to the molecular formula C21H23N3O2, which can be associated with the desoxybrevianamide E (11) previously isolated from this strain. This was additionally proven through comparison of experimental MS/MS spectra and RT with an in-house database (Figure S39).
The peak detected at 5.0 min (m/z 284.1386) corresponded to the molecular formula C16H17N3O2 and was associated with the known brevianamide F (12) using the GNPS database.
The peaks detected at 13.0 (m/z 271.0597), 8.7 (m/z 287.0545), 10.1 (m/z 321.0160) and 8.1 (m/z 315.0490) min corresponded to the molecular formulas C15H10O5, C15H10O6, C15H9ClO6 and C16H10O7, and were associated with anthraquinone derivatives emodine (13) [23], citreorosein (15) [24], 2-chlorocitreorosein (16) [25] and endocrocin (17) [26], respectively, using the GNPS database.
The peaks detected at 15.5 (m/z 579.0609) and 15.7 (m/z 579.0614) min corresponded to the molecular formulas C30H20Cl2O8, and were associated with the stereoisomeric bisanthrone derivatives nephrolaevigatins A (18) and B (19), respectively, using the GNPS database [27]. The peaks detected at 15.3 (m/z 545.1005) and 15.0 (m/z 545.1012) min corresponded to the molecular formulas C30H21ClO8, and were associated with the stereoisomeric bisanthrone derivatives nephrolaevigatins C (20) and D (21), respectively, using the GNPS database [27]. It should be noted that the identification of compounds 1821 was carried out not only on the basis of the identity of the MS/MS spectra, but also based on the correspondence of the RT, which made it possible to identify specific stereoisomers [27].
The peaks detected at 13.6 (m/z 639.1747), 4.9 (m/z 209.081) and 5.1 (m/z 235.096) min corresponded to the molecular formulas C32H30O14, C11H12O4 and C13H14O4, and were associated with secalonic acid D (22) [28], cinnamic acid (23) and isochromen (24) derivatives, respectively, using the GNPS database. The peak detected at 19.9 min with m/z 411.324 corresponded to the molecular formula C28H42O2, and can be associated with the unidentified ergostane derivative (25) according to characteristic MS/MS spectra.
The use of FBMN together with the in-house database made it possible to reveal several clusters of related features, the largest of which was assigned to brevianamide alkaloids and contained not only identified compounds 513, but also a few unidentified compounds (Figure 5).
The relative content of the compounds in the studied extracts was calculated as a percentage of the total area of the corresponding peaks in the HPLC MS chromatograms and is presented as a heatmap (Figure 6). A main compound detected in all extracts was (+)-deoxyisoaustamide (9), the amount of which was increased in hypo- and hypersalinity cultures, excluding the 22-5 extract. 3β-hydroxydeoxyisoaustamide (7) and deoxydihydroisoaustamide (10) were also detected as major compounds, and their amounts were decreased in extracts obtained with 5 µg/mL of sea salt. The neuroprotective alkaloids 5 and 6 were detected in the greatest amount in the extract obtained after culture at 30 °C and with hypersalinity. Other alkaloids (13, 1113) were found only in small amounts, and compounds 12 and 13 were not detected at all in extract 30-5.
Under hyposaline conditions (22-5 and 30-5), the content of almost all anthraquinone pigments sharply decreased, with the exception of 2-chlorocitreorosein (16), which was found only in these extracts (Figure 6). In addition, the content of bisanthrone derivatives 1821 decreased with an increase in cultivation temperature to 30 °C. Interestingly, the relative content of citreorosein (15) and isochromene derivative (24) was stable in all extracts. The change in the content of the cinnamic acid derivative (23) occurred in direct proportion to the change in the salt content in the medium, regardless of cultivation temperature. The content of ergostane triterpenoid (25) hardly changed at 22 °C, except for a decrease in hyposaline conditions (22-5), and decreased with any deviation from the natural content of sea salt at 30 °C.
Overall, hyposaline conditions (especially at a lower temperature) of cultivation significantly reduced the content of almost all detected compounds. Hyper salinity caused a change in metabolism, which was expressed in an increase or decrease in the content of individual detected metabolites.
Principal component analysis (PCA) was used to distinguish between extracts that were analyzed using HPLC MS. The PCA model showed an optimal number of principal components (PCs) equal to two, so two PCs (PC1 and PC2) were chosen to describe ≈99% of the variations in the samples. The first principal component describes about 92% of variance and the second principal component describes ≈7% of variations (Figure 7).
The results of the PCA analysis showed that the extracts obtained during cultivation with standard salinity, regardless of temperature (22-sw and 30-sw), are close to each other in the two principal components. Extract 22-15 is also close to this group. The extracts obtained after hyposaline cultivation (22-5 and 30-5) have large differences from the first group of samples according to PC1. Extracts 30-50 and 30-15 are different from each other in PC2 and are different from the first group of extracts in PC1. Extract 22-50 differs from the first group of extracts and other groups in both PC1 and PC2.

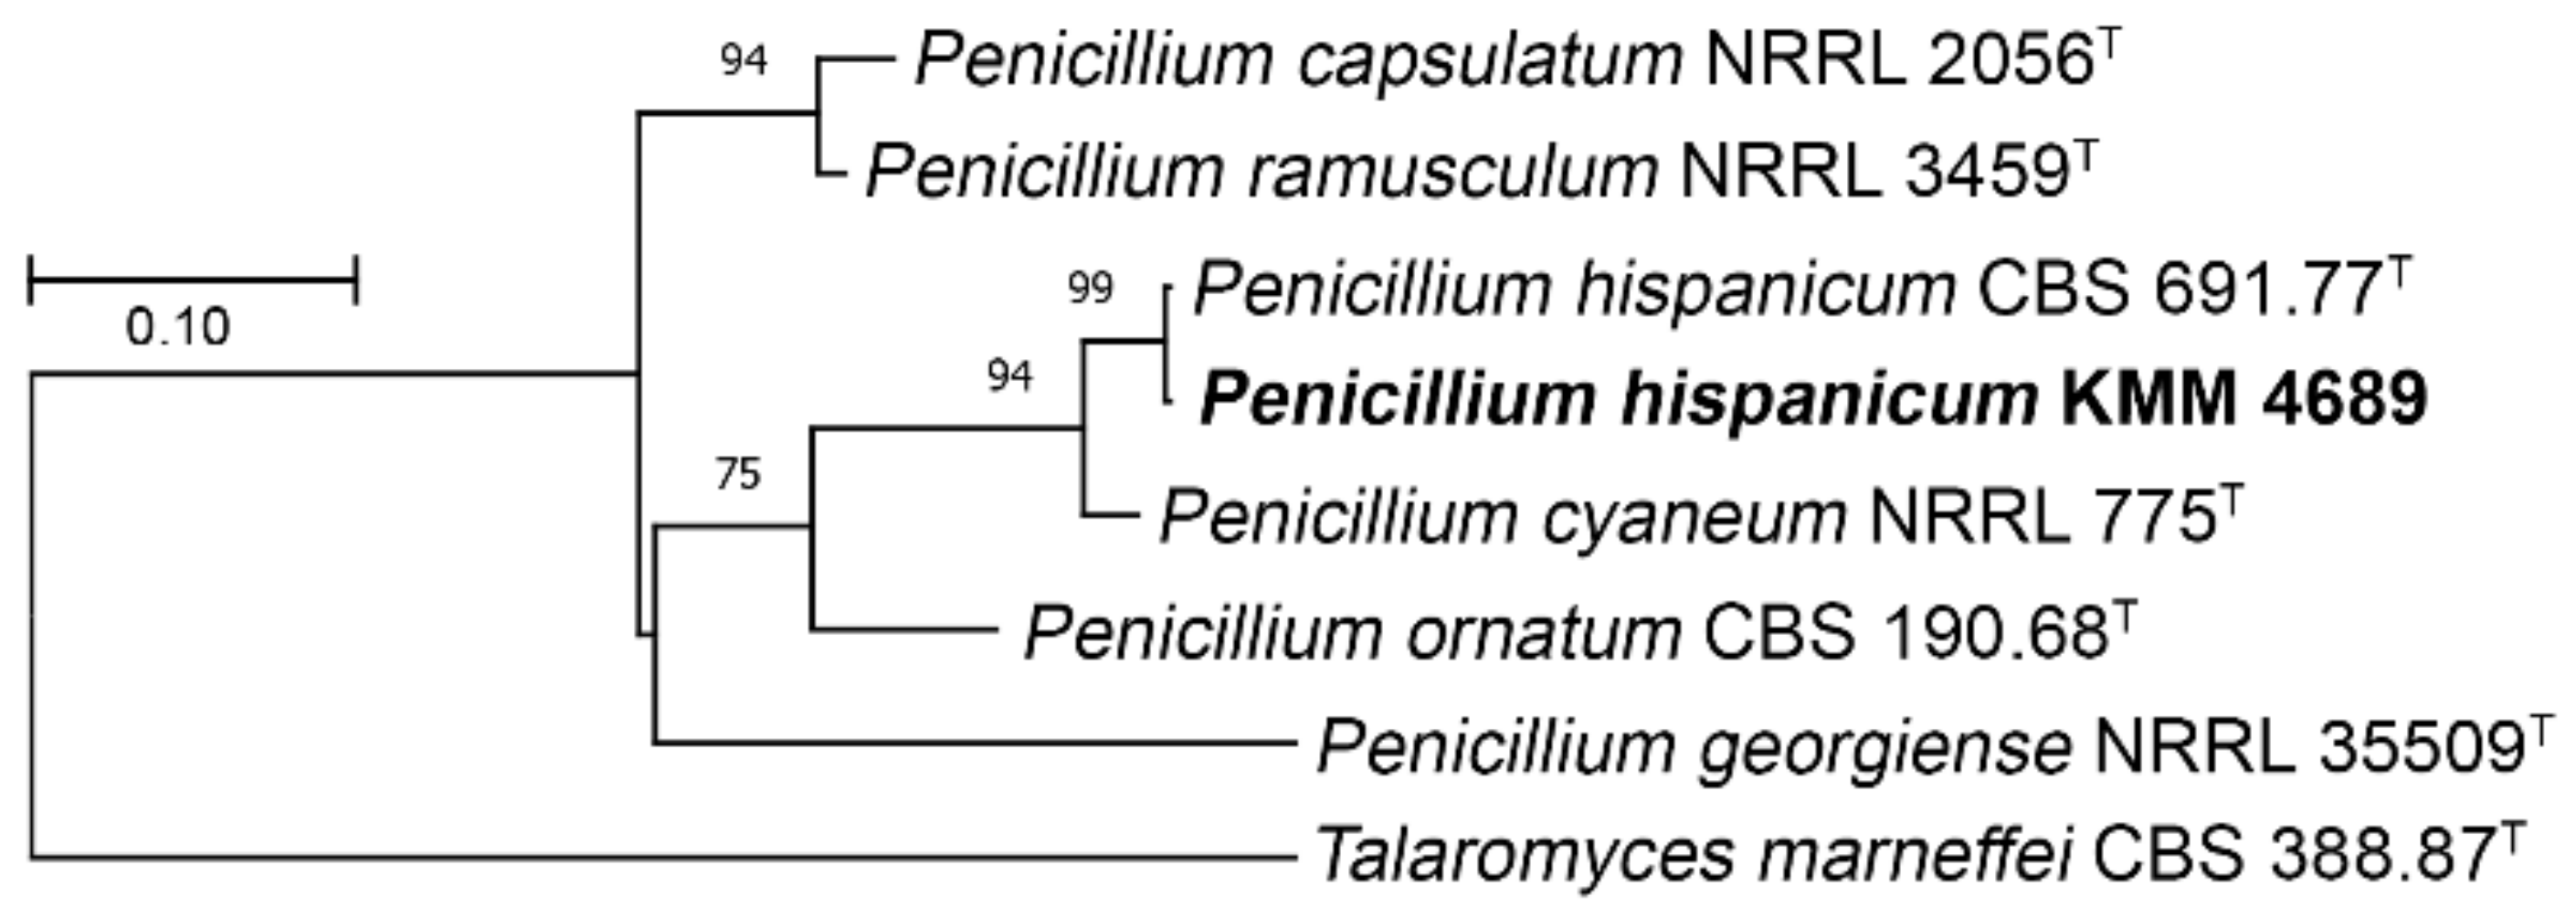
3.2. Molecular Re-Identification of the Fungal Strain
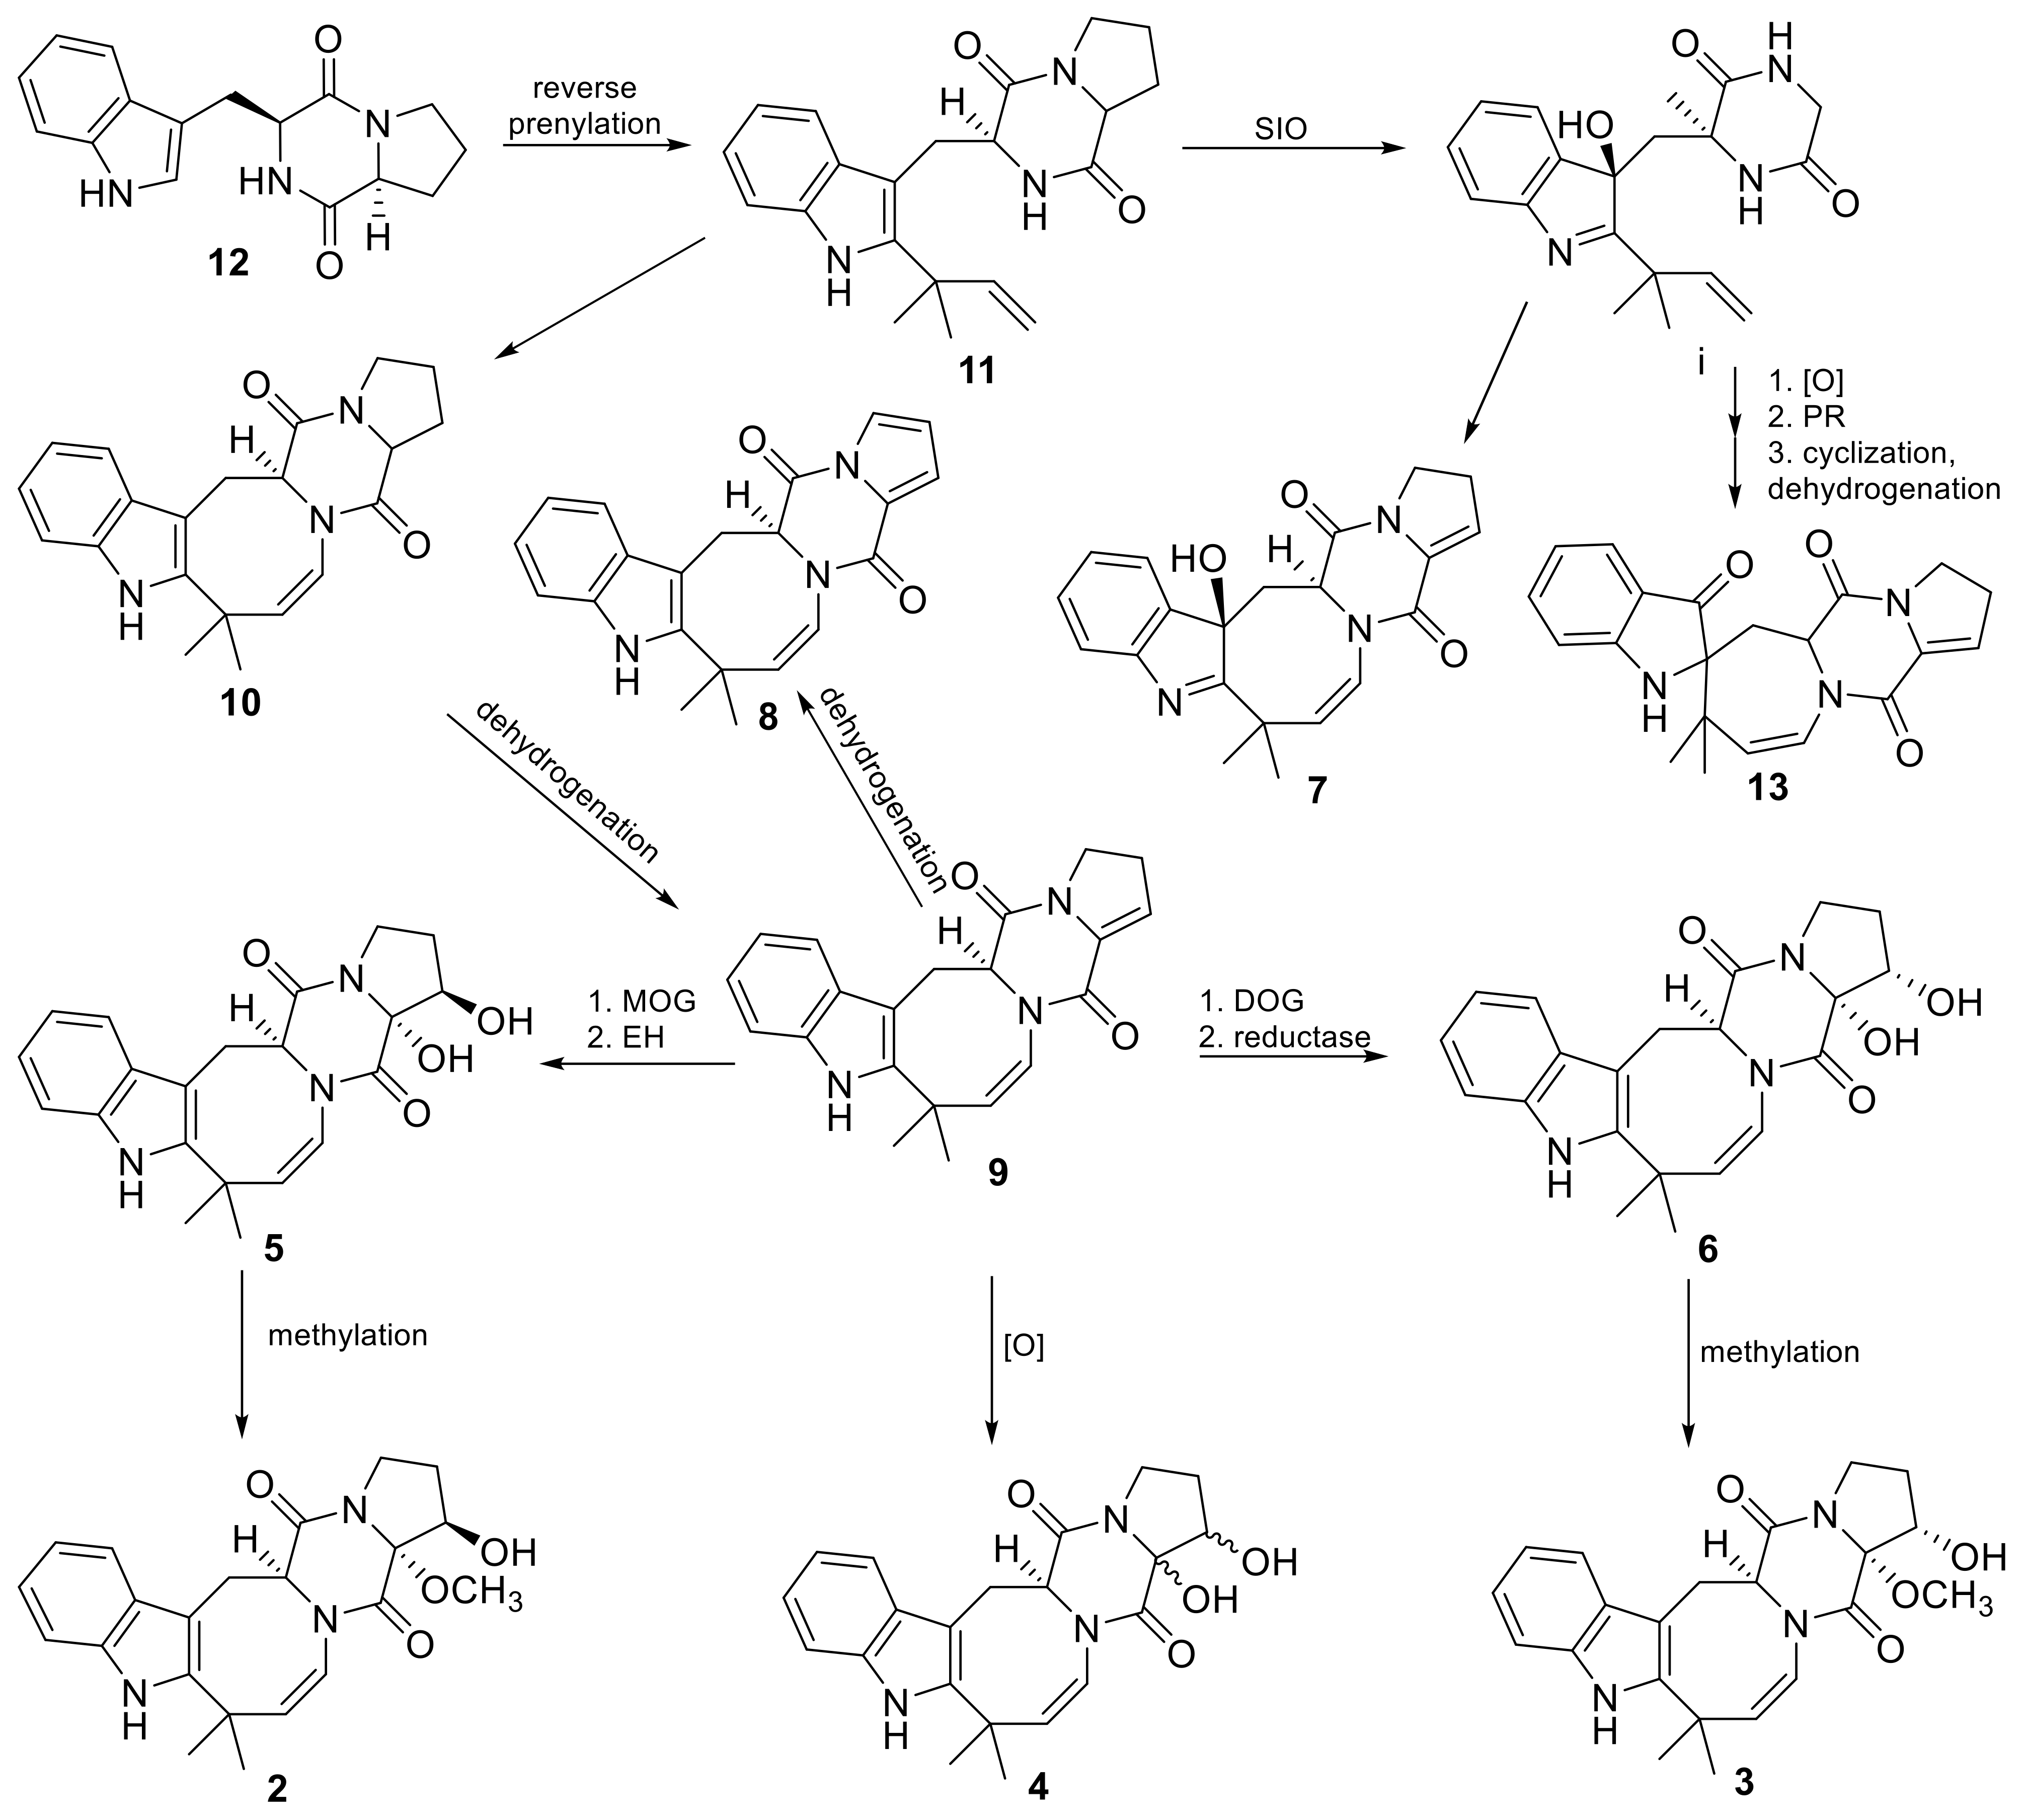
The study of secondary metabolites of the strain KMM 4689 showed that although brevianamide-related alkaloids and anthraquinone pigments are widely distributed in various fungi, these metabolites have not yet been described for P. dimorphosporum and related species. For this reason, the KMM 4689 strain was re-sequenced using a combination of two molecular markers (ITS and β-tubulin regions).
Approximately 1200 bp fragments of the ITS gene region and 450 bp fragments of the β-tubulin gene were successfully amplified. BLAST search results indicated that the sequences were 99.52–100% identical to the sequences of the ex-type strain Penicillium hispanicum CBS 691.77. The phylogenetic ML tree constructed on the basis of the concatenated ITS gene and partial β-tubulin gene sequences clearly showed that the strain KMM 4689 belongs to the Ramigena seria of Ramigena section together with Penicillium capsulatum, P. cyaneum, P. ornatum and P. ramusculum (Figure 8). The phylogenetic ML tree of ITS region sequences showing the phylogenetic position of the strain KMM 4689 among members of the genus Penicillium section Ramigena and section Exilicaulis (P. dimorphosporum) is presented in Figure S29.

4. Discussion

The fungal strain KMM 4689 was originally identified as P. dimorphosporum according to morphological features, ITS molecular data and its association with the marine environment [8]. P. dimorphosporum was firstly isolated from mangrove swamp soil (Australia) and described by H.J. Swart in 1970 [29]. ITS is a widely used sequence marker for fungi, but its data give good results for identifications at the complex or section level. Because of some limitations associated with ITS as a species-level marker, we used the β-tubulin gene as a secondary identification marker [30]. Re-identification was based on the concatenated ITS gene and partial β-tubulin gene sequences showing the phylogenetic position of the strain KMM 4689 among members of the genus Penicillium section Ramigena (Figure 8 and Figure S29).
Both P. dimorphosporum and P. hispanicum share some similarities such as slow growth on CYA, monoverticillate conidiophores and pigment production. However, the secondary metabolites reported from these fungi to date are quite different.
P. dimorphosporum fungus belongs to the Exilicaulis section of the Erubescentia series (Figure S29). This series includes 16 species with restricted colony, short monoverticillate conidiophores and conidia with variable shapes [31]. The fungi of the Exilicaulis section are characterized by the production of long-chain polyketides [32,33,34], benzopyrans [35], chromones and xanthones [36], as well as the simplest dipeptides, non-prenylated indole and diketopiperazine alkaloids [37].
P. hispanicum is in the Ramigena section of the Ramigena series together with Penicillium capsulatum, P. cyaneum, P. ornatum and P. ramusculum [31]. The metabolism of these fungi is relatively poorly understood. To date, they have been described as producers of anthraquinone and bisanthrone pigments [31], and a number of other polyketides [38,39]. Moreover, P. hispanicum was reported as a source of brevianamide-related alkaloid desoxybrevianamide E (11) [31], which was identified by us in all studied fungal extracts and which is the precursor of related compounds 110 and 13. The identification of brevianamide F (12) allowed us to suggest the biosynthesis scheme of the 2,5-diketopiperazine alkaloids in this fungal strain (Figure 9).
The change in fungal culture conditions induced a change in the metabolite profiles of the fungal extracts detected through both HPLC UV and HPLC MS approaches, indicating a significant influence of culture conditions on the metabolism of this fungus.
Comparison of the number of peaks in HPLC UV chromatograms both at 220 nm and at 290 nm detection as well as peak areas with the masses of purified extracts showed no direct relationships. The extracts of cultures obtained under hyposaline conditions (22-5 and 30-5) have the largest masses of extracts but a minimal area of peaks in the HPLC UV chromatograms. The increase in cultivation temperature to 30 °C did not result in a change in extract masses, but induced an increase in the area of peaks in the polar and middle polar zones of the HPLC UV chromatograms at 220 nm.
HPLC MS detection allowed us to identify 25 compounds, but only 14 compounds, 111, 15, 17 and 24, were identified in all studied extracts. Compounds 12 and 13 as well as 14, 19, 21, 22, and 25 were not identified in the 22-5 and 30-5 extracts. Compounds 18 and 23 were not identified in extract 22-5. Compound 20 was not identified in the 30-5 extract. 2-Chlorocitreorosein (16) was identified only in the 22-5 and 30-5 extracts. Therefore, strong hyposalinity conditions clearly have the most significant influence on the metabolite profile of this fungal strain. In addition, about 20 visible HPLC MS peaks were not identified and yet more differences in the metabolite profiles of extracts can be discovered in this field.
All studied extracts shown a moderate DPPH activity, and this effect was observed to be high for extracts 22-5 and 22-50 as well as 30-5. The alkaloids 113 did not show DPPH radical scavenging. Anthraquinone derivatives 1421 also could not be described as radical scavengers [40]. Cinnamic acid derivative 23 showed weak DPPH radical scavenging activity [41]. No antioxidant activity for isochromene derivative 24 was reported, but other isochromenes demonstrated earlier DPPH radical scavenging effect [42]. Therefore, the high DPPH radical scavenging activity of several extracts may be considered with unidentified compounds.
The moderate cytotoxicity of extracts may be caused by a presence of compounds 13 [43], 14 [44], 16 [45] and 22 [46]. The most cytotoxic extract 22-50 contained the maximum amount of the most-detected metabolites, which probably explains its cytotoxicity, while extract 22-5, characterized by a low content of many identified compounds, also showed the weakest cytotoxic activity. On the other hand, the extracts can contain other cytotoxic compounds.
Therefore, the production of known neuroprotective alkaloids 5, 6 and other brevianamide alkaloids was increased in hypersaline and high-temperature conditions, and this may be an adaptation to extreme conditions. On the other hand, hyposalinity stress may induce the synthesis of unidentified antioxidants with low cytotoxicity that could be very interesting for future investigation.

5. Conclusions

In total, 25 varying compounds including 13 desoxyisoaustamide alkaloids and eight anthraquinones were identified in different combinations in the extracts, obtained after changes in the fungal strain KMM 4689 cultivation conditions, and the relative amounts of identified metabolites were estimated. The production of known neuroprotective alkaloids 16,17-dihydroxy-deoxydihydroisoaustamides (46) and other brevianamide alkaloids was increased in hypersaline and high-temperature conditions, and this may be an adaptation to extreme conditions. On the other hand, the hyposalinity stress may induce the synthesis of unidentified antioxidants with low cytotoxicity that could be very interesting for future investigation.
The study of secondary metabolites of the strain KMM 4689 showed that although brevianamide-related alkaloids and anthraquinone pigments are widely distributed in various fungi, these metabolites have not been described for Penicillium dimorphosporum and related species. For this reason, the strain KMM 4689 was re-identified as P. hispanicum using a combination of the ITS region and β-tubulin gene sequences as molecular markers.

Supplementary Materials

The following supporting information can be downloaded at: https://www.mdpi.com/article/10.3390/fermentation9040337/s1, Figures S1–S20: HPLC UV chromatograms for all analyzed extracts; Figures S21–S28: UHPLC MS chromatograms for extracts 22-sw, 22-5, 22-15, 22-50, 30-sw, 30-5, 30-15, 30-50; Figure S29: ITS gene-based ML tree for P. hispanicum and P. dimorphosporum; Figures S30–S39: HPLC MS chromatograms for reference compounds 110.

Author Contributions

Conceptualization, E.A.Y. and A.N.Y.; Data curation, R.S.P.; Formal analysis, N.N.K., V.E.C., E.A.Y. and A.N.Y.; Funding acquisition, M.P.I.; Investigation, L.E.N., R.S.P., O.I.Z., N.N.K., V.E.C., K.S.K., M.V.P. and E.A.Y.; Project administration, M.P.I.; Resources, A.N.Y.; Supervision, M.P.I. and A.N.Y.; Validation, R.S.P., O.I.Z., E.A.Y., M.P.I. and A.N.Y.; Visualization, L.E.N., N.N.K., V.E.C., K.S.K., E.A.Y. and A.N.Y.; Writing—original draft, L.E.N., N.N.K., V.E.C. and E.A.Y.; Writing—review and editing, M.P.I. and A.N.Y. All authors have read and agreed to the published version of the manuscript.

Funding

This research was funded by a grant from the Ministry of Science and Higher Education of the Russian Federation 15.BRK.21.0004 (Contract No. 075-15-2021-1052).

Institutional Review Board Statement

Not applicable.

Informed Consent Statement

Not applicable.

Data Availability Statement

The FBMN is available from the GNPS website through the following link: https://gnps.ucsd.edu/ProteoSAFe/status.jsp?task=edcc91ae9f2943ac8a3bd2ad4e94ae10 (accessed on 28 October 2022).

Acknowledgments

We are grateful to Sergey Baldaev for Sanger sequencing of nucleotide sequences. The study was carried out using the Collective Facilities Center “Collection of Marine Microorganisms PIBOC FEB RAS” and on the equipment of the Collective Facilities Center, “The Far Eastern Center for Structural Molecular Research (NMR/MS) PIBOC FEB RAS”.

Conflicts of Interest

The authors declare no conflict of interest.

Appendix A

Table A1. The identified compounds.
NNameStructureRTExact Mass (Measured)Exact Mass (Calcd)Δ, ppmMQScore (GNPS)Ref.
116α-hydroxy-17β-methoxy-deoxydihydroisoaustamideFermentation 09 00337 i0017.3396.194
[M+H]+
396.1918−5.6*[8]
216β-hydroxy-17α-methoxy-deoxydihydroisoaustamideFermentation 09 00337 i0027.3396.194
[M+H]+
396.1918−5.6*[8]
316α-hydroxy-17α-methoxy-deoxydihydroisoaustamideFermentation 09 00337 i0037.3396.194
[M+H]+
396.1918−5.6*[8]
416,17-dihydroxy-deoxydihydroisoaustamideFermentation 09 00337 i0046.2382.176
[M+H]+
382.17610.3*[8]
516β,17α-dihydroxy-deoxydihydroisoaustamideFermentation 09 00337 i0056.0382.176
[M+H]+
382.17610.3*[8]
616α,17α-dihydroxy-deoxydihydroisoaustamideFermentation 09 00337 i0066.6382.176
[M+H]+
382.17610.3*[8]
73β-hydroxydeoxyisoaustamideFermentation 09 00337 i0072.9364.1645
[M+H]+
364.16563.0*[8]
8deoxy-14,15-dehydroisoaustamideFermentation 09 00337 i00810.8346.1562
[M+H]+
346.15503.4**[9]
9(+)-deoxyisoaustamideFermentation 09 00337 i0097.7348.1697
[M+H]+
348.17072.9*[8]
10deoxydihydroisoaustamideFermentation 09 00337 i0107.6350.1870
[M+H]+
350.1863−2.0*[8]
11desoxybrevianamide EFermentation 09 00337 i0119.7352.2010
[M+H]+
352.20202.7*[8]
12brevianamide FFermentation 09 00337 i0125.0284.1386
[M+H]+
284.13942.70.98[47]
13austamideFermentation 09 00337 i0135.2364.1654
[M+H]+
364.16560.50.81[43]
14emodineFermentation 09 00337 i01413.0271.0597
[M+H]+
271.06011.50.94[14,48]
15citreoroseinFermentation 09 00337 i0158.7287.0545
[M+H]+
287.05501.80.89[14,49]
162-chlorocitreoroseinFermentation 09 00337 i01610.1321.016
[M+H]+
321.01600.10.86[25]
17endocrocinFermentation 09 00337 i0178.1315.0490
[M+H]+
315.04992.90.96[14]
18nephrolaevigatin AFermentation 09 00337 i01815.5579.0609
[M+H]+
579.0608−0.20.81[27]
19nephrolaevigatin BFermentation 09 00337 i01915.7579.0614
[M+H]+
579.0608−1.040.81[27]
20nephrolaevigatin CFermentation 09 00337 i02015.3545.1005
[M+H]+
545.0998−1.30.89[27]
21nephrolaevigatin DFermentation 09 00337 i02115.0545.1012
[M+H]+
545.0998−2.60.89[27]
22secalonic acid DFermentation 09 00337 i02213.6639.1747
[M+H]+
639.1708−6.10.82[50,51]
233,4-dimethoxycinnamic acidFermentation 09 00337 i0234.9209.081
[M+H]+
209.0804−0.80.90[52]
247-hydroxy-3-(2-hydroxypropyl)-5-methylisochromen-1-oneFermentation 09 00337 i0245.1235.096
[M+H]+
235.09652.10.86[53]
25unidentified ergostane derivativeC28H42O219.9411.324
[M+H]+
411.32584.3
* Compounds were identified through comparison of MS/MS data and retention time with those obtained for authentic standards previously isolated from this fungal strain [8]. ** Compound was identified based on an exact mass value.

References

  1. Dewapriya, P.; Kim, S.K. Marine microorganisms: An emerging avenue in modern nutraceuticals and functional foods. Food Res. Int. 2014, 56, 115–125. [Google Scholar] [CrossRef]
  2. Takahashi, J.A.; Barbosa, B.V.R.; Martins, B.A.; Guirlanda, C.P.; Moura, M.A.F. Use of the versatility of fungal metabolism to meet modern demands for healthy aging, functional foods, and sustainability. J. Fungi 2020, 6, 223. [Google Scholar] [CrossRef] [PubMed]
  3. Pinedo-Rivilla, C.; Aleu, J.; Durán-Patrón, R. Cryptic Metabolites from Marine-Derived Microorganisms Using OSMAC and Epigenetic Approaches. Mar. Drugs 2022, 20, 84. [Google Scholar] [CrossRef]
  4. Bode, H.B.; Bethe, B.; Höfs, R.; Zeeck, A. Big effects from small changes: Possible ways to explore nature’s chemical diversity. ChemBioChem 2002, 3, 619–627. [Google Scholar] [CrossRef]
  5. Petersen, L.E.; Marner, M.; Labes, A.; Tasdemir, D. Rapid metabolome and bioactivity profiling of fungi associated with the leaf and rhizosphere of the baltic seagrass zostera marina. Mar. Drugs 2019, 17, 419. [Google Scholar] [CrossRef] [PubMed] [Green Version]
  6. Overy, D.; Correa, H.; Roullier, C.; Chi, W.C.; Pang, K.L.; Rateb, M.; Ebel, R.; Shang, Z.; Capon, R.; Bills, G.; et al. Does Osmotic Stress Affect Natural Product Expression in Fungi? Mar. Drugs 2017, 15, 254. [Google Scholar] [CrossRef] [PubMed] [Green Version]
  7. Igboeli, H.A.; Marchbank, D.H.; Correa, H.; Overy, D.; Kerr, R.G. Discovery of Primarolides A and B from Marine Fungus Asteromyces cruciatus Using Osmotic Stress and Treatment with Suberoylanilide Hydroxamic Acid. Mar. Drugs 2019, 17, 435. [Google Scholar] [CrossRef] [Green Version]
  8. Zhuravleva, O.I.; Antonov, A.S.; Trang, V.T.D.; Pivkin, M.V.; Khudyakova, Y.V.; Denisenko, V.A.; Popov, R.S.; Kim, N.Y.; Yurchenko, E.A.; Gerasimenko, A.V.; et al. New Deoxyisoaustamide Derivatives from the Coral-Derived Fungus Penicillium dimorphosporum KMM 4689. Mar. Drugs 2021, 19, 32. [Google Scholar] [CrossRef]
  9. Dyshlovoy, S.A.; Zhuravleva, O.I.; Hauschild, J.; Busenbender, T.; Pelageev, D.N.; Yurchenko, A.N.; Khudyakova, Y.V.; Antonov, A.S.; Graefen, M.; Bokemeyer, C.; et al. New Marine Fungal Deoxy-14,15-Dehydroisoaustamide Resensitizes Prostate Cancer Cells to Enzalutamide. Mar. Drugs 2023, 21, 54. [Google Scholar] [CrossRef]
  10. Chambers, M.C.; MacLean, B.; Burke, R.; Amodei, D.; Ruderman, D.L.; Neumann, S.; Gatto, L.; Fischer, B.; Pratt, B.; Egertson, J.; et al. A cross-platform toolkit for mass spectrometry and proteomics. Nat. Biotechnol. 2012, 30, 918–920. [Google Scholar] [CrossRef]
  11. Pluskal, T.; Castillo, S.; Villar-Briones, A.; Orešič, M. MZmine 2: Modular framework for processing, visualizing, and analyzing mass spectrometry-based molecular profile data. BMC Bioinform. 2010, 11, 395. [Google Scholar] [CrossRef] [Green Version]
  12. Myers, O.D.; Sumner, S.J.; Li, S.; Barnes, S.; Du, X. One Step Forward for Reducing False Positive and False Negative Compound Identifications from Mass Spectrometry Metabolomics Data: New Algorithms for Constructing Extracted Ion Chromatograms and Detecting Chromatographic Peaks. Anal. Chem. 2017, 89, 8696–8703. [Google Scholar] [CrossRef] [PubMed]
  13. Nothias, L.F.; Petras, D.; Schmid, R.; Dührkop, K.; Rainer, J.; Sarvepalli, A.; Protsyuk, I.; Ernst, M.; Tsugawa, H.; Fleischauer, M.; et al. Feature-based molecular networking in the GNPS analysis environment. Nat. Methods 2020, 17, 905–908. [Google Scholar] [CrossRef] [PubMed]
  14. Christiansen, J.V.; Larsen, T.O.; Frisvad, J.C. Production of Fungal Quinones: Problems and Prospects. Biomolecules 2022, 12, 1041. [Google Scholar] [CrossRef]
  15. Aron, A.T.; Gentry, E.C.; McPhail, K.L.; Nothias, L.F.; Nothias-Esposito, M.; Bouslimani, A.; Petras, D.; Gauglitz, J.M.; Sikora, N.; Vargas, F.; et al. Reproducible molecular networking of untargeted mass spectrometry data using GNPS. Nat. Protoc. 2020, 15, 1954–1991. [Google Scholar] [CrossRef] [PubMed]
  16. Pedregosa, F.; Varoquaux, G.; Gramfort, A.; Michel, V.; Thirion, B.; Grisel, O.; Blondel, M.; Prettenhofer, P.; Weiss, R.; Dubourg, V.; et al. Scikit-learn: Machine learning in Python. J. Mach. Learn. Res. 2011, 12, 2825–2830. [Google Scholar] [CrossRef] [Green Version]
  17. Bedre, R. Reneshbedre/Bioinfokit: Bioinformatics Data Analysis and Visualization Toolkit, 2.0.9, Zenodo, 2022.
  18. Scholin, C.A.; Herzog, M.; Sogin, M.; Anderson, D.M. Identification of group- and strain-specific genetic markers for globally distributed Alexandrium (Dinophyceae). II. Sequence analysis of a fragment of the LSU rRNA gene. J. Phycol. 1994, 30, 999–1011. [Google Scholar] [CrossRef]
  19. Elwood, H.J.; Olsen, G.J.; Sogin, M.L. The small-subunit ribosomal RNA gene sequences from the hypotrichous ciliates Oxytricha nova and Stylonychia pustulata. Mol. Biol. Evol. 1985, 2, 399–410. [Google Scholar] [PubMed] [Green Version]
  20. Glass, N.L.; Donaldson, G.C. Development of primer sets designed for use with the PCR to amplify conserved genes from filamentous ascomycetes. Appl. Environ. Microbiol. 1995, 61, 1323–1330. [Google Scholar] [CrossRef] [Green Version]
  21. Kumar, S.; Stecher, G.; Li, M.; Knyaz, C.; Tamura, K. MEGA X: Molecular evolutionary genetics analysis across computing platforms. Mol. Biol. Evol. 2018, 35, 1547. [Google Scholar] [CrossRef]
  22. Tamura, K.; Nei, M. Estimation of the number of nucleotide substitutions in the control region of mitochondrial DNA in humans and chimpanzees. Mol. Biol. Evol. 1993, 10, 512–526. [Google Scholar]
  23. Monisha, B.A.; Kumar, N.; Tiku, A.B. Emodin and its role in chronic diseases. Adv. Exp. Med. Biol. 2016, 928, 47–73. [Google Scholar] [PubMed]
  24. Graf, T.N.; Kao, D.; Rivera-Chávez, J.; Gallagher, J.M.; Raja, H.A.; Oberlies, N.H. Drug leads from endophytic fungi: Lessons learned via scaled production. Planta. Med. 2020, 86, 988–996. [Google Scholar] [CrossRef] [PubMed]
  25. Yamamoto, Y.; Kiriyama, N.; Arahata, S. Studies on the Metabolic Products of Aspergillus fumigatus (J-4). Chemical Structure of Metabolic Products. Chem. Pharm. Bull. 1968, 16, 304–310. [Google Scholar] [CrossRef] [PubMed] [Green Version]
  26. Kurobane, I.; Vining, L.C.; Gavin McInnes, A. Biosynthetic relationships among the secalonic acids isolation of emodin, endocrocin and secalonic acids from pyrenochaeta terrestris and aspergillus aculeatus. J. Antibiot. 1979, 32, 1256–1266. [Google Scholar] [CrossRef]
  27. Lagarde, A.; Mambu, L.; Mai, P.Y.; Champavier, Y.; Stigliani, J.L.; Beniddir, M.A.; Millot, M. Chlorinated bianthrones from the cyanolichen Nephroma laevigatum. Fitoterapia 2021, 149, 104811. [Google Scholar] [CrossRef]
  28. Wang, B.H.; Polya, G.M. The fungal teratogen secalonic acid D is an inhibitor of protein kinase C and of cyclic AMP-dependent protein kinase. Planta. Med. 1996, 62, 111–114. [Google Scholar] [CrossRef] [PubMed]
  29. Swart, H.J. Penicillium dimorphosporum sp. nov. Trans. Br. Mycol. Soc. 1970, 55, 310–313. [Google Scholar] [CrossRef]
  30. Visagie, C.M.; Houbraken, J.; Frisvad, J.C.; Hong, S.B.; Klaassen, C.H.W.; Perrone, G.; Seifert, K.A.; Varga, J.; Yaguchi, T.; Samson, R.A. Identification and nomenclature of the genus Penicillium. Stud. Mycol. 2014, 78, 343–371. [Google Scholar] [CrossRef] [Green Version]
  31. Houbraken, J.; Kocsube, S.; Visagie, C.M.; Yilmaz, N.; Wang, X.C.; Meijer, M.; Kraak, B.; Hubka, V.; Bensch, K.; Samson, R.A.; et al. Classification of Aspergillus, Penicillium, Talaromyces and related genera (Eurotiales): An overview of families, genera, subgenera, sections, series and species. Stud. Mycol. 2020, 95, 5–169. [Google Scholar] [CrossRef]
  32. Hensens, O.D.; Wichmann, C.F.; Liesch, J.M.; Vanmiddlesworth, F.L.; Wilson, K.E.; Schwartz, R.E. Structure elucidation of restricticin, a novel antifungal agent from Penicillium restrictum. Tetrahedron 1991, 47, 3915–3924. [Google Scholar] [CrossRef]
  33. Brill, G.M.; Chen, R.H.; Rasmussen, R.R.; Whittern, D.N.; McAlpine, J.B. Calbistrins, novel antifungal agents produced by Penicillium restrictum. 2. Isolation and elucidation of structure. J. Antibiot. 1993, 46, 39–47. [Google Scholar] [CrossRef] [PubMed] [Green Version]
  34. Stewart, M.; Capon, R.J.; Lacey, E.; Tennant, S.; Gill, J.H. Calbistrin E and two other new metabolites from an Australian isolate of Penicillium striatisporum. J. Nat. Prod. 2005, 68, 581–584. [Google Scholar] [CrossRef]
  35. Chen, X.-H.; Zhou, G.-L.; Sun, C.-X.; Zhang, X.-M.; Zhang, G.-J.; Zhu, T.-J.; Li, J.; Che, Q.; Li, D.-H. Penicacids E–G, three new mycophenolic acid derivatives from the marine-derived fungus Penicillium parvum HDN17-478. Chin. J. Nat. Med. 2020, 18, 850–854. [Google Scholar] [CrossRef] [PubMed]
  36. Kumla, D.; Pereira, J.A.; Dethoup, T.; Gales, L.; Freitas-Silva, J.; Costa, P.M.; Lee, M.; Silva, A.M.S.; Sekeroglu, N.; Pinto, M.M.M.; et al. Chromone derivatives and other constituents from cultures of the marine sponge-associated fungus Penicillium erubescens KUFA0220 and their antibacterial activity. Mar. Drugs 2018, 16, 289. [Google Scholar] [CrossRef] [Green Version]
  37. Asiri, I.A.M.; Badr, J.M.; Youssef, D.T.A. Penicillivinacine, antimigratory diketopiperazine alkaloid from the marine-derived fungus Penicillium vinaceum. Phytochem. Lett. 2015, 13, 53–58. [Google Scholar] [CrossRef]
  38. Xian, P.J.; Chen, H.Y.; Feng, Z.; Zhao, W.; Yang, X.L. Capsulactone: A new 4-hydroxy-α-pyrone derivative from an endophytic fungus Penicillium capsulatum and its antimicrobial activity. J. Asian Nat. Prod. Res. 2021, 23, 1100–1106. [Google Scholar] [CrossRef] [PubMed]
  39. Betina, V.; Nemec, P.; Dobias, J.; Baráth, Z. Cyanein, a New Antibiotic from Penicillium cyaneum. Folia Microbiol. 1962, 7, 353–357. [Google Scholar] [CrossRef]
  40. Sebak, M.; Molham, F.; Greco, C.; Tammam, M.A.; Sobeh, M.; El-Demerdash, A. Chemical diversity, medicinal potentialities, biosynthesis, and pharmacokinetics of anthraquinones and their congeners derived from marine fungi: A comprehensive update. RSC Adv. 2022, 12, 24887–24921. [Google Scholar] [CrossRef] [PubMed]
  41. Takahashi, T.; Miyazawa, M. Synthesis and structure–activity relationships of phenylpropanoid amides of serotonin on tyrosinase inhibition. Bioorg. Med. Chem. Lett. 2011, 21, 1983–1986. [Google Scholar] [CrossRef]
  42. Choi, D.Y.; Choi, H. Natural products from marine organisms with neuroprotective activity in the experimental models of Alzheimer’s disease, Parkinson’s disease and ischemic brain stroke: Their molecular targets and action mechanisms. Arch. Pharm. Res. 2015, 38, 139–170. [Google Scholar] [CrossRef]
  43. Steyn, P.S. Austamide, a new toxic metabolite from Aspergillus ustus. Tetrahedron Lett. 1971, 12, 3331–3334. [Google Scholar] [CrossRef]
  44. Su, Y.T.; Chang, H.L.; Shyue, S.K.; Hsu, S.L. Emodin induces apoptosis in human lung adenocarcinoma cells through a reactive oxygen species-dependent mitochondrial signaling pathway. Biochem. Pharmacol. 2005, 70, 229–241. [Google Scholar] [CrossRef] [PubMed]
  45. Fredenhagen, A.; Mett, H.; Meyer, T.; Buchdunger, E.; Regenass, U.; Roggo, B.E.; Petersen, F. Protein Tyrosine Kinase and Protein Kinase C Inhibition by Fungal Anthraquinones Related to Emodin. J. Antibiot. 1995, 48, 1355–1358. [Google Scholar] [CrossRef] [Green Version]
  46. Zhang, J.Y.; Tao, L.Y.; Liang, Y.J.; Yan, Y.Y.; Dai, C.L.; Xia, X.K.; She, Z.G.; Lin, Y.C.; Fu, L.W. Secalonic acid D induced leukemia cell apoptosis and cell cycle arrest of G1 with involvement of GSK-3β/β-catenin/c-Myc pathway. Cell Cycle 2009, 8, 2444–2450. [Google Scholar] [CrossRef] [Green Version]
  47. Zhang, D.; Noviendri, D.; Nursid, M.; Yang, X.; Byeng, W.S. 12,13-Dihydroxyfumitremorgin C, fumitremorgin C, and brevianamide F, antibacterial diketopiperazine alkaloids from the marine-derived fungus Pseudallescheria sp. Nat. Prod. Sci. 2007, 13, 251–254. [Google Scholar]
  48. Zhang, F.; Chen, W.; Sun, L. LC-VWD-MS determination of three anthraquinones and one stilbene in the quality control of crude and prepared roots of Polygonum multiflorum Thunb. Chromatographia 2008, 67, 869–874. [Google Scholar] [CrossRef]
  49. Piattelli, M.; Giudici de Nicola, M. Anthraquinone pigments from Xanthoria parientina (L.). Phytochemistry 1968, 7, 1183–1187. [Google Scholar] [CrossRef]
  50. Steyn, P.S. The isolation, structure and absolute configuration of secalonic acid D, the toxic metabolite of Penicillium oxalicum. Tetrahedron 1970, 26, 51–57. [Google Scholar] [CrossRef]
  51. Santini, A.; Mikušová, P.; Sulyok, M.; Krska, R.; Labuda, R.; Šrobárová, A. Penicillium strains isolated from Slovak grape berries taxonomy assessment by secondary metabolite profile. Mycotoxin Res. 2014, 30, 213–220. [Google Scholar] [CrossRef]
  52. Kovács, Z.; Dinya, Z.; Antus, S. LC-SSI-MS Techniques as Efficient Tools for Characterization of Nonvolatile Phenolic Compounds of a Special Hungarian Wine. J. Chromatogr. Sci. 2004, 42, 125–129. [Google Scholar] [CrossRef] [PubMed] [Green Version]
  53. Wang, Q.X.; Bao, L.; Yang, X.L.; Guo, H.; Yang, R.N.; Ren, B.; Zhang, L.X.; Dai, H.Q.; Guo, L.D.; Liu, H.W. Polyketides with antimicrobial activity from the solid culture of an endolichenic fungus Ulocladium sp. Fitoterapia 2012, 83, 209–214. [Google Scholar] [CrossRef] [PubMed]
Figure 1. HPLC UV chromatograms of extracts from fungus cultivated with sea water at 22 °C (A), and at 30 °C (B). Chromatograms were recorded at 290 nm (blue) and 220 nm (green).
Fermentation 09 00337 g001
Figure 2. Total number of peaks in HPLC UV chromatograms. (a) Detection at 220 nm; (b) detection at 290 nm. The codes of extracts are presented in X axes of graphs.
Fermentation 09 00337 g002
Figure 3. Total area of peaks in HPLC UV chromatograms. (a) Detection at 220 nm; (b) detection at 290 nm. The codes of extracts are presented in X axes of graphs.
Fermentation 09 00337 g003
Figure 4. UHPLC MS chromatogram of extract 22-sw.
Fermentation 09 00337 g004
Figure 5. Feature-based molecular network (FBMN) of the extracts of strain KMM 4689. The cluster containing library hits for brevianamide-related alkaloids is highlighted. Feature identity is annotated with the results from the in-house library identification (411) and the GNPS identification (12 and 13). The precursor mass of all identified alkaloids corresponds to the [M+H]+ adduct of these alkaloids. A pie chart shows the distribution of the metabolite extract according to the legend.
Fermentation 09 00337 g005
Figure 6. The heat map of a relative content of compounds 125 identified in fungal extracts. Each cell presents data about percentage of compound peak area to total area of peaks in extract.
Fermentation 09 00337 g006
Figure 7. The principal component analysis (PCA) of various fungal extracts.
Fermentation 09 00337 g007
Figure 8. ML tree based on concatenated ITS region and partial β-tubulin gene sequences showing phylogenetic position of the strain KMM 4689 among members of genus Penicillium section Ramigena. Bootstrap values (%) of 1000 replications. Nodes with confidence values greater than 50% are indicated. The scale bar represents 0.1 substitutions per site.
Fermentation 09 00337 g008
Figure 9. Plausible biosynthetic pathway for alkaloids 113 in Penicillium hispanicum. SIO—R-selective indoloxidase, PR—pinacol rearrangement, DOG—dioxygenase, MOG—monooxygenase, EH—epoxide hydrolase.
Fermentation 09 00337 g009
Table 1. Cultivation conditions of Penicillium dimorphosporum KMM 4689.
NoCultivation ConditionsSample CodeEtOAc Extract Amount, mgPurified Extract Amount, mg
122 °C, sea water22-sw452.3178.1
222 °C, sea salt (5 mg/mL)22-5536.9211.4
322 °C, sea salt (10 mg/mL)22-10246.296.6
422 °C, sea salt (15 mg/mL)22-15259.534.8
522 °C, sea salt (20 mg/mL)22-20374.347.0
622 °C, sea salt (25 mg/mL)22-25344.332.3
722 °C, sea salt (30 mg/mL)22-30343.623.3
822 °C, sea salt (40 mg/mL)22-40294.531.7
922 °C, sea salt (45 mg/mL)22-45151.822.2
1022 °C, sea salt (50 mg/mL)22-50391.150.6
1130 °C, sea water30-sw409.4161.2
1230 °C, sea salt (5 mg/mL)30-5415.8163.7
1330 °C, sea salt (10 mg/mL)30-10294.3114.4
1430 °C, sea salt (15 mg/mL)30-15408.453.6
1530 °C, sea salt (20 mg/mL)30-20337.544.3
1630 °C, sea salt (25 mg/mL)30-25311.547.8
1730 °C, sea salt (30 mg/mL)30-30358.032.8
1830 °C, sea salt (40 mg/mL)30-40268.130.5
1930 °C, sea salt (45 mg/mL)30-45155.222.7
2030 °C, sea salt (50 mg/mL)30-50142.129.4
Table 2. Strains used in phylogenetic analysis and GenBank accession numbers of ITS and β-tubulin molecular data.
TaxonCollection NumberGenBank Accession Number
ITSβ-Tubulin
Penicillium canis S.W. PetersonNRRL 62,798 TKJ511291
Penicillium capsulatum Raper et FennellCBS 301.48 TAF033429MN969375
Penicillium catenatum D.B. ScottCBS 352.67 TKC411754
Penicillium cyaneum (Bainier et Sartory) BiourgeCBS 315.48 TAF033427JX091552
Penicillium dimorphosporum H.J. SwartCBS 456.70 TAF081804
Penicillium erubescens D.B. ScottCBS 318.67 TAF033464
Penicillium georgiense S.W. Peterson et B.W. HornCBS 132826 TEF422852EF506223
Penicillium guttulosum J.C. Gilman et E.V. AbbottNRRL 907 THQ646592
Penicillium hermansii Houbraken, Seifert et SamsonCBS 124,296 TMG333472
Penicillium hispanicum C. Ramírez, A.T. Martínez et FerrerKMM 4689
CBS 691.77 T
MW325972
JX841247
OP407668
KJ834456
Penicillium laeve (K. Ando et Manoch) Houbraken et SamsonCBS 136,665 TKF667369
Penicillium menonorum S.W. PetersonNRRL 50,410 THQ646591
Penicillium nepalense Takada et UdagawaCBS 203.84 TKC411692
Penicillium ornatum UdagawaCBS 190.68 TKC411687KJ834479
Penicillium ovatum (K. Ando et Nawawi) Houbraken et SamsonCBS 136,664 TKF667370
Penicillium parvofructum Guevara-Suarez, Cano-Canals, Cano et StchigelCBS 141,690 TAF033460
Penicillium parvum Raper et FennellCBS 359.48 TAF033460
Penicillium pimiteouiense S.W. PetersonCBS 102,479 TAF037431
Penicillium ramusculum Bat. et H. MaiaCBS 251.56 TEF433765EU427269
Penicillium rubidurum Udagawa et Y. HorieCBS 609.73 TAF033462
Penicillium striatisporum StolkCBS 705.68 TAF038938
Penicillium vinaceum J.C. Gilman et E.V. AbbottCBS 389.48 TAF033461
Talaromyces marneffei (Segretain, Capponi et Sureau) Samson, N. Yilmaz, Frisvad et SeifertCBS 388.87 TJN899344JX091389
T—ex-type strain.
Table 3. The cytotoxic and radical scavenging activities of fungal extracts.
Extract CodeCell Viability 1, % of ControlDPPH Radicals 2,
%
PC-3H9c2
22-585.4 ± 0.893.5 ± 3.819.9 ± 0.9
22-1056.6 ± 7.670.1 ± 10.220.4 ± 2.3
22-1556.8 ± 9.646.6 ± 0.725.8 ± 1.8
22-2064.8 ± 6.567.2 ± 5.626.9 ± 4.1
22-2546.0 ± 8.167.1 ± 8.629.5 ± 3.1
22-3056.4 ± 4.757.9 ± 4.140.7 ± 8.0
22-sw44.2 ± 6.653.2 ± 2.239.6 ± 2.5
22-4060.3 ± 4.457.9 ± 6.228.4 ± 2.4
22-4568.3 ± 5.064.8 ± 4.735.3 ± 5.0
22-5027.7 ± 4.064.4 ± 4.119.1 ± 1.8
30-567.6 ± 9.570.5 ± 3.116.2 ± 4.0
30-1062.6 ± 6.465.4 ± 2.123.1 ± 2.4
30-1570.2 ± 2.667.0 ± 2.540.1 ± 4.6
30-2077.4 ± 12.270.9 ± 4.429.1 ± 2.2
30-2574.4 ± 5.475.1 ± 0.831.9 ± 1.9
30-3048.1 ± 6.673.5 ± 5.233.1 ± 5.2
30-sw70.9 ± 1.262.7 ± 3.621.4 ± 5.2
30-4050.5 ± 10.782.3 ± 6.431.0 ± 8.3
30-4553.4 ± 1.069.8 ± 1.036.9 ± 9.3
30-5086.9 ± 2.872.2 ± 2.242.9 ± 3.2
1 The concentrations of extracts were 10 µg/mL. 2 The concentrations of extracts were 1 µg/mL. All data are presented as a mean ± standard error of mean (SEM).
Disclaimer/Publisher’s Note: The statements, opinions and data contained in all publications are solely those of the individual author(s) and contributor(s) and not of MDPI and/or the editor(s). MDPI and/or the editor(s) disclaim responsibility for any injury to people or property resulting from any ideas, methods, instructions or products referred to in the content.

