
Chemical and Aromatic Changes during Fermentation of Kombucha Beverages Produced Using Strawberry Tree (Arbutus unedo) Fruits

1
Department of Plant Science, Agrifood Research and Technology Centre of Aragón (CITA), Avda Montañana 930, 50059 Zaragoza, Spain
2
Departmental Section of Galenic Pharmacy and Food Technology, Veterinary Faculty, Complutense University of Madrid, 28040 Madrid, Spain
3
Nutrigenomics Research Group, Department of Biochemistry and Biotechnology, Universitat Rovira i Virgili, 43007 Tarragona, Spain
*
Author to whom correspondence should be addressed.
Fermentation 2023, 9(4), 326; https://doi.org/10.3390/fermentation9040326
Submission received: 6 March 2023
/
Revised: 21 March 2023
/
Accepted: 23 March 2023
/
Published: 25 March 2023
(This article belongs to the Special Issue Nutritional Significance of Fermented Foods)
Abstract
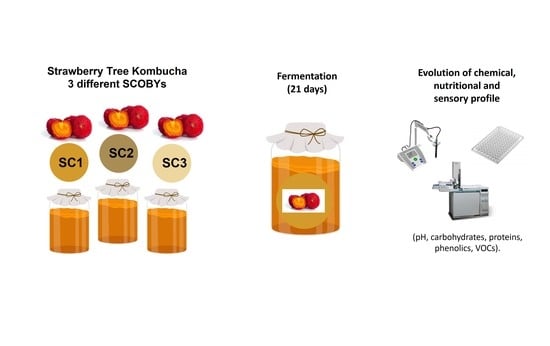
:The use of alternative ingredients in the production of kombucha has seen a recent increase. Our research aimed to characterize the chemical, nutritional, microbial, and aromatic profiles of kombucha beverages prepared with strawberry tree (Arbutus unedo) fruits fermented with three different SCOBYs for 21 days. The analyses showed similar levels of microbiological groups (aerobic mesophilic microorganisms, lactic acid bacteria, acetic acid bacteria, and yeasts)among the SCOBYs used. The beverages studied displayed a decrease in pH value and carbohydrate content, and protein degradation was also observed as fermentation progressed. However, the increase in total phenolic compounds during the first week proved to be a point of interest. A total of 20 volatile organic compounds were detected, giving different sensory qualities to the beverages: higher ethanol, benzaldehyde-4-ethyl, or acetic acid depending on the SCOBY used. The results obtained indicated that strawberry tree kombucha might be an alternative beverage with notable nutritional and aromatic properties, with fermentation time and SCOBY composition being identified as crucial factors.
1. Introduction
Although their popularity and availability on the market has increased significantly in the last decade, kombucha beverages are thought to have originated over 2000 years ago, around 200 B.C., in North-eastern China [1,2]. These drinks are made by fermenting sugars from different sources and a main ingredient, which traditionally has been tea. This process is feasible due to the action of a microbial consortium called “SCOBY” (symbiotic culture of bacteria and yeasts) over a period of approximately 7–10 days [1,3]. The resultant product contains sugars, organic acids, proteins, ethanol, vitamins, minerals, anions, phenolic compounds, and specific molecules such as D-saccharic acid-1,4-lactone (DSL), among others [4].
In terms of the biological activities of kombucha (antioxidant, immune-modulatory, hypocholesterolemic, antihypertensive, antiproliferative, hypoglycemic, antimicrobial, etc.), a significant number of studies have been carried out to evaluate them [5,6]. However, in these studies, most of the experiments were carried out in vitro, with only a small number being validated in animal models. Clinical trials have not been conducted. Therefore, although many consumers of kombucha consider this beverage as ”functional”, further research is required to support specific health claims [7,8].
As previously stated, the mostly commonly used substrate for kombucha production is Camellia sinensis, particularly green and black tea leaves [9,10]. However, alternative substrates have been used in recent years to diversify the range of kombucha beverages, leading to different compositions and, consequently, a greater variety of organoleptic and sensorial attributes, and of functional properties. A number of ingredients might replace tea leaves; work of interest has been published on the testing of kombuchas based on raw materials such as fruits, herbs, cereals, mushrooms, algae, coffee, etc. [11].
Other interesting vegetal materials that have not yet been applied to kombucha fermentation processes are fruits from Arbutus unedo, commonly known as the strawberry tree (ST). The ST is a native Mediterranean plant, an evergreen and flowering shrub or small tree whose fruits have been traditionally consumed fresh or in sauces, jams, and jellies as well as in fermented and distilled beverages [12,13]. Therefore, since they have been used in other food products and drinks, ST fruits are well positioned as a relevant candidate for the production of novel kombuchas. This is especially the case due to their interesting content in terms of nutritional and bioactive compounds such as carbohydrates, lectins and other proteins, tocopherols, carotenoids, ascorbic acid, lectins, fatty acids, etc. The fruits’ predominant phenolic compounds must be highlighted as the molecules having been primarily studied in some of the literature [13,14].
The degree of fruit ripeness and the fermentation conditions in ST beverages [15] exert a strong influence on the chemical composition and the volatile profile and, therefore, the quality of the final product. The green odors are progressively replaced during ripening by floral and sweet sensations, due to the decrease in alcohols, aldehydes and esters. This results in the unmasking of the aromas associated with the minor compounds that are present in ST fruits [16]. As a result, the analysis of volatile organic compounds (VOCs) is the key tool for describing the aromatic properties.
In addition to the sources of sugar and the tea leaves or alternative substrates, microorganisms constitute a crucial aspect of the fermentation process. Therefore, the SCOBY populations have a direct and significant impact on the kombucha’s chemical composition and, therefore, on its organoleptic and sensorial attributes (including taste and aroma), and its nutritional and functional properties [17]. There is no standard composition for the SCOBY microbiota since it depends on the environmental conditions during storage or the fermentation process (temperature, time, pH, use of starters, ingredients that are present in the media, etc.). However, it is well known that the main species are yeasts (e.g., Debaryomyces spp., Saccharomyces spp., Kluyveromyces spp., Brettanomyces spp.), acetic acid bacteria (AAB, e.g., Acetobacter spp., Gluconobacter spp., Komagataeibacter spp.) and lactic acid bacteria (LAB, e.g., Lactobacillus spp., Oenococcus spp.) [18,19]. Thus, the initial microbial composition of the utilized SCOBY will be a key point in the development of the kombucha.
Taking the points above into consideration, this work studied the procedure for producing a novel kombucha using ST fruits instead of tea leaves and three SCOBYs with different compositions in terms of levels of different microbial groups. The fermentation process was analyzed over a period of 21 days in terms of pH, carbohydrate consumption, and protein and total phenolic compound content. Analysis of VOC composition allowed analysis of the aromatic profile.
2. Materials and Methods
2.1. Biological Material
ST fruits at the same stage of ripening were collected from trees located in Plasencia (a city in the region of Extremadura, Western Spain). Fresh ST fruits were used immediately for the production of kombucha, and the unused material was freeze-dried (LyoBeta 15 lyophilizer, Telstar, Madrid, Spain) and stored in darkness at −20 °C until further use. Three different SCOBYs were used: SCOBY 1, prepared in the laboratory; SCOBY 2, kindly provided by a local market; and SCOBY 3, purchased in the shop “Oh My Kefir!”.
For the preparation of SCOBY 1, tap water (3 L) was heated to 80 °C prior to the addition of powdered, dried green tea leaves (8 g/L) (Hornimans, London, United Kingdom) and white cane sugar (80 g/L) (Acor, Valladolid, Spain). After vigorous stirring, the homogenized mixture was cooled to room temperature (RT). Then, non-pasteurized commercial kombucha (275 mL) (Kombutxa, Mataró, Spain) was added to the mixture, which was transferred to a glass receptacle previously sterilized in an Autester ST Dry PV III autoclave (J.P. Selecta, Barcelona, Spain). The receptacle was then kept open but covered with filter paper, and stored in darkness at RT for 3 weeks.
2.2. Reagents
Methanol (HPLC) was obtained from LAB-SCAN (Gliwice, Poland), and sodium carbonate (Na2CO3) and sulfuric acid (H2SO4) from Panreac (Barcelona, Spain). Bovine serum albumin (BSA), HCl (37%), phenol, Folin–Cioucalteu phenol reagent, D-glucose and gallic acid were purchased from Sigma-Adrich Quimica (Madrid, Spain). The Bradford reagent was acquired from Bio-Rad (Hercules, CA, USA) and microbial analysis reagents from Merck (Darmstad, Germany).
2.3. Microbial Analysis
Microbial analyses included the quantification of aerobic mesophilic microorganisms (AMM; which constitute the total aerobic microbial load), lactic acid bacteria (LAB), acetic acid bacteria (AAB) and yeasts levels. The quantifications were performed following the corresponding ISO norm, with slight modifications as indicated in Tejedor-Calvo et al. (2020) [20]. Each SCOBY (10 g) was diluted in a series in sterile distilled peptone water 0.1% (Merck, Darmstadt, Germany), and homogenized using a Stomacher 400 Circulator (Seward Laboratory, London, England) laboratory blender for 2 min at 250 rpm according to ISO norm 6887-1:2017. Culture media and incubation conditions for each microbial group were: (1) AMM: plate count agar (PCA) (Merck) for 72 h at 30 ± 1 °C; (2) LAB: Man, Rogosa and Sharpe agar (MRS) (Merck) for 72 h at 30 ± 1 °C (Oxoid), using anaerobic jars with an atmosphere generation system; (3) AAB: glucose–yeast extract–calcium carbonate agar (GYC) [21] at 30 °C for 5–10 days. The GYC composition was: 10% D-glucose, 2% calcium carbonate, 1% yeast extract, 1.5% agar, pH 6.8 ± 0.2; and (5) yeasts: dichloran rose–bengal chloramphenicol agar (DRBC) (Merck), supplemented with 0.1% gentamicin (Carlier, Barcelona, Spain) to avoid Pseudomonas spp. growth, for 4 days at 25 ± 1 °C. The value presented for the microbial count of each sampling day is the average of four measurements (two per scoby), expressed as log cfu/g.
2.4. Kombucha Production Using SCOBYs 1, 2, and 3
The preparation of the ST kombuchas using the different SCOBYs followed a protocol adapted from Villarreal Soto et al. (2019) and Cardoso et al. (2020) in terms of procedures for preparing tea kombucha [22,23]. In summary, fresh ST fruits (equivalent to 12 g dry weight/L) were added to hot tap water (80 °C) together with white cane sugar (70 g/L). After vigorous stirring, the homogenized suspension was cooled to RT before the addition of the SCOBY 1, 2 or 3 (40 g/L) and 10% v/v of the medium (“old kombucha”) in which the SCOBY was immersed. Triplicates of the kombuchas were prepared for each SCOBY. The receptacles containing the kombuchas were kept open, covered with filter paper, and stored in darkness at RT for 21 days.
2.5. pH Measurements
A micropH 2000 pHmeter (Crison Instruments, Barcelona, Spain) was used to measure the pH of all the kombuchas at different stages of the fermentation process (0, 4, 7, 14, 21 days).
2.6. Determination of Total Carbohydrates
The total carbohydrate content of the kombuchas was measured at different stages of the fermentation process (0, 4, 7, 14, 21 days) using the phenol–sulfuric acid method, as detailed by Smiderle et al. (2017) [24]. In summary, 25 µL of the samples (thoroughly diluted in water) was added in triplicate to a 96-well plate, followed by 25 µL of 5% phenol solution and 125 µL of concentrated H2SO4. The plate was sealed and incubated at 80 °C for 30 min. The absorbance was read using a M200 plate reader (Tecan, Mannedorf, Switzerland) at 490 nm. D-glucose was used as the standard for quantification.
2.7. Determination of Total Soluble Proteins
The total soluble protein concentration of the kombuchas was determined (0, 4, 7, 14, 21 days) using the Bradford method reagents (Sigma-Aldrich, Madrid, Spain), according to the manufacturer’s instruction manual. In short, 10 µL of the samples was added in triplicate to a 96-well plate, followed by 200 µL of Bradford reagent (diluted 1:4). Absorbance (595 nm) was read after 5 min using the M200 plate reader. Bovine serum albumin was used as the standard for quantification.
2.8. Determination of Total Phenolic Content
The total phenol concentration of the kombuchas was calculated (0, 4, 7, 14, 21 days) using the Folin–Ciocalteu method, adapting the procedure as described by Ramírez-Anguiano et al. (2007) [25]. The samples (50 µL) were mixed with 1.48% HCl (300 µL) and methanol (150 µL) in triplicate and centrifuged for 2 min at 13000 rpm. Supernatants (50 µL) were added to 1 mL of 2% Na2CO3 (w/v). The mixtures were vigorously stirred and incubated at RT for 3 min prior to the addition of Folin–Cioucalteu reagent (25 µL). After a 30 min incubation, absorbances were read at 750 nm. Gallic acid was used as the standard for quantification.
2.9. Analysis of Volatile Organic Compounds (VOCs) Using SPME-GC-MS
The methodological approach was based on a solid-phase microextraction (SPME) carried out by Tejedor-Calvo et al. (2021) [26]. The SPME was used to extract the aromatic compounds. To achieve this, a fused-silica fiber coated with a 50/30 mm layer of divinylbenzene/carboxen/polydimethylsiloxane from Supelco (Barcelona, Spain) was chosen. The samples (2 mL of liquid kombucha) were placed in a 20 mL glass vial closed with a septum. The vial was then conditioned at 50 °C for 10 min. Finally, the fiber was exposed to the headspace of the vial for 20 min.
The VOC profile of each sample was analyzed via static GC–MS using an Agilent 6890 N gas chromatograph (Termoquest, Milan, Italy) coupled with a mass spectrometer detector. This instrument was equipped with an HP-5MS capillary column (Agilent Technologies, Santa Clara, CA, USA) of 30 m, 0.32 mm i.d., 0.25 μm film thickness and a flow of 1 mL/min with helium as a carrier gas. The oven temperature was held at 45 °C for 2 min, then increased from 45 to 200 °C at a rate of 4 °C/min, and finally increased to 225 °C at a rate of 10 °C/min and held for 5 min [27]. The MS used the electron impact mode with an ionization potential of 70 eV and an ion source temperature of 200 °C. The interface temperature was 220 °C. The MS scanning was recorded in full scan mode (35–250 m/z). TurboMass software was used for controlling the GC–MS system.
Peak identification of the VOCs was achieved by comparison of the mass spectra with mass spectral data from the NIST MS Search Program 2.0 library; and by comparison of previously reported retention indices (RI) with those calculated in this study using an n-alkane series (C6–C20) under the same analysis conditions. The n-alkane series and standards for MS identification (all standards of purity higher than 95%) were purchased from Sigma-Aldrich (Madrid, Spain). Semi-quantification was performed by integrating the area of the sum of ion characteristics of each compound and normalization by calculating the relative percentage. This allowed comparison of each eluted compound between samples.
2.10. Statistical Analyses
Differences were evaluated at a 95% confidence level (p ≤ 0.05) using a one-way analysis of variance (ANOVA) followed by the Tukey multiple comparison test. Statistical analysis was performed using GraphPad Prism version 9.5.1 (GraphPad Software, San Diego, CA, USA). The VOCs were analyzed via principal component analysis (PCA), performed with the statistical software R, and visualized using XLStat version 2021.5 (Addinsoft, Paris, France) and the R package factoextra version 1.0.7 [28].
3. Results and Discussion
3.1. Microbial Composition of the Different SCOBYs
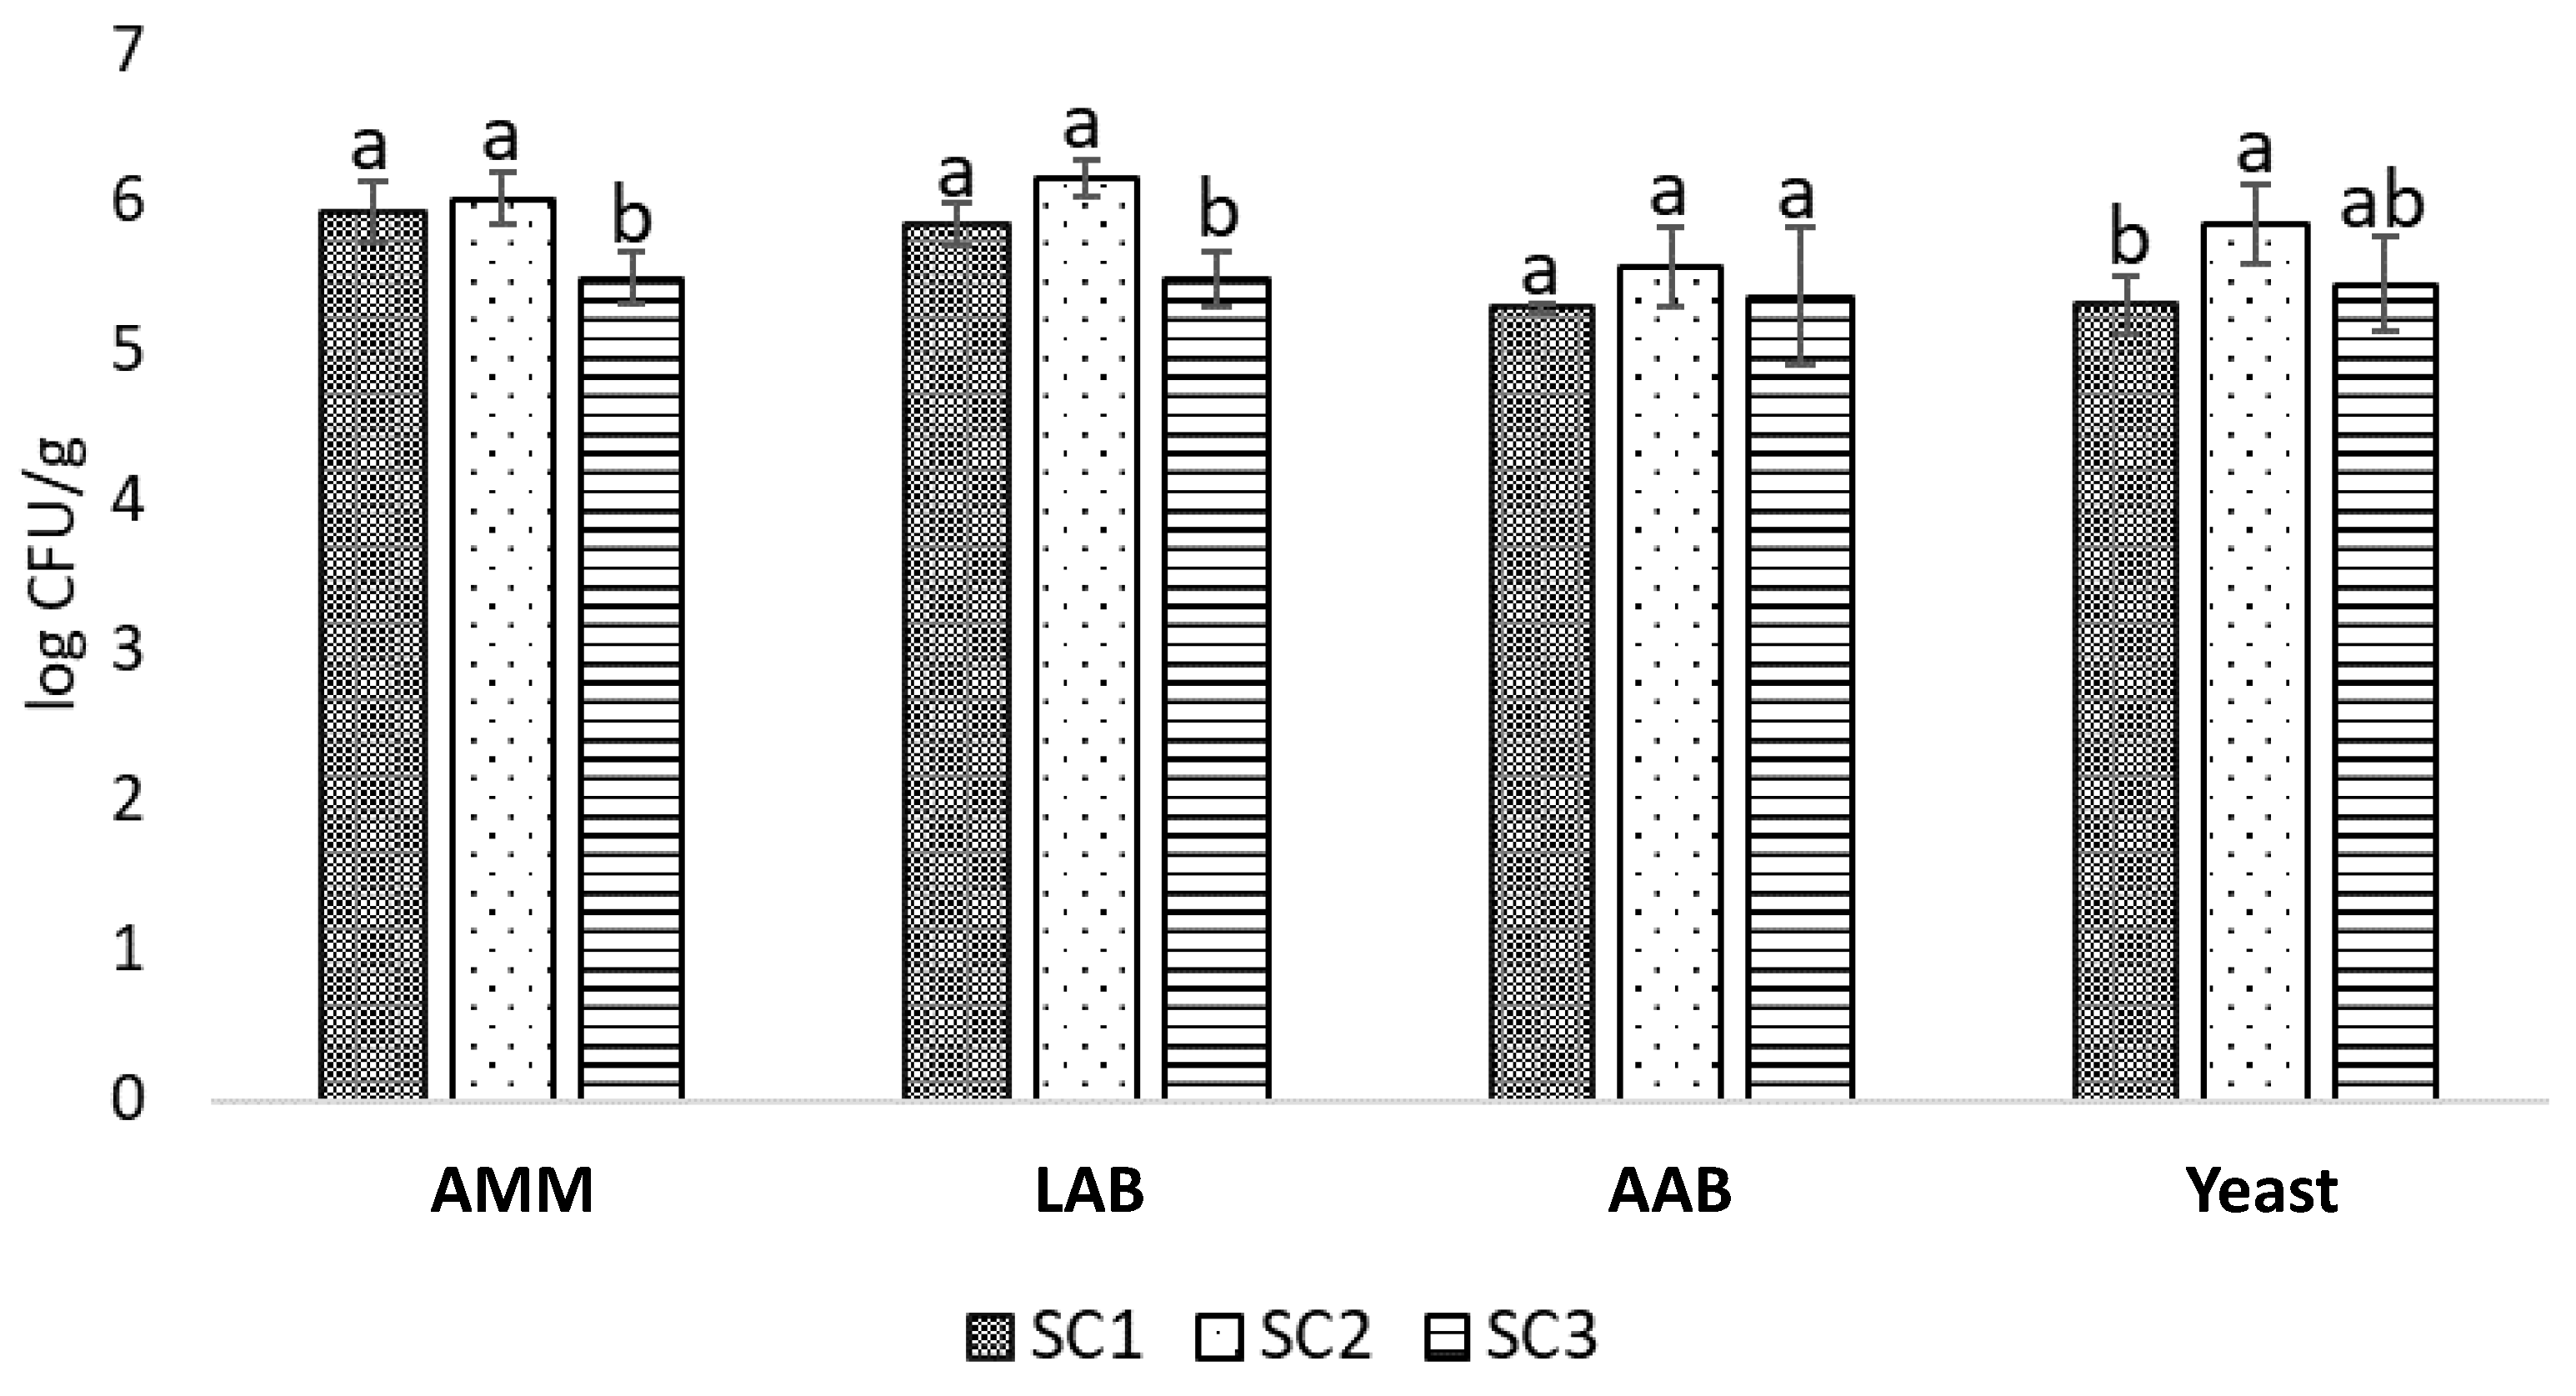
The three SCOBYs showed similar AMT counts (5.5–6 log cfu/g) (Figure 1). Among them, SC1 showed lower yeast content (5.3 log cfu/g) and SC3 showed lower LAB counts (5.4 log cfu/g). AAB populations were similar across the three initial SCOBYs (5.2–5.5 log cfu/g). Similar values were reported in artisanal (6.93 ± 0.50 log CFU/g [29]) and commercial SCOBYs (5.4–6.7 log CFU/g [30]).
The bacteria and yeasts in kombucha cooperate and compete while different chemical components, such as acetic acid, gluconic acid, glucuronic acid, and ethanol, are formed [31]. In general, LAB dominates in green tea, and AAB in black tea kombuchas, but the most abundant genera among the cohort of kombuchas are Komagataeibacter, Lactobacillus and Bacillus, which belong to the potential probiotic strains including Lactobacillus and Oenococcus, and bacterium Bacillus coagulans. In addition, some products contained Acetobacter, Gluconobacter, Pseudomonas, and Zymomonas species [32]. However, depending on the SCOBY and the starting material used (e.g., tea, fruits), the proportion of the various strains might change.
3.2. Evolution of pH during Fermentation
The pH range that is considered as safe for consumption of kombucha is 2.5–4.2, as higher values constitute a risk of growth of undesired microbial populations (potential pathogens), and lower values are correlated with high acetic acid levels [22].
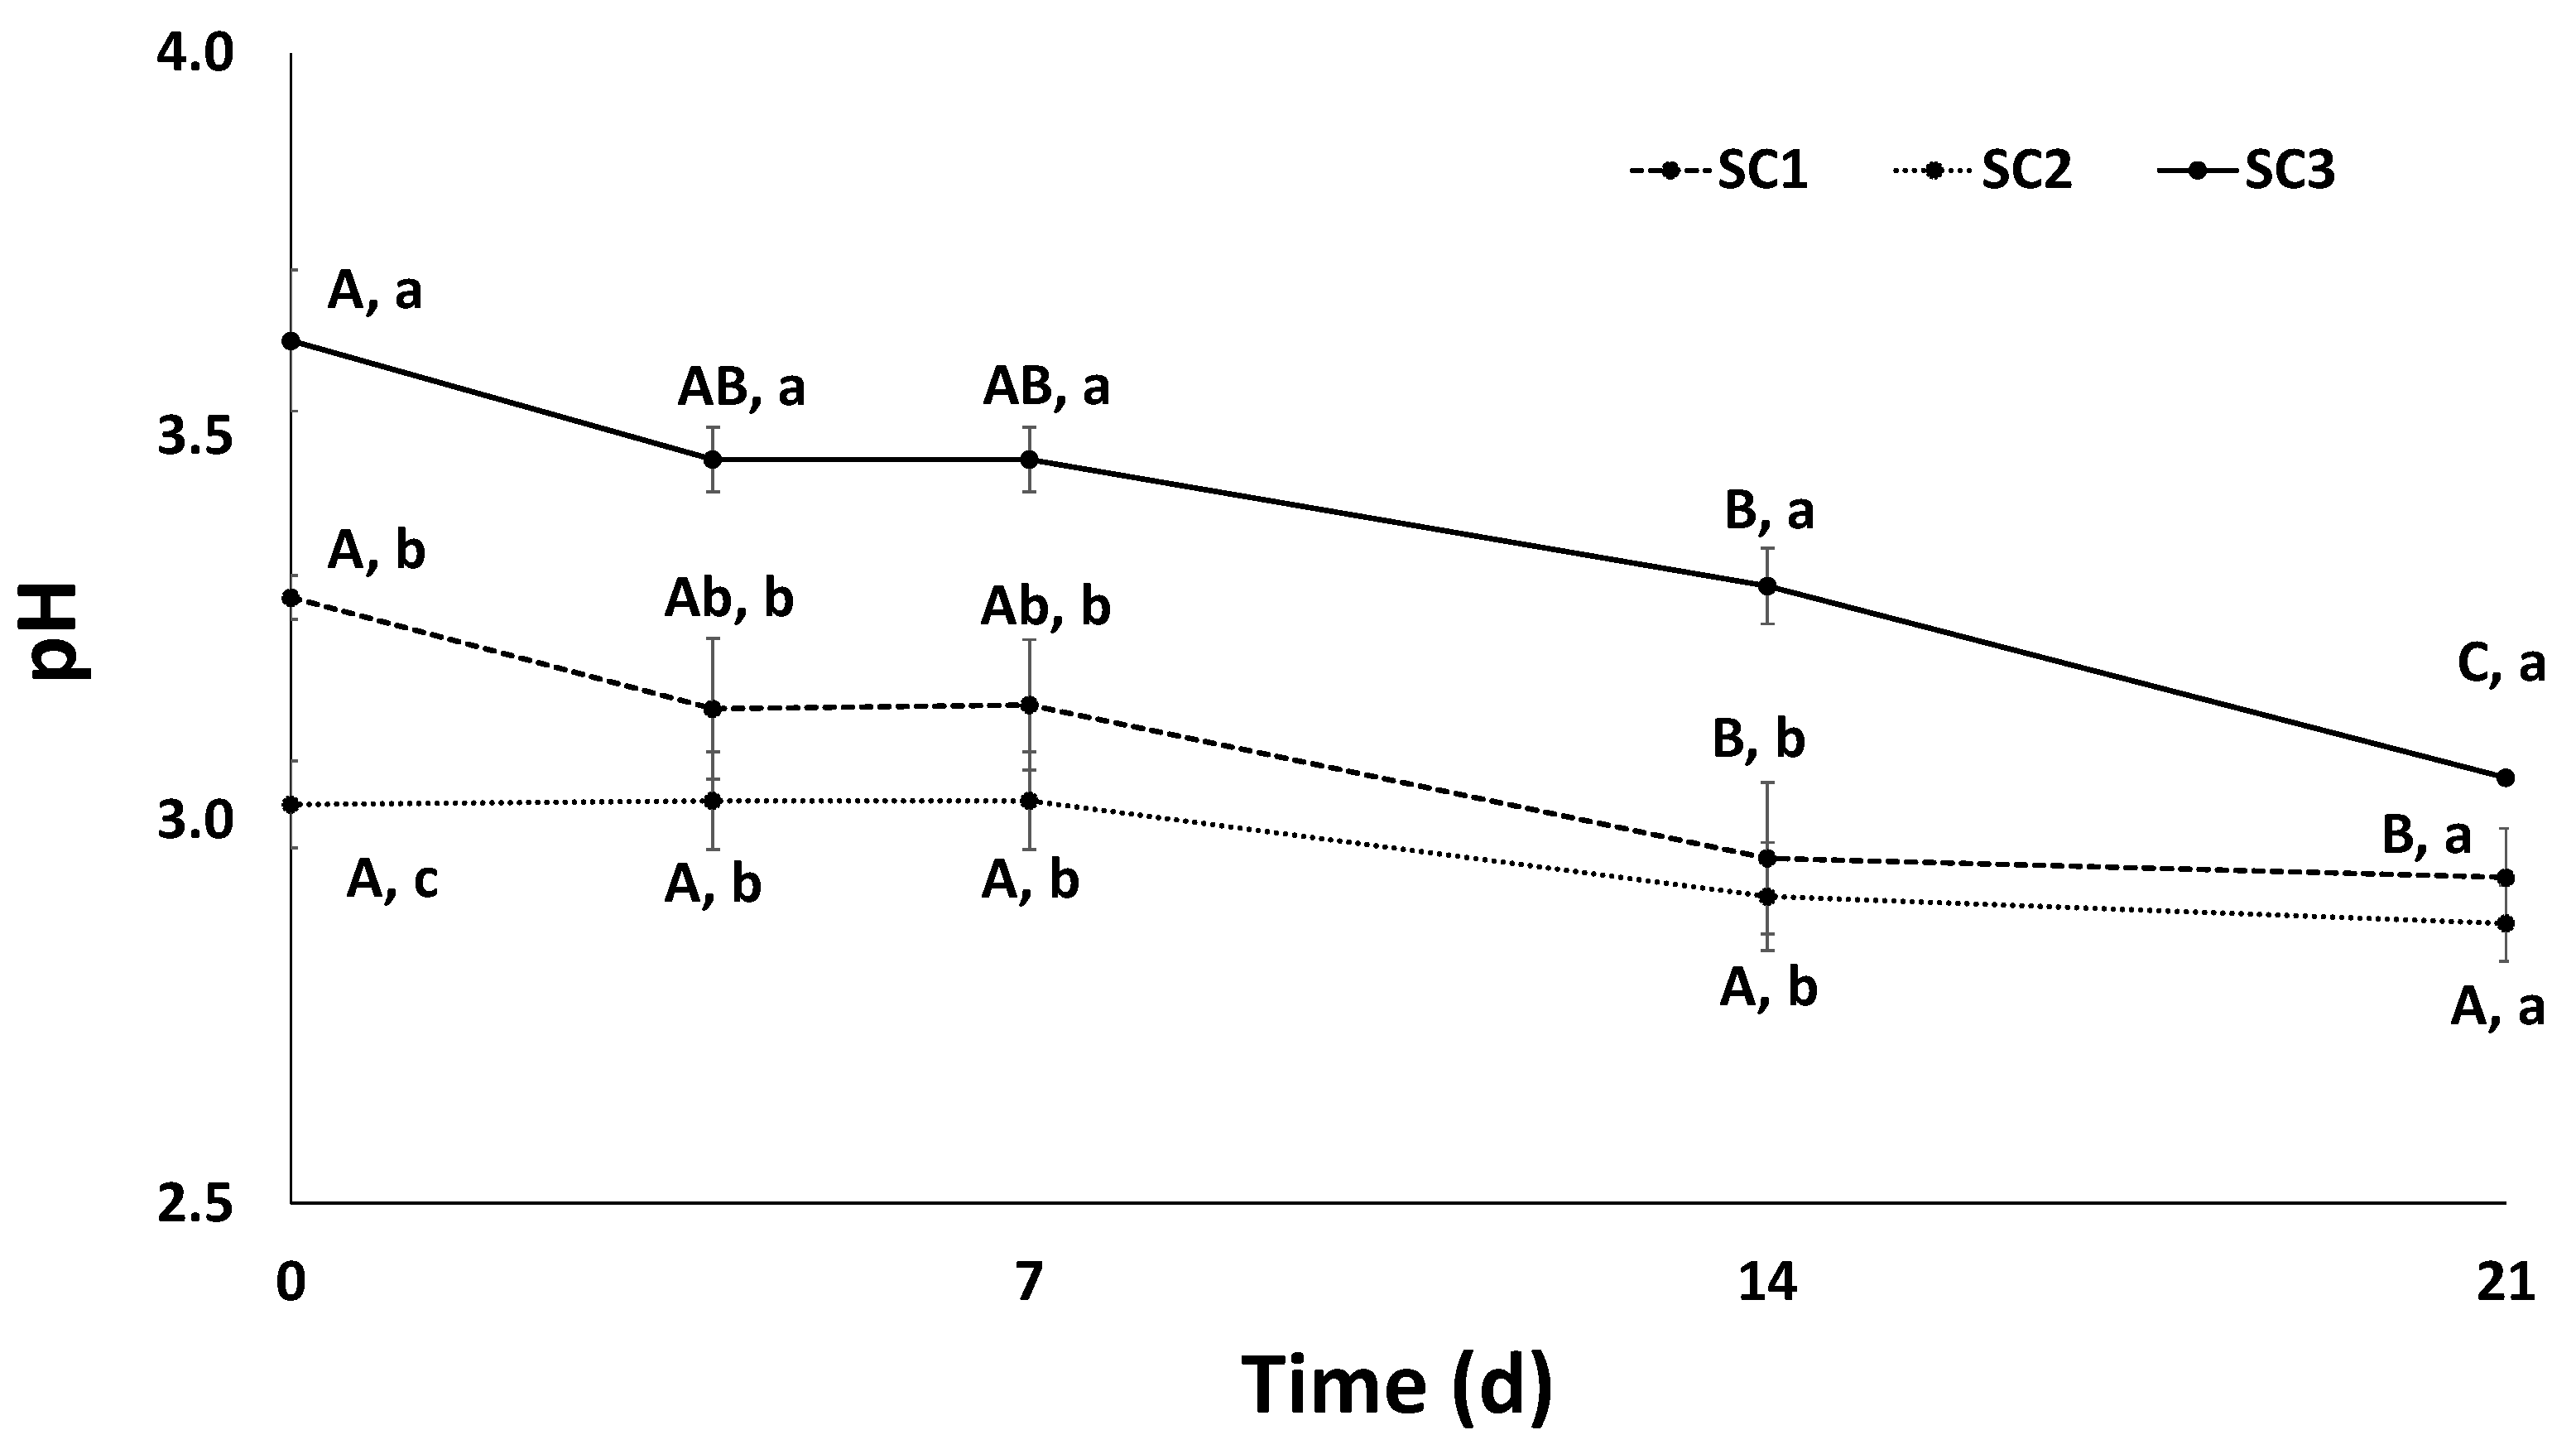
In the case of the ST kombuchas prepared in this study, the initial pH was between 3.0 and 3.6, indicating pre-existing significant differences between SCOBYs (Figure 2). These initial dissimilarities are due to the divergent acidities of the “old kombucha” (medium in which the SCOBY was maintained before its addition to the ST kombucha), which was included in the preparation (10% v/v).
During fermentation, the expected decrease in pH values was recorded; this was caused by the acetic acid production of microorganisms and the release of organic acids from vegetal material [10]. This reduction was not significant during the first week but was noticeable after 14 days in SC1 and 3, with the acidity of SC3 being even higher after 21 days. However, the pH of SC2 was initially lower and its decline was not as drastic as those seen in SC1 and SC3. At the end of the experiment, the registered pH values were between 2.9 and 3.1 after 21 days.
The levels obtained are similar to those reported in previous studies using other ingredients for the preparation of kombucha. For instance, Cardoso et al. (2020), obtained pH values of 3.2–3.5 for green and black tea kombuchas after 10 days of fermentation [22]. Slightly lower values, in the range of 2.7–2.9, were observed by Kaekwod et al. (2019) for black, oolong, and green tea kombuchas after 15 days [33]. Other kombuchas fermenting totally different raw materials, for instance, soy whey, exhibited similar pH levels of between 3.2 and 3.3 after 8 days [34].
3.3. Evolution of Total Carbohydrate Content during Fermentation
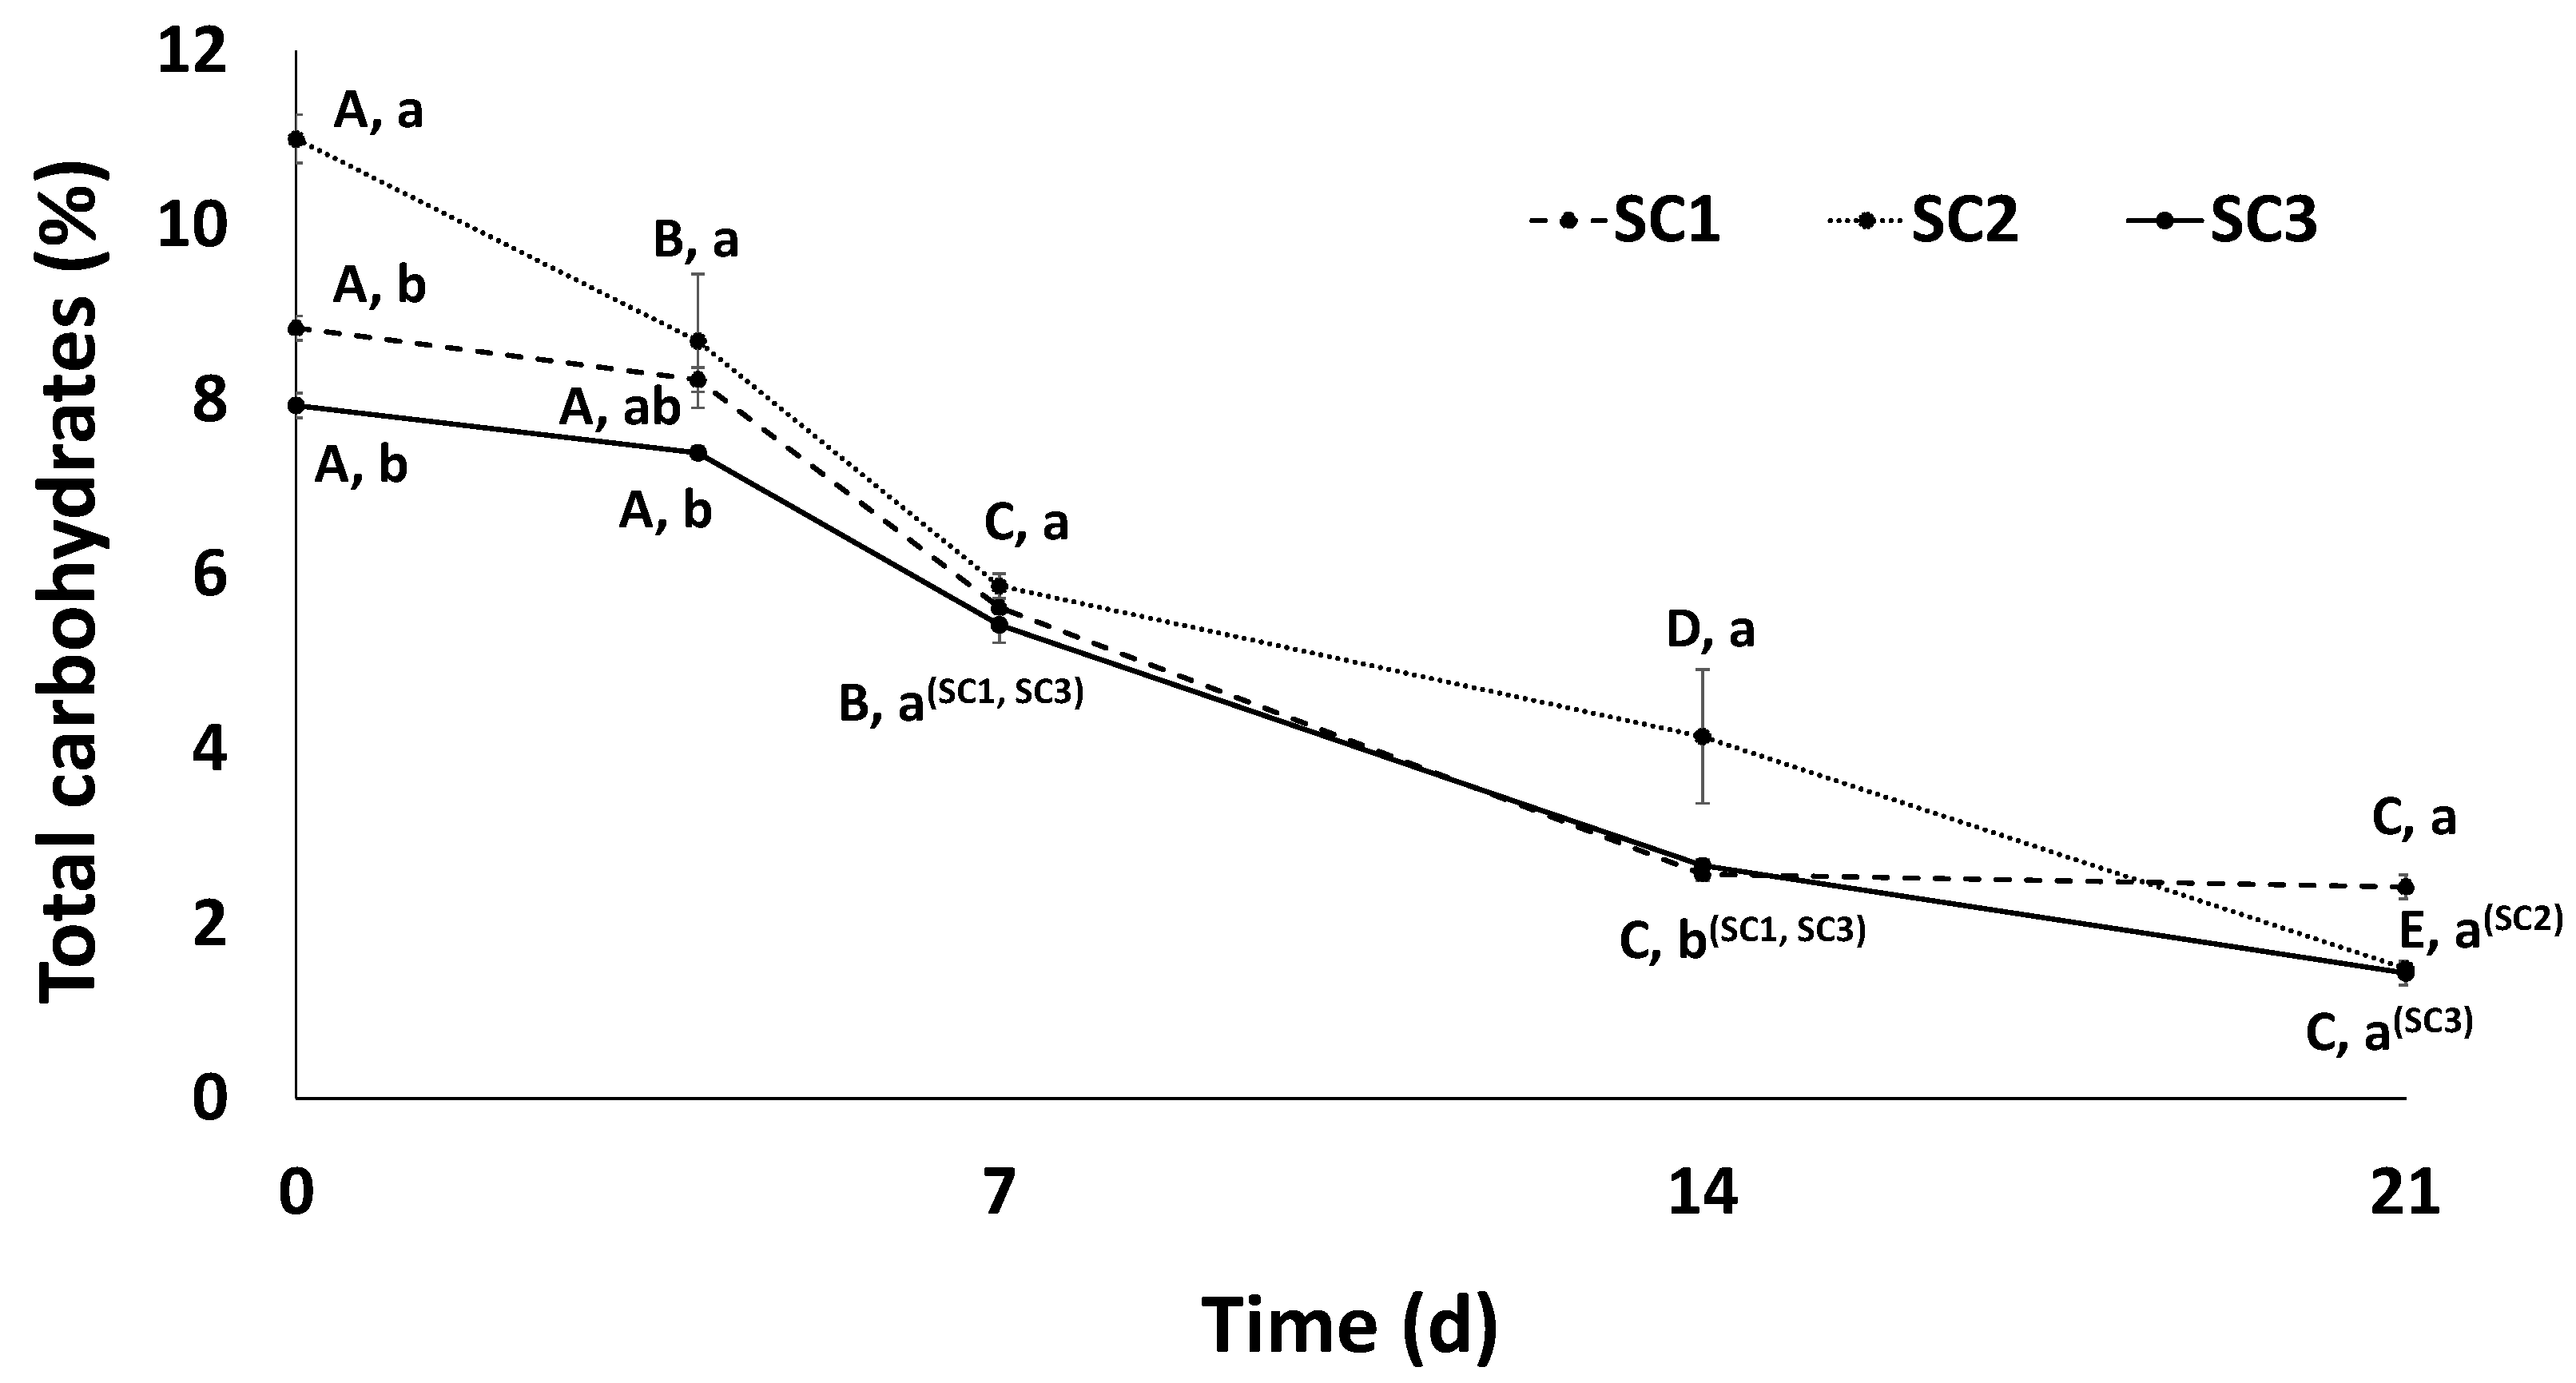
Before the start of the fermentation process, the prepared kombuchas showed different carbohydrate content levels; the kombucha fermented using SC2 had the highest levels. These variations were caused by the particular SCOBY used since the carbohydrate concentration that was provided by the cane sugar and the ST trees was always at 8%. Once the microorganisms started to use the available carbohydrates, the consumption rate was very similar in SC1 and SC3, with a significant decrease after 7 days. This reduction continued into the second week and was minimal between day 14 and day 21, showing a level of 1.4–2.4% of non-consumed carbohydrates. However, SC2 demonstrated the greatest capacity for consumption of carbohydrates. This was likely the result of having the highest initial quantity of available carbohydrates, which were consumed at a significant rate even during the first 4 days. This reduction in carbohydrate content was maintained throughout the fermentation time leading to a final level of 1.5% (Figure 3).
Similar behaviors were observed in previous studies on traditional kombuchas. For instance, Cardoso et al. (2020) added a lower initial amount of sucrose (5%) and registered a remaining sucrose concentration of 2% and 3.5% in green tea and black tea kombucha, respectively, after 10 days [22]. Villarreal-Soto et al. (2019) worked with green tea kombucha and presented sucrose consumption curves very close to those obtained for ST kombucha carbohydrates, being reduced from 8% on day 0 to almost 0% after 21 days [23]. The total reducing sugar content in soy whey kombucha also decreased from 9.6% to 1.8% after 8 days [34].
Reviewing the values of ST kombuchas and considering that conventional procedures stop kombucha fermentation after 7–10 days, the levels obtained after 1 week (5.4–5.9) are the most relevant. From a nutritional point of view, these levels are similar to the total sugar content in, for example, tea infusions (approx. 5–6%) and significantly lower than those obtained for other drinks such as fruit juices or carbonated drinks (approx. 9–10%) [35,36], positioning ST beverages as promising alternatives from a nutritional and health perspective.
3.4. Evolution of Soluble Protein Content during Fermentation
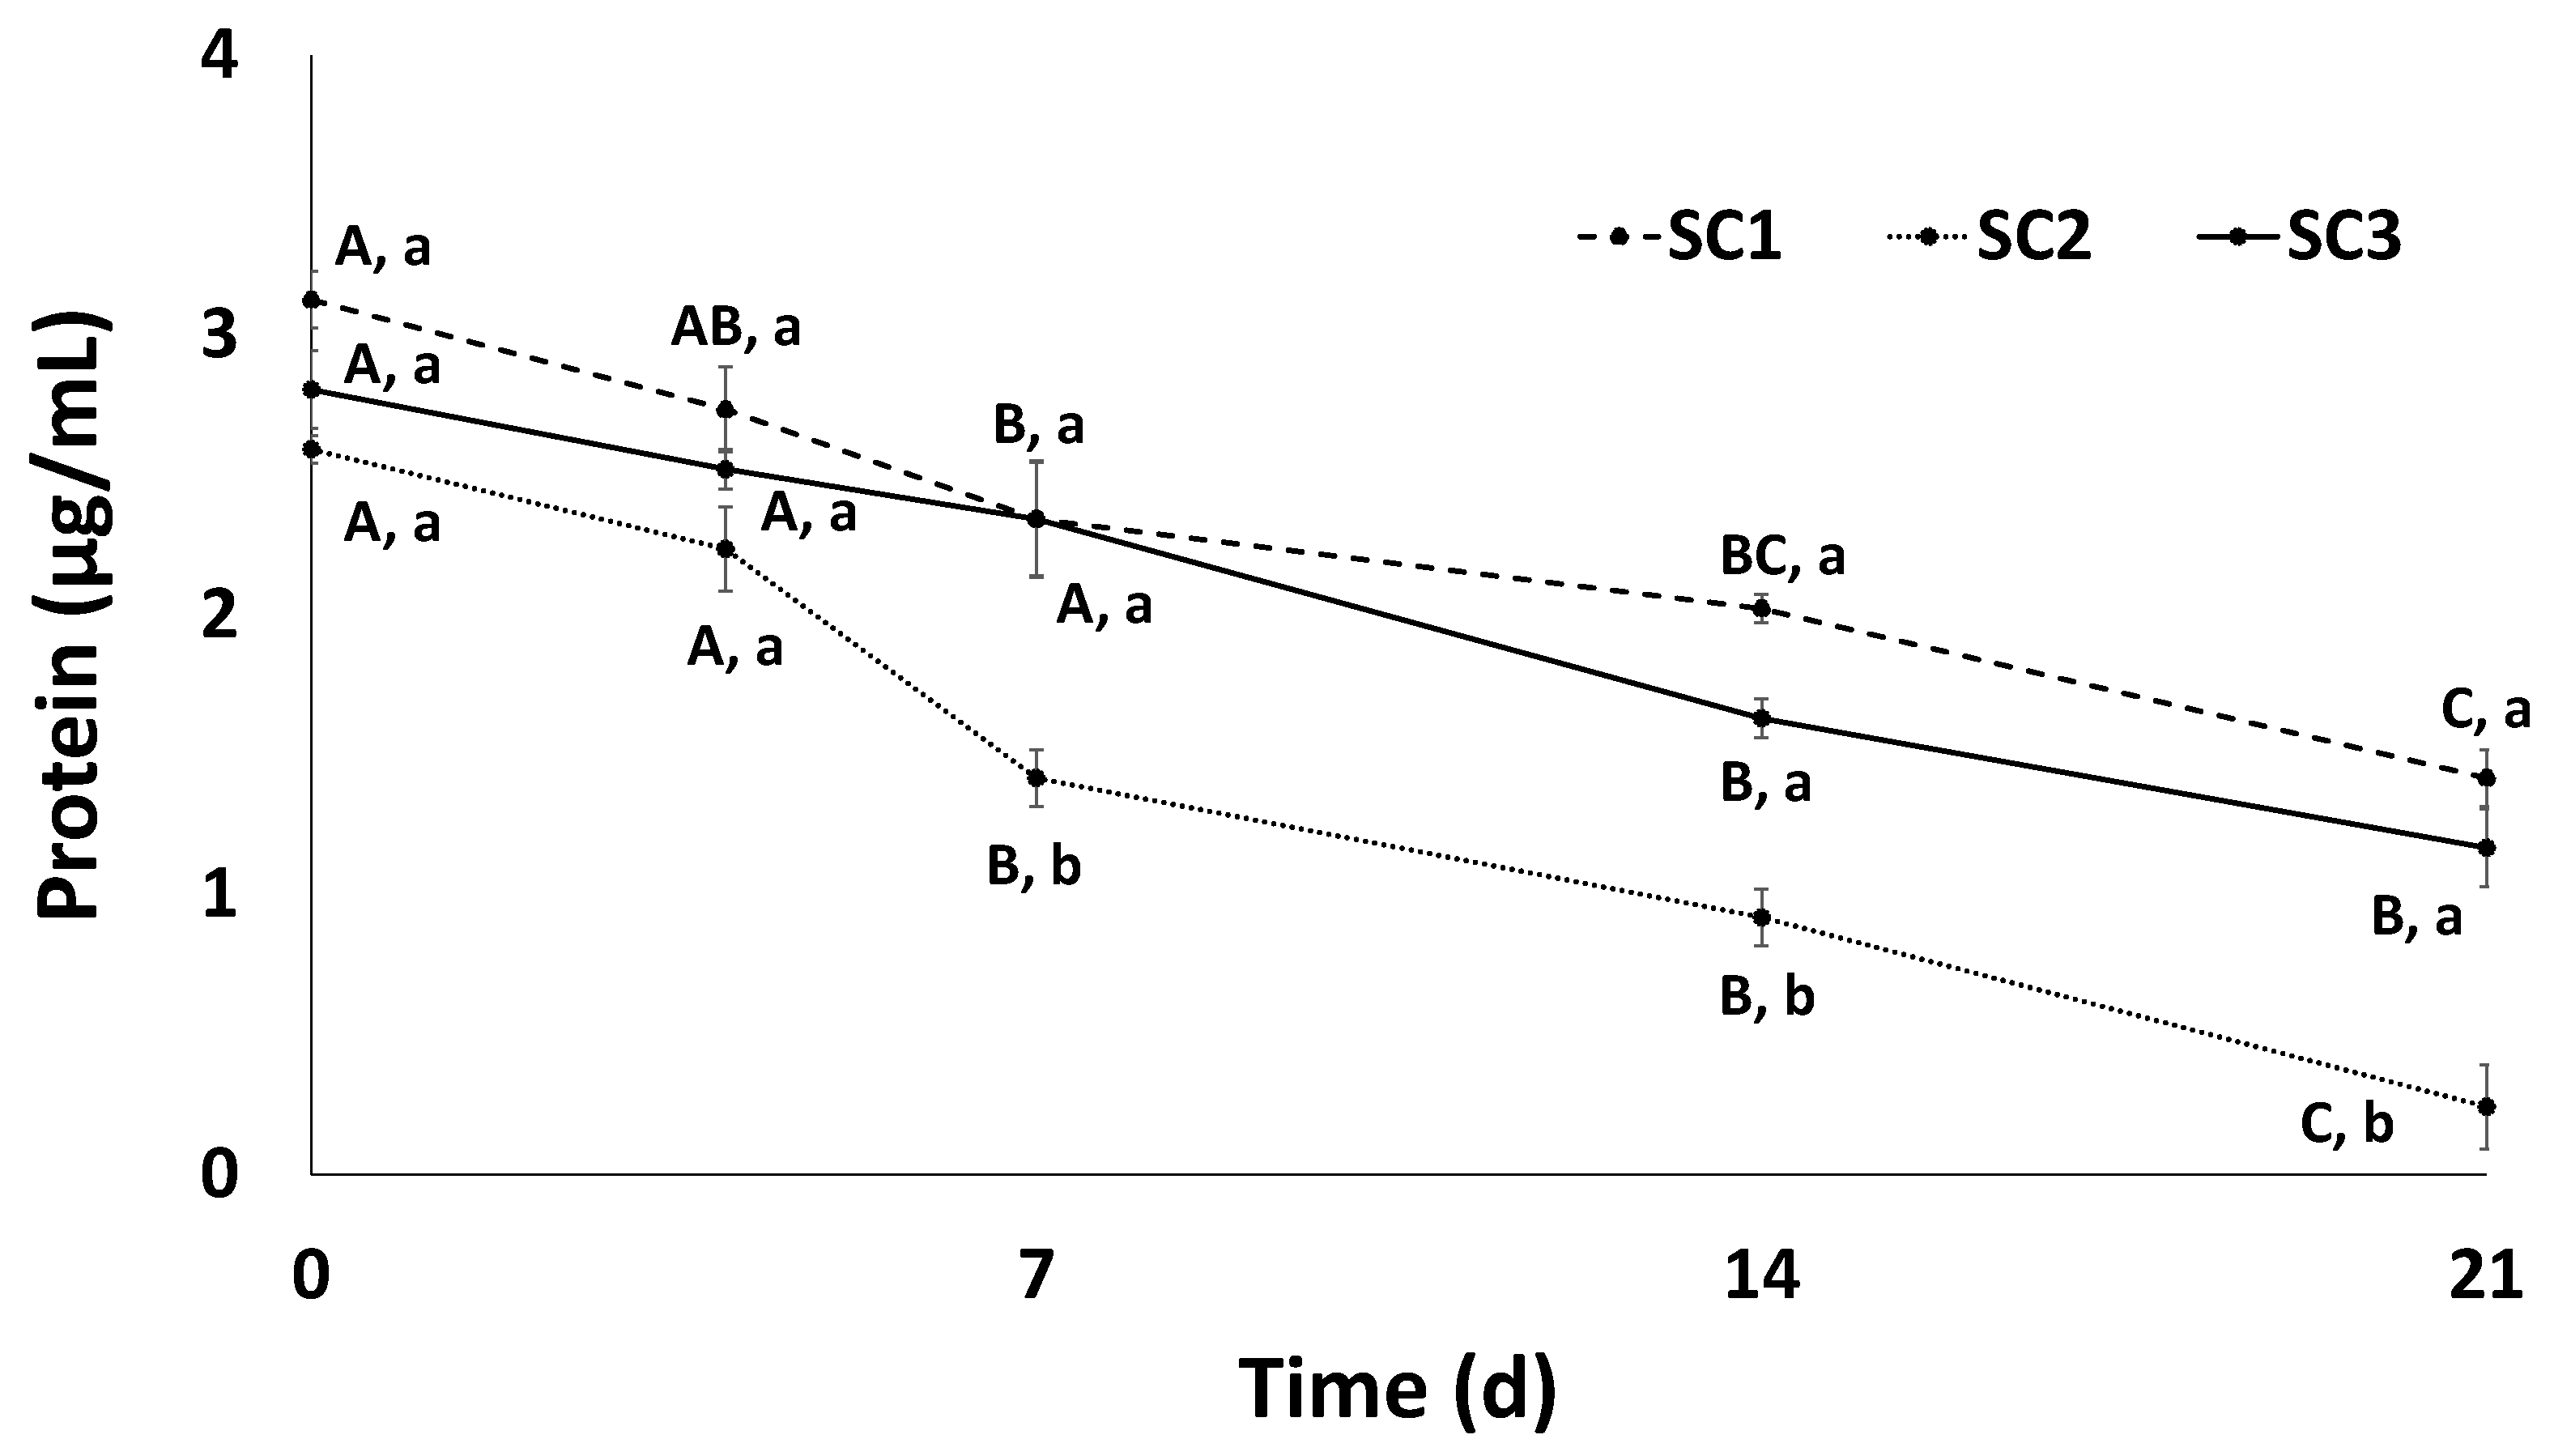
The protein content in conventional kombucha is very low in comparison to other macronutrients; it is normally around 3 µg/mL in conventional and commercial tea kombuchas [37]. This reference value is very close to the values determined for the ST kombuchas during the initial days of fermentation (Figure 4).
ST fruits contain small amounts of total proteins (3%) and the soluble molecules represent an even smaller fraction (0.1%) [13,14]. Consequently, the values determined in the ST kombuchas were also low and the content decreased significantly as fermentation advanced, showing a clear correlation with the reduction in pH value. The high acidity affected protein structures significantly, leading to denaturation; this fact was evidenced by the SC2 sample, which produced a kombucha with lower pH, and faster and more drastic protein loss. Although with a less marked tendency, protein content also fell in the SC1 and SC3 kombuchas, falling to 1.4 and 1.2 µg/mL, respectively, while SC2 registered the lowest value, 0.2 µg/mL, among all the kombuchas after 21 days.
3.5. Evolution of Total Phenolic Content during Fermentation
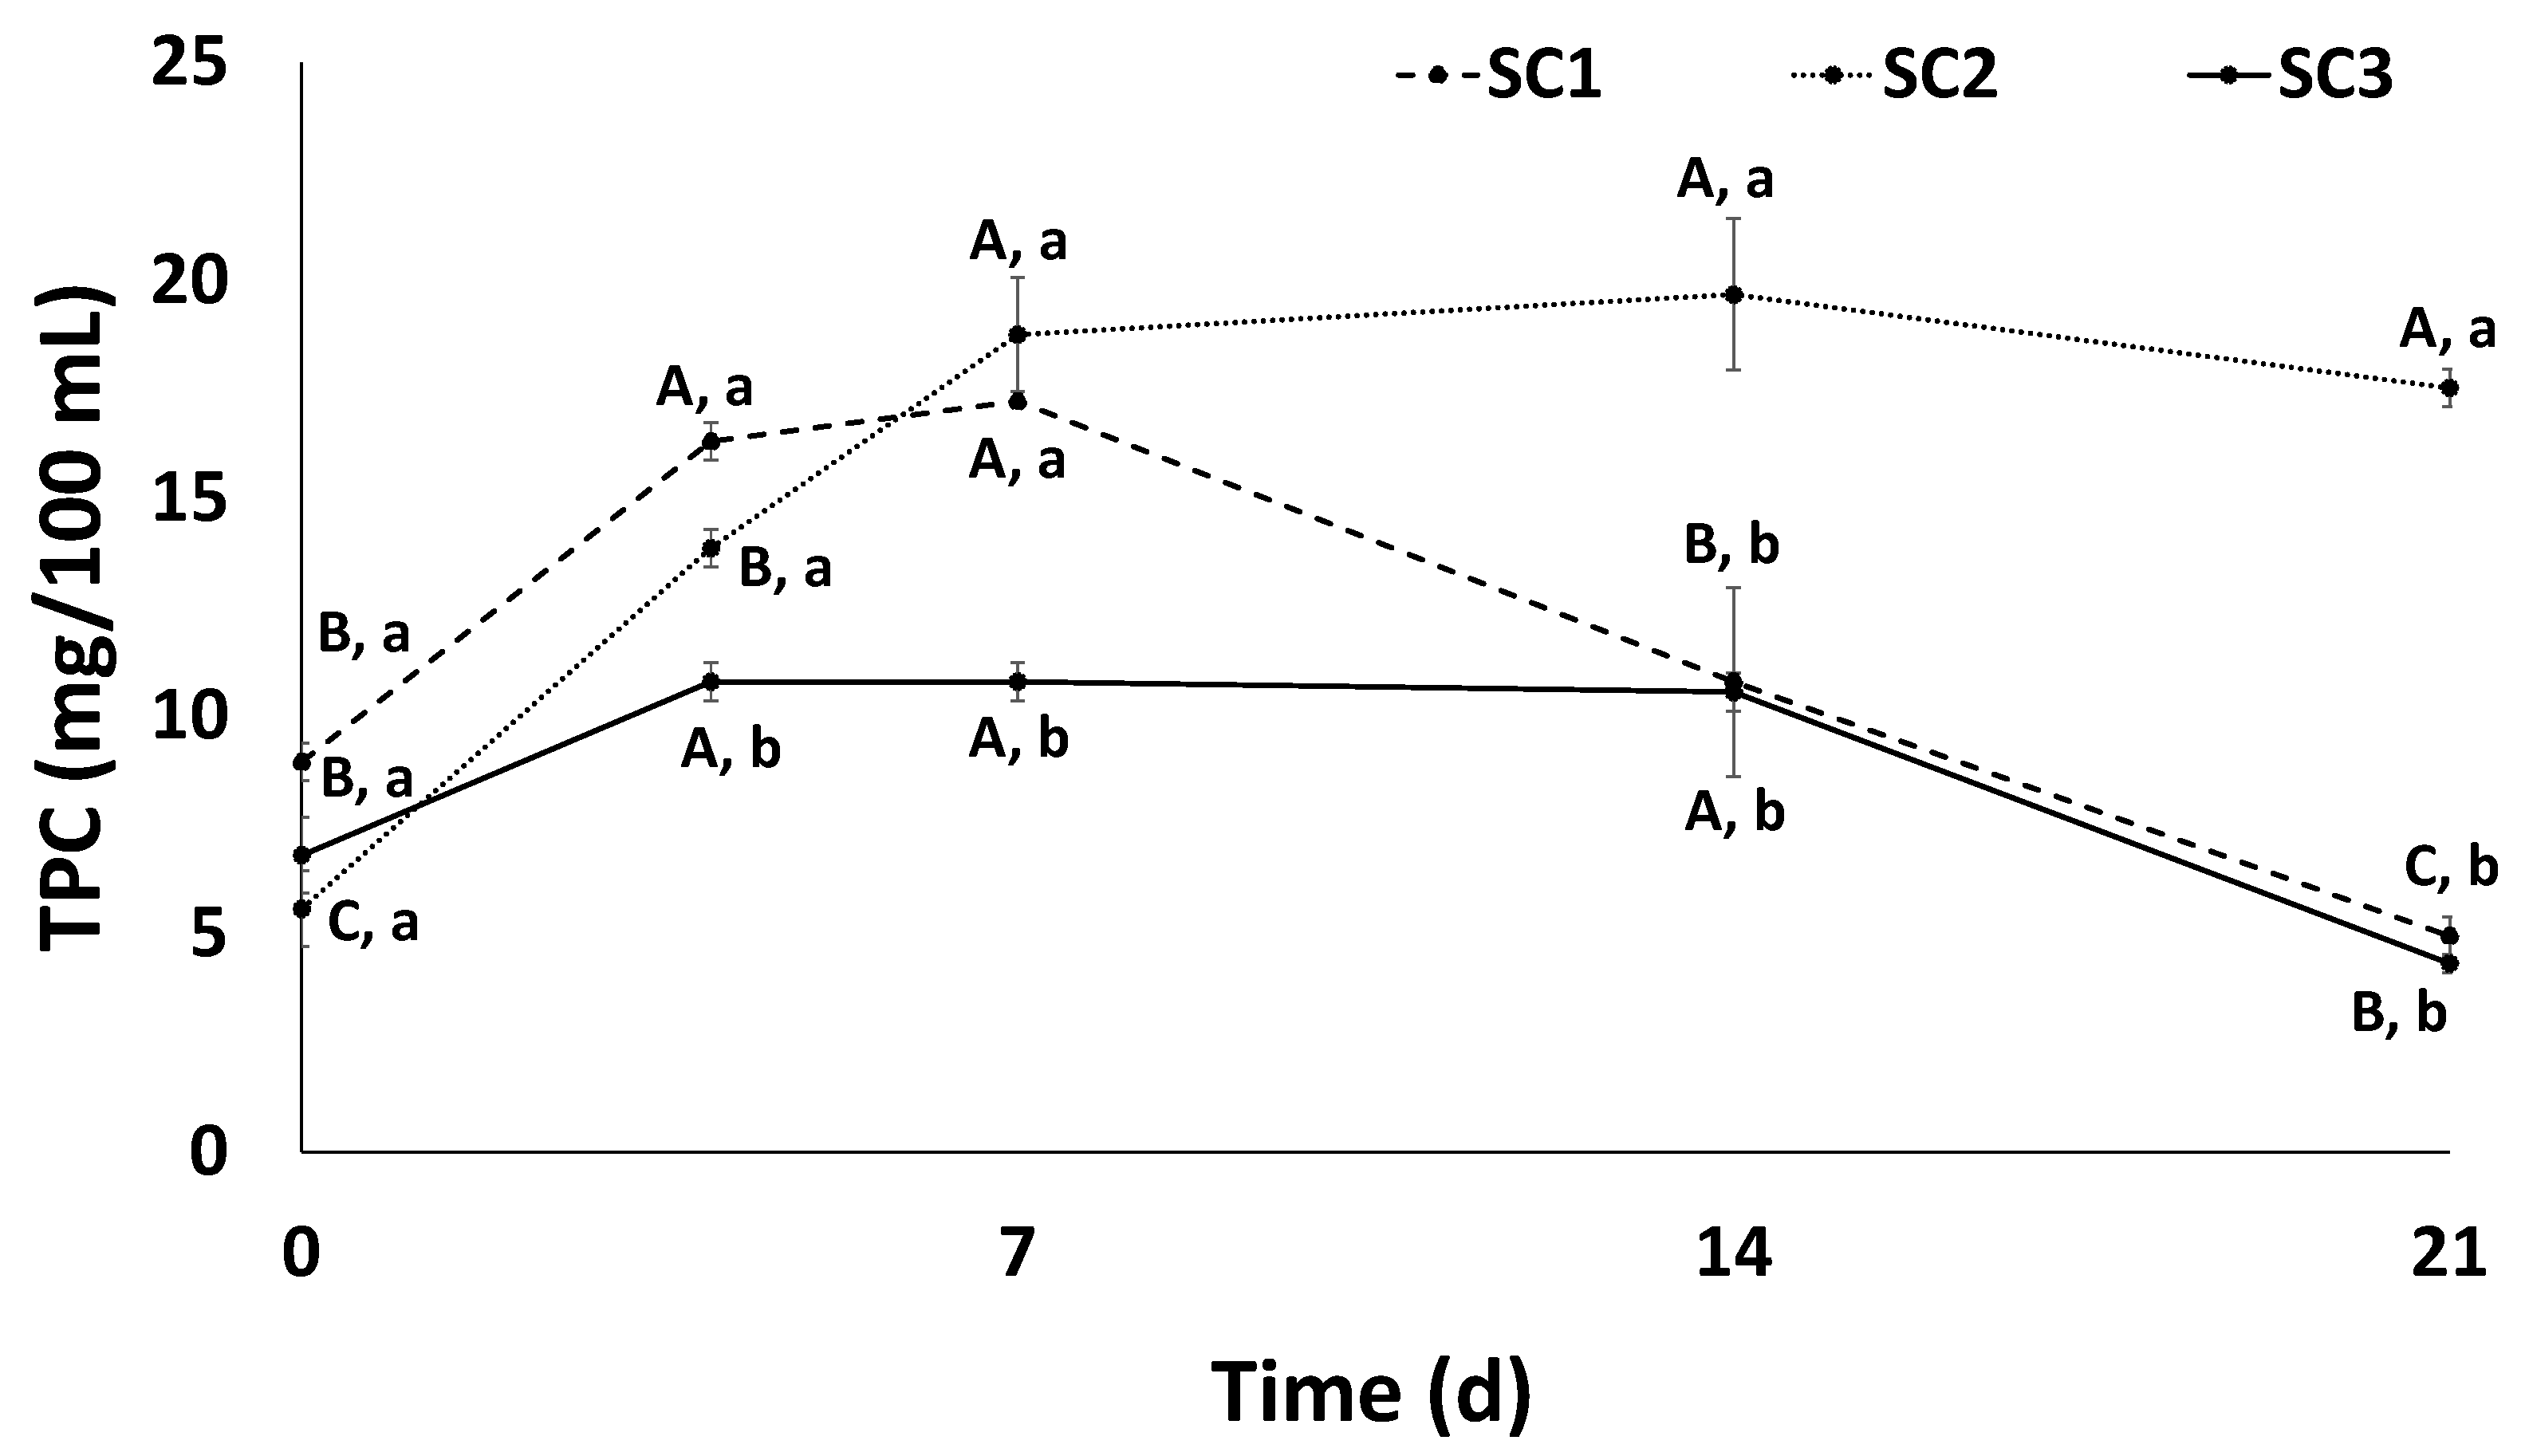
The use of ST fruits to make kombuchas might result in a relevant content of phenolic compounds, an outcome of interest due to their functional properties (antioxidant, anti-inflammatory, antiproliferative, etc.) [12,13]. The fruits that were used in this study contained 12.3 mg/g of total phenols, a level slightly lower than those reported in previous studies [38,39]. The ST’s contribution of phenols to the prepared kombuchas was not in agreement with the initial total phenol content (TPC) of the three studied cases, which ranged from 5.6 to 9.0 mg/100 mL. These unexpectedly low levels might be explained by the degradation of phenolic species caused by the low pH or by the fact that some polyphenols could be integrated in complex structures and were not released and quantified. However, the microbial action and the progression of the fermentation led to significant rises in the TPC: it saw a 1.8-, 2.5-, and 1.6-fold increase in the SC1, SC2, and SC3 samples, respectively, after only 4 days (Figure 5).
These increments were in agreement with the scientific literature. For instance, Wang et al. (2022) also reported this rapid increase in polyphenols and flavonoids in black tea kombuchas and suggested that the enzymes produced by SCOBY microorganisms could act by releasing high amounts of small phenolic monomers, thus augmenting the TPC [10]. Moreover, Kaewkod et al. (2019) registered the maximum levels of TPCs in green, oolong, and black tea kombuchas after 3 days of fermentation [33].
The high TPCs were stable during the rest of fermentation in SC2 and were significantly reduced after day 14 and day 21 in SC1 and SC3, respectively. This fact could be linked to chemical (low pH) or microbial (SCOBY action) degradation, with the latter being the most plausible explanation given that SC2 led to the highest acidities and levels of phenol loss.
3.6. Evolution of VOCs during Fermentation
A total of 20 VOCs were detected in the kombucha beverages over 21 days (Table 1).
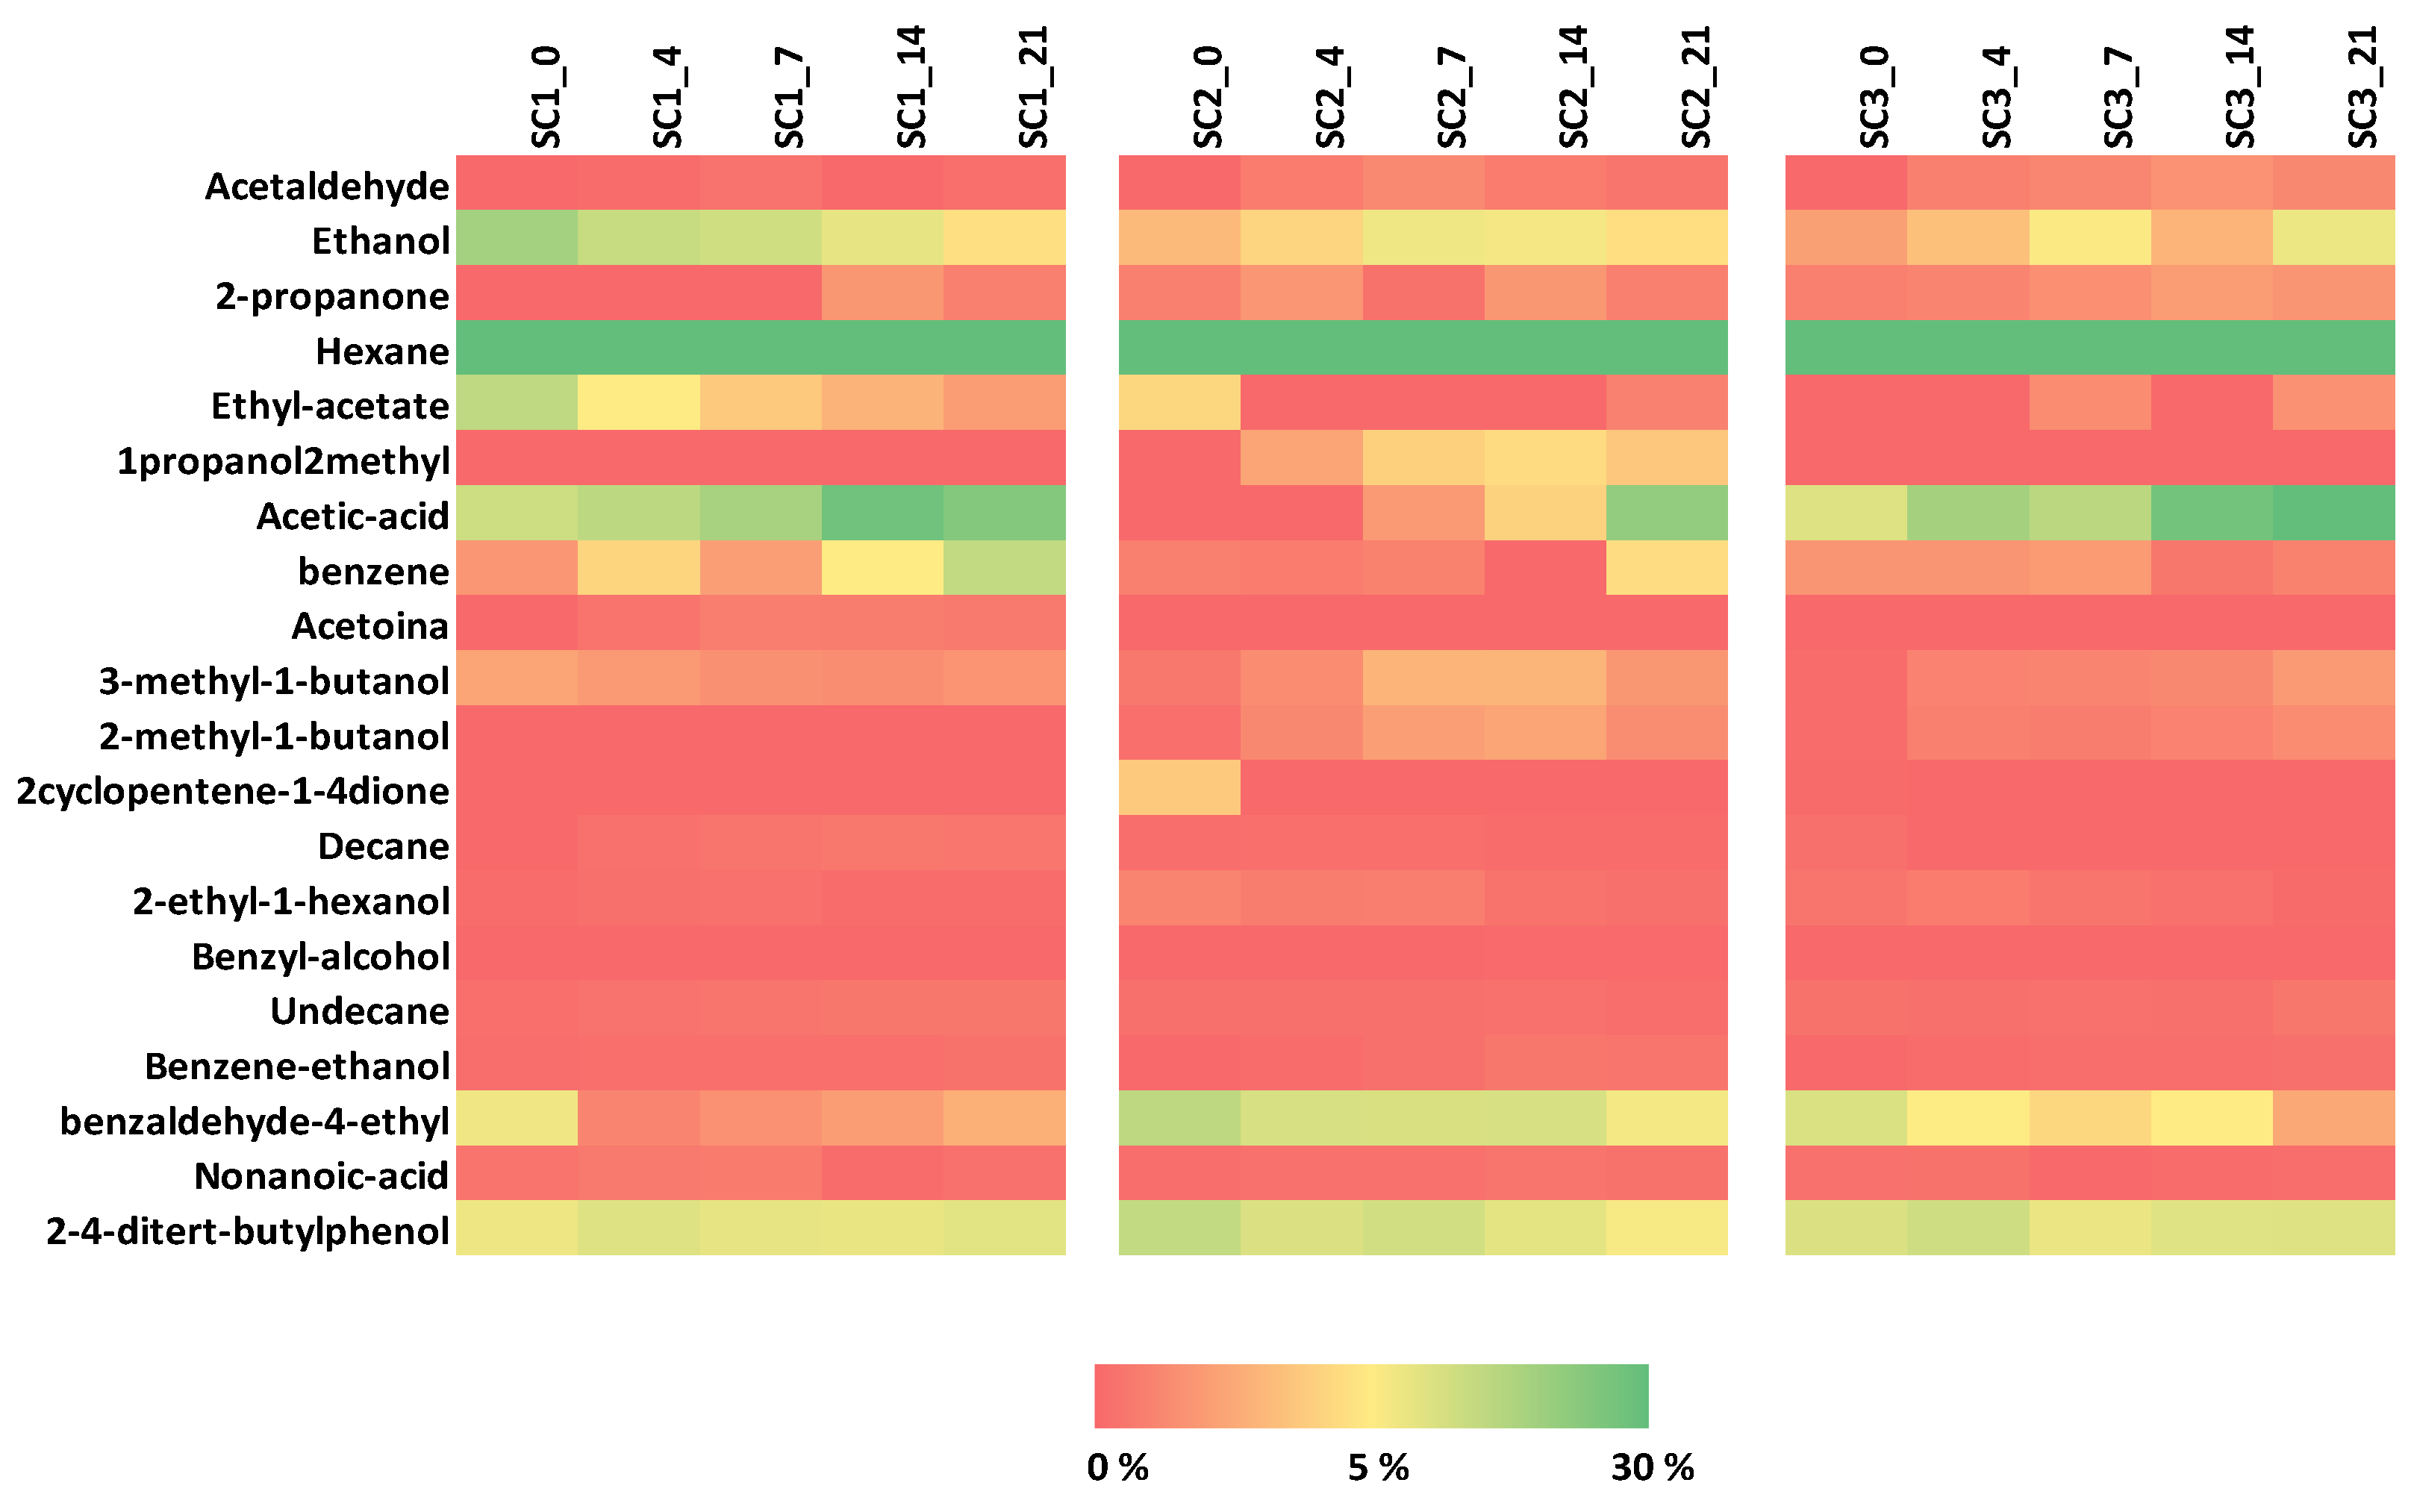
The initial kombuchas showed 12 VOCs in the case of SC1, 14 in SC2, and 15 in SC3 (Figure 6). Among them, hexane was the predominant compound in the three combinations throughout the experiment. Some VOCs detected were only found depending on the SCOBY used: 2-methyl-1-propanol (ethereal, whisky), 2-methyl-1-butanol (wine, onion), and 2cyclopentene-1-4dione (no aroma) in the case of SC1; acetoin (butter, cream) in SC2; and 2-methyl-1-propanol and benzyl-alcohol (rose, phenolic) in SC3. However, other compounds such as ethyl-acetate (ester) and 3-methyl-1-butanol (alcohol) were found in all.
The volatile profile of ST fruits revealed 3-methyl-1-butanol, 2-methy-1-butanol, and ethyl acetate to be present during the ripening stage. According to Oliveira et al. (2011) [16], the volatile compounds present in highest amounts were (Z)-3-hexen-1-ol, 1-hexanol, hexanal, (E)-2-hexe-nal, (Z)-3-hexenyl acetate, and hexyl acetate, collectively known as “green leaf volatiles” (GLV).
Several alcohols, including ethanol, 2-methyl-1-propanol, 3-methyl-1-butanol, 2-methyl-1-butanol, benzyl-alcohol, and benzene-ethanol were detected in all the kombuchas. All these compounds, along with acetic acid, increased in concentration throughout the fermentation process. Acetic acid increased in the case of all the SCOBYs, rising to 24.8% in the case of SC1, 22.4% in SC2, and 32.5% in SC3 (day 21). Similar results were observed in kombucha tea over a period of 14 days, during which the acetic acid increased from 0.3 to 23.9% [40]. On day 7, the kombucha fermented with SC2 showed the lowest acetic acid content, indicating it to be the least acidic beverage. The acetic acid content has been related positively to the presence of Komagataeibacter rhaeticus, Komagataeibacter intermedius, and Bacillus spp., and shows a negative correlation with Bacillus coagulans [32]. Furthermore, this compound creates a vinegar-like taste; extending the fermentation process to 21 days in the production of kombucha might provoke strong vinegar notes and odors due to the high acetic acid content. An astringent taste, however, has been correlated negatively with sucrose concentration and positively with ethanol. After the optimal fermentation time (7–14 days) had elapsed, the ethanol content differed depending on the SCOBY used: from 9.1 to 12.5% in the case of SC1; from 6.6 to 7.7% in SC2; and from 2.9 to 5.1% in SC3. It is likely that the SC1 kombucha would display the most astringent taste. The compound benzaldehyde-4-ethyl, which has a sweet odor, was at a higher level in the kombucha fermented with SC2 (11% at day 7) in comparison to those containing SC1 and SC3 (1.5% and 4.2%, respectively). On the same day, the compound 2,4-Di-tert-butylphenol (phenolic odor) was at a slightly higher level (12.3%) in SC2 than in the other kombuchas (8.4–8.9%).
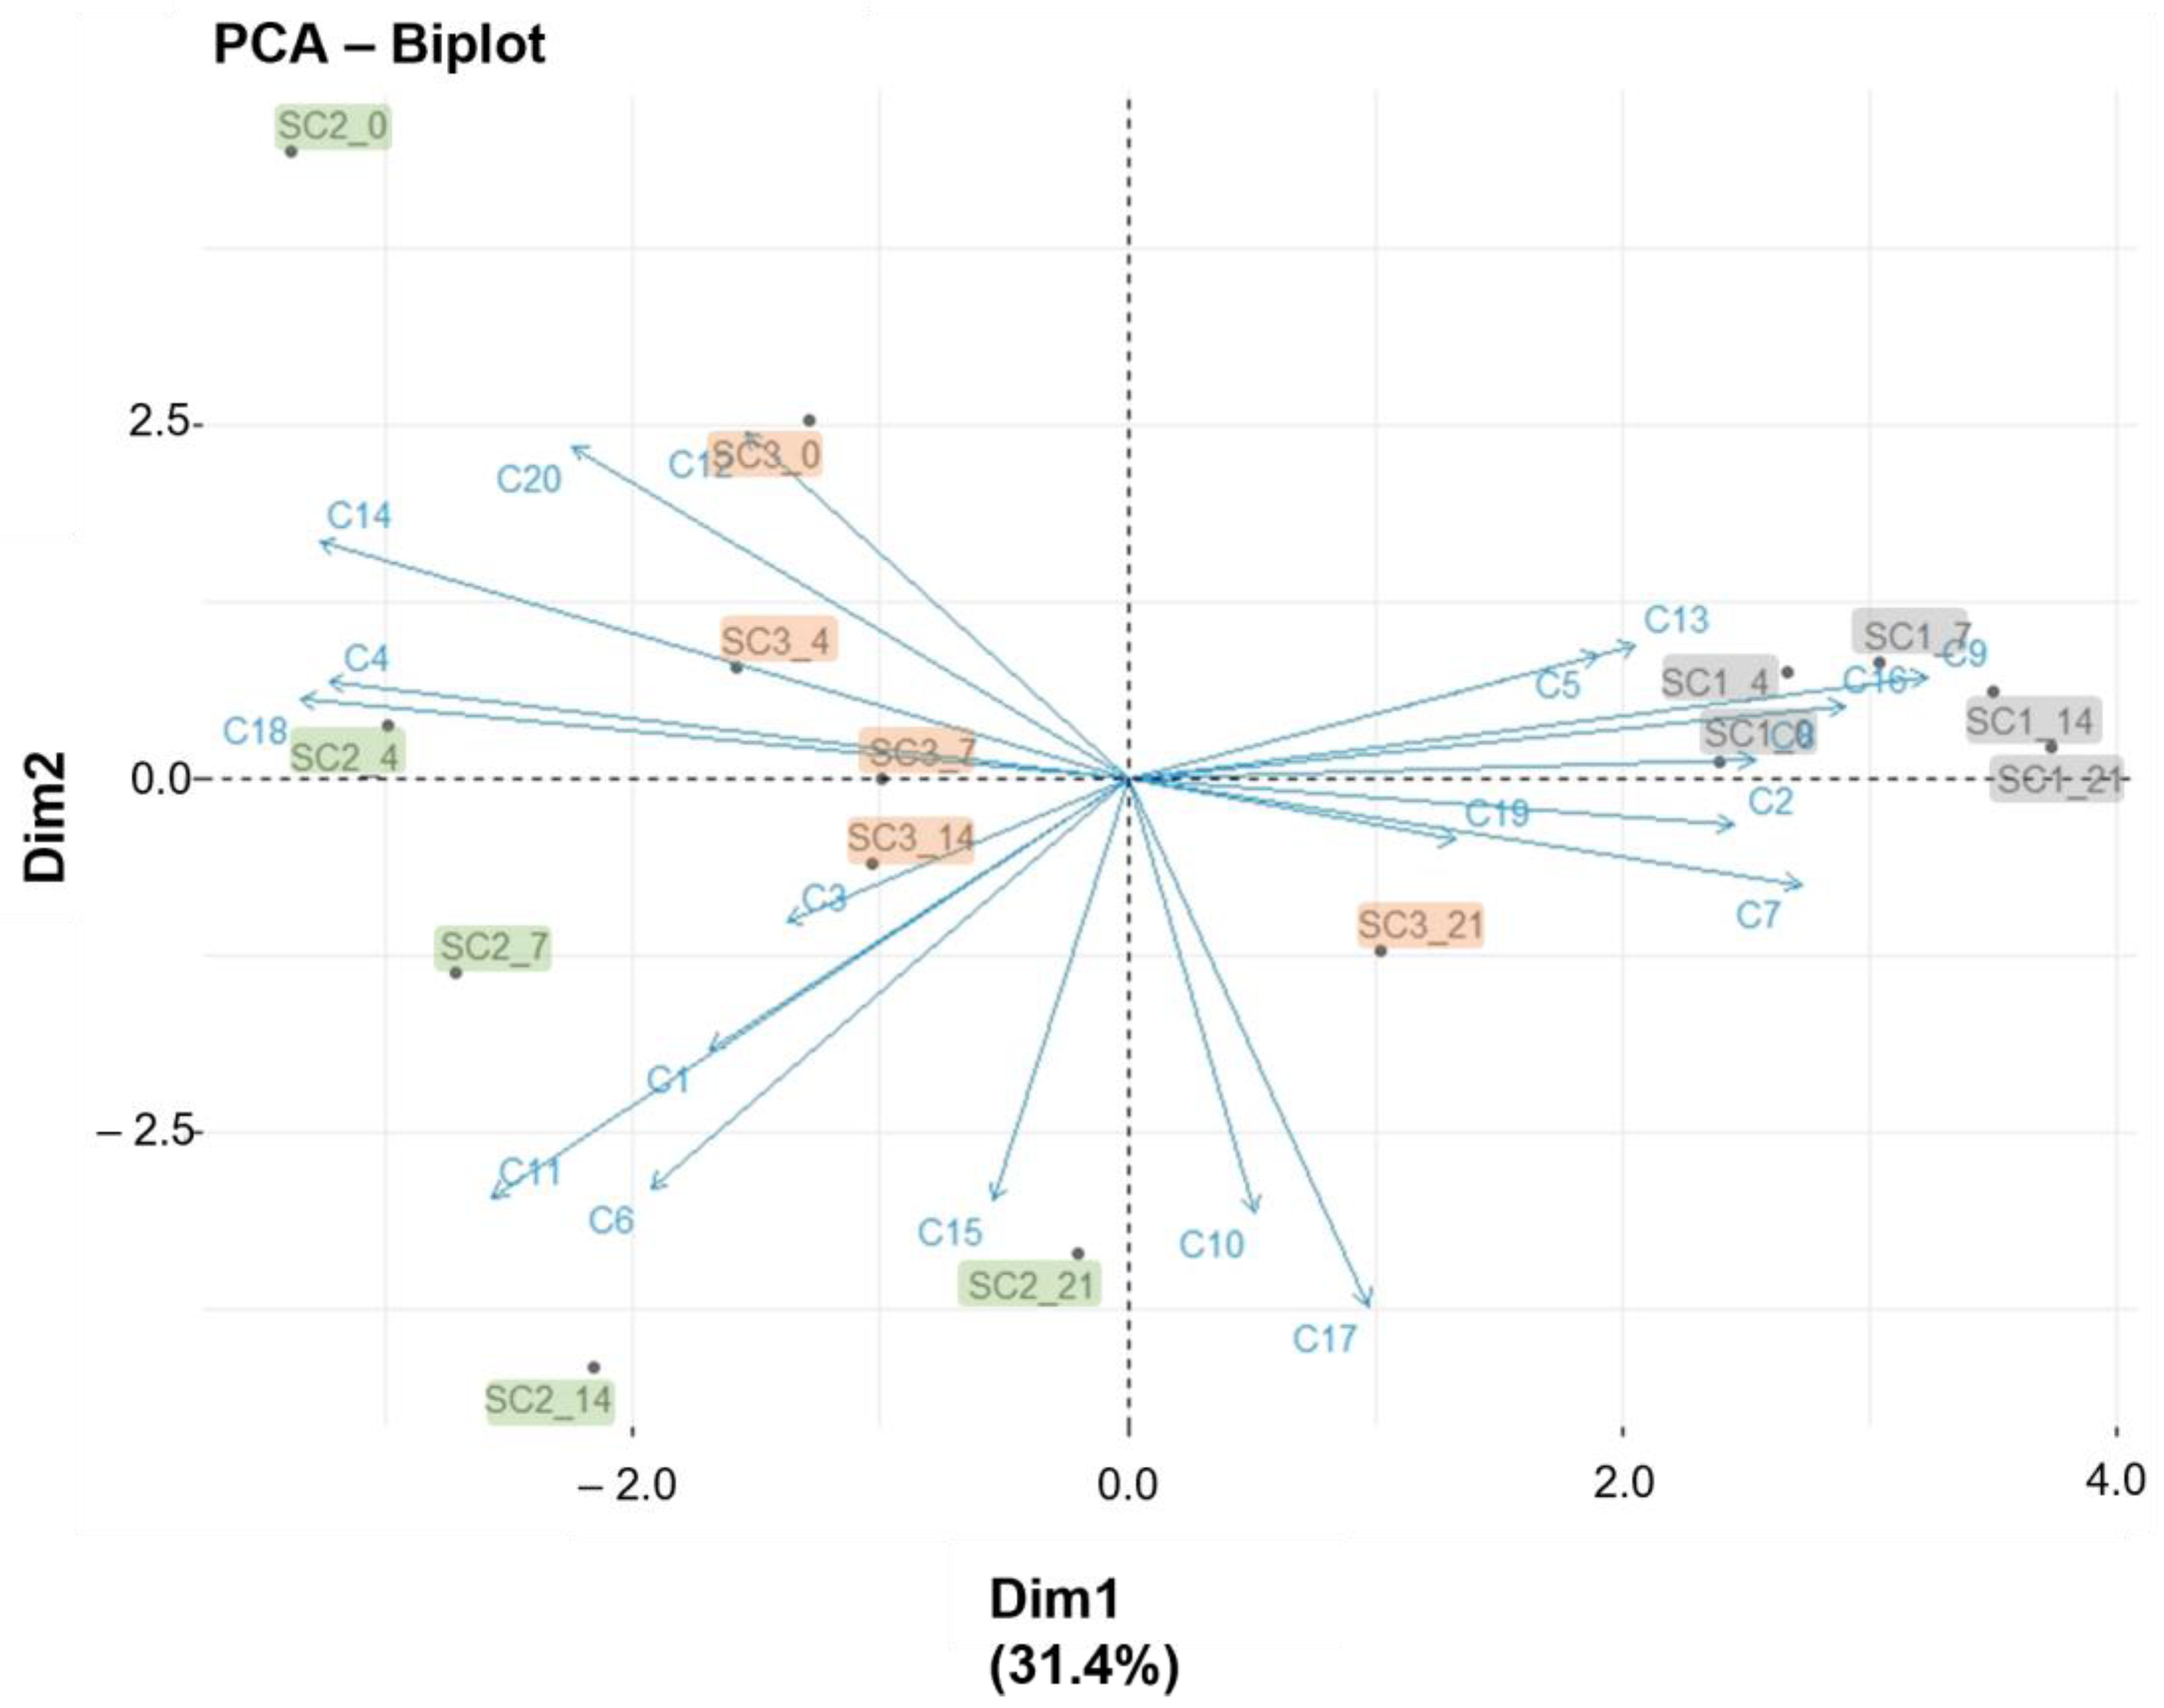
A PCA was performed to analyze variety among the VOCs in the different kombuchas for the 21-day period (Figure 7). The first two principal components (PCs) accounted for 53.2% of the total variability. The first PC was related to the type of SCOBY used in the kombucha fermentation. The PCA allowed the clear separation of the samples into three clusters: SC1 samples on the right, SC3 samples in the middle, and SC2 on the left and at middle-bottom. Samples from SC2 showed higher VOC variability in comparison with SC1 and SC2 samples over 14 days of fermentation. This might be due to differing microorganism strains or levels. The second PC was related to the fermentation time. The more positive loadings correspond to 2-ethyl-1-hexanol (C14—rose, green odor); 2,4-di-tert-butylphenol (C20—phenolic odor); and 2cyclopentene-1-4dione (C12—no aroma), these compounds being correlated with non-fermented kombucha (day 0). The more negative loadings correspond to later fermentation states (day 14, 21): 2-methyl-1-propanol (C6—ethereal, whisky odor); benzyl-alcohol (C15—rose, phenolic odor); 3-methyl-1-butanol (C10—whisky, malt, burnt odor); and benzene-ethanol (C17—rose odor).
4. Conclusions
This study reveals the impact of the type of SCOBY used and of the fermentation time on the nutritional and aromatic properties of ST kombuchas. The three SCOBYs showed similar microbial load content. However, the initial pH values were different; of particular note is the low pH of the kombucha prepared with SC2, which was in the safe range for human consumption, but affected the composition of the kombucha. In this regard, ST kombuchas showed an increased phenolic content during the first week and after 7 days. Furthermore, their carbohydrate content was lower than those reported for other fruit-based or carbonated drinks, therefore positioning these beverages as a promising alternative from a nutritional point of view, despite their reduced protein content. On day 7, the kombuchas using SC1, SC2, and SC3 showed astringent, sweet, and acidic notes, respectively. These results encourage further research targeting ST kombuchas fermented for no more than 7 days, paying particular attention to their nutritional and potentially bioactive properties.
Author Contributions
Conceptualization, E.T.-C. and D.M.; methodology, E.T.-C. and D.M.; software, E.T.-C. and D.M.; validation, E.T.-C. and D.M.; formal analysis, E.T.-C. and D.M.; investigation, E.T.-C. and D.M.; resources, E.T.-C. and D.M.; data curation, E.T.-C. and D.M.; writing—original draft preparation, E.T.-C. and D.M.; writing—review and editing, E.T.-C. and D.M. All authors have read and agreed to the published version of the manuscript.
Funding
This research received no external funding.
Institutional Review Board Statement
Not applicable.
Informed Consent Statement
Not applicable.
Data Availability Statement
Data sharing not applicable.
Acknowledgments
Diosdado Morales is acknowledged for collecting and kindly providing ST fruits. D.M. thanks the Spanish Ministry of Science and Innovation (MICINN) for the Juan de la Cierva Formación Fellowship (FJC020-044585-I).
Conflicts of Interest
The authors declare no conflict of interest.
Abbreviations
SCOBY (symbiotic culture of bacteria and yeasts); ST (strawberry tree); AMM (aerobic mesophilic microorganisms); LAB (lactic acid bacteria); AAB (acetic acid bacteria); TPC (total phenolic content); VOC (volatile organic compound).
References
- Kapp, J.M.; Sumner, W. Kombucha: A Systematic Review of the Empirical Evidence of Human Health Benefit. Ann. Epidemiol. 2019, 30, 66–70. [Google Scholar] [CrossRef]
- Bishop, P.; Pitts, E.R.; Budner, D.; Thompson-Witrick, K.A. Chemical Composition of Kombucha. Beverages 2022, 8, 45. [Google Scholar] [CrossRef]
- Villarreal-Soto, S.A.; Bouajila, J.; Pace, M.; Leech, J.; Cotter, P.D.; Souchard, J.P.; Taillandier, P.; Beaufort, S. Metabolome-Microbiome Signatures in the Fermented Beverage, Kombucha. Int. J. Food Microbiol. 2020, 333, 108778. [Google Scholar] [CrossRef] [PubMed]
- de Roos, J.; de Vuyst, L. Acetic Acid Bacteria in Fermented Foods and Beverages. Curr. Opin. Biotechnol. 2018, 49, 115–119. [Google Scholar] [CrossRef]
- da Silva Júnior, J.C.; Mafaldo, Í.M.; de Lima Brito, I.; de Magalhães Cordeiro, A.M.T. Kombucha: Formulation, Chemical Composition, and Therapeutic Potentialities. Curr. Res. Food Sci. 2022, 5, 360–365. [Google Scholar] [CrossRef]
- Ivanišová, E.; Meňhartová, K.; Terentjeva, M.; Harangozo, Ľ.; Kántor, A.; Kačániová, M. The Evaluation of Chemical, Antioxidant, Antimicrobial and Sensory Properties of Kombucha Tea Beverage. J. Food Sci. Technol. 2020, 57, 1840–1846. [Google Scholar] [CrossRef]
- Morales, D. Biological Activities of Kombucha Beverages: The Need of Clinical Evidence. Trends Food Sci. Technol. 2020, 105, 323–333. [Google Scholar] [CrossRef]
- Diez-Ozaeta, I.; Astiazaran, O.J. Recent Advances in Kombucha Tea: Microbial Consortium, Chemical Parameters, Health Implications and Biocellulose Production. Int. J. Food Microbiol. 2022, 377, 109783. [Google Scholar] [CrossRef]
- Teixeira Oliveira, J.; Machado da Costa, F.; Gonçalvez da Silva, T.; Dotto Simões, G.; dos Santos Pereira, E.; Quevedo da Costa, P.; Andreazza, R.; Cavalheiro Schenkel, P.; Pieniz, S. Green Tea and Kombucha Characterization: Phenolic Composition, Antioxidant Capacity and Enzymatic Inhibition Potential. Food Chem. 2023, 408, 135206. [Google Scholar] [CrossRef]
- Wang, X.; Wang, D.; Wang, H.; Jiao, S.; Wu, J.; Hou, Y.; Sun, J.; Yuan, J. Chemical Profile and Antioxidant Capacity of Kombucha Tea by the Pure Cultured Kombucha. LWT 2022, 168, 113931. [Google Scholar] [CrossRef]
- Freitas, A.; Sousa, P.; Wurlitzer, N. Alternative Raw Materials in Kombucha Production. Int. J. Gastron. Food Sci. 2022, 30, 100594. [Google Scholar] [CrossRef]
- Tenuta, M.C.; Tundis, R.; Xiao, J.; Loizzo, M.R.; Dugay, A.; Deguin, B. Arbutus Species (Ericaceae) as Source of Valuable Bioactive Products. Crit. Rev. Food Sci. Nutr. 2019, 59, 864–881. [Google Scholar] [CrossRef]
- Morales, D. Use of Strawberry Tree (Arbutus unedo) as a Source of Functional Fractions with Biological Activities. Foods 2022, 11, 3838. [Google Scholar] [CrossRef]
- Ait Lhaj, Z.; Bchitou, R.; Gaboun, F.; Abdelwahd, R.; Benabdelouahab, T.; Kabbour, M.R.; Pare, P.; Diria, G.; Bakhy, K. Moroccan Strawberry Tree (Arbutus unedo L.) Fruits: Nutritional Value and Mineral Composition. Foods 2021, 10, 2263. [Google Scholar] [CrossRef]
- Anjos, O.; Canas, S.; Gonçalves, J.C.; Caldeira, I. Development of a Spirit Drink Produced with Strawberry Tree (Arbutus unedo L.) Fruit and Honey. Beverages 2020, 6, 38. [Google Scholar] [CrossRef]
- Oliveira, I.; Guedes De Pinho, P.; Malheiro, R.; Baptista, P.; Pereira, J.A. Volatile Profile of Arbutus unedo L. Fruits through Ripening Stage. Food Chem. 2011, 128, 667–673. [Google Scholar] [CrossRef]
- Torán-Pereg, P.; del Noval, B.; Valenzuela, S.; Martinez, J.; Prado, D.; Perisé, R.; Arboleya, J.C. Microbiological and Sensory Characterization of Kombucha SCOBY for Culinary Applications. Int. J. Gastron. Food Sci. 2021, 23, 100314. [Google Scholar] [CrossRef]
- Coton, M.; Pawtowski, A.; Taminiau, B.; Burgaud, G.; Deniel, F.; Coulloumme-Labarthe, L.; Fall, A.; Daube, G.; Coton, E. Unraveling Microbial Ecology of Industrial-Scale Kombucha Fermentations by Metabarcoding and Culture-Based Methods. FEMS Microbiol. Ecol. 2017, 93, fix048. [Google Scholar] [CrossRef]
- Gaggìa, F.; Baffoni, L.; Galiano, M.; Nielsen, D.S.; Jakobsen, R.R.; Castro-Mejía, J.L.; Bosi, S.; Truzzi, F.; Musumeci, F.; Dinelli, G.; et al. Kombucha Beverage from Green, Black and Rooibos Teas: A Comparative Study Looking at Microbiology, Chemistry and Antioxidant Activity. Nutrients 2019, 11, 1. [Google Scholar] [CrossRef] [Green Version]
- Tejedor-Calvo, E.; Morales, D.; García-Barreda, S.; Sánchez, S.; Venturini, M.E.; Blanco, D.; Soler-Rivas, C.; Marco, P. Effects of Gamma Irradiation on the Shelf-Life and Bioactive Compounds of Tuber Aestivum Truffles Packaged in Passive Modified Atmosphere. Int. J. Food Microbiol. 2020, 332, 108774. [Google Scholar] [CrossRef]
- de Vero, L.; Gala, E.; Gullo, M.; Solieri, L.; Landi, S.; Giudici, P. Application of Denaturing Gradient Gel Electrophoresis (DGGE) Analysis to Evaluate Acetic Acid Bacteria in Traditional Balsamic Vinegar. Food Microbiol. 2006, 23, 809–813. [Google Scholar] [CrossRef]
- Cardoso, R.R.; Neto, R.O.; dos Santos D’Almeida, C.T.; do Nascimento, T.P.; Pressete, C.G.; Azevedo, L.; Martino, H.S.D.; Cameron, L.C.; Ferreira, M.S.L.; Barros, F.A.R. de Kombuchas from Green and Black Teas Have Different Phenolic Profile, Which Impacts Their Antioxidant Capacities, Antibacterial and Antiproliferative Activities. Food Res. Int. 2020, 128, 108782. [Google Scholar] [CrossRef]
- Villarreal-Soto, S.A.; Beaufort, S.; Bouajila, J.; Souchard, J.P.; Renard, T.; Rollan, S.; Taillandier, P. Impact of Fermentation Conditions on the Production of Bioactive Compounds with Anticancer, Anti-Inflammatory and Antioxidant Properties in Kombucha Tea Extracts. Process Biochem. 2019, 83, 44–54. [Google Scholar] [CrossRef] [Green Version]
- Smiderle, F.R.; Morales, D.; Gil-Ramírez, A.; de Jesus, L.I.; Gilbert-López, B.; Iacomini, M.; Soler-Rivas, C. Evaluation of Microwave-Assisted and Pressurized Liquid Extractions to Obtain β-D-Glucans from Mushrooms. Carbohydr. Polym. 2017, 156, 165–174. [Google Scholar] [CrossRef]
- Ramírez-Anguiano, A.C.; Santoyo, S.; Reglero, G.; Soler-Rivas, C. Radical Scavenging Activities, Endogenous Oxidative Enzymes and Total Phenols in Edible Mushrooms Commonly Consumed in Europe. J. Sci. Food Agric. 2007, 87, 2272–2278. [Google Scholar] [CrossRef]
- Tejedor-Calvo, E.; García-Barreda, S.; Sánchez, S.; Morales, D.; Soler-Rivas, C.; Ruiz-Rodriguez, A.; Sanz, M.Á.; Garcia, A.P.; Morte, A.; Marco, P. Supercritical CO2 Extraction Method of Aromatic Compounds from Truffles. LWT 2021, 150, 111954. [Google Scholar] [CrossRef]
- Gómez, I.; Lavega-gonzález, R.; Tejedor-calvo, E.; Pérez-Clavijo, M.; Carrasco, J. Odor Profile of Four Cultivated and Freeze-Dried Edible Mushrooms by Using Sensory Panel, Electronic Nose and GC.MS. Foods 2022, 8, 953. [Google Scholar] [CrossRef]
- Kassambara, A.; Mundt, F. R Package, Version 1.0. 5.999. Factoextra: Extract and Visualize the Results of Multivariate Data Analyses. R Core Team: New York, NY, USA, 2017.
- Ferremi Leali, N.; Binati, R.L.; Martelli, F.; Gatto, V.; Luzzini, G.; Salini, A.; Slaghenaufi, D.; Fusco, S.; Ugliano, M.; Torriani, S.; et al. Reconstruction of Simplified Microbial Consortia to Modulate Sensory Quality of Kombucha Tea. Foods 2022, 11, 3045. [Google Scholar] [CrossRef]
- Wang, S.; Zhang, L.; Qi, L.; Liang, H.; Lin, X.; Li, S.; Yu, C.; Ji, C. Effect of Synthetic Microbial Community on Nutraceutical and Sensory Qualities of Kombucha. Int. J. Food Sci. Technol. 2020, 55, 3327–3333. [Google Scholar] [CrossRef]
- May, A.; Narayanan, S.; Alcock, J.; Varsani, A.; Maley, C.; Aktipis, A. Kombucha: A Novel Model System for Cooperation and Conflict in a Complex Multi-Species Microbial Ecosystem. PeerJ 2019, 7, e7565. [Google Scholar] [CrossRef] [PubMed]
- Andreson, M.; Kazantseva, J.; Kuldjärv, R.; Malv, E.; Vaikma, H.; Kaleda, A.; Kütt, M.L.; Vilu, R. Characterisation of Chemical, Microbial and Sensory Profiles of Commercial Kombuchas. Int. J. Food Microbiol. 2022, 373, 109715. [Google Scholar] [CrossRef]
- Kaewkod, T.; Bovonsombut, S.; Tragoolpua, Y. Efficacy of Kombucha Obtained from Green, Oolongand Black Teas on Inhibition of Pathogenic Bacteria, Antioxidation, and Toxicity on Colorectal Cancer Cell Line. Microorganisms 2019, 7, 700. [Google Scholar] [CrossRef] [PubMed] [Green Version]
- Tu, C.; Tang, S.; Azi, F.; Hu, W.; Dong, M. Use of Kombucha Consortium to Transform Soy Whey into a Novel Functional Beverage. J. Funct. Foods 2019, 52, 81–89. [Google Scholar] [CrossRef]
- Lin, L.; Li, C.; Jin, C.; Peng, Y.; Hashem, K.M.; Macgregor, G.A.; He, F.J.; Wang, H. Sugar and Energy Content of Carbonated Sugar-Sweetened Beverages in Haidian District, Beijing: A Cross-Sectional Study. BMJ Open 2018, 8, e022048. [Google Scholar] [CrossRef] [PubMed] [Green Version]
- Yin, J.F.; Xu, Y.Q.; Yuan, H.B.; Luo, L.X.; Qian, X.J. Cream Formation and Main Chemical Components of Green Tea Infusions Processed from Different Parts of New Shoots. Food Chem. 2009, 114, 665–670. [Google Scholar] [CrossRef]
- Kaashyap, M.; Cohen, M.; Mantri, N. Microbial Diversity and Characteristics of Kombucha as Revealed by Metagenomic and Physicochemical Analysis. Nutrients 2021, 13, 4446. [Google Scholar] [CrossRef]
- Zitouni, H.; Hssaini, L.; Ouaabou, R.; Viuda-Martos, M.; Hernández, F.; Ercisli, S.; Ennahli, S.; Messaoudi, Z.; Hanine, H. Exploring Antioxidant Activity, Organic Acid, and Phenolic Composition in Strawberry Tree Fruits (Arbutus unedo L.) Growing in Morocco. Plants 2020, 9, 1677. [Google Scholar] [CrossRef]
- Žlabur, J.Š.; Bogdanović, S.; Voća, S.; Babojelić, M.S. Biological Potential of Fruit and Leaves of Strawberry Tree (Arbutus unedo L.) from Croatia. Molecules 2020, 25, 5102. [Google Scholar] [CrossRef]
- Zhao, Z.J.; Sui, Y.C.; Wu, H.W.; Zhou, C.B.; Hu, X.C.; Zhang, J. Flavour Chemical Dynamics during Fermentation of Kombucha Tea. Emir. J. Food Agric. 2018, 30, 732–741. [Google Scholar] [CrossRef]
Figure 1.
Microbiological group levels in ST kombuchas fermented using SCOBYs 1, 2, and 3 (SC1, SC2, SC3). Different letters show statistical significance (p ≤ 0.05) between different SCOBYs (a,b).
Figure 1.
Microbiological group levels in ST kombuchas fermented using SCOBYs 1, 2, and 3 (SC1, SC2, SC3). Different letters show statistical significance (p ≤ 0.05) between different SCOBYs (a,b).

Figure 2.
Evolution of pH in ST kombuchas fermented using SCOBYs 1, 2, and 3 (SC1, SC2, SC3). Different letters show statistical significance (p ≤ 0.05) between different fermentation days for the same SCOBY (A–C) and between different SCOBYs for the same fermentation day (a–c).
Figure 2.
Evolution of pH in ST kombuchas fermented using SCOBYs 1, 2, and 3 (SC1, SC2, SC3). Different letters show statistical significance (p ≤ 0.05) between different fermentation days for the same SCOBY (A–C) and between different SCOBYs for the same fermentation day (a–c).

Figure 3.
Evolution of total carbohydrate content (%) in ST kombuchas fermented using SCOBYs 1, 2, and 3 (SC1, SC2, SC3). Different letters show statistical significance (p ≤ 0.05) between different fermentation days for the same SCOBY (A–E) and between different SCOBYs for the same fermentation day (a,b).

Figure 4.
Evolution of total soluble protein content (µg/mL) in ST kombuchas fermented using SCOBYs 1, 2, and 3 (SC1, SC2, SC3). Different letters show statistical significance (p ≤ 0.05) between different fermentation days for the same SCOBY (A–C) and between different SCOBYs for the same fermentation day (a,b).

Figure 5.
Evolution of total phenolic content (mg/100 mL) in ST kombuchas fermented using SCOBYs 1, 2, and 3 (SC1, SC2, SC3). Different letters show statistical significance (p ≤ 0.05) between different fermentation days for the same SCOBY (A–C) and between different SCOBYs for the same fermentation day (a,b).

Figure 6.
Heatmap of volatile profile of ST kombucha fermented using SCOBYs 1, 2, and 3 (SC1, SC2, SC3). Colors range from red (0%), to yellow (5%), and to green (30%), showing the relative percentage of the total VOCs detected. Numbers 0, 4, 7, 14, 21 refer to the storage period in days.
Figure 6.
Heatmap of volatile profile of ST kombucha fermented using SCOBYs 1, 2, and 3 (SC1, SC2, SC3). Colors range from red (0%), to yellow (5%), and to green (30%), showing the relative percentage of the total VOCs detected. Numbers 0, 4, 7, 14, 21 refer to the storage period in days.

Figure 7.
PCA plot corresponding to VOCs detected by SPME-GC-MS in ST kombucha fermented using SCOBYs 1, 2, and 3 (SC1, SC2, SC3) over 21 days. Arrows refer to the VOCs (C1 to C20) listed in Table 1. Samples of kombucha beverages are colored in gray (SC1), green (SC2), or orange (SC3). Numbers 0, 4, 7, 14, 21 refer to the storage period in days.


Table 1.
List of volatile organic compounds identified by SPME-GC–MS in ST kombuchas fermented using SCOBYs 1, 2, and 3 (SC1, SC2, SC3).
Table 1.
List of volatile organic compounds identified by SPME-GC–MS in ST kombuchas fermented using SCOBYs 1, 2, and 3 (SC1, SC2, SC3).
| Nº | Name | CAS | Chemical Group | Odor Description * | RT | RI Exp | RI Nist | Mass (m/z) | ||
|---|---|---|---|---|---|---|---|---|---|---|
| 1 | Acetaldehyde | 75-07-0 | Aldehyde | Pungent, ether | 1.467 | <500 | No data | 44 | 43 | 42 |
| 2 | Ethanol | 64-17-5 | Alcohol | Sweet | 1.568 | <500 | 450 | 45 | 46 | 43 |
| 3 | 2-propanone | 67-64-1 | Ketone | Solvent | 1.64 | <500 | 500 | 43 | 58 | 42 |
| 4 | Hexane | 110-54-3 | Alkane | Alkane | 2.014 | Standard | - | 57 | 86 | 56 |
| 5 | Ethyl-acetate | 141-78-6 | Acetates | Pineapple | 2.108 | 612 | 612 | 43 | 80 | 70 |
| 6 | 2-methyl-1-propanol | 78-83-1 | Alcohol | Ethereal, whisky | 2.107 | 612 | 626 | 43 | 74 | 55 |
| 7 | Acetic-acid | 64-19-7 | Acid | Sour | 2.584 | 660 | 660 | 43 | 60 | 45 |
| 8 | benzene | 71-43-2 | Hydrocarbons aromatics | Sweet | 2.676 | 679 | 657 | 78 | 51 | 50 |
| 9 | Acetoin | 513-86-0 | Ketone | Butter, cream | 3.297 | 720 | 720 | 45 | 43 | 88 |
| 10 | 3-methyl-1-butanol | 123-51-3 | Alcohol | Whisky, malt, burnt | 3.47 | 729 | 730 | 55 | 70 | 57 |
| 11 | 2-methyl-1-butanol | 137-32-6 | Alcohol | Wine, onion | 3.506 | 730 | 733 | 57 | 70 | 56 |
| 12 | 2cyclopentene-1-4dione | 930-60-9 | Ketone | - | 8.01 | 884 | 880 | 96 | 42 | 54 |
| 13 | Decane | 124-18-5 | Alkane | Alkane | 12.247 | Standard | - | 57 | 43 | 41 |
| 14 | 2-ethyl-1-hexanol | 104-76-7 | Alcohol | Rose, green | 13.248 | 1029 | 1031 | 57 | 41 | 43 |
| 15 | Benzyl-alcohol | 100-51-6 | Alcohol | Rose, phenolic | 13.544 | 1038 | 1037 | 79 | 108 | 77 |
| 16 | Undecane | 1120-21-4 | Alkane | Alkane | 15.648 | Standard | - | 57 | 43 | 71 |
| 17 | Benzene-ethanol | 60-12-8 | Alcohol | Rose | 16.131 | 1115 | 1116 | 91 | 122 | 65 |
| 18 | benzaldehyde-4-ethyl | 4748-78-1 | Aldehyde | Sweet | 19.193 | 1214 | 1163 | 134 | 133 | 105 |
| 19 | Nonanoic-acid | 112-05-0 | Acid | Green, fat | 20.757 | 1268 | 1264 | 60 | 73 | 57 |
| 20 | 2,4-Di-tert-butylphenol | 96-76-4 | Hydrocarbons aromatics | Phenolic | 27.061 | 1514 | 1518 | 191 | 57 | 206 |
* Odor was selected using Flavornet and Thegoodscentscompany websites. RT = retention time. RI Exp = retention index experimental. RI Nist = retention index literature database NIST.
Disclaimer/Publisher’s Note: The statements, opinions and data contained in all publications are solely those of the individual author(s) and contributor(s) and not of MDPI and/or the editor(s). MDPI and/or the editor(s) disclaim responsibility for any injury to people or property resulting from any ideas, methods, instructions or products referred to in the content. |
© 2023 by the authors. Licensee MDPI, Basel, Switzerland. This article is an open access article distributed under the terms and conditions of the Creative Commons Attribution (CC BY) license (https://creativecommons.org/licenses/by/4.0/).
Share and Cite
MDPI and ACS Style
Tejedor-Calvo, E.; Morales, D. Chemical and Aromatic Changes during Fermentation of Kombucha Beverages Produced Using Strawberry Tree (Arbutus unedo) Fruits. Fermentation 2023, 9, 326. https://doi.org/10.3390/fermentation9040326
AMA Style
Tejedor-Calvo E, Morales D. Chemical and Aromatic Changes during Fermentation of Kombucha Beverages Produced Using Strawberry Tree (Arbutus unedo) Fruits. Fermentation. 2023; 9(4):326. https://doi.org/10.3390/fermentation9040326
Chicago/Turabian StyleTejedor-Calvo, Eva, and Diego Morales. 2023. "Chemical and Aromatic Changes during Fermentation of Kombucha Beverages Produced Using Strawberry Tree (Arbutus unedo) Fruits" Fermentation 9, no. 4: 326. https://doi.org/10.3390/fermentation9040326
Note that from the first issue of 2016, this journal uses article numbers instead of page numbers. See further details here.