Article

Roles of Process Parameters on the Ricinoleic Acid Production from Castor Oil by Aspergillus flavus BU22S

1
Department of Biotechnology, Bennett University, Greater Noida 201310, India
2
Lassonde School of Engineering, York University, North York, Toronto, ON M3J1P3, Canada
*
Author to whom correspondence should be addressed.
Fermentation 2023, 9(4), 318; https://doi.org/10.3390/fermentation9040318
Submission received: 22 February 2023 / Revised: 15 March 2023 / Accepted: 21 March 2023 / Published: 23 March 2023
(This article belongs to the Special Issue Biodegradation and Fermentation in Biorefinery)

Abstract

:
Ricinoleic acid is a biobased green chemical industrially produced from castor oil. Microbial conversion is a cleaner and greener approach to ricinoleic acid production from castor oil. These processes should be further optimized for a better yield of the product. Aspergillus flavus BU22S was used to convert castor oil into ricinoleic acid. The strain was isolated and identified by molecular biological techniques. It was found to be effective in the biotransformation of castor oil. The ricinoleic acid production and dry cell weight of the fungus were studied as functions of time. In this study, to increase the yield of ricinoleic acid and decrease the oil loss, which microorganisms utilizes in biomass production, response surface methodology (RSM) has been used for process optimization. The central composite design was used to optimize the predictor variables such as oil concentration (% w/v), glucose concentration (% w/v), and calcium chloride concentration (% w/v) to increase the overall yield of ricinoleic acid. A quadratic model was found to be the best fit to predict the responses of the experimental results. The model suggested that the concentrations of oil, glucose, and calcium chloride should be lower in order to increase the ricinoleic acid yield and minimize the oil loss. The bench scale studies of optimized conditions from RSM were also conducted. The yield of ricinoleic acid in batch and fed-batch culture studies was also compared. The yield of the ricinoleic acid in batch culture was 21.67 g/kg of total oil. The yield of ricinoleic acid in fed-batch culture in the absence of an external air supply was 46.77 g/kg of total oil. In this case, the oil loss was also reduced to only 12%.

1. Introduction

Naturally occurring hydroxylated fatty acids are very crucial for the chemical industry because of their varied applications. Hydroxy fatty acids can undergo several alterations owing to the presence of the hydroxyl group in the carbon skeleton. One such important resource for hydroxy fatty acid is castor oil. Oil has wide industrial applications. It has been used in the polymer and pharmaceutical industries as an excellent lubricant and as a varnish [1]. It is inedible, has a high oil content, and is widely available, which makes it a suitable candidate for its use in the chemical industries. 90% of the total fatty acid content in castor oil is ricinoleic acid (RA). It is because of the presence of this fatty acid in such a huge amount that castor oil plays a salient role as a biobased green chemical feedstock. Biobased green chemical feedstocks are derived from agricultural or plant materials that serve as an alternative to petroleum-based raw materials for different chemicals. Ricinoleic acid can be transformed into various derivatives by undergoing various chemical modifications [2]. The distinctive characteristics of oil, such as being a desirable candidate for the synthesis of polyols, and having greater oxidative stability, are all due to the hydroxyl group present at the twelfth position in the ricinoleic acid molecule. Due to the presence of the hydroxyl group, the oil possesses some polar properties, which make the oil soluble in alcohols. Due to the intramolecular hydrogen bonding that happens due to the presence of the hydroxyl group, the oil is more viscous compared with other vegetable oils. Due to its higher viscosity, the oil has a relatively longer shelf life [3,4]. The molecular structure of the fatty acid prepared using ChemAxon MarvinSketch® has been shown in Figure 1.
RA has been used in the manufacturing of a wide variety of polymers. Polyurethanes synthesized from castor oil are used for a variety of purposes. It can be used as a sealant, cast elastomers, rigid foams, flexible foams, adhesives, and semi-rigid foams [5]. The polymers synthesized from the RA are highly hydrophobic, have low fracture strain, and are chemically resistant [6]. Polyurethanes from castor oil are used in the manufacturing of telephone cables, in drug delivery systems, and as sealants in electrical components [7,8]. Polyesters resulting from RA have been found useful in biomedical implants [9]. Polyamides synthesized from RA have been used in the synthesis of catheters, tubes, transportation systems, fuel lines, electronic systems, and the manufacturing of sports products [8]. Coating materials synthesized from RA have been found to be very effective. And the use of castor oil as a lubricant has been well-known for a long time. RA has also been used as an emollient, moisturizer, dispersant, and surfactant. RA is also used as an antifungal agent for dermatological applications, and it is also used for other pharmaceutical purposes [8,10,11].
Castor oil contains RA in the form of triglycerides. Castor oil must be hydrolyzed to isolate RA. Castor oil can be hydrolyzed in a variety of ways. The hydrolysis of castor oil is completed by using high temperatures, steam, high pressure (Twitchell process, medium pressure autoclave splitting, high pressure and temperature splitting, and the Colgate-Emery process), and by the use of chemicals (saponification) [12,13]. The aforementioned techniques are ineffective for hydrolyzing oils with hydroxyl groups, conjugated double bonds, and unconjugated yet thermally degradable oils [14,15,16]. The hydrolysis of castor oil by saponification comes with downsides such as inducing polymerization reactions, by-product generation, energy consumption, and color creation. As the world is moving towards greener and cleaner technologies, the use of biocatalysts is preferred over any other chemical methods. The use of biocatalysts ensures the selectivity of the overall reaction, less by-product formation, and the use of mild conditions [17]. Microorganisms such as Candida rugosa [18], Aspergillus niger [19], Penicillium sp. [20], Propionibacterium acidipropionici [21], Pseudomonas aeruginosa [22] have been studied for the hydrolysis of castor oil. Lipases from Porcine Pancreas [23], and Castor bean [24] have also been studied for hydrolysis.
However, there is still a need for improvement in castor oil biotransformation and optimization for commercial applications. It is necessary to identify a microorganism that can produce more RA without wasting any oil. In the previous study, we identified a microorganism that was producing RA in good amounts. The strain, after molecular characterization, was identified as Aspergillus flavus BU22S [25]. There are just two instances of Aspergillus flavus lipase-mediated hydrolysis of castor oil [26,27]. The concentration of the RA has been calculated based on the titrimetric assays in both the investigations and even in nearly all of the studies that have been conducted thus far concerning lipase-mediated hydrolysis [28]. In the previous study, we estimated the concentration of RA using HPLC analysis for a more precise estimation. Similarly, while determining the concentration and yield of the RA, oil consumption by the microorganism was also considered. In that study, glucose was used as an additional carbon source to reduce the consumption of oil and produce fatty acids [25].
The free fatty acids are known to precipitate in the vicinity of calcium ions. Therefore, the existence of calcium ions in the media will remove the free fatty acids. The free fatty acids accumulate at the droplet surfaces, thereby hindering the lipase’s ability to reach the triglycerides [29]. In the present study, process optimization studies have been completed to increase the yield of RA and reduce the oil consumption by the organism. To increase the yield and lower the oil loss, systematic improvement of process variables, i.e., the concentration of oil, concentration of glucose, and concentration of calcium ions, was completed using response surface methodology (RSM). To explore connections between independent factors and responses, RSM, a mixture of certain mathematical and statistical techniques, is used. In order to solve multivariate equations, it makes use of quantitative data from well-crafted experiments. These equations are graphically represented by response surfaces. These surfaces very well explain the impacts of individual, progressive, and mutual interactions of test factors on the response. Additionally, it chooses the best factorial combination of factors to get the greatest response [30,31,32,33,34,35]. Therefore, in this study, process variables in the conversion of castor oil to RA by Aspergillus flavus BU22S were optimized using RSM.

2. Materials and Methods

2.1. Molecular Biological Identification of the Isolated Species and Its Growth Conditions

The strain was isolated from the Bennett University campus (Greater Noida, Uttar Pradesh, India) and was subcultured again and again on Potato Dextrose Agar (PDA) plates for 72 h at 30 °C to obtain a pure strain. The isolate was identified using morphological traits and molecular biological analysis. The methodology described by Carter et al. was used for the extraction of genomic DNA [36]. The isolated DNA was kept at −20 °C for future analysis. The internal transcribed spacer (ITS) regions of the isolate were amplified using primers ITS1-F (5′-TCCGTAGGTGAACCTGCGG-3′) and ITS4-R (5′-TCCTCCGCTTATTGATATGC-3′). The secondary barcoding was also completed for the identification of the species by amplifying the coding regions of the cyp51A gene. The conditions used for the amplification of the cyp51A gene were the same as described by Nargesi et al. [37] The amplicons were purified and sequenced in both directions. With the help of the NCBI BLAST, the acquired sequences were compared with GenBank databases. The newly isolated and molecular biologically characterized strain was further used in this study [25].
The fungal samples were stored in an ultra-freezer (Cryocube, Eppendorf, Hamburg, Germany) in triplicate at −80 °C. Every six months, the fungal samples from the deep freezer were revived in Potato Dextrose Agar (PDA) medium. The fungal samples were also maintained on the PDA slants. On the PDA slants, the fungus was sub-cultured and allowed to grow for 7 days at 30 °C. Such PDA slants were kept in a refrigerator at 4 °C and were replaced every month. Further research was conducted using this pure culture.

2.2. Biotransformation

To check the ricinoleic acid production with time, preliminary studies were performed. The minimal salt media (MSM) supplemented with 2% castor oil was inoculated with the spore suspension of Aspergillus flavus BU22S in different Erlenmeyer flasks. The following MSM components were present in a liter: 3 g KH2PO4, 5.52 g Na2HPO4·7H2O, 1 g NH4Cl, 0.5 g NaCl, 0.03g CaCl2, and 0.12g MgSO4. The spore suspension was made by adding 5 mL of N-saline to the PDA slants of Aspergillus flavus BU22S and scraping the spores off. The flasks were incubated at 30 °C and 180 rpm for one to seven days. After the incubation, the oil phases from the different flasks were recovered on their respective days and analyzed as described later in this study. After the recovery of the oil phase, Aspergillus flavus BU22S biomass on the respective days was filtered through the Whatman Filter Paper. The weight of the filter paper before filtration was recorded. The filter paper along with fungal biomass were kept at 50 °C for 48 h. After 48 h the weight of the filter paper along with the biomass was recorded. The dry cell weight was calculated by subtracting the before and after weights of the filter paper.
To check the effect of different process variables, i.e., oil concentration, glucose concentration, and concentration of calcium ions, small scale preliminary studies of fermentation were performed in MSM. The media used during the experiments was sterilized at 121 °C for 20 min. The biotransformation studies have been carried out for 7 days at 30 °C and 180 rpm. A working volume of 50 mL of MSM was made using a series of castor oil concentrations and the glucose concentrations between the limits of 2 and 5% (w/v), and a series of calcium chloride concentrations between the limits of 1 to 3% (w/v). Twenty treatments were carried out at random, with six axial points, eight fractional factorial points, and six central points, as depicted in Table 1. The experiments were plotted using the Design-Expert® tool v.12(Stat-Ease, Minneapolis, MI, USA). The different Erlenmeyer flasks with different process variable conditions and containing 50 mL of MSM were inoculated with the spore suspension of Aspergillus flavus BU22S. After 7 days, the oil phase was recovered, as described later. Each set of studies included a recording of the weight of the remaining oil after recovery. With the help of the HPLC (Waters, Milford, MA, USA), the samples (oil) acquired after biotransformation were examined.

2.3. Optimization of Process Variables by Response Surface Methodology (RSM)

The influence of independent factors was investigated using the response surface approach involving the concentration of oil (x1), glucose concentration (x2), and concentration of calcium chloride (x3) on response variables, such as the yield of ricinoleic acid and oil loss in the biotransformation studies. A fully crossed central composite design (CCD) was used to plot the experiments. The coded independent variables could be given by the following regression Equation (1):
x i = ( X i   X i * ) / Δ X i
where x i = encoded level of the ith predictor variable, X i   = uncoded level of ith predictor variables, X i * = actual value of the ith predictor variable at the central point, and Δ X i = value for a step change.
For three factors, the model took the following quadratic polynomial equation (Equation (2)), which shows the predicted outcomes as a function of the predictor variables:
Y = β 0 + β 1   x 1 + β 2   x 2 + β 3 x 3 + β 11 x 1 2 + β 22 x 2 2 + β 33 x 3 2 + β 12 x 1 x 2 + β 13 x 1 x 3 + β 23 x 2   x 3
where Y = output, β 0 = constant/intercept, β j = linear interactions effects for variables, β j j = quadratic effects, β j k = linear interactive coefficients.
For the determination of the values of these coefficients, Design-Expert® tool v.12 (Stat-Ease » V12 » Designs » Response Surface Designs, n.d.) was used [30,38].

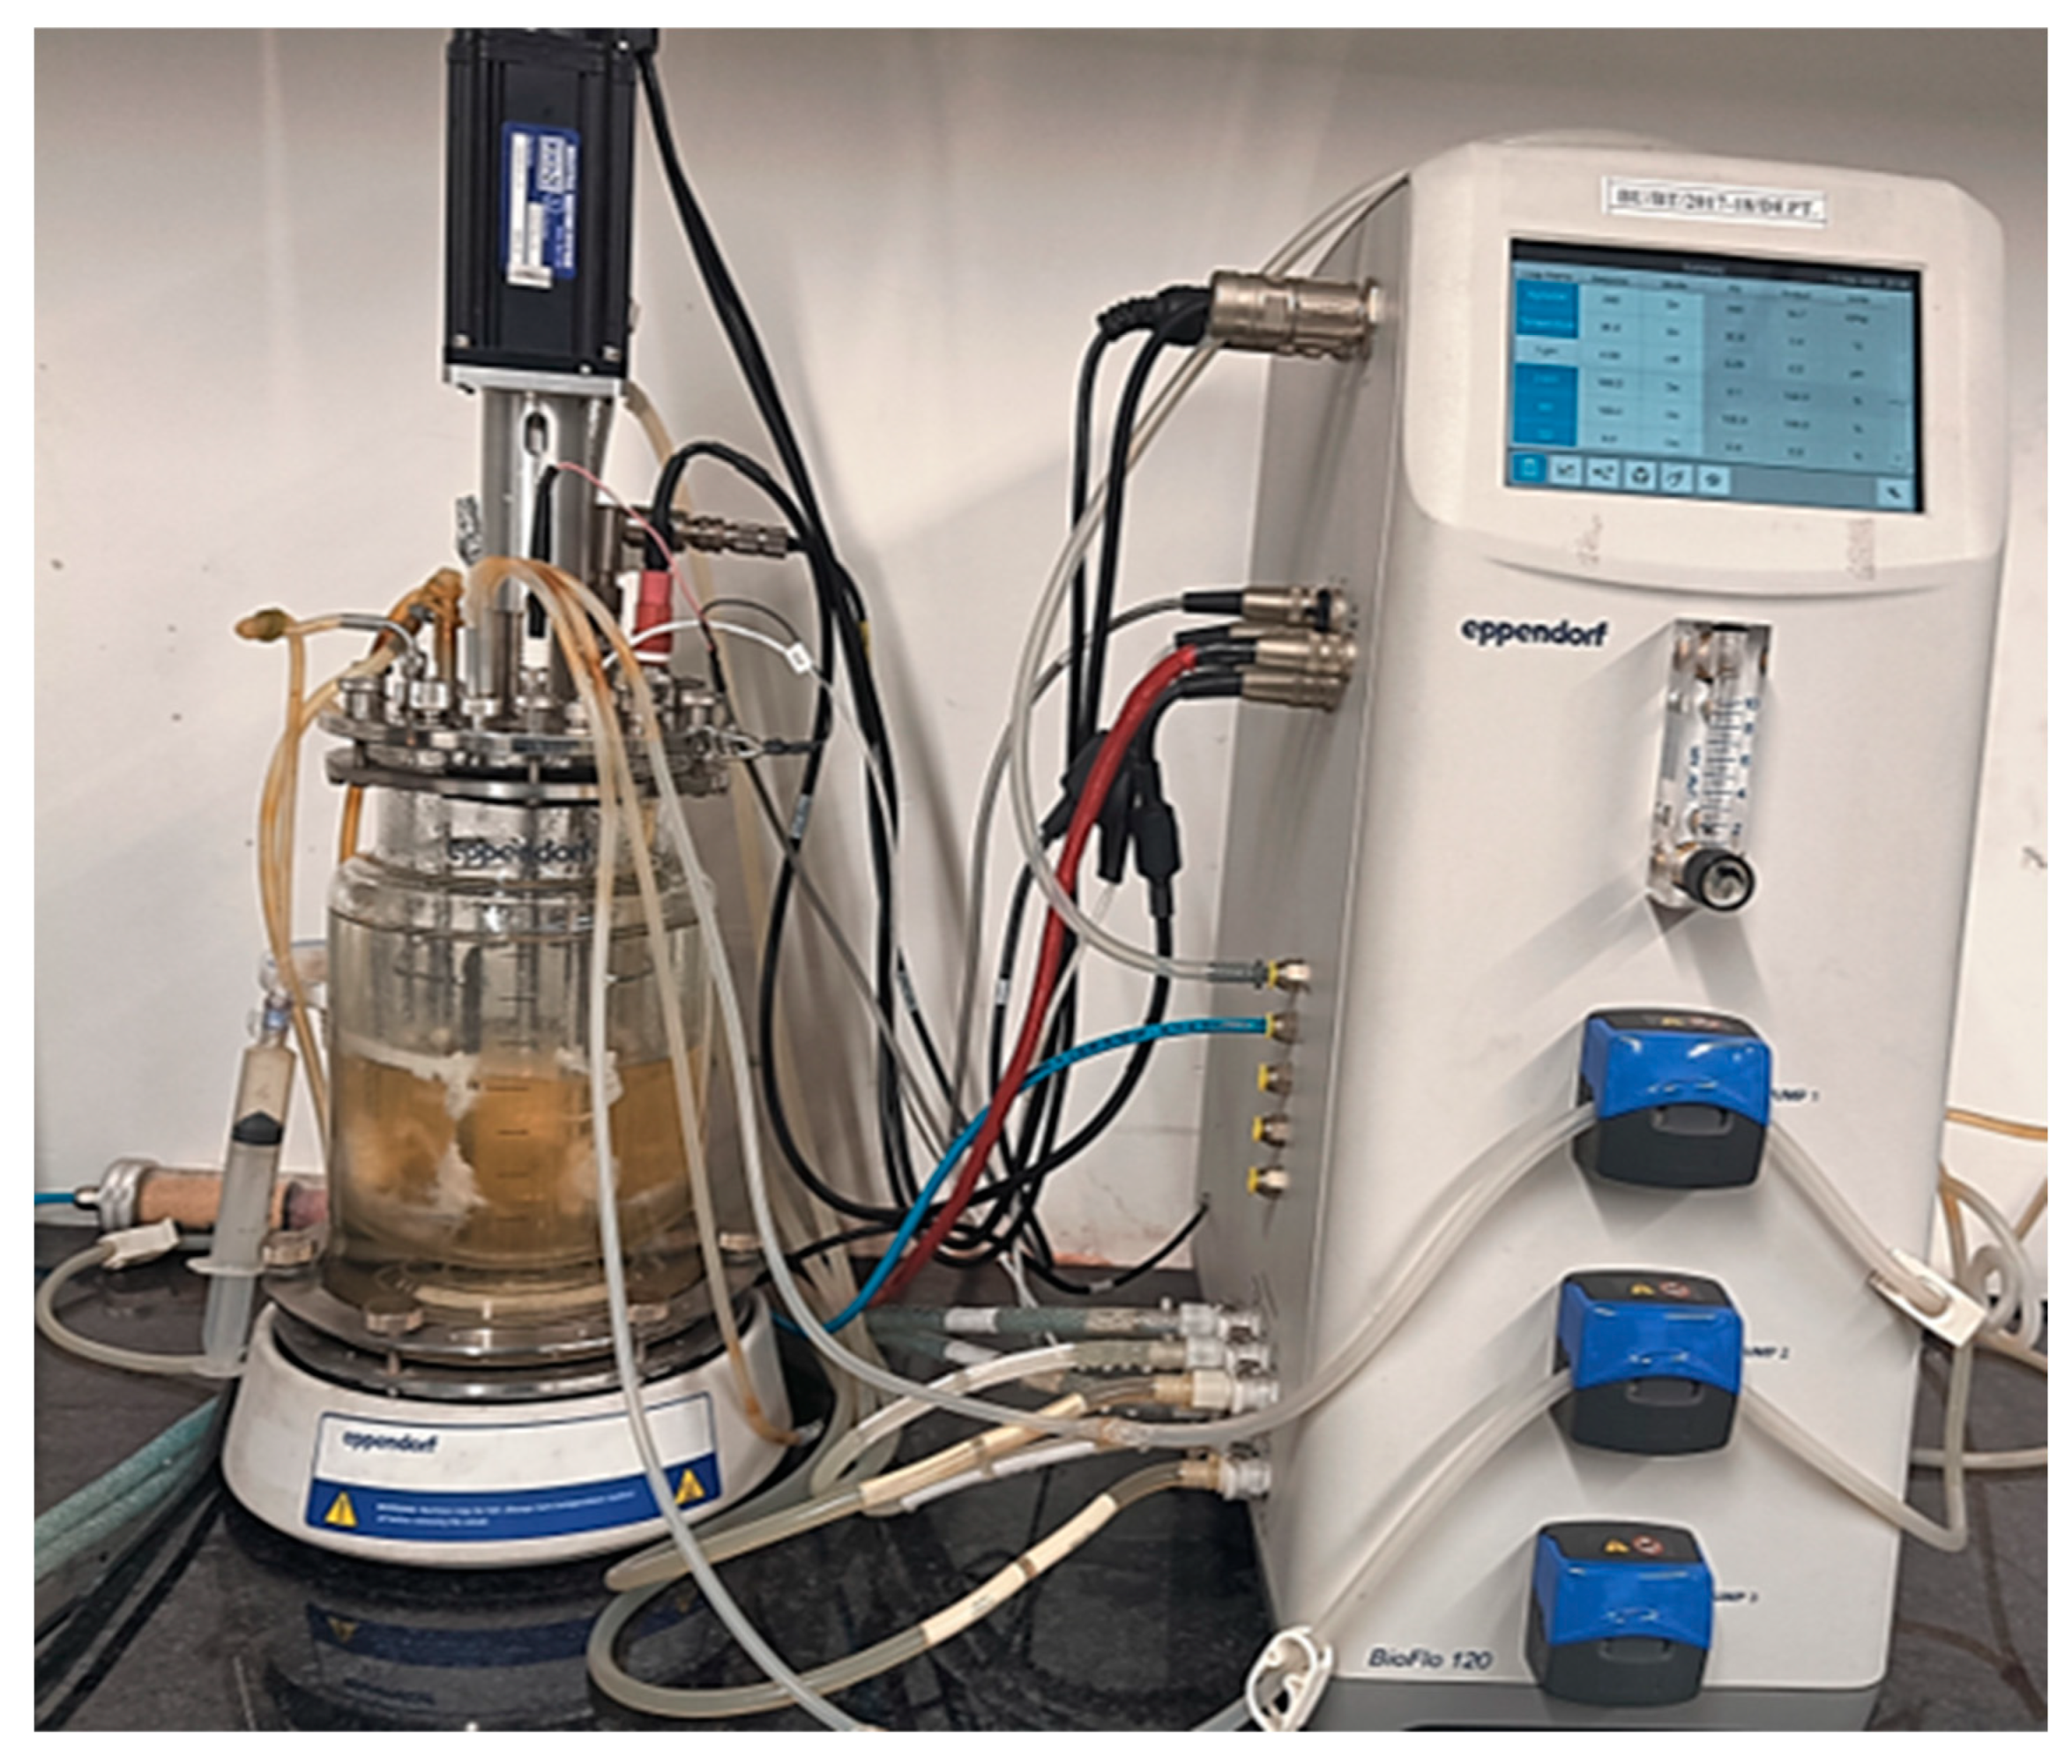
2.4. Bench Scale Fermentation in the Optimized Conditions

The bioreactor (NBS BioFlo 120, Eppendorf, Hamburg, Germany, equipped with an air compressor, a chilled water recirculating unit, and a controlling unit) with a volume of 2 L was used for the experimental set-up. The optimized condition from the RSM was taken and scaled up to a working volume of 1 L. One liter of MSM supplemented with 3.5% of castor oil, 2% of glucose, and 0.3% calcium chloride was prepared and sterilized by autoclaving. The bioreactor along with the media were sterilized at 121 °C for 20 min. The prepared media was inoculated with 2 mL of spore suspension (1.6 × 10⁷ spores/mL). The batch was carried out for 72 h at 30 °C, and at an agitation speed of 200 rpm. The Rushton disc turbine (Eppendorf, Hamburg, Germany) was used as an impeller in the fermentation studies. The pH of the media at the beginning of the batch was 6.01. The airflow was maintained at 1.5 L per minute for 48 h, which was further increased to 2 L per minute for the next 24 h. The reason behind the increased airflow during the final 24 h of the process was high mycelial growth. So, to increase the oxygen diffusion all through the medium in the case of dense mycelium growth, the airflow was increased.
The oil phase was extracted after 72 h. The quantification of the product was completed similarly to that of the shake flask study.
For the same optimized conditions, the fed-batch study was also conducted. The MSM with 2% glucose, and 0.3% calcium chloride was prepared, and 3.5% of castor oil was fed to the reactor at regular intervals. The batch was started with 0.5% castor oil, and then 1% castor oil was fed to the reactor after 24 h. 2% of castor oil was fed to the reactor after 48 h. The fed batch was carried out for 72 h at 30 °C and an agitation speed of 200 rpm. The pH of the media at the beginning of the batch was 6.01. The airflow was maintained at 1.5 L per minute for 48 h, which was further increased to 2 L per minute for the next 24 h. The effect of successive feedings of castor oil every 24 h was observed by calculating the product and oil loss after 72 h of incubation.
A similar fed-batch study was conducted in the absence of an external oxygen supply. All other conditions were maintained similarly to those of the first fed-batch experiment. The only difference was that the external air supply was not connected to the reactor. The fungus was only able to utilize the air present in the headspace of the reactor. The oil phase was recovered and analyzed after 72 h.

2.5. Sample Analyses

2.5.1. Recovery of the Oil Phase

Following 7 days of biotransformation, the medium was centrifuged for 15 min at a speed of 10,000 rpm to separate biomass from the aqueous and oil phases. The media, after centrifugation, were transferred to the separating funnel (BOROSIL, Mumbai, Maharashtra, India). The hexane was added in a 3:1 ratio. The oil phase and the aqueous phase were mixed using a vortex mixture (Labnet, Edison, NJ, USA) for 5 min. The funnel was allowed to rest for 5 min and then the lower aqueous layer was eliminated and the upper organic (hexane) layer was collected. The hexane was then allowed to evaporate. The extraction of the oil phase from the batch and fed-batch studies was also performed in a similar manner. After extraction, samples (oil) were collected, and HPLC was used to examine them.

2.5.2. HPLC Analyses

The Waters 1500 series Model was used for HPLC. The column used for the analysis was 5 μm SunFire™ C18 4.6 × 50 mm. The mobile phase included 0.1% orthophosphoric acid and was composed of acetonitrile and water in a ratio of 60:40. The flow rate was set to 1 mL per min and the column temperature was maintained constant at 30 °C. The sampling rate was 10 samples per second, and the injected volume was 20 μL for all the injections. Each sample was run for 60 min. As a blank, the mobile phase was injected. The photodiode array (PDA) detector captured the peaks at a wavelength of 200 nm [39]. The standard ricinoleic acid (purity ≥ 99%) was purchased from Sigma-Aldrich (St. Louis, MO, USA).

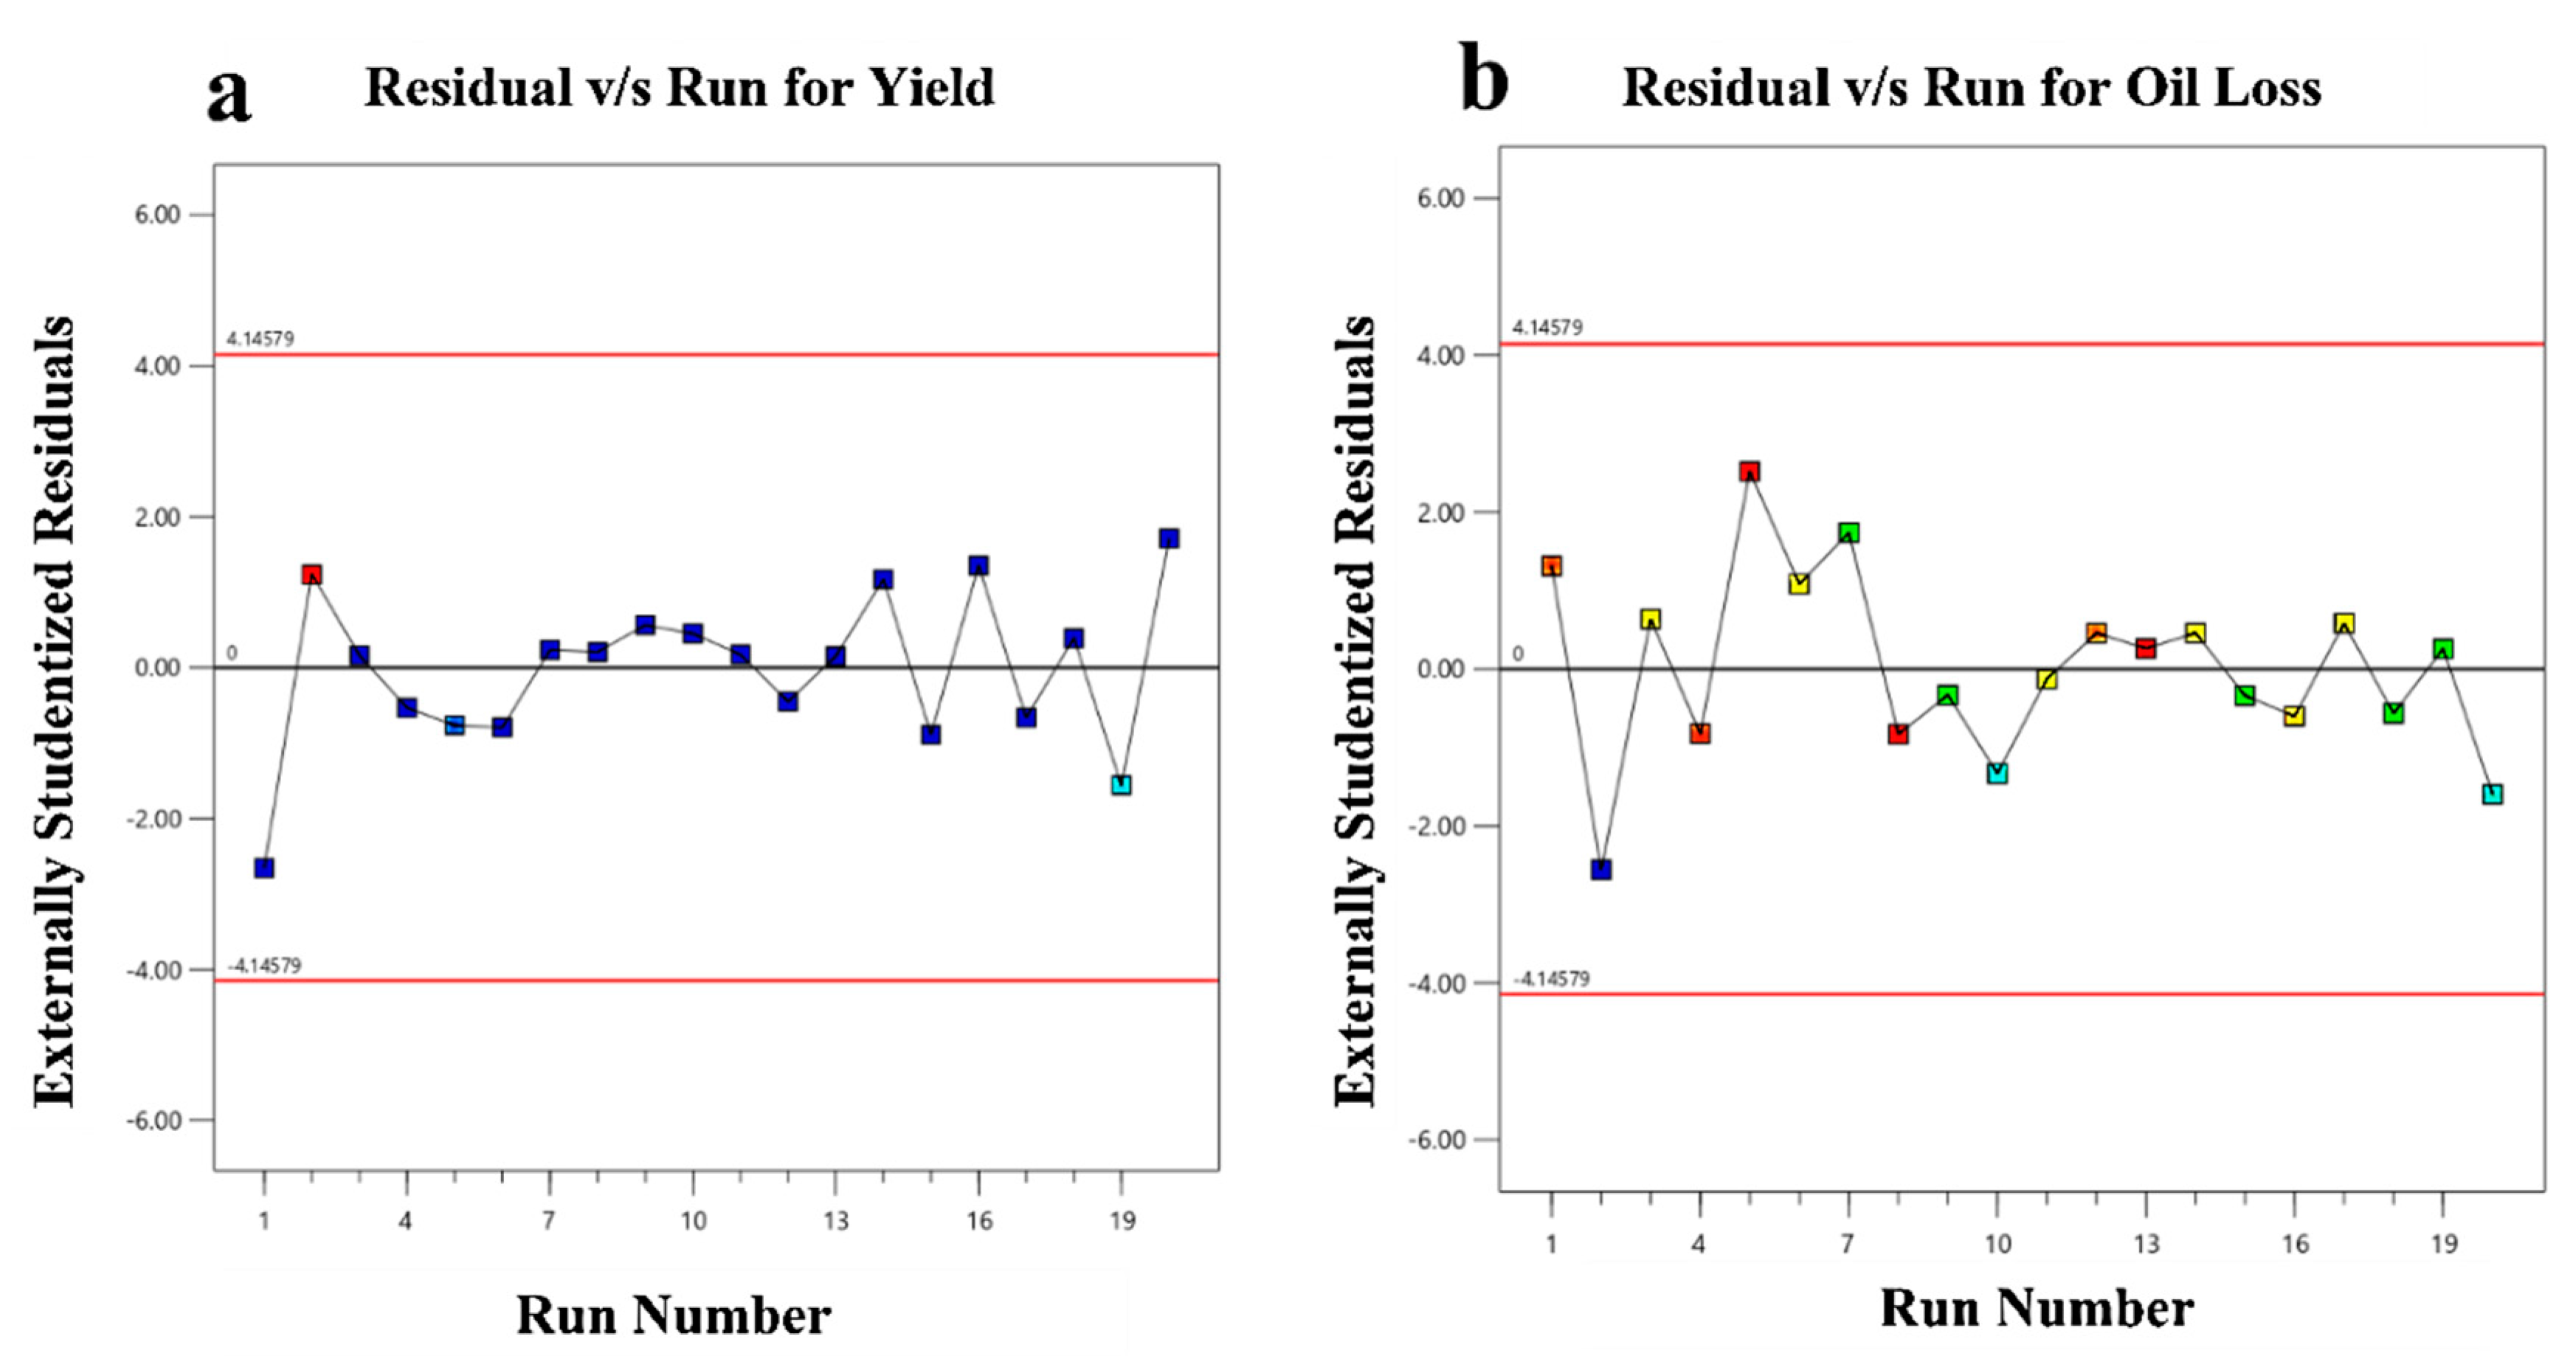
2.5.3. Statistical Analyses

Design-Expert® tool v.12 (Stat-Ease » V12 » Designs » Response Surface Designs, n.d.) was used to statistically assess experimental data. The best-fitting polynomial model was chosen by comparing several statistical metrics of several polynomial models. Through analysis of variance (ANOVA), a significant difference was identified by computing the F-value for the probabilities of 0.5, 0.1, and 0.01. Response plots were created with the aid of Design-Expert® tool v.12(Stat-Ease, Minneapolis, MI, USA) to comprehend the impact of the process variables on the response.

2.5.4. GenBank Accession Numbers

The full sequence for the cyp51A gene and the ITS regions are accessible in the GenBank database under the unique sequence identifiers OP750009, OP750010, OP648166, and OP64817, respectively.

3. Results and Discussion

3.1. Molecular Biological Identification of the Isolated Species

The comparative analysis of the sequences was carried out with the GenBank database using NCBI BLAST search. The ITS sequences showed a similarity index of 99.67% with the species Aspergillus oryzae and Aspergillus flavus. Therefore, to obtain a clear distinction between the species, a secondary biomarker of the cyp51A gene was used. The sequences from the cyp51A gene showed a similarity index of 99.76% and a 100% query coverage with the Aspergillus flavus. Thus, the species was identified as Aspergillus flavus BU22S.

3.2. Biotransformation

Figure 2a depicts the pellets of Aspergillus flavus BU22S formed in the biotransformation media. Figure 2b gives the microscopic view (40×) of Aspergillus flavus BU22S spores. The qualitative analysis of the oil phase recovered from the seven consecutive days was completed using HPLC. The concentration of RA was stated as g/kg of residual oil, and the RA yield was stated as g/kg of total oil added (prior to the biotransformation). The oil loss was defined as the grams of oil lost per kg of oil added. The calculations of RA concentration, RA Yield, and oil loss were performed in a similar way throughout the manuscript. The dry cell weight of the fungus was also recorded each day. The trend of concentration of ricinoleic acid with time was found to be somewhat increasing from day 1 to day 7. The concentration of RA was similar on days 6 and 7. The concentration of RA on day 7 was 256 g/kg of residual oil. The ricinoleic acid yield was observed to increase from 1 to 3 days, as can be seen in Figure 3. The yield was found to be at its maximum on the third day. After 3 days, the yield was somewhat between 60 g/kg to 80 g/kg of total oil. The biomass of the fungus first increased and then became constant up to the 7th day. This is why all the biotransformation experiments plotted using Design-Expert® tool v.12 were carried out for 7 days. When the dry cell weight of the fungus was found to be increasing, the yield was comparably low. On the days when the dry cellular weight was found to be low, the yield was comparably high. The yield and dry cell weight were inversely proportional to each other. While the concentration of the RA was found to be independent of the dry cell weight of the fungus.

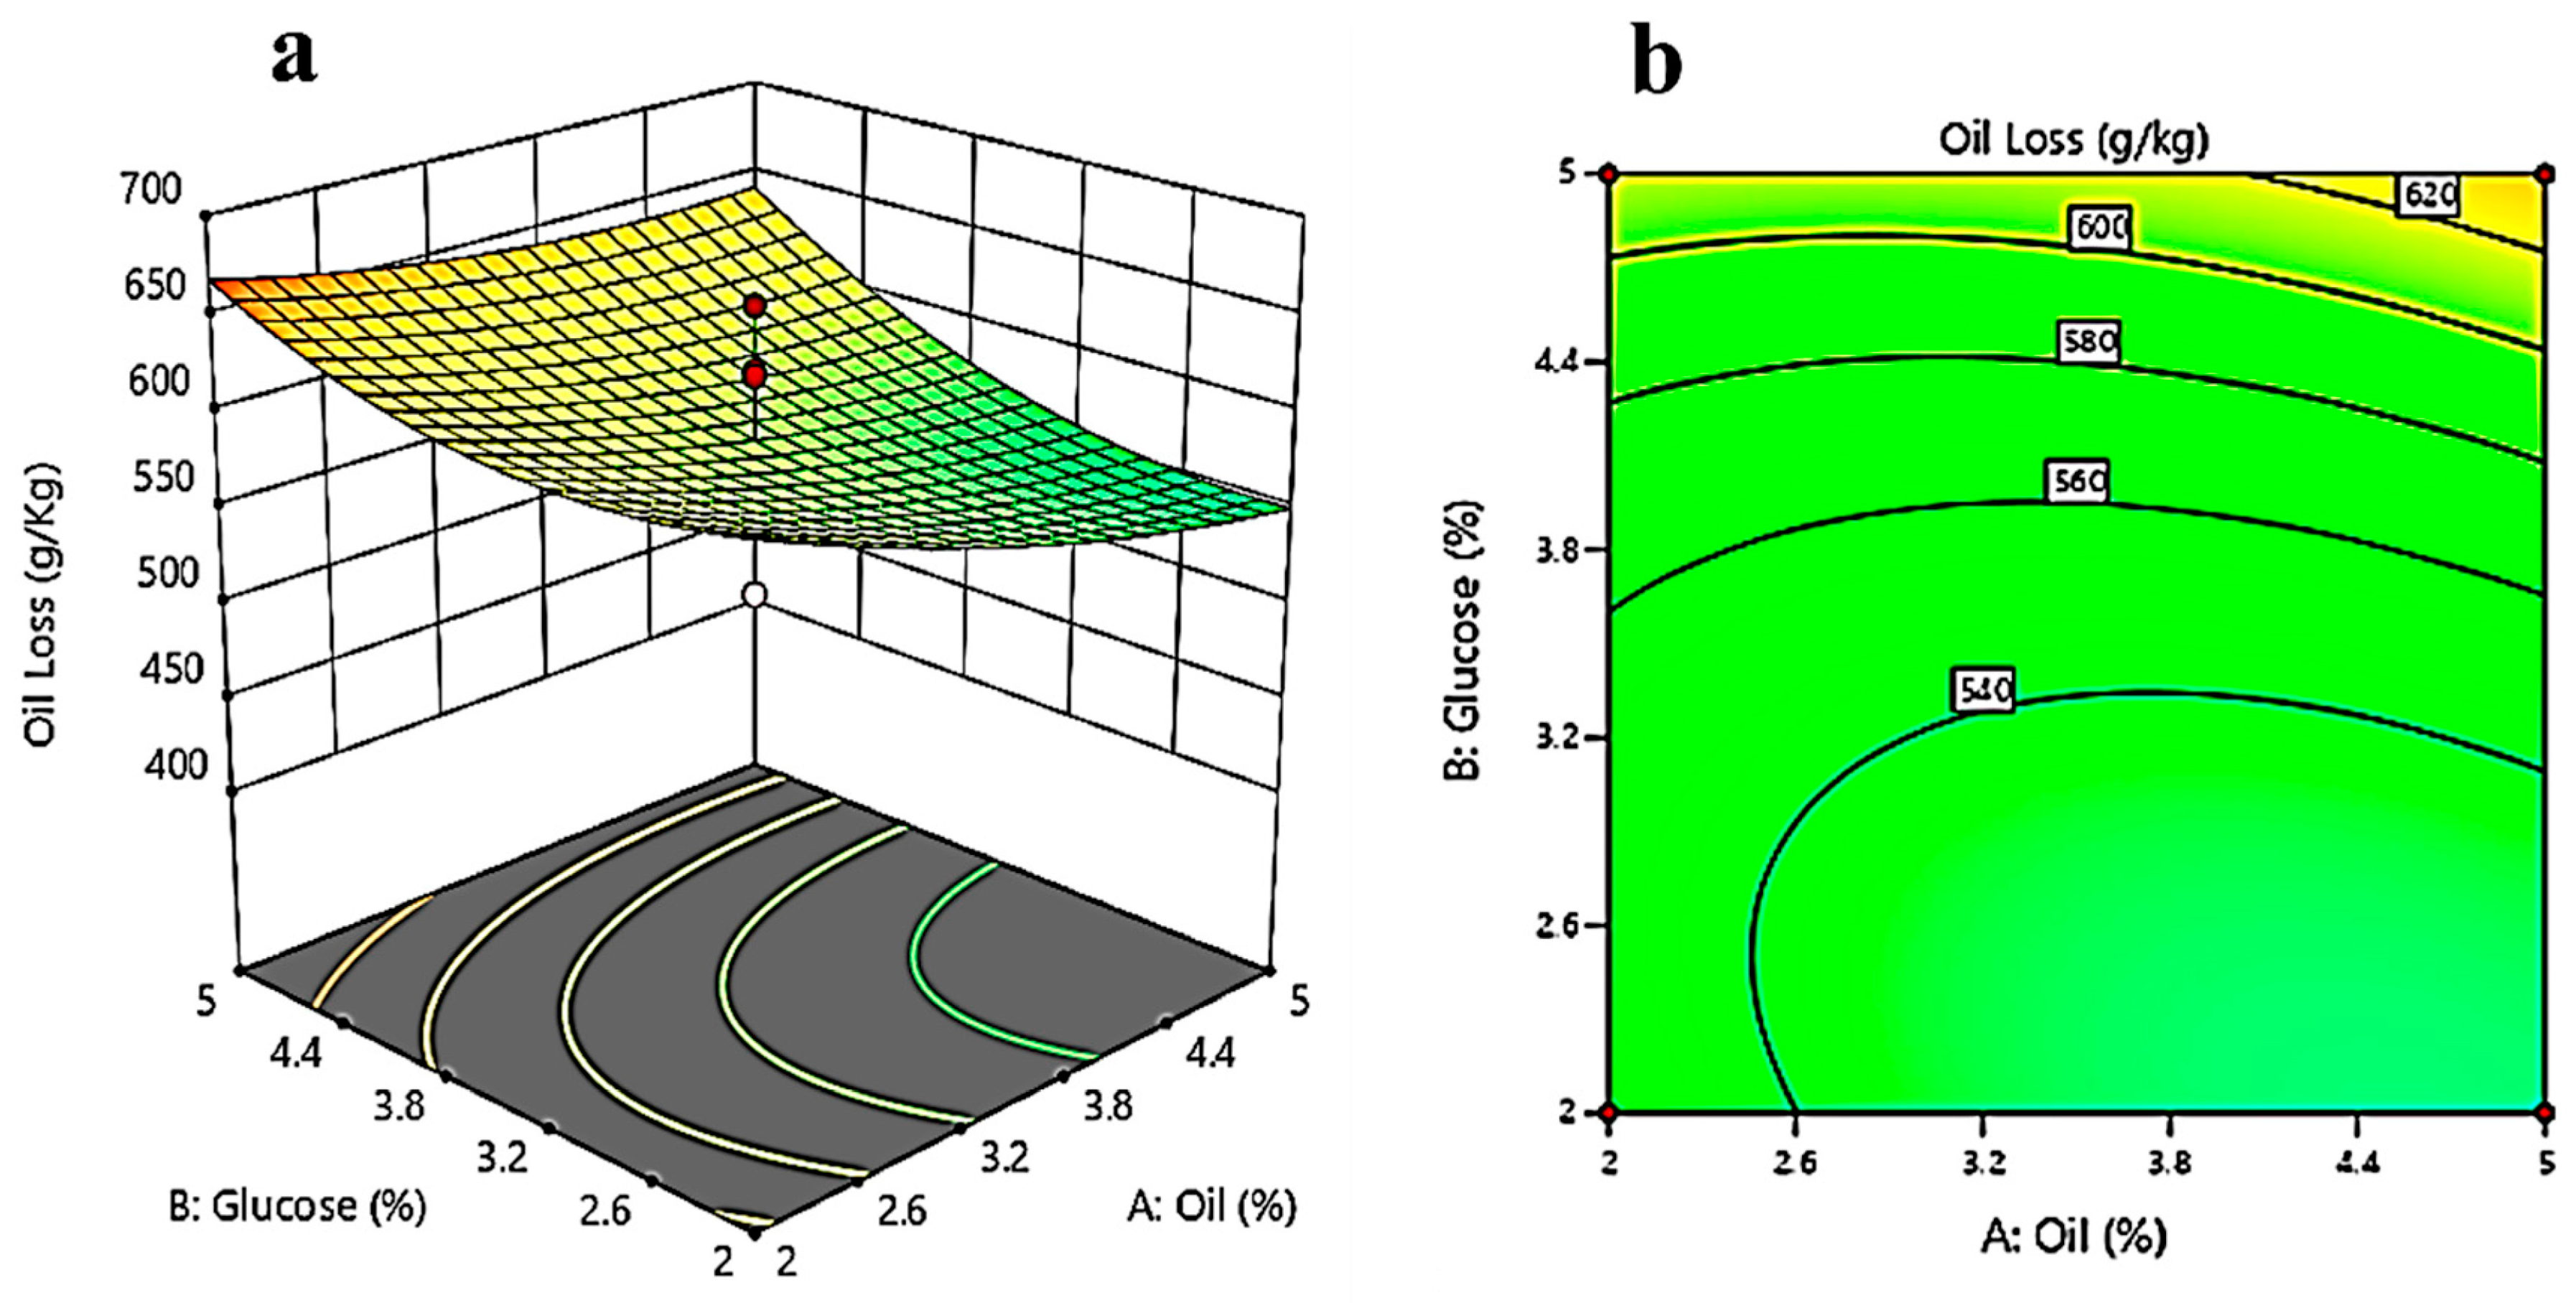
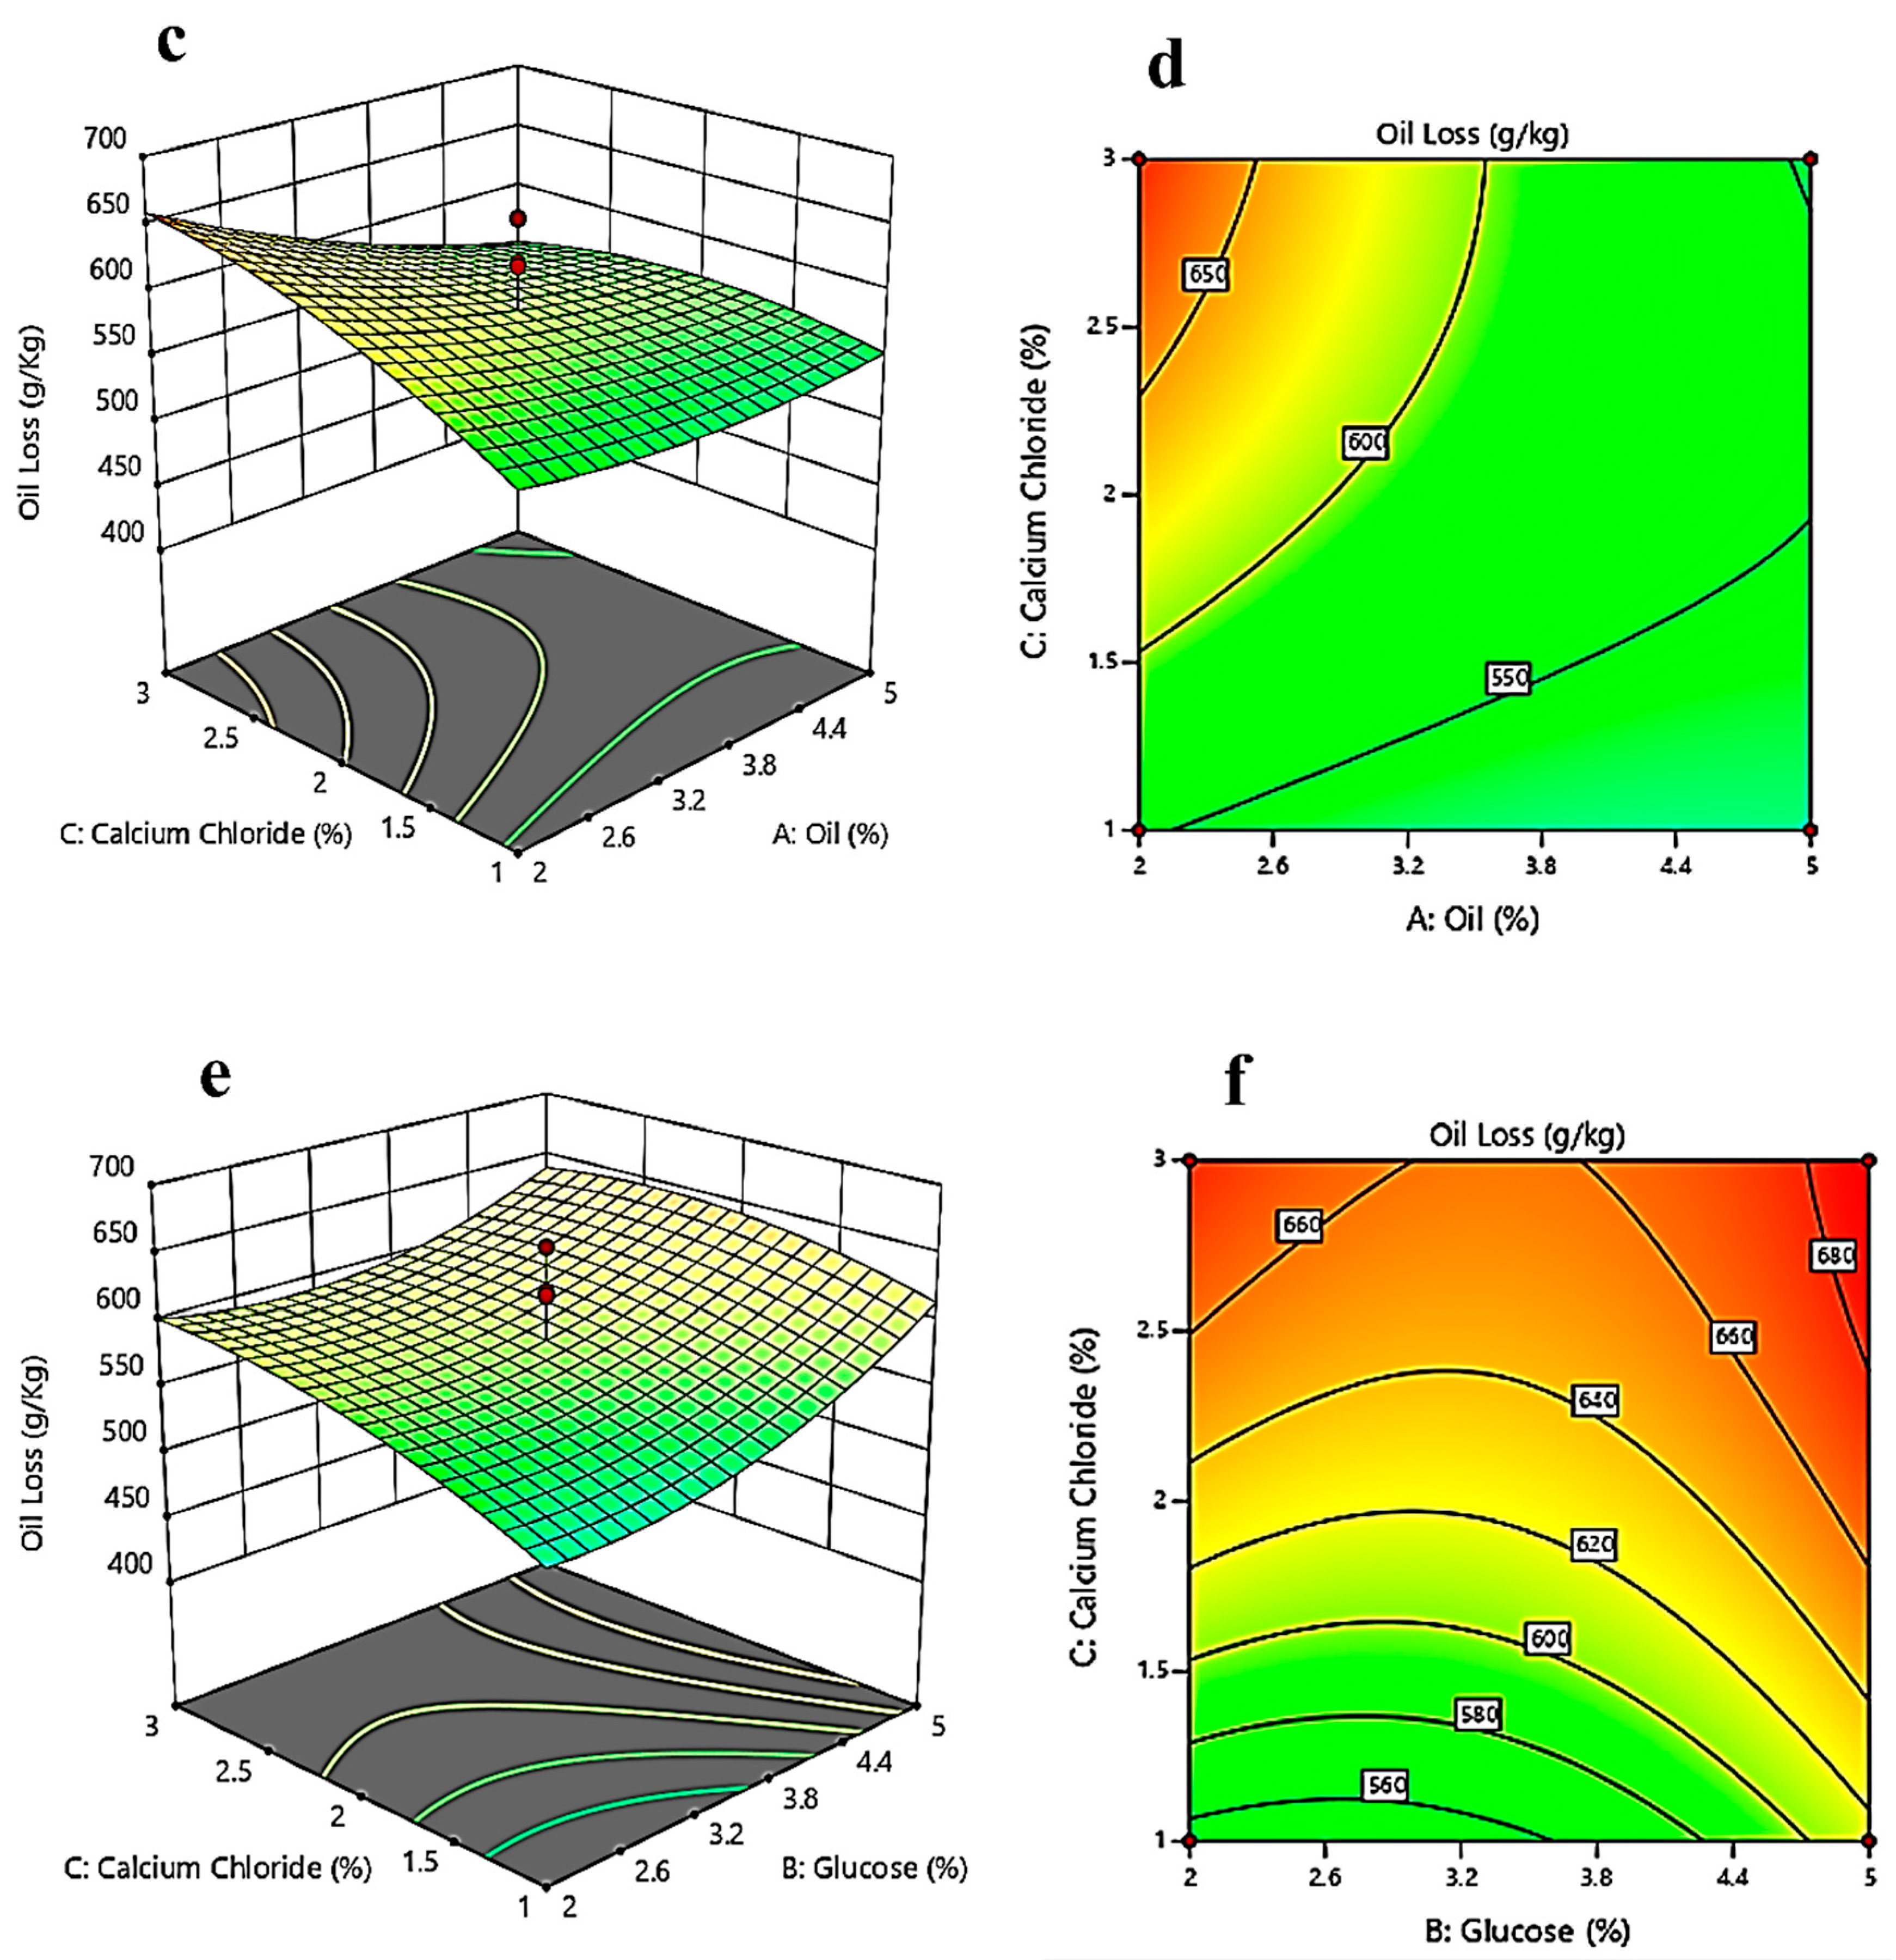
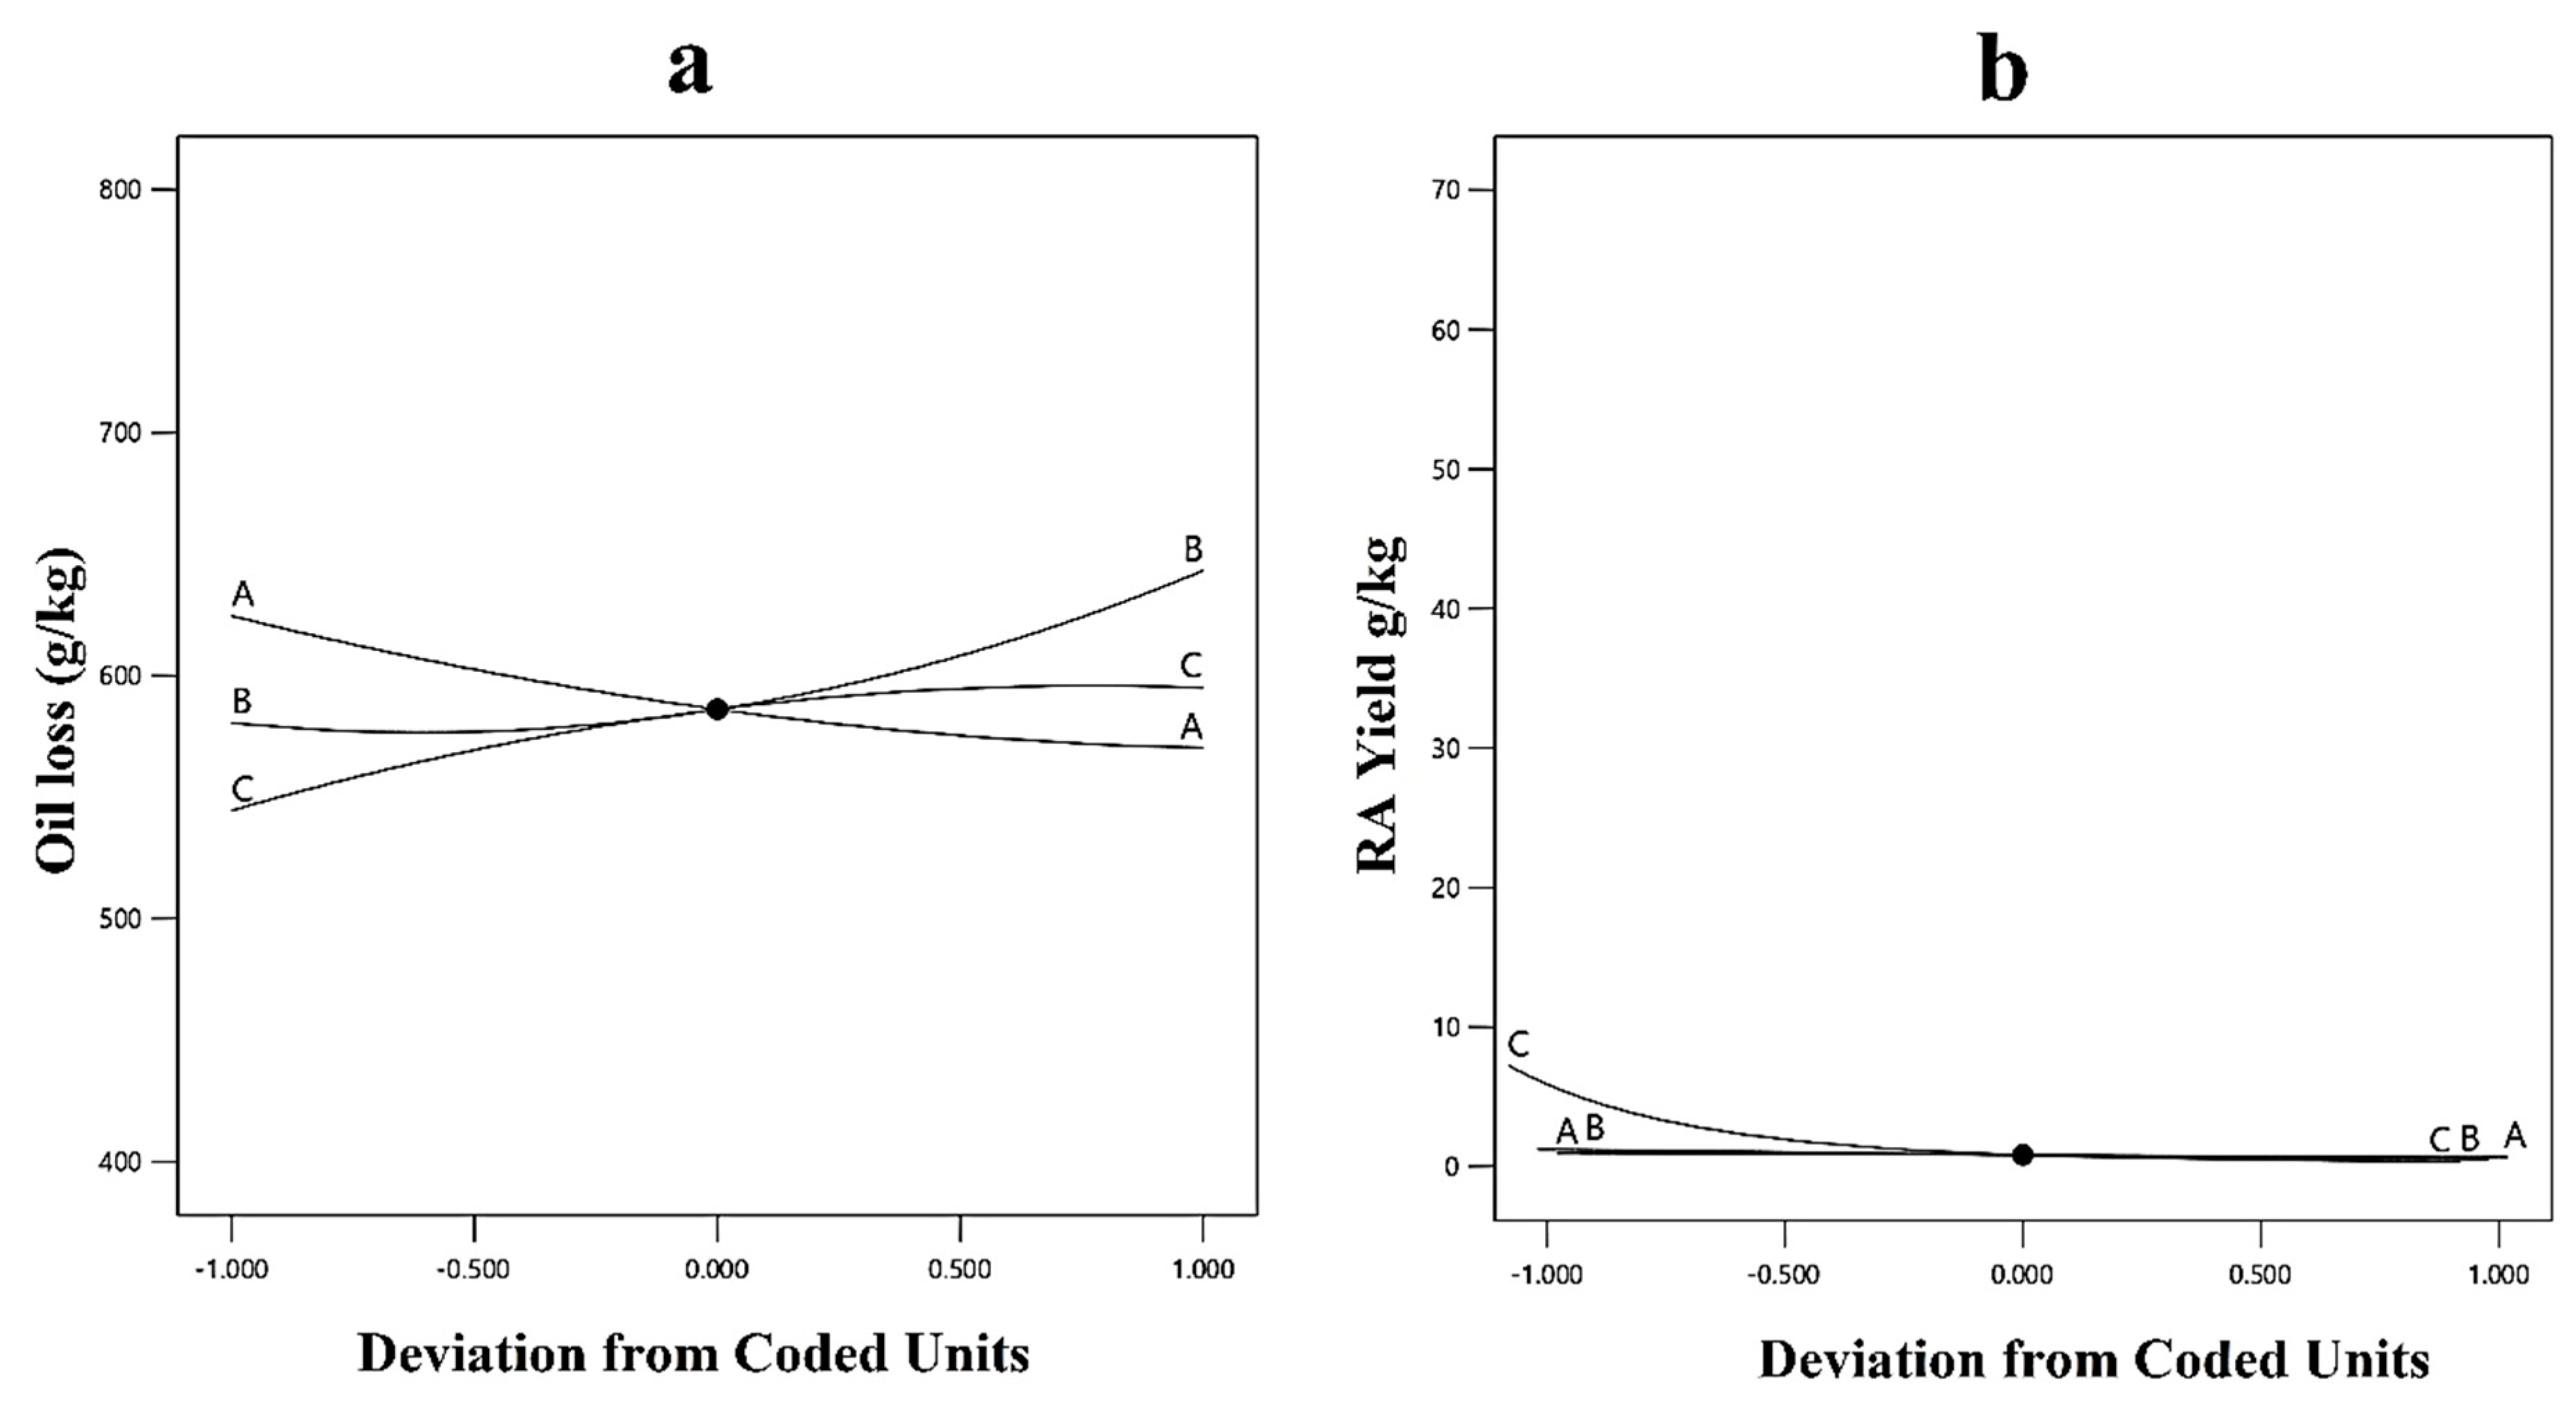
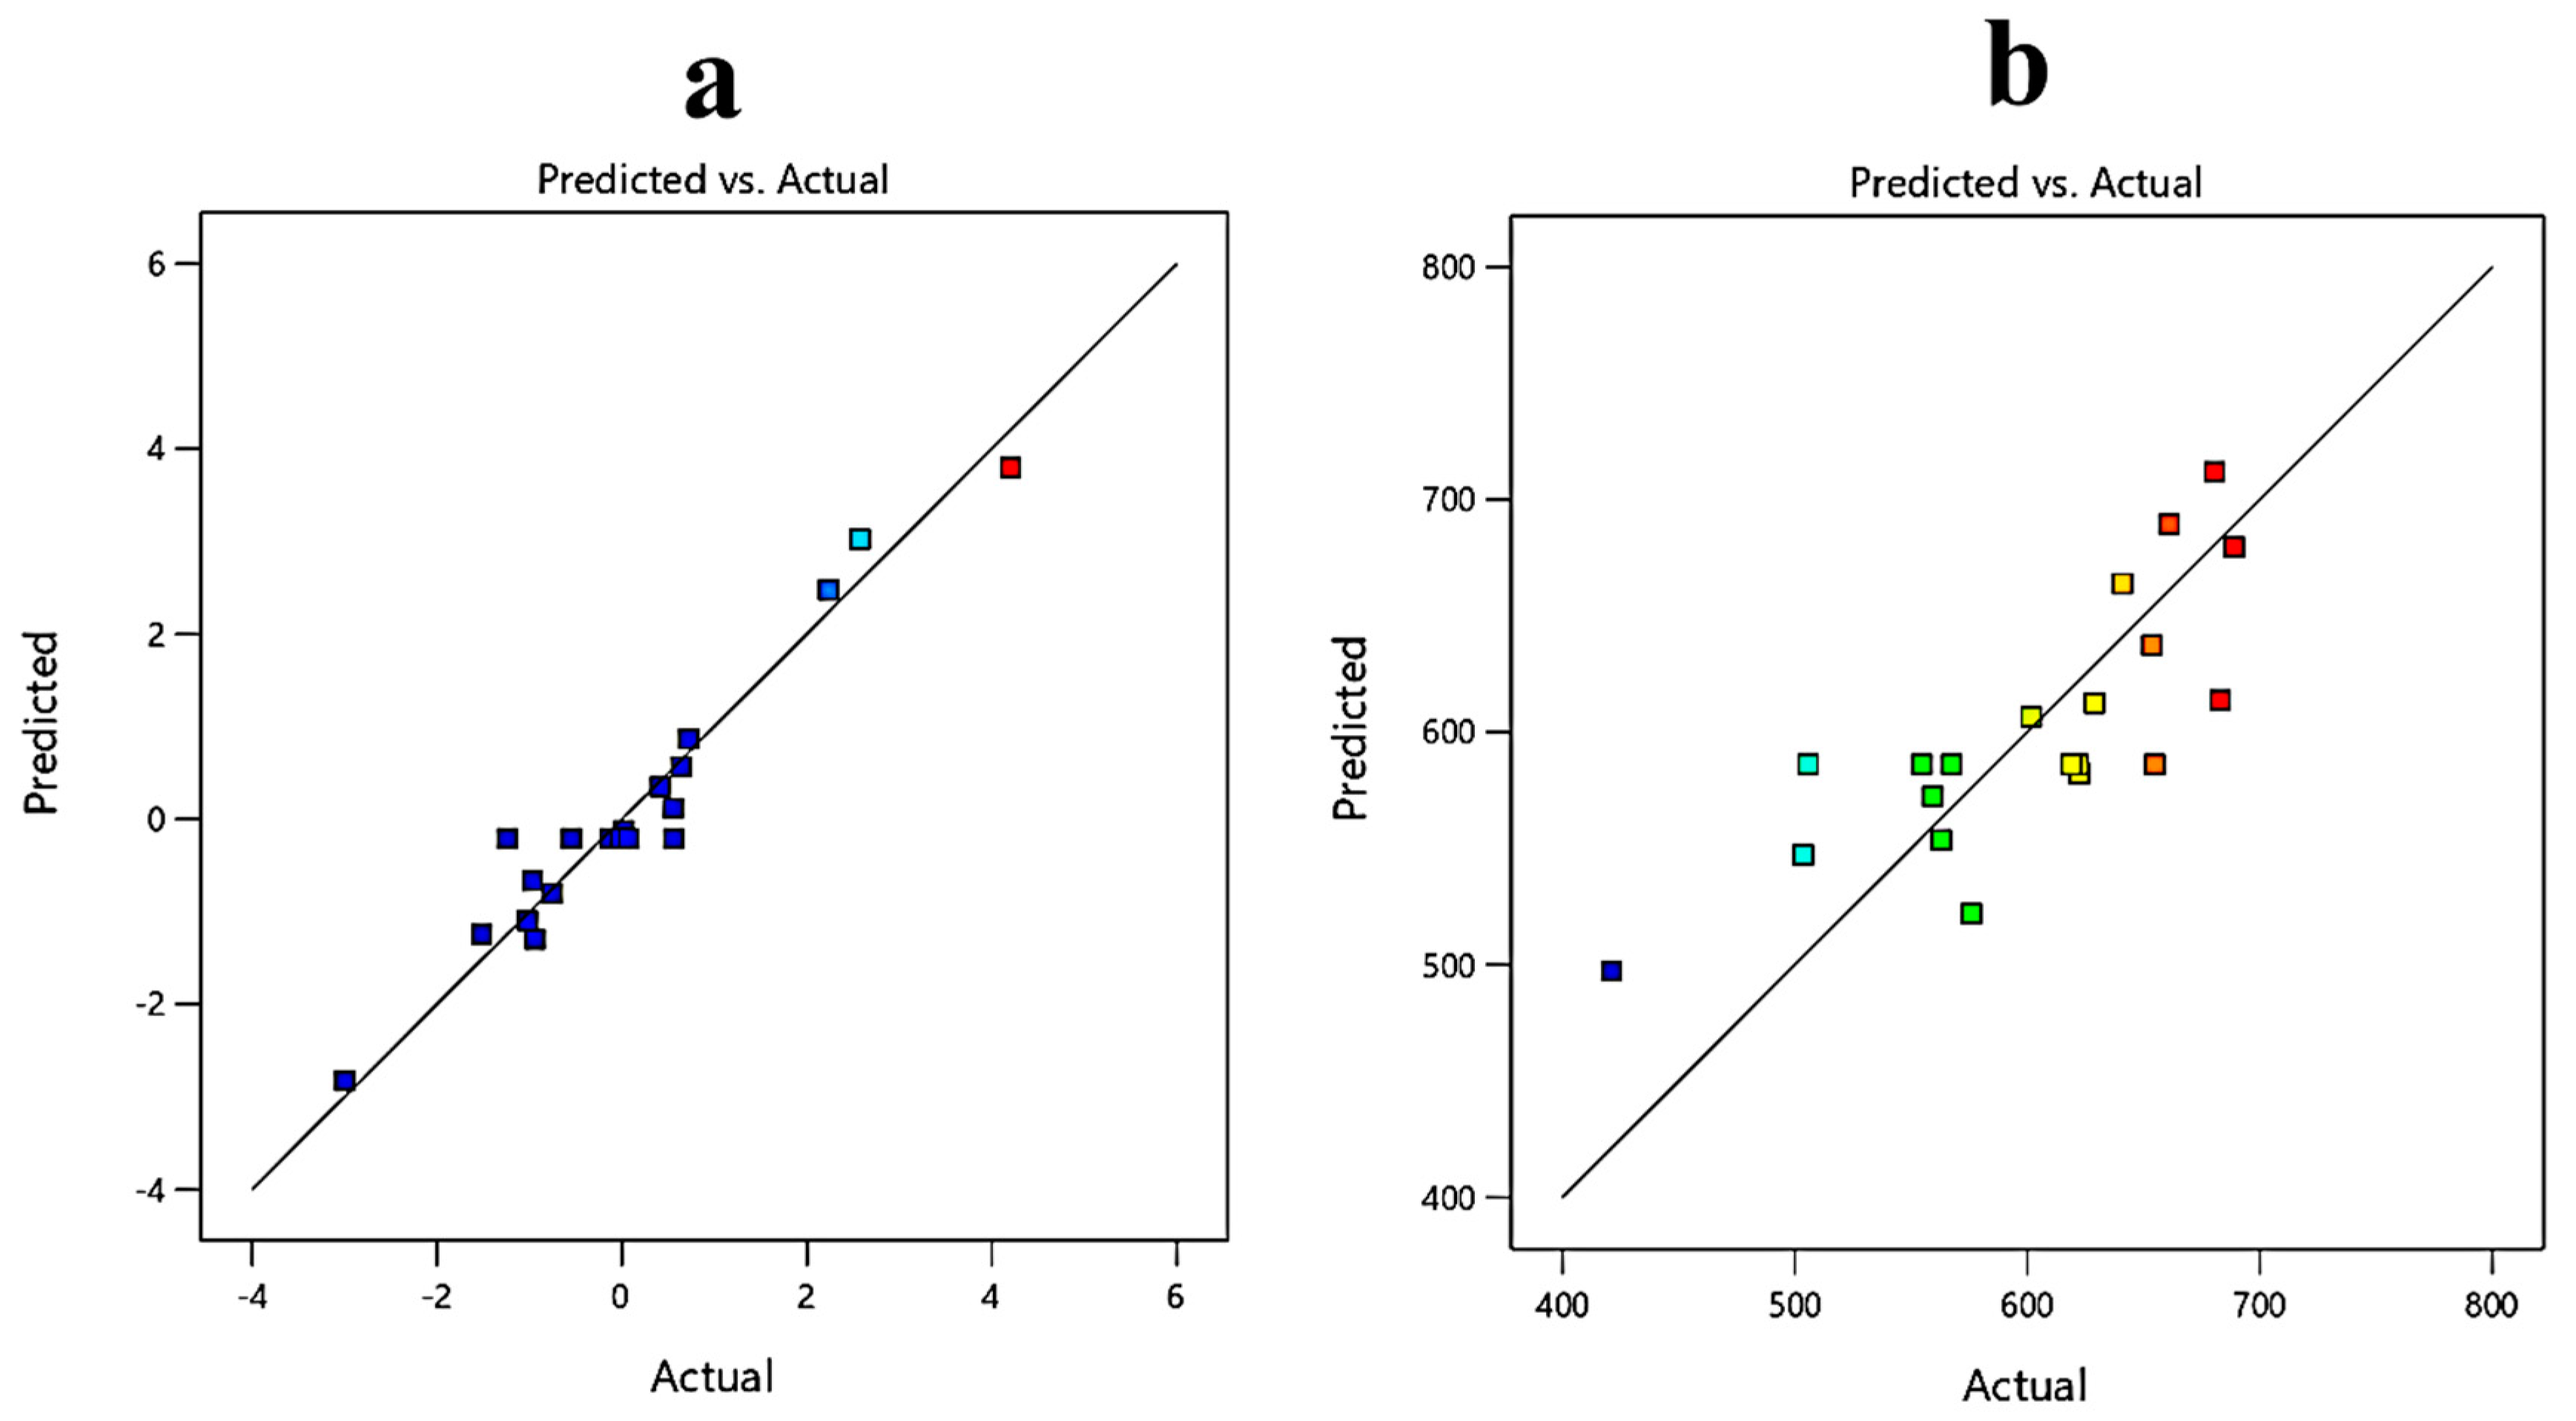
3.3. Response Surface Methodology

The optimal values were determined using CCD, and the results from the experiments were fed into the Design-Expert® tool v.12, which generated a CCD matrix with axial, factorial, and central points. Table 2 shows the statistical combination of the independent variables and both the responses, i.e., ricinoleic acid yield (g/kg), and oil loss (g/kg). The findings obtained after CCD were evaluated using ANOVA since it is the most effective method for determining the significance of the fitted model. Table 3 and Table 4 provide the results for fitting the second-order (quadratic polynomial) response surface model using ANOVA. The model for ricinoleic acid yield (g/kg) is believed to be significant given its F-value of 17.14. The p-value is also less than 0.0001, which suggests that the regression model is highly significant. The determination coefficient evaluates the model’s quality of fit. In this instance, the R2 value is 0.9391 (which is closer to unity). This suggests that model fitting is accurate, and the effect of the independent variable could be easily explained through the second-order surface model. To get a high level of significance for the model, the value of the Adjusted R2 (adjusted determination coefficient = 0.88431) is likewise high [40,41]. While the model fit for oil loss (g/kg) was found to be less significant. The model has a low F-value, which was 1.79. The model has an R2 value of 0.6166 and an adjusted R2 value of 0.2715.
The regression equation is the outcome of the implementation of RSM [38]. It represents an important correlation between the test variables and the outcome. The regression equation obtained for each response is given in Equations (3) and (4).
R A   Y i e l d = 0.210125 0.232525   x 1 0.429973   x 2 1.49826   x 3 0.0227039   x 1 2 0.0573243   x 2 2 + 0.525661   x 3 2 + 0.212459   x 1 x 2 + 0.784333   x 1 x 3 0.367931   x 2   x 3
O i l   l o s s = 586.144 27.1695   x 1 + 31.2971   x 2 + 25.2676   x 3 + 11.3259   x 1 2 + 25.8488   x 2 2 16.3768   x 3 2 + 13.85   x 1 x 2 25.15   x 1 x 3 12.55   x 2   x 3
The p-values (Table 5) are used to determine the importance of each coefficient. The higher the significance of the coefficients, the lesser the p-value [42,43]. The values in Table 5 indicate that the linear main effect of the concentration of oil (0.1408), and glucose concentration (0.0143) is more significant than the second-order main effect of the concentration of oil (0.8757), and glucose concentration (0.06939), respectively, in the case of ricinoleic acid yield. Both the linear main effect of calcium chloride concentration (<0.0001) and the second-order main effect of calcium chloride concentration (0.0040) are more significant in the case of the yield of ricinoleic acid. The calcium ions, when present in the media, eliminate the free fatty acid and enable the lipase to reach the emulsified lipids, thereby increasing the yield of ricinoleic acid [29]. The linear main effect of the concentration of calcium chloride (0.1462), the concentration of oil (0.1211), and glucose concentration (0.0796) are also more significant than the second-order main effect of calcium chloride concentration (0.3189), the concentration of oil (0.4848), and the glucose concentration (0.1288), respectively, in the case of oil loss. In the presence of the carbon source, the microorganism consumes less oil [25]. This indirectly affects the yield of ricinoleic acid as well. That is why the effect of glucose concentration is more significant than other test variables in the oil loss. However, all coefficients, whether the linear main effect, the quadratic effect, or the interaction effect, were less significant as the p > 0.05. Thus, the equation cannot be used to predict oil loss.
The contour plots used in graphs to represent regression equations assess the relationships between independent variables and how they affect the respective responses. Contour plots might be in the form of saddle points, elliptical mounds, or rising ridges [44].
Response surface and contour plots show a relationship between two independent variables at a time while holding the other independent variables constant. Contour plots and response surface graphs were produced from the analysis of the experimental data from the CCD. Figure 4a depicts the interaction between oil concentration (%) and glucose concentration (%) while keeping the calcium chloride concentration (%) constant. The contour plot represented in Figure 4b gives an estimate that, while keeping the calcium chloride concentration constant, the ricinoleic acid yield will be higher at lower glucose (2%) and oil concentrations (2%). Figure 4c gives an idea about the interaction between oil concentration (%) and calcium chloride concentration (%) while keeping glucose concentration (%) constant. The contour plot (Figure 4d) marks a clear optimum response at lower calcium chloride concentrations (1–1.5%) and lower oil concentrations (2%), where the yield will be higher. Figure 4e is the response surface plot between glucose and calcium chloride concentrations while keeping oil concentration constant. After the analysis of Figure 4f, it can be said that at lower calcium chloride concentrations (1–1.5%) and lower glucose concentrations (2%), the yield will be higher.
Figure 5a evaluates the effect of glucose and oil concentrations while keeping the concentration of calcium chloride constant on the oil loss. It shows that with increasing glucose concentration, oil loss first decreases up to a certain extent and then increases. Figure 5b is the contour plot, and it gives the optimum values of glucose (2–2.5%) and oil concentration (2%). The response surface plot in Figure 5c evaluates the effect of the concentration of oil and calcium chloride at a constant value of glucose concentration. The contour plot (Figure 5d) shows that at the optimized concentrations of calcium chloride (1–1.5%) and oil concentration (2%), the oil loss will be less. While keeping oil concentration constant, Figure 5e gives a response surface plot between glucose concentration and calcium chloride concentration. As per the response surface plot, with decreasing calcium chloride concentration, oil loss decreases; with increasing glucose concentration, oil loss decreases up to a certain extent (3–3.5%); and then, by further increasing the glucose concentration, the oil loss increases.
Figure 5f depicts a stronger interaction than the rest of the contour plots in the case of oil loss. The optimum values for calcium chloride (1–1.5%) and glucose concentration (2%) can also be observed in the figures.
The interaction is also explained using perturbation plots when one variable deviates from the preferred reference while keeping the other components fixed at the specified zero values. As a result, the perturbation plots show how the factorial level varies from the corrected reference point of every variable.
From Figure 6, it can be deduced that the variables concentration of oil (A), glucose concentration (B), and the concentration of calcium chloride (C) are the driving factors in the case of the ricinoleic acid yield. The three variables are shown to have less effect on the other response, i.e., the loss of the oil.
The residuals are shown against the design’s ordering of runs in the residual vs. run plot. If the plot’s points are scattered randomly, the experiment’s test sequence is not having any impact. If a pattern or trend emerges, this suggests that the experiment may be being impacted by a time-related variable and should be rectified by randomization. As the points are scattered randomly (Figure 7) for the test sequence in both responses, the test sequence has no effect.
The effect of the model is displayed and contrasted with the null model in a predicted versus actual graph. The points should be around the fitting line, with little confidence bands, for a good fit. From Figure 8, it can be concluded that the model was a good fit for the ricinoleic acid yield response and not for the oil loss.
Although many studies were performed to enhance the production of ricinoleic acid [30,45,46], all the studies reported the overall hydrolysis rate, which is based on the acid value of the oil. Due to the hydrolysis, fatty acids get released, thereby increasing the acidity (or acid value) of the oil. The acid value of the oil is determined by titration. The oil sample is titrated against a standard alkali solution (either sodium hydroxide or potassium hydroxide). The acid value of oil will be contributed by all the fatty acids present in the oil. The studies do not report the exact amount of ricinoleic acid produced. The present study reports the exact amount of ricinoleic acid produced. The oil loss taking place in the overall process, i.e., during the extraction and due to the consumption by the organism, has also not been reported in the studies. The oil loss during the process has been considered for the calculation of ricinoleic acid yield in the present study. Efforts have also been made to minimize the loss and increase the yield of ricinoleic acid.

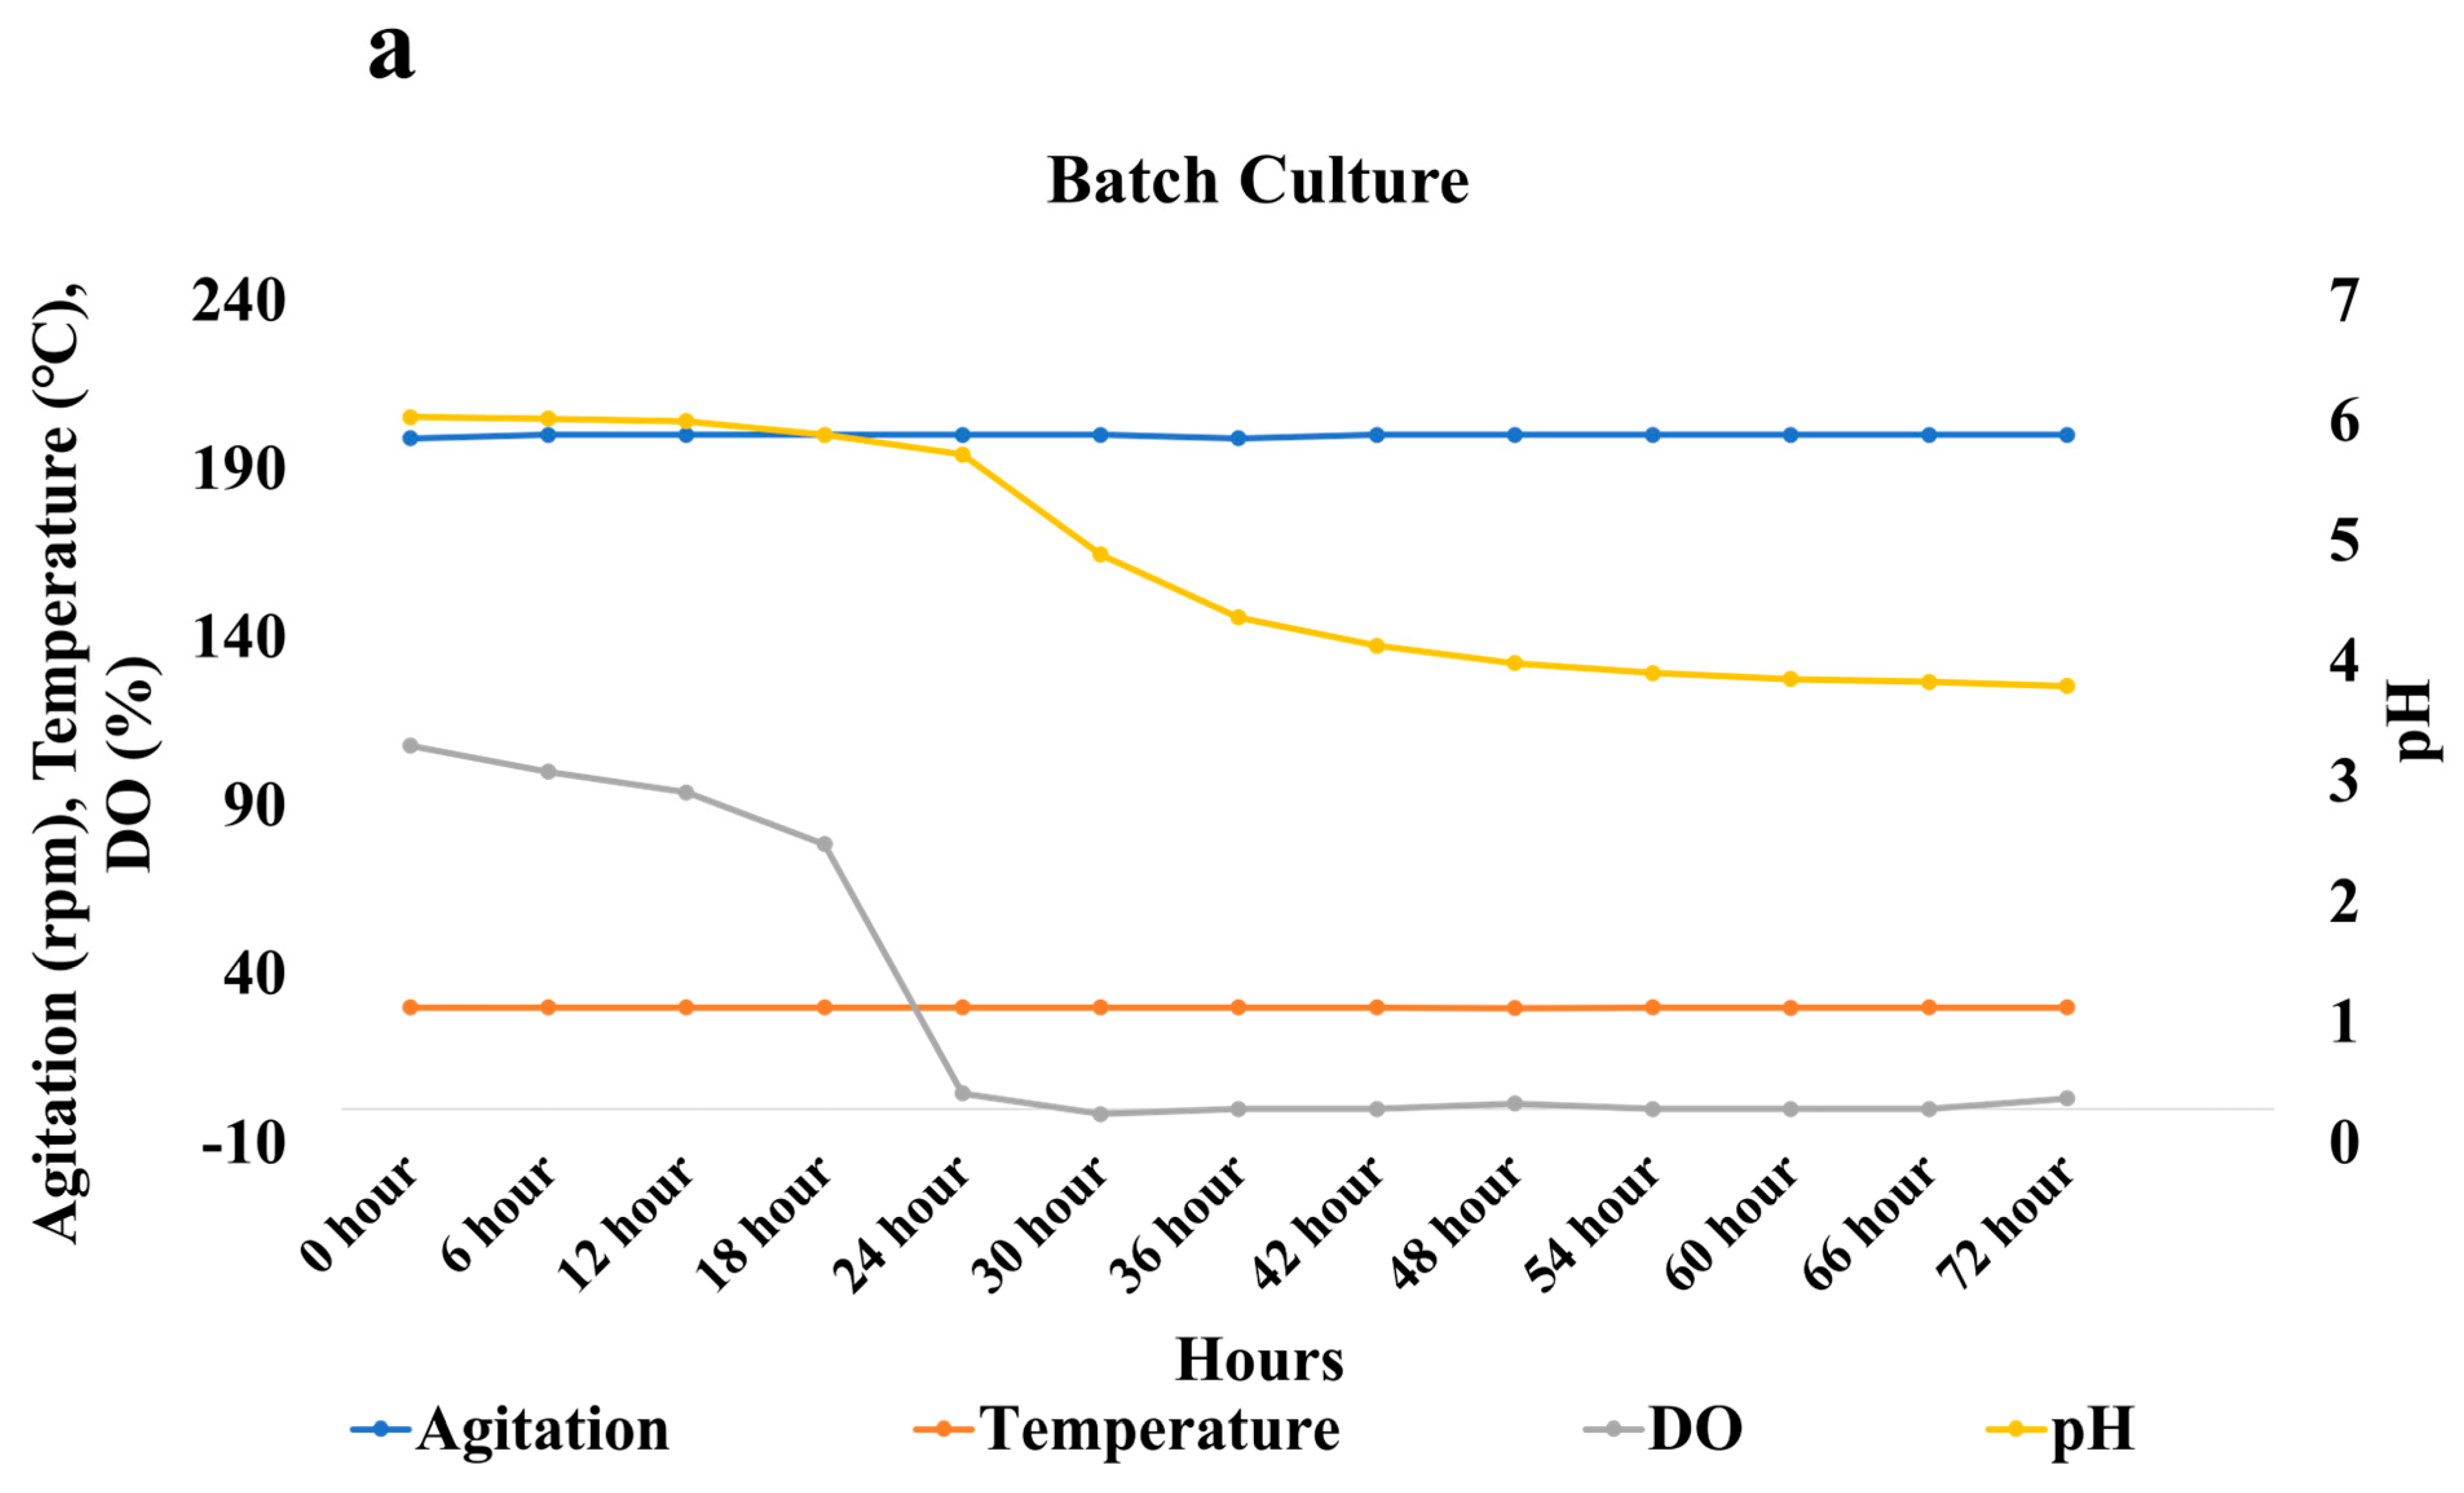
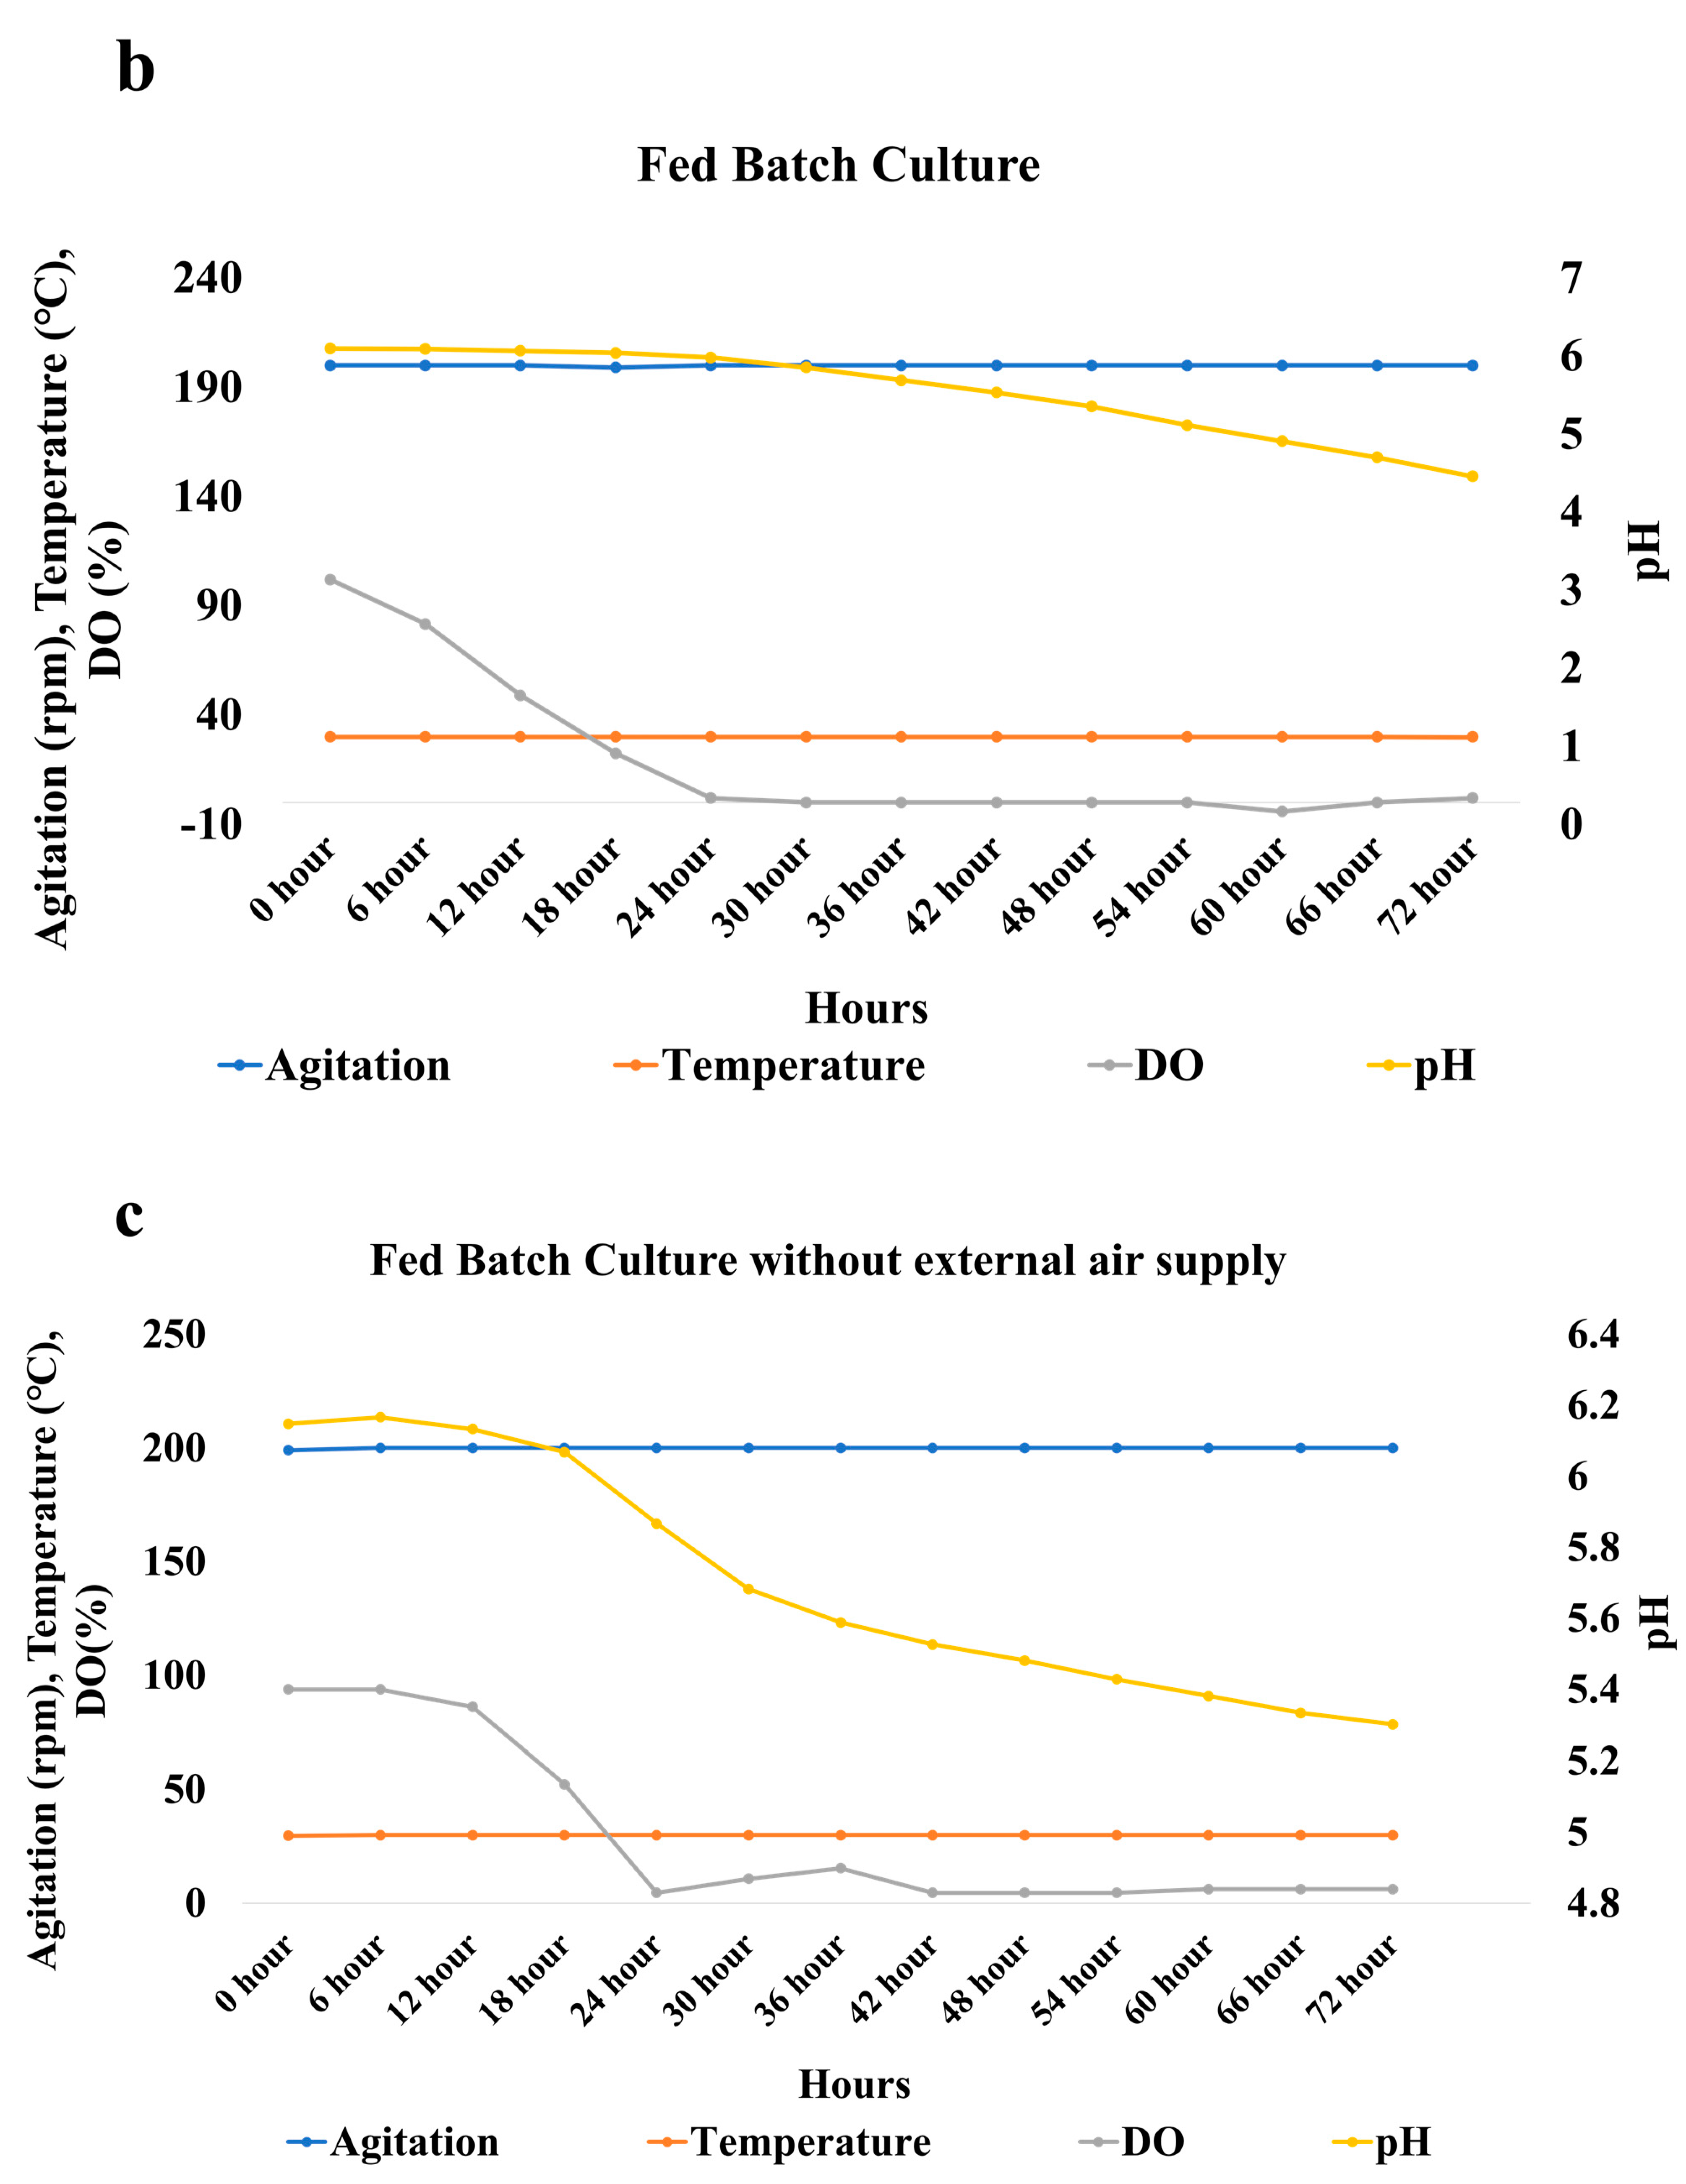
3.4. Bench Scale Fermentation in the Optimized Conditions

One batch and two fed-batch studies were conducted in different conditions in the bioreactor. Agitation rate, aeration rate, pH, Dissolved Oxygen (DO), and temperature were monitored continuously over time in batch as well as fed-batch cultures. The oil phase was recovered after 72 h and analyzed using the conditions mentioned earlier in this study. Temperature and agitation rate were maintained constant throughout the batch culture. The aeration rate was first set at 1.5 L per minute. After 48 h the aeration rate was changed to 2 L per minute, which was maintained till the completion of the batch culture. The pH of the media went down from 6.01 to 5.7 at the end of 24 h (Figure 9a). There was a sudden drop in the pH from 5.7 to 3.9 between 24 and 48 h. Between 48 and 72 h, there was a gradual drop in pH from 3.9 to 3.7. There was also a drastic decrease in dissolved oxygen from 0 to 24 h due to the accumulation of biomass. The DO cannot be increased even after increasing the aeration rate. The ricinoleic acid yield obtained after 72 h in the batch study was 21.6 g/ kg of total oil (Figure 10). The oil loss observed in the batch culture was 485.7 g/kg.
The conditions in the fed-batch were similar to those of the batch culture. The castor oil was fed at regular intervals in the fed-batch culture. The drop in pH was observed after 30 h in the case of the fed-batch culture (Figure 9b). The pH gradually decreases from 6 to 4.4 from 30 to 72 h. The decrease in DO was drastic within the first 24 h of the study. The ricinoleic acid yield obtained in this case was 16.7 g/kg of total oil. The oil loss observed was 365 g/kg (Figure 10). The oil loss was less compared with that of the batch culture. The yield was lower in the case of the fed-batch culture in comparison to that of the batch study. The possible reason could be the drop in the pH. Around 2% of the oil was added after 48 h, and the pH after 48 h was less than 5. The lower pH resulted in lower enzymatic activity, thereby resulting in a decreased yield of ricinoleic acid.
Another fed-batch study was conducted in similar conditions as that of the fed-batch mentioned above. The only difference was that the external air supply was not connected to the reactor. The fungus can only utilize the air present in the headspace of the reactor. The pH in this set-up gradually decreased to 5.2 during the 72 h. The DO drastically decreased during the first 24 h (Figure 9c). The yield of the ricinoleic acid obtained in this condition was 46.77 g/kg of total oil. The oil loss observed was 127.17 g/kg of oil. The yield was highest in the absence of an external oxygen supply in comparison to the other two setups (Figure 10). The oil loss was also the least in this setup. The possible reason for the higher yield could be the smaller drop in the pH. Due to the oxygen-limiting conditions, the oil utilization rate of the fungus was lower. Due to this, the oil loss in this setup was very low. Thus, the fed-batch technique demonstrated during this study provides a way to increase the product yield and reduce oil loss. The picture of the bioreactor in which biotransformation was carried out is given in Figure 11.
Goswami et al. have studied the synthesis of ricinoleic acid from castor oil, but they have optimized the temperature, pH, and buffer conditions [30]. Bench-scale studies of the synthesis of ricinoleic acid from castor via A. flavus are scarce. The yield and concentration of ricinoleic acid have also not been determined in these studies. Optimization of parameters for minimizing oil loss has also not been reported in the literature studies.

4. Conclusions

Locally isolated and molecular biologically characterized Aspergillus flavus BU22S has been used in the present study. The yield of ricinoleic acid and the dry cell weight of the fungus become constant at the end of the 7 days. A fully cross CCD and Design-Expert® tool v.12 was utilized for the numerical optimization of response surface modeling of independent variables such as concentration of oil (% w/v), glucose concentration (% w/v), and calcium chloride concentration (% w/v). The outcome of this study suggests that independent variables have a significant effect on the yield of ricinoleic acid, while the variables were less significant for the oil loss response. A quadratic polynomial equation was better fitted to speculate on the outcomes/response. With the help of this prediction model, the optimized values for all the independent variables were also defined. According to the model, in order to maximize the yield of ricinoleic acid and minimize oil loss, the concentrations of oil, glucose, and calcium chloride should be lowered. The linear main effect and the quadratic main effects of the calcium chloride concentration were significant for higher ricinoleic acid yield (p-value is <0.0001). There was a significant interaction between the variables-glucose concentration and calcium chloride concentration for the response to oil loss. The optimized conditions from RSM were upscaled up to a working volume of 1 L in a 2-L bioreactor. The batch and fed-batch studies were conducted under optimized conditions. The yield of the ricinoleic acid was higher in the fed-batch culture in the absence of an external oxygen supply. The yield was 46.77 g/kg of total oil. The oil loss was also reduced in this setup. The oil loss observed in this case was 127 g/kg of oil. The batch and fed-batch cultures with an airflow of 1.5 L per min for the first 48 h followed by 2 L per min for the next 72 h have a comparatively lower yield and more oil loss. The batch has 36% more oil loss, and the fed-batch with airflow has 24% more oil loss in comparison to the fed-batch with no external air supply. The pure ricinoleic acid is of great industrial significance. The reports on calculating the yield and concentration of ricinoleic acid considering the oil loss from castor oil are hardly any. The efforts for reducing the oil loss and thereby increasing the yield of the RA have been made in this study. There still lies the scope for the betterment of the overall process. The yield of RA still needs to be improved. The molecular mechanism by which calcium affects the production of ricinoleic acid and other optimization conditions still needs to be determined.

Author Contributions

S.S. (Shikha Singh): Conceptualization; Formal analysis; Investigation; Methodology; Validation; Visualization; Writing—original draft, Writing—review & editing. S.S. (Sumit Sharma): Formal analysis, Writing—review & editing. S.J.S.: Conceptualization, Formal analysis, Writing—review & editing, Funding acquisition, Supervision. S.K.B.: Formal analysis, Writing—review & editing, Supervision. All authors have read and agreed to the published version of the manuscript.

Funding

This project was funded by Bennett University, Greater Noida through its Ph.D. program.

Institutional Review Board Statement

Not applicable.

Informed Consent Statement

Not applicable.

Data Availability Statement

All data generated or analyzed during this study are included in this article.

Conflicts of Interest

The authors declare no conflict of interest.

References

  1. Singh, S.; Sharma, S.; Sarma, S.J.; Brar, S.K. A Comprehensive Review of Castor Oil-Derived Renewable and Sustainable Industrial Products. Environ. Prog. Sustain. Energy 2022, 42, e14008. [Google Scholar] [CrossRef]
  2. Hoon, J.; Hee, S.; Yeub, I.; Byung, J.; Han, S.; Lee, H.; Park, C.; Yeol, E. Preparation of 11-Hexyloxy-9-Undecenoic Acid from Crude Castor Oil Hydrolysates by Recombinant Escherichia Coli Expressing Alcohol Dehydrogenase and Baeyer–Villiger Monooxygenase. Process Biochem. 2016, 51, 362–368. [Google Scholar] [CrossRef]
  3. Heilig, M.L. United States Patent Office. ACM SIGGRAPH Comput. Graph. 1994, 28, 131–134. [Google Scholar] [CrossRef]
  4. Patel, V.R.; Dumancas, G.G.; Viswanath, L.C.K.; Maples, R.; Subong, B.J.J. Castor Oil: Properties, Uses, and Optimization of Processing Parameters in Commercial Production. Lipid Insights 2016, 9, LPI-S40233. [Google Scholar] [CrossRef] [Green Version]
  5. Mubofu, E.B. Castor Oil as a Potential Renewable Resource for the Production of Functional Materials. Sustain. Chem. Process. 2016, 4, 11. [Google Scholar] [CrossRef] [Green Version]
  6. Mutlu, H.; Meier, M.A.R. Castor Oil as a Renewable Resource for the Chemical Industry. Eur. J. Lipid Sci. Technol. 2010, 112, 10–30. [Google Scholar] [CrossRef]
  7. Hablot, E.; Zheng, D.; Bouquey, M.; Ave, L. Polyurethanes Based on Castor Oil: Kinetics, Chemical, Mechanical and Thermal Properties. Macromol. Mater. Eng. 2002, 293, 922–929. [Google Scholar] [CrossRef]
  8. Naughton, F. Castor Oil. In Kirk-Othmer Encyclopedia of Chemical Technology; John Wiley & Sons, Inc.: Hoboken, NJ, USA, 2000; pp. 1–20. [Google Scholar]
  9. Kunduru, K.R.; Basu, A.; Zada, M.H.; Domb, A.J. Castor Oil Based Biodegradable Polyesters. Biomacromolecules 2015, 16, 2572. [Google Scholar] [CrossRef]
  10. Verma, K.K.; Kendurkar, P.S.; Tewari, N.; Prasad, R.N. Physico-Chemical Characteristics of Some Castorbean (Ricinus Communis L.) Varieties, Hybrids and Genotypes. Indian J. Agric. Biochem. 2007, 20, 43–45. [Google Scholar]
  11. Guimarães, A.; Venâncio, A. The Potential of Fatty Acids and Their Derivatives as Antifungal Agents: A Review. Toxins 2022, 14, 188. [Google Scholar] [CrossRef]
  12. Naik, S.N.; Saxena, D.K.; Dole, B.R.; Khare, S.K. Chapter 21—Potential and Perspective of Castor Biorefinery. In Waste Biorefinery; Elsevier: Amsterdam, The Netherlands, 2018; pp. 623–656. [Google Scholar] [CrossRef]
  13. Bloom, P.; Lee, I.; Reimers, P. Method for the Production of Fatty Acids Having a Low Trans-Fatty Acid Content. U.S. Patent No. 7,126,019, 24 October 2006. [Google Scholar]
  14. Sonntag, N.O.V. Fat Splitting. J. Am. Oil Chem. Soc. 1979, 56, 729A–732A. [Google Scholar] [CrossRef]
  15. Goswami, D.; Basu, J.K.; De, S. Ipase Applications in Oil Hydrolysis with a Case Study on Castor Oil: A Review. Crit. Rev. Biotechnol. 2013, 33, 81–96. [Google Scholar] [CrossRef] [PubMed]
  16. Majid, S.A.; Hossain, A. Study on the Hydrolysis of Fats and Oils by Twitchell Reagent. Bangladesh J. Sci. Ind. Res. 1976, 44–50. [Google Scholar]
  17. Avelar, M.H.M.; Cassimiro, D.M.J.; Santos, K.C.; Domingues, R.C.C.; de Castro, H.F.; Mendes, A.A. Hydrolysis of Vegetable Oils Catalyzed by Lipase Extract Powder from Dormant Castor Bean Seeds. Ind. Crops Prod. 2013, 44, 452–458. [Google Scholar] [CrossRef]
  18. Goswami, D.; Basu, J.K.; De, S. Optimization of Process Variables in Castor Oil Hydrolysis by Candida Rugosa Lipase with Buffer as Dispersion Medium. Biotechnol. Bioprocess Eng. 2009, 14, 220–224. [Google Scholar] [CrossRef]
  19. Edwinoliver, N.G.; Thirunavukarasu, K.; Purushothaman, S.; Rose, C.; Gowthaman, M.K.; Kamini, N.R. Corn Steep Liquor as a Nutrition Adjunct for the Production of Aspergillus Niger Lipase and Hydrolysis of Oils Thereof. J. Agric. food Chem. 2009, 57, 10658–10663. [Google Scholar] [CrossRef]
  20. Dheeman, D.S.; Antony-Babu, S.; Frías, J.M.; Henehan, G.T.M. Purification and Characterization of an Extracellular Lipase from a Novel StrainPurification and Characterization of an Extracellular Lipase from a Novel Strain Penicillium sp. DS-39 (DSM 23773). J. Mol. Catal. B Enzym. 2011, 72, 256–262. [Google Scholar] [CrossRef]
  21. Sarada, R.; Joseph, R. Purification and Properties of Lipase from the Anaerobepropionibacterium Acidi-Propionici. J. Am. Oil Chem. Soc. 1992, 69, 974–977. [Google Scholar] [CrossRef]
  22. Syed, M.N.; Iqbal, S.; Bano, S.; Khan, A.B.; Ali-ul-, S. Purification and Characterization of 60 KD Lipase Linked with Chaperonin from Pseudomonas Aeruginosa BN-1. Afr. J. Biotechnol. 2010, 9, 7724–7732. [Google Scholar] [CrossRef]
  23. Ozcan, H.M.; Sagiroglu, A. Production of Ricinoleic Acid from Castor Oil by Immobilised Lipases. Prep. Biochem. Biotechnol. 2009, 39, 170–182. [Google Scholar] [CrossRef]
  24. Er-zheng, S.; Zhou, Y.; You, P.; Dong-zhi, W. Lipases in the Castor Bean Seed of Chinese Varieties: Activity Comparison, Purification and Characterization. J. Shanghai Univ. 2010, 14, 137–144. [Google Scholar] [CrossRef]
  25. Singh, S.; Sharma, S.; Sarma, S.J.; Brar, S.K. Molecular Characterization of a New Strain of Aspergillus and Ricinoleic Acid Production from Castor Oil by the Fungus. Environ. Prog. Sustain. Energy 2023, Unpublished. [Google Scholar]
  26. Toscano, L.; Montero, G.; Stoytcheva, M.; Gochev, V.; Cervantes, L.; Campbell, H.; Zlatev, R.; Valdez, B.; Pérez, C.; Gil-Samaniego, M. Lipase Production through Solid-State Fermentation Using Agro-Industrial Residues as Substrates and Newly Isolated Fungal Strains. Biotechnol. Biotechnol. Equip. 2013, 27, 4074–4077. [Google Scholar] [CrossRef] [Green Version]
  27. Negedu, A.; Ameh, J.; Umoh, V.; Atawodi, S. Lipolytic Activity Of Some Fungal Species On Castor Oil. Afr. J. Food Agric. Nutr. Dev. 2012, 12, 6686–6699. [Google Scholar]
  28. Rathod, V.K.; Pandit, A.B. Effect of Various Additives on Enzymatic Hydrolysis of Castor Oil. Biochem. Eng. J. 2009, 47, 93–99. [Google Scholar] [CrossRef]
  29. Hu, M.; Li, Y.; Decker, E.A.; McClements, D.J. Role of Calcium and Calcium-Binding Agents on the Lipase Digestibility of Emulsified Lipids Using an in Vitro Digestion Model. Food Hydrocoll. 2010, 24, 719–725. [Google Scholar] [CrossRef]
  30. Goswami, D.; Sen, R.; Basu, J.K.; De, S. Maximization of Bioconversion of Castor Oil into Ricinoleic Acid by Response Surface Methodology. Bioresour. Technol. 2009, 100, 4067–4073. [Google Scholar] [CrossRef]
  31. Barrak, N.; Mannai, R.; Zaidi, M.; Kechida, M.; Helal, A.N.; Barrak, N.; Mannai, R.; Zaidi, M.; Kechida, M.; Helal, A.N. Experimental Design Approach with Response Surface Methodology for Removal of Indigo Dye by Electrocoagulation. J. Geosci. Environ. Prot. 2016, 4, 50–61. [Google Scholar] [CrossRef] [Green Version]
  32. Fatoba, O.S.; Akanji, O.L.; Aasa, A.S.; Fatoba, O.S.; Akanji, O.L.; Aasa, A.S. Optimization of Carburized UNS G10170 Steel Process Parameters Using Taguchi Approach and Response Surface Model (RSM). J. Miner. Mater. Charact. Eng. 2014, 2, 566–578. [Google Scholar] [CrossRef] [Green Version]
  33. Sen, R.; Babu, K.S. Modeling and Optimization of the Process Conditions for Biomass Production and Sporulation of a Probiotic Culture. Process Biochem. 2005, 40, 2531–2538. [Google Scholar] [CrossRef]
  34. Namal Senanayake, S.P.J.; Shahidi, F. Lipase-Catalyzed Incorporation of Docosahexaenoic Acid (DHA) into Borage Oil: Optimization Using Response Surface Methodology. Food Chem. 2002, 77, 115–123. [Google Scholar] [CrossRef]
  35. Shieh, C.-J.; Liao, H.-F.; Lee, C.-C. Optimization of Lipase-Catalyzed Biodiesel by Response Surface Methodology. Bioresour. Technol. 2003, 88, 103–106. [Google Scholar] [CrossRef] [PubMed]
  36. Carter-House, D.; E Stajich, J.; Unruh, S.; Kurbessoian, T. Fungal CTAB DNA Extraction. Protocols.io 2020. [Google Scholar] [CrossRef]
  37. Nargesi, S.; Abastabar, M.; Valadan, R.; Mayahi, S.; Youn, J.H.; Hedayati, M.T.; Seyedmousavi, S. Differentiation of Aspergillus Flavus from Aspergillus Oryzae Targeting the Cyp51A Gene. Pathogens 2021, 10, 1279. [Google Scholar] [CrossRef]
  38. Mehmood, T.; Ahmed, A.; Ahmad, A.; Ahmad, M.S.; Sandhu, M.A. Optimization of Mixed Surfactants-Based β-Carotene Nanoemulsions Using Response Surface Methodology: An Ultrasonic Homogenization Approach. Food Chem. 2018, 253, 179–184. [Google Scholar] [CrossRef]
  39. Bódalo-Santoyo, A.; Bastida-Rodríguez, J.; Máximo-Martín, M.F.; Montiel-Morte, M.C.; Murcia-Almagro, M.D. Enzymatic Biosynthesis of Ricinoleic Acid Estolides. Biochem. Eng. J. 2005, 26, 155–158. [Google Scholar] [CrossRef]
  40. Joyce, R.M. Experiment Optimization in Chemistry and Chemical Engineering, S. Akhnazarova and V. Kafarov, Mir Publishers, Moscow and Chicago, 1982, 312 Pp. Price: $9.95. J. Polym. Sci. Polym. Lett. Ed. 1984, 22, 372. [Google Scholar] [CrossRef]
  41. Khuri, A.I.; Cornell, J.A. Response Surfaces Designs and Analyses; CRC Press: Boca Raton, FL, USA, 2019. [Google Scholar] [CrossRef]
  42. Box, G.E.P.; Hunter, J.S.; Hunter, W.G. Statistics Experimenters; John Wiley & Sons: Hoboken, NJ, USA, 2009; pp. 1–655. [Google Scholar]
  43. Box, G.E.P.; Wilson, K.B. On the Experimental Attainment of Optimum Conditions. J. R. Stat. Soc. Ser. B 1951, 13, 1–38. [Google Scholar] [CrossRef]
  44. Osho, M.; Popoola, T.; Adeleye, T.; Adetunji, C. Response Surface Methodology for Optimal Immobilization of Aspergillus Niger ATCC 1015 Lipase by Adsorption Method. Int. J. Biol. Res. 2016, 4, 56. [Google Scholar] [CrossRef] [Green Version]
  45. Sun, S.; Guo, J. Enhanced Ricinoleic Acid Preparation Using Lipozyme TLIM as a Novel Biocatalyst: Optimized by Response Surface Methodology. Catalysts 2018, 8, 486. [Google Scholar] [CrossRef] [Green Version]
  46. Bhattacharjee, D.; Goswami, D. Surfactant Assisted Production of Ricinoleic Acid Using Cross-Linked and Entrapped Porcine Pancreas Lipase. J. Dispers. Sci. Technol. 2021, 42, 947–955. [Google Scholar] [CrossRef]
Figure 1. Chemical structure of Ricinoleic Acid.
Fermentation 09 00318 g001
Figure 2. Pictures representing (a) Aspergillus flavus BU22S pellets formed in the biotransformation media, (b) Aspergillus flavus BU22S spores stained with Methylene Blue.
Fermentation 09 00318 g002
Figure 3. Graph representing ricinoleic acid concentration and yield, along with the Dry Cell Weight of the A. flavus BU22S with time.
Fermentation 09 00318 g003
Figure 4. Three-dimensional surface optimization of (a) oil (%), and glucose (%); (c) oil (%), and calcium chloride (%); (e) glucose (%), and calcium chloride (%) on the ricinoleic acid yield (g/kg). Contour plots showing the effect of (b) oil (%), and glucose (%); (d) oil (%), and calcium chloride (%); (f) glucose (%), and calcium chloride (%) on the ricinoleic acid yield (g/kg).
Fermentation 09 00318 g004aFermentation 09 00318 g004b
Figure 5. Three-dimensional surface optimization of (a) oil (%), and glucose (%); (c) oil (%), and calcium chloride (%); (e) glucose (%), and calcium chloride (%) on the oil loss (g/kg). Contour plots showing the effect of (b) oil (%), and glucose (%); (d) oil (%), and calcium chloride (%); (f) glucose (%), and calcium chloride (%) on the oil loss (g/kg).
Fermentation 09 00318 g005aFermentation 09 00318 g005b
Figure 6. Interaction plots of three independent variables for (a) oil loss (g/kg); and (b) ricinoleic acid yield (g/kg) where A is the concentration of oil (%), B is glucose concentration (%), and C is the concentration of calcium chloride.
Fermentation 09 00318 g006
Figure 7. Residual v/s Run plots for (a) ricinoleic acid yield diagnostic; (b) oil loss diagnostic.
Fermentation 09 00318 g007
Figure 8. Predicted versus actual plot for (a) ricinoleic acid yield (g/kg); (b) oil loss (g/kg).
Fermentation 09 00318 g008
Figure 9. Graph representing changes in Dissolved Oxygen and pH with time in (a) Batch Culture, (b) Fed-Batch Culture, and (c) Fed-Batch Culture without an external air supply.
Fermentation 09 00318 g009aFermentation 09 00318 g009b
Figure 10. Graph representing ricinoleic acid yield and oil loss observed in batch culture, fed-batch culture, and fed-batch culture without an external air supply.
Fermentation 09 00318 g010
Figure 11. Picture of the bioreactor.
Fermentation 09 00318 g011
Table 1. Degrees of independent (predictor) variables and the range of experiments.
VariablesSymbolsRange and Levels
−α−10+1
Concentration of oil (%)x10.977323.556.02
Glucose concentration (%)x20.977323.556.02
Concentration of calcium chloride (%)x30.31821233.68
Table 2. CCD matrix for predictor (process) variables with output values of ricinoleic acid yield (g/kg), and oil loss (g/kg).
RunIndependent VariablesResponse/Output
x1 (%)x2 (%)x3 (%)RA Yield (g/kg)Oil Loss
(g/kg)
13.53.520.29654.85
23.53.50.3266.85421.14
33.53.520.88621.71
42530.05661
52519.35683
63.53.53.680.22622.28
75211.9576
83.56.0220.36680.57
93.53.521.08567.42
105231.02503.6
113.50.9921.51601.71
125512.06653.6
132230.47689
145530.39628.8
156.023.520.38559.32
160.973.521.74640.81
173.53.520.58618.85
183.53.520.99554.54
1922113.13563
203.53.521.75505.71
Table 3. Analysis of Variance for ricinoleic acid yield (g/kg).
SourceSum of SquaresDegrees of FreedomMean SquareF-Valuep-Value
Model44.5094.9417.14<0.0001
Pure error1.8950.3780
Cor Total47.3919
Standard deviation = 0.5372; Adjusted R2 = 0.8843; R2 = 0.9391.
Table 4. Analysis of Variance for oil loss (g/kg).
SourceSum of SquaresDegrees of FreedomMean SquareF-Valuep-Value
Model56,493.0096277.001.790.1894
Pure error14,867.7352973.55
COR. Total91,624.8919
Standard deviation = 59.27; Adjusted R2 = 0.2715; R2 = 0.6166.
Table 5. Regression coefficients and least square fit for ricinoleic acid yield and oil loss.
FactorsRA Yield (g/kg)Oil Loss (g/kg)
Coefficient EstimateStandard Errorp-ValueCoefficient EstimateStandard Errorp-Value
Intercept−0.21010.2191-586.1424.170.1894
x 1 –Concentration of Oil (%)−0.23250.14540.1408−27.1716.040.1211
x 2 –Glucose Concentration−0.43000.14540.014331.3016.040.0796
x 3 Concentration of Calcium Chloride−1.500.1454<0.000125.2716.040.1462
x 1 x 2 0.21250.18990.289413.8520.960.5236
x 2 x 3 0.78430.18990.0020−25.1520.960.2577
x 1 x 3 −0.36790.18990.0815−12.5520.960.5626
x 1 2 −0.02270.14150.875711.3315.610.4848
x 2 2 −0.05730.14150.693925.8515.610.1288
x 3 2 0.52570.14150.0040−16.3815.610.3189
Disclaimer/Publisher’s Note: The statements, opinions and data contained in all publications are solely those of the individual author(s) and contributor(s) and not of MDPI and/or the editor(s). MDPI and/or the editor(s) disclaim responsibility for any injury to people or property resulting from any ideas, methods, instructions or products referred to in the content.

