Article

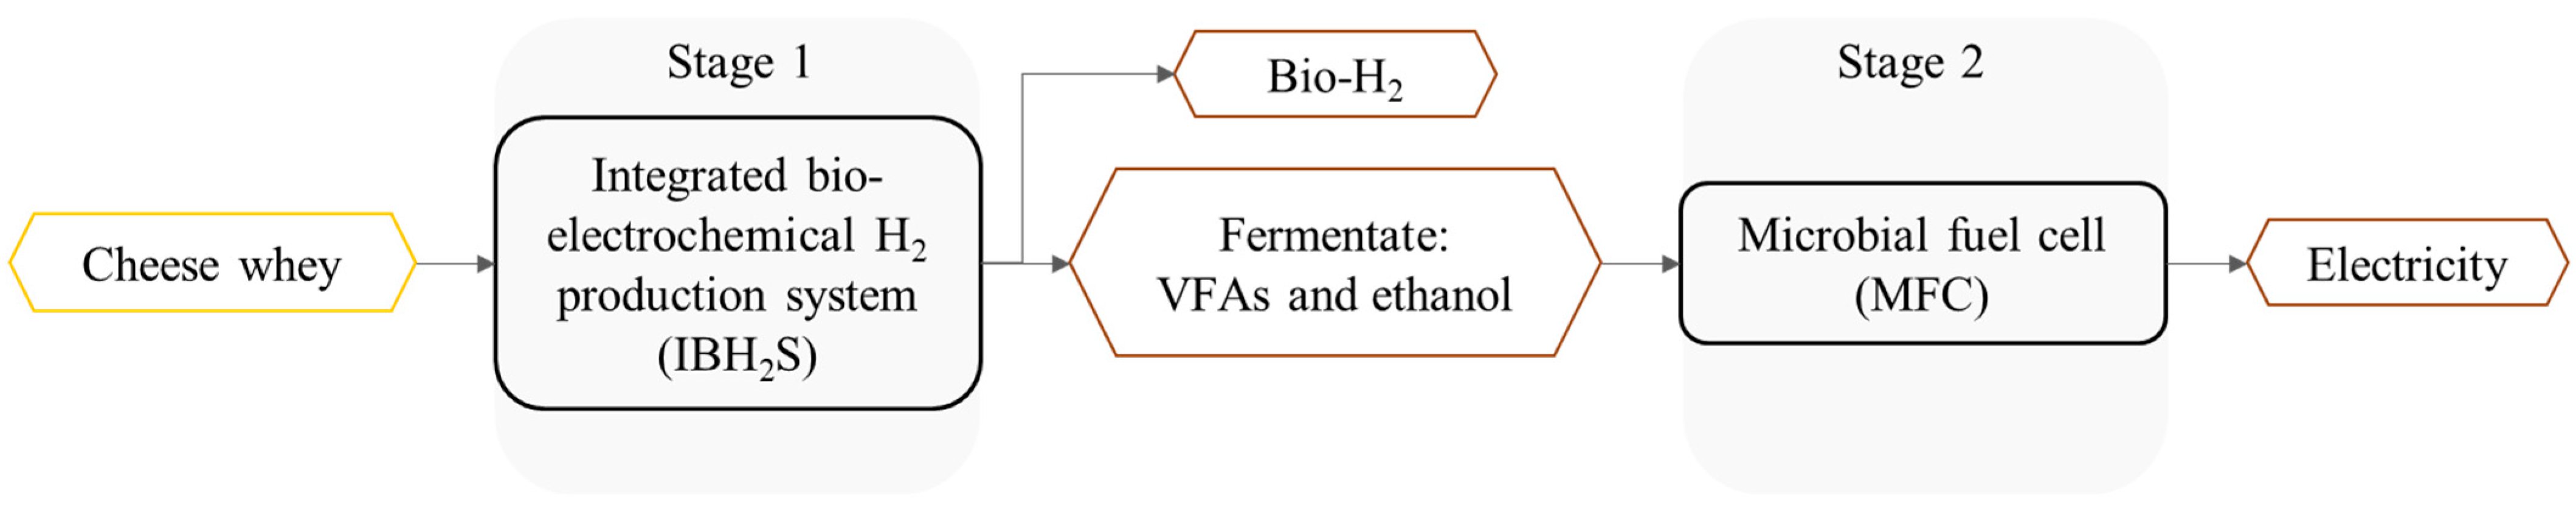
Two-Stage Process for Energy Valorization of Cheese Whey through Bio-Electrochemical Hydrogen Production Coupled with Microbial Fuel Cell

1
Department of Civil and Environmental Engineering, Sapienza University of Rome, 00184 Rome, Italy
2
School of Chemical Engineering, National Technical University of Athens, 15780 Athens, Greece
3
Institute of Chemical Engineering Sciences (ICE-HT), 26504 Patras, Greece
*
Author to whom correspondence should be addressed.
Fermentation 2023, 9(3), 306; https://doi.org/10.3390/fermentation9030306
Submission received: 24 February 2023 / Revised: 17 March 2023 / Accepted: 19 March 2023 / Published: 21 March 2023

Abstract

:
The present work investigates a two-stage process scheme for cheese whey valorization through energy recovery in different forms by means of bio-electrochemical systems. The first stage consisted of an integrated bio-electrochemical process for H2 and electricity production. This combined dark fermentation with an electrochemical system with the aim of overcoming the typical thermodynamic/biochemical limitations of fermentation and enhancing H2 recovery. The second treatment stage involved a single-chamber microbial fuel cell, featuring an innovative configuration consisting of four air cathodes with fly ash as the oxygen reduction catalyst. The bio-electrochemical process performed in the first stage achieved promising results, displaying a three-times higher H2 production yield compared to conventional dark fermentation. In addition, the experiments using the MFC in the second stage were found to successfully exploit the effluent from the first stage, with COD removal yields of 86% ± 8% and energy recovery with a maximum current output of 1.6 mA and a maximum power density of 1.2 W/m3.

1. Introduction

Every year, huge amounts of urban and agro-industrial organic waste are produced worldwide and their potential to be a promising feedstock for biorefineries for the production of biofuels and biomaterials has gained ever-increasing attention [1,2,3,4,5]. Compared to the conventional approach for management of organic waste based on biological stabilization with the production of compost and/or digestate plus biogas, waste biorefineries are aimed at obtaining value-added bio-products that can replace their fossil counterparts. At the same time, the use of waste as a feedstock for biorefineries has the potential to replace the use of crop biomasses, addressing the well-known energy-vs.-food dilemma [6,7,8]. Stemming from this, increasing attention has been paid to the investigation of stand-alone or combined bio-processes aimed at producing high added-value biofuels and/or chemicals from organic waste. Among these processes, dark fermentation (DF) with biochemical H2 generation is widely regarded as a promising option for organic residue valorization, on account of the well-recognized sustainable profile of H2 as an energy carrier [9,10,11,12,13]. Many efforts have been made to increasing the process yield, while attaining stable H2 production [14,15,16,17,18]. A typical feature of DF is, however, that a considerable fraction of the initial organic matter remains in the fermentate in the form of metabolic products, mainly volatile fatty acids (VFAs) and alcohols. Such metabolites thus require further treatment that may be designed for (1) the selective recovery of acids/alcohols or (2) energy recovery [19,20,21,22]. With a view to identify potentially sustainable energy recovery options from the residual fermentate, one interesting alternative is direct electricity recovery from VFAs by electroactive bacteria through the microbial fuel cell (MFC) technology.
MFCs are bio-electrochemical systems for wastewater treatment and simultaneous power generation. This is achieved by the utilization of electrochemically active bacteria in the MFC anode, which oxidize the organic compounds contained in the wastewater [23]. This technology has the unique feature of producing electricity, while treating wastewater at the same time. Compared to anaerobic digestion for biomethane production, this option provides the benefit of avoiding a third stage where an internal combustion engine would generate electricity from biomethane. Since the first evidence, a century ago, of electrically interacting microorganisms with solids [24], a number of processes have been explored to exploit the electrical potential generated by microorganisms using liquid and solid effluents as substrates and different system configurations [25,26].
In order for the MFC technology to be practically implemented, cost-effective systems to treat various types of wastewaters are being assessed. To this end, ceramic cathode assemblies using sustainable catalysts have been examined as a cost-efficient alternative to the use of membrane separators and expensive catalysts such as platinum [27,28]. Ceramic electrodes in MFCs have been reported to provide stable conditions for microorganisms in terms of pH (low pH gradient between anode and cathode) and resistance to biofouling. Moreover, the catalyst of cathode reduction may be deposited on the ceramic material with simple techniques, converting the ceramic separator to a promising cathode electrode, which may even offer structural support to the MFC configuration [29]. Cost–efficient catalysts for oxygen reduction in MFCs have also been studied. One example is activated carbon. which has been reported to perform as well as the more expensive Pt/C catalyst [30]. Additionally, biochar, a product of biomass pyrolysis, has been studied as a cost–efficient catalyst for oxygen reduction. Comparable power density outputs were observed when using a Pt cathode and an activated biochar cathode, implying a great potential of substituting Pt cathodes with biochar materials [31].
MFCs have been successfully used for the treatment of a wide spectrum of wastewaters, producing different amounts of power depending on the configuration and the type of wastewater [32]. In particular, the treatment of DF effluent has been assessed in a variety of MFC configurations, as reported by Bundhoo 2017 and Koók et al., 2021 [19,20]. The VFA content of the DF effluent has been reported to be rapidly (~24 h) and effectively decomposed through MFCs [19,33]. A combination of DF with an MFC has been reported to increase the COD removal efficiency when compared to the single DF process [34]. The use of single-chamber MFCs to treat DF effluents can significantly reduce the cost of the two-stage system, since the incorporation of expensive membrane separators is avoided.
In this framework, this work proposes a two-stage process, combining an integrated bio-electrochemical H2/electricity production system with a single-chamber MFC aimed at maximizing the energy exploitation of industrial organic effluents. In particular, cheese whey (CW), a carbohydrate-rich by-product of the dairy industry, was used as the organic feedstock for the two-stage process. The significant organic content of CW, which varies in the range of 55–117 g COD/L [35], makes it an optimal substrate for biochemical processes aimed at energy recovery. A number of studies have demonstrated the suitability of CW for fermentative H2 production [36,37,38,39,40,41], also thanks to the fact that CW contains an indigenous hydrogen-producing biomass [42] and, therefore, requires no external inoculum addition.
The novelty of this work lies in the proposed configurations for both stages of the process: in the first stage, the DF is coupled with an electrochemical method to enhance H2 production, while the second stage involves a single chamber four-air-cathode MFC, with fly ash as the oxygen reduction catalyst.

2. Materials and Methods

The applied process for CW treatment was based on the integration of different biological and electrochemical systems to maximize energy recovery in the form of H2 and electricity. The process layout was arranged in two in-series process stages (Figure 1), one aimed at the bio-electrochemical conversion of CW into H2, organic acids, and electricity (integrated bio-electrochemical H2 production system, IBH2S), and the second one adopting an MFC to degrade the fermentate constituents and generate electricity. In particular, Stage 1 consisted of a DF biological compartment coupled with a galvanic cell to enhance the bio-electrochemical generation of H2 from CW, while generating at the same time electricity from the displaced electrons. Stage 2 made use of an aerobically operated MFC that produces electricity as a result of bio-electrochemically-mediated oxidation of the organic components of the effluent from Stage 1. A more detailed description of the characteristics of the two systems and the associated operating conditions is provided in the following sections.

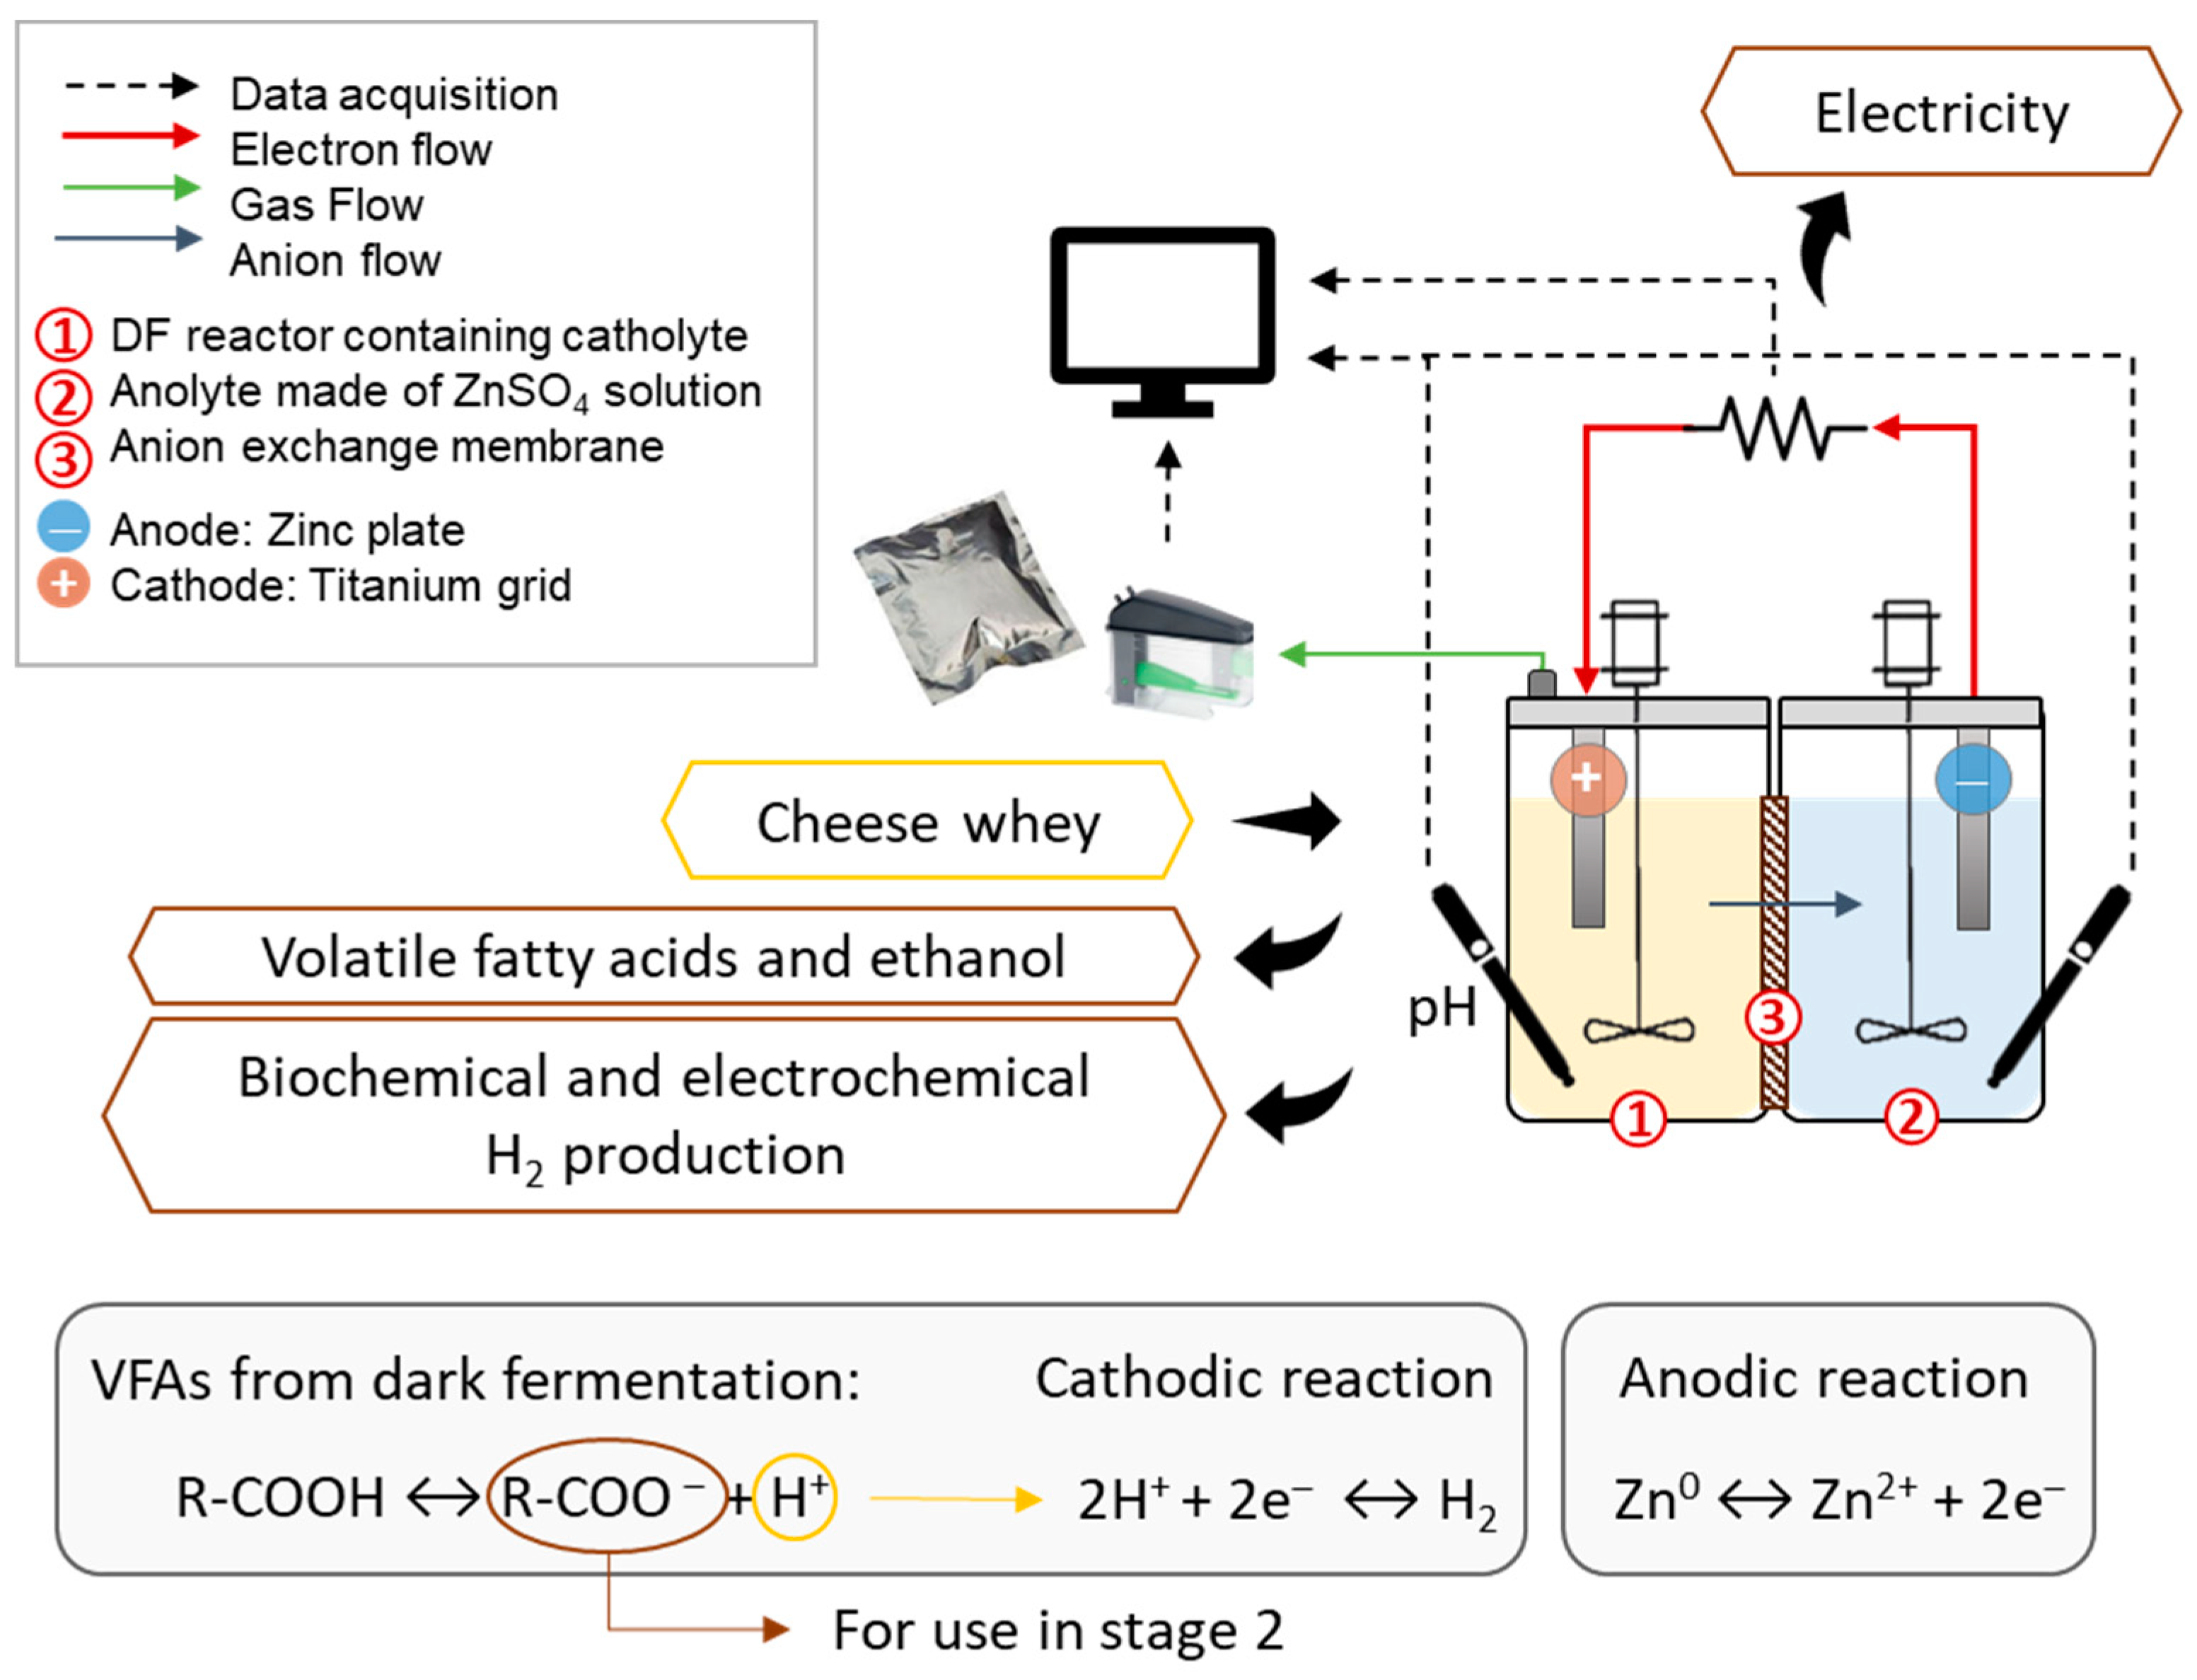
2.1. Stage 1: Bio-Electrochemical H2 Production

The IBH2S consisted of a DF reactor integrated with an electrochemical compartment for proton conversion into H2, with the aim of enhancing the H2 yield compared to the stand-alone biochemical process (see Figure 2). The operating principle of the IBH2S is based on the electrochemical reduction of the free protons derived from the dissociation of the VFAs that are generated during the DF process (cathodic reaction in Figure 2). This electrochemical conversion gives a three-fold benefit, increasing the overall H2 yield of the process; subtracting protons from the system, thus reducing the drop in pH; and generating electricity from the electron flow from the anode to the cathode.
The electron flow required by the cathodic reaction (2H+ + 2e → H2) is generated by the oxidation of metallic Zn in the anodic compartment (Zn0 → Zn2+ + 2e), where a Zn plate is immersed in a 0.5 M ZnSO4 solution. The generated electrons are conveyed through an external circuit into the cathodic chamber where a titanium grid acts as an inert electrode. The ion flow that is required to maintain the electroneutrality of the system occurs through an anion exchange membrane (AEM, surface 67.5 cm2) connecting the cathodic and anodic compartments. Further details on the IBH2S theory and its preliminary assessment are reported in a previous study [43].
The external resistance in the electrical circuit was set at 1.3 Ω, which is considered to be low enough in order to maximize the electrical current flow, achievable with this configuration. The two compartments had an individual working volume of 0.5 L and were completely mixed and maintained under mesophilic conditions (T = 38 ± 1 °C). The cathodic chamber was fed with CW as the substrate (see Table 1), and the initial pH was adjusted to 7.5 using 2 M NaOH, while no further pH control was performed during the tests.

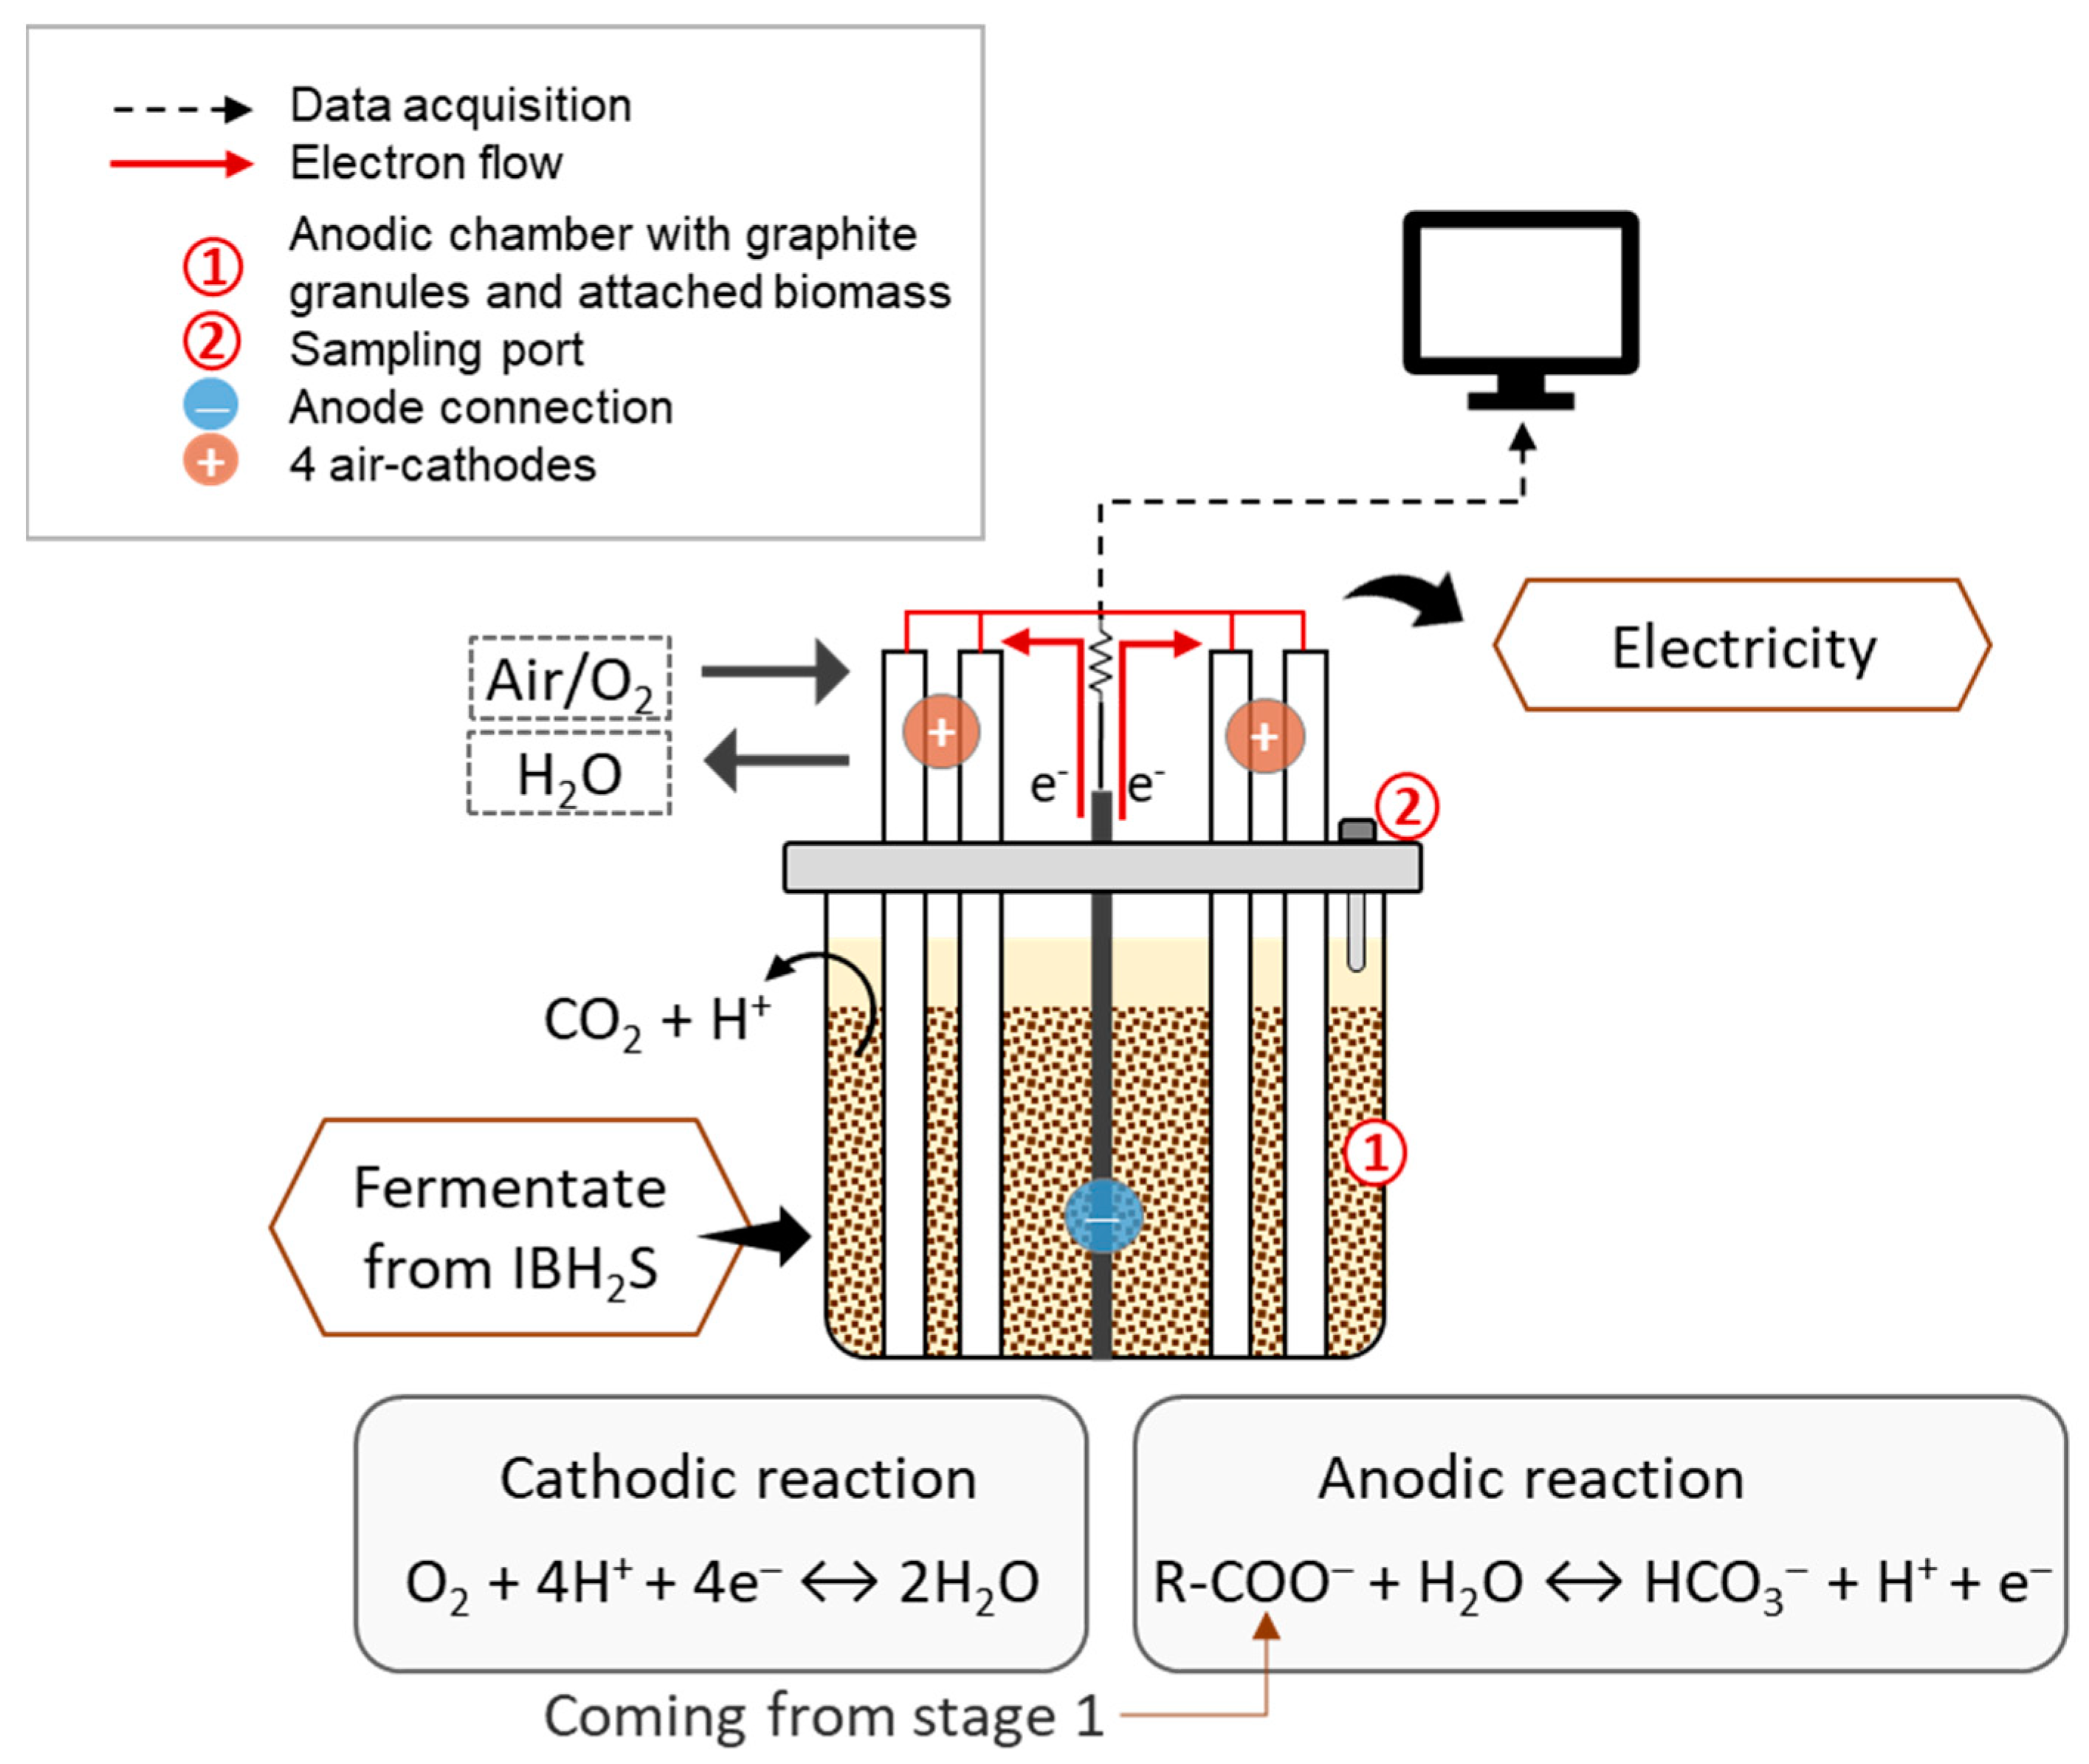
2.2. Stage 2: Microbial Fuel Cell

A four-air cathode single-chamber MFC (see Figure 3) was used for the energy exploitation of the effluent from the cathodic chamber of the IBH2S. The reactor consisted of a single Plexiglas chamber (11.8 cm × 9.6 cm × 9.6 cm; 1.6 cm wall thickness) equipped with four mullite (Bonis S.A., Athens, Greece) cathode tubes (2-cm Φ, 15-cm L), similar to Tremouli et al., 2021 [44]. The inner side of the tube was coated with the catalytic paste containing the oxygen reduction catalyst consisting of coal fly ash supplied by the Megalopoli Power Plant (Arcadia, Greece). The catalytic paste used was similar to Kamperidis et al., 2022 [45], consisting of 5 g fly ash, 10 mL HSF graphite paint, 10 mL xylene, and 10 mL ethanol.
The anode compartment was made of 250 g of graphite granules (type 00514, Le Carbone, Belgium), with diameters ranging between 1.5 and 5 mm, employed as biofilm support and conducting material, while a graphite rod (13-cm length and 7-mm diameter) was embedded into the packed bed of granules for the external connection as well as the electron transfer. The MFC had an effective anolyte volume of 0.15 L. Prior to use, the granules were washed in 32% HCl for 24 h and the process was repeated four times with the aim of removing the metals from the external surface and the inner pores [46].
An external resistance set at 100 Ω was connected to the MFC at all times, except when the open circuit voltage (OCV) measurements and the electrochemical experiments were conducted. The MFC was operated in a thermostatic room set at 30 °C.

2.3. Substrate and Inoculum

In the first stage, CW provided by an Italian dairy industry producing mozzarella cheese, was used as the substrate for the IBH2S. No inoculum was added to the system, relying on the indigenous biomass in CW for the DF reactions.
In the second stage, a single-chamber four-air-cathode MFC was used for the treatment of the first stage effluent. The MFC was acclimated using glucose medium (glucose corresponding to 1.5 g COD/L; 5 g/L NaHCO3, 0.16 g/L KCl, 4.8 g/L NaH2PO4, 3.44 g/L Na2HPO4, and trace elements, detailed elsewhere [47]). Anaerobic sludge was used as the inoculum (10% v/v), obtained from the Lykovrisi Wastewater Treatment Plant, Athens, Greece.
After the acclimation period, synthetic DF waste (SDF, 150 mL) was used as the feedstock (four cycles). Similar concentrations to the real IBH2S effluent (see Table 2) were employed: 1.2 g/L acetic acid, 3.5 g/L butyric acid, and 2.5 g/L ethanol in diluted form with deionized water.
After the MFC operation with SDF, the feedstock was switched to real dark fermentation (RDF) wastewater. Prior to use, the IBH2S effluent was filtered using a 5 μm bag filter. A total of three different cases were studied of RDF mixed with DI water, 10% v/v IBH2S effluent, 50% v/v IBH2S effluent, and 10% IBH2S effluent with increased conductivity by KCl addition. In all cases, the pH of the RDF solution was adjusted to 6.5 by 2 M NaOH addition. Each condition was tested in duplicate, in order to confirm the reproducibility of the results.
The characteristics of the two feedstocks (SDF and RDF) are presented in Table 3.

2.4. Analytical Methods

The biogas production during the first stage was recorded through a volumetric gas counter (Bioprocess Control) with a 2 mL accuracy. The biogas was collected in gasbags and the composition was periodically analyzed with a gas chromatograph (Model 3600 CX, Varian, Walnut Creek, CA, USA). The measured volume was corrected for pressure and temperature and reported at standard conditions (T = 273.15 K, P = 105 Pa).
Acetate, butyrate, and ethanol concentrations were determined in the CW and in the fermentate after 0.2 µm filtration and acidification with HCl (pH = 2) using a gas chromatograph equipped with a flame ionization detector (FID).
The analysis of chemical oxygen demand (COD) as well as total and volatile solids (TS, VS) were conducted according to the Standard Methods for the Examination of Water and Wastewater [48].
Carbohydrates were determined according to the colorimetric phenol–sulfuric acid method using glucose as the standard [49] and expressed in terms of g-glucose/L.
Total organic carbon (TOC) was measured with a Shimadzu TOC analyzer (Shimadzu, Kyoto, Japan; TOC-VCHS and SSM-5000 module).
Conductivity and pH were measured through WTW INOLAB PH720 probes (ThermoFischer Scientific, Waltham, MA, USA).
The MFC voltage was recorded in regular intervals (2 min) by a Keysight LXI Data Acquisition system (Santa Rosa, CA, USA). Electrochemical experiments (Linear Sweep Voltammetry—LSV and Electrochemical Impedance Spectroscopy—EIS) were conducted with a Potentiostat–Galvanostat (PGSTAT128N—AUTOLAB, Metrohm AG, Herisau, Switzerland). The electrochemical experiments were carried out at the start of the operation cycle, after the MFC was allowed to reach an OCV. LSV was done from OCV to 0 V with a negative step (5 mV/s) to measure the power output of the MFC.

2.5. Evaluation Parameters and Calculation

The H2 production yield (H2PY) from Stage 1 was evaluated as the cumulative H2 volume produced per unit of initial TOC of the substrate (L H2/kg TOC). The amount of electric charge (C) mobilized during the IBH2S process was derived as the integral of the measured electric current. The associated theoretical amount of electrochemical H2 produced was also calculated on the basis of the electrons displaced.
The organic matter utilization in Stage 2 was evaluated for each batch cycle in terms of soluble COD removal efficiency (CODre):
COD re   ( % ) = Δ COD COD   i n i t i a l   ·   100
where ∆COD is the COD variation over a cycle.
The conversion of COD into electricity was assessed through the coulombic efficiency (εce), defined as the ratio between the total charge transferred from the substrate to the anode (experimental C, Cex) and the theoretical charge calculated as if the all the substrate that was removed produced current (theoretical C, Ctheo) [50]:
ε ce   ( % ) = C e x C t h e o = M · 0 t I   dt   F · b · v · Δ COD
where Cex is derived from the integration of the electric current intensity produced by the cell over a single cycle, M is the molar weight of O2, F is the Faraday’s constant, b is the number of electrons exchanged per mole of O2, and v is the anolyte volume.
The power output (P) was calculated as P = I · V and expressed in mW/m3 considering the volume of the anodic solution of the single chamber MFC. The internal resistance of the MFC was calculated using Jacobi’s law (maximum power transfer theorem).

3. Results and Discussion

3.1. Bio-Hydrogen Production from Stage 1

The IBH2S achieved a H2PY in the range 75.5–78.8 L H2/kg TOC, showing a three-fold improvement compared to the stand-alone biochemical process performed under identical DF conditions, which reached a H2PY of 22.4 L H2/kg TOC. Table 4 summarises the main results of that study [43].
The electron flow generated by the IBH2S during one batch test cycle was measured to be 7086 C (corresponding to a specific energy production of 6.63 kJ/kg TOC), which is equivalent to a theoretical electrochemical H2PY of 40 L H2/kg TOC. This implies that the expected H2PY would be around 62 L H2/kg TOC, while the measured H2PY in the IBH2S was about 20% higher. It was then argued that the benefits of the biochemical and electrochemical processes were not simply additive, but rather the biochemical H2 production was enhanced by the electrochemical process.
The pH buffering effect that was expected from the electrochemical conversion of excess protons to H2 mainly occurred during the first 13 h of the tests. The electrical current showed an inverse trend compared to the pH evolution, decreasing when the pH increased (see Figure 4). On the other hand, at the later stages of the DF process, the electrochemical proton consumption was found to be unable to counteract the acidification effect caused by the progressive VFA accumulation in the cathodic chamber, so that the pH was observed to drop to final values below 4.
The measured electrical current was found to decrease gradually towards the end of the test despite the availability of protons in the cathodic chamber, indicating that the H2 production potential of the IBH2S was not fully exploited using the current experimental configuration and, therefore, required further optimization of the process conditions. It is tempting to hypothesize that a passivation effect occurred on the metallic Zn plate in the anodic compartment, probably caused by the progressive accumulation of a layer of zinc oxide/hydroxide precipitate onto its surface that was clearly identifiable even by the naked eye. This opens up room for process optimization for strategies to prevent passivation of the anode.
The metabolic products that were detected in the fermentate indicated that DF was mainly governed by the acetate and butyrate pathways. As reported in Table 5, the metabolic products examination in the anodic chamber showed the occurrence of a migration phenomenon through the AEM of the anions derived from the organic acid dissociation, although most of them remained in the cathodic chamber. This suggests that they also contributed to the migration of anionic species (generally OH and Cl) required to maintain the electroneutrality. Future studies may thus include exploring methods to constrain the passage of organic anions through the AEM, in order to increase the amount of species that can be directed to the second treatment stage, or alternately investigate techniques of acid recovery from the anolyte.

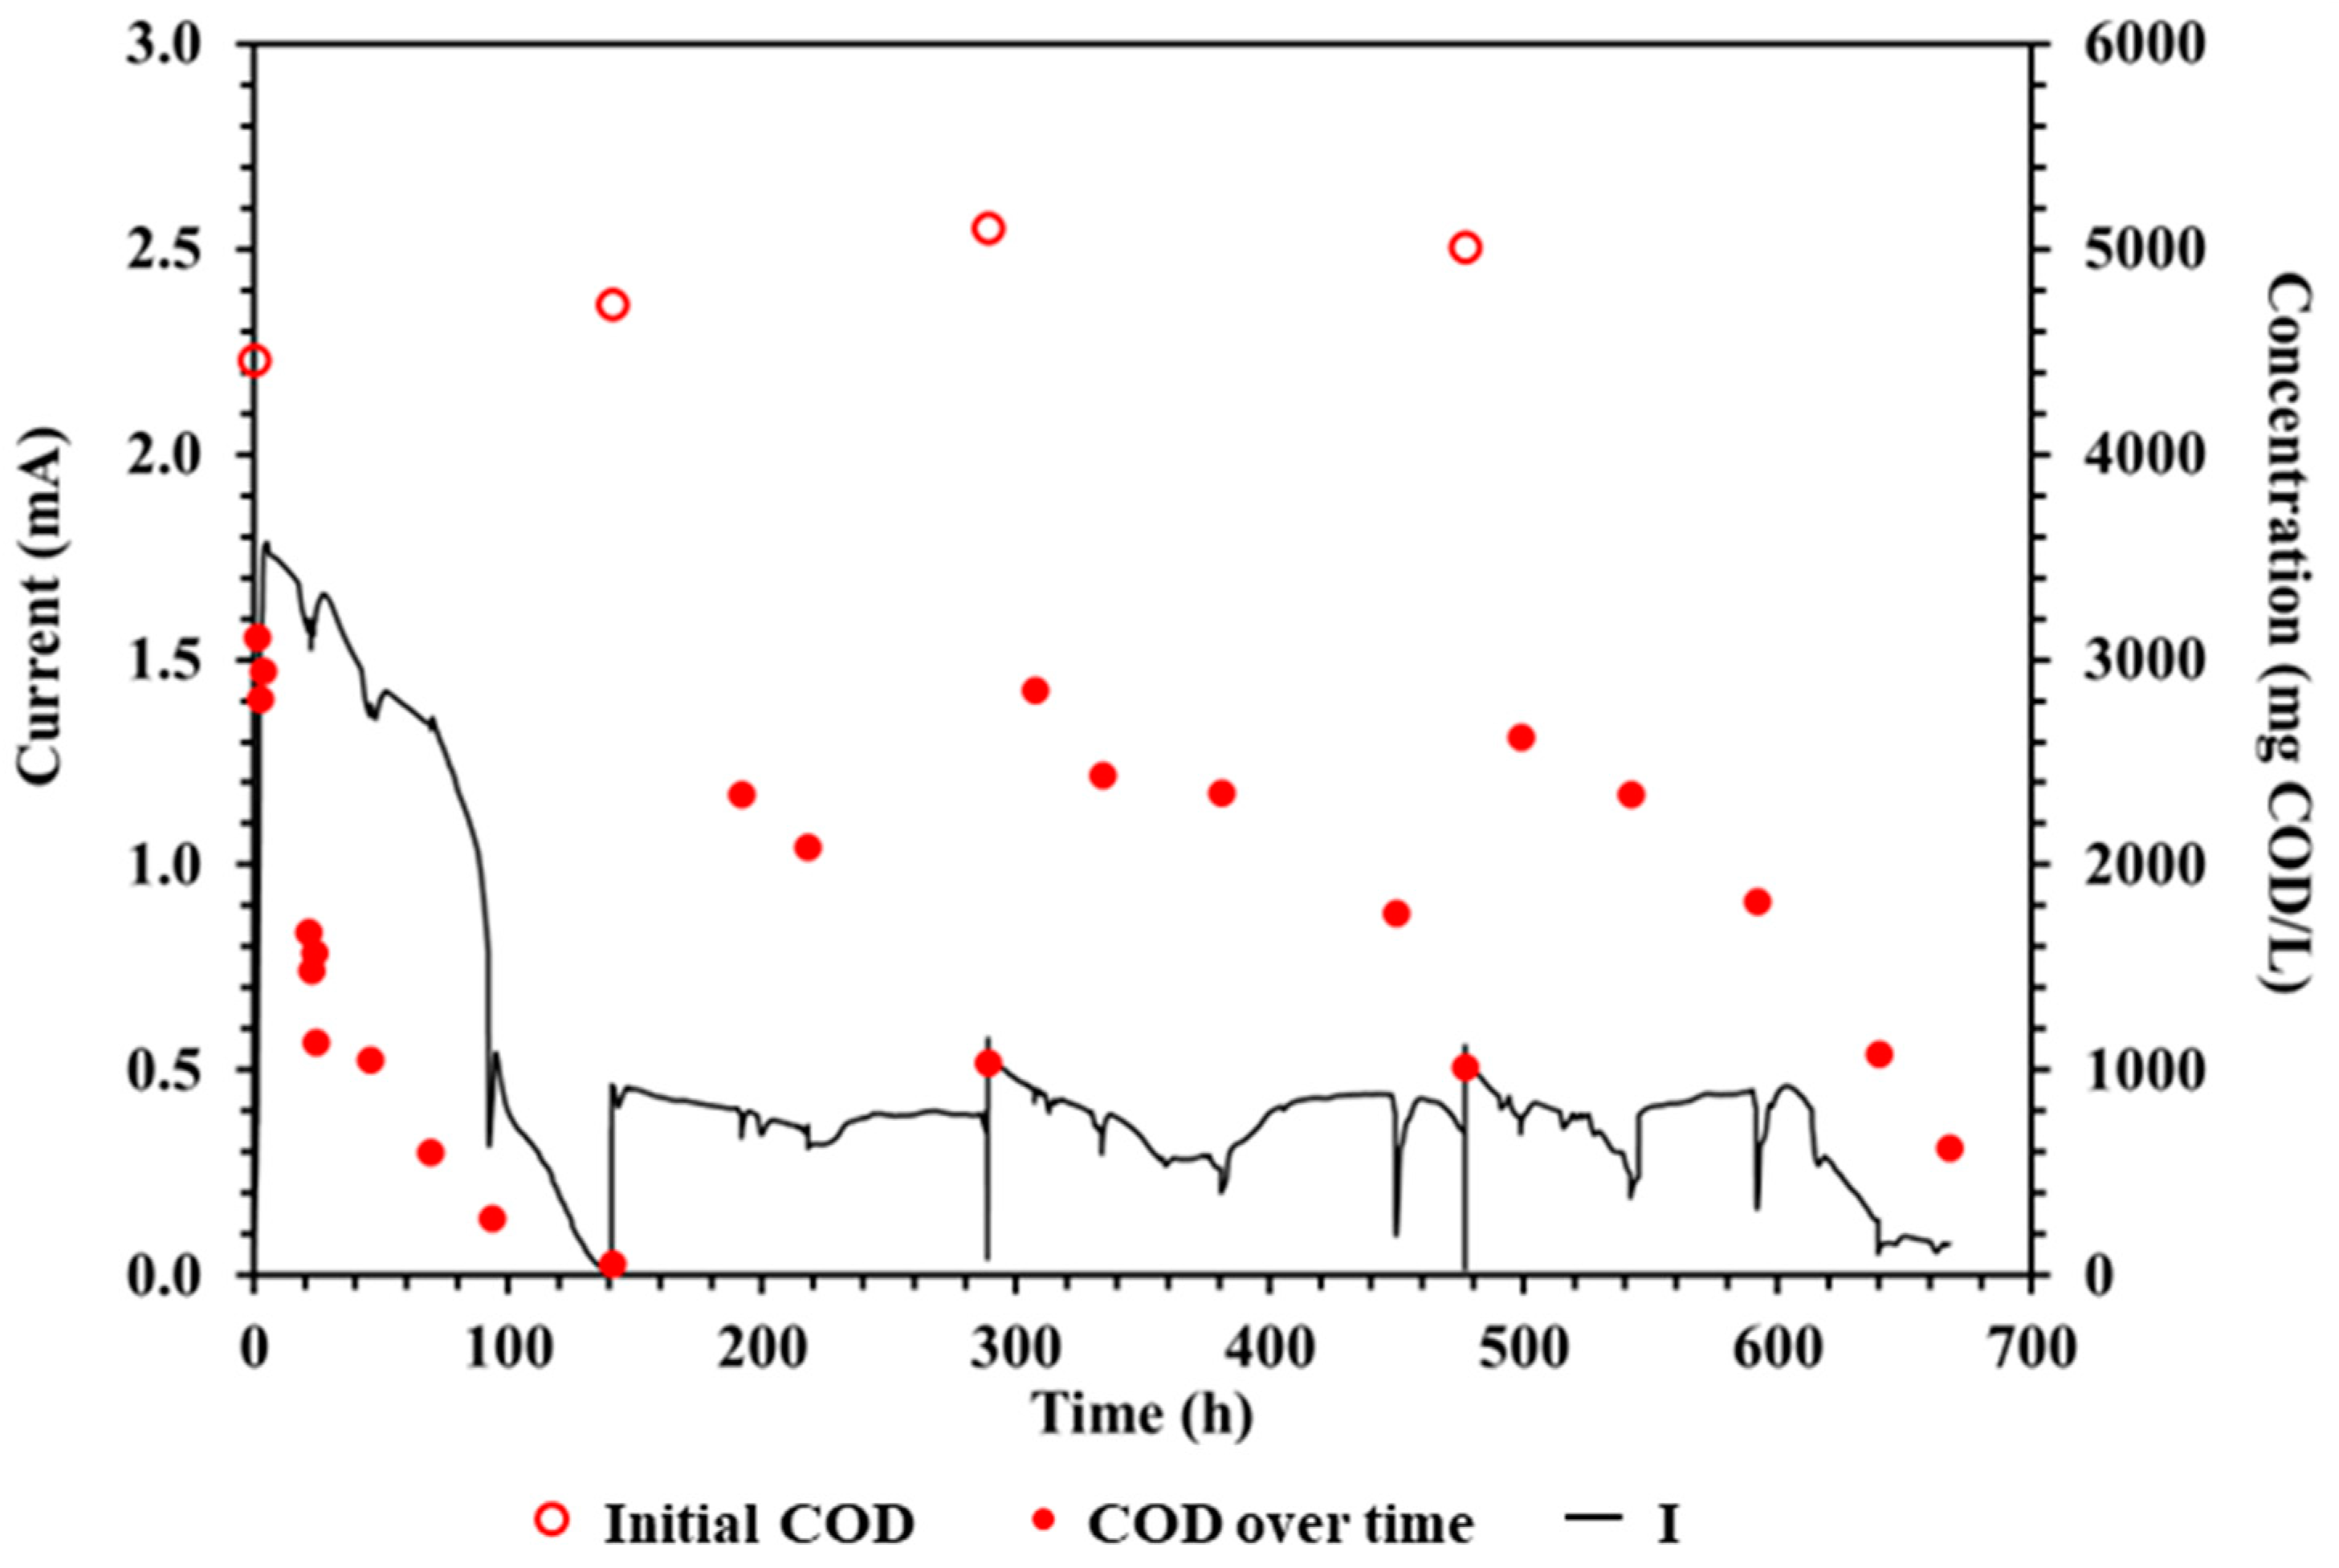
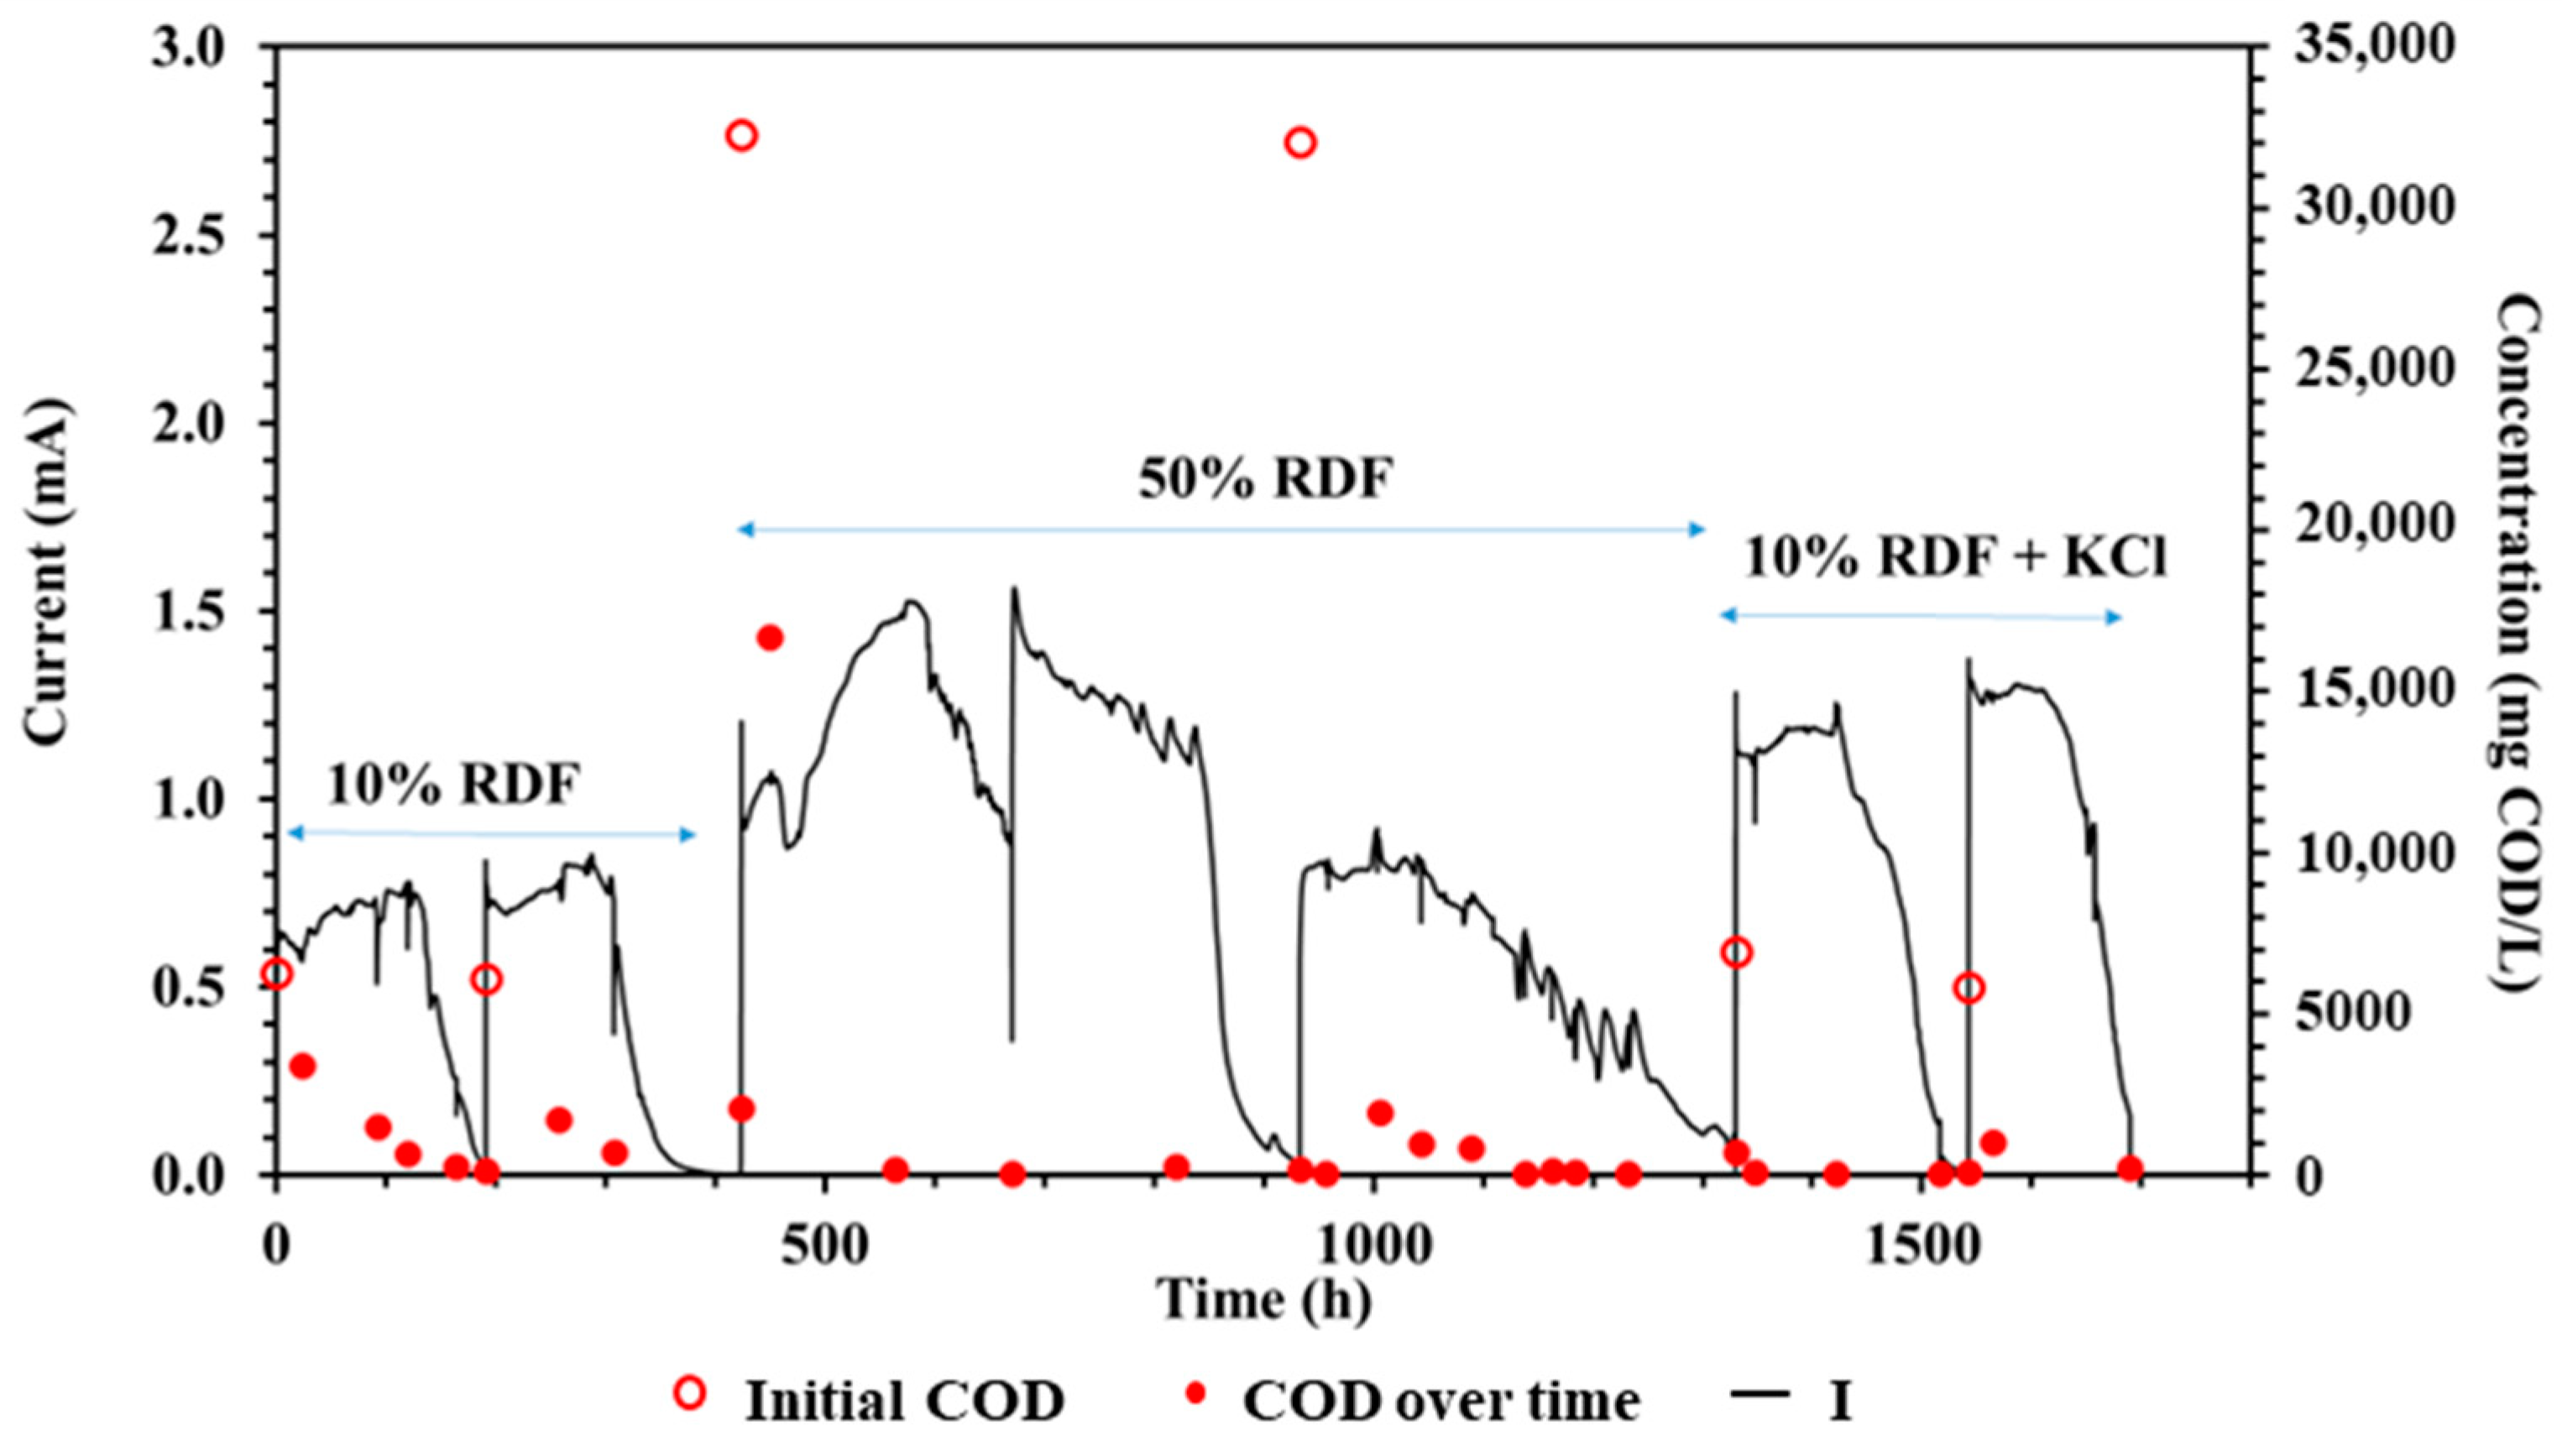
3.2. MFC Operation with SDF and RDF (Stage 2)

The evolution of the electric current output from the MFC and the COD concentration in Stage 2 using SDF as the feedstock is presented in Figure 5.
As can be seen from Figure 5, a decrease in the maximum electrical current output was observed from Cycle 1 to Cycle 2 (from 1.8 mA to 0.5 mA). Following this decrease, the maximum current output remained approximately constant for the subsequent operation cycles (third cycle: 0.6 mA, fourth cycle: 0.6 mA). This drop was partially attributed to an acclimation period of the biofilm due to the switch from the glucose medium (previously used for biomass acclimation) to the SDF wastewater. The COD removal efficiency was high in all cases (86% ± 8%). The coulombic efficiency ranged from 1.4% to 3.2%, indicating that the MFC performance was hindered by parasitic activities, such as antagonistic microbial reactions [51]. The pH of the MFC effluent was almost stable (6.3 ± 0.2).
Furthermore, the electrical current generation was inhibited by the low initial conductivity of the SDF solution (1.6 ± 0.2 mS/cm, Table 3). The electric conductivity of the MFC effluent showed a decreasing trend from Cycle 1 to Cycle 4 (4.2 mS/cm in the first cycle, 1.6 mS/cm in the second cycle, 1.4 mS/cm in the third cycle, and 1 mS/cm in the fourth cycle). The electric conductivity in the first cycle was influenced by the residual synthetic medium in the porous anode electrode. In Cycles 2 to 4, the effect of the low conductivity of the SDF wastewater on the current generation of the MFC was observed, resulting in a maximum current output of 0.6 mA.
Afterwards, SDF was replaced with filtered and diluted RDF (IBH2S effluent). Initially, 10% RDF was used as the feedstock, followed by 50% RDF. The effect of the initial RDF concentration on the MFC performance was examined. To further compare the two cases, the electric conductivity of the 10% RDF was adjusted from 3.9 mS/cm to 14 mS/cm (Table 3) by the addition of KCl. The evolution of the electric current output from the MFC and the COD concentration is presented in Figure 6.
During the MFC operation with 10% RDF as the feedstock (first and second cycle), the electric current output increased (0.8 mA in the first cycle, 0.9 mA in the second cycle) compared to the operation on SDF (0.6 mA in the third and fourth cycles—see Figure 5). In the tests on RDF, the electric current output further increased to 1.6 mA during the third cycle with 50% RDF as the MFC feed. During the fourth cycle, the maximum current intensity was 0.9 mA. Ιn order to examine the effect of conductivity, after the operation phase using 50% RDF the feedstock was switched to 10% RDF + KCl. The addition of KCl led to an initial conductivity that was similar to the 50% RDF case (14 mS/cm). When using 10% RDF + KCl as the feed, the maximum current output was 1.3 mA and 1.4 mA for the fifth and sixth cycle, respectively.
The duration of the MFC operation cycles was 212 ± 21 h, displaying an increase from the duration of the experiments on SDF (167 ± 21 h). The COD removal efficiency was high across all RDF cases, averaging 93% ± 12%. During the 50% RDF operation, the COD concentration decreased by 48% in the first 24 h of the cycle (third cycle). Afterwards, the COD concentration further decreased, achieving a COD removal of 98% after 100 h of MFC operation. Although the organic matter was almost totally removed from the solution, the electrical current output became virtually zero only after 509 h of cell operation. This indicated that the chemical energy obtained from substrate decomposition (first 100 h) was stored in the system, resulting in a continuous current output for 509 h. It has been noted by Freguia et al., 2007 [52] that in case of excess substrate, the electrochemically active biofilm temporarily stores energy. The stored energy is then slowly released by the electrochemically active bacteria resulting in electricity generation. Furthermore, a similar MFC behavior was documented by Tremouli et al., 2021 [33] for a different substrate, with a rapid decomposition of the organic matter and storage of the energy by the biofilm. The COD concentration in the fourth cycle displayed a similar trend as the third cycle: a rapid COD decrease (85%) during the first 50 h was observed, which then reached 98% at the end of the cycle, while maintaining a voltage output for over 300 h. The duration of the third and fourth cycle was 509 h and 397 h, respectively. The electrical current generation in both cases lasted for more than 350 h, showing a slow release of energy from the electrochemically active biofilm.
It should be mentioned that the conductivity of 50% RDF (14 mS/cm) was considerably higher compared to 10% RDF (4 mS/cm), contributing to the observed difference in the electrical current output (maximum values of 0.9 mA for 10% RDF and 1.6 mA for 50% RDF). In both cases, the MFC effluent conductivity decreased, from 3.9 ± 0.1 mS/cm to 1.6 ± 0.2 mS/cm for the 10% RDF and from 14 ± 0.6 mS/cm to 1.7 ± 0.2 mS/cm for the 50% RDF.
The runs on 10% RDF + KCl achieved similar conductivity values as those on 50% RDF, resulting in similar electric current intensities (1.6 mA for 50% RDF, 1.4 mA for 10% RDF + KCl). The maximum current intensity for the 10% RDF test was 0.9 mA with an initial conductivity of 3.9 ± 0.1 mS/cm, compared to a value of 1.4 mA for the 10% RDF + KCl test with an initial conductivity of 14 mS/cm. Both the 10% RDF and 10% RDF + KCl feedstocks had similar initial COD concentrations (6.4 and 6.2 g COD/L, respectively) and high average COD removal yields (82% and 97%). The pH of the MFC effluent was similar to the initial pH of the RDF solutions studied in all cases. The COD removal efficiency was high (>82%) for the whole of MFC operation whereas the coulombic efficiency ranged from 0.7% to 3.7%.

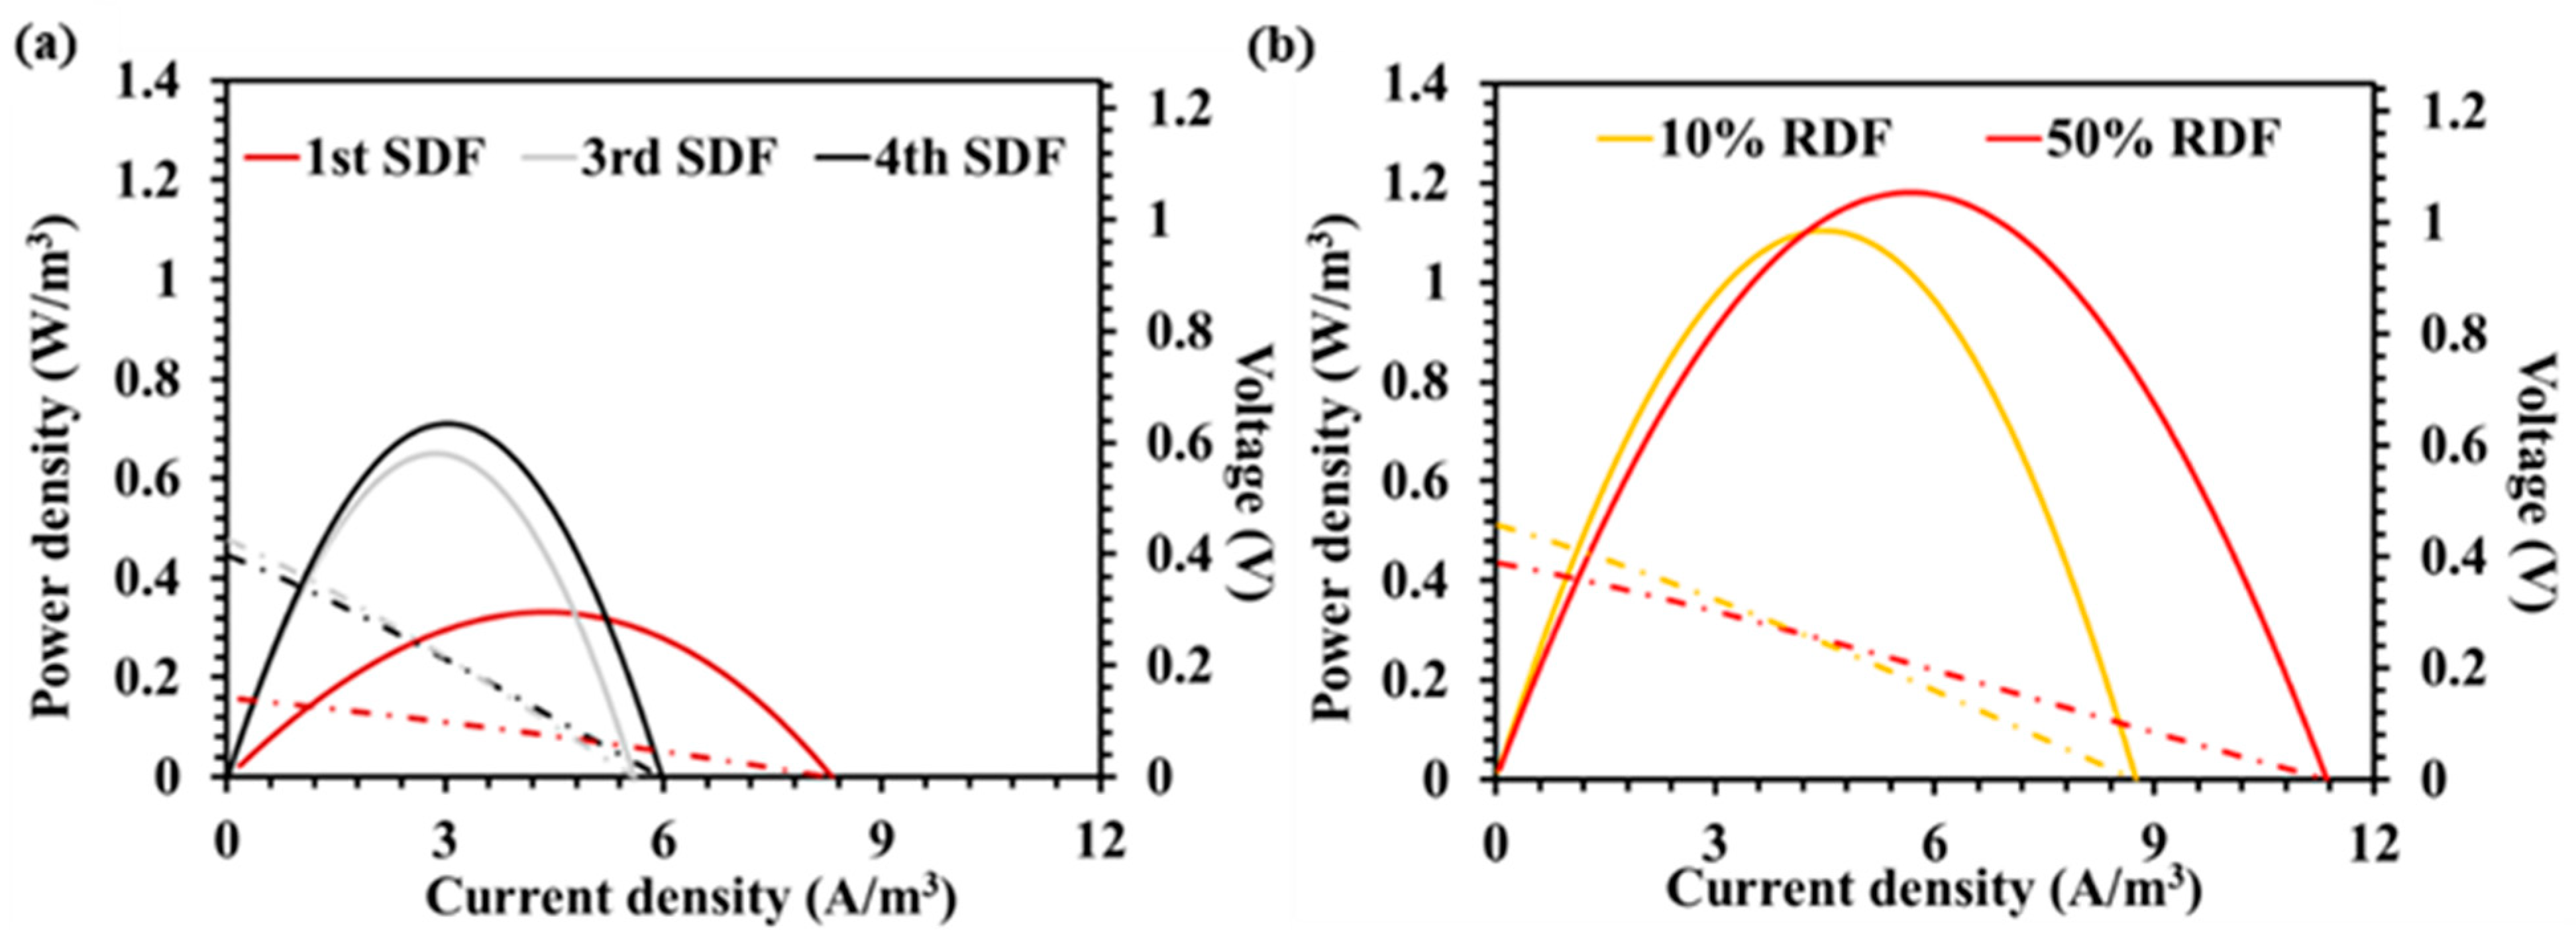
3.3. Linear Sweep Voltammetry Experiments in Stage 2

The LSV experiments were conducted at the beginning of each operation cycle when the current output of the cycle reached its maximum value.
Figure 7 shows the electric power density versus current density curves (solid lines) and the voltage versus current density curves (dashed lines). The maximum power density that was achieved for the SDF feedstock (Figure 7a) was 0.7 W/m3, with an initial COD concentration of 5014 mg COD/L and an initial conductivity of 1.8 mS/cm. The maximum electrical power obtained for the RDF feedstock (Figure 7b) was 1.2 W/m3, corresponding to the 50% RDF case, with an initial concentration of 32 g COD/L and an initial conductivity of 14.4 mS/cm. During the test on 10% RDF, the MFC achieved 1.1 W/m3, with starting conditions of 6.4 g COD/L and 3.9 mS/cm. Despite the differences in the initial COD concentration and electric conductivity, the maximum power output was similar between the 10% RDF and the 50% RDF. The internal resistance of the MFC was calculated using the Jacobi’s law for the different experiments. The lowest internal resistance (202 Ω) was observed during the first SDF operation cycle, where the operation of the MFC was affected by the residual glucose medium. The subsequent cycles showed an increase in the internal resistance of the MFC (third cycle with SDF: 645 Ω; fourth cycle with SDF: 509 Ω). This was caused by the conductivity of the SDF (1.5 ± 0.3 mS/cm). The switch in the feed solution from SDF wastewater to diluted RDF wastewater resulted in a reduced internal resistance (10% RDF: 369 Ω: 50% RDF: 248 Ω). The higher electric conductivity of the RDF solutions led to a reduced internal resistance of the MFC, thus improving the power output (Figure 7b) and the electric current output (Figure 6) across all cases studied. In both types of experiments, the voltage versus current density lines indicated the ohmic losses dominating in the MFC.

4. Conclusions

This study was focused on the feasibility of energy recovery from CW by means of a two-stage process consisting of a bio-electrochemical system with innovative configurations. In the first stage, the fermentation process for H2 recovery was combined with an electrochemical method attempting to overcome the typical biochemical limitations that hinder the actual H2 production yield. The IBH2S fed with CW produced an H2 yield in the range 75.5–78.8 L H2/kg TOC providing a three-fold improvement of the conventional DF. Therefore, this system demonstrated that it is possible to take advantage of the protons derived from dissociation of the VFAs produced during DF, producing additional H2 as well as limiting the utilization of chemical agents for pH control. However, the observed H2 yield appeared to be limited by the influence of side reactions that reduced the actual performance of the IBH2S compared to the theoretical behavior. Potential candidates among the competing factors included the precipitation of solids onto the electrode surface, common-ion effects altering the dissociation reactions involved, and changes in ions mobility. Therefore, in order to further improve the H2 yield in the IBH2S, additional investigations may be addressed to (1) explore strategies to prevent the passivation of the anode, that was recognized as a possible limiting factor during the process, (2) assess the efficiency of the AEM conductivity to ensure adequate migration of anions along the whole process, and (3) enhance the degree of dissociation of the organic acids produced during DF. Additional efforts may also be directed to enhancing the sustainability of the whole process, e.g., by testing alternative materials for the anodic compartment.
A single-chamber MFC was tested for the removal of the residual organic matter contained in the IBH2S effluent and the contextual power generation. The MFC that was proposed as second step also presented an innovative configuration consisting of four mullite air-cathodes connected in series, where fly ash was the catalyst for the cathodic reaction. High COD removal efficiencies were achieved (86% ± 8%) across all cases examined. The maximum current output (1.6 mA) was observed for the 50% RDF feedstock. Similarly, the maximum power density (1.2 W/m3) was obtained for 50% RDF feedstock. Temporary storage of energy by the biofilm was detected for all RDF cases due to the rapid (24 h) COD concentration decline accompanied by a long (>180 h) duration of electric current generation. This result showed that high-strength substrates such as the IBH2S effluent can be successfully treated by this type of MFC and opens up the possibility of attempting to apply directly the undiluted effluent in future investigations.

Author Contributions

Conceptualization: T.K., G.L., A.P., R.P., A.R., A.T. and T.Z.; Data curation: T.K., A.P., R.P., A.R., A.T. and T.Z.; Formal analysis: T.K., A.P., R.P., A.R., A.T. and T.Z.; Funding acquisition: A.P. and R.P.; Investigation: T.K. and T.Z.; Methodology: M.F., T.K., G.L., A.P., R.P., A.R., A.T. and T.Z.; Project administration: A.P. and R.P.; Supervision: G.L., A.P., R.P. and A.T.; Writing—original draft: T.Z.; Writing—review and editing: M.F., T.K., G.L., A.P., R.P., A.R., A.T. and T.Z. All authors have read and agreed to the published version of the manuscript.

Funding

Part of the research was realised within the project BBCircle: Biomaterials, biofuels, CO2 sequestration and circularity. Study on the implementability of biorefineries in the Lazio Region, funded by Lazio Region, Italy (POR FESR LAZIO 2014–2020, project n. id. A0375E0200, CUP B85F21003690005).

Institutional Review Board Statement

Not applicable.

Informed Consent Statement

Not applicable.

Data Availability Statement

The data presented in this study are available within the article.

Conflicts of Interest

The authors declare no conflict of interest.

References

  1. Alibardi, L.; Astrup, T.F.; Asunis, F.; Clarke, W.P.; De Gioannis, G.; Dessì, P.; Lens, P.N.; Lavagnolo, M.C.; Lombardi, L.; Muntoni, A.; et al. Organic waste biorefineries: Looking towards implementation. Waste Manag. 2020, 114, 274–286. [Google Scholar] [CrossRef] [PubMed]
  2. Guo, H.; Zhao, Y.; Damgaard, A.; Wang, Q.; Lu, W.; Wang, H.; Christensen, T.H. Material flow analysis of alternative biorefinery systems for managing Chinese food waste. Resour. Conserv. Recycl. 2019, 149, 197–209. [Google Scholar] [CrossRef]
  3. Kumar, V.; Sharma, N.; Umesh, M.; Selvaraj, M.; Al-Shehri, B.M.; Chakraborty, P.; Duhan, L.; Sharma, S.; Pasrija, R.; Awasthi, M.K.; et al. Emerging challenges for the agro-industrial food waste utilization: A review on food waste biorefinery. Bioresour. Technol. 2022, 362, 127790. [Google Scholar] [CrossRef] [PubMed]
  4. Moscoviz, R.; Trably, E.; Bernet, N.; Carrère, H. The environmental biorefinery: State-of-the-art on the production of hydrogen and value-added biomolecules in mixed-culture fermentation. Green Chem. 2018, 20, 3159–3179. [Google Scholar] [CrossRef]
  5. Mohan, S.V.; Nikhil, G.; Chiranjeevi, P.; Reddy, C.N.; Rohit, M.; Kumar, A.N.; Sarkar, O. Waste biorefinery models towards sustainable circular bioeconomy: Critical review and future perspectives. Bioresour. Technol. 2016, 215, 2–12. [Google Scholar] [CrossRef]
  6. Escobar, J.C.; Lora, E.S.; Venturini, O.J.; Yáñez, E.E.; Castillo, E.F.; Almazan, O. Biofuels: Environment, technology and food security. Renew. Sustain. Energy. Rev. 2009, 13, 1275–1287. [Google Scholar] [CrossRef]
  7. Groom, M.J.; Gray, E.M.; Townsend, P.A. Biofuels and biodiversity: Principles for creating better policies for biofuel production. Conserv. Biol. 2008, 22, 602–609. [Google Scholar] [CrossRef]
  8. Nigam, P.S.; Singh, A. Production of liquid biofuels from renewable resources. Prog. Energy Combust. Sci. 2011, 37, 52–68. [Google Scholar] [CrossRef]
  9. Angenent, L.T.; Karim, K.; Al-Dahhan, M.H.; Wrenn, B.A.; Domíguez-Espinosa, R. Production of bioenergy and biochemicals from industrial and agricultural wastewater. Trends Biotechnol. 2004, 22, 477–485. [Google Scholar] [CrossRef]
  10. Bundhoo, Z.M.A. Potential of bio-hydrogen production from dark fermentation of crop residues: A review. Int. J. Hydrogen Energy 2019, 44, 17346–17362. [Google Scholar] [CrossRef]
  11. Ghimire, A.; Frunzo, L.; Pontoni, L.; D’Antonio, G.; Lens, P.N.L.; Esposito, G.; Pirozzi, F. Dark fermentation of complex waste biomass for biohydrogen production by pretreated thermophilic anaerobic digestate. J. Environ. Manag. 2015, 152, 43–48. [Google Scholar] [CrossRef] [PubMed]
  12. Patel, S.K.S.; Das, D.; Kim, S.C.; Cho, B.K.; Kalia, V.C.; Lee, J.K. Integrating strategies for sustainable conversion of waste biomass into dark-fermentative hydrogen and value-added products. Renew. Sustain. Energy Rev. 2021, 150, 111491. [Google Scholar] [CrossRef]
  13. Tapia-Venegas, E.; Ramirez-Morales, J.E.; Silva-Illanes, F.; Toledo-Alarcón, J.; Paillet, F.; Escudie, R.; Lay, C.-H.; Chu, C.-Y.; Leu, H.-J.; Marone, A.; et al. Biohydrogen production by dark fermentation: Scaling-up and technologies integration for a sustainable system. Rev. Environ. Sci. Biotechnol. 2015, 14, 761–785. [Google Scholar] [CrossRef]
  14. Polettini, A.; Pomi, R.; Rossi, A.; Zonfa, T.; De Gioannis, G.; Muntoni, A. Continuous fermentative hydrogen production from cheese whey—New insights into process stability. Int. J. Hydrogen Energy 2022, 47, 21044–21059. [Google Scholar] [CrossRef]
  15. Yasser Farouk, R.; Li, L.; Wang, Y.; Li, Y.; Melak, S. Influence of pretreatment and pH on the enhancement of hydrogen and volatile fatty acids production from food waste in the semi-continuously running reactor. Int. J. Hydrogen Energy 2019, 45, 3729–3738. [Google Scholar] [CrossRef]
  16. Alexandropoulou, M.; Antonopoulou, G.; Trably, E.; Carrere, H.; Lyberatos, G. Continuous biohydrogen production from a food industry waste: Influence of operational parameters and microbial community analysis. J. Clean. Prod. 2018, 174, 1054–1063. [Google Scholar] [CrossRef] [Green Version]
  17. Castelló, E.; Braga, L.; Fuentes, L.; Etchebehere, C. Possible causes for the instability in the H2 production from cheese whey in a CSTR. Int. J. Hydrogen Energy 2018, 43, 2654–2665. [Google Scholar] [CrossRef]
  18. Castelló, E.; Ferraz-Junior, A.D.N.; Andreani, C.; Anzola-Rojas, M.D.P.; Borzacconi, L.; Buitrón, G.; Carrillo-Reyes, J.; Gomes, S.D.; Maintinguer, S.I.; Moreno-Andrade, I.; et al. Stability problems in the hydrogen production by dark fermentation: Possible causes and solutions. Renew. Sustain. Energy Rev. 2020, 119, 109602. [Google Scholar] [CrossRef]
  19. Koók, L.; Nemestóthy, N.; Bélafi-Bakó, K.; Bakonyi, P. Treatment of dark fermentative H2 production effluents by microbial fuel cells: A tutorial review on promising operational strategies and practices. Int. J. Hydrogen Energy 2021, 46, 5556–5569. [Google Scholar] [CrossRef]
  20. Bundhoo, Z.M.A. Coupling dark fermentation with biochemical or bioelectrochemical systems for enhanced bio-energy production: A review. Int. J. Hydrogen Energy 2017, 42, 26667–26686. [Google Scholar] [CrossRef]
  21. Sekoai, P.T.; Ghimire, A.; Ezeokoli, O.T.; Rao, S.; Ngan, W.Y.; Habimana, O.; Yao, Y.; Yang, P.; Fung, A.H.Y.; Yoro, K.O.; et al. Valorization of volatile fatty acids from the dark fermentation waste Streams-A promising pathway for a biorefinery concept. Renew. Sustain. Energy Rev. 2021, 143, 110971. [Google Scholar] [CrossRef]
  22. Asunis, F.; Carucci, A.; De Gioannis, G.; Farru, G.; Muntoni, A.; Polettini, A.; Pomi, R.; Rossi, A.; Spiga, D. Combined biohydrogen and polyhydroxyalkanoates production from sheep cheese whey by a mixed microbial culture. J. Environ. Manag. 2022, 322, 116149. [Google Scholar] [CrossRef]
  23. Logan, B.E. Exoelectrogenic bacteria that power microbial fuel cells. Nat. Rev. Microbiol. 2009, 7, 375–381. [Google Scholar] [CrossRef] [PubMed]
  24. Potter, M.C. Electrical effects accompanying the decomposition of organic compounds. Proc. R. Soc. Lond. Ser. B Contain. Pap. Biol. Character 1911, 84, 260–276. [Google Scholar] [CrossRef]
  25. Santoro, C.; Arbizzani, C.; Erable, B.; Ieropoulos, I. Microbial fuel cells: From fundamentals to applications. A review. J. Power Sources 2017, 356, 225–244. [Google Scholar] [CrossRef]
  26. Pant, D.; Van Bogaert, G.; Diels, L.; Vanbroekhoven, K. A review of the substrates used in microbial fuel cells (MFCs) for sustainable energy production. Bioresour. Technol. 2010, 101, 1533–1543. [Google Scholar] [CrossRef]
  27. Winfield, J.; Gajda, I.; Greenman, J.; Ieropoulos, I. A review into the use of ceramics in microbial fuel cells. Bioresour. Technol. 2016, 215, 296–303. [Google Scholar] [CrossRef] [Green Version]
  28. Yousefi, V.; Mohebbi-Kalhori, D.; Samimi, A. Ceramic-based microbial fuel cells (MFCs): A review. Int. J. Hydrogen Energy 2017, 3, 1672–1690. [Google Scholar] [CrossRef]
  29. Pandis, P.K.; Kamperidis, T.; Bariamis, K.; Vlachos, I.; Argirusis, C.; Stathopoulos, V.N.; Lyberatos, G.; Tremouli, A. Comparative Study of Different Production Methods of Activated Carbon Cathodic Electrodes in Single Chamber MFC Treating Municipal Landfill Leachate. Appl. Sci. 2022, 12, 2991. [Google Scholar] [CrossRef]
  30. Lv, K.; Zhang, H.; Chen, S. Nitrogen and phosphorus co-doped carbon modified activated carbon as an efficient oxygen reduction catalyst for microbial fuel cells. RSC Adv. 2018, 8, 848–855. [Google Scholar] [CrossRef] [Green Version]
  31. Chakraborty, I.; Bhowmick, G.D.; Ghosh, D.; Dubey, B.K.; Pradhan, D.; Ghangrekar, M.M. Novel low-cost activated algal biochar as a cathode catalyst for improving performance of microbial fuel cell. Sustain. Energy Technol. Assess. 2020, 42, 100808. [Google Scholar] [CrossRef]
  32. Sarma, R.; Tamuly, A.; Kakati, B.K. Recent developments in electricity generation by Microbial Fuel Cell using different substrates. Mater. Today Proc. 2022, 49, 457–463. [Google Scholar] [CrossRef]
  33. Tremouli, A.; Kamperidis, T.; Pandis, P.K.; Argirusis, C.; Lyberatos, G. Exploitation of Digestate from Thermophilic and Mesophilic Anaerobic Digesters Fed with Fermentable Food Waste Using the MFC Technology. Waste Biomass Valorization 2021, 12, 5361–5370. [Google Scholar] [CrossRef]
  34. Chookaew, T.; Prasertsan, P.; Ren, Z.J. Two-stage conversion of crude glycerol to energy using dark fermentation linked with microbial fuel cell or microbial electrolysis cell. N Biotechnol. 2014, 31, 179–184. [Google Scholar] [CrossRef]
  35. Polettini, A.; Pomi, R.; Rossi, A.; Zonfa, T.; De Gioannis, G.; Muntoni, A. Factor-based assessment of continuous bio-H2 production from cheese whey. Chemosphere 2022, 308, 136174. [Google Scholar] [CrossRef] [PubMed]
  36. Ottaviano, L.M.; Ramos, L.R.; Botta, L.S.; Amâncio Varesche, M.B.; Silva, E.L. Continuous thermophilic hydrogen production from cheese whey powder solution in an anaerobic fluidized bed reactor: Effect of hydraulic retention time and initial substrate concentration. Int. J. Hydrogen Energy 2017, 42, 4848–4860. [Google Scholar] [CrossRef]
  37. Moreno, R.; Escapa, A.; Cara, J.; Carracedo, B.; Gómez, X. A two-stage process for hydrogen production from cheese whey: Integration of dark fermentation and biocatalyzed electrolysis. Int. J. Hydrogen Energy 2015, 40, 168–175. [Google Scholar] [CrossRef]
  38. Rosa, P.R.F.; Santos, S.C.; Sakamoto, I.K.; Varesche, M.B.A.; Silva, E.L. Hydrogen production from cheese whey with ethanol-type fermentation: Effect of hydraulic retention time on the microbial community composition. Bioresour. Technol. 2014, 161, 10–19. [Google Scholar] [CrossRef]
  39. Gomez-Romero, J.; Gonzalez-Garcia, A.; Chairez, I.; Torres, L.; García-Peña, E.I. Selective adaptation of an anaerobic microbial community: Biohydrogen production by co-digestion of cheese whey and vegetables fruit waste. Int. J. Hydrogen Energy 2014, 39, 12541–12550. [Google Scholar] [CrossRef]
  40. Venetsaneas, N.; Antonopoulou, G.; Stamatelatou, K.; Kornaros, M.; Lyberatos, G. Using cheese whey for hydrogen and methane generation in a two-stage continuous process with alternative pH controlling approaches. Bioresour. Technol. 2009, 100, 3713–3717. [Google Scholar] [CrossRef]
  41. Akhlaghi, M.; Boni, M.R.; De Gioannis, G.; Muntoni, A.; Polettini, A.; Pomi, R.; Rossi, A.; Spiga, D. A parametric response surface study of fermentative hydrogen production from cheese whey. Bioresour. Technol. 2017, 244, 473–483. [Google Scholar] [CrossRef] [PubMed]
  42. Asunis, F.; De Gioannis, G.; Isipato, M.; Muntoni, A.; Polettini, A.; Pomi, R.; Rossi, A.; Spiga, D. Control of fermentation duration and pH to orient biochemicals and biofuels production from cheese whey. Bioresour. Technol. 2019, 289, 121722. [Google Scholar] [CrossRef] [PubMed]
  43. De Gioannis, G.; Dell’Era, A.; Muntoni, A.; Pasquali, M.; Polettini, A.; Pomi, R.; Rossi, A.; Zonfa, T. Bio-electrochemical production of hydrogen and electricity from organic waste: Preliminary assessment. Clean. Technol. Environ. Policy 2022, 25, 269–280. [Google Scholar] [CrossRef]
  44. Tremouli, A.; Kamperidis, T.; Lyberatos, G. Comparative Study of Different Operation Modes of Microbial Fuel Cells Treating Food Residue Biomass. Molecules 2021, 26, 3987. [Google Scholar] [CrossRef] [PubMed]
  45. Kamperidis, T.; Pandis, P.K.; Argirusis, C.; Lyberatos, G.; Tremouli, A. Effect of Food Waste Condensate Concentration on the Performance of Microbial Fuel Cells with Different Cathode Assemblies. Sustainability 2022, 14, 2625. [Google Scholar] [CrossRef]
  46. Tremouli, A.; Karydogiannis, I.; Pandis, P.; Papadopoulou, K.; Argirusis, C.; Stathopoulos, V.N.; Lyberatos, G. Bioelectricity production from fermentable household waste extract using a single chamber microbial fuel cell. Energy Procedia 2019, 161, 2–9. [Google Scholar] [CrossRef]
  47. Kamperidis, T.; Tremouli, A.; Peppas, A.; Lyberatos, G. A 2D Modelling Approach for Predicting the Response of a Two-Chamber Microbial Fuel Cell to Substrate Concentration and Electrolyte Conductivity Changes. Energies 2022, 15, 1412. [Google Scholar] [CrossRef]
  48. American Public Health Association, American Water Works Association and Water Environment Federation. Standard Methods for the Examination of Water and Wastewater, 23rd ed.; APHA-AWWA-WEF: Washington, DC, USA, 2017. [Google Scholar]
  49. Dubois, M.; Gilles, K.A.; Hamilton, J.K.; Rebers, P.A.; Smith, F. Colorimetric Method for Determination of Sugars and Related Substances. Anal. Chem. 1956, 28, 350–356. [Google Scholar] [CrossRef]
  50. Logan, B.E.; Hamelers, B.; Rozendal, R.; Schröder, U.; Keller, J.; Freguia, S.; Aelterman, P.; Verstraete, W.; Rabaey, K. Microbial Fuel Cells: Methodology and Technology. Environ. Sci. Technol. 2006, 40, 5181–5192. [Google Scholar] [CrossRef]
  51. Logan, B.E. Microbial Fuel Cells; John Wiley and Sons: Hoboken, NJ, USA, 2008. [Google Scholar]
  52. Freguia, S.; Rabaey, K.; Yuan, Z.; Keller, J. Electron and carbon balances in microbial fuel cells reveal temporary bacterial storage behavior during electricity generation. Environ. Sci. Technol. 2007, 41, 2915–2921. [Google Scholar] [CrossRef]
Figure 1. Two-stage process scheme for cheese whey valorization.
Fermentation 09 00306 g001
Figure 2. Experimental setup of the IBH2S (stage 1).
Fermentation 09 00306 g002
Figure 3. Single-chamber MFC layout using the fermentate from Stage 1.
Fermentation 09 00306 g003
Figure 4. pH and electricity trends in Stage 1.
Fermentation 09 00306 g004
Figure 5. Current output and COD concentration versus time for the MFC operation with SDF.
Fermentation 09 00306 g005
Figure 6. Electric current output and COD concentration versus time for the MFC operation with RDF (10% diluted RDF—left, 50% diluted RDF—middle, 10% diluted RDF with KCl—right).
Fermentation 09 00306 g006
Figure 7. Electric power density (solid lines) and voltage (dashed lines) versus the current density for (a) three SDF cycles (1st, 3rd, and 4th) and (b) RDF as feeds to the MFC.
Fermentation 09 00306 g007
Table 1. Characterization of the CW used as the substrate in Stage 1.
ParameterUnit of MeasureValue 1
Total solids (TS)g/L74.1 ± 3
Volatile solids (VS)g/L63.9 ± 3
Carbohydrates 2g/L38.5 ± 3.8
Total organic carbon (TOC)g C/kg39.3 ± 3.7
pH-3.6 ± 0.1
Acetic acidmg HAc/L364 ± 71
Ethanolmg EtOH/L3360 ± 82
1 Average value ± standard deviation; 2 Carbohydrates are expressed as g-glucose/L.
Table 2. Characterization of the IBH2S effluent used as the substrate for Stage 2.
ParameterUnit of MeasureValue 1
Total solids (TS)g/L59.44 ± 0.28
Volatile solids (VS)g/L41.08 ± 0.60
Carbohydrates 2g/L18.0 ± 0.1
Total organic carbon (TOC)g C/kg26.7 ± 0.1
Soluble CODmgO2/L67,267 ± 329
Total CODmgO2/L80,106 ± 572
pH-3.5 ± 0.1
ConductivitymS/cm15.36
Acetic acidmg HAc/L1188 ± 333
Butyric acidmg HBu/L3493 ± 293
Ethanolmg EtOH/L2428 ± 192
1 Average value ± standard deviation; 2 Carbohydrates are expressed as g-glucose/L.
Table 3. Characteristics of the synthetic and the real dark fermentation wastewaters (SDF, RDF) used as MFC feedstock.
TestpH 1Conductivity 1
(mS/cm)
Concentration 1
(g COD/L)
SDF6.2 ± 0.11.6 ± 0.24.8 ± 0.2
10% RDF6.43.9 ± 0.16.2 ± 0.1
50% RDF6.5 ± 0.414 ± 0.432.2 ± 0.1
10% RDF + KCl7.4 ± 0.814 ± 0.66.4 ± 0.4
1 Average value ± standard deviation.
Table 4. Main results for the IBH2S (stage 1).
ParameterUnit of MeasureValue
Test durationh213
Electricity produced by the IBH2Smol e0.073
C7086
kJ/kgTOC6.63
Measured H2 production in the IBH2SL1.380
Theoretical electrochemical H2 production in the IBH2SL0.823
Measured H2 production yield in the IBH2SL H2/kg TOC68.7
Total H2 production yield in the IBH2S (including the estimated leakage) 1L H2/kg TOC75.5–78.8
Theoretical electrochemical H2 production yield in the IBH2SL H2/kg TOC41.0
Measured H2 production yield in the stand-alone biochemical processL H2/kg TOC22.4
1 Gas leakage through the AEM estimated to lie in the range 0.64–0.95 mL/h through dedicated H2 leakage measurement tests.
Table 5. Metabolic products from the IBH2S (stage 1).
MetabolitesCatholyteAnolyteAEM Migration
mg/L 1mg/L 1%
Acetic acid118845428
Butyric acid349374618
Ethanol2428<DL 2-
1 mg/L of the relative metabolite; 2 DL = Detection limit.
Disclaimer/Publisher’s Note: The statements, opinions and data contained in all publications are solely those of the individual author(s) and contributor(s) and not of MDPI and/or the editor(s). MDPI and/or the editor(s) disclaim responsibility for any injury to people or property resulting from any ideas, methods, instructions or products referred to in the content.

