Article

Fruit Beer with the Bisucciu Sardinian Apricot Cultivar (Prunus armeniaca L.): A Technological and Analytical Approach

1
Porto Conte Ricerche Srl, Tramariglio, 07041 Alghero, Italy
2
Institute of Biomolecular Chemistry, National Research Council (CNR), 07100 Sassari, Italy
3
Department of Food and Drug, University of Parma, 43124 Parma, Italy
4
Department of Agricultural Sciences, University of Sassari, 07100 Sassari, Italy
*
Author to whom correspondence should be addressed.
Fermentation 2023, 9(3), 305; https://doi.org/10.3390/fermentation9030305
Submission received: 3 March 2023 / Revised: 14 March 2023 / Accepted: 18 March 2023 / Published: 21 March 2023
(This article belongs to the Section Fermentation for Food and Beverages)

Abstract

:
The aim of this work was to test native microbial strains and fruits for brewing, with a multidisciplinary approach for a sustainable production linked to the territory. Pediococcus acidilactici B5 and Hanseniaspora uvarum L2 strains were isolated from apricot Bisucciu fruits, a Sardinian local variety (Prunus armeniaca L.), and P. acidilactici B5 was used to ferment a sterile apricot Bisucciu puree, which was then added to a malt wort. The H. uvarum L2 strain and the industrial yeast Saccharomyces cerevisiae US-05 were used sequentially to ferment a portion of this wort (M2); a control was carried out with an industrial yeast, S. cerevisiae T-58 (T58). Beer standard quality parameters were studied and a sensorial analysis performed in the beers obtained from the two fermentations. Intermediate and end molecular products were characterized by proton Nuclear Magnetic Resonance (1H NMR) for glucidic, organic acids and amino acids and by Gas Chromatography–Mass Spectrometry (SPME/GC/MS) for volatile profiles. M2 and T58 samples showed differences in color, foam stability and in the carbohydrates, acids and amino acids profiles. The highest concentrations of ethyl acetate were found in M2, whereas a high concentration of 3-methylbutan-1-ol characterized T58. Sensory analysis highlighted differences in flavor, astringency and balance between the two beers studied.

Graphical Abstract

1. Introduction

After water and tea, beer is the most consumed beverage worldwide and the first one among alcoholic beverages [1,2]. The global beer scenario is constantly evolving with the advent of new products, increased by the craft brewery phenomena based on the replication of classic styles through the use of ingredients grown and developed in that geographical area [3]. The beer style concept is linked to specific historical and geographical indications (areas or even cities), and with the local agricultural environment. The production of beer styles outside of their original area causes a massive movement of raw materials between states and/or continents, with high transport and ecological costs. These economic and environmental sustainability drawbacks have a strong impact on craft breweries, prompting them to extend and reinterpret the classic styles [4,5,6,7]. This is a global trend that is driving a significant change in wort composition and technology. From this perspective, the use of indigenous microorganisms, local special malts and the addition of autochthonous raw materials, such as herbs, spices or fruits, can help to obtain new beer products [8,9,10,11,12]. An example is the recognition of the first Italian beer style: Italian Grape Ale, a sub-fruit beer style, which has grape berries added to the recipe in amounts up to 40% during mashing, fermentation or maturation [12,13]. Fruit biodiversity may increase the sensorial landscape flavors and the bioactive compound concentrations [9,11].
In this field, novel microorganisms are acquiring relevance for the craft brewers, especially if isolated from fruits’ grape must or sourdough [11,14,15,16,17]. Currently, some regional beers, fermented by bakery yeasts, have gained recognition as “Traditional Specialities Guaranteed” by the European Union [18].
Recently, interest in non-Saccharomyces yeasts is also increasing [19,20]. Brettanomyces strains are part of this microbiological trend: despite their role as beer and wine spoilers, when applied correctly, they contribute to the aroma and flavor complexity in a beer style named “Bret beers” [21]. Strains of Torulaspora delbruecki in pure or mixed fermentation with commercials yeasts improve the production of isoamyl acetate [22]. Hanseniaspora strains, used in low alcohol beer production, show low differences in volatile profiles if compared with commercial yeasts. Instead, the use of the H. vinae strain in co-fermentation improves the highly fruity flavor of beer [23]. Recently, the effects in mixed and sub-sequential fermentation with the commercial yeast of five H. uvarum strains, isolated from traditional honey fermented beverages, were reported [14].
Breweries need a deeper understanding of the production process to respond to the changing market demands and consumer preferences. In order to reduce or enhance certain flavors, various research has focused on the measurement of the volatile organic compound generation during beer fermentation. Due to its effectiveness and operability, headspace solid phase microextraction (HS-SPME) coupled with mass spectrometry gas chromatography (GC-MS) is the most popular extraction method for quantifying volatile chemicals in beer [24,25].
The aim of this study is the investigation of the analytical and sensorial profiles of beers obtained from wort fermented by the yeast strain Hanseniaspora uvarum L2 and the lactic acid bacteria strain Pediococcus acidilactici B5, isolated from a Sardinian apricot cv. Bisucciu (Prunus armeniaca L.), compared to a control beer obtained by using a commercial yeast (S. cerevisiae T-58) characterized by the production of a peculiar aromatic bouquet. The selected yeast and bacterial strains used in this work, were previously isolated, identified and tested for their brewing ability, such as fermentation power and effect on the volatile profile of beer [26].

2. Materials and Methods

2.1. Sampling and Preparation of Apricot Puree

The apricot puree (AP) obtained from the ripened fruits of the Sardinian cultivar Bisucciu was the same one used by Fancello et al. [26].

2.2. Strains

Hanseniaspora uvarum L2 and Pediococcus acidilactici B5 were isolated and identified, as described by Fancello et al. [26]. Saccharomyces cerevisiae commercial strains T-58, US-05 and F2 were purchased from Fermentis, (Marcq-en-Baroeul Cedex, France).

Starter Preparation

P. acidilactici B5 was precultured in MRS broth at 30 °C in static for 24 h. Subsequently, precultured bacterial cells were transferred into 5 L of Bisucciu apricot puree at a final concentration of 6 Log cells/mL. Puree fermentation was carried out at 30 °C in a static state for 7 days. H. uvarum L2 was precultured in YPD broth at 25 °C for 24 h. After this period, the yeast cells were inoculated in 5 L YEPD and incubated in a static state at 25 °C for 48 h.

2.3. Beer Production

Batches of 100 L of beer were produced on the pilot plant facility of Porto Conte Ricerche Srl (Alghero, Italy). As grist, 50% Pils malt (Weyermann, Bamberg, Germany), 40% Vienna malt (Thomas Fawcett and sons, Castleford, UK), and 10% Weizen malt (Weyermann, Bamberg, Germany) were used. Malts were ground in a two-roll mill with 1 mm spacing. Mash-in was done by 70 L of water added to 10 g of MgCl2 and 10 g of CaCl2 (Mr. Malt, Udine, Italy). Mash was conducted at 64 °C for 60 min, and then heated at 72 °C and held for 10 min, and finally heated at 78 °C and kept for 10 min for mash-out. The first wort was transferred to a kettle and the spent grain was washed using water at 78 °C to reach a total volume of 100 L. The wort was boiled for 60 min and then 105 g of East Kent Goldings hop (Mr. Malt, Udine, Italy) was added. A total of 5 kg of apricot puree previously fermented by Pediococcus acidilactici (FP) was added to the wort after 50 min of the boiling step. The boiled wort was separated from the hot trub in a whirlpool, and then cooled at 18 °C.
Wort fermentation was conducted at 15 °C for 16 days in 2 different vessels with 25 L of boiled wort each. One vessel (M2) was inoculated with Hanseniospora uvarum (1% v/v) and after 9 days 0.5 g/L of US-05 yeast (Fermentis, Marcq-en-Baroeul Cedex, France) was added for the subsequent fermentation. The second vessel (T58) was fermented by 0.5 g/L of T58 yeast (Fermentis, Marcq-en-Baroeul Cedex, France) for 7 days, and used as the sample control. At the end of the fermentation, the matured beers were chilled at 4 °C for 13 days. A total of 10 g/L of glucose syrup (Uniglad Ingredienti, Grinzane Cavour, Italy) and 0.05 g/L of yeast F2 (Fermentis, Marcq-en-Baroeul Cedex, France) was added to all matured beers for bottle conditioning at 22 °C for 14 days (conditioned beer).

2.4. Microbiological Analysis

2.4.1. Microbiological Analysis of Fermented Apricot Puree

In total, 10 g of apricot puree fermented with Pediococcus acidilactici (FP) was suspended in 90 mL of sterile peptone solution (0.1 g/L, Oxoid (Milan, Italy) Peptone Bacteriological) in distilled water and homogenized in a stomacher (Stomacher Lab blender, 80 VWR International PBI, Italy) for 2 min. Serial decimal dilutions were plated, duplicated and incubated at 28 °C for 48 h on MRS agar anaerobically (GasPak jars with bags 2.5 L AnaeroGen, Oxoid), on Plate Count Agar, on YEPD (2% glucose, 1% yeast extract, 1% peptone bacteriological, 2% agar) and on Rose Bengal agar, added to the chloramphenicol and incubated aerobically. All media were purchased from Oxoid.

2.4.2. Growth Kinetics during Fermentation of Beer Wort

The microbiological analysis on the inoculated beer wort were carried out throughout the fermentation period, with sampling after 24, 48 and 72 h and then at 7, 9, 10, 13 and 15 days, followed by plating in the same condition and culture medium as described above for the apricot puree analysis.

2.4.3. Microbial Strains Identification by microFlex™ Mass Spectrometry (MALDI Biotyper, Bruker Daltonik GmbH)

Fresh yeast grown in the YEPD agar medium from M2 after 24 h and 48 h of fermentation was used for identification by microFlex™ mass spectrometry (MALDI Biotyper, Bruker Daltonik GmbH, Bremen, Germany) in positive mode. A small amount of colony material was removed with a toothpick and put on the disposable target. In order to validate the quality of identifications, 1 µL of a matrix consisting of α-cyano-4-hydroxycinnamic acid in 50% acetonitrile and 2.5% trifluoroacetic acid were deposited on the cellular material (Bruker Daltonik GmbH). The spectra were analyzed using MBT Compass® 4.1 software and the attached libraries (Bruker Daltonik GmbH). The assignment of genus and species required scores ≥1.70 and ≥2.00, respectively.

2.5. Standard Quality Attributes of Beers

Original extract (% w/w), real extract (% w/w), apparent extract (% w/w), real degree of fermentation (RDF%), alcohol (% v/v) and density (g/cm3) were measured with a PBA-B generation M (Anton Paar, Graz, Austria). Colour, pH and foam stability (with a NIBEM-OPH foam stability tester—Pentair Haffmans, Zeist, The Netherlands) were measured according to the Analytica-European Brewery Convention method [27].

2.6. Volatiles Profile of Fermented Wort and Beer

Fermented wort and conditioned beer were analyzed in order to obtain the volatile profiles [26,28,29]. A total of 5 mL of the degassed sample was transferred to a 10 mL headspace vial with 1 g of NaCl and 0.05 mL of 1-Butanol as the internal standard (5 g/L in ultra pure water with 5% v/v of absolute ethanol), and then sealed with PTFE/ silicone septa. The volatile compounds were analysed by means of the headspace/solid phase microextraction/gas chromatography–mass spectrometry (HS/SPME/GC/MS) technique using Divinylbenzene/Carboxen/Polydimethylsiloxane (DVB-CAR-PDMS) fiber (Supelco, Bellefonte, PA, USA). For the SPME analysis, the samples were incubated for 10 min at 60 °C, and then extraction was carried out, exposing the fiber to the headspace for 30 min. Both incubation and extraction were performed while stirring the sample. Fiber desorption was done in the injector for 10 min at 250 °C with a split flow of 5 mL/min. The fiber was activated each day following the manufacturer’s instructions. The chromatographic analyses were carried out using a TRACE GC coupled with an ISQ single quadrupole (Thermo Scientific, Hudson, NY, USA). The analytes were separated on a SLB-5 ms capillary column (60 m × 0.25 mm × 0.25 μm film thickness) (Supelco, Bellefonte, PA, USA) using helium as the carrier gas at a 1 mL/min constant flow rate. The oven temperature program started at 35 °C, and this temperature was held for 7 min, and then increased to 200 °C at 3 °C/min and held for a further 7 min, before being increased to 250 °C at 5 °C/min and finally kept at the highest temperature for 10 min. Transfer line and ion source were set at 250 °C and 270 °C, respectively. Quadrupole scan range was 30–250 amu, and ionization energy was set to 70 eV. Chromatographic data were acquired by means of the Trace finder (Thermo Scientific), and identifications were carried out by comparison of the mass spectra with those of the data system library (NIST, 2005 software, Mass Spectral Search Program V.2.0d, Washington, DC, USA version 2.2 June 2014). All Identity Spectrum Match factors above 850 resulting from the NIST Identity Spectrum Search algorithm (NISTMS Search 2.0) were considered acceptable for positive identification. The gas chromatographic signals were manually integrated, and the resulting peak areas were compared with the peak area of the internal standard (As/AIS). For some of the volatile compounds strictly correlated with specific odor characteristics, an absolute quantification was performed by calibration curves (Table 1). Other volatile compounds were semi-quantified and expressed as a function of the concentration of the internal standard [30].

2.7. NMR Analysis

Six groups of samples were analyzed, in particular AP (starting Apricot Puree), FP (apricot Fermented Puree by P. acidilactici), MP (Malt wort added with fermented Puree), M2 (Malt wort with fermented puree inoculated with H. uvarum and subsequently with S. cerevisaie US-05) and T58 (malt wort fermented by S. cerevisiae T-58). All NMR measurements were performed on samples extracted in triplicate.

2.7.1. Sample Preparation for NMR Analysis

Approximately 200 mg of each frozen sample, previously pulverized in liquid nitrogen, was initially lyophilized (Lio5P DM1002, 5 Pascal) and then resuspended in 1.0 mL of 50 mM deuterated phosphate buffer (pH 7.0) containing 1 mM Sodium-3-trimethylsilylpropionate (TMSP-2,2,3,3-D4 98 atom %D, Cambridge Isotope Laboratories). After a centrifugation step (3500 rpm, 5 min at 4 °C), 0.8 mL of the supernatant was transferred to a 5-mm-o.d. NMR tube.
Reference solutions for NMR spiking experiments such as sugars (L-maltose, 99.5% purity,) and organic acids (citric acid, pyruvic acid and formic acid, 99.5% purity, Sigma Aldrich) were also prepared. For each reference compound, a stock solution at a concentration of about 5 mg/L was initially prepared in the same NMR buffer and diluted to 1/10 w/w. NMR spiking was performed by adding small aliquots (10 μL) of each reference solution to the analyzed samples. All sugars used as references were purchased at Sigma Aldrich (Sigma Aldrich, St. Louis, MO, USA).

2.7.2. NMR Measurements

1D 1H NMR spectra were acquired at T = 292 K using a single pulse-acquisition sequence with presaturation of the water signal around 4.8 ppm during the relaxation delay. Calculated hard pulse (90°) length was optimized for each analyzed sample and found to be approximately 11 μs. Spectral data were collected into 64 k data points, within a spectral width of 7183.9 Hz. Then, 4 s of acquisition time (AQ) and 32 scans plus 4 dummy scans were noted. The longest longitudinal relaxation time constant (T1) was measured for each sample by means of standard 1D inversion recovery experiment, and was found to be in the range of 2.89–5.05 s. Consequently, relaxation delays were set so the sum of acquisition time and relaxation delay could be 5 times as long as the longest T1, namely from 15 s to 21 s, in order to allow for the complete relaxation of spins for quantitative NMR purposes. Total acquisition time for each experiment was about 10–15 min.
Compounds identification in the acquired 1D NMR spectra was done by referring to the relevant literature [31] and by comparing the spectra of spiked samples to the spectra of the standard pure compounds available at the Human Metabolome Database (https://hmdb.ca/ accessed on 18 February 2022) [32].
To further confirm assignments, two-dimensional (2D) NMR experiments including 2D 1H–1H total correlation spectroscopy (TOCSY) and heteronuclear single quantum coherence spectroscopy (1H–13C HSQC) were additionally acquired on both spiked and not-spiked samples. A representative 1D NMR spectrum with the main assigned wort metabolites is reported as Supplementary Material (Figure S1). All NMR experiments were carried out using a Bruker Avance 600 MHz spectrometer (Bruker Biospin, Karlsruhe, Germany), equipped with a 5 mm BBI probe.

2.7.3. NMR Quantification of Metabolites

For quantification purposes (qNMR), the acquired raw 1D NMR spectra were loaded into NMRProcFlow [33]. The following spectral pre-processing steps were preliminarily carried out prior to Fourier transformation (FT); all free induction decays were multiplied by an exponential window function to improve signal to noise ratio (S/N), leading to 0.3 Hz line broadening. All FT spectra were then automatically referenced to 0 ppm (TMSP signal), and then phased and baseline corrected. Spectral alignment, based on a Least-Squares algorithm with a shift tolerance of 0.01 ppm, was additionally carried out to overcome signal misalignment. Signal integrations were manually performed by means of user-defined regions of interest (buckets) (Table S1).
To check the accuracy of NMR integrations, signal to noise ratio (S/N) matrices were also generated by NMRProcFlow and an average S/N ratio was extrapolated for each bucket. Buckets that showed an average S/N higher than the lower limit of quantification (LLOQ) of S/N > 10 or superimposed to other signals was taken into account in the relative quantification (namely those corresponding to the functional groups of lysine, pyruvic acid, leucine, valine and the signal from both malic and citric acid, glucose, maltose and dextrins), while only those unambiguously assigned, not overlapped and with S/N > 200 (i.e., ascribed to isoleucine, ethanol, lactate, proline, choline and glycine) were subjected to absolute quantification (mg/mL), in agreement with previous recommendations [34,35]. It should be recalled that integration of NMR signals from glucose, maltose and dextrins can be affected by several technical issues such as interference of water suppression scheme and low S/N; therefore quantification related to such sugars should be considered as indicative in this report (Table S1).

2.8. Sensorial Analysis

The sensory profiles of beers were determined using Descriptive Analysis (DA) [36] with a trained panel (n = 6, males). The panellists employed in the beer DA had on average ten years of experience in beer sensory analysis.
The order of samples presentation was randomised across the panelists and sessions. For the evaluation, samples were served in glasses, and were odour-free and covered with a glass top, at which point each judge had water to rinse his mouth from one sample to the next. Samples were served at a controlled temperature of 16 ± 2 °C in a testing room. To quantify the intensity of the beers’ attributes, the panel used a seven-point horizontally oriented scale anchored as ‘‘not perceived at all’’ and ‘‘extremely intense’’ at the left and right ends, respectively. The panel was trained with orientation sessions, after which it agreed to evaluate the following attributes: for the orthonasal and retronasal odor, fruity and floral and yeast was used; the taste attributes were sweet, sour and bitter; and the tactile sensations were alcoholic and astringent. In order to determine the panel’s performance and any significant difference in their rating, three-way ANOVA (sample, panelist and replicate) with interaction was applied to the attribute scores and collected in three assessments.
The intensity of each attribute was scored to investigate the panel performances, and both MSE and F-values were extracted using PanelCheck software V1.4.0-beta2.

3. Results

3.1. Beer Production

3.1.1. Identification of Yeast Strain in Wort

Microbial strains identification by microFlex™ mass spectrometry (MALDI Biotyper, Bruker Daltonik GmbH) was performed in M2 boiled malt wort with apricot puree after the inoculation with H. uvarum L2 at 24 and 48 h, in order to evaluate the absence of microbial contamination. The identification of the yeast strain from M2 highlighted the presence of H. uvarum (scores of 2.05 ± 0.05 and 2.16 ± 0.03 after 24 h and 48 h, respectively) without any spoilage contamination.

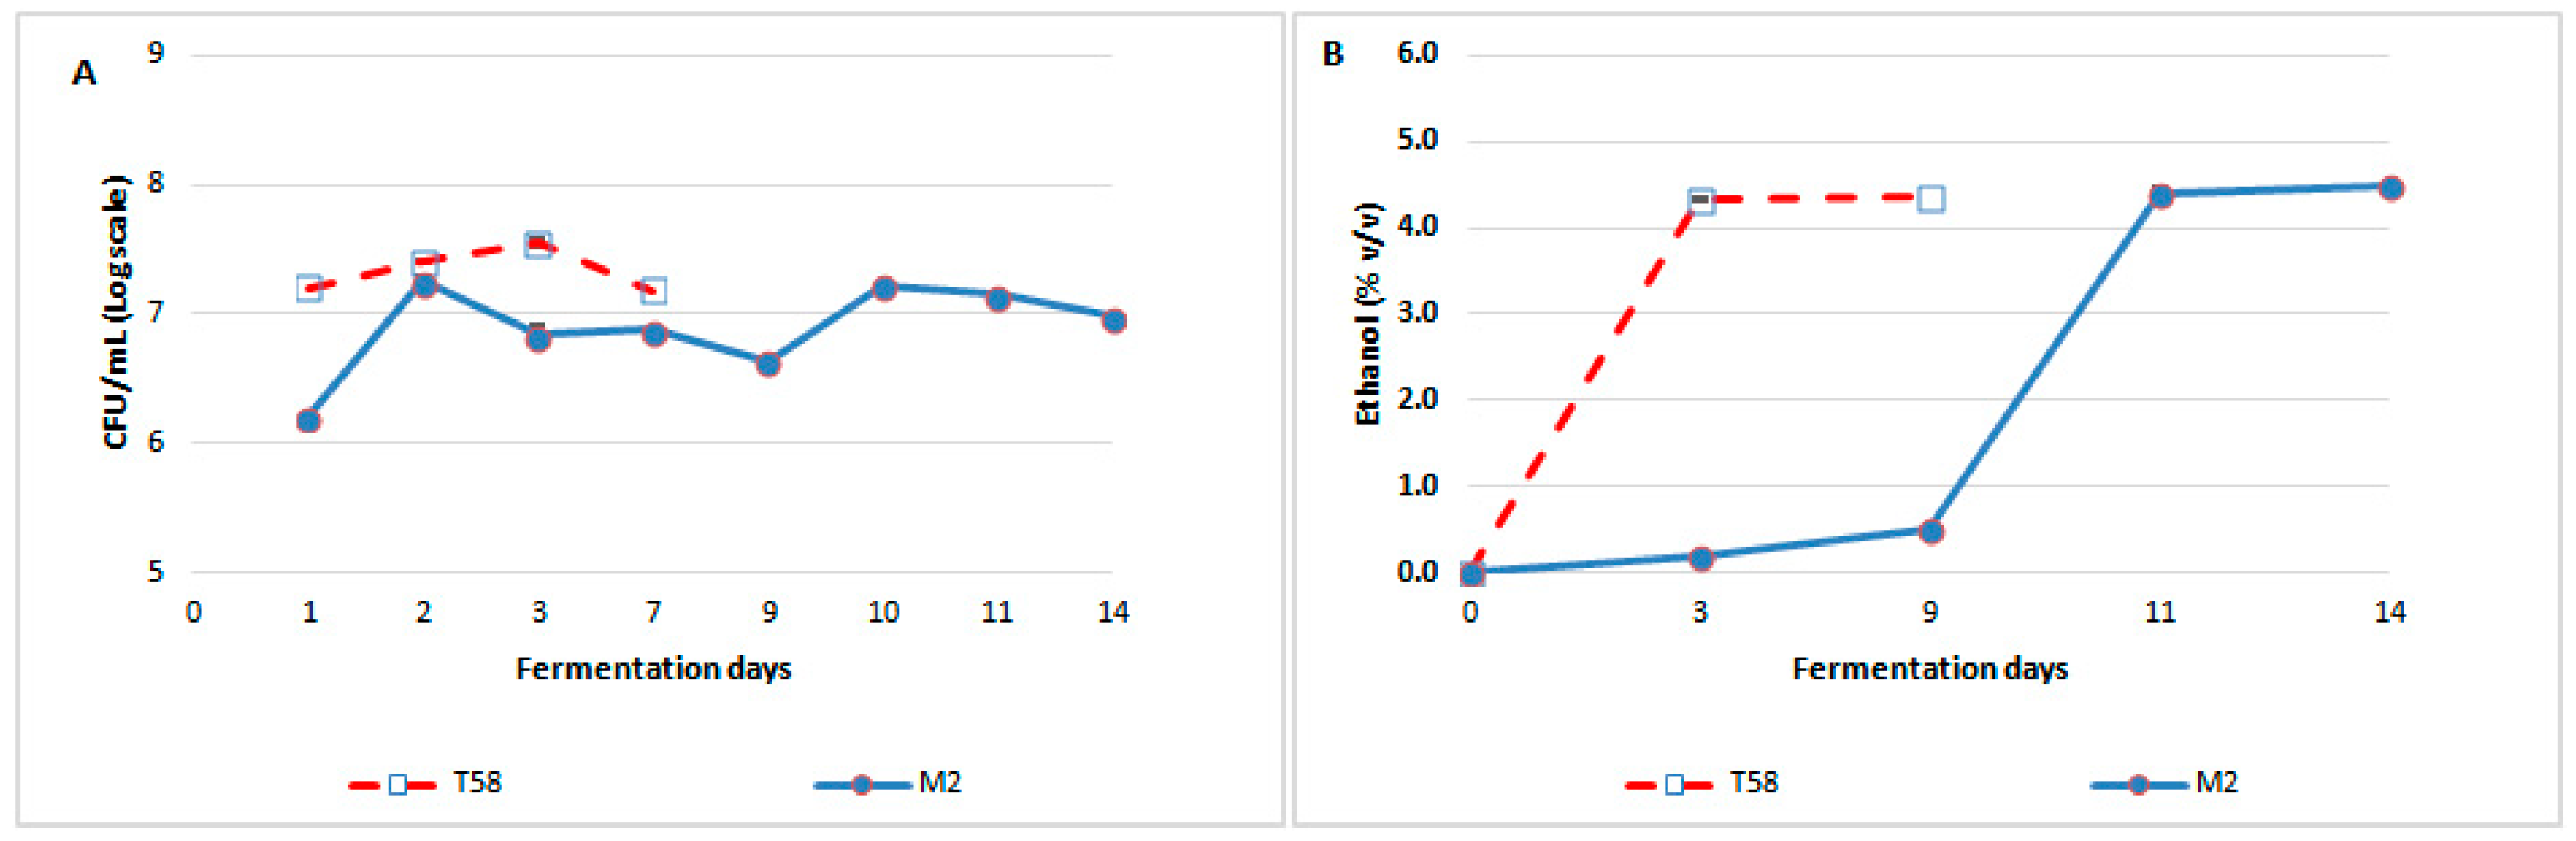
3.1.2. Viable Population Kinetics during Fermentation

The evolution of yeast populations until the reaching of constant ethanol production of M2 and T58 is reported in Figure 1A. Samples from M2 showed the first fermentation step corresponding to the inoculation of H. uvarum (6.1 and 6.3 Log CFU/mL, respectively), which then increased from Day 9, corresponding to the US-05 inoculum, and reaching the highest value (7.2 Log CFU/mL) after 24 h. Then, the ratio decreased until the end of fermentation at the 14th day of observation (7.0 Log CFU/mL). Samples from T58 showed typical fermentation kinetics.
The H. uvarum population evolved was reported by Matraxia et al. during the fermentation of malt wort [14]; however, the cell concentrations remain lower than that of US-05 and T-58 strains.

3.1.3. Ethanol Production Kinetics during Fermentation

H. uvarum produced 0.50% v/v of ethanol after 9 days of fermentations, in agreement with Matraxia et al. (0.52% v/v) [14] and with the previous results reported during the screening of yeast species isolated from the apricot microbiota (0.52% v/v) [26]. After the inoculation of US-05, the ethanol concentrations increased rapidly to 4.4% v/v (11 days), then slowly increased to 4.5% v/v after 14 days of fermentation. The sample control T58 completed the fermentation after 3 days, reaching an ethanol concentration of 4.3% v/v, and remained almost constant after 9 days of fermentations (4.4% v/v) (Figure 1B).

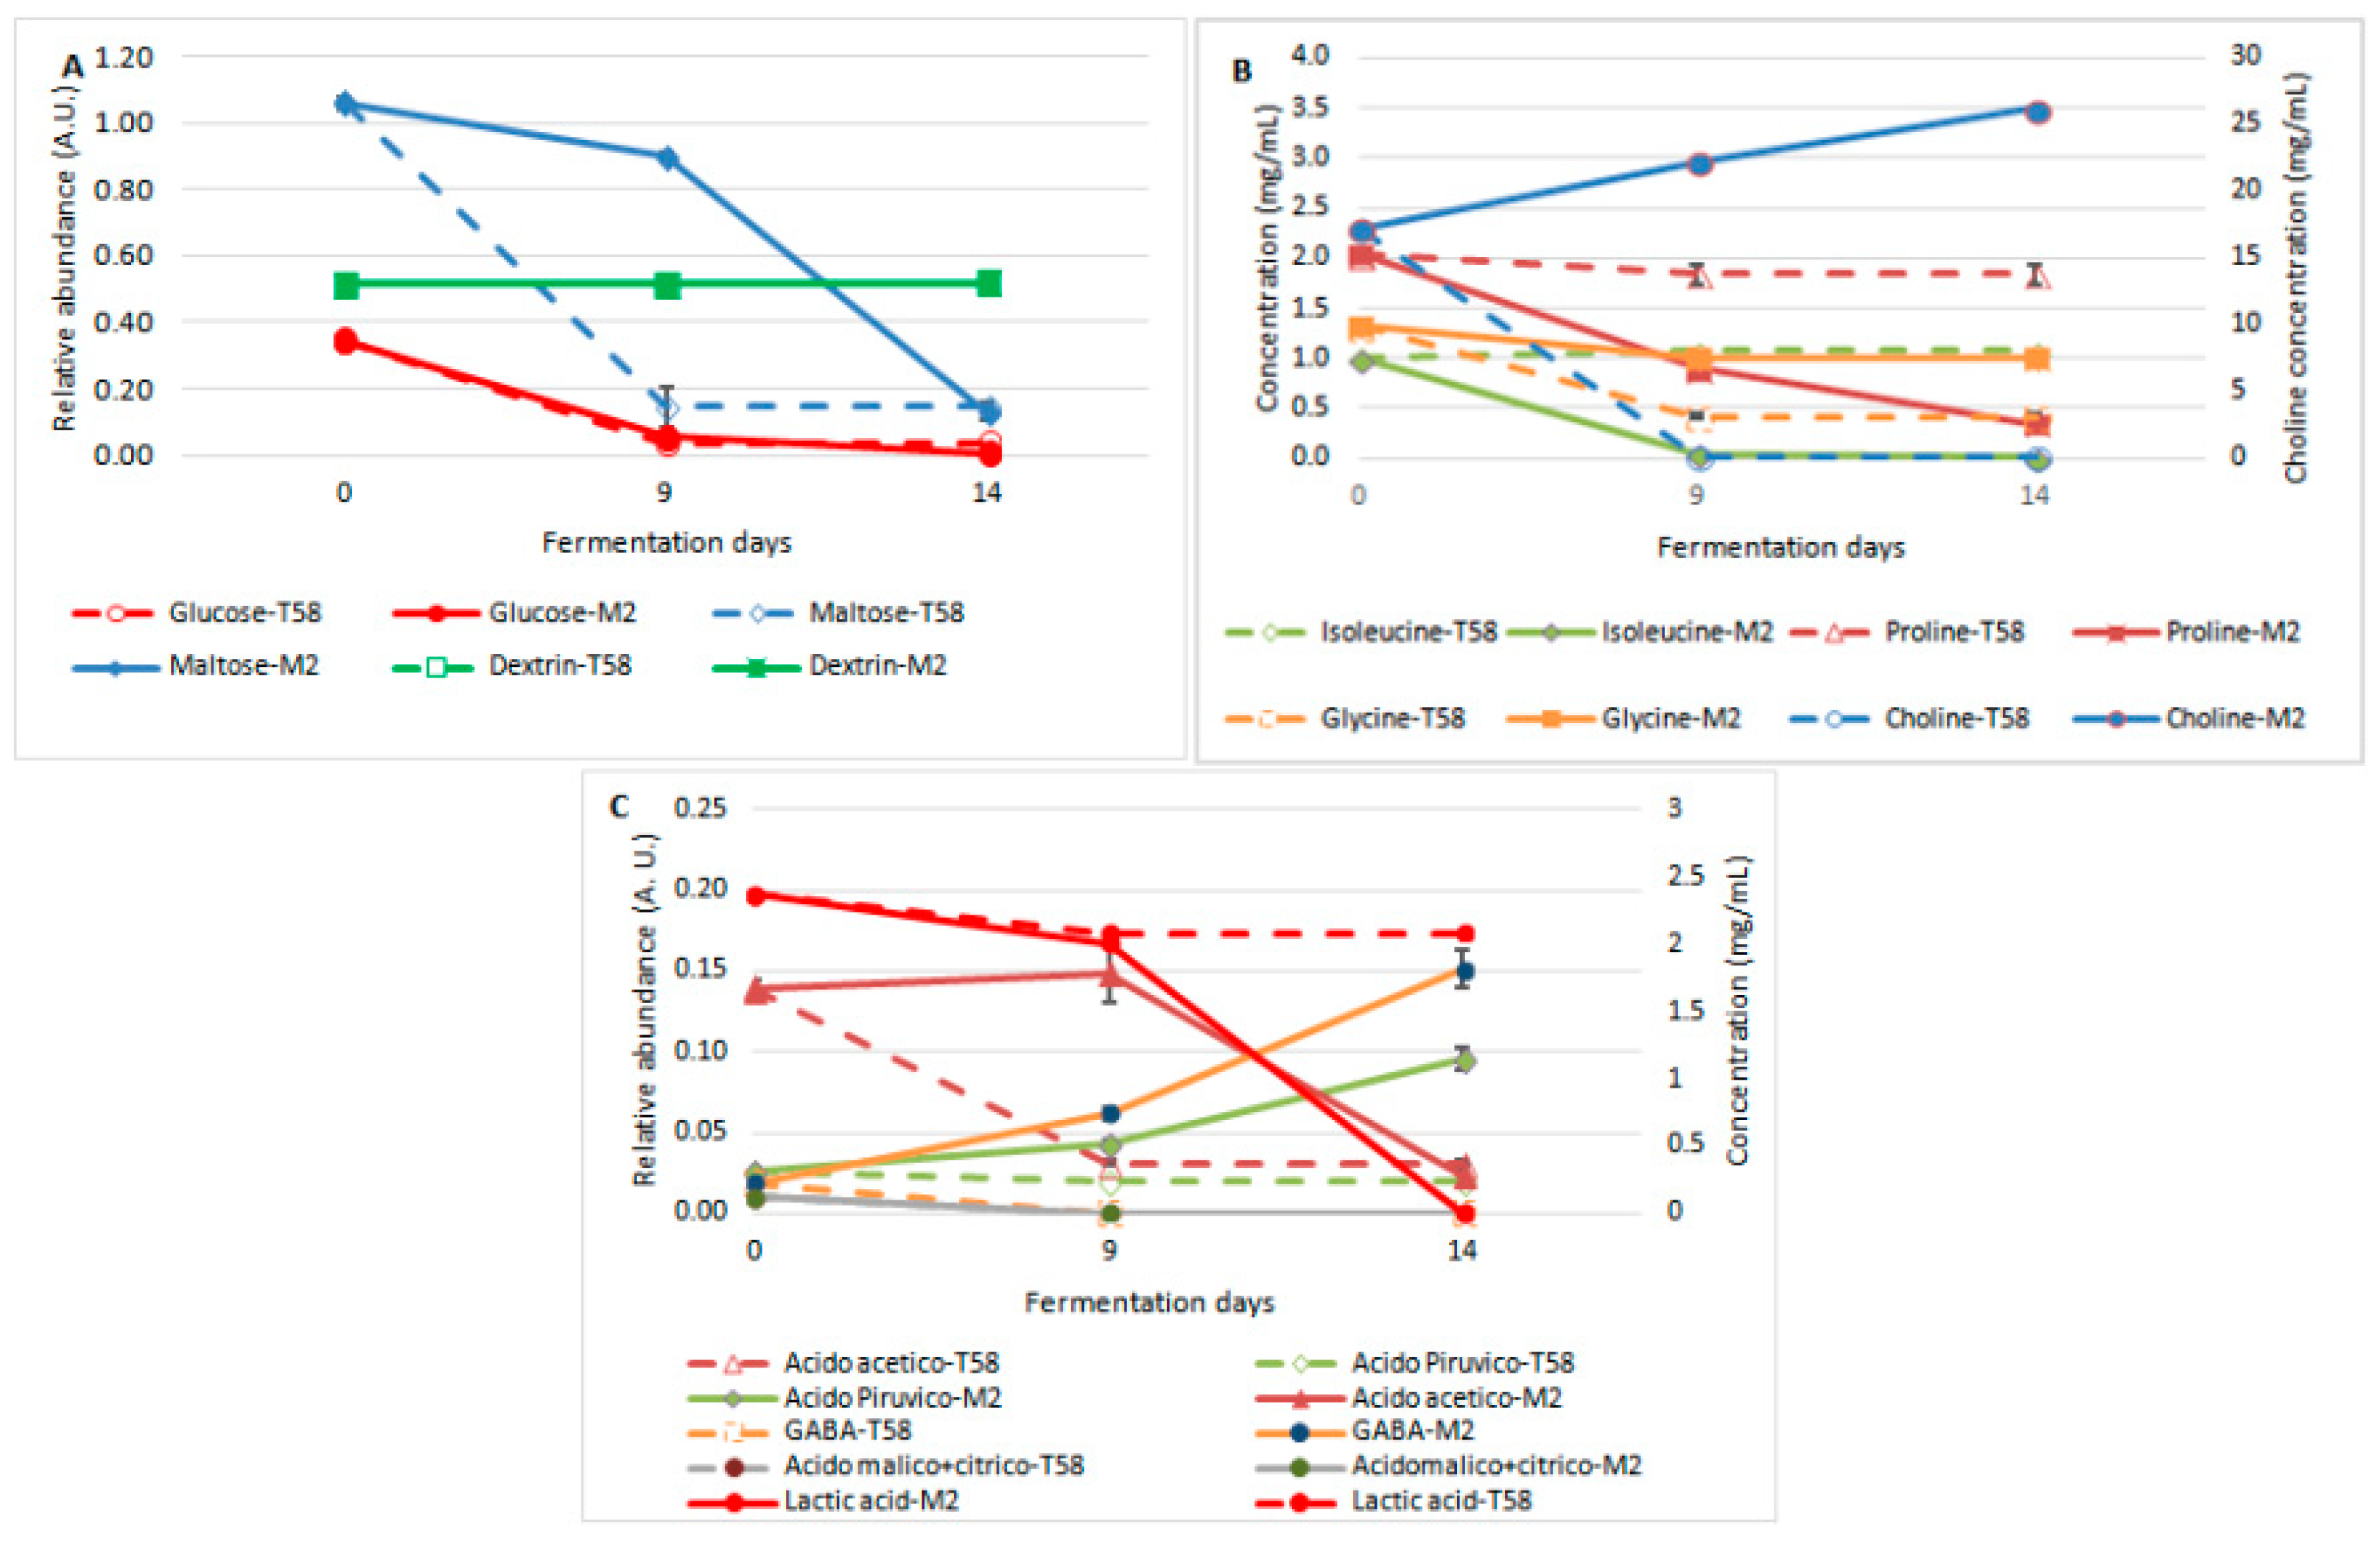
3.1.4. Kinetics of the Carbohydrates, Amino Acids and Acids Concentrations during Fermentation

1H NMR analysis yields a wealth of information about the molecular composition of the two examined wort batches (Figure S1 and Table S1). Moreover, it provides a suitable tool for tracking the metabolites influenced by the fermentative process.
Glucose and dextrin concentrations in both batches (M2 and T58) showed the same trend during fermentation in both batches (M2 and T58). Notably in M2, the maltose level decreased slowly during the first 9 days (corresponding to the H. uvarum fermentation) and more rapidly after the inoculation of US-05 (Figure 2A).
Amino acids and choline concentrations showed different trends in the two fermentation conditions. In particular, choline showed diverging trends: a continuous increase in M2 and a depletion after 9 days in T58. Glycine and proline concentrations decreased in T58, but isoleucine remained almost unvaried. Moreover, a marked decrease of both proline and isoleucine content after 9 days of fermentation was observed in M2 (Figure 2B).
Organic acids were also monitored until the end of fermentation. Lactic acid concentration slightly decreased in both batches until the 9th day, and then rapidly decreased only in M2 (Figure 2C). In T58, the acetic acid amount decreased until the 9th day and then remained steady, whereas the opposite behavior was observed in M2 (Figure 2C).
After 14 days of fermentation, M2 showed higher amount of pyruvic acid than T58 (Figure 2C). Other organic acids were present in smaller amounts or superimposed to other metabolites; thus, absolute quantification was not achieved.

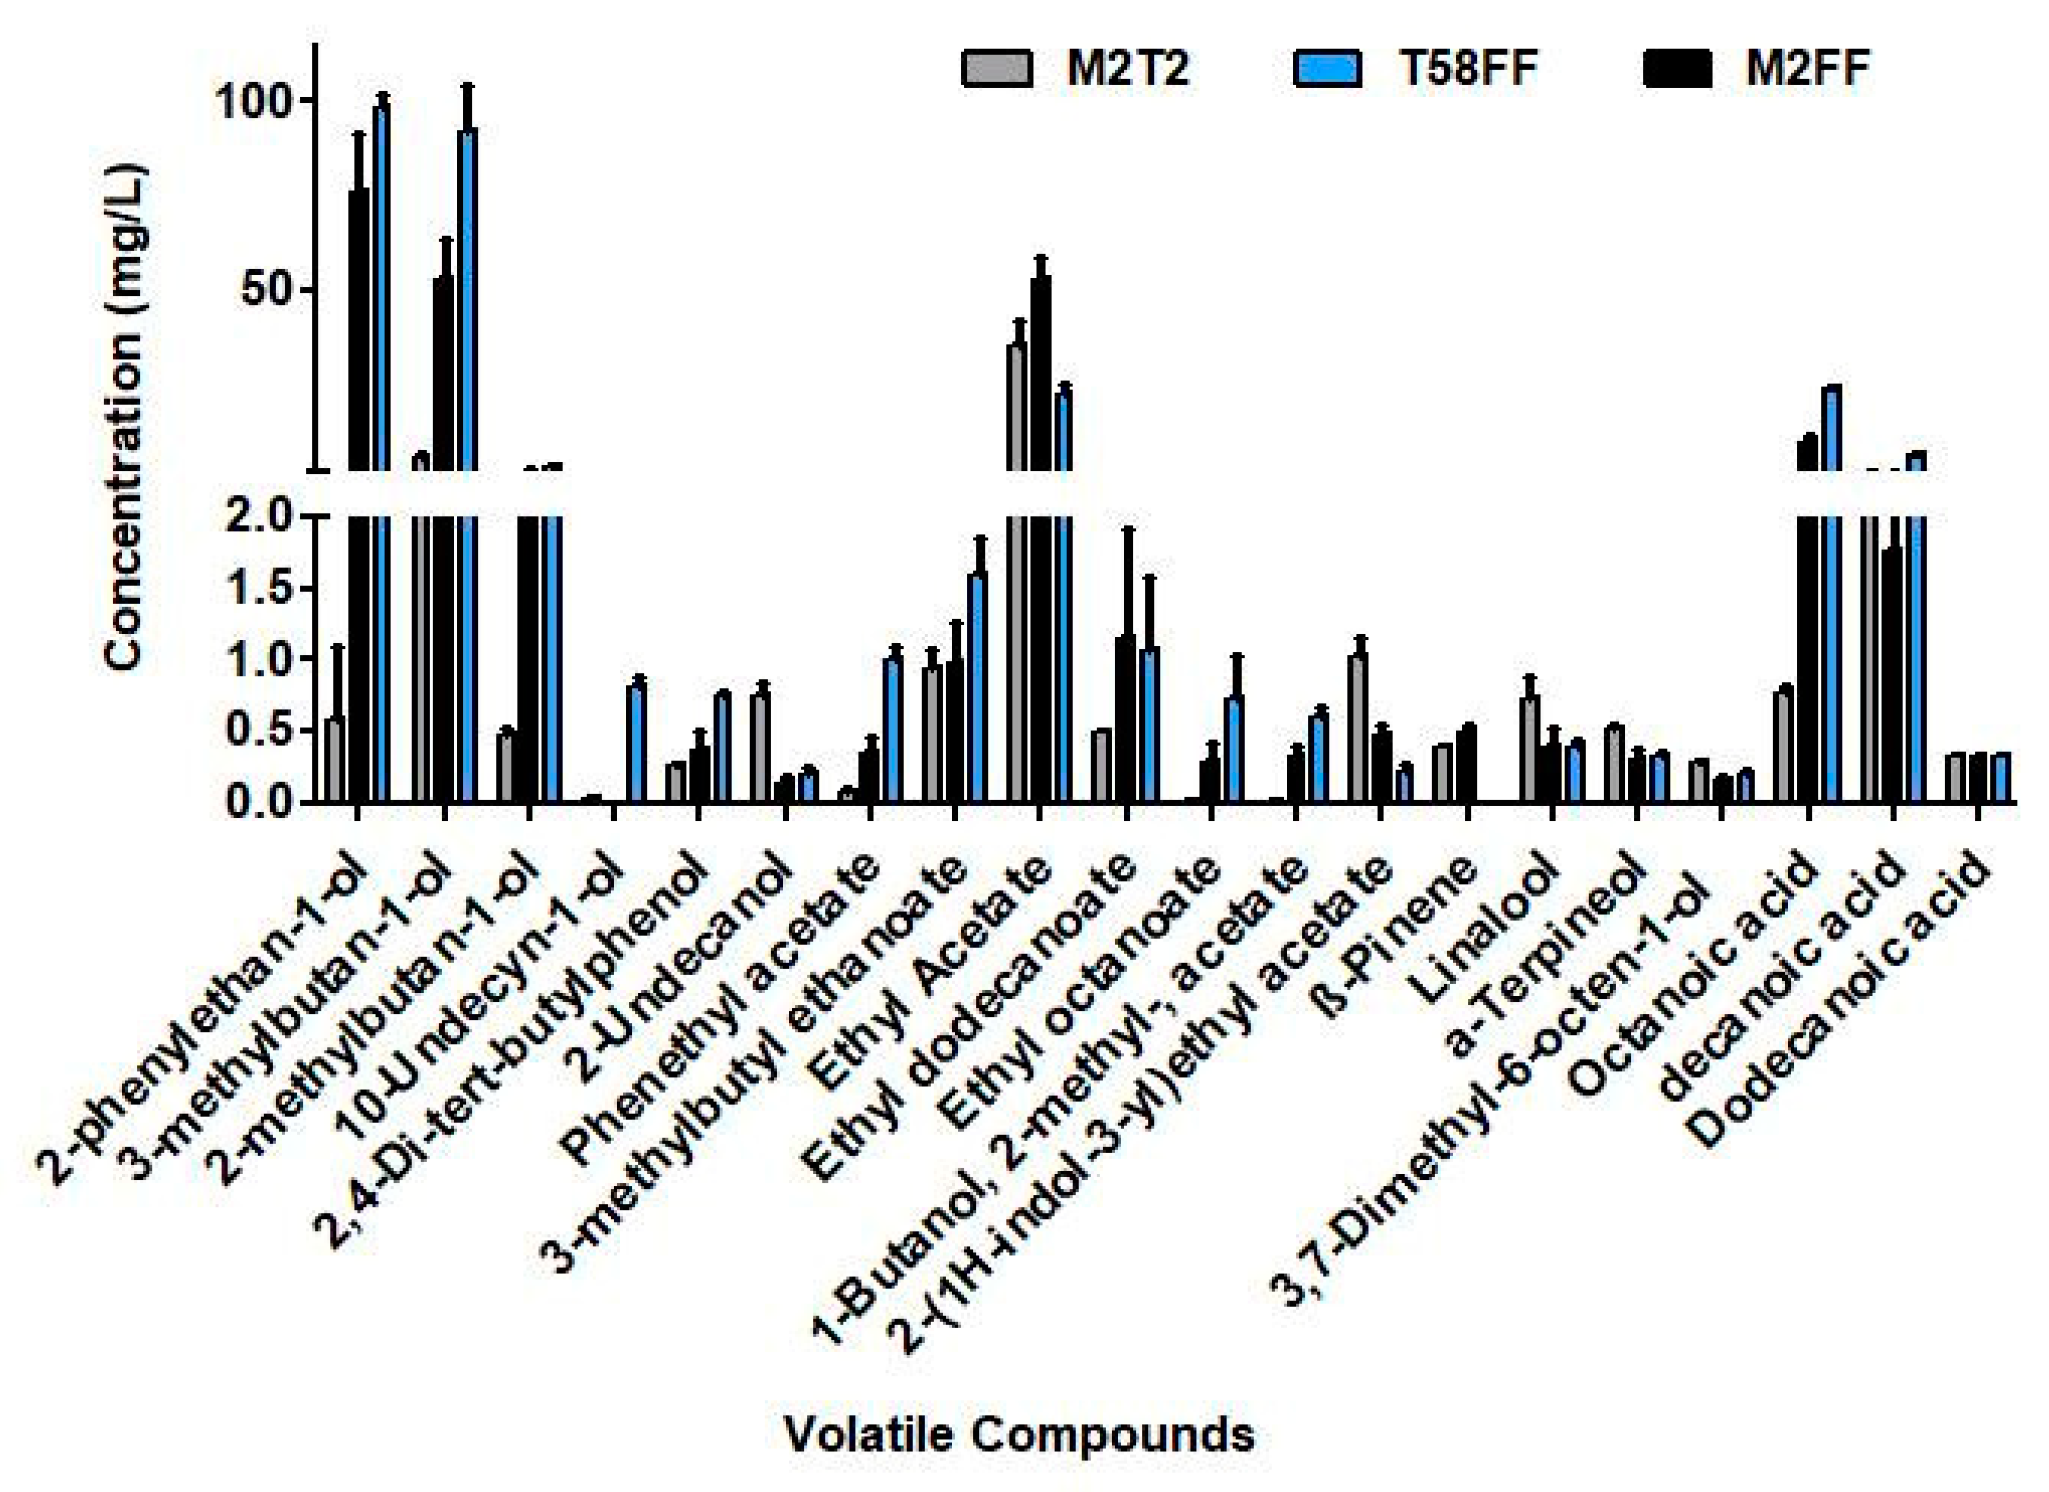
3.1.5. Kinetics of the Volatiles Organic Compounds during Fermentation

In total, 20 volatile compounds were detected and identified by SPME GC/MS in M2 and T58: 6 alcohols, 7 esters, 4 terpenes and 3 carboxylic acids.
After 9 days of fermentation, the concentration of 2-phenylethan-1-ol in M2 (0.59 mg/L) passed its odor thresholds (0.10 mg/L). Instead, 3-metylbutan-1-ol (6.00 mg/L) passed the odor threshold (40.00 mg/L) only after the inoculation of US-05 (52.69 mg/L) (Figure 3).
M2 showed higher levels of ethyl acetate (35.52 mg/L) than T58 (23.06 mg/L), both over the odor threshold of 21.00 mg/L. The 3-methylbutyl ethanoate remained below the odor threshold (1.20 mg/L) in M2 until the end of fermentation (0.98 mg/L), while in T58, it slightly exceeded it (1.6 mg/L). The concentrations of phenylethyl acetate remained below the odor threshold in all samples.
Higher levels of octanoic and decanoic acids were observed in T58 (Figure 3).

3.2. Characterization of Beers

3.2.1. Technological Parameters

For conditioned M2 and T58 beers, the technological parameters were measured (Table 2). Differences were observed, except for RDF and pH. M2 showed higher attenuation as expected according to the S. cerevisiae US-05 characteristics described by the manufacturer.

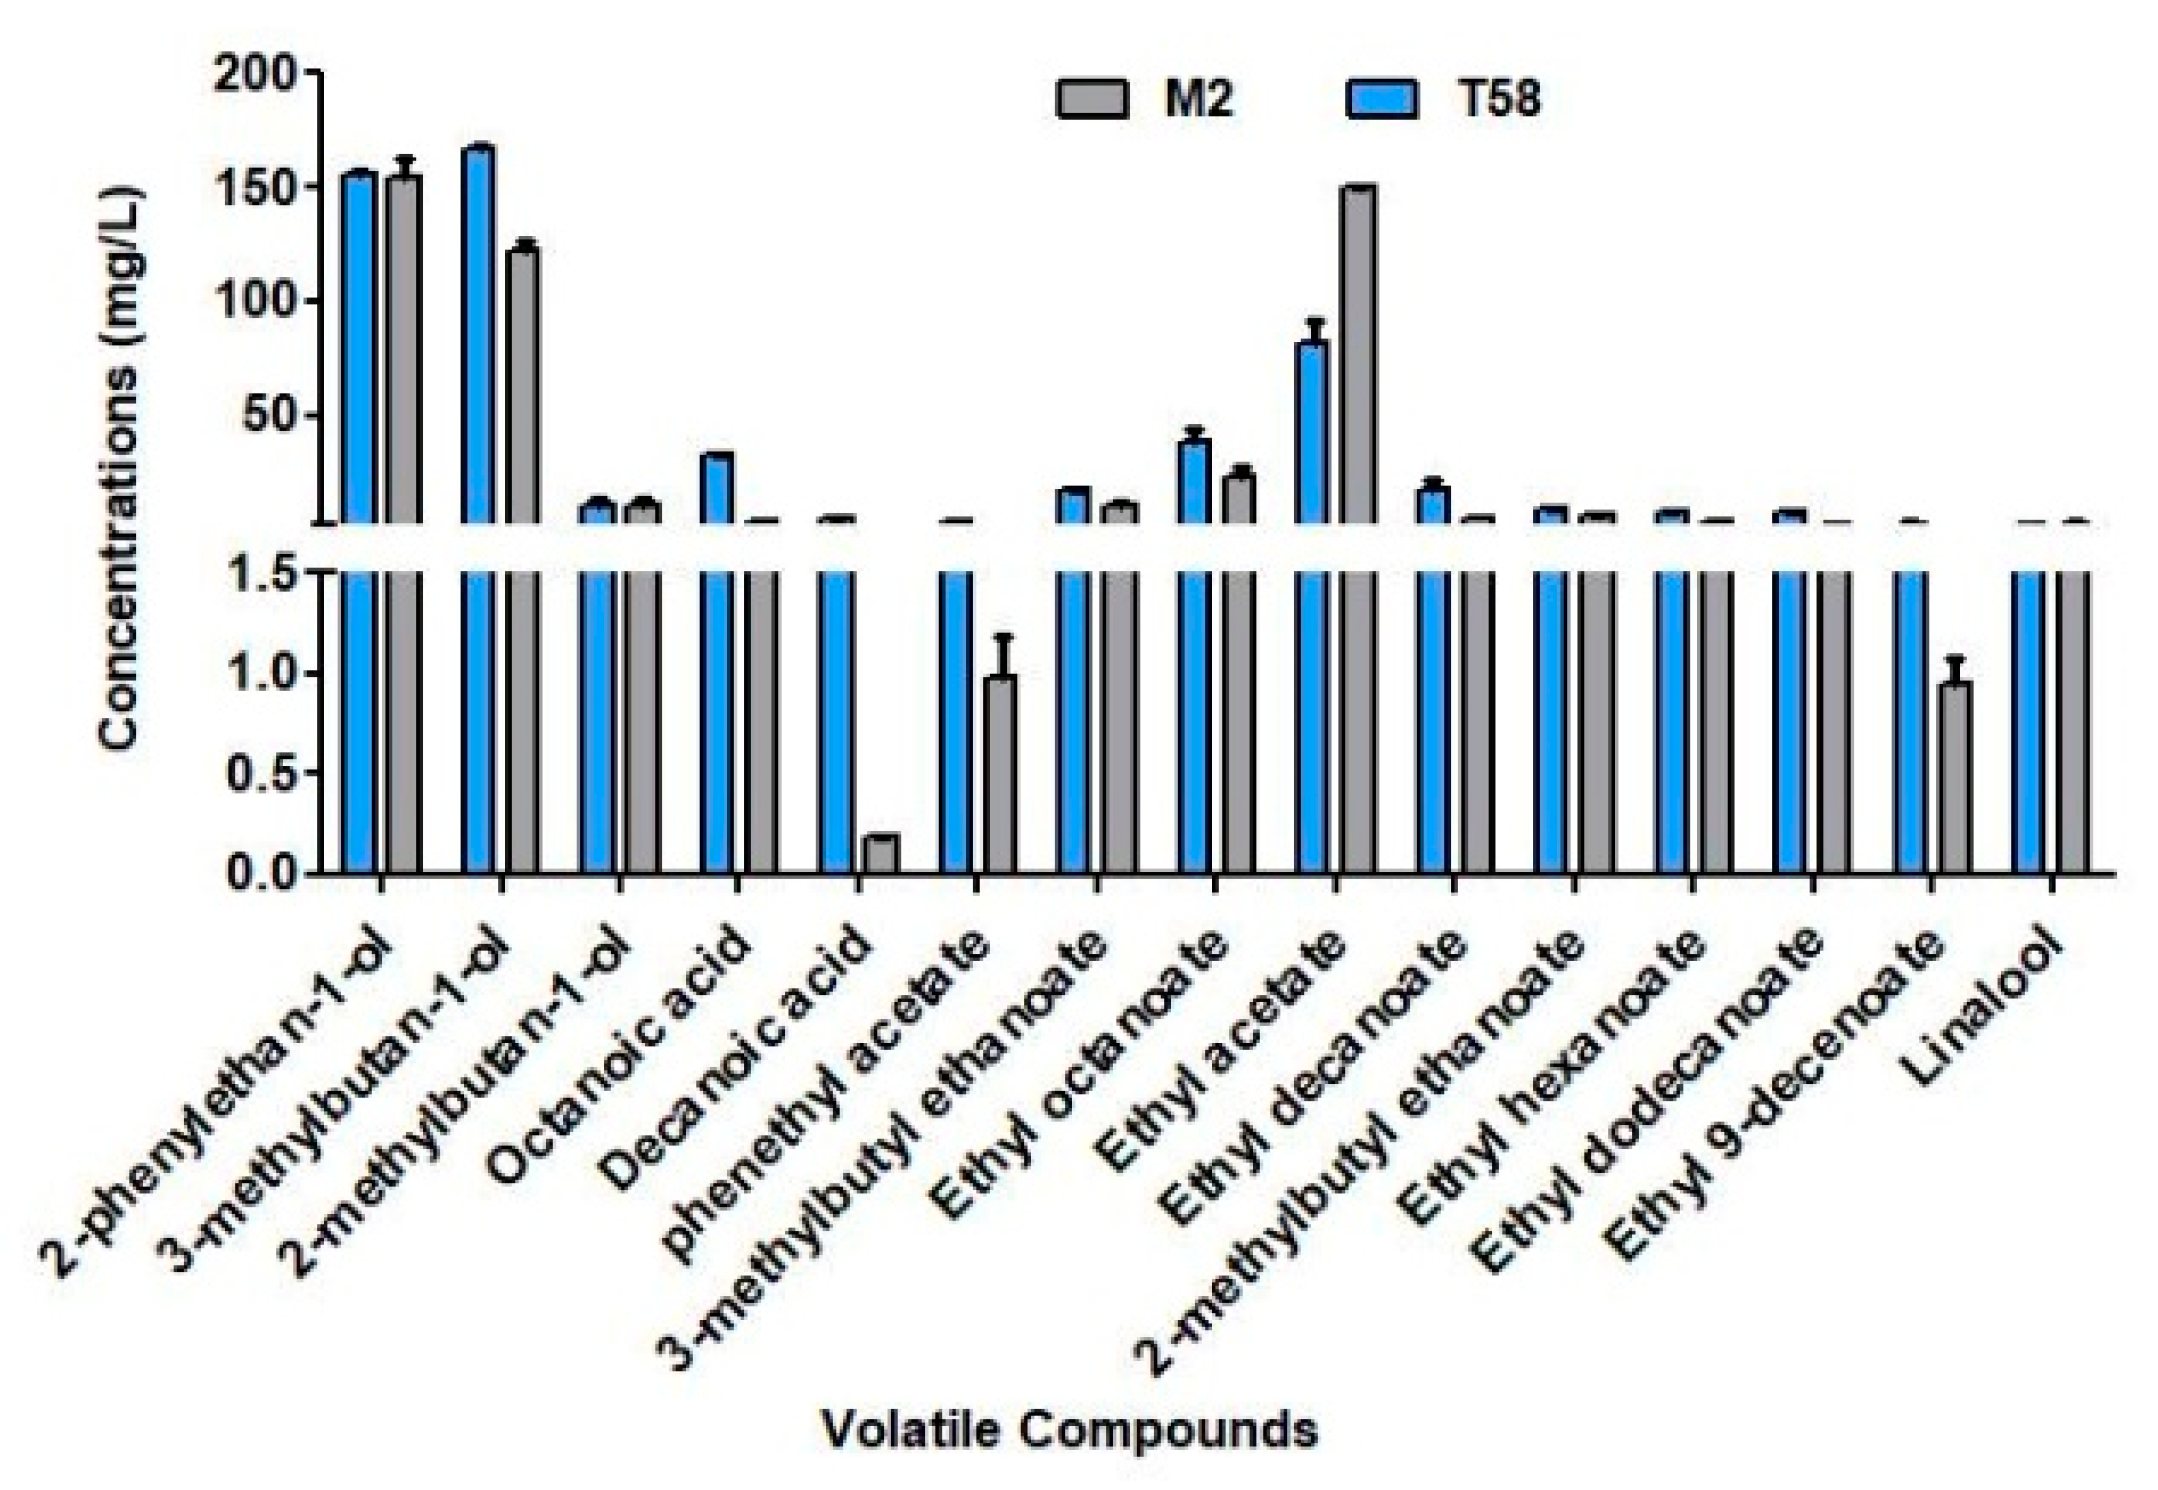
3.2.2. Volatiles Profile

In total, 15 volatile compounds were identified in the conditioned M2 and T58 beers. M2 showed a higher concentration of ethyl acetate, 150 vs. 80 mg/L (threshold 21 mg/L); lower concentrations of 3-methylbutan-1-ol (120 vs. 160 mg/L, threshold 40 mg/L), ethyl octanoate, ethyl decanoate, octanoic acid and decanoic acid were detected in M2 (Figure 4).

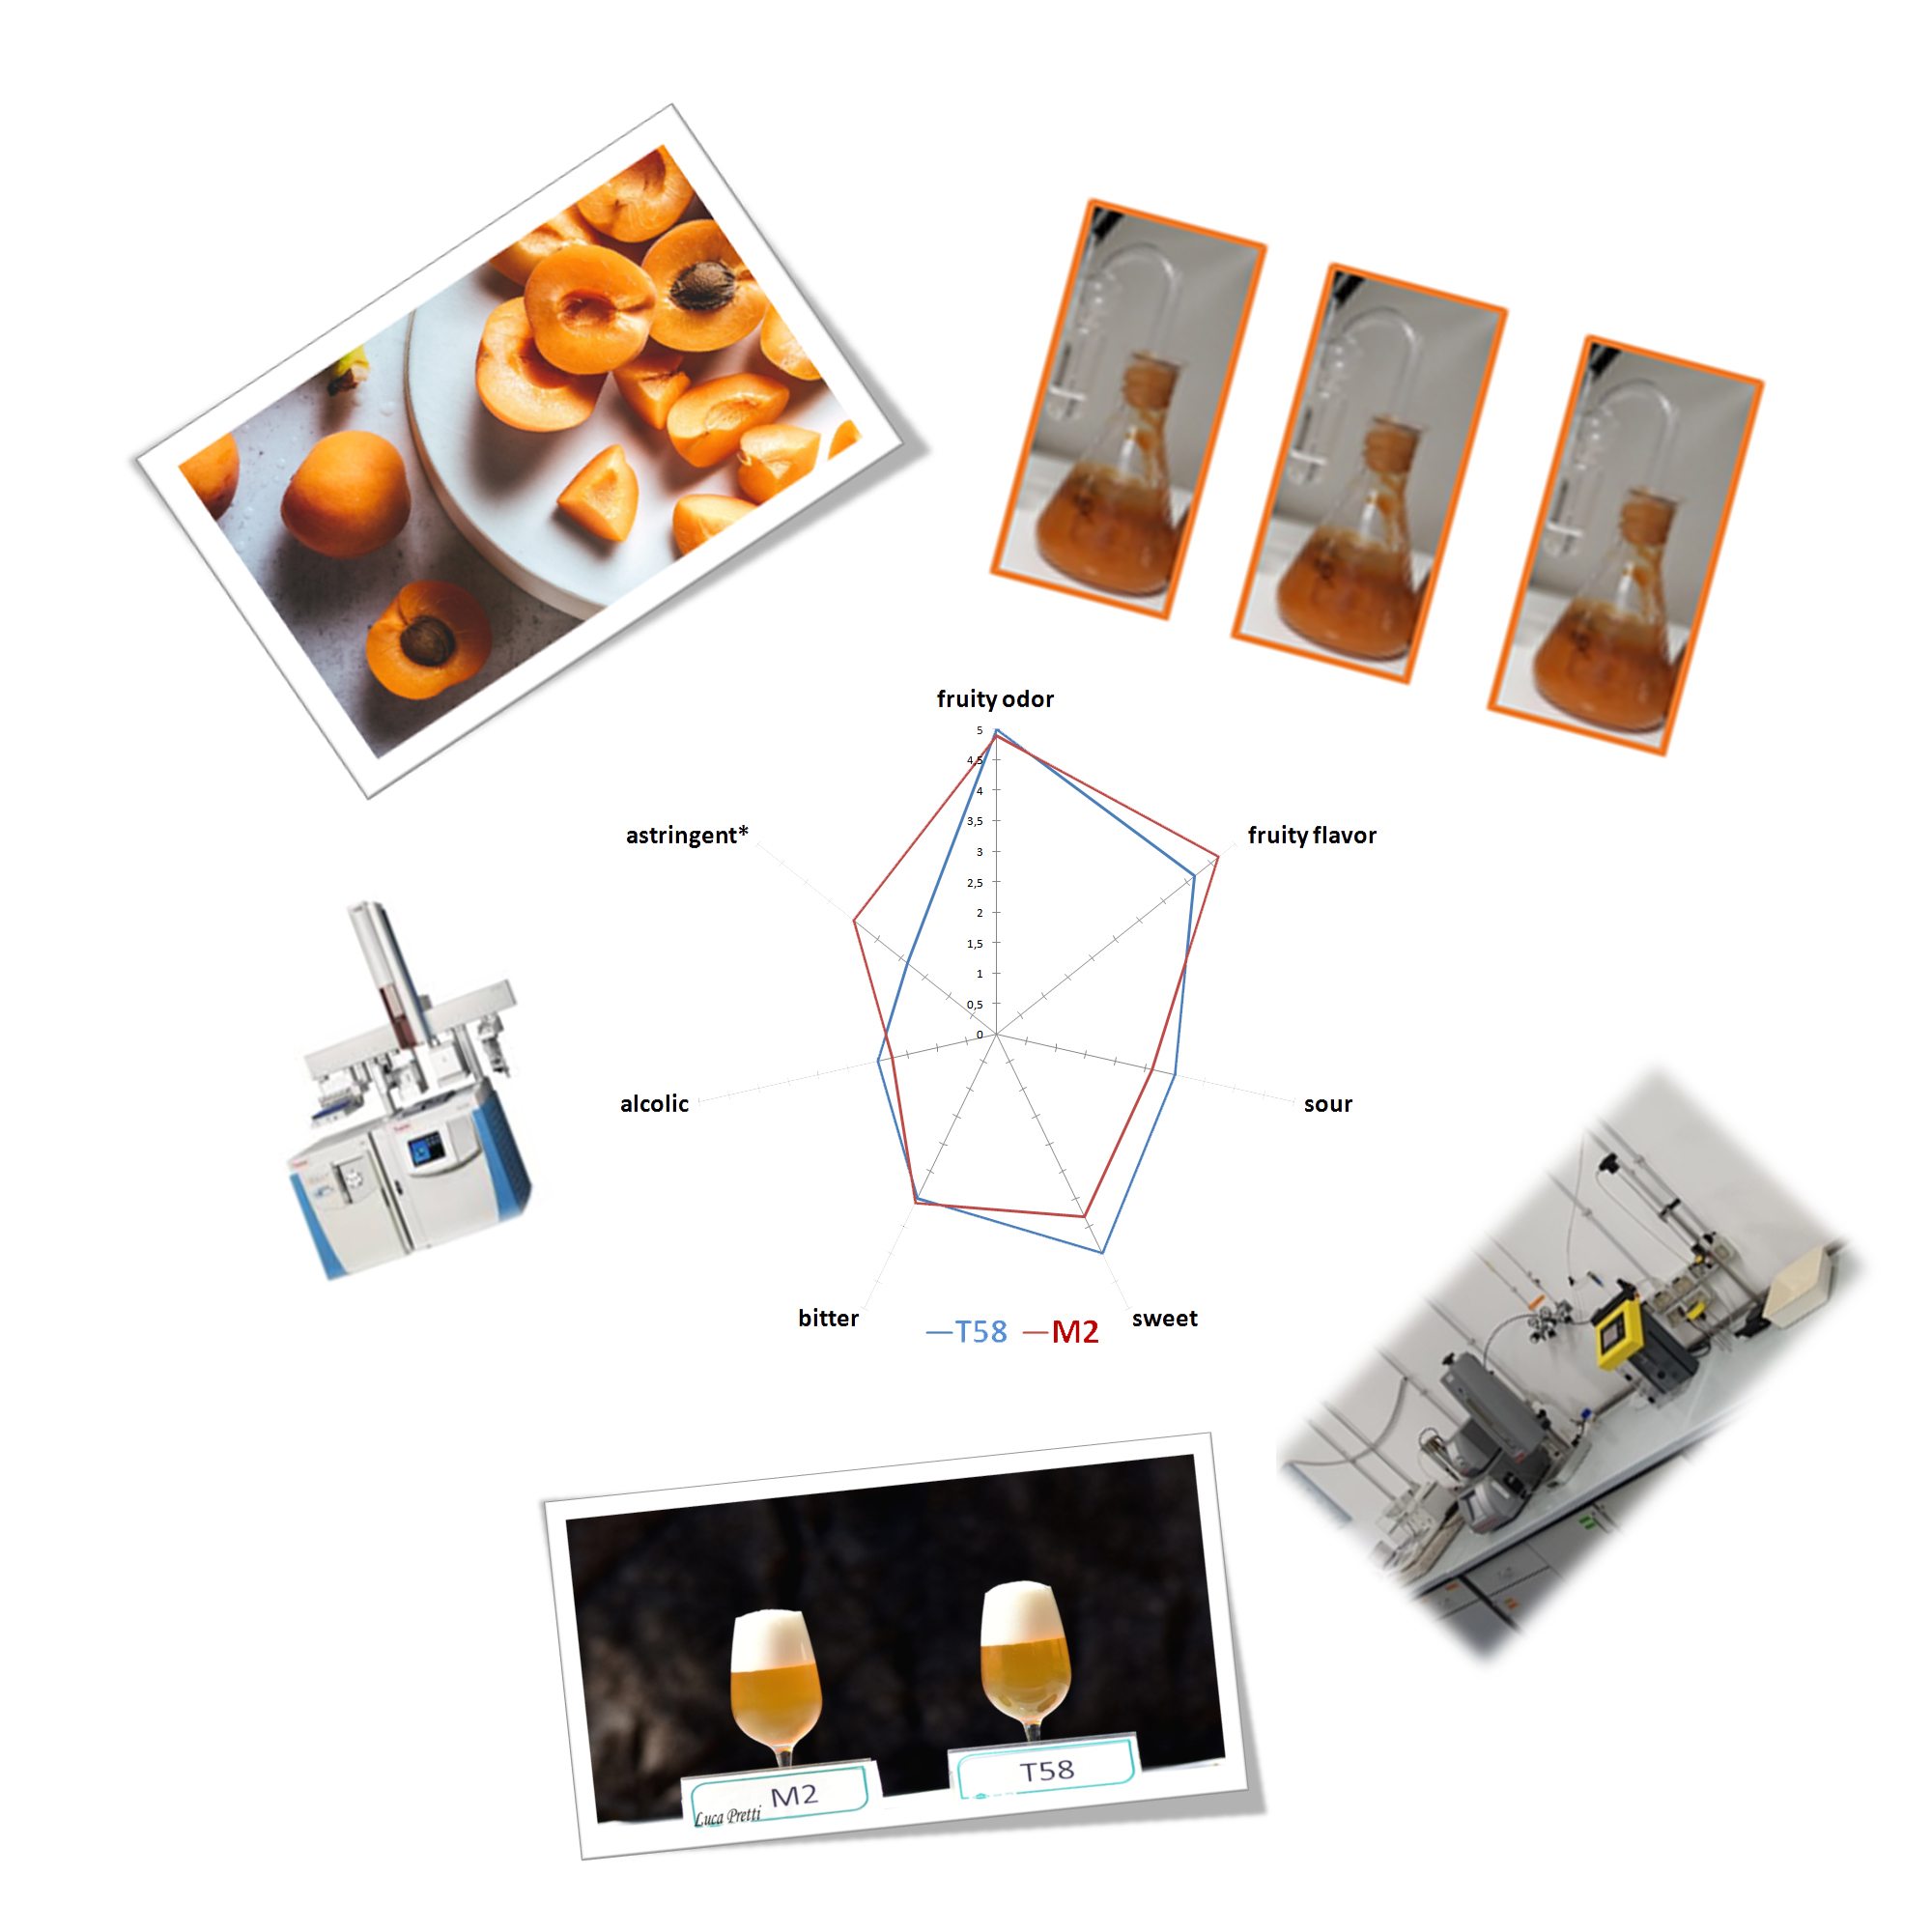
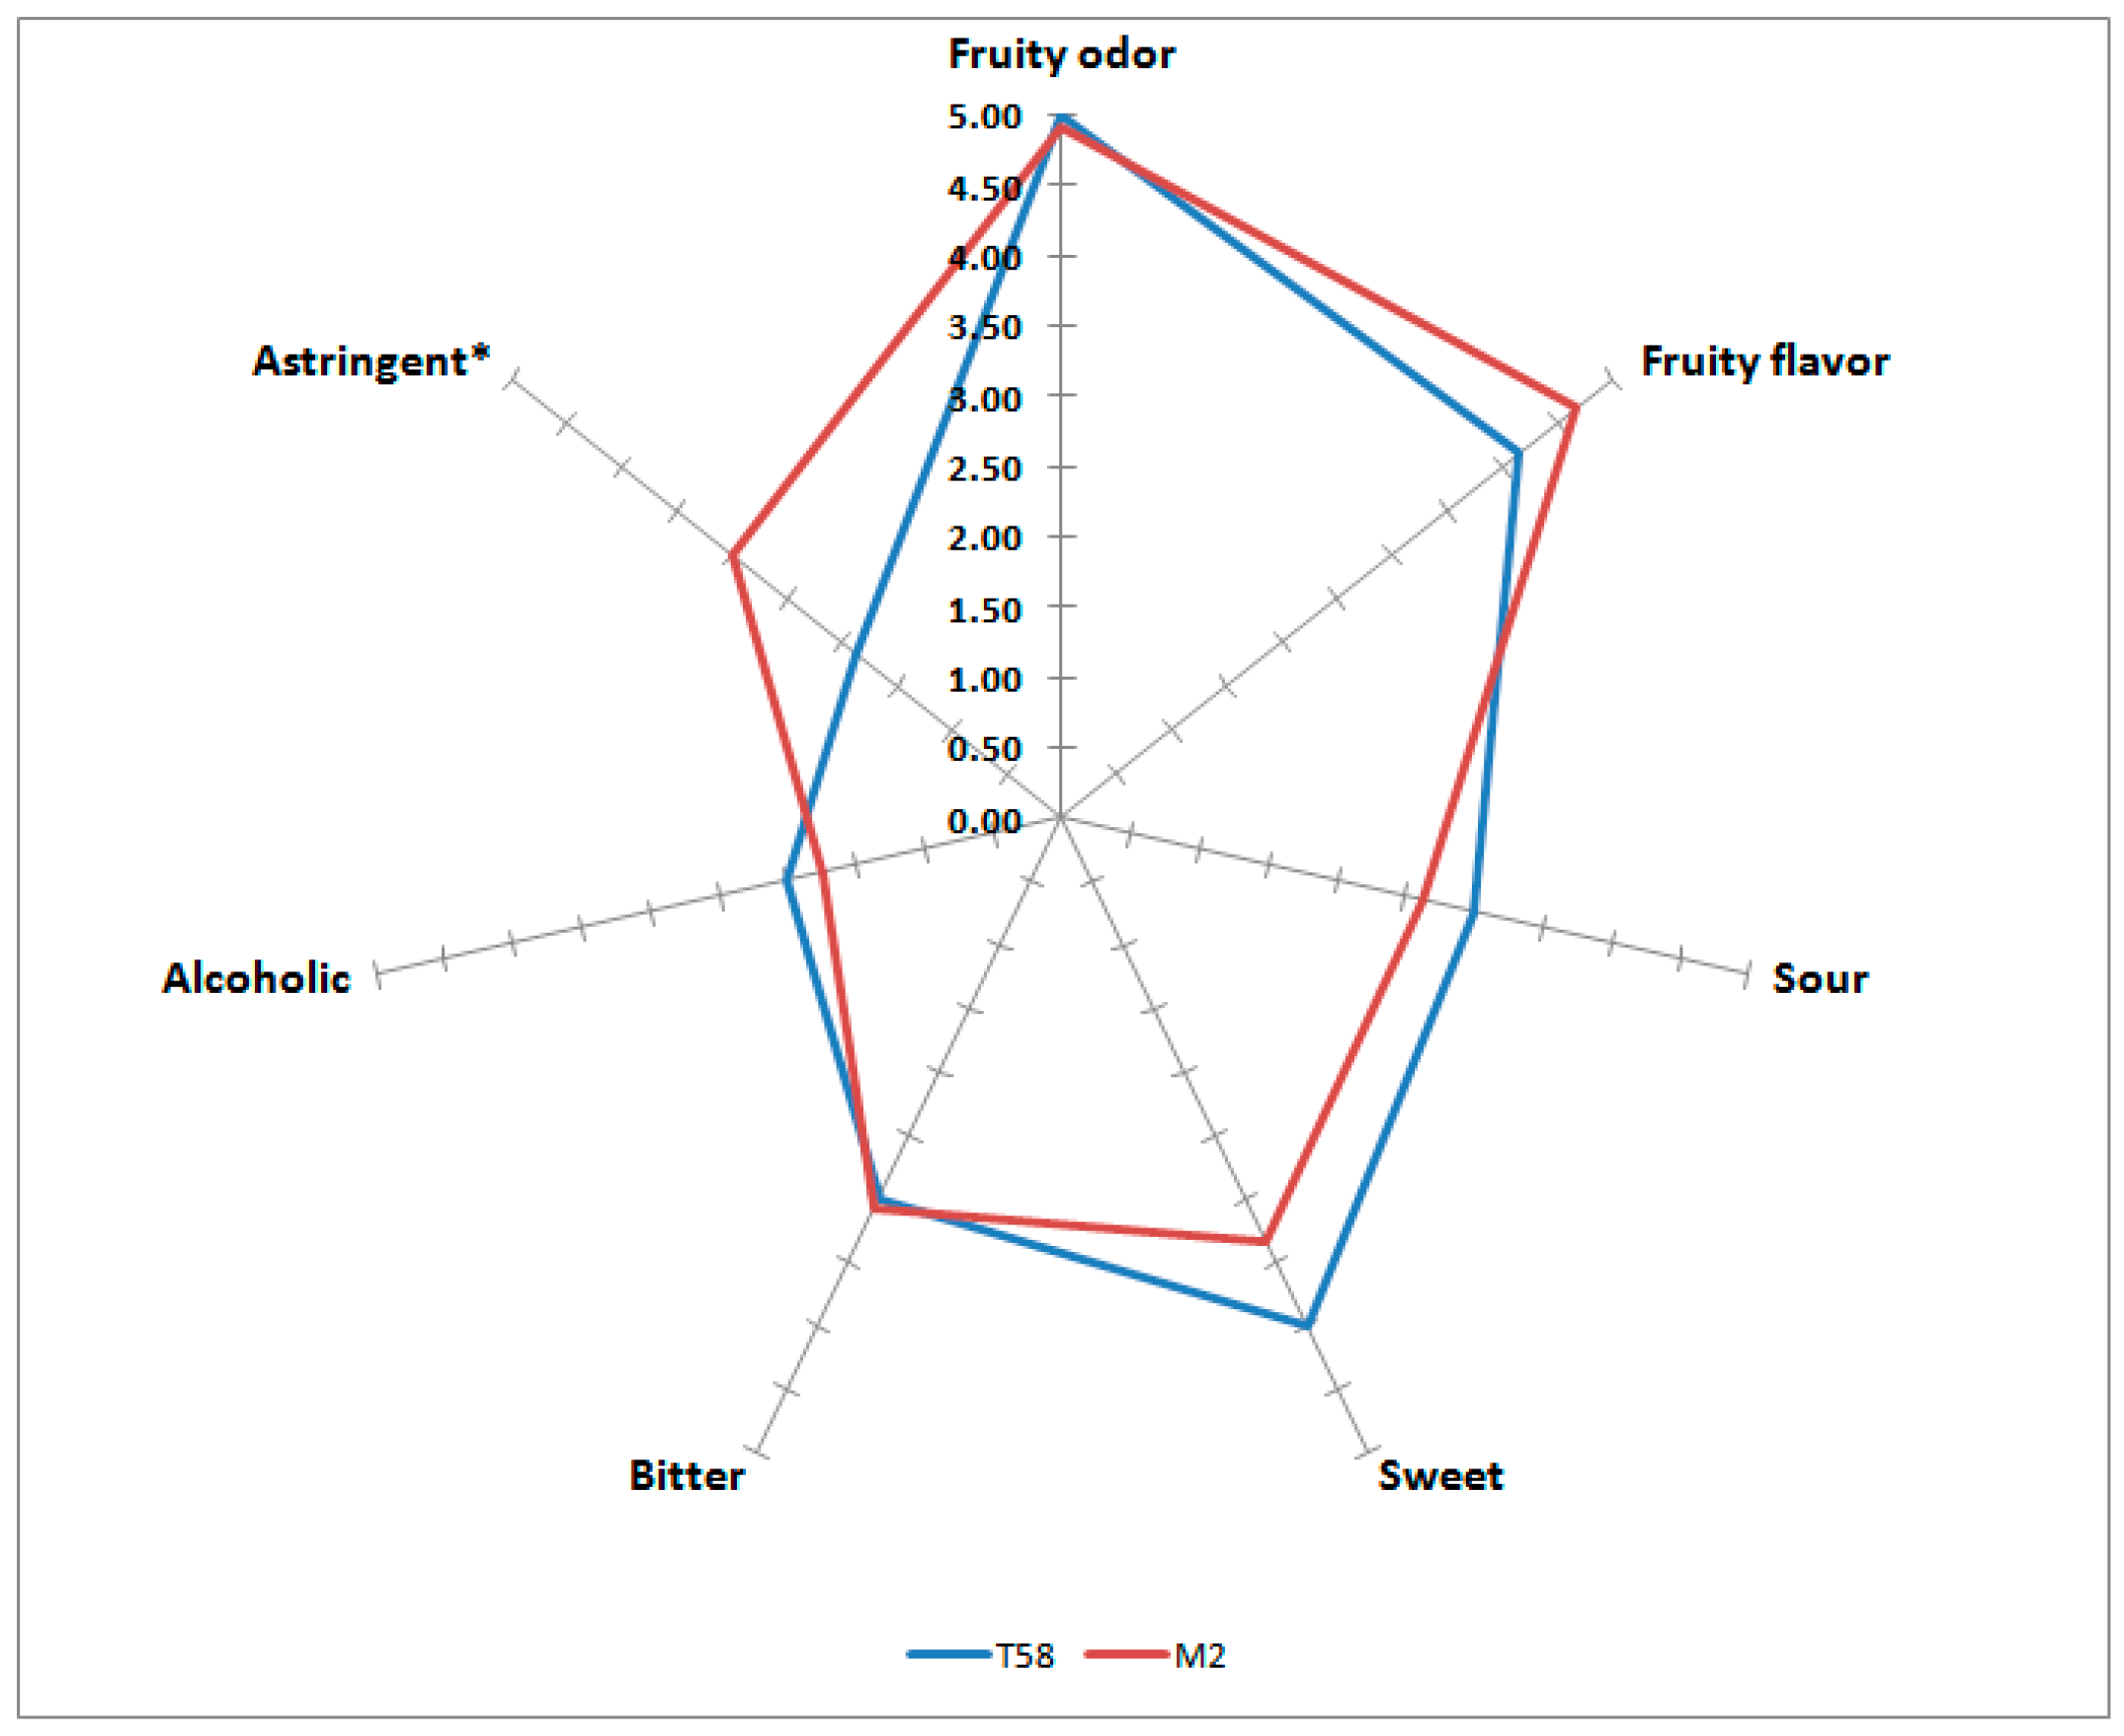
3.2.3. Sensorial Characterization

For six of the considered attributes, the panel could not significantly discriminate between the samples. T58 was evaluated by the panel as less astringent (Figure 5).

4. Discussion

From a political and social standpoint, there is a great emphasis on the environmental sustainability of food production. Craft brewers are looking for solutions that will allow them to produce beers strongly associated with their region, such as using local hops and malts, but also microorganisms and ingredients (herbs, species and fruits) found in traditional foods [8,9,11,13].
Wild yeast strains are diverse and unique, often specific to a particular location, and can allow for obtaining beers with peculiar characteristics [14,15,16,17,18,19,20,21,22,23]. From an analytical point of view, the yeast strains used had a distinctive impact on the beers’ composition.
In order to evaluate the impact of wild yeast and bacteria strains on the final beers, we chose to compare a subsequential fermentation using the H. uvarum L2 strain (a wild “non-conventional” yeast isolated from apricot Bisucciu apricot variety) and S. cerevisiae US-05 (a neutral industrial yeast) with a fermentation obtained from T58 (an industrial yeast known for its intense fruity and spicy flavors).
As showed in our results, H. uvarum L2 fermentation in M2 before the S. cerevisiae US-05 inoculum shows a volatile profile composition similar to T58 at the end of fermentation, but with higher levels of ethyl acetate and lower levels of 3-methylbutyl ethanoate (Figure 3 and Figure 4). These data confirm that the brewing yeast used can characterize the aroma profile in the final beers. This agrees with other works in which non-Saccharomyces yeast were used in mixed fermentations with pure S. cerevisiae starter strains [37,38,39].
Non-Saccharomyces yeasts have opened up the opportunity for using different techniques to make specialty and unique beers.
Hanseniaspora spp. and other yeast genera can provide a diverse enzymatic apparatus and bioconversion abilities that enable brewers to work with new concepts such as bioflavoring, as well as beers with lower calorie and alcohol contents, or even functional beers.
Nonetheless, the introduction of a new yeast must be previously studied, because each microorganism is unique, and can develop a range of adaptations in different substrates or conditions [40].
The kinetics of biotransformations in wort due to the different yeast used showed interesting results. Acetic acid, known to contribute to the overall acidity of beer, and balance out the sweetness of the malt and the bitterness of the hops, in our study showed different behavior during the two fermentations. Acetic acid concentration most likely derived from fermented apricot puree is not metabolized in the fermentation phase corresponding to H. uvarum L2 activity, whereas the inoculum in M2 of S. cerevisiae US-05 drives the concentration of acetic acid to the same level found at the end of the T58 beer (Figure 2C). The concentration of lactic acid does not appear to be affected by either H. uvarum L2 or S. cerevisiae T-58 metabolism. During the two fermentations, choline shows a rising trend in M2 (Figure 2B). Choline is an essential component of phosphatidylcholine, a component of cell membranes, a precursor to the neurotransmitter acetylcholine, which is important for liver function, brain development and cardiovascular health [41,42,43].
Except for the foam, higher in M2 and tightness, there are no significant technological differences between the beers produced in the two fermentations (Table 2). The presence of lipids can have an effect on this parameter. T58, which has the highest levels of octanoic and decanoic acid, shows a lower foam stability.
In conclusion, the use of local fruit in beer production can provide a wide variety of flavors and aromas, allowing for greater diversification of beer styles and contributing to the preservation of biodiversity by encouraging the cultivation of local species [2,9,11,28].
Furthermore, they may be more resistant to environmental conditions, and breweries may be able to source yeast locally, reducing the need for transportation and the associated carbon footprint.

5. Conclusions

The use of fruit from local germoplasms and microorganisms isolated from it, and comparing their technological properties to an industrial yeast, allowed us to highlight some peculiarities.
Under these conditions, H. uvarum L2 and the lactic acid bacteria P. acidilactici B5 provide a sensory profile similar to the industrial yeast chosen, but in a shorter time, with a low ethanol content and a higher concentration of choline, opening new, healthier productive perspectives. Moreover, the experiment showed the possibility of obtaining sustainable productions linked to the territory, valorizing local biodiversity. Recent craft brewery revolutions have stimulated new research fields to evaluate the qualities and opportunities of new technologies and microbiological resources.
However, because every microbe is different and has the capacity to adapt to a variety of substrates and environmental conditions, the introduction of a new yeast must be planned in advance.

Supplementary Materials

The following supporting information can be downloaded at https://www.mdpi.com/article/10.3390/fermentation9030305/s1, Figure S1: 1H NMR assignment of metabolites in beer wort. Table S1: List of the metabolites identified by 1H NMR analysis in beer wort.

Author Contributions

Conceptualization, L.P.; methodology, L.P., R.A. and G.Z.; formal analysis, M.S. and D.P.; investigation, A.V., D.P., A.B. (Angela Bianco), R.A., A.B. (Angela Braca) and M.S.; resources, A.V., D.P. and R.M.; Data Curation L.P.; writing—original draft preparation, A.V., L.P., M.C.P. and M.R.; writing—review and editing, L.P., M.C.P., R.A., M.R., M.B. and G.Z.; supervision, L.P.; project administration, L.P.; funding acquisition, L.P. All authors have read and agreed to the published version of the manuscript.

Funding

This research was funded by Sardegna FESR 2014/2020-Asse Prioritario I, “Ricerca scientifica, sviluppo tecnologico e innovazione”, Action 1.1.4-Sostegno alle attività collaborative di R&S per lo sviluppo di nuove tecnologie sostenibili, di nuovi prodotti e servizi, “Sviluppo sostenibile della birra artigianale in Sardegna”.

Institutional Review Board Statement

Not applicable.

Informed Consent Statement

Not applicable.

Data Availability Statement

Not applicable.

Acknowledgments

M.N. gratefully acknowledges Sardinia Regional Government for the financial support of their research grant: “Sviluppo sostenibile della birra artigianale in Sardegna”.

Conflicts of Interest

The authors declare no conflict of interest. The funders had no role in the design of the study; in the collection, analyses, or interpretation of data; in the writing of the manuscript, or in the decision to publish the results.

References

  1. Caon, G.; Morrone, M.; Feistauer, L.; Sganzerla, D.; Moreira, J.C.F. Moderate beer consumption promotes silymarin-like redox status without affecting the liver integrity in vivo. Food Biosci. 2021, 43, 101307. [Google Scholar] [CrossRef]
  2. Martínez, A.; Vegara, S.; Martí, N.; Valero, M.; Saura, D. Physicochemical characterization of special persimmon fruit beers using bohemian pilsner malt as a base. J. Inst. Brew. 2017, 123, 319–327. [Google Scholar] [CrossRef] [Green Version]
  3. Aquilani, B.; Laureti, T.; Poponi, S.; Secondi, L. Beer choice and consumption determinants when craft beers are tasted: An exploratory study of consumer preferences. Food Qual. Prefer. 2015, 41, 214–224. [Google Scholar] [CrossRef]
  4. Mongelli, A.; Rodolfi, M.; Ganino, T.; Marieschi, M.; Caligiani, A.; Dall’Asta, C.; Bruni, R. Are Humulus lupulus L. ecotypes and cultivars suitable for the cultivation of aromatic hop in Italy? A phytochemical approach. Ind. Crops Prod. 2016, 83, 693–700. [Google Scholar] [CrossRef]
  5. Forteschi, M.; Porcu, M.C.; Fanari, M.; Zinellu, M.; Secchi, N.; Buiatti, S.; Passaghe, P.; Bertoli, S.; Pretti, L. Quality assessment of Cascade Hop (Humulus lupulus L.) grown in Sardinia. Eur. Food Res. Technol. 2019, 245, 863–871. [Google Scholar] [CrossRef]
  6. Alfeo, V.; Jaskula-Goiris, B.; Venora, G.; Schimmenti, E.; Aerts, G.; Todaro, A. Screening of durum wheat landraces (Triticum turgidum subsp. durum) for the malting suitability. J. Cereal Sci. 2018, 83, 101–109. [Google Scholar] [CrossRef]
  7. Benedetti, P.; Salvi, S.; Giomo, A.; Van Deun, R.; Boselli, E.; Frega, N.G. Taste-active Components of Beers from Emmer Wheat (Triticum dicoccum) Malt. Sci. Agric. Bohem. 2016, 47, 82–89. [Google Scholar] [CrossRef] [Green Version]
  8. Denby, C.M.; Li, R.A.; Vu, V.T.; Costello, Z.; Lin, W.; Chan, L.J.G.; Williams, J.; Donaldson, B.; Bamforth, C.W.; Petzold, C.J.; et al. Industrial brewing yeast engineered for the production of primary flavor determinants in hopped beer. Nat. Commun. 2018, 9, 965. [Google Scholar] [CrossRef] [PubMed] [Green Version]
  9. Ducruet, J.; Rebenaque, P.; Diserens, S.; Kosinska-Cagnazzo, A.; Heritier, I.; Andlauer, W. Amber ale beer enriched with goji berries—The effect on bioactive compound content and sensorial properties. Food Chem. 2017, 226, 109–118. [Google Scholar] [CrossRef] [PubMed]
  10. Mayer, H.; Ceccaroni, D.; Marconi, O.; Sileoni, V.; Perretti, G.; Fantozzi, P. Development of an all rice malt beer: A gluten free alternative. LWT-Food Sci. Technol. 2016, 67, 67–73. [Google Scholar] [CrossRef]
  11. De Simone, N.; Russo, P.; Tufariello, M.; Fragasso, M.; Solimando, M.; Capozzi, V.; Grieco, F.; Spano, G. Autochthonous Biological Resources for the Production of Regional Craft Beers: Exploring Possible Contributions of Cereals, Hops, Microbes, and Other Ingredients. Foods 2021, 10, 1831. [Google Scholar] [CrossRef] [PubMed]
  12. Strong, G.; England, K. BJCP Beer Style Guidelines; Beer Judge Certification Program: Minneapolis, MN, USA, 2021. [Google Scholar]
  13. Garavaglia, C. The Emergence of Italian Craft Breweries and the Development of Their Local Identity. In The Geography of Beer: Culture and Economics; Hoalst-Pullen, N., Patterson, M.W., Eds.; Springer International Publishing: Cham, Switzerland, 2020; pp. 135–147. [Google Scholar]
  14. Matraxia, M.; Alfonzo, A.; Prestianni, R.; Francesca, N.; Gaglio, R.; Todaro, A.; Alfeo, V.; Perretti, G.; Columba, P.; Settanni, L.; et al. Non-conventional yeasts from fermented honey by-products: Focus on Hanseniaspora uvarum strains for craft beer production. Food Microbiol. 2021, 99, 103806. [Google Scholar] [CrossRef] [PubMed]
  15. Iattici, F.; Catallo, M.; Solieri, L. Designing New Yeasts for Craft Brewing: When Natural Biodiversity Meets Biotechnology. Beverages 2020, 6, 3. [Google Scholar] [CrossRef] [Green Version]
  16. Marongiu, A.; Zara, G.; Legras, J.L.; Del Caro, A.; Mascia, I.; Fadda, C.; Budroni, M. Novel starters for old processes: Use of Saccharomyces cerevisiae strains isolated from artisanal sourdough for craft beer production at a brewery scale. J. Ind. Microbiol. Biotechnol. 2015, 42, 85–92. [Google Scholar] [CrossRef]
  17. Mascia, I.; Fadda, C.; Dostalek, P.; Karabin, M.; Zara, G.; Budroni, M. Is it possible to create an innovative craft durum wheat beer with sourdough yeasts? A case study. J. Inst. Brew. 2015, 121, 283–286. [Google Scholar] [CrossRef]
  18. Catallo, M.; Nikulin, J.; Johansson, L.; Krogerus, K.; Laitinen, M.; Magalhães, F.; Piironen, M.; Mikkelson, A.; Randazzo, C.L.; Solieri, L.; et al. Sourdough derived strains of Saccharomyces cerevisiae. and their potential for farmhouse ale brewing. J. Inst. Brew. 2020, 126, 168–175. [Google Scholar] [CrossRef] [Green Version]
  19. Pires, E.J.; Teixeira, J.A.; Brányik, T.; Vicente, A.A. Yeast: The soul of beer’s aroma—A review of flavour-active esters and higher alcohols produced by the brewing yeast. Appl. Microbiol. Biotechnol. 2014, 98, 1937–1949. [Google Scholar] [CrossRef] [Green Version]
  20. Holt, S.; Mukherjee, V.; Lievens, B.; Verstrepen, K.J.; Thevelein, J.M. Bioflavoring by non-conventional yeasts in sequential beer fermentations. Food Microbiol. 2018, 72, 55–66. [Google Scholar] [CrossRef]
  21. Serra Colomer, M.; Funch, B.; Forster, J. The raise of Brettanomyces yeast species for beer production. Curr. Opin. Biotechnol. 2019, 56, 30–35. [Google Scholar] [CrossRef]
  22. Tataridis, P.; Kanelis, A.; Logotetis, S.; Nerancis, E. Use of non-Saccharomyces Torulaspora delbrueckii yeast strains in winemaking and brewing. Zb. Matice Srp. Za Prir. Nauk. 2013, 124, 415–426. [Google Scholar] [CrossRef]
  23. Larroque, M.N.; Carrau, F.; Farina, L.; Boido, E.; Dellacassa, E.; Medina, K. Effect of Saccharomyces and non-Saccharomyces native yeasts on beer aroma compounds. Int. J. Food Microbiol. 2021, 337, 108953. [Google Scholar] [CrossRef] [PubMed]
  24. Andrés-Iglesias, C.; Montero, O.; Sancho, D.; Blanco, C.A. New trends in beer flavour compound analysis. J. Sci. Food Agric. 2015, 95, 1571–1576. [Google Scholar] [CrossRef] [PubMed]
  25. Braga, C.M.; Zielinski, A.A.F.; da Silva, K.M.; de Souza, F.K.F.; Pietrowski, G.d.A.M.; Couto, M.; Granato, D.; Wosiacki, G.; Nogueira, A. Classification of juices and fermented beverages made from unripe, ripe and senescent apples based on the aromatic profile using chemometrics. Food Chem. 2013, 141, 967–974. [Google Scholar] [CrossRef] [PubMed]
  26. Fancello, F.; Bianco, A.; Niccolai, M.; Zara, G.; Coronas, R.; Serra, E.; D’Hallewin, G.; Valentoni, A.; Santoru, A.; Pretti, L.; et al. Fruit Microbial Communities of the Bisucciu Sardinian Apricot Cultivar (Prunus armeniaca L.) as a Reservoir of New Brewing Starter Strains. Fermentation 2022, 8, 364. [Google Scholar] [CrossRef]
  27. European Brewery Convention; Fachverlag, H.C. (Eds.) Analytica-Microbiologica-EBC, 5th ed.; EBC: Nürnberg, Germany, 2006. [Google Scholar]
  28. Fanari, M.; Forteschi, M.; Sanna, M.; Piu, P.P.; Porcu, M.C.; d’Hallewin, G.; Secchi, N.; Zinellu, M.; Pretti, L. Pilot plant production of craft fruit beer by using Ohmic treated fruit puree. J. Food Process. Preserv. 2019, 44, e14339. [Google Scholar] [CrossRef]
  29. Kleinová, J.; Klejdus, B. Determination of volatiles in beer using solid-phase microextraction in combination with gas chromatography/mass spectrometry. Czech J. Food Sci. 2014, 32, 241–248. [Google Scholar] [CrossRef] [Green Version]
  30. Bourbon-Melo, N.; Palma, M.; Rocha, M.P.; Ferreira, A.; Bronze, M.R.; Elias, H.; Sá-Correia, I. Use of Hanseniaspora guilliermondii and Hanseniaspora opuntiae to enhance the aromatic profile of beer in mixed-culture fermentation with Saccharomyces cerevisiae. Food Microbiol. 2021, 95, 103678. [Google Scholar] [CrossRef]
  31. Nord, L.I.; Vaag, P.; Duus, J.Ø. Quantification of Organic and Amino Acids in Beer by 1H NMR Spectroscopy. Anal. Chem. 2004, 76, 4790–4798. [Google Scholar] [CrossRef]
  32. Wishart, D.S.; Feunang, Y.D.; Marcu, A.; Guo, A.C.; Liang, K.; Vázquez-Fresno, R.; Sajed, T.; Johnson, D.; Li, C.; Karu, N.; et al. HMDB 4.0: The human metabolome database for 2018. Nucleic Acids Res. 2017, 46, D608–D617. [Google Scholar] [CrossRef]
  33. Jacob, D.; Deborde, C.; Lefebvre, M.; Maucourt, M.; Moing, A. NMRProcFlow: A graphical and interactive tool dedicated to 1D spectra processing for NMR-based metabolomics. Metabolomics 2017, 13, 36. [Google Scholar] [CrossRef] [Green Version]
  34. Bharti, S.K.; Roy, R. Quantitative 1H NMR spectroscopy. TrAC Trends Anal. Chem. 2012, 35, 5–26. [Google Scholar] [CrossRef]
  35. Sumner, L.W.; Amberg, A.; Barrett, D.; Beale, M.H.; Beger, R.; Daykin, C.A.; Fan, T.W.; Fiehn, O.; Goodacre, R.; Griffin, J.L.; et al. Proposed minimum reporting standards for chemical analysis Chemical Analysis Working Group (CAWG) Metabolomics Standards Initiative (MSI). Metabolomics 2007, 3, 211–221. [Google Scholar] [CrossRef] [PubMed] [Green Version]
  36. Stone, H.; Sidel, J.L. (Eds.) Index. In Sensory Evaluation Practices, 3rd ed.; Academic Press: San Diego, CA, USA, 2004; pp. 365–374. [Google Scholar]
  37. Saerens, S.M.G.; Delvaux, F.; Verstrepen, K.J.; Van Dijck, P.; Thevelein, J.M.; Delvaux, F.R. Parameters affecting ethyl ester production by Saccharomyces cerevisiae during fermentation. Appl. Environ. Microbiol. 2008, 74, 454–461. [Google Scholar] [CrossRef] [PubMed] [Green Version]
  38. Verstrepen, K.J.; Derdelinckx, G.; Dufour, J.P.; Winderickx, J.; Thevelein, J.M.; Pretorius, I.S.; Delvaux, F.R. Flavour-active esters: Adding fruitiness to beer. J. Biosci. Bioeng. 2003, 96, 110–118. [Google Scholar] [CrossRef] [PubMed]
  39. Younis, O.S.; Stewart, G.G. Sugar uptake and subsequent ester and higher alcohol production by Saccharomyces cerevisiae. J. Inst. Brew. 1998, 104, 255–264. [Google Scholar] [CrossRef]
  40. Basso, R.F.; Alcarde, A.R.; Portugal, C.B. Could non-Saccharomyces yeasts contribute on innovative brewing fermentations? Food Res. Int. 2016, 86, 112–120. [Google Scholar] [CrossRef]
  41. Zeisel, S.H. Choline: An important nutrient in brain development, liver function and carcinogenesis. J. Am. Coll. Nutr. 1992, 11, 473–481. [Google Scholar] [CrossRef]
  42. Moretti, A.; Paoletta, M.; Liguori, S.; Bertone, M.; Toro, G.; Iolascon, G. Choline: An Essential Nutrient for Skeletal Muscle. Nutrients 2020, 12, 2144. [Google Scholar] [CrossRef]
  43. López-Sobaler, A.M.; Lorenzo Mora, A.M.; Salas González, M.D.; Suárez, A.P.; Aparicio, A.; Ortega, R.M. Importance of choline in cognitive function. Nutr. Hosp. 2021, 37, 18–23. [Google Scholar] [CrossRef]
Figure 1. Worts fermented by H. uvarum L2 in subsequent fermentation with S. cerevisiae US-05 (M2) and S. cerevisiae T-58 (T58): (A) Yeast concentration during alcoholic fermentation; (B) kinetic of the ethanol (% v/v) production. Data are reported as means of two measurements (error bars related to SD lie below the symbols).
Fermentation 09 00305 g001
Figure 2. Wort fermented by H. uvarum L2 and S. cerevisiae US-05 (M2) and wort fermented by S. cerevisiae T-58 (T58): (A) Time evolution of the main carbohydrates (glucose, maltose, dextrin) levels (arbitrary units); (B) time evolution of amino acid and choline content (mg/mL); (C) time evolution of organic acids content (mg/mL or arbitrary units). Data are reported as means ± SD of two measurements. Where not visible, error bars lie below the symbols.
Fermentation 09 00305 g002
Figure 3. Concentration of volatiles organic compounds during fermentation in M2 and T58: M2 at 9 days corresponds to the H. uvarum L2 fermentation (M2T2) and 14 days corresponds to the adjunct of S. cerevisiae US-05 (M2FF) and T-58 (T58FF). Data are reported as means ± SD. Where not visible, error bars lie below the symbols. Histogram bar with two segments option was generated by using GraphPad Prism software (GraphPad Prism 5.03 GraphPad Software Inc., La Jolla, CA, USA).
Fermentation 09 00305 g003
Figure 4. Concentrations of volatiles organic compounds in conditioned beers M2 and T58. Data are reported as means ± SD. Where not visible, error bars lie below the symbols. Histogram bar with two segments option was generated by using GraphPad Prism software (GraphPad Prism 5.03 GraphPad Software Inc., La Jolla, CA, USA).
Fermentation 09 00305 g004
Figure 5. Radar plot of the mean rating scores for the T58 and M2 beers. (*) denote samples that were significantly different (p ≤ 0.05).
Fermentation 09 00305 g005
Table 1. Calibration curve of volatile compounds absolutely quantified with their linear fit, R2 value, odor threshold and odor characteristics, an used for the quantification of fermenting worth and conditioned beer.
FamilyCompoundLinear FitR2 ValueOdor Threshold (mg/L)Odor Characteristics
Alcohols2-phenylethan-1-oly = 0.0873x + 0.43060.96570.10Rose, floral
Alcohols3-methylbutan-1-oly = 0.0324x + 0.2340.983440.00Whiskey, solvent
Esters3-methylbutyl ethanoatey = 0.5164x + 0.53590.9631.20Fruity, banana
EstersPhenylethyl acetatey = 4.9085x + 0.70280.97863.80Floral, honey
EstersEthyl acetatey = 0.0453x + 0.27790.983321.00Ethery, fruity, sweet
Table 2. Standard quality parameters of M2 and T58 beers. Values are averages of two measurements ± the standard deviation.
ParameterT58M2
Alcohol (% v/v)4.9 ± 0.05.0 ± 0.0
Density (g/cm3)1.0137 ± 0.00001.0126 ± 0.0000
Re (Real extract) (% w/w)5.7 ± 0.05.5 ± 0.0
Ae (App. extract) (% w/w)4.0 ± 0.03.7 ± 0.0
Oe (Original extract) (% w/w)13.1 ± 0.013.0 ± 0.0
RDF (Real Deg. of Ferm.)58 ± 059 ± 0
Foam stability (s/3 cm)203 ± 4313 ± 8
Color (EBC unit)10 ± 011 ± 0
pH4.1 ± 0.04.1 ± 0.0
Disclaimer/Publisher’s Note: The statements, opinions and data contained in all publications are solely those of the individual author(s) and contributor(s) and not of MDPI and/or the editor(s). MDPI and/or the editor(s) disclaim responsibility for any injury to people or property resulting from any ideas, methods, instructions or products referred to in the content.

