Article

New Online Monitoring Approaches to Describe and Understand the Kinetics of Acetaldehyde Concentration during Wine Alcoholic Fermentation: Access to Production Balances

1
SPO, Université de Montpellier, INRAE, Institut Agro, 34060 Montpellier, France
2
R&D Department, Jas Hennessy & Co., 16100 Cognac, France
*
Author to whom correspondence should be addressed.
Fermentation 2023, 9(3), 299; https://doi.org/10.3390/fermentation9030299
Submission received: 3 March 2023 / Revised: 16 March 2023 / Accepted: 16 March 2023 / Published: 18 March 2023
(This article belongs to the Special Issue Aroma Compound Evolution during Fermentation)

Abstract

:
The compound acetaldehyde has complex synthesis kinetics since it accumulates during the growth phase and is consumed by yeast during the stationary phase, as well as evaporating (low boiling point) throughout the process. One recurrent question about this molecule is: can temperature both increase and decrease the consumption of the molecule by yeast or does it only promote its evaporation? Therefore, the main objective of this study was to describe and analyze the evolution of acetaldehyde and shed light on the effect of temperature, the main parameter that impacts fermentation kinetics and the dynamics of acetaldehyde synthesis. Thanks to new online monitoring approaches, anisothermal temperature management and associated mathematical methods, complete acetaldehyde production balances during fermentation made it possible to dissociate biological consumption from physical evaporation. From a biological point of view, the high fermentation temperatures led to important production of acetaldehyde at the end of the growth phase but also allowed better consumption of the molecule by yeast. Physical evaporation was more important at high temperatures, reinforcing the final decrease in acetaldehyde concentration. Thanks to the use of production balances, it was possible to determine that the decrease in acetaldehyde concentration during the stationary phase was mainly due to yeast consumption, which was explained by the metabolic links found between acetaldehyde and markers of metabolism, such as organic acids.

1. Introduction

Alcoholic fermentation is the central stage of the wine-making process using the yeast Saccharomyces cerevisiae. The main reaction in this biological process is the bioconversion of sugars into ethanol and carbon dioxide, as well as many other compounds responsible for the organoleptic profile of the wine. Acetaldehyde, also referred to as ethanal or acetic aldehyde, is a powerful aromatic compound that can be found in many food matrices: apple juice, spirits, beer, cider, wine, cheese, yogurt and butter [1]. In wine, free acetaldehyde can form more or less stable combinations with other molecules to produce combined or bound acetaldehyde; the sum of the free and combined acetaldehyde corresponds to the total acetaldehyde. Typically, in the presence of sulfite, the combination rate is 50–60% at the end of fermentation [2]. The concentration of total acetaldehyde in wines generally varies between 10 and 200 mg/L, with a sensory perception threshold of around 100 to 125 mg/L for free acetaldehyde. At low concentrations, acetaldehyde has a pleasant and fruity aroma, while at high levels, its odor becomes irritating and pungent, which depreciates the organoleptic qualities of wines for consumers. These high concentrations of acetaldehyde give undesired organoleptic properties to wines, such as green apple, freshly cut grass and nutty aromas, which, however, are sometimes sought after; in particular, in wines such as “vins jaunes”. The acetaldehyde in wines has microbiological and/or chemical origins. Indeed, during alcoholic fermentation under reducing conditions, acetaldehyde is the most important carbonyl compound produced by yeasts after ethanol. Acetaldehyde accumulation differs according to yeast species and strain, ranging from 0.5 for the least productive ones to more than 700 mg/L for the most productive ones [1]. Moreover, under oxidative conditions, acetaldehyde can also be produced after oenological fermentation through ethanol chemical oxidation when the wine is exposed to air. The presence of the carbonyl group makes acetaldehyde very reactive and sensitive to oxidation phenomena. The main physical properties of acetaldehyde are: a boiling point of 20.1 °C [3], 120 kPa vapor pressure, and a Henry’s law constant in water at 298.15 K of about 15 mol·kg−1·bar−1 [4]. This molecule is also very polar, with water solubility of 2.568 × 10⁵ mg/L at 298.15 K and log Kow = −0.34.
Acetaldehyde is a key compound of yeast metabolism and an intermediate of glycolysis produced during alcoholic fermentation. Its metabolic pathway thus begins with glycolysis, which generates pyruvate as the final product. Pyruvate can then be converted to acetaldehyde and carbon dioxide by pyruvate decarboxylase (PDC); then, acetaldehyde can be reduced to ethanol through the action of alcohol dehydrogenase (ADH). These steps of alcoholic fermentation take place in the cell cytoplasm. Acetaldehyde has a central role in yeast metabolism as the precursor of many molecules, such as ethanol, acetate, acetoin, α-acetohydroxybutyrate and α-acetolactate. Acetaldehyde is also used to generate the cytoplasmic acetyl-CoA required for lipid biosynthesis. The reduction of acetaldehyde to ethanol is highly dependent on ADH activity in close connection with the cofactor NADH. Compared to its high production, acetaldehyde accumulation in the fermentation medium is negligible, as it is directly transformed into ethanol (the main flux of alcoholic fermentation). However, acetaldehyde accumulation could be one way to orient the metabolism; in particular, by inducing the synthesis of certain by-products (organic acids) while maintaining the redox balance [5]. The dynamics of acetaldehyde production during alcoholic fermentation can be divided into three phases. Early formation of this compound is observed during the lag phase at the beginning of fermentation before any detectable yeast growth [6]. Acetaldehyde accumulation continues throughout the growth phase. Finally, its concentration decreases during the stationary phase until the end of alcoholic fermentation [2,7,8]. Comparison of acetaldehyde kinetics and sugar consumption kinetics shows a possible relationship between the moment when the maximum acetaldehyde concentration is reached and the divergence of glucose and fructose degradation rates [8,9]. Thus, sugar concentration influences acetaldehyde kinetics [10]. These kinetics are also highly dependent on the redox balance of the cell. At the beginning of fermentation, glycerol production allows NADH/NAD+ recycling. This production phase ensures the maintenance of the cell redox balance. Then, in the stationary phase, glycerol mainly plays a role related to coping with osmotic stress, so its synthesis is continuous [11]. Afterwards, as soon as acetaldehyde is present in a sufficient quantity, it is able to play its role of reducer [12]. Thus, through its catabolism, acetaldehyde serves as a terminal electron acceptor in yeast redox balance and has the ability to create energy through glycolysis [1]. Although sugar is the main substrate for acetaldehyde formation, the metabolism of amino acids, such as alanine, also contributes to the formation of this compound [13]. In this case, acetaldehyde is produced through the Ehrlich pathway: alanine is catabolized to 2-oxopropanoate, which can then be decarboxylated to acetaldehyde [14].
Online monitoring of molecules, which involves dozens or hundreds of measurements during fermentation, brings new information of direct interest for the study of metabolism and for a better understanding of the kinetics of the production of compounds [15]. With manual sampling, the dynamics of acetaldehyde synthesis, including the accumulation peak at the end of the growth phase and its synchronization with the fermentation kinetics, would have been difficult results to obtain due to the compiling of precision errors. Moreover, employing this online monitoring tool, a recent study evaluated the physical properties of acetaldehyde during alcoholic fermentation by characterizing the partition coefficient of this molecule, thus making it possible to determine production balances by estimating the share of acetaldehyde losses attributable to evaporation [7]. However, to date, acetaldehyde accumulation, including its metabolic and physicochemical aspects, remains poorly described and demonstrated. Using an online monitoring tool for the production of this volatile molecule during oenological fermentation, the atypical synthesis kinetics of acetaldehyde in the presence of SO2 have recently been investigated [2]. However, much work remains to be undertaken, particularly on the impact of fermentation parameters on the synthesis and re-consumption of this compound by yeast, since the hypotheses in the literature diverge, notably with respect to the fermentation temperature. Indeed, although otherwise contradictory, studies agree in considering the fermentation temperature a key point in acetaldehyde production [8,16,17,18,19,20]. For Amerine and Ough (1964), the fermentation temperature has little effect on the final acetaldehyde content, while other authors correlate the increase in acetaldehyde content with increasing fermentation temperature [18].
To obtain a general understanding of acetaldehyde dynamics, this work employed a combination of original approaches, including (a) the use of an online acetaldehyde monitoring system in the gas phase during alcoholic fermentation; (b) the implementation of complete production balances, including for physicochemical and metabolic aspects; and, finally, (c) the application of different isothermal and anisothermal temperature profiles in order to understand the impact of this parameter on the synthesis of the molecule using three Saccharomyces cerevisiae yeast strains in a natural must.

2. Materials and Methods

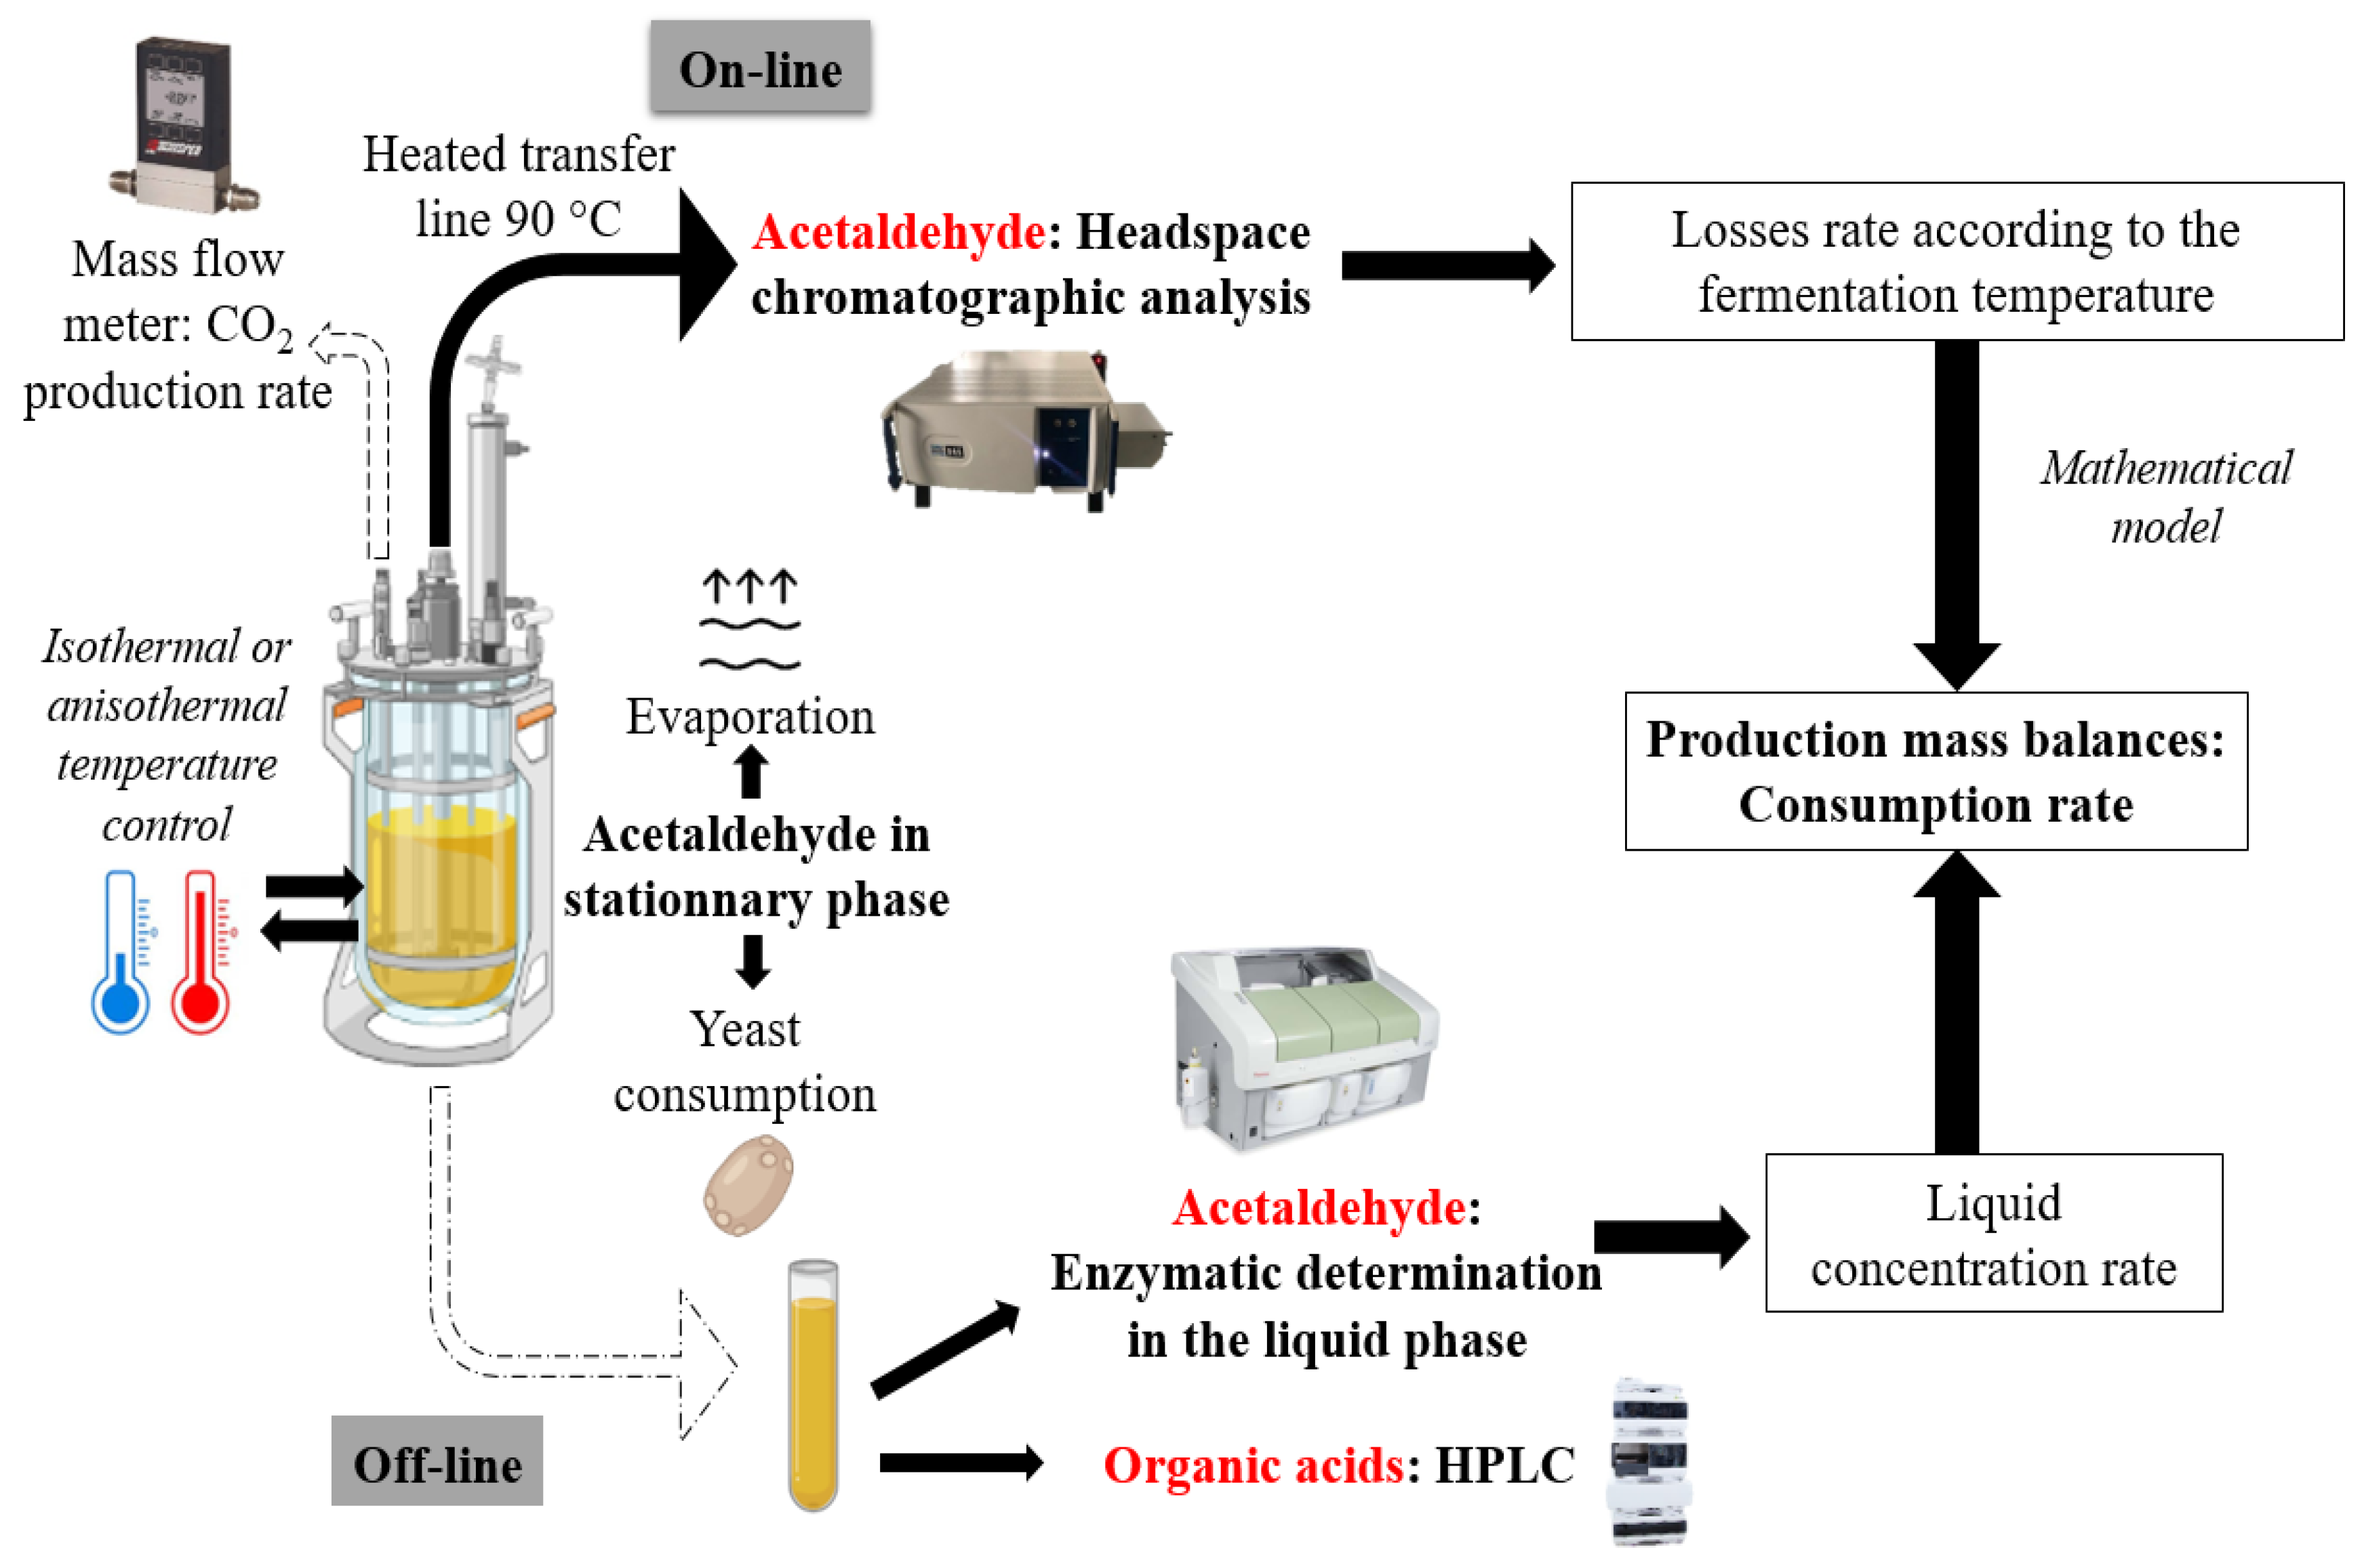
2.1. Schematic Overview of the Experimental Program

The experimental process in this study relied on different techniques: (a) the online monitoring of fermentation kinetics; (b) the control of the anisothermal temperature during fermentation; (c) the online monitoring of volatile compounds, such as acetaldehyde; and (d) as a result of this monitoring, the implementation of a complete production balance using mathematical models allowing the dissociation of the biological effects (consumption by yeast) and physical effects (evaporation) on the decrease in acetaldehyde during the stationary phase (Figure 1).

2.2. Yeast Strains

Fermentations were carried out with the commercial Saccharomyces cerevisae strains Lalvin FC9® (Lallemand SA, Montreal, QC, Canada), Fermivin 7013® and Fermivin SM102® (Erbslöh S.A.S., Servian, France). Fermenters were inoculated with 20 g/hL active dry yeast previously rehydrated for 30 min at 37 °C in a 50 g/L glucose solution (1 g of dry yeast diluted in 10 mL of this solution).

2.3. Natural Must

The must was prepared from the Ugni blanc grape variety (2020) harvested in the Cognac region, France. Grapes were pressed and the must was settled for 24 h at 4 °C in the presence of 3 mL/hL enzymes (MYZYM SPIRIT, Institut Oenologique de Champagne, Epernay, France). A final turbidity of 95 NTU (measured with a 2100 N turbidimeter (Hach®, Lognes, France)) was achieved for the must and the sludge was collected separately. A correlation between sludge concentration and turbidity was previously calculated (R2 = 0.9924) by adding different amounts of solid particles to final volumes (100 mL) of must:
Turbidity = 37.05 × [solids particles] + 47.32
where the concentration of added solid particles ([solid particles]) is in percentage points (v/v) and the turbidity in NTU.
The must characteristics were as follows: 185 g/L total sugar, 111 mg/L assimilable nitrogen (35 mg/L and 76 mg/L mineral and organic nitrogen, respectively) and pH 3.02.
Based on the relationship determined between turbidity and the percentage of solid particles (Equation (1)), 216 mL of sludge was added to a final volume of 1.8 L must to obtain a turbidity of 500 NTU. The corresponding volume of must was previously removed from the fermenter to be substituted with the sludge.
Assimilable nitrogen was adjusted to 200 mg Nass/L (=assimilable nitrogen/L) with a solution of amino acids and NH4Cl, respecting the proportions of 30% mineral nitrogen (NH4+) and 70% organic nitrogen (a mix of amino acids) found in the initial Ugni blanc must. The free amino acid content of the initial Ugni blanc must was determined using cation-exchange chromatography (see Section 2.5). The composition of the amino acid stock solution added was as follows (in g/L): tyrosine, 0.29; tryptophan, 0.22; isoleucine, 0.33; aspartate, 4.33; glutamate, 6.02; arginine, 9.46; leucine, 0.49; threonine, 0.95; glycine, 0.06; glutamine, 3.89; alanine, 2.19; valine, 1.16; methionine, 0.09; phenylalanine, 1.02; serine, 1.66; histidine, 0.38; lysine, 0.15; asparagine, 0.38; and proline, 9.38.
A solution of NH4Cl (21.45 g/L) was used as an ammonium source. To obtain 200 mg Nass/L in must, 18 mL of amino acid stock solution and 9 mL of NH4Cl solution were added to 1.8 L of must, respectively.

2.4. Fermentation Conditions

The fermentations were performed in four 2 L jacketed glass autoclavable bioreactors (Applikon®, Delft, the Netherlands). Bioreactors were equipped with direct drive stirring systems (150 rpm) coupled with Rushton impellers (diameter 45 mm). Temperature regulation in each bioreactor was ensured with a Huber cryostat (Offenburg, Deutschland) with coolant liquid circulation in the double jacket. Each cryostat was coupled with a Pt 100 sensor to ensure temperature control. Online measurement of the rate of CO2 production (dCO2/dt) was undertaken automatically with a gas thermal mass flow controller (Brooks® Instrument, Hatfield, PA, USA). Different temperature profiles were applied. For the three strains, three isothermal temperature profiles were selected: 18, 24 and 30 °C.
For strains FC9® and SM102®, anisothermal temperature profiles were additionally obtained with a temperature control slope of 0.2 °C/gCO2 released and a trigger level for the temperature change applied just after 20 g of CO2 was released. This slope corresponds to the average cooling or heating slope observed in wineries’ industrial tanks [21]. The first anisothermal profile was an ascending one from 18 °C to 30 °C. The second profile decreased from 30 °C to 18 °C. The third profile was 24–18 °C and, finally, the fourth was 24–30 °C. Each isothermal and anisothermal fermentation operation was performed in duplicate.

2.5. Quantification of Sterols and Fatty Acids in Grape Solids

2.5.1. Dry Matter

A total of 200 mL of must was centrifuged for 10 min at 10,000 rpm to concentrate grape solids. Supernatant was removed and grape solids were washed three times consecutively with a NaCl solution (10 mM) to remove sugars. The final pellet was freeze-dried overnight to recover dry matter (DM).

2.5.2. Lipid Composition

Total lipids from lyophilized grape solids (aliquot of 1 g) were extracted overnight with methanol/chloroform (2:1, v/v), and the solid residue was then extracted over 2 h with methanol/chloroform/water (2:1:0.8, v/v/v). The organic extracts were dried over Na2SO4 and concentrated to dryness using a rotatory evaporator. Phytosterols (campesterol, stigmasterol and β-sistosterol) and main fatty acids were determined in the remaining solids with the method described by Grison et al. (2015), as adapted by [22]. Total fatty acid concentration was 28.06 mg/g DM. C18 unsaturated acids represented approximately 57% of the total fatty acid content, and the most abundant saturated fatty acid was palmitic acid (23%). The concentration of phytosterols was 6.93 mg/g DM; i.e., within the limits of the concentrations described for other grape varieties [22]. The main phytosterol was β-sitosterol (84%), while campesterol and stigmasterol accounted for approximately 10.5% of total phytosterols.
Using the lipid composition of the solid particles’ dry matter and Equation (1) (information on the amount of solid particles as a function of turbidity), it was calculated that the 500 NTU turbidity corresponded to 26.3 mg/L of sterols and 106.43 mg/L of fatty acids.

2.6. Quantification of Assimilable Nitrogen

Ammonium concentration was determined enzymatically (R-Biopharm AG™, Darmstadt, Germany). The free amino acid content of the must was measured using cation-exchange chromatography with post-column ninhydrin derivatization (Biochrom 30, Biochrom™, Cambridge, UK), as described by [23].

2.7. Determination of Concentration of Metabolites of Central Carbon Metabolism

With every 10 g/L of CO2 released, samples were analyzed to determine the concentrations of ethanol, glycerol, succinate, α-cetoglutarate and acetate using HPLC (HPLC 1260 Infinity, Agilent™ Technologies, Santa Clara, CA, USA) on a Phenomenex Rezex ROA column (Phenomenex™, Le Pecq, France) at 60 °C. The column was eluted with 0.005 N H2SO4 at a flow rate of 0.6 mL/min. Organic acids were analyzed with a UV detector (Agilent™ Technologies, Santa Clara, CA, USA) at 210 nm; the concentrations of the other compounds were quantified with a refractive index detector (Agilent™ Technologies, Santa Clara, CA, USA). Analyses were carried out with the Agilent™ OpenLab CDS 2.x software package (Santa Clara, CA, USA).

2.8. Online Acetaldehyde Monitoring

Our online measurement device consisted of a GC Compact 4.0 (Interscience, Breda, The Netherlands) gas phase chromatography system for carbon and sulfur volatile compounds analysis.
For volatile compounds (acetaldehyde) analysis, headspace gas was sequentially pumped from each 2 L bioreactor for 1 min at a flow rate of 15 mL/min through a dedicated heated transfer line at 90 °C. The gas phase passed through a sampling loop of 50 µL to feed the analysis channel of the sulfur compounds, while carbon compounds were concentrated in a cold trap (TenaxTM) at 5 °C.
After this concentration step, carbon compounds were desorbed from TenaxTM at 280 °C for 1 min. The injector temperature was 250 °C with a split flow at 2 mL/min. The GC Compact 4.0 was equipped with a programmable oven containing a MXT-Wax column (30 m × 0.25 mm ID, 0.5 µm film thickness) from RestekTM (Lisses, France). Helium at a constant pressure of 80 kPa was used as the carrier gas. The oven temperature program was: 40 °C for 2 min, increase to 160 °C at a rate of 8 °C/min, hold at 160 °C for 10 s, increase to 220 °C at a rate of 15 °C/min, and hold at 220 °C for 3 min. The Flame Ionization Detector (Thermo Fisher ScientificTM, Toulouse, France) was set at 150 °C.
The areas of the acetaldehyde peaks were acquired with Chromeleon™ Chromatography Data System (CDS) software (Thermo Fisher ScientificTM, Toulouse, France). The analysis frequency was once every 2 h for each bioreactor.

2.9. Determination of Acetaldehyde

2.9.1. Calibration in the Gas Phase

The GC Compact 4.0 (Interscience, Breda, the Netherlands) gas phase chromatography system was calibrated with an ATIS Adsorbent Tube Injector System 230V (Supelco®, Sigma-Aldrich, Saint-Louis, MO, USA) supplied with CO2. The liquid calibration standard (1 µL) was injected with a microsyringe through a replaceable septum in the center of the injection glassware, which was heated to 100 °C. Each flash-vaporized sample was pumped in a CO2 atmosphere into the gas phase chromatography system for analysis. A stock solution of acetaldehyde (CAS no. 75-07-0) (10.03 g/L) was prepared from pure acetaldehyde (Acetaldehyde, PESTANAL®, analytical standard, Sigma, St Quantin Fallavier, France). The different calibration points were determined for this stock solution with the following liquid concentrations: 1.00, 2.00, 4.01, 6.01, 8.02 and 10.03 g/L.

2.9.2. Losses during Fermentation

During fermentation, the losses in the gas L ( t )   in mg per liter of must were calculated according to the following equation:
L ( t ) = 0 t C g ( t ) × Q t × d t
where C g ( t ) is the concentration of acetaldehyde in milligrams per liter of CO2 measured online in the gas phase and Q t is the CO2 flow rate at time t expressed in liters of CO2 per liter of must and per hour.
The rate of losses in the gas phase R L ( t ) in mg per liter of must and per hour was calculated as follows:
R L ( t ) = L ( t ) L ( t i ) t ( t i )
where t and ( t i ) correspond to two successive sampling points in an hour.

2.9.3. Production Mass Balances

Offline liquid sampling was performed with every 10 g/L of CO2 released until the end of fermentation and total acetaldehyde concentrations were precisely measured using a commercial enzymatic test kit (Ref 984347, ThermoFischer scientificTM).
The kinetics of total acetaldehyde in the liquid phase were thus smoothed with a polynomial function of degree two for the accumulation phase in the medium (growth phase) and with logarithmic smoothing for the decrease phase (stationary phase) to obtain the concentration of acetaldehyde in the liquid C l ( t ) in milligrams per liter of must.
The rate of accumulation in the liquid phase R C l ( t ) in mg per liter of must and per hour was calculated as follows:
R C l ( t ) = C l ( t ) C l ( t i ) t ( t i )
where t and ( t i ) correspond to two successive sampling points in an hour.
The rate of acetaldehyde consumption by yeasts, expressed as R C o ( t )   in milligrams per liter of must per hour, was calculated as the difference between the absolute value of the acetaldehyde accumulation rate in the liquid, expressed as A b s ( R C l ( t ) )   in milligrams per liter of must per hour, and the absolute value of the rate of losses in the gas phase, expressed as A b s ( R L ( t ) ) in milligrams per liter of must per hour (Equation (5)):
R C o ( t ) = A b s ( R C l ( t ) ) A b s ( R L ( t ) )

2.10. Statistical Analysis

All the experiments were carried out in biological duplicates. Statistical analyses were performed with R version 3.6.2 (R Development Core Team 2016). The ANOVA was realized using the aov function from the R package agricolae (v1.3.5) and Tukey’s test was used for the separation of means.

3. Results and Discussion

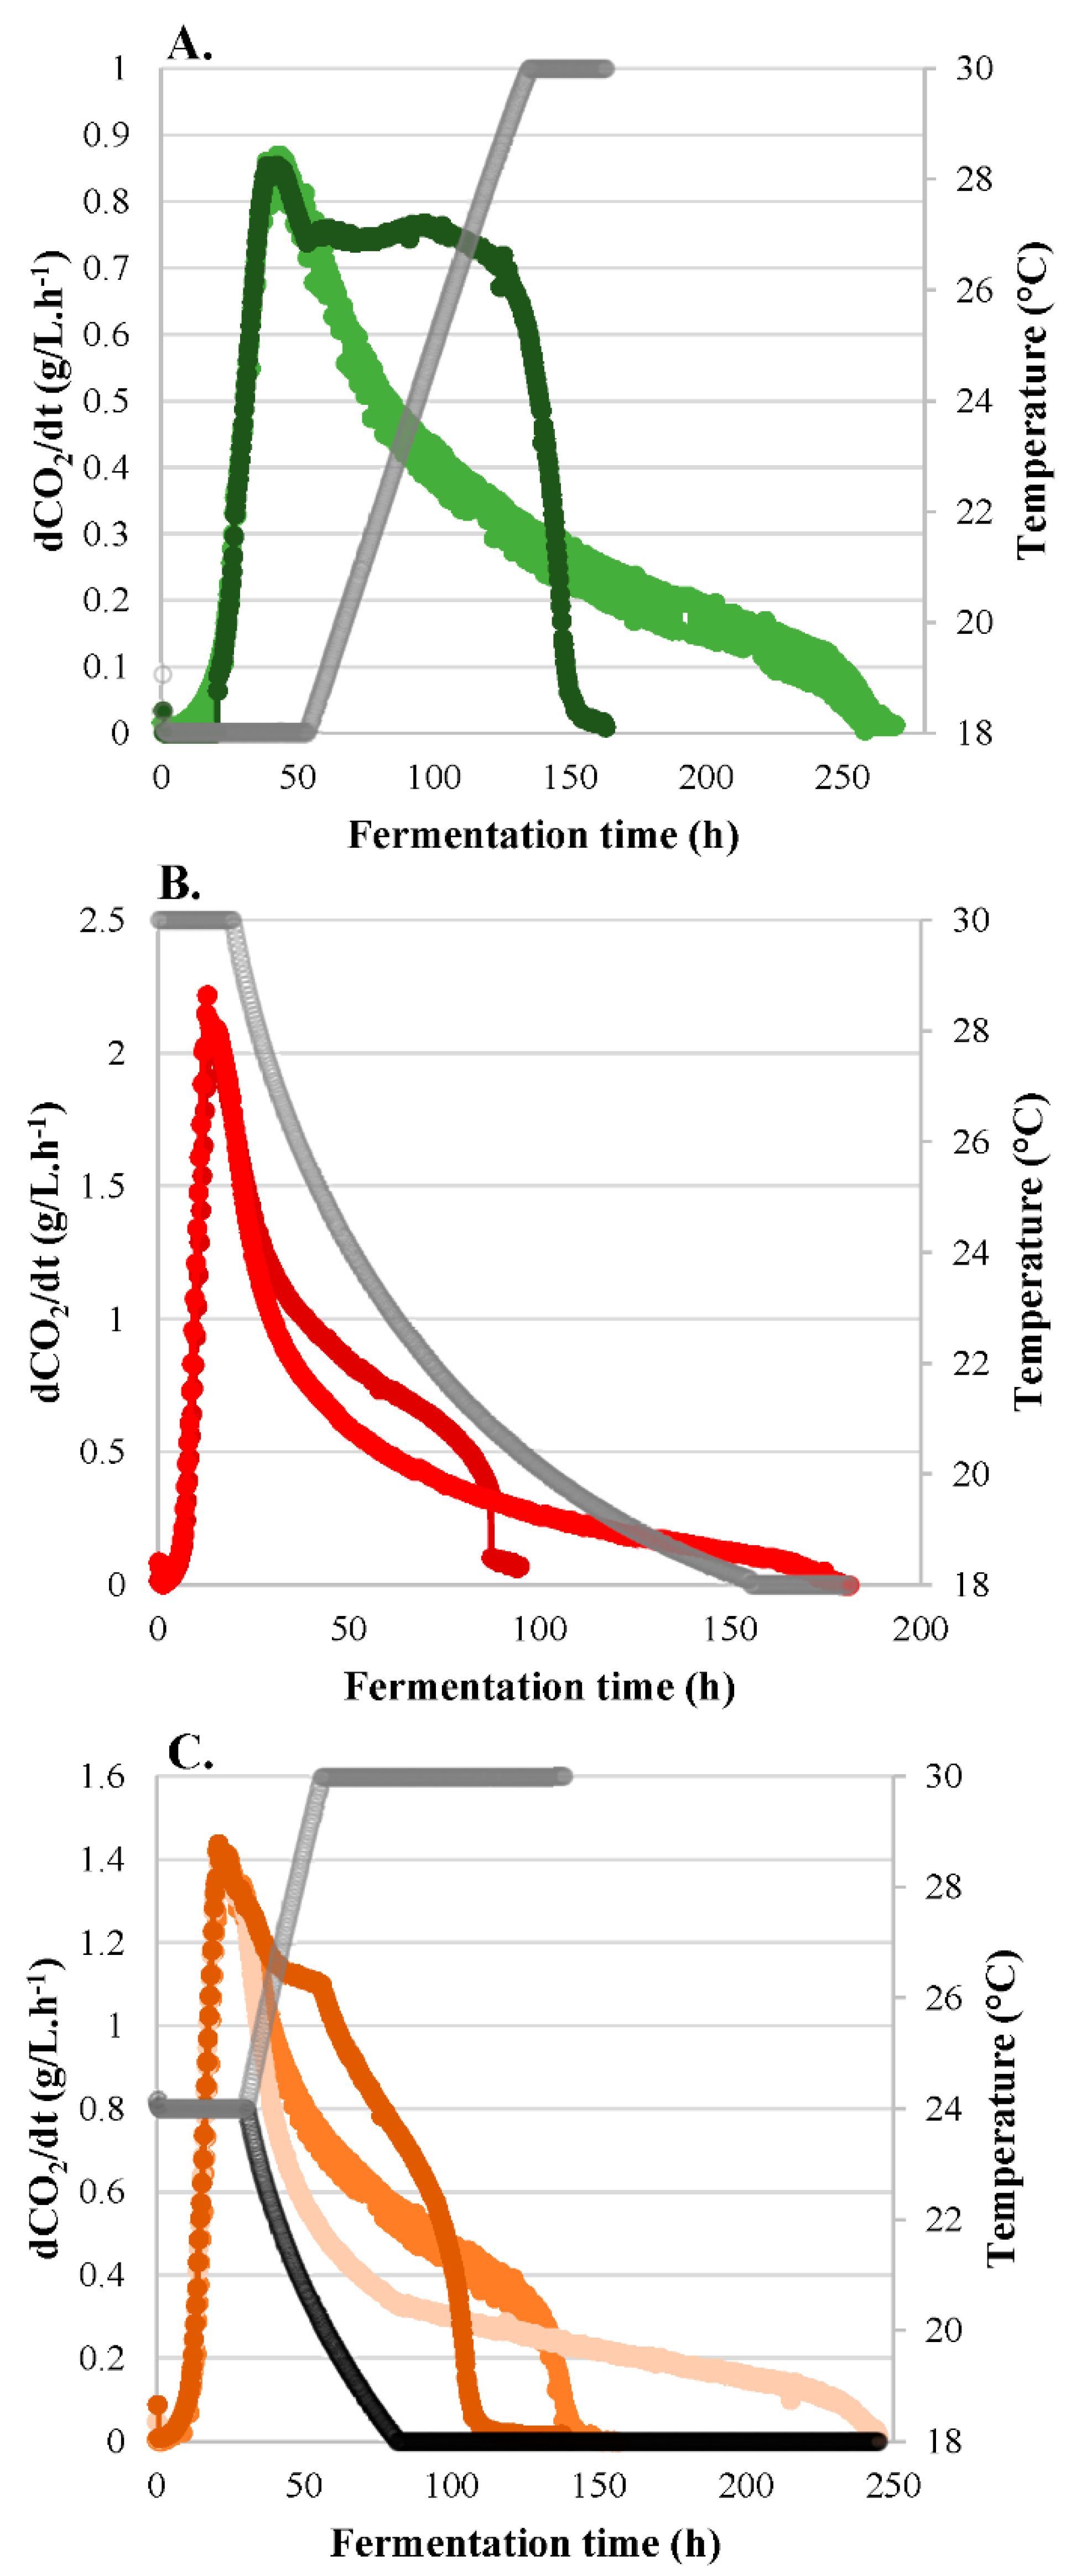
3.1. Fermentation Kinetics

In all the fermentation experiments, sugars were almost exhausted; i.e., the residual sugar content was lower than or equal to 2 g/L. As the limiting nutrient, assimilable nitrogen was completely consumed at the end of the growth phase in all experiments. Anisothermal profiles applied during the stationary phase changed the overall shape of the fermentation kinetics and the fermentation parameters, such as fermentation duration. When the temperature was increased during fermentation (from 18 to 30 °C) (Figure 2A), the fermentation rate was maintained at a high value, which resulted in faster fermentation of about 100 h compared to the initial isothermal fermentation performed at 18 °C. The temperature increase of 0.2 °C/g of CO2 released allowed yeasts to maintain their fermentative activity [24,25,26]. On the other hand, when the temperature was decreased (30 °C to 18 °C) during the stationary phase, it was observed that yeast cellular activity was slowed down, which resulted in an additional 100 h of fermentation compared to the isothermal control fermentation at 30 °C (Figure 2B). Similar trends were observed as previously with the two other anisothermal temperature profiles, even though fermentation only started at 24 °C (Figure 2C). However, when the profile was raised from 24 to 30 °C, the fermentation time was 40 h shorter instead of the 100 h reduction when fermentation was started at 18 °C. Thus, isothermal and anisothermal profiles highlighted the importance of the effects of temperature on yeast metabolic activity, which resulted in major modifications in fermentation kinetics.

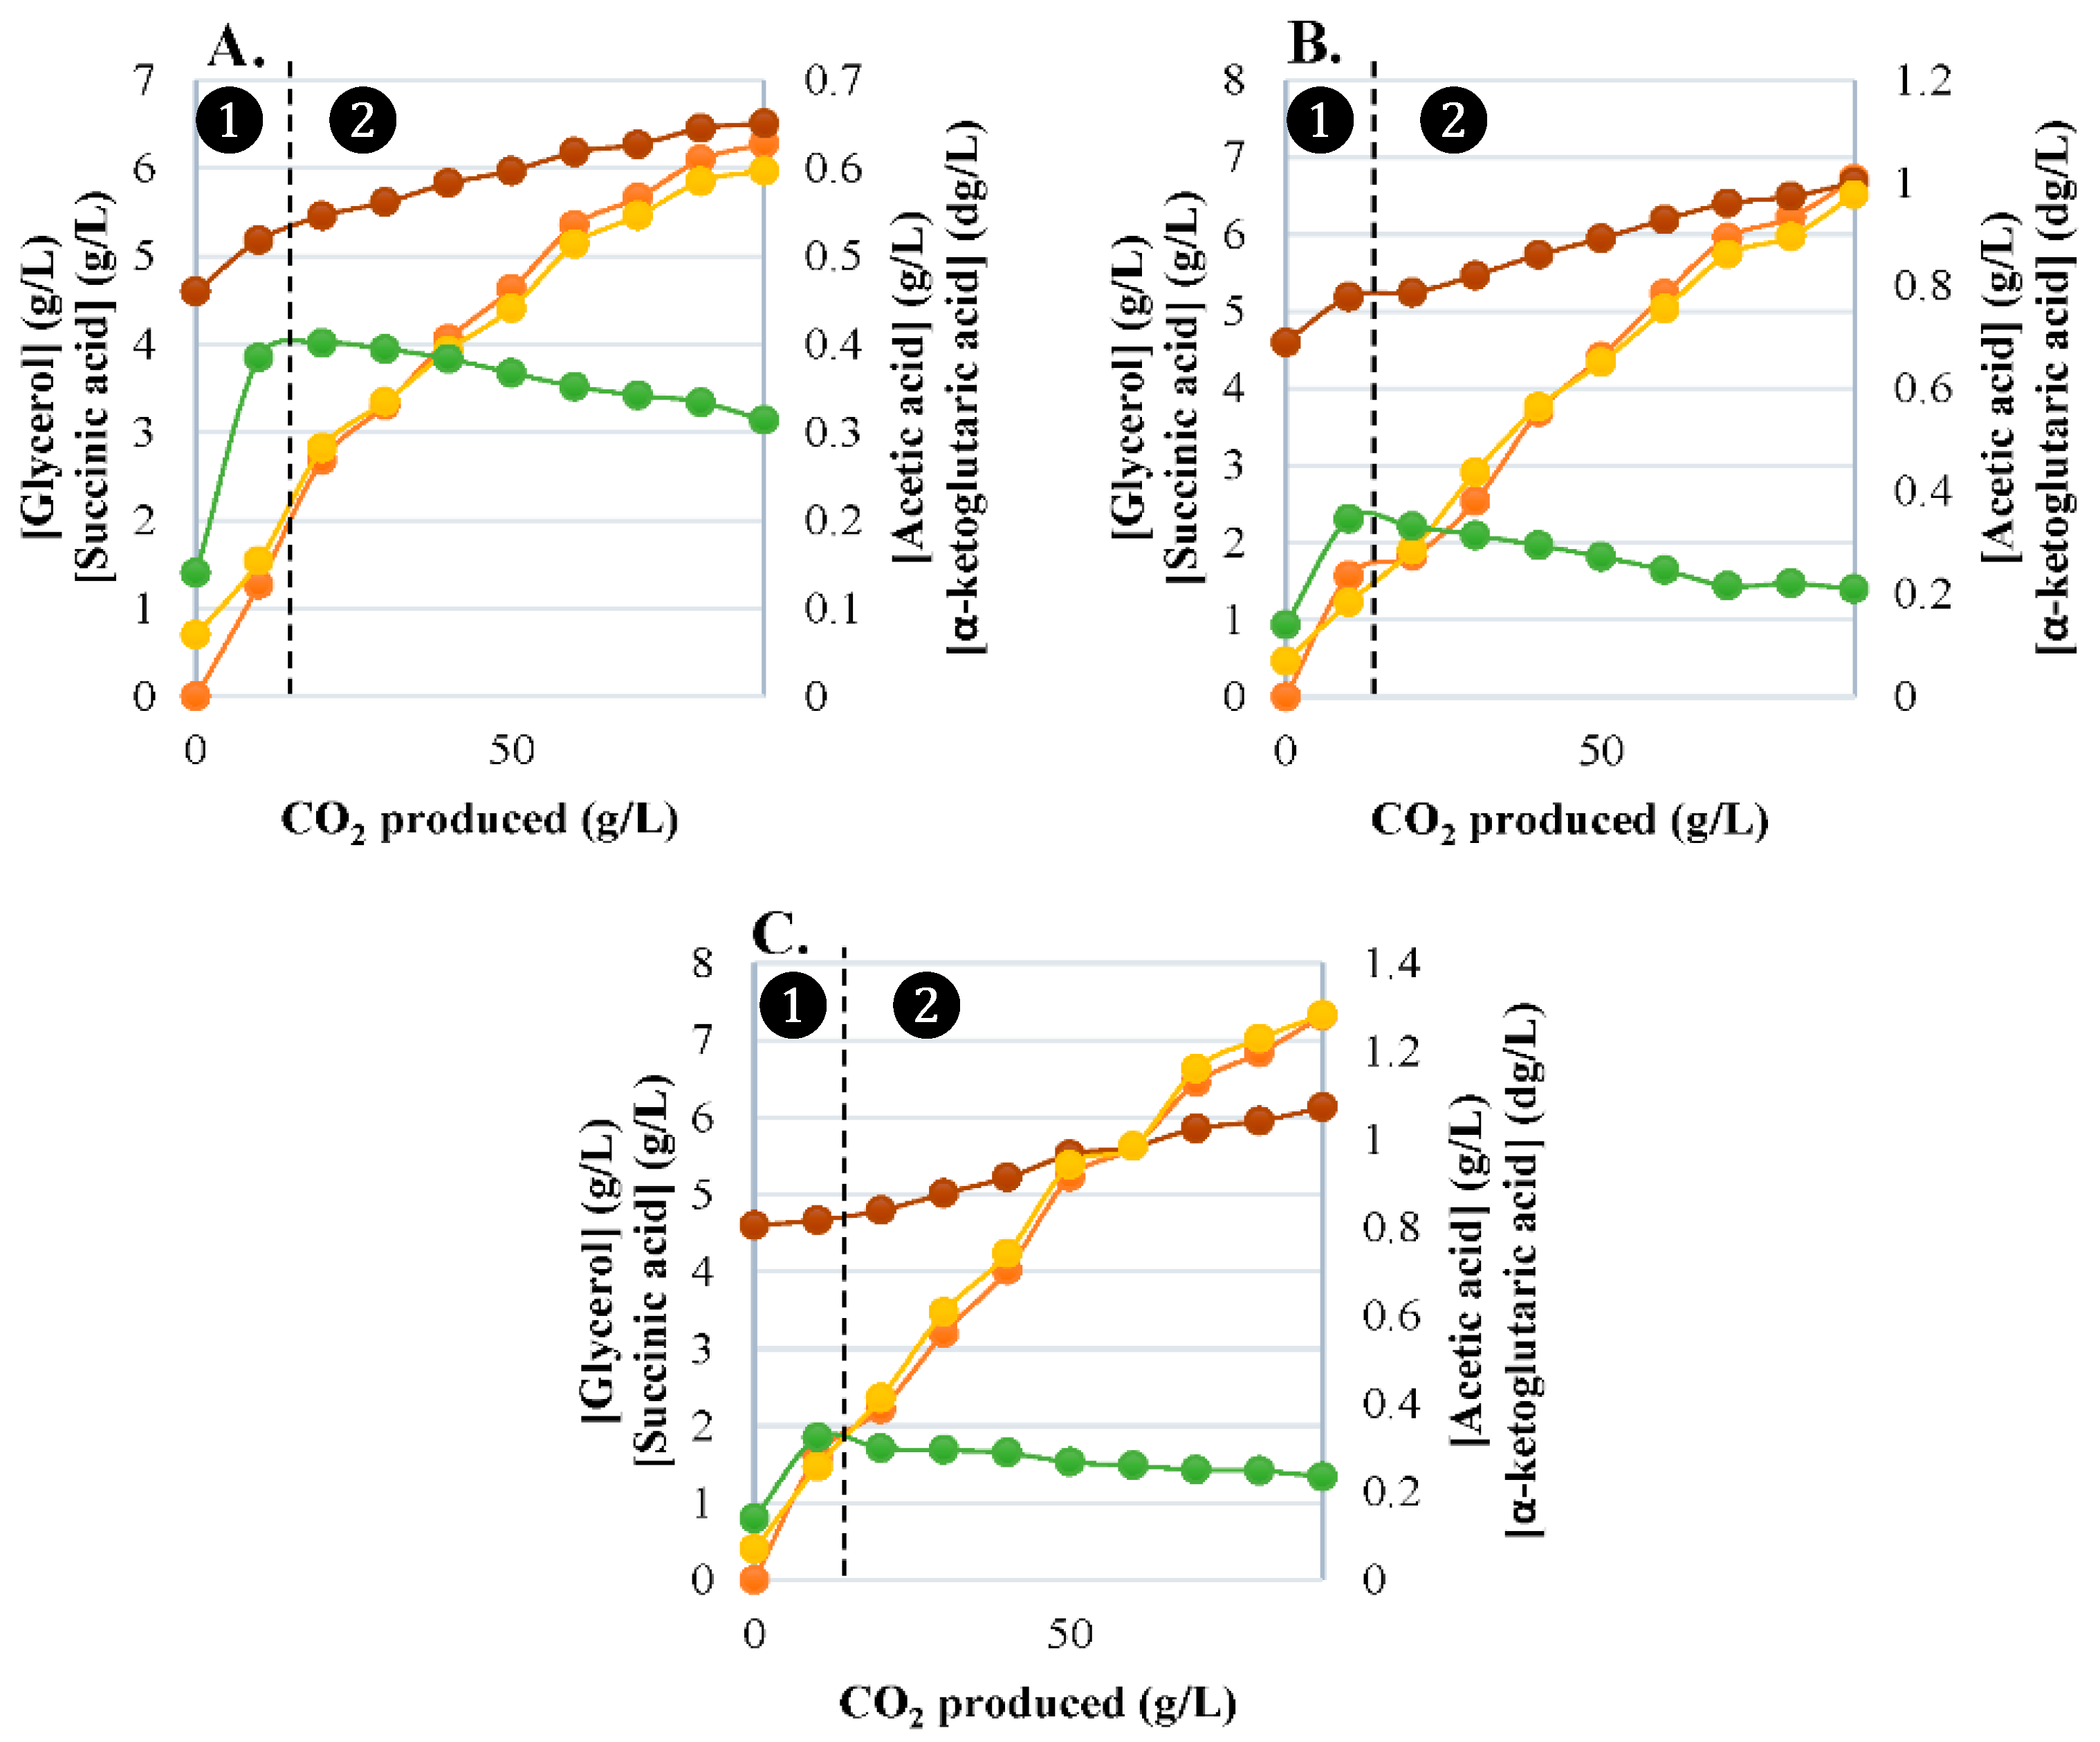
3.2. Synthesis of Primary Carbon Metabolites

3.2.1. Glycerol Production

Glycerol is quantitatively the most important by-product, and its production during fermentation with Saccharomyces cerevisiae is associated with ethanol and carbon dioxide production. In wines, levels between 1 and 15 g/L are frequently encountered; higher levels are thought to contribute to a wine’s smoothness and viscosity [27] but do not contribute directly to its aroma due to glycerol’s non-volatile nature. The two most important functions of glycerol synthesis in yeast are related to redox balancing and the hyperosmotic stress response. Osmotic stress is one of the most common types of stress imposed on yeasts, making it necessary for the cell to survive under these conditions. The role of NADH-consuming glycerol formation is to maintain the cytosolic redox balance, especially under anaerobic conditions, compensating for cellular reactions that produce NADH [28]. Figure 3 shows the kinetics of glycerol production as a function of CO2 throughout the alcoholic fermentation. Glycerol synthesis was very high during the growth phase and until the middle of the stationary phase. With 50 g/L of CO2 released and more, a decrease in the slope for glycerol synthesis was observed, indicating a tendency towards a slowing down of production. This result was observed for the three fermentation temperatures: 18, 24 and 30 °C. The application of non-isothermal temperatures did not induce any changes in the synthesis of this compound.
Therefore, glycerol maintained the redox balance throughout the fermentation and, especially, up to the middle of the stationary phase (i.e., 60 g of CO2 released), where a change in the slope was observed. During this phase, glycerol acted purely as a safety valve for the elimination of excess reducing power and not as a protective agent against increases in the osmotic pressure of the medium [29]. After that, one hypothesis could be that acetaldehyde served as an electron acceptor for the novel oxidation of NADH to NAD+. This hypothesis is detailed in the following sections. Temperature favored the production of final amounts of glycerol at concentrations of 6.3 g/L at 18 °C, 6.8 g/L at 24 °C and 7.2 g/L at 30 °C (ANOVA p-value < 0.001), as observed in other studies [30,31,32,33]. This temperature-related overproduction could be explained by higher glycerol-3-phosphate deshydrogenase (GPDH) activity at approximately 25 °C [11].

3.2.2. α-Ketoglutaric Acid Production

α-Ketoglutarate (also known as αKG, 2-oxoglutarate and 2-oxoglutaric acid) is a key tricarboxylic acid (TCA) cycle intermediate and an important intermediate in many catabolic and anabolic processes. Under fermentative conditions with Saccharomyces cerevisiae, TCA does not function in a cyclic form, as under aerobic conditions [34], but with an oxidative and a reductive branch with succinate as the final compound [35]. Camarasa et al. (2003) showed that, under oenological conditions, about two thirds of the succinate were synthesized via the reducing branch but that the oxidative pathway was also active during the growth phase and allowed the synthesis of α-ketoglutarate, a key component of nitrogen metabolism (redirected to amino acid synthesis).
It was found in this study that α-ketoglutarate was produced throughout the alcoholic fermentation and in a very similar way as glycerol (Figure 3) for all three isothermal temperatures (no impact on the synthesis at anisothermal temperatures). When glycerol synthesis was plotted against α-ketoglutarate during alcoholic fermentation, very high correlations were obtained at 18 °C (r2 = 0.9980), 24 °C (r2 = 0.9916) and 30 °C (r2 = 0.9961). These correlations clearly showed a metabolic link between the syntheses of these two compounds. Indeed, the α-ketoglutarate synthesis pathway through the TCA cycle was responsible for the reduction of NAD+ to NADH via isocitrate conversion to α-ketoglutarate in contrast to the glycerol synthesis pathway that oxidized excess NADH to NAD+.
Regarding the effect of temperature on α-ketoglutarate synthesis, it was observed that higher temperatures induced higher concentrations of this compound. Indeed, final α-ketoglutarate concentrations of 0.59, 0.97 and 1.28 g/L were found for 18, 24 and 30 °C, respectively (ANOVA p-value < 0.001).
Two hypotheses explaining this result could be proposed. The first hypothesis is that, although cell activity was higher at high temperature [24,32,36,37,38], the higher flux of α-ketoglutarate was not used by the glutamate pathway to form amino acids [39,40]. Indeed, in the present work employing a high lipid concentration (linked to a high turbidity of 500 NTU), the flux within the acetic acid synthesis pathway (precursor of lipid synthesis) was low [31,32]; therefore, so was NADPH availability. The low availability of this co-factor thus resulted in very limited α-ketoglutarate conversion to glutamate [40], leading to α-ketoglutarate accumulation in the extra-cellular medium. The second hypothesis is related to the fact that α-ketoglutarate synthesis was highly correlated with that of glycerol. When the production of the latter was enhanced, the cell needed to reduce high quantities of NAD+ (generated by the glycerol-3-phosphate pathway) to maintain its intracellular redox balance. Therefore, the reductive pathway of the TCA cycle was activated, resulting in increased accumulation of α-ketoglutarate.

3.2.3. Succinic Acid Production

Succinic acid is a by-product in the alcoholic fermentation of yeasts, with amounts ranging from a few mg up to 2 g/L in all products of fermentation [41]. As the main acid produced by yeast, it significantly influences organoleptic balance by providing acidity and a desirable salty–bitter taste. Succinate synthesis started at the beginning of fermentation [42] and continued during the growth and the stationary phases regardless of the temperature applied (Figure 3).
Succinic acid can be formed from pyruvate or aspartate via the reductive branch of the TCA cycle or from pyruvate via the oxidative branch. In the reducing pathway of the TCA cycle, the precursor of succinate is L-malate. In the present work, it is important to note that, depending on the state of advancement of the fermentation, the correlation behavior of these two compounds diverged. Indeed, during the growth phase and for up to 50% of the fermentation process, a negative correlation existed at the three temperatures (18 °C, r2 = 0.9913; 24 °C, r2 = 0.9759; and 30 °C, r2 = 0.9747): malate (present in the must at 4 g/L) was consumed to synthesize succinate. On average, at 18 and 24 °C, the decrease of 0.3 g/L of malate induced the production of 1.3 g/L for succinate, while at 30 °C, there was a decrease of 0.25 g/L for malate with an increase of 0.9 g/L of succinic acid. During the second part of the fermentation—i.e., during the stationary phase—re-accumulation of malate in the fermentation medium was associated with succinate production, with positive correlations at 18 °C (r2 = 0.9243), 24 °C (r2 = 0.8886) and 30 °C (r2 = 0.9470). Indeed, during this phase, succinate was produced by the TCA reductive pathway but the malate concentration of natural musts could also have stimulated succinate synthesis in the first phase [43].
Finally, establishing correlations between succinate and other intermediates of the TCA cycle makes it possible to better understand the production kinetics of this acid. At first, citrate synthesis (precursor of succinate through the oxidative pathway) was only observed during the growth phase (positive correlation with succinate) and up to the beginning of the stationary phase; i.e., for up to 40% of the fermentation process for 18 °C (r2 = 0.8792), 24 °C (r2 = 0.9796) and 30 °C (r2 = 0.9864). In contrast, α-ketoglutarate, which is also a precursor of succinate, was always correlated with succinate throughout the fermentation for all three temperatures (r2 = 0.9848, 0.9823 and 0.9739 for 18, 24 and 30 °C, respectively). This can be explained by the fact that succinic acid can also be produced from glutamate through glutamate oxidation to α-ketoglutarate followed by the conversion of α-ketoglutarate to succinic acid via this step of the TCA cycle (a reverse pathway from glutamate). All these results confirmed that the TCA reductive branch (reductive pathway) is the main pathway operative during anaerobic fermentation [29,43].

3.2.4. Acetic Acid Production

In Saccharomyces cerevisiae, acetate is produced as an intermediate of the pyruvate dehydrogenase (PDH) bypass, which converts pyruvate to acetyl-CoA in a series of reactions catalyzed by pyruvate decarboxylase (PDC), acetaldehyde dehydrogenase (ACDH) and acetyl-CoA synthetase. This pathway is the sole source of cytosolic acetyl-CoA, which is required for anabolic processes, such as lipid biosynthesis [44]. The reaction catalyzed by ACDH also generates reducing equivalents, which are required for a variety of synthetic pathways and redox reactions, in the form of NADPH [45].
The monitoring of acetic acid synthesis showed that acetic acid was essentially produced during the growth phase and until the maximum CO2 production rate was reached. Afterwards, stabilization and a slight decrease in acetate concentration in the medium were observed during the stationary phase. In the present work, the decrease was even more significant at high temperatures, with final concentrations of 0.32 g/L of acetic acid at 18 °C compared to 0.21 and 0.23 g/L at 24 and 30 °C, respectively. The volatility of the molecule could explain these results, but the data in the literature remain contradictory to date [46,47].
Acetaldehyde, a precursor of acetate through the activity of aldehyde dehydrogenase, has similar kinetics to acetate, showing accumulation during the growth phase until a maximum concentration is reached, as observed by other authors [8,18]. This was also illustrated by the positive correlation between acetaldehyde and acetate synthesis observed at 18 °C (r2 = 0.8230), 24 °C (r2 = 0.8803) and 30 °C (r2 = 0.9253).

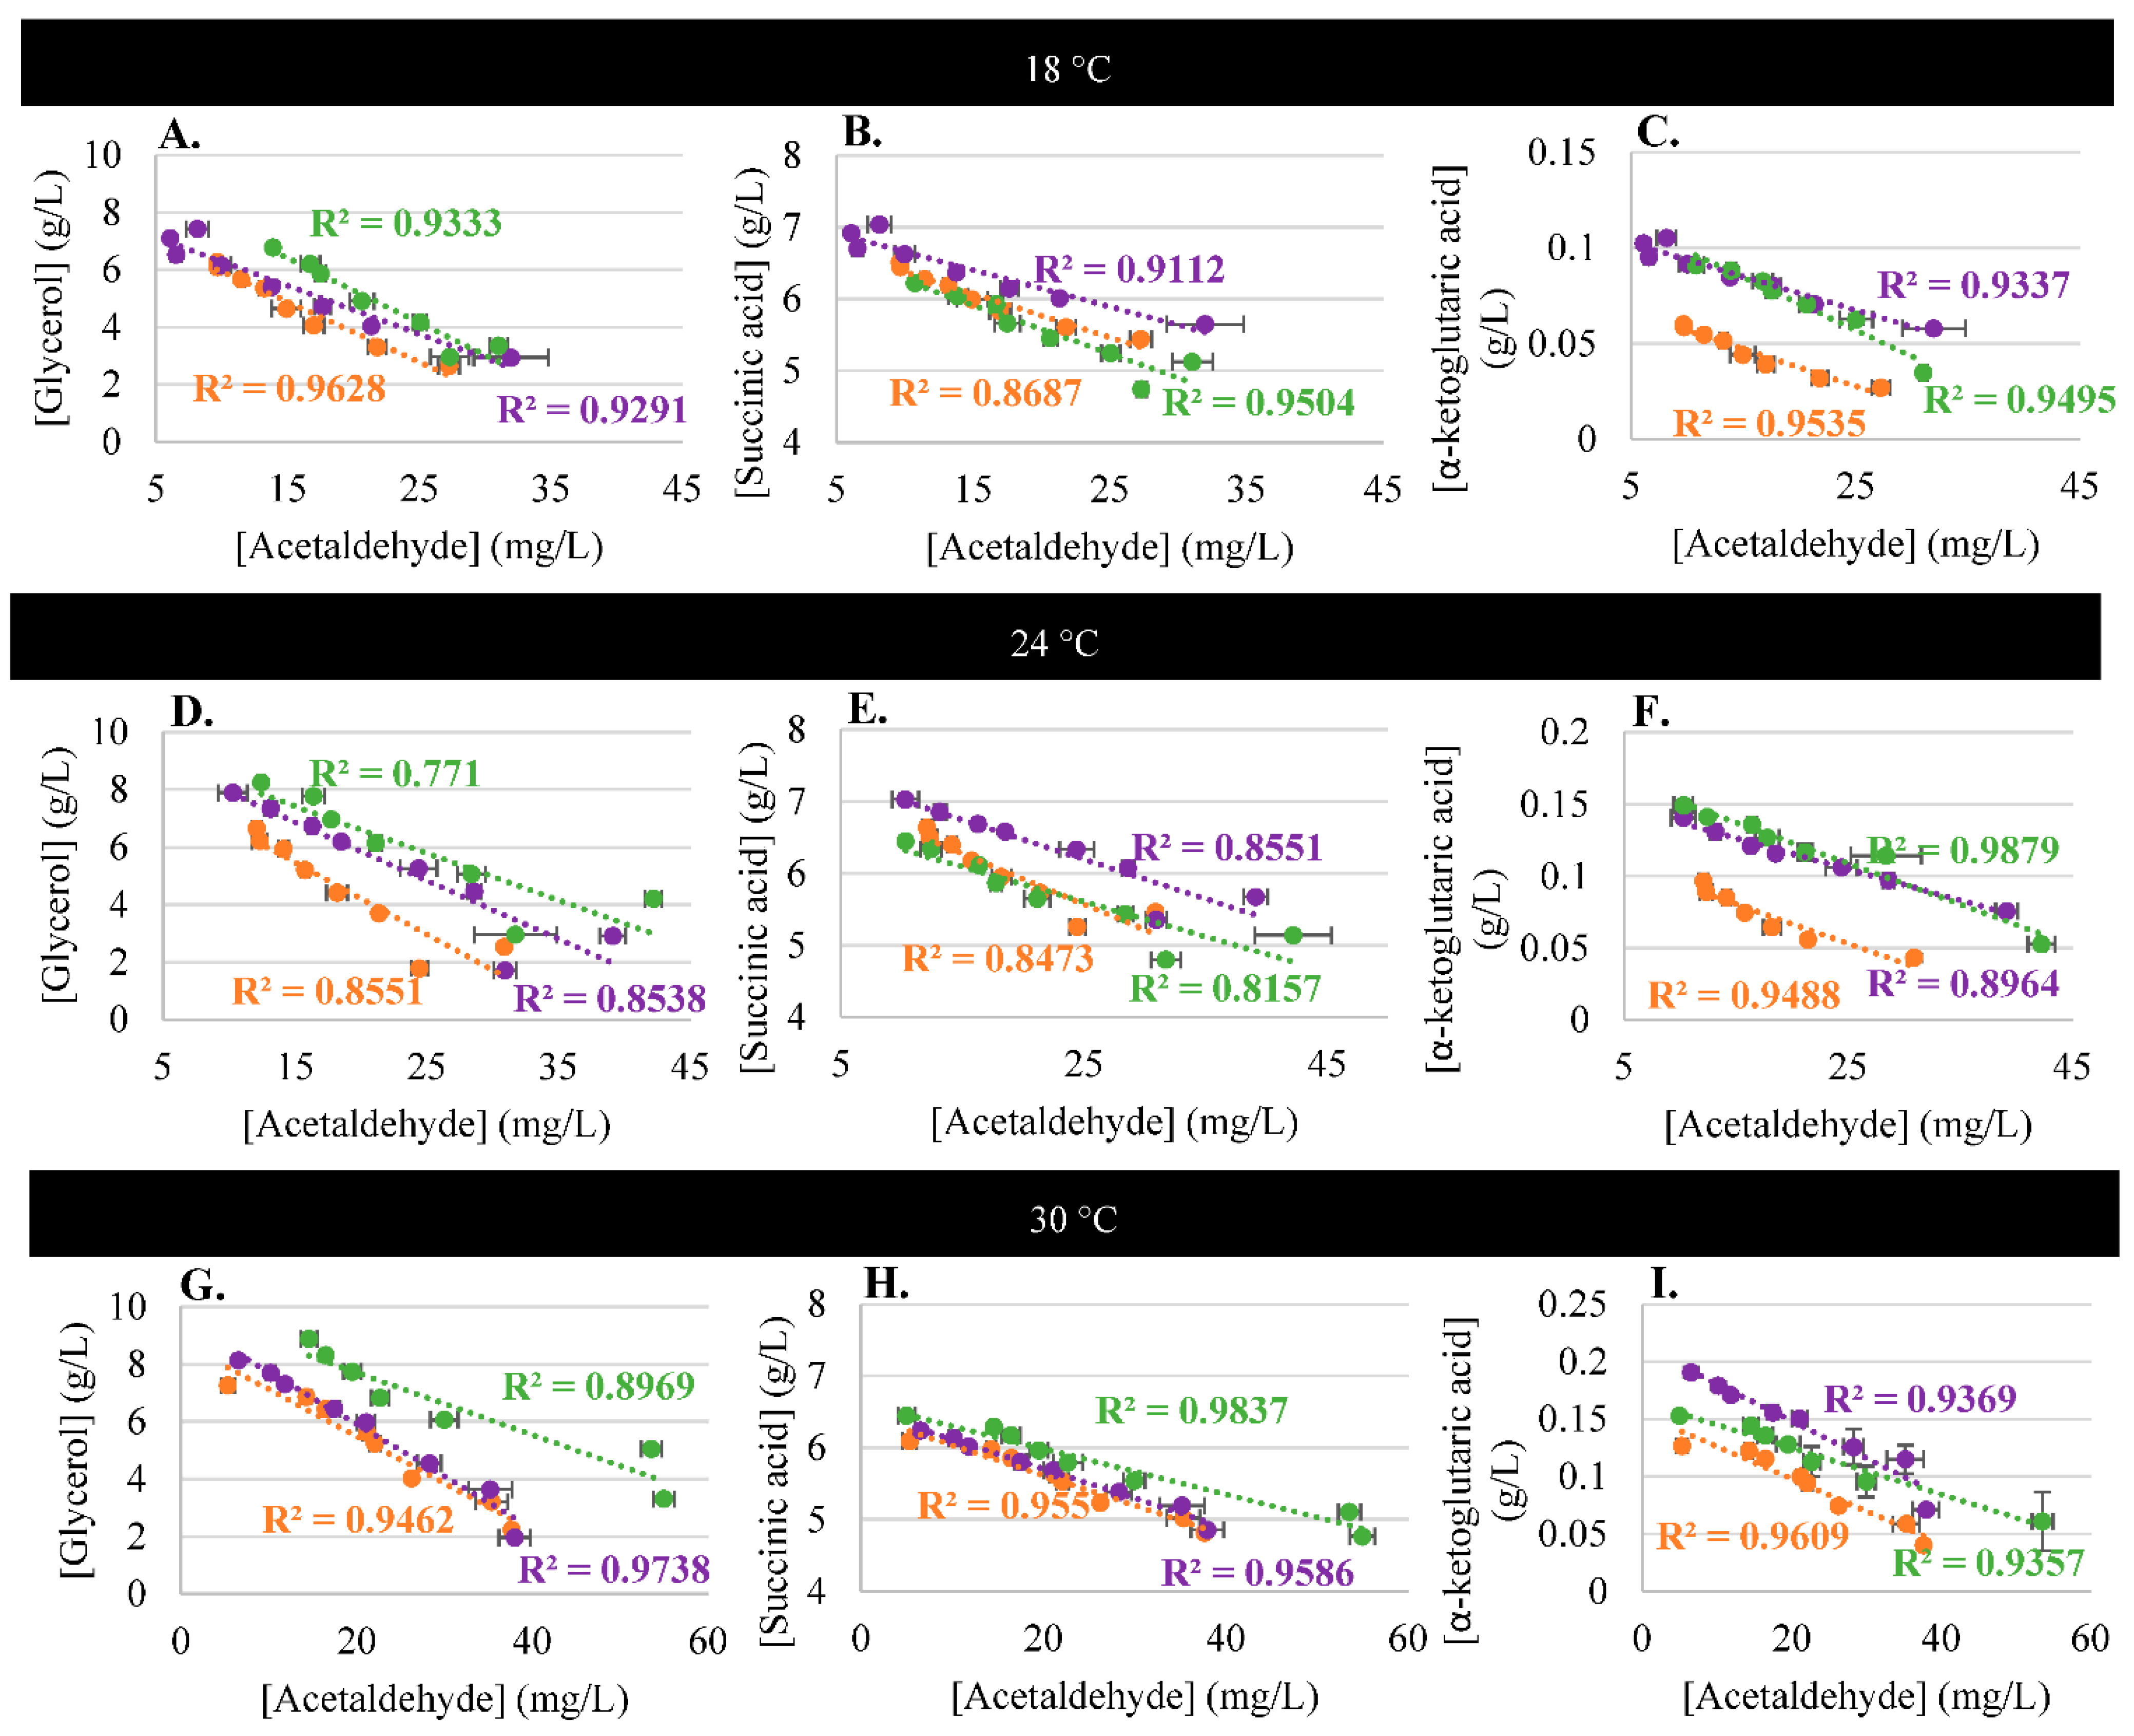
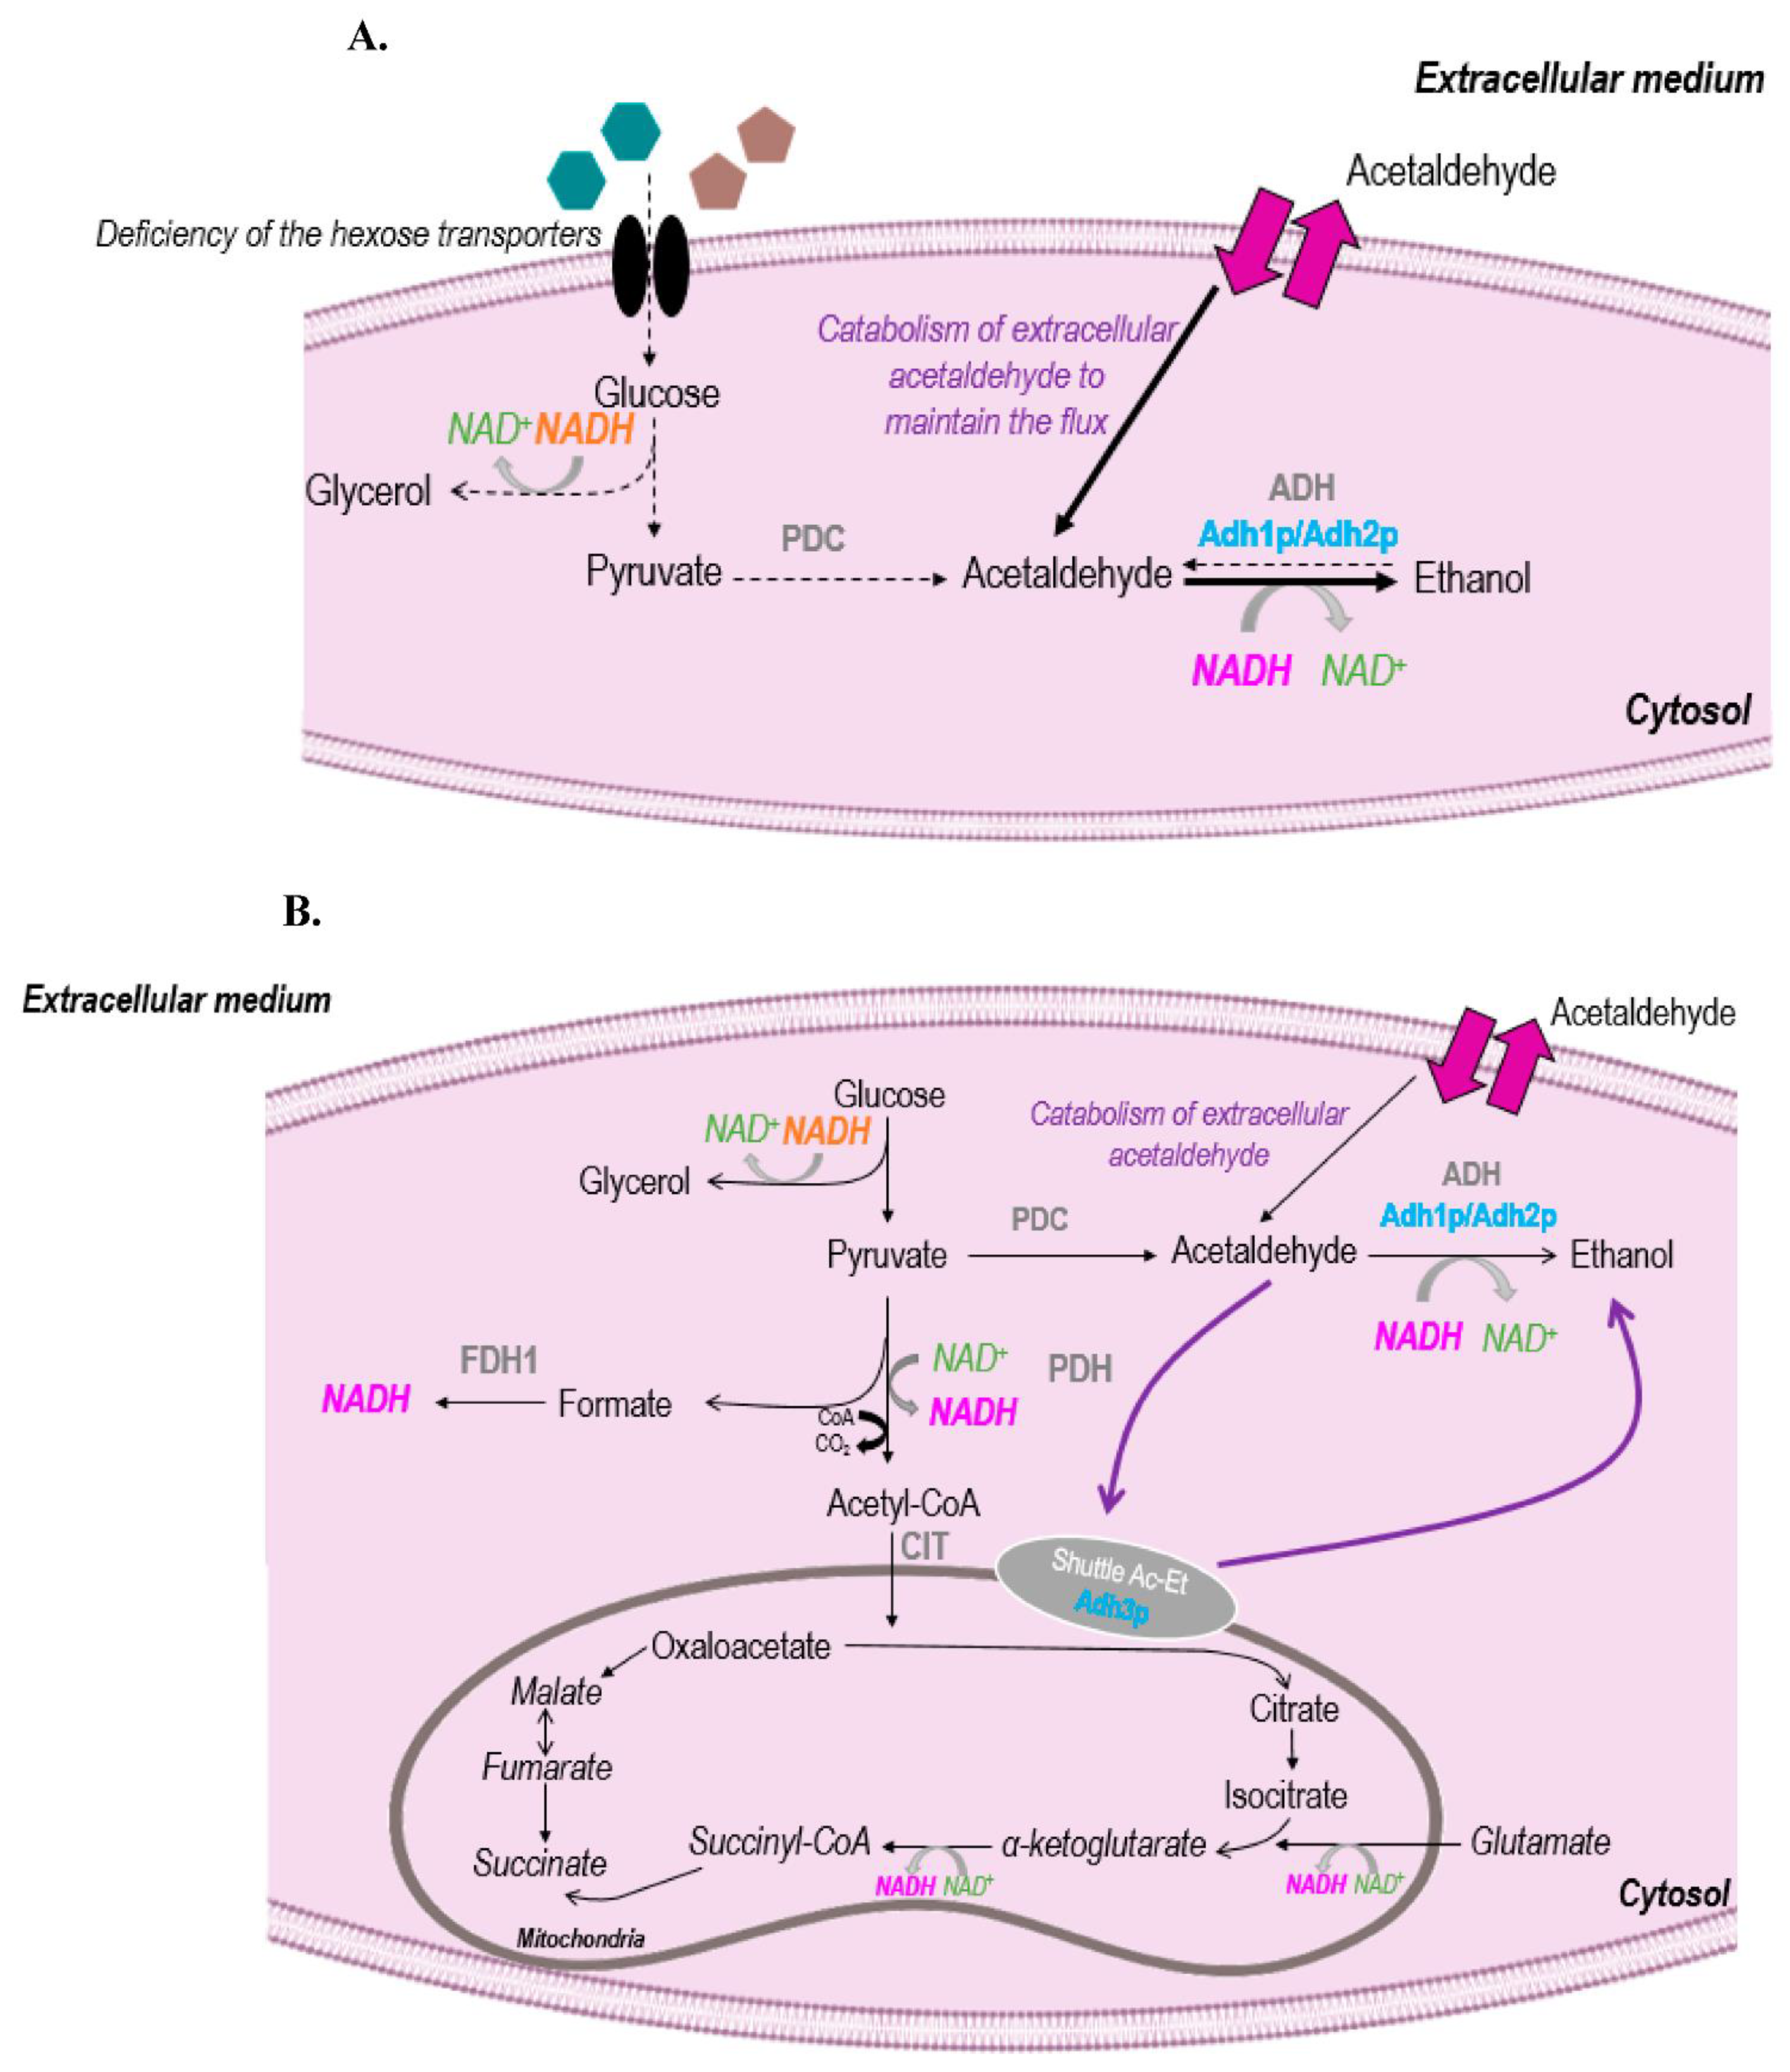
3.3. Acetaldehyde and Metabolism

The kinetics of acetaldehyde depend strongly on the redox balance of the cell. At the beginning of the winemaking process, glycerol synthesis allows the recycling of NADH/NAD+ and ensures the maintenance of the redox balance of the cell system. Then, in the stationary phase, the slower but continuous synthesis of glycerol is generally used to fight against osmotic stress, as acetaldehyde is present in sufficient quantities to play its reducing role with an important flux [12]. A previous study stated that acetaldehyde is unable to serve as an electron acceptor for cytosolic NADH and that the accumulated NADH is instead oxidized by the reduction of dihydroxyacetone phosphate to glycerol-3-phosphate [48]. However, addition of acetaldehyde at the beginning of fermentation has been shown to reduce the lag phase of the yeast. Therefore, the acetaldehyde molecule seems to act as an activator of NADH-consuming metabolic pathways and, in particular, of the lower part of the glycolysis pathway [6].
These results were corroborated by the strong correlation between glycerol and acetaldehyde synthesis observed in our work. Figure 4A,D,G demonstrate the metabolic link between the syntheses of these two metabolic markers involved in redox balance maintenance. Additionally, an inverse correlation was noted between the final concentrations of acetaldehyde and glycerol. Thus, during its catabolism, acetaldehyde serves as a terminal electron acceptor for the redox balance of yeast and its creation of energy through glycolysis [1], while glycerol is always produced so that it can also participate in the maintenance of the redox balance, on the one hand, and for resistance against osmotic stress, on the other hand [29] Yeast consumption of extracellular acetaldehyde may hypothetically be connected with hexose transporter activity. Indeed, Saccharomyces cerevisiae harbors several hexose transporters that transport glucose and fructose through facilitated diffusion. It has been shown that, under enological conditions, the activity of the low-affinity hexose transport system starts to decrease when the fermenting cells are in the early stationary phase, limiting sugar transport [49,50]. This decreased activity reduces the flux in the earlier part of the glycolysis pathway, resulting in a lower intracellular concentration for acetaldehyde, therefore enabling the consumption of extracellular acetaldehyde to regenerate NADH (Figure 5A).
An alternative hypothesis regarding acetaldehyde consumption by yeast can be put forward in this study. Acetaldehyde synthesis is strongly correlated with the synthesis of TCAs, such as succinate and α-ketoglutarate, as markers of metabolism involved in the reduction of NAD+ to mitochondrial NADH (Figure 4B,C,E,F,H,I). Such a correlation between acetaldehyde consumption and organic acid synthesis by yeast during the stationary phase has already been described [51] This metabolic link can be verified by considering the acetaldehyde–ethanol shuttle that allows the exchange of mitochondrial NADH with cytosolic NADH [52]. Coupling of the mitochondrial alcohol dehydrogenases Adh3p and cytosolic Adh2p can be ensured by the diffusion of acetaldehyde and ethanol between the two compartments. However, this shuttle is not functional in oenological fermentations: if Adh3p is indeed active during fermentation, Adh2p is inactive because of repression by glucose [53]. The action of the Adh3p enzyme with the entry of acetaldehyde into mitochondria and the exit of ethanol from this compartment thus distorts the cytosolic NADH/NAD+ balance: the entry of one mole of acetaldehyde into mitochondria generates a surplus of cytosolic NADH since this molecule cannot be used to form ethanol. In order to equilibrate the cytosolic NADH/NAD+ balance, the yeast cell again consumes the acetaldehyde previously excreted in the medium to compensate for this redox imbalance (Figure 5B). A recent study also underlined the importance of Adh3p in the oxidization of mitochondrial NADH to NAD+ and the central role of the major TCA-contributing metabolites (malate, α-ketoglutarate, succinate and citrate), showing a strong correlation between organic acid production and acetaldehyde consumption [5,54]. The production of these acids helps maintain the mitochondrial redox balance by reducing NAD+ (produced by Adh3p) to NADH. The evolution of accumulated and consumed acetaldehyde over time indicates that it correlates directly with markers of interest for redox balance, thus allowing its maintenance thanks to its role as electron acceptor.

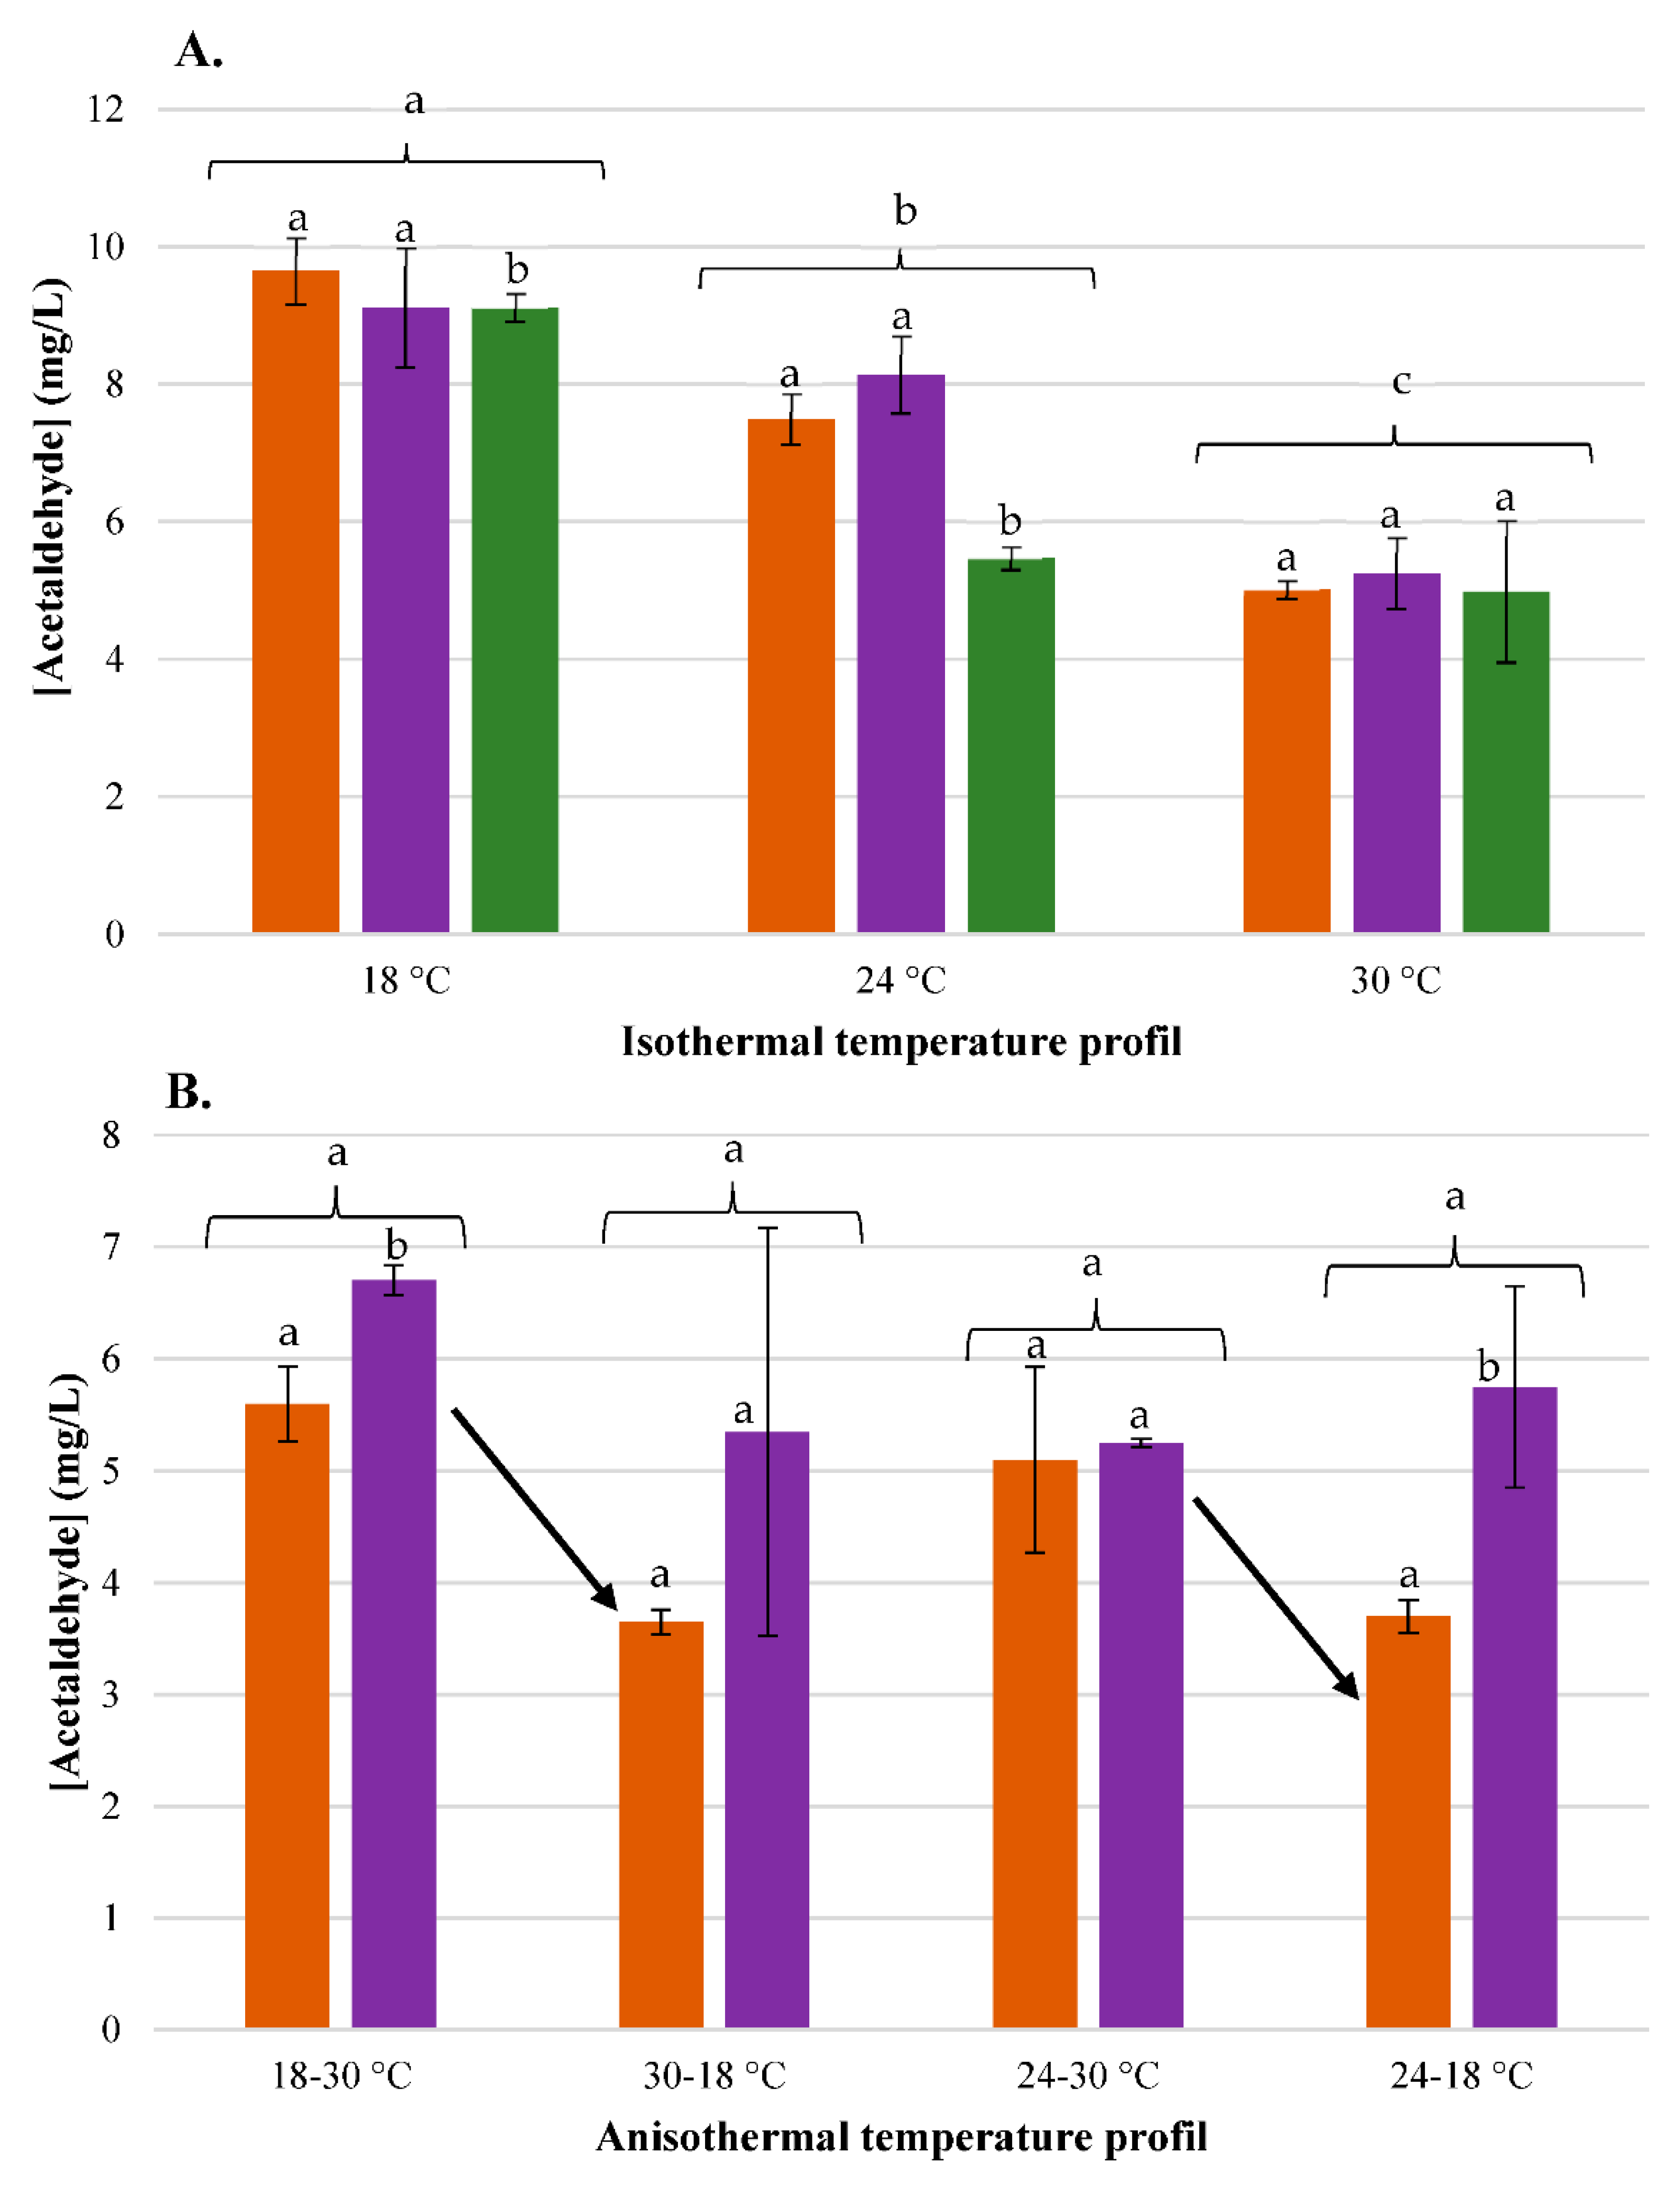
3.4. Impact of Temperature on Acetaldehyde

Temperature can impact both (a) acetaldehyde synthesis and consumption by yeast and (b) evaporation of this volatile molecule. However, to date, the relative contributions of these two phenomena to the evolution kinetics of acetaldehyde concentration in the liquid phase remain unknown.
First, high temperatures resulted in higher accumulation of acetaldehyde in the medium (Table 1) when the maximum population was reached, as previously demonstrated by [8]. For strain FC9®, maximum acetaldehyde concentrations varied around 27.3 mg/L at 18 °C versus 35.8 mg/L at 30 °C (p-value < 0.001). With strain SM102®, the impact of temperature was limited, and the strain appeared to produce a similar amount of acetaldehyde (around 40 mg/L, p-value < 0.05) regardless of the temperature chosen. Finally, for strain 7013®, a major impact from temperature was observed, with a variation of 31.0 mg/L at 18 °C versus 53.5 mg/L at 30 °C (p-value < 0.001). While results concerning the levels of acetaldehyde accumulated in the medium at the end of the growth phase remain contradictory, authors agree in considering the fermentation temperature a key point in the production of acetaldehyde [8,16,17,18,19,20] and that high temperatures seem to promote high concentrations of acetaldehyde at the end of the growth phase [17], in addition to higher cellular activity [36]. The effect of the strain on acetaldehyde production was also highly significant (Table 1) (p-value < 0.001), with strain 7013® being the strain that resulted in the highest accumulation of acetaldehyde. Indeed, acetaldehyde production is a “strain-dependent” trait, which complicates comparisons with other studies [10].
A strain effect was also observed for residual acetaldehyde (Figure 6), but this time, strain 7013® achieved the lowest final concentration. For the other two strains, final acetaldehyde concentrations were similar with isothermal temperature profiles, while strain FC9® led to the lowest concentrations with anisothermal profiles. The impact of temperature on residual acetaldehyde was different from that on accumulated acetaldehyde; indeed, high temperatures induced a decrease in final acetaldehyde content. At 30 °C, the concentrations for the three strains were around 5 mg/L in the wines compared to around 9 mg/L (Tukey test < 0.001) at 18 °C. Furthermore, descending anisothermal temperature profiles (30–18 °C and 24–18 °C) tended to resulted in lower residual acetaldehyde concentrations than the ascending profiles (18–30 °C and 24–30 °C). Thus, an inverse correlation was observed for all temperatures between accumulated and residual acetaldehyde concentrations.
To understand the impact of temperature on acetaldehyde synthesis, various hypotheses can be proposed: (a) From a biological point of view, yeast metabolic activity is lower at low temperatures and can be correlated with lower accumulation of acetaldehyde in the medium. Alternatively, poor cellular activity may be associated with poor consumption of acetaldehyde by yeast, leading to high residual concentrations [8]. In contrast, it can also result in a longer time for yeasts to consume acetaldehyde (low fermentation rate), which is associated with low residual concentrations [8,9,10,19]. (b) Another situation is when fermentation takes place at high temperatures: metabolic activity is higher with high acetaldehyde accumulation in the medium but there is better consumption by yeast and, thus, a lower residual concentration. Too short a fermentation duration can also reduce the time available for yeast consumption of acetaldehyde [10], thus inducing high final concentrations. (c) From a physical perspective, acetaldehyde evaporation at low temperatures will be lower and acetaldehyde will be present in higher concentrations at the end of fermentation. The reverse reasoning can be applied for high temperature. A question of interest thus emerges: what is the major phenomenon—evaporation or consumption by yeasts—involved in the decrease in acetaldehyde concentration in the liquid part during the stationary phase? Furthermore, was the observed inverse correlation between maximum accumulated acetaldehyde and residual acetaldehyde due to a physical or biological phenomenon? The isothermal and anisothermal temperature profiles demonstrated (a) the effect of temperature on the evaporation of the molecule (c.f. Section 3.4.1) and (b) the importance of cell activity and consumption time for acetaldehyde (c.f. Section 3.4.2). Thanks to the online monitoring system, we could access the complete balances for acetaldehyde production (Figure 7), and the biological phenomenon of consumption by yeasts could be distinguished from the physical phenomenon of evaporation of the molecule.

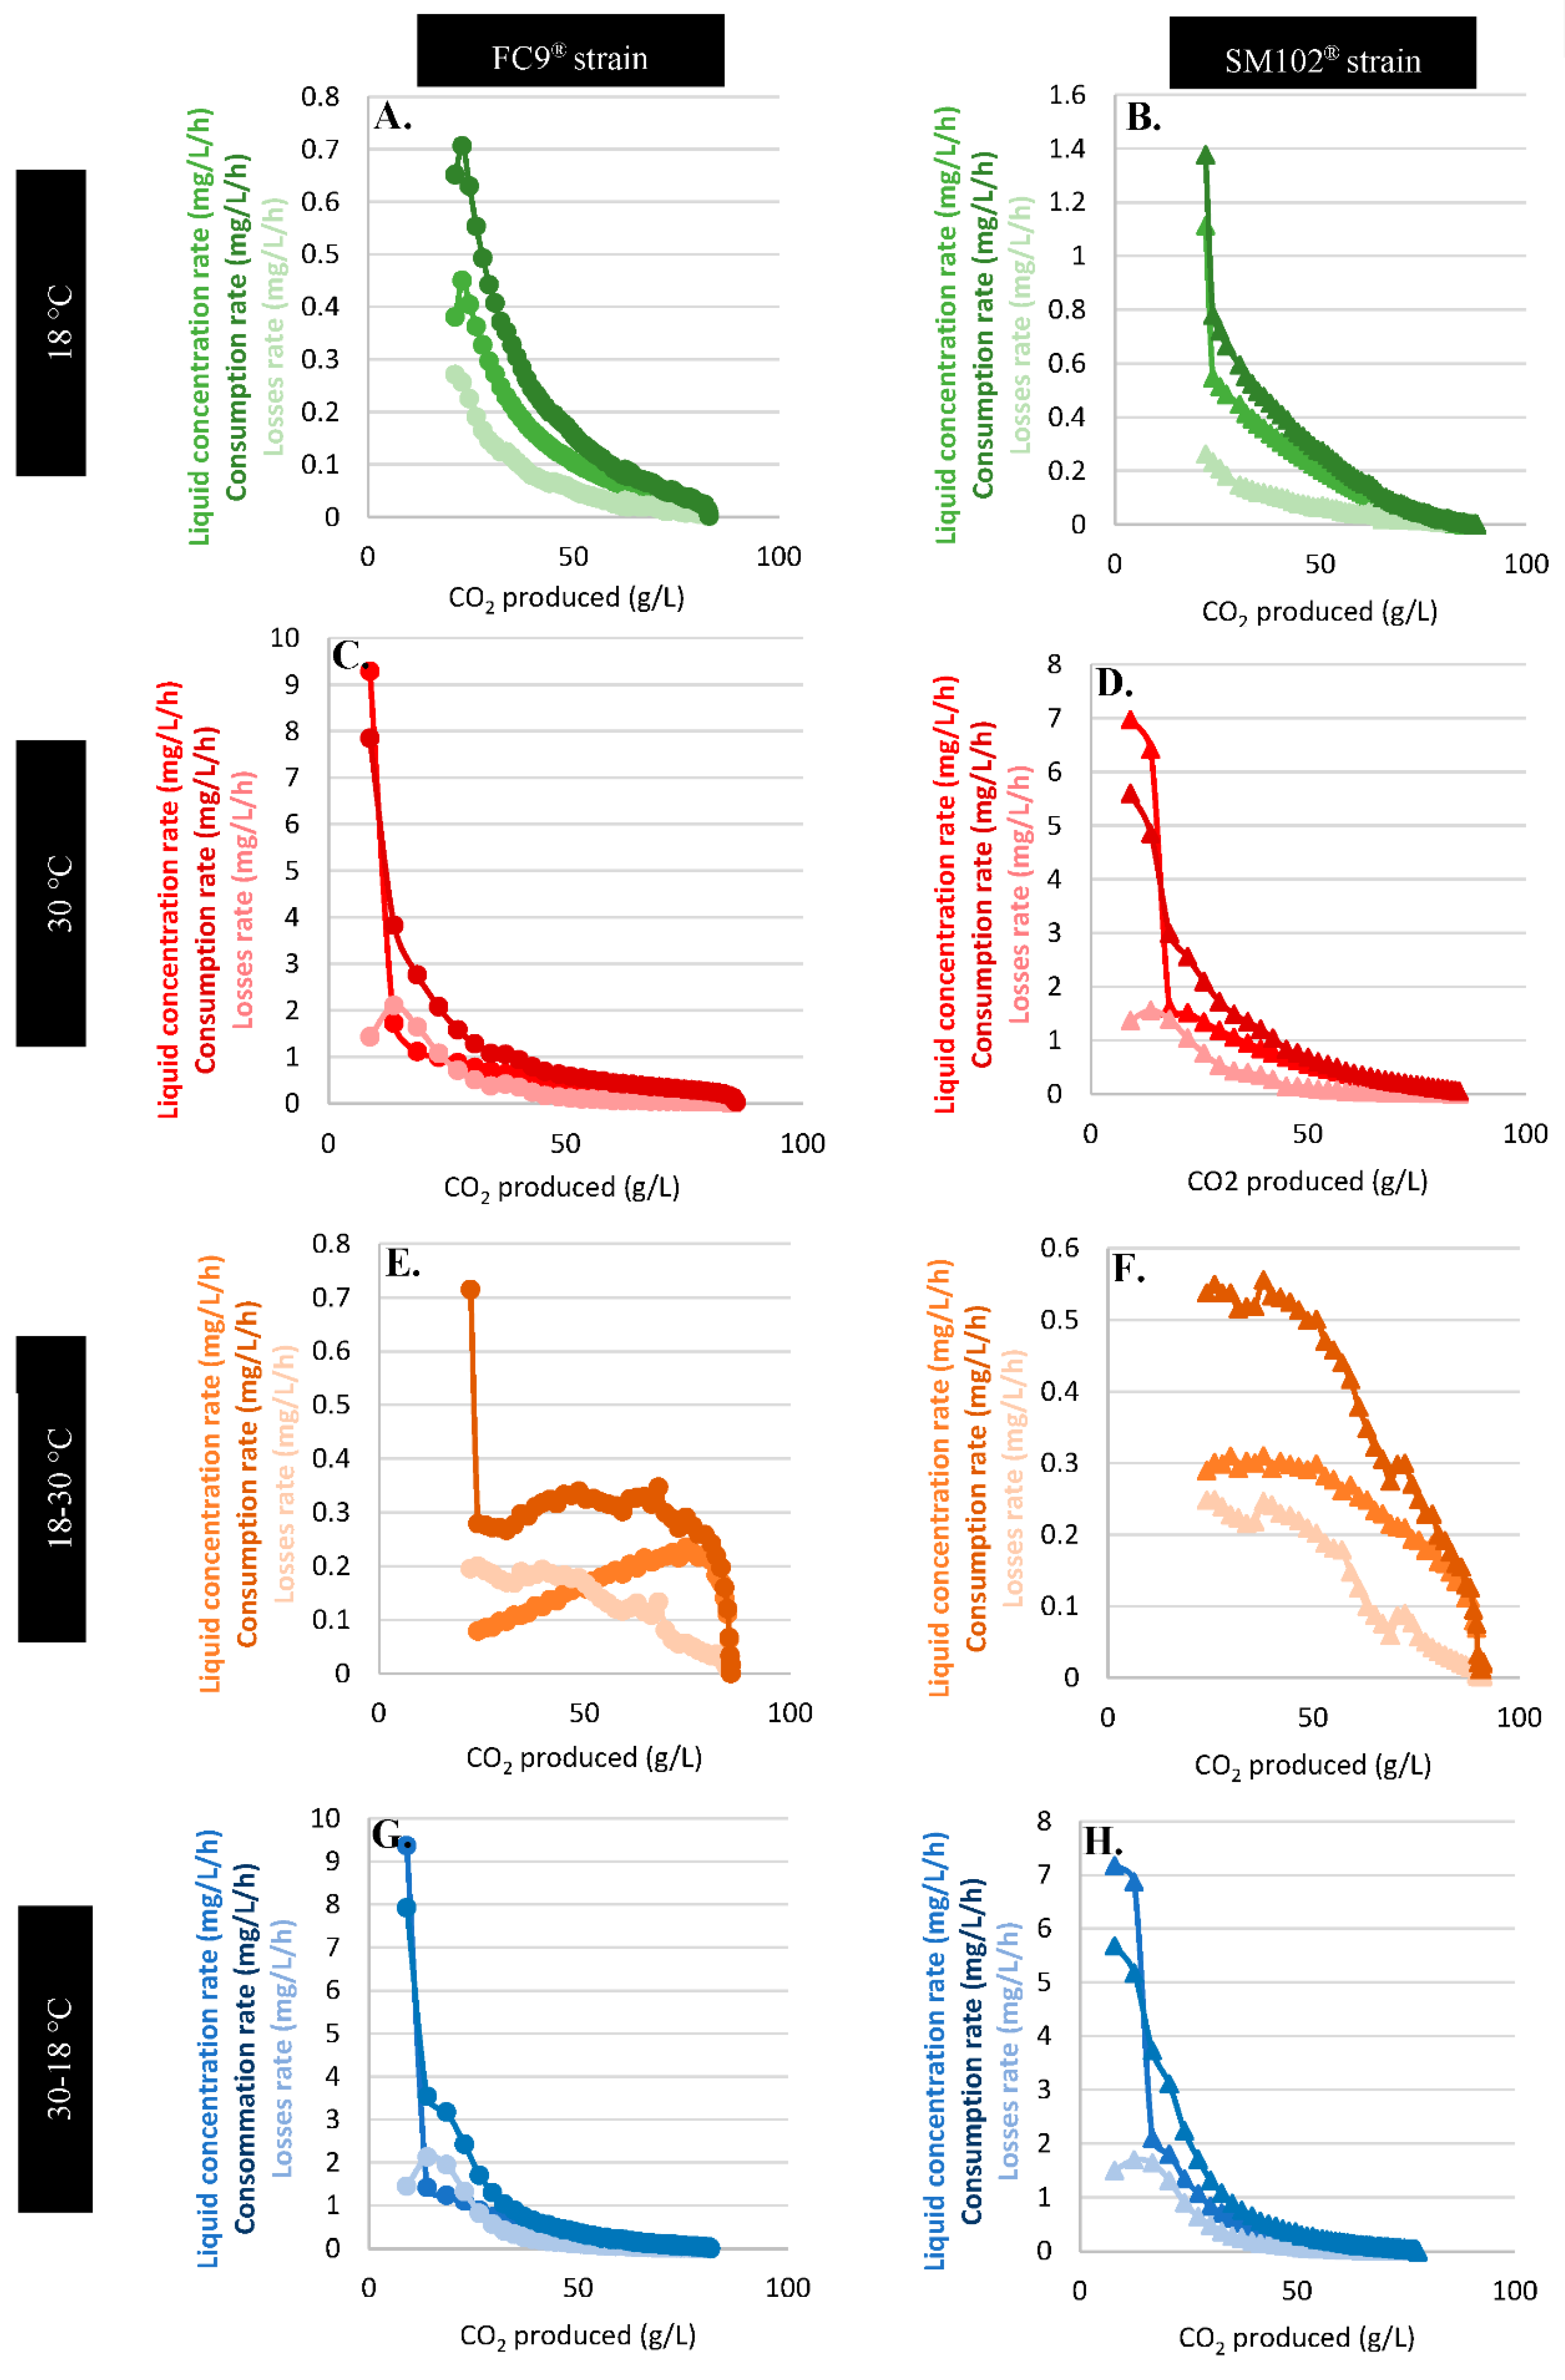
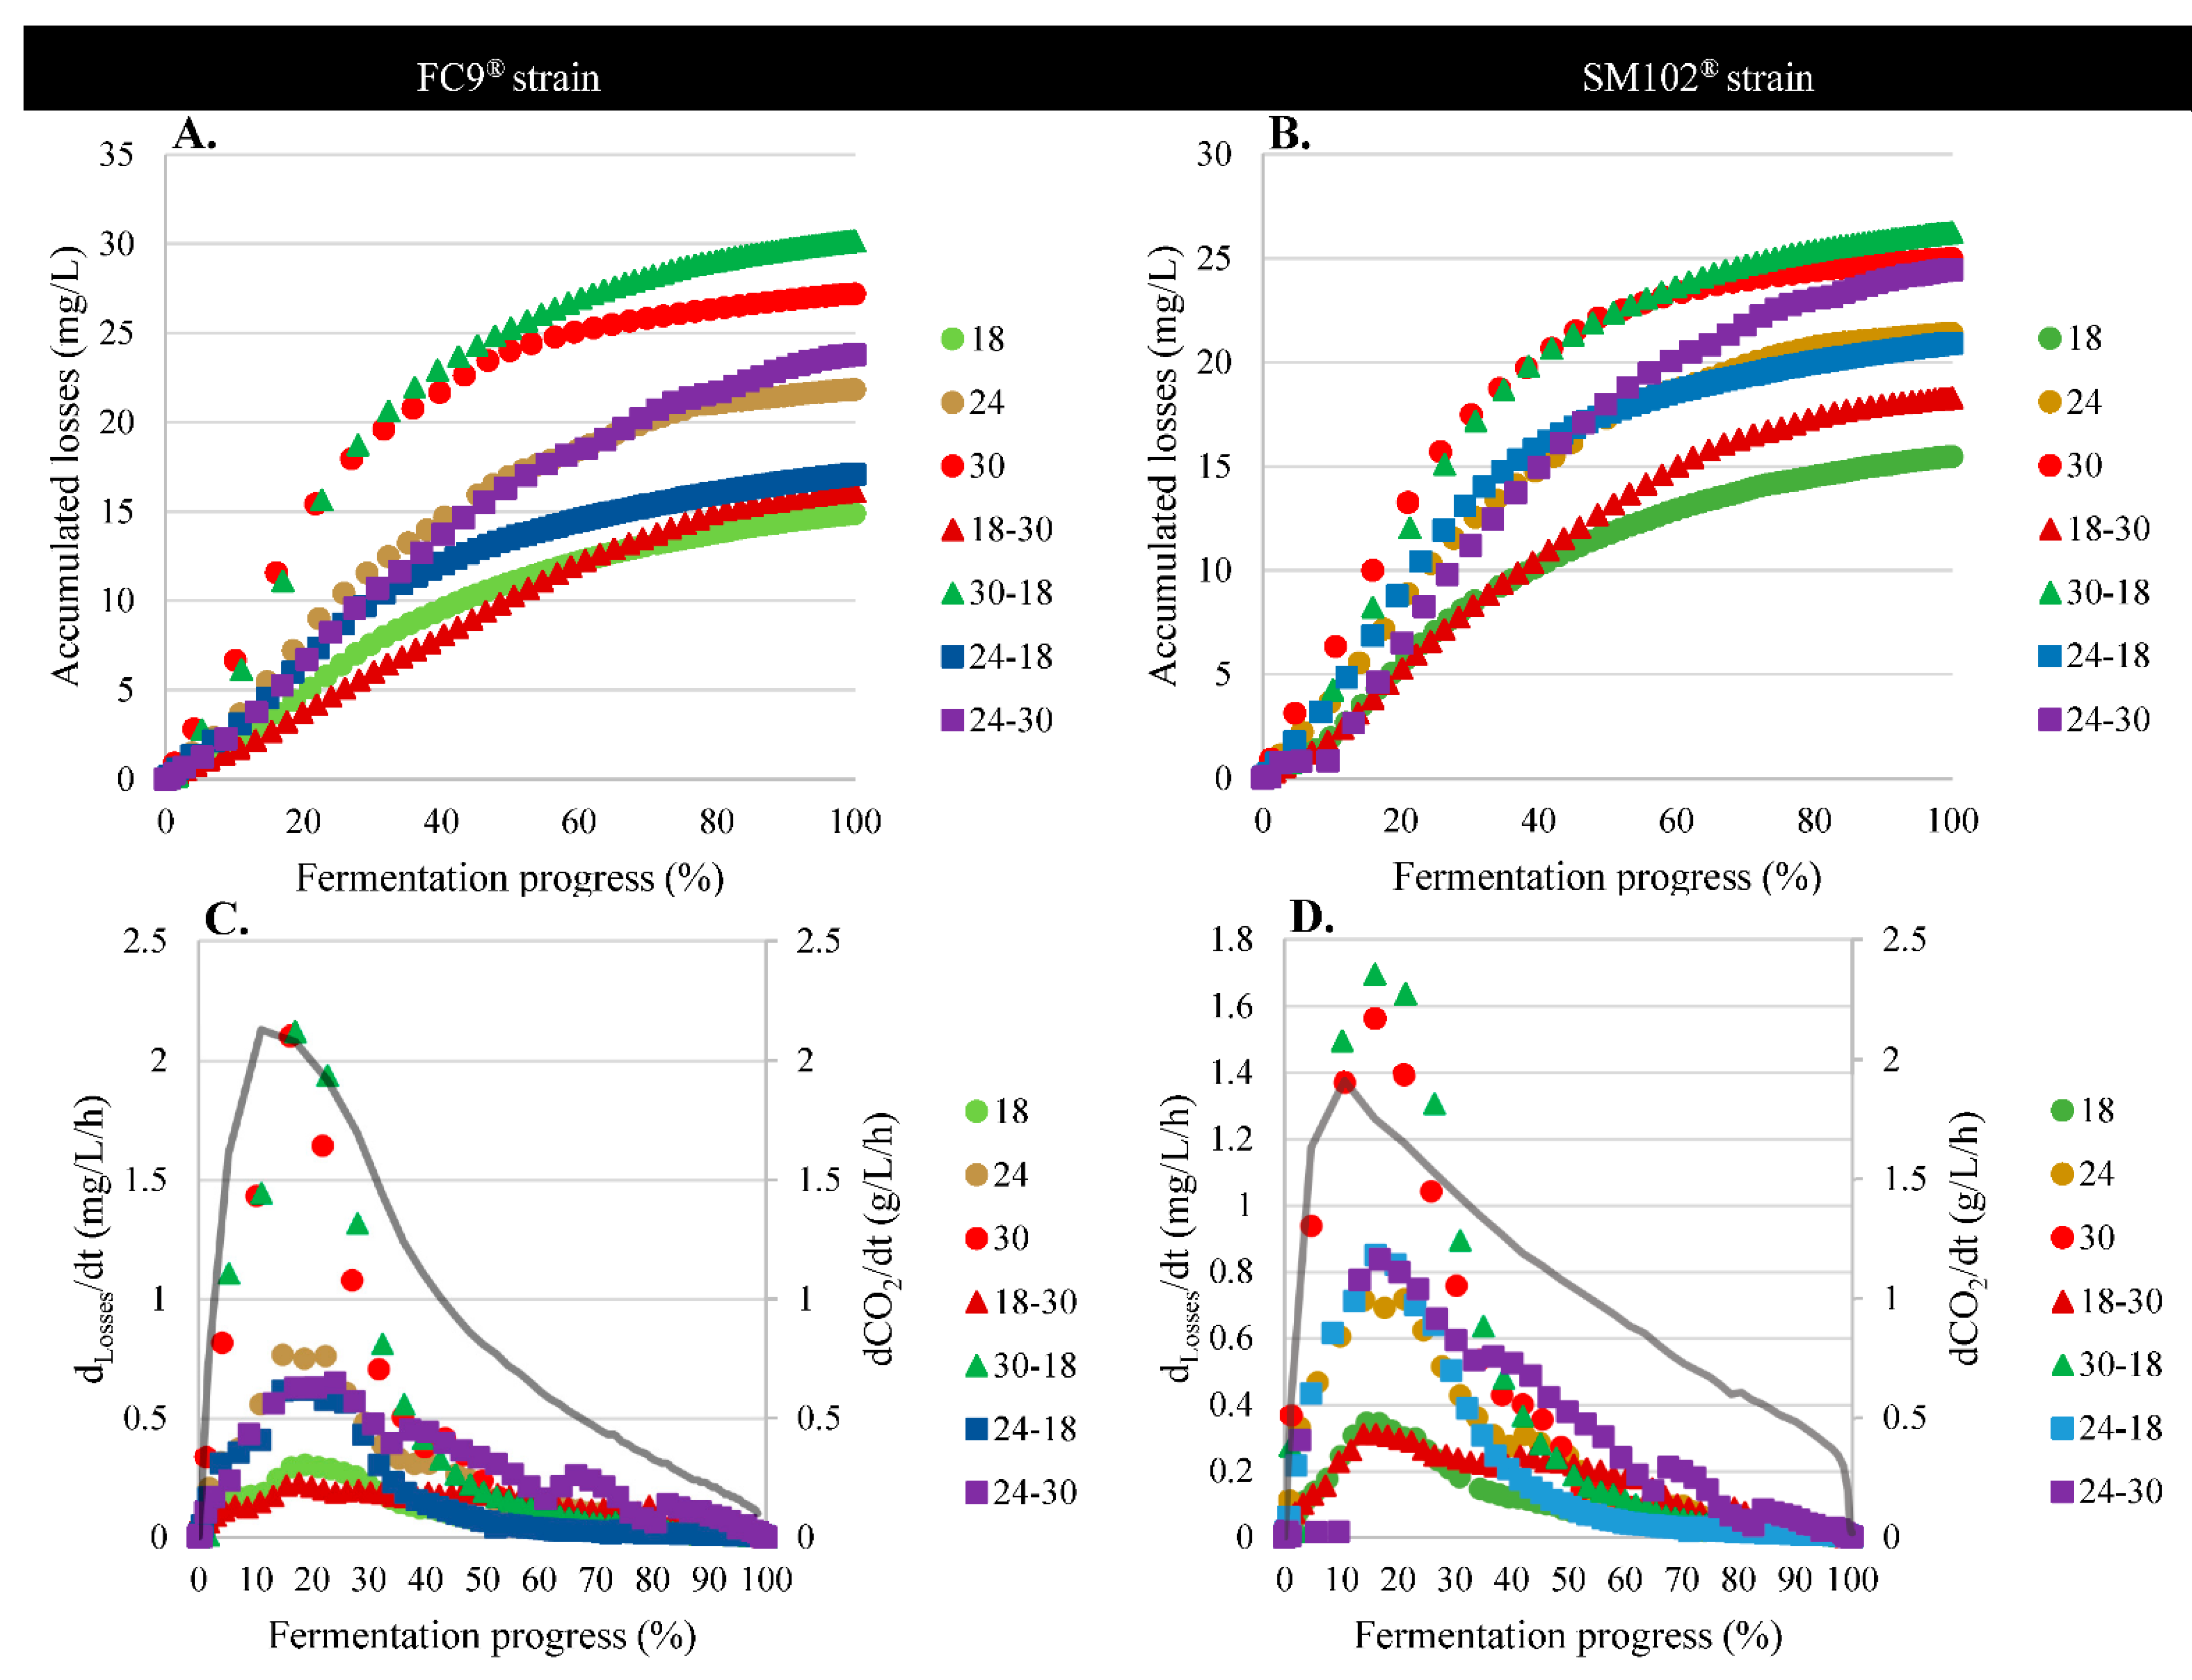
3.4.1. Physical Effect: Evaporation

Figure 8A,B show the cumulative losses of acetaldehyde throughout the alcoholic fermentation as a function of different temperature profiles and for two strains. Molecule losses were enhanced with temperature increases. When fermenting at 18 °C, cumulative losses were about 14.9 mg/L at the end of fermentation compared to 21.8 mg/L and 27.2 mg/L at 24 and 30 °C, respectively (Figure 7A,B). For the rising anisothermal profiles, such as 18–30 °C and 24–30 °C, the progressive increase in temperature generated additional increases in the accumulation of losses of 1.27 mg/L for the 18–30 °C profile and 1.94 mg/L for 24–30 °C compared to the isothermal profiles at 18 and 24 °C, respectively. When the temperature was lowered during the process, for the 24–18 °C profile, the cumulative losses were reduced by 6.68 mg/L at the end of fermentation compared to the isothermal 24 °C profile. On the other hand, different behavior was observed for the 30–18 °C profile. The cumulative losses were similar to the 30 °C isothermal profile, with a total of 30.16 mg/L. Since the temperature decrease was greater at 30–18 °C compared to 24–18 °C, more than half of the fermentation occurred between 30 °C and 26 °C—i.e., above the boiling point of acetaldehyde—and, therefore, evaporation continued to be promoted throughout the alcoholic fermentation.
Figure 8C,D show the rates of losses for all temperature profiles. The maximum rate of loss was systematically obtained after 20% of the fermentation process, which corresponded with the maximum acetaldehyde produced and accumulated in the extracellular medium when the yeast population was at its maximum, as well as with the high CO2 release rate achieved, which necessarily influences the rate of loss. Therefore, the more acetaldehyde was produced and accumulated at high temperatures, the more acetaldehyde was also lost simultaneously. Using the real-time quantification of losses, online monitoring data for the molecule made it possible to demonstrate that a part of the acetaldehyde was lost in the gas phase through evaporation during alcoholic fermentation [7]. Then, the differences between the physical and biological effects on the consumption of the molecule were demonstrated.

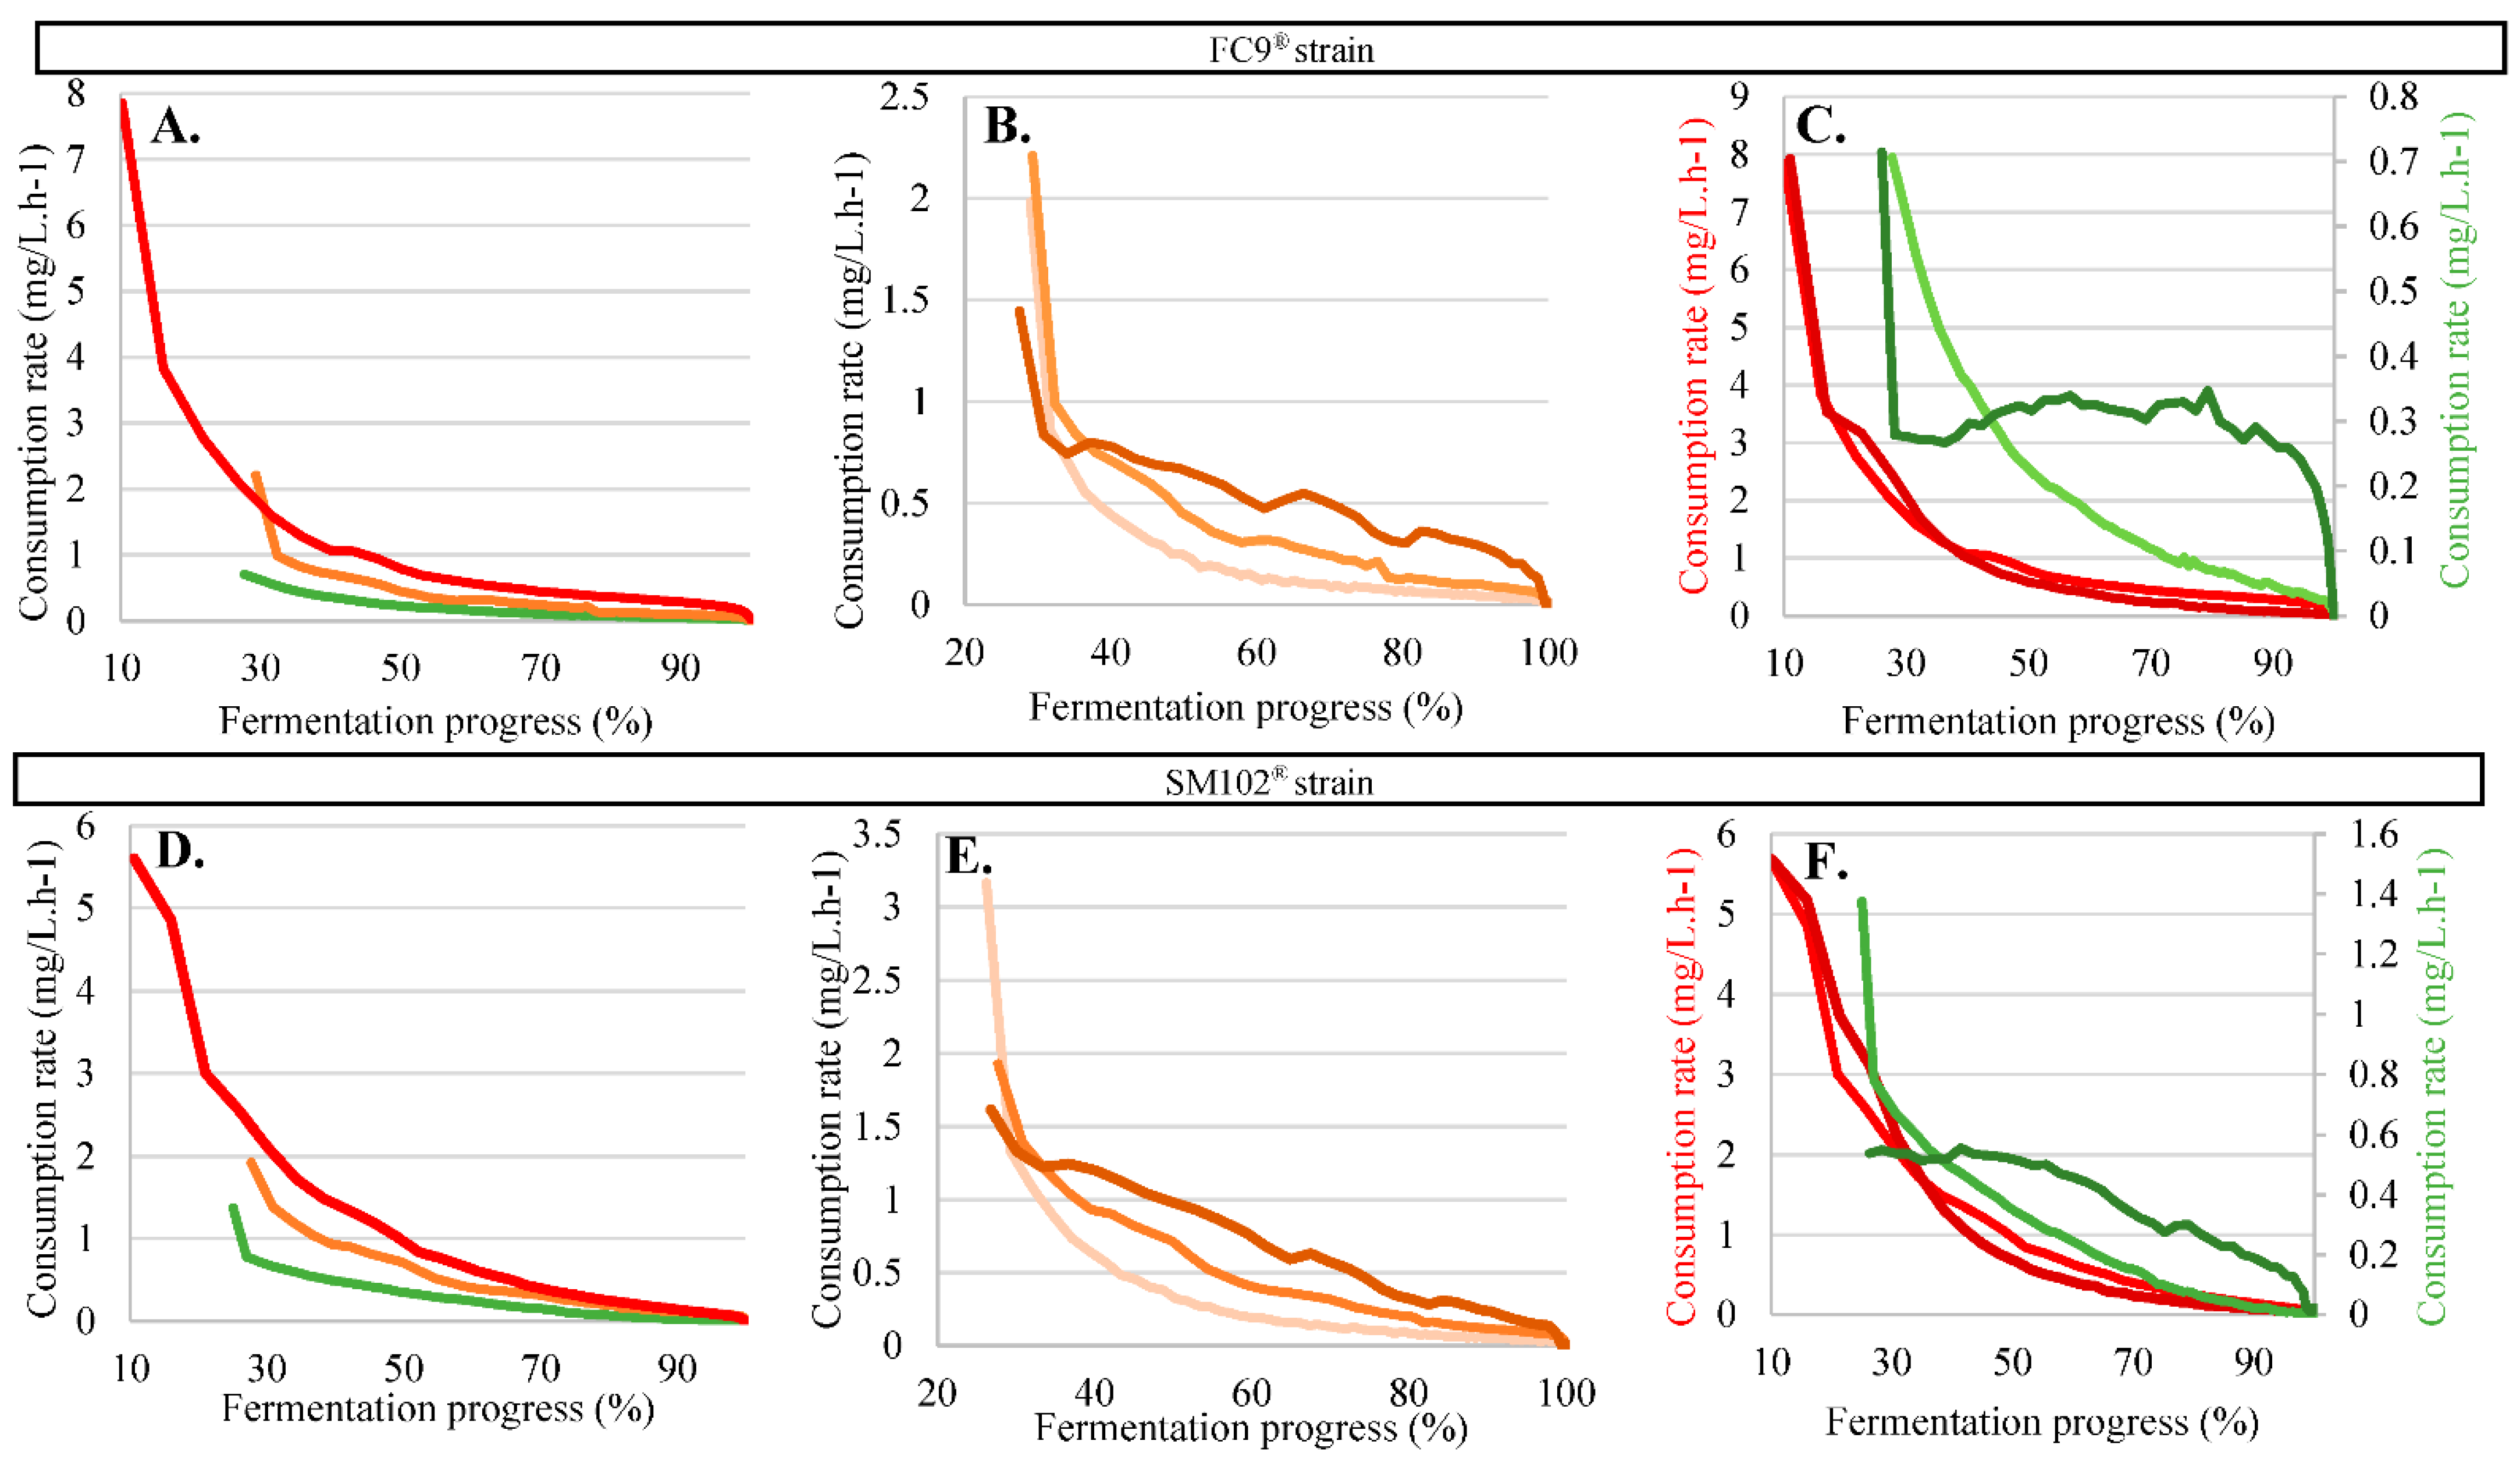
3.4.2. Biological Effects: Consumption by Yeast

The acetaldehyde consumption profiles in the stationary phase were visualized for the two yeast strains used at all the different fermentation temperatures (Figure 9). The same phenomena were observed for both strains. The yeast acetaldehyde catabolism (i.e., the rate of consumption) was higher at the isothermal temperature of 30 °C (Figure 9A,D). For the anisothermal profiles starting at 24 °C (Figure 9B,E), the rate of consumption increased simultaneously with the temperature increase (24–30 °C), whereas, when the temperature was decreased, the rate of consumption was lower. For the 18–30 °C rising temperature profile (Figure 9C,F), the consumption rate was stimulated and plateaus of consumption were maintained at 0.35 mg/L/h and 0.5 mg/L/h for the FC9® and SM102® strains, respectively, in contrast to the isothermal fermentation at 18 °C, for which this rate only decreased. After 70% of the fermentation process with the FC9® strain, yeast consumption was more than three times lower at 18 °C compared to that observed with the 18–30 °C temperature profile.
On the other hand, for the 30–18 °C descending profile, the consumption rate was not slowed down by the decrease in temperature compared to the isothermal profile at 30 °C. Indeed, the amplitude of the temperature difference was important, as it was for the phenomenon of losses, but since half of the fermentation occurred at a temperature higher than 25 °C, yeast metabolic activity remained optimal; this also promoted efficient consumption during half of the fermentation, amounting to between 8 and 1 mg/L/h for the FC9® strain and between 6 and 1 mg/L/h for SM102®. After the accumulation of extracellular acetaldehyde, at the beginning of the stationary phase, the rate of consumption was maximal (Figure 9 and Table 2) and related to temperature: 0.68, 0.72 and 0.99 mg/L/h for FC9®, SM102® and 7013®, respectively, at 18 °C compared to 7.6, 5.38 and 5.64 mg/L/h at 30 °C. Therefore, there was no inhibitory effect from temperature on ADH activity, as previously reported [55]. Thus, high temperatures enabled the promotion of cellular activity with a better catabolism and, even when the fermentation rate was higher, the time necessary to assimilate acetaldehyde was not a limiting factor in obtaining low residual acetaldehyde content, in contrast to the hypothesis posed by [10]. However, acetaldehyde assimilation is lowered by temperature decreases, which entails higher residual contents [7].
Furthermore, at high temperatures, although the yeast accumulated more acetaldehyde, the addition of physical evaporation and biological consumption phenomena led to the lowest residual acetaldehyde levels. While it was the strain that produced the most acetaldehyde at the end of the growth phase, 7013® was the least efficient in catabolizing acetaldehyde (Table 2). The strain effect on acetaldehyde synthesis has been described as a “strain-dependent” trait [9], but so is the strain’s ability to consume this metabolite in the medium. These two capacities are, moreover, not correlated: a strain that produces high amounts of acetaldehyde does not necessarily have the highest consuming capacity.
It was thus possible to compare the physical effect of evaporation and the biological effect of consumption. Maximum rates of cumulative losses (Figure 7C,D) varied between 0.2 and 2.1 mg/L/h depending on the temperature, while the maximum rates of consumption remained between 0.7 and 7.6 mg/L/h depending on the temperature and the strain used. Thus, the biological phenomenon of acetaldehyde consumption by yeast contributes more significantly to the atypical kinetics of this aroma in the stationary phase than the losses caused by the evaporation of the molecule during the process. Despite being weaker than the biological effect, the physical effect nevertheless had a significant impact. Indeed, in the present work, it was clearly demonstrated that the lowest residual acetaldehyde contents were obtained at high temperatures in combination with both high yeast consumption and high evaporation.

4. Conclusions

The primary objective of this study was to describe and analyze the evolution of acetaldehyde concentration during alcoholic fermentation and to shed light on the impact of temperature, the main parameter that manages both fermentation and acetaldehyde synthesis, on the dynamics of this molecule. Thanks to new online monitoring approaches that allow complete acetaldehyde production balances to be developed during fermentation—and which also allowed biological consumption to be dissociated from physical evaporation—it was possible to gain a detailed understanding of the different phenomena involved in the kinetics of acetaldehyde production. First of all, from a biological point of view, high fermentation temperatures led to important production of acetaldehyde at the end of the growth phase but also entailed better consumption of this molecule by yeast, which led to a lower residual acetaldehyde content. In addition, physical evaporation was even more important at high temperatures due to the low boiling point of the molecule. On the other hand, thanks to the use of production balances, it was possible to observe that consumption played a larger role in the decrease in acetaldehyde in the stationary phase than the physical effect of evaporation. This was corroborated by the use of anisothermal temperature profiles, allowing us to dissociate the temperature effects from the biological and physical phenomena. The consumption aspect being the most important in the decrease in the acetaldehyde concentration, metabolic links could be revealed between acetaldehyde and markers of metabolism, such as organic acids. Hypotheses were put forward regarding the involvement of acetaldehyde consumption and the maintenance of the cellular redox balance, but they have yet to be validated.
Finally, from the practical point of view of the oenological industry, it was clearly established that the use of an anisothermal profile with a downward slope, such as 30–18 °C, resulted in permanent consumption of acetaldehyde; however, the aromatic aspect remains to be studied and optimized with such a temperature process. Future work will demonstrate the value of anisothermal temperature profiles for the synthesis of higher alcohols, acetate esters and ethyl esters using the same experimental strategy. In addition, the aromatic content of the lees of the corresponding wines will also be studied to report on whether the impact of temperature is similar for the compounds retained inside the cell. However, it can be noted that such a temperature slope is not favorable in terms of technological aspects, resulting in longer fermentation duration and high expenses for frigories.

Author Contributions

Conceptualization, X.P., J.-R.M. and V.F.; methodology, C.G., F.M., C.P. and M.P.; formal analysis, C.G., M.P. and A.B.; investigation, C.G., A.B. and V.F.; writing—original draft preparation, C.G., A.B. and V.F.; writing—review and editing, C.G., X.P., J.-R.M., J.-M.S. and V.F. All authors have read and agreed to the published version of the manuscript.

Funding

This research received no funding.

Institutional Review Board Statement

Not applicable.

Informed Consent Statement

Not applicable.

Data Availability Statement

The datasets generated and/or analyzed during the current study are available from the corresponding author upon reasonable request.

Acknowledgments

The authors would like to thank the Chemosens Plateform (CSGA, INRAE Dijon) for the analysis of lipids, Thérèse Marlin and Martine Pradal for the analysis of amino acids (ADEL Team, UMR SPO, INRAE Montpellier) and Mélanie Veyret (UE Pech Rouge, INRAE) for her help with acetaldehyde assays.

Conflicts of Interest

The authors declare no conflict of interest.

References

  1. Liu, S.-Q.; Pilone, G.J. An Overview of Formation and Roles of Acetaldehyde in Winemaking with Emphasis on Microbiological Implications. Int. J. Food Sci. Technol. 2000, 35, 49–61. [Google Scholar] [CrossRef]
  2. Ochando, T.; Mouret, J.-R.; Humbert-Goffard, A.; Aguera, E.; Sablayrolles, J.-M.; Farines, V. Comprehensive Study of the Dynamic Interaction between SO2 and Acetaldehyde during Alcoholic Fermentation. Food Res. Int. 2020, 136, 109607. [Google Scholar] [CrossRef] [PubMed]
  3. Sohrabvandi, S.; Mousavi, S.M.; Razavi, S.H.; Mortazavian, A.M.; Rezaei, K. Alcohol-Free Beer: Methods of Production, Sensorial Defects, and Healthful Effects. Food Rev. Int. 2010, 26, 335–352. [Google Scholar] [CrossRef]
  4. Buttery, R.G.; Ling, L.; Guadagni, D.G. Food Volatiles. Volatilities of Aldehydes, Ketones, and Esters in Dilute Water Solution. J. Agric. Food Chem. 1969, 17, 385–389. [Google Scholar] [CrossRef]
  5. Xu, X.; Wang, J.; Bao, M.; Niu, C.; Liu, C.; Zheng, F.; Li, Y.; Li, Q. Reverse Metabolic Engineering in Lager Yeast: Impact of the NADH/NAD+ Ratio on Acetaldehyde Production during the Brewing Process. Appl. Microbiol. Biotechnol. 2019, 103, 869–880. [Google Scholar] [CrossRef]
  6. Cheraiti, N.; Guezenec, S.; Salmon, J.-M. Very Early Acetaldehyde Production by Industrial Saccharomyces Cerevisiae Strains: A New Intrinsic Character. Appl. Microbiol. Biotechnol. 2010, 86, 693–700. [Google Scholar] [CrossRef] [PubMed]
  7. Aguera, E.; Sire, Y.; Mouret, J.-R.; Sablayrolles, J.-M.; Farines, V. Comprehensive Study of the Evolution of the Gas–Liquid Partitioning of Acetaldehyde during Wine Alcoholic Fermentation. J. Agric. Food Chem. 2018, 66, 6170–6178. [Google Scholar] [CrossRef]
  8. Jackowetz, J.N.; Dierschke, S.; Mira de Orduña, R. Multifactorial Analysis of Acetaldehyde Kinetics during Alcoholic Fermentation by Saccharomyces Cerevisiae. Food Res. Int. 2011, 44, 310–316. [Google Scholar] [CrossRef]
  9. Li, E.; Mira de Orduña Heidinger, R. Acetaldehyde Metabolism in Industrial Strains of Saccharomyces Cerevisiae Inhibited by SO2 and Cooling during Alcoholic Fermentation. OENO One 2020, 54, 351–358. [Google Scholar] [CrossRef]
  10. Li, E.; Mira de Orduña, R. Evaluation of the Acetaldehyde Production and Degradation Potential of 26 Enological Saccharomyces and Non-Saccharomyces Yeast Strains in a Resting Cell Model System. J. Ind. Microbiol. Biotechnol. 2011, 38, 1391–1398. [Google Scholar] [CrossRef] [Green Version]
  11. Gao, Y.-T.; Zhang, Y.-S.; Wen, X.; Song, X.-W.; Meng, D.; Li, B.-J.; Wang, M.-Y.; Tao, Y.-Q.; Zhao, H.; Guan, W.-Q.; et al. The Glycerol and Ethanol Production Kinetics in Low-Temperature Wine Fermentation Using Saccharomyces Cerevisiae Yeast Strains. Int. J. Food Sci. Technol. 2019, 54, 102–110. [Google Scholar] [CrossRef] [Green Version]
  12. Ribéreau-Gayon, P.; Dubourdieu, D.; Donèche, B.; Lonvaud, A. Traité D’oenologie, Tome 1: Microbiologie Du Vin, Vinifications; Dunod: Malakoff, France, 1998. [Google Scholar]
  13. Henschke, P.A.; Jiranek, V. Yeast-Metabolism of Nitrogen Compounds; Taylor & Francis Group: New York, NY, USA, 1993. [Google Scholar]
  14. Boulton, R.B.; Singleton, V.L.; Bisson, L.F.; Kunkee, R.E. Principles and Practices of Winemaking; Springer: Boston, MA, USA, 1996; ISBN 978-1-4613-5718-6. [Google Scholar]
  15. Mouret, J.-R.; Aguera, E.; Perez, M.; Farines, V.; Sablayrolles, J.-M. Study of Oenological Fermentation: Which Strategy and Which Tools? Fermentation 2021, 7, 155. [Google Scholar] [CrossRef]
  16. Amerine, M.; Ough, C. Studies with Controlled Fermentation. VIII. Factors Affecting Aldehyde Accumulation. Am. J. Enol. Vitic. 1964, 15, 23–33. [Google Scholar]
  17. Bosso, A.; Guaita, M. Study of Some Factors Involved in Ethanal Production during Alcoholic Fermentation. Eur. Food Res. Technol. 2008, 227, 911–917. [Google Scholar] [CrossRef]
  18. Li, E.; Mira de Orduña, R. Acetaldehyde Kinetics of Enological Yeast during Alcoholic Fermentation in Grape Must. J. Ind. Microbiol. Biotechnol. 2017, 44, 229–236. [Google Scholar] [CrossRef]
  19. Romano, P.; Suzzi, G.; Turbanti, L.; Polsinelli, M. Acetaldehyde Production in Saccharomyces Cerevisiae Wine Yeasts. FEMS Microbiol. Lett. 1994, 118, 213–218. [Google Scholar] [CrossRef] [PubMed]
  20. Torija, M. Effects of Fermentation Temperature on the Strain Population of Saccharomyces Cerevisiae. Int. J. Food Microbiol. 2003, 80, 47–53. [Google Scholar] [CrossRef]
  21. Colombié, S.; Malherbe, S.; Sablayrolles, J.-M. Modeling of Heat Transfer in Tanks during Wine-Making Fermentation. Food Control 2007, 18, 953–960. [Google Scholar] [CrossRef]
  22. Casalta, E.; Salmon, J.-M.; Picou, C.; Sablayrolles, J.-M. Grape Solids: Lipid Composition and Role during Alcoholic Fermentation under Enological Conditions. Am. J. Enol Vitic. 2019, 70, 147–154. [Google Scholar] [CrossRef]
  23. Crépin, L.; Nidelet, T.; Sanchez, I.; Dequin, S.; Camarasa, C. Sequential Use of Nitrogen Compounds by Saccharomyces Cerevisiae during Wine Fermentation: A Model Based on Kinetic and Regulation Characteristics of Nitrogen Permeases. Appl. Environ. Microbiol. 2012, 78, 8102–8111. [Google Scholar] [CrossRef] [Green Version]
  24. Sablayrolles, J.M. Control of Alcoholic Fermentation in Winemaking: Current Situation and Prospect. Food Res. Int. 2009, 42, 418–424. [Google Scholar] [CrossRef]
  25. Sablayrolles, J.M.; Ball, C.B. Fermentation Kinetics and the Production of Volatiles During Alcoholic Fermentation. J. Am. Soc. Brew. Chem. 1995, 53, 72–78. [Google Scholar] [CrossRef]
  26. Sablayrolles, J.-M.; Barre, P. Kinetics of Alcoholic Fermentation Under Anisothermal Enological Conditions. I. Influence of Temperature Evolution on the Instantaneous Rate of Fermentation. Am. J. Enol. Vitic. 1993, 44, 127–133. [Google Scholar] [CrossRef]
  27. Remize, F.; Roustan, J.L.; Sablayrolles, J.M.; Barre, P.; Dequin, S. Glycerol Overproduction by Engineered Saccharomyces Cerevisiae Wine Yeast Strains Leads to Substantial Changes in By-Product Formation and to a Stimulation of Fermentation Rate in Stationary Phase. Appl. Environ. Microbiol. 1999, 65, 143–149. [Google Scholar] [CrossRef] [PubMed] [Green Version]
  28. Van Dijken, J.P.; Scheffers, W.A. Redox Balances in the Metabolism of Sugars by Yeasts. FEMS Microbiol Rev. 1986, 1, 199–224. [Google Scholar] [CrossRef] [Green Version]
  29. Roustan, J.L.; Sablayrolles, J.-M. Modification of the Acetaldehyde Concentration during Alcoholic Fermentation and Effects on Fermentation Kinetics. J. Biosci. Bioeng. 2002, 93, 367–375. [Google Scholar] [CrossRef] [PubMed]
  30. Deroite, A.; Legras, J.-L.; Rigou, P.; Ortiz-Julien, A.; Dequin, S. Lipids Modulate Acetic Acid and Thiol Final Concentrations in Wine during Fermentation by Saccharomyces Cerevisiae × Saccharomyces Kudriavzevii Hybrids. AMB Expr. 2018, 8, 130. [Google Scholar] [CrossRef] [PubMed] [Green Version]
  31. Guittin, C.; Maçna, F.; Sanchez, I.; Barreau, A.; Poitou, X.; Sablayrolles, J.-M.; Mouret, J.-R.; Farines, V. The Impact of Must Nutrients and Yeast Strain on the Aromatic Quality of Wines for Cognac Distillation. Fermentation 2022, 8, 51. [Google Scholar] [CrossRef]
  32. Guittin, C.; Maçna, F.; Sanchez, I.; Poitou, X.; Sablayrolles, J.-M.; Mouret, J.-R.; Farines, V. Impact of High Lipid Contents on the Production of Fermentative Aromas during White Wine Fermentation. Appl. Microbiol. Biotechnol. 2021, 105, 6435–6449. [Google Scholar] [CrossRef] [PubMed]
  33. Scanes, K.T.; Hohrnann, S.; Prior, B.A. Glycerol Production by the Yeast Saccharomyces Cerevisiae and Its Relevance to Wine: A Review. SAJEV 2017, 19, 17–24. [Google Scholar] [CrossRef] [Green Version]
  34. Gancedo, J.M. The Early Steps of Glucose Signalling in Yeast. FEMS Microbiol. Rev. 2008, 32, 673–704. [Google Scholar] [CrossRef] [PubMed] [Green Version]
  35. Gombert, A.K.; dos Santos, M.M.; Christensen, B.; Nielsen, J. Network Identification and Flux Quantification in the Central Metabolism of Saccharomyces Cerevisiae under Different Conditions of Glucose Repression. J. Bacteriol. 2001, 183, 1441–1451. [Google Scholar] [CrossRef] [Green Version]
  36. Bely, M.; Sablayrolles, J.M.; Barre, P. Automatic Detection of Assimilable Nitrogen Deficiencies during Alcoholic Fermentation in Oenological Conditions. J. Ferment. Bioeng. 1990, 70, 246–252. [Google Scholar] [CrossRef]
  37. Malherbe, S.; Fromion, V.; Hilgert, N.; Sablayrolles, J.-M. Modeling the Effects of Assimilable Nitrogen and Temperature on Fermentation Kinetics in Enological Conditions. Biotechnol. Bioeng. 2004, 86, 261–272. [Google Scholar] [CrossRef]
  38. Rollero, S.; Bloem, A.; Camarasa, C.; Sanchez, I.; Ortiz-Julien, A.; Sablayrolles, J.-M.; Dequin, S.; Mouret, J.-R. Combined Effects of Nutrients and Temperature on the Production of Fermentative Aromas by Saccharomyces Cerevisiae during Wine Fermentation. Appl. Microbiol. Biotechnol. 2015, 99, 2291–2304. [Google Scholar] [CrossRef]
  39. Godillot, J.; Sanchez, I.; Perez, M.; Picou, C.; Galeote, V.; Sablayrolles, J.-M.; Farines, V.; Mouret, J.-R. The Timing of Nitrogen Addition Impacts Yeast Genes Expression and the Production of Aroma Compounds During Wine Fermentation. Front. Microbiol. 2022, 13, 829786. [Google Scholar] [CrossRef] [PubMed]
  40. Ljungdahl, P.O.; Daignan-Fornier, B. Regulation of Amino Acid, Nucleotide, and Phosphate Metabolism in Saccharomyces Cerevisiae. Genetics 2012, 190, 885–929. [Google Scholar] [CrossRef] [PubMed] [Green Version]
  41. Whiting, G.C. Organic acid metabolism of yeasts during fermentation of alcoholic beverages-a review. J. Inst. Brew. 1976, 82, 84–92. [Google Scholar] [CrossRef]
  42. Thoukis, G.; Ueda, M.; Wright, D. The Formation of Succinic Acid during Alcoholic Fermentation. Am. J. Enol. Vitic. 1965, 16, 1–8. [Google Scholar]
  43. Camarasa, C.; Grivet, J.-P.; Dequin, S. Investigation by 13C-NMR and Tricarboxylic Acid (TCA) Deletion Mutant Analysis of Pathways for Succinate Formation in Saccharomyces Cerevisiae during Anaerobic Fermentation. Microbiology 2003, 149, 2669–2678. [Google Scholar] [CrossRef] [PubMed] [Green Version]
  44. Pronk, J.T. Pyruvate Metabolism in Saccharomyces Cerevisiae. Yeast 1996, 12, 1607–1633. [Google Scholar] [CrossRef]
  45. Saint-Prix, F.; Bönquist, L.; Dequin, S. Functional Analysis of the ALD Gene Family of Saccharomyces Cerevisiae during Anaerobic Growth on Glucose: The NADP+-Dependent Ald6p and Ald5p Isoforms Play a Major Role in Acetate Formation. Microbiology 2004, 150, 2209–2220. [Google Scholar] [CrossRef]
  46. Beltran, G.; Novo, M.; Guillamón, J.M.; Mas, A.; Rozès, N. Effect of Fermentation Temperature and Culture Media on the Yeast Lipid Composition and Wine Volatile Compounds. Int. J. Food Microbiol. 2008, 121, 169–177. [Google Scholar] [CrossRef] [PubMed]
  47. Llaurado, J.; Rozes, N.; Bobet, R.; Mas, A.; Constanti, M. Low Temperature Alcoholic Fermentations in High Sugar Concentration Grape Musts. J. Food Sci. 2002, 67, 268–273. [Google Scholar] [CrossRef]
  48. Neuberg, C.; Hirsch, J. Uber Den Verlauf Der Alkoholischen Garung Bei Alkalischer Reaktion: II. Garung Mit Lebender Hefe in Alkalischen Lösungen. Biochem. Z 1919, 96, 175–202. [Google Scholar]
  49. Salmon, J.M. Effect of Sugar Transport Inactivation in Saccharomyces Cerevisiae on Sluggish and Stuck Enological Fermentations. Appl. Environ. Microbiol. 1989, 55, 953–958. [Google Scholar] [CrossRef] [Green Version]
  50. Salmon, J.M.; Vincent, O.; Mauricio, J.C.; Bely, M.; Barre, P. Sugar Transport Inhibition and Apparent Loss of Activity in Saccharomyces Cerevisiae as a Major Limiting Factor of Enological Fermentations. Am. J. Enol. Vitic. 1993, 44, 56–64. [Google Scholar] [CrossRef]
  51. Roustan, J.L.; Sablayrolles, J.M. Impact of the Addition of Electron Acceptors on the By-Products of Alcoholic Fermentation. Enzym. Microb. Technol. 2002, 31, 142–152. [Google Scholar] [CrossRef]
  52. Bakker, B.M.; Bro, C.; Kötter, P.; Luttik, M.A.H.; van Dijken, J.P.; Pronk, J.T. The Mitochondrial Alcohol Dehydrogenase Adh3p Is Involved in a Redox Shuttle in Saccharomyces Cerevisiae. J. Bacteriol. 2000, 182, 4730–4737. [Google Scholar] [CrossRef] [Green Version]
  53. Ciriacy, M. Genetics of Alcohol Dehydrogenase InSaccharomyces Cerevisiac. Molec. Gen. Genet. 1975, 138, 157–164. [Google Scholar] [CrossRef] [PubMed]
  54. Xu, X.; Niu, C.; Liu, C.; Li, Q. Unraveling the Mechanisms for Low-Level Acetaldehyde Production during Alcoholic Fermentation in Saccharomyces Pastorianus Lager Yeast. J. Agric. Food Chem. 2019, 67, 2020–2027. [Google Scholar] [CrossRef] [PubMed]
  55. Lutstorf, U.; Megnet, R. Multiple Forms of Alcohol Dehydrogenase in S. Cerevisiae. I. Physiological Control of ADH-2 and Properties of ADH-2 and ADH-4. Arch. Biochem. Biophys. 1968, 126, 933–944. [Google Scholar] [CrossRef] [PubMed]
Figure 1. Schematic overview of the experimental design: acetaldehyde production balance during alcoholic fermentation.
Fermentation 09 00299 g001
Figure 2. Fermentation kinetics analyzed at (A) 18 °C (light green) and 18–30 °C (dark green), (B) 30 °C (dark red) and 30–18 °C (light red) and (C) 24 °C (orange), 24–18 °C (light orange) and 24–30 °C (dark orange) with anisothermal temperature profiles (gray and black).
Fermentation 09 00299 g002
Figure 3. Production kinetics for organic acids at 18 °C (A), 24 °C (B) and 30 °C (C): glycerol (orange), succinate (brown), α-ketoglutarate (yellow) and acetic acid (green). ❶ growth phase and ❷ stationary phase.
Fermentation 09 00299 g003
Figure 4. Correlation between the production of glycerol (A,D,G) and the organic acids succinate (B,E,H) and α-ketoglutarate (C,F,I), with acetaldehyde synthesis for the three isothermal temperatures (18, 24 and 30 °C) for strains FC9® (orange), SM102® (purple) and 7013® (green).
Fermentation 09 00299 g004
Figure 5. Hypotheses regarding the biological phenomenon of acetaldehyde reconsumption (A) through the decreased activity of hexose transporters and (B) through the principle of the acetaldehyde–ethanol Adh3p (Ac-Et) shuttle and the importance of the amount of NADH for yeast metabolism.
Fermentation 09 00299 g005
Figure 6. Residual acetaldehyde concentration at the end of alcoholic fermentation for isothermal (A) and anisothermal (B) temperature profiles with the three yeast strains: FC9® (orange), SM102® (purple) and 7013® (green). The letters (a, b, c) indicate homogeneous groups for acetaldehyde contration at the 95% confidence level, as tested by Tukey’s statistical test.
Fermentation 09 00299 g006
Figure 7. The value of online monitoring, making it possible to produce and visualize complete production balances for the two strains FC9® (A,C,E,G) and SM102® (B,D,F,H) at 18 °C (A,B), 30 °C (C,D), 18–30 °C (E,F) and 30–18 °C (G,H). Assessments carried out during the stationary phase: the decrease in the acetaldehyde concentration was demonstrated by the rate of decrease in the liquid phase (mg/L/h), the rate of physical losses (mg/L/h) and the rate of consumption (mg/L/h).
Fermentation 09 00299 g007
Figure 8. Monitoring of acetaldehyde in the gas phase that provides access to (A, B) cumulative losses (mg/L) and (C,D) loss rates (mg/L/h) for all temperature profiles with the example of a fermentative kinetics (grey) for both strains: (A,C) FC9® and (B,D) SM102®.
Fermentation 09 00299 g008
Figure 9. Acetaldehyde consumption rates (mg/L/h) for strains FC9® (AC) and SM102® (DF) with isothermal temperature profiles (A,D):18 °C (green), 24 °C (orange) and 30 °C (red)and anisothermal temperature profiles (B,C,E,F):24–18 °C (light orange), 24–30 °C (dark orange), 18–30 °C (dark green) and 30–18 °C (dark red).
Fermentation 09 00299 g009
Table 1. Concentration of acetaldehyde accumulated in the extracellular medium at the end of the growth phase. ANOVA statistical analysis: effect of temperature and strain.
Acetaldehyde Concentration (mg/L)
FC9®SM102®7013®
Isothermal temperature profiles18 °C27.3 ± 0.732.0 ± 0.131.0 ± 0.7
24 °C30.9 ± 0.239.1 ± 0.537.2 ± 7.7
30 °C35.8 ± 0.840.0 ± 1.453.5 ± 1.2
Anisothermal temperature profiles18–30 °C28.2 ± 0.537.9 ± 1.0
30–18 °C36.7 ± 0.640.3 ± 0.3
24–18 °C29.1 ± 2.639.5 ± 2.1
24–30 °C30.1 ± 0.539.4 ± 1.0
Temperature effect ANOVA
(p-value)
*******
Strain effect ANOVA
(p-value)
***
(***): ANCOVA p < 0.001, (*): ANCOVA p < 0.05.
Table 2. Maximum acetaldehyde consumption rate at the beginning of the stationary phase. ANOVA statistical analysis: effects of temperature and strain.
Vmax of Consumption (mg/L·h−1)
FC9®SM102®7013®
Isothermal temperature profiles18 °C0.68 ± 0.040.78 ± 0.010.99 ± 0.04
24 °C2.14 ± 0.092.00 ± 0.092.09 ± 0.06
30 °C7.60 ± 0.355.38 ± 0.325.64 ± 0.07
Anisothermal temperature profiles18–30 °C0.79 ± 0.110.54 ± 0.005
30–18 °C7.58 ± 0.495.36 ± 0.45
24–18 °C1.94 ± 0.052.90 ± 0.37
24–30 °C1.42 ± 0.051.63 ± 0.03
Temperature effect ANOVA
(p-value)
*********
Strain effect ANOVA
(p-value)
**
(***): ANCOVA p < 0.001, (**): ANCOVA p < 0.01.
Disclaimer/Publisher’s Note: The statements, opinions and data contained in all publications are solely those of the individual author(s) and contributor(s) and not of MDPI and/or the editor(s). MDPI and/or the editor(s) disclaim responsibility for any injury to people or property resulting from any ideas, methods, instructions or products referred to in the content.

