Article

Valorization of Delonix regia Pods for Bioethanol Production

1
Central Laboratories, King Faisal University, Al-Ahsa P.O. Box 31982, Saudi Arabia
2
Department of Biochemistry and Biotechnology, University of Gujrat, Gujrat 50700, Pakistan
3
Date Palm Research Center of Excellence, King Faisal University, Al-Ahsa P.O. Box 31982, Saudi Arabia
*
Author to whom correspondence should be addressed.
Fermentation 2023, 9(3), 289; https://doi.org/10.3390/fermentation9030289
Submission received: 16 February 2023 / Revised: 12 March 2023 / Accepted: 14 March 2023 / Published: 16 March 2023
(This article belongs to the Special Issue Lignocellulosic Biomass to Value-Added Products)

Abstract

:
Delonix regia (common name: Flame tree) pods, an inexpensive lignocellulosic waste matrix, were successfully used to produce value-added bioethanol. Initially, the potentiality of D. regia pods as a lignocellulosic biomass was assessed by Fourier-transform infrared spectroscopy (FTIR), which revealed the presence of several functional groups belonging to cellulose, hemicellulose, and lignin, implying that D. regia pods could serve as an excellent lignocellulosic biomass. Response Surface Methodology (RSM) and Central Composite Design (CCD) were used to optimize pretreatment conditions of incubation time (10–70 min), H2SO4 concentration (0.5–3%), amount of substrate (0.02–0.22 g), and temperature (45–100 °C). Then, RSM-suggested 30 trials of pretreatment conditions experimented in the laboratory, and a trial using 0.16 g substrate, 3% H2SO4, 70 min incubation at 90 °C, yielded the highest amount of glucose (0.296 mg·mL−1), and xylose (0.477 mg·mL−1). Subsequently, the same trial conditions were chosen in the downstream process, and pretreated D. regia pods were subjected to enzymatic hydrolysis with 5 mL of indigenously produced cellulase enzyme (74 filter per unit [FPU]) at 50 °C for 72 h to augment the yield of fermentable sugars, yielding up to 55.57 mg·mL−1 of glucose. Finally, the released sugars were fermented to ethanol by Saccharomyces cerevisiae, yielding a maximum of 7.771% ethanol after 72 h of incubation at 30 °C. Conclusively, this study entails the successful valorization of D. regia pods for bioethanol production.

1. Introduction

The upsurge in global population and the development of human society have not only exacerbated food and energy demands but also resulted in environmental issues and global warming. In order to meet the everyday increasing food requirements of the growing population, agricultural practices are being intensified to produce more food, resulting in the production of agro-cellulosic biomass, which is becoming a burgeoning problem due to inefficient and inconsistent disposal and poor management practices [1]. The global biomass waste generation is expected to be around 140 gigatonnes per annum, with negative environmental repercussions. Most biomass wastes are left to decompose in the field or burnt, causing substantial environmental pollution [2]. The world population has become overly reliant on fossil fuels and their derivatives to meet energy demands. The extensive use of fossil fuels and their products results in the emission of greenhouse gases such as methane, carbon, and nitrogen oxides [3] and has severely shaken the global climate. Notably, all these cues, food sustainability, human activities/population, and environment, are so intermingled that the escalation of one exacerbates the severity of the other, and this cycle continues indefinitely and thereby affects food security indirectly. It is signposted that by the middle of this century, at least a 40% reduction in greenhouse gas emissions is required to maintain the average increase by 1.5 °C [4]. Additionally, fossil fuels are on the verge of depletion. This scenario led to the finding of eco-friendly, cost-effective, sustainable, and renewable sources of energy. Biofuels ranked top in these attributes, strictly fulfilling the aforementioned criterion, and have emerged as an appealing choice to meet global fuel requirements [5]. The most significant advantages of biofuel production are renewability, production of fewer toxins, and emission of less carbon. Furthermore, the bioconversion of lignocellulosic biomass into bioethanol is a sustainable approach with unrivaled advantages for substituting gasoline [6].
First-generation biofuels are produced from edible feedstocks such as potato, wheat, sugarcane, rice, and barley. The direct competition with food crops renders them unfit for biofuel production [7]. In second-generation biofuels, woody biomass and forest residues were used to cope with the problems associated with first-generation biofuels, but there are still limitations that exist [8]. In third-generation biofuels, seaweed (macroalgae) was used as it does not require a large and arable area and has a high growth rate [9]. However, some limitations exist, such as the highly volatile nature of microalgae-derived biofuel [10]. Despite different constraints, biofuels derived from lignocellulosic materials (second generation) remained the widely produced biofuels and have a considerable potential to substitute non-renewable gasoline.
It is expected that global industrial demand for ethanol will surge to reach 135.5 billion liters/annum by 2050 [11]. To meet such high demands, second-generation bioethanol production from lignocellulose, a more sustainable and greener biomass, is a promising choice. Saccharomyces cerevisiae (S. cerevisiae) is primarily recognized yeast for fermentation due to its high tolerance limits and high ethanol yields [12,13,14]. It is commercially utilized in the industrial-scale production of bioethanol [15]. S. cerevisiae can ferment the different kinds of hexose sugars only but not the pentose sugars [16].
Lignocelluloses are the most abundant biomass on the earth’s crust, but the commercial production of bioethanol from them is harrowing due to their unique compositional factor and physicochemical structure. Cellulose is the main structural polysaccharide in plant cell walls, accounting for 30% to 50% of the dry weight of lignocellulosic biomass. Hemicelluloses are the second most abundant polysaccharide, accounting for 15–30% of the dry mass of lignocellulosic plants. Lignin, which accounts for 15–30% of the dry mass of lignocellulosic biomass, is the third most important component [17]. The presence of lignin sheaths and their unique chemical composition impede the hydrolysis of long-chain and highly packed polysaccharides into fermentable sugars. In order to circumvent this problem, pre-treatment is a prerequisite to release fermentable sugars, but this enhances the overall cost of the process and poses a barrier to large-scale bioethanol production [18]. To deal with the cost problem, a plethora of pre-treatment techniques, such as ammonia explosion, acid treatment, alkali treatment, biological, enzymatic, and a combination of these, have been developed. Nonetheless, pre-treatment with dilute acid at high temperatures effectively promotes the hydrolysis of lignocellulose [19,20]. Dilute acid substantially converts hemicelluloses into simple sugars, and the hydrolysis of hemicelluloses improves the digestibility of the residual cellulosic contents in the biomass [21]. In most cases of biomass pretreatment, high temperatures favor the hydrolysis and digestibility of cellulose in the presence of an acid. Subsequent to acid hydrolysis, enzymatic hydrolysis can complete the hydrolysis of remaining cellulosic biomass into fermentable sugars. Additionally, the optimization of pre-treatment conditions through Response Surface Methodology (RSM) and Central Composite Design (CCD) was achieved. Four different variables, such as acid concentration, temperature, reaction time, and amount of substrate, were optimized. The RSM employs statistical analysis to generate model equations for optimizing and predicting specific condition behavior. As a result, this can eventually lead to the use of a small number of resources, making any process highly economical.
Delonix regia (D. regia), common name; Flame tree; local name Gulmohar, is a flowering plant belonging to the leguminous family Fabaceae (subfamily Caesalpinioideae). It is grown as an ornamental tree in tropical and sub-tropical regions of the world, and its pods are considered agricultural waste [22]. Its flowers are large, with four spreading scarlets of pale yellow-red petals up to 8 cm in length and a fifth upright petal that is slightly larger and spotted with yellow and white. The size of pods can be up to 60 cm in length and 5 cm in width. Young pods are green and flaccid but turn dark brown and woody on maturation. The seeds are small, weighing an average of 0.4 g (6.2 grains) [23].
The present study aimed to yield the highest concentration of reducing sugars from D. regia pods. The hydrolytic potential of D. regia pods in terms of glucose and xylose yields was demonstrated in this study using acidic and enzymatic pretreatment. The interoperable RSM technique was used to optimize pretreatment conditions. This study entails the successful valorization of D. regia pods for bioethanol through S. cerevisiae.

2. Materials and Methods

2.1. Biomass Collection and Estimation of Moisture Contents

D. regia pods were collected from the vicinity of the University of Gujrat, Pakistan (32°38′26″ N; 74°10′01″ E). The collected samples were washed thoroughly with tap water, dried, ground to a fine powder of uniform particle size, and finally stored at room temperature in a plastic bag for further use.
The oven-dry method was used to calculate the moisture content of D. regia pods. A 1.23 g of D. regia pods were dried in an oven at 90 °C for 72 hours (h) until a further loss in weight was not observed. The weight loss is the moisture content of D. regia pods was calculated as;
Moisture   content   % = Initial   weight     Dry   weight Initial   weight × 100

2.2. Fourier-Transform Infrared Spectroscopy Assay

A Fourier-transform infrared spectrophotometer ([FTIR]; IR Affinity-1, Shimadzu, Kyoto, Japan) was used to determine the structural properties of D. regia pods. The powder sample of D. regia was mixed with spectroscopic grade KBr powder and pelleted into 1 mm size. The scan was taken from 4000–650 cm−1 and had a spectral resolution of 4 cm−1, as described earlier [24].

2.3. Optimization of Variables by RSM and Statistical Analysis

The RSM was employed to optimize the variables for the pretreatment of D. regia pods to yield the maximum reducing sugars using CCD. The selected variable attributes were temperature (45–100 °C), incubation time (10–70 min [min]), amount of substrate (0.02–0.22 g), and acid concentration (H2SO4, 0.5–3%). The response was validated by generating 3D response surface plots with two parameters set simultaneously and observing the interactions of variables on glucose and xylose yield as well as lignin degradation. The response of different variables was explained in the quadratic regression model [25]. The relationship between the optimum values of each attribute was then determined at the p-value of 0.05. The F-test and t-test were applied to determine the statistical significance. MINITAB 17 software was used to compute analysis of variance (ANOVA) and equation coefficients [26].

2.4. Acid Hydrolysis

The powdered D. regia pods (0.02–0.22 g) were initially acid hydrolyzed by soaking them in RSM-optimized conditions of dilute H2SO4 (0.5–3% w/v) at different temperatures (45–100 °C) in a static incubator for 10–70 min. A total of 30 independent trials were conducted. After acid hydrolysis, the samples were filtered, washed with distilled water, and dried in an incubator at 40 °C. The filtrate was used to assess the released reducing sugars (glucose and xylose) and soluble and insoluble lignin (Section 2.5 and Section 2.6).

2.5. Estimation of Reducing Sugars

In order to estimate the glucose and xylose after acid hydrolysis, the filtrate samples were centrifuged at 4000 rpm for 20 min. The supernatant was discarded, and precipitates were used. The dinitro salicylic acid (DNS) reagent was used to estimate the glucose concentration, and the phloroglucinol method was used to estimate the xylose concentration [27].
For glucose estimation, 100 µL of pretreated biomass filtrate was taken into a test tube, then 1000 µL of DNS reagent was added before boiling the mixture for a few min until the color changed from pale yellow to orange. Later, 5 mL of distilled water was added, and absorbance was measured at 540 nm. For xylose determination, 5 µL of the sample was taken from the filtrate and mixed with 5 mL of phloroglucinol reagent. After boiling the mixture for 5 min, 10 mL of distilled water was added to the flask and allowed to cool at room temperature. The absorbance was measured at 554 nm using a spectrophotometer (PG80, UK).

2.6. Determination of Lignin Contents

To determine the lignin contents, all the D. regia samples, pretreated with RSM optimized variables and non-treated (controls), were acid hydrolyzed. A pre-weighed amount (0.016 g) of all pretreated and non-treated D. regia samples were added to a flask containing 0.15 mL of 72% H2SO4 and incubated at 30 °C for 4 h. Then 4.2 mL of distilled water was added to the flask and autoclaved for 2 h. The residues were filtered and washed with distilled water for 10–15 min to neutralize the acid. Subsequently, the residues were oven dried at 105 °C until constant weight and used for insoluble lignin. The filtrate was then used to calculate the soluble lignin by measuring its absorbance at 205 nm. The total soluble lignin percentage was determined using the following formula [28,29].
Total   soluble   lignin   % = Abs + W 1 W 2 × 100
where:
Abs = absorbance of soluble lignin at 205 nm.
W1 = weight of total soluble lignin (in grams)
W2 = weight of biomass (which was 0.016 g)

2.7. Enzymatic Hydrolysis

An indigenous cellulase enzyme produced by Aspergillus tubingensis via pre-optimized solid-state fermentation of corn stover [30] was used to augment the hydrolysis of lignocellulose of acid-hydrolyzed D. regia pods. For enzymatic hydrolysis, an enzyme activity of 74 filter per unit (FPU·mL−1) was determined [31] and added to a flask containing 2 g of the substrate in 100 mL of sodium acetate buffer (pH = 6). 74 FPU·mL−1 of the cellulase enzyme were added in different volumes; 0.5 mL (0.5 U·mL−1), 1 mL (1 U·mL−1), 1.5 mL (1.5 U·mL−1), 3 mL (3 U·mL−1), and 5 mL (5 U·mL−1). Flasks were incubated at 50 °C for different time periods. The samples were taken after 1.5 h, 3 h, 24 h, 48 h, and 72 h, and the glucose was determined through the DNS method [27]. In order to prevent bacterial contamination, ~75 mg of Augmentin was used in each flask. At the same time, the sample with the highest amount of glucose was used for the subsequent fermentation process.

2.8. Media and Inoculum Preparation

For inoculum preparation, S. cerevisiae (Rossmoor Food Products, Karachi, Pakistan) yeast was grown in Yeast Peptone Dextrose (YPD) growth media to carry out fermentation of the biomass. The YPD media were prepared by adding 2 g of casein peptone, 2 g of dextrose, and 1 g of yeast extract in 100 mL of distilled water [32]. Triplicate media samples were prepared in three independent flasks. All the flasks were sealed with cotton plugs and aluminum foil and then autoclaved at 121 °C for 30 min at 15 psi. The prepared inoculum was then used in the subsequent fermentation process.

2.9. Fermentation and Quantification of Ethanol

After enzymatic hydrolysis (Section 2.7), the filtrates of the pretreated samples carrying optimal glucose and pentose concentration were subjected to the fermentation process to yield bioethanol. Then the filtrate was inoculated with 5 g of S. cerevisiae in different inoculum sizes (ranging from 1–5 mL), and fermentation was carried out in triplicates. Subsequently, the flasks of each treatment were incubated in a shaker at 30 °C, 120 rpm for 96 h. Fermented samples were taken under sterile conditions in a laminar airflow cabinet (Heraguard™ ECO Clean Bench, Thermo Fisher Scientific, Waltham, MA, USA) at 24, 36, 48, 72, and 96 h for the quantification of ethanol, as described earlier [25].
For the quantitative analysis of the produced bioethanol, the potassium dichromate method was used [33]. A 250 mL of dichromate solution (0.1 M of Cr2O7−2 in 5M of H2SO4) was prepared by mixing 7.5 g of potassium chromate with 5 M H2SO4. Afterward, 3 mL of dichromate solution was taken in 250 mL beakers, and a falcon cap was placed in the center of beakers containing 300 µL of fermented solutions. The beakers were air sealed with parafilm and incubated for 30 min at room temperature, and the absorbance was measured at 590 nm, as described earlier [34].

3. Results and Discussion

3.1. Estimation of Moisture Contents

The moisture content in D. regia pods was determined as 9.48%, which was substantially higher than the MC% of previous studies, which reported 0.22% and 6.29% in D. regia pods [35,36]. The precise cause of the difference in MC% is far from a conclusion, but it can be attributed to varietal differences, habitat differences, or differences in axillary samples. The MC% of wheat straw was 4.2% [37], while other studies found 8.30% [38], 8.52% [39], and different lignocellulosic biomasses have 10–13% [40]. The moisture content provides a medium for nutrient transport, which is indispensable for the physiological and metabolic activities of microorganisms, resulting in a higher level of lignocellulosic material degradation [41,42]. Therefore, D. regia pods, with their higher moisture content, could serve as an unprecedented utility over other lignocellulosic matrices as excellent biomass for the production of next-generation biofuels.

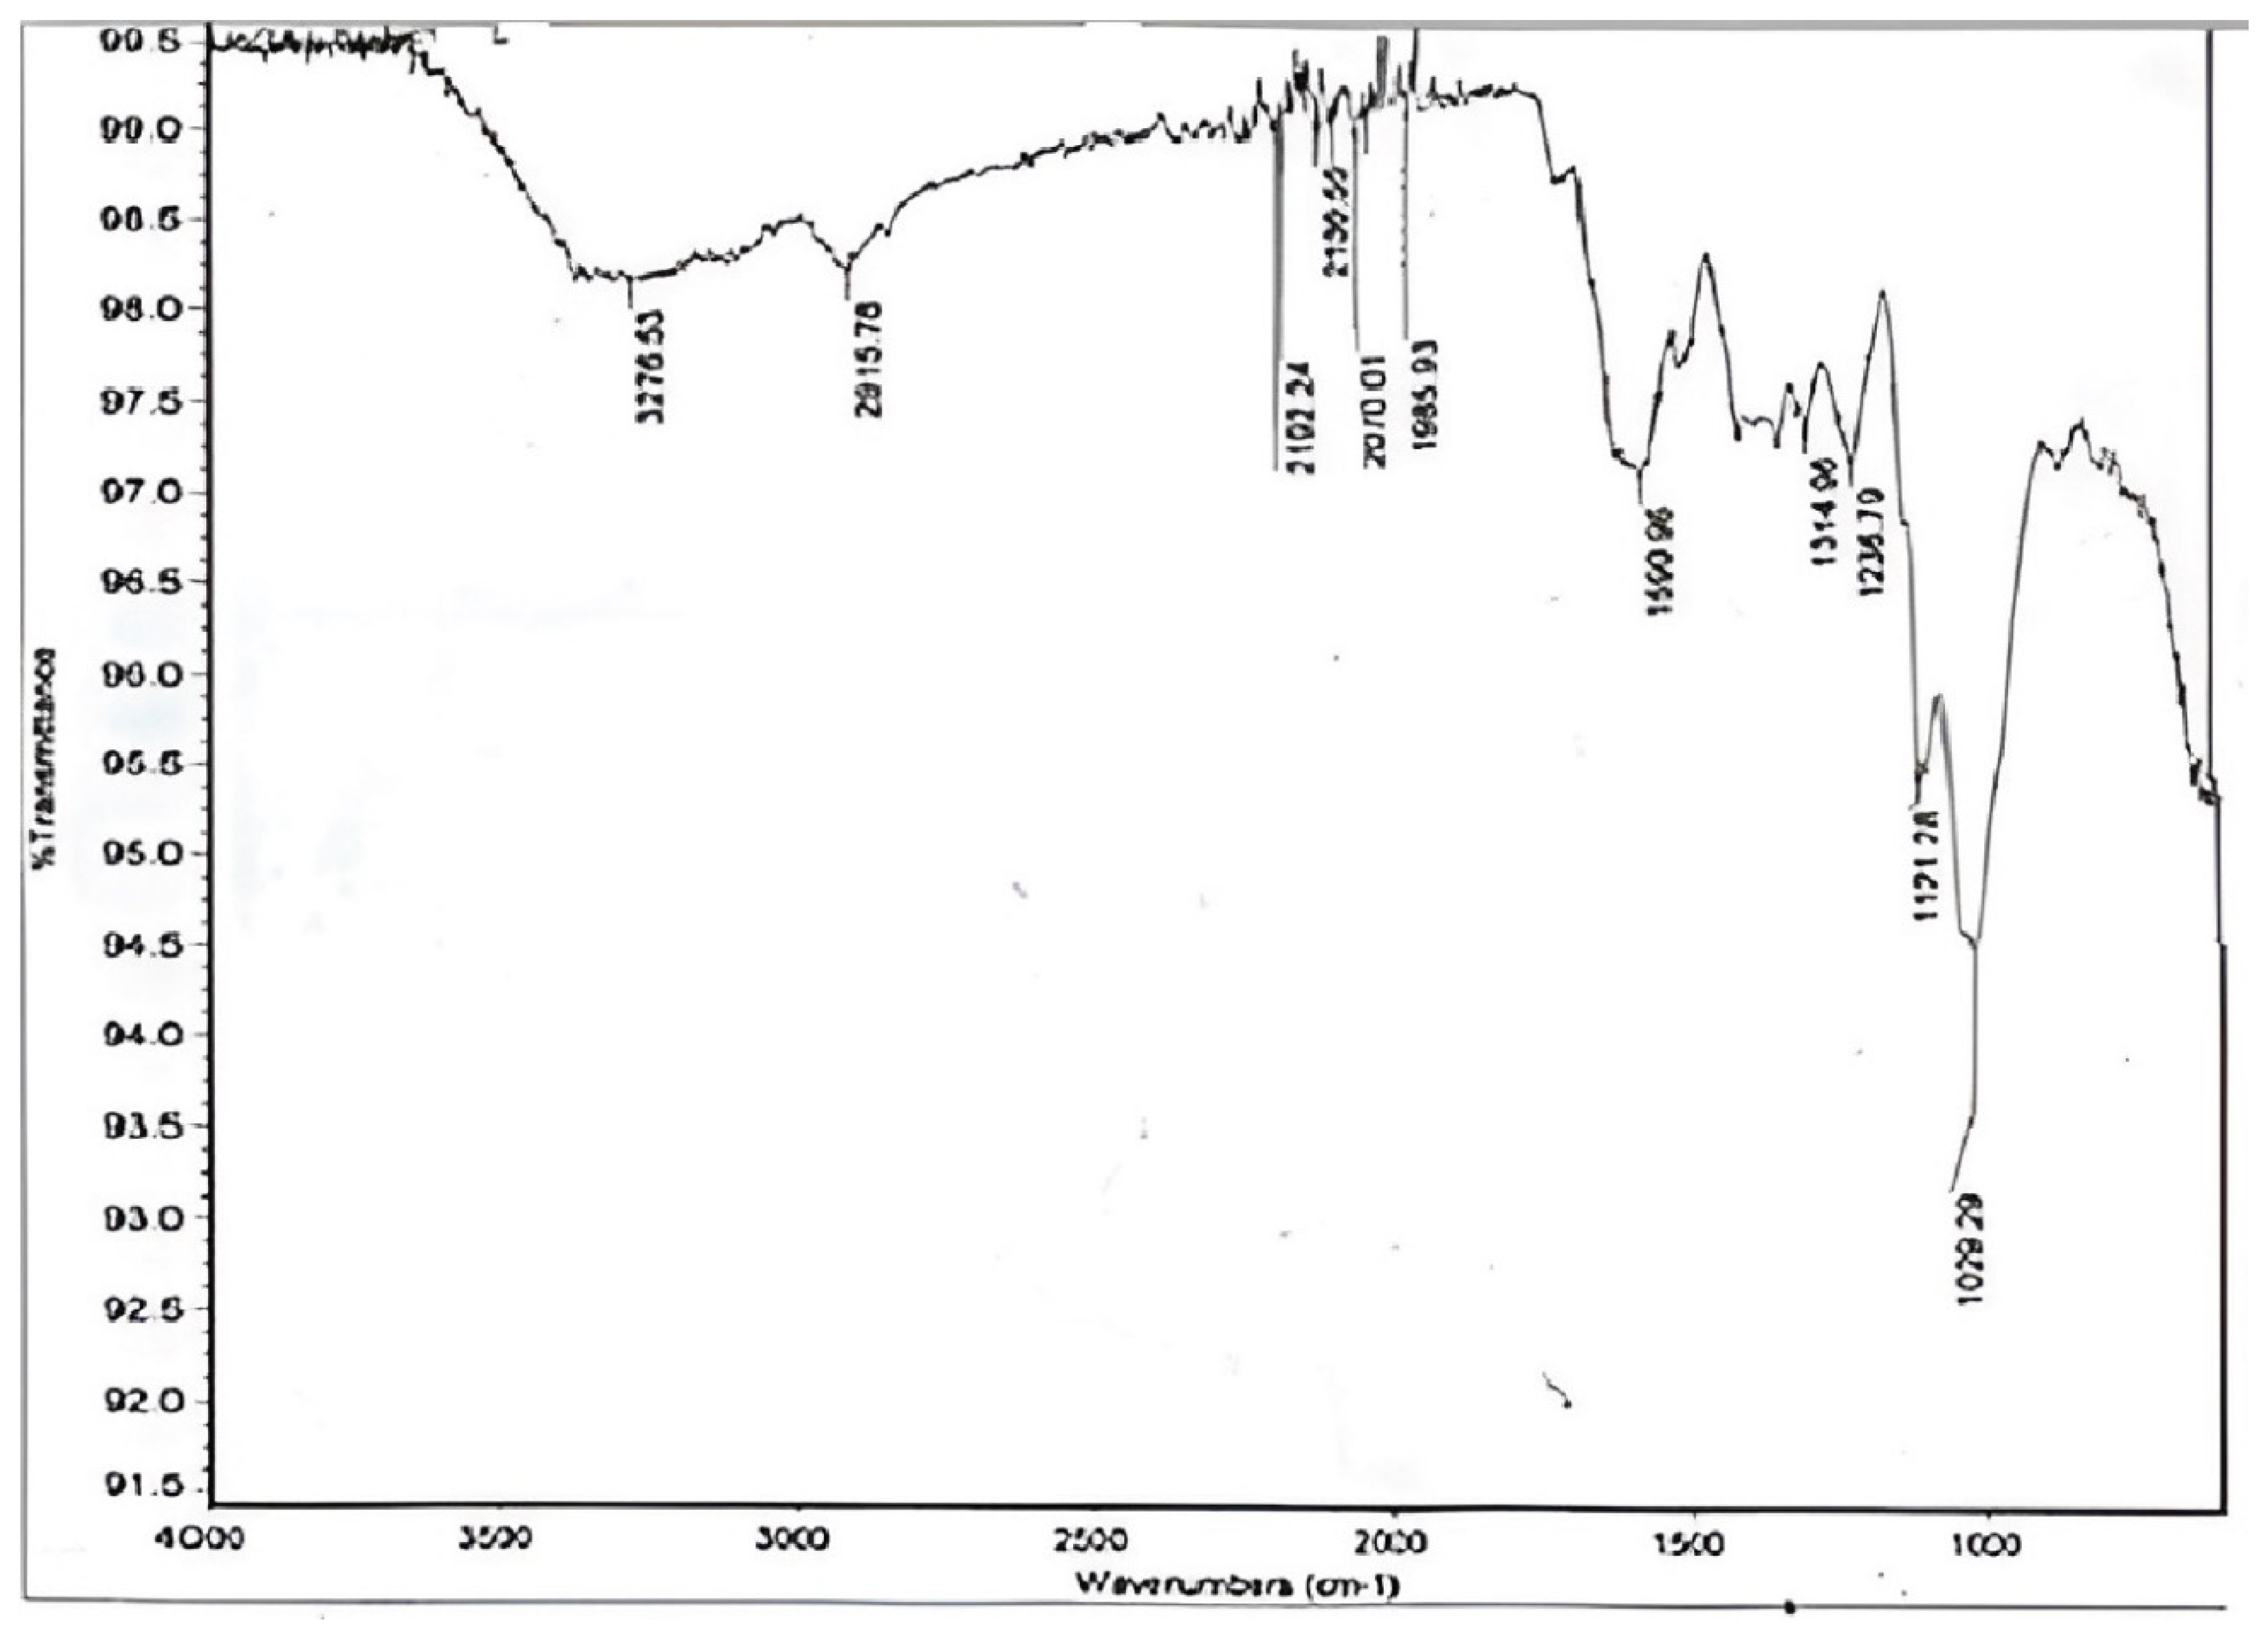
3.2. Chemical Analysis of D. regia Pods by FTIR

FTIR is a widely used nondestructive analytical tool for the qualitative and quantitative identification of different types of chemical bonds (functional groups) present in chemical substances and lignocellulosic biomasses [43,44,45,46]. The FTIR absorbance spectra of D. regia pods revealed the presence of functional groups and vibration modes (Figure 1; Table 1). The absorption bands between 3200 and 3600 cm−1 are attributed to the O-H stretching of alcohols, carboxylic acids, and hydroperoxides. The O-H stretchings of alcohols fall between 3650 and 3010 cm−1. A peak at 3276 cm−1 corresponded to vibration and free stretching of O-H groups in cellulose, hemicellulose, and lignin of D. regia pods [44,46,47,48]. The small peaks at 2915 cm−1 demonstrated C-H asymmetric stretching, confirming the presence of cellulose in the biomass [44,47,49]. We found the CH2 symmetric stretching in D. regia biomass at 2915 cm−1, and similar stretching at 2914–2918 cm−1 in cellulosic biomass has previously been demonstrated [44,49]. Other absorbance peaks in the 2000 and 2200 cm−1 range were ascribed to C≡C in the alkynes in the D. regia pods. The peak at 1590 cm−1 was accredited to skeletal vibration (C=C) in the phenolic ring of lignin [50]. The FTIR absorbance spectra of holocellulose and lignin found that the absorption positions at 1510 and 1600 cm−1 are instigated by lignin. While absorption at 1730 cm−1 by holocellulose [51], specifies the stretching of C=O in non-conjugated ketones, ester, and carbonyl groups.
The absorption spectrum at 1236 cm−1 was attributed to C=O stretching of hemicelluloses and corroborated previous findings of C=O absorbance at 1244–1254 cm−1 [44,49,52]. Likewise, C-O stretching at 1236 cm−1 has been accredited to the guaiacyl unit of lignin [44]. Our results, however, contradicted a previous study that reported C-H asymmetric stretching at 2850 cm−1 [53]. The absorbance peak at 1121 cm−1 in D. regia pods had low molecular weight lignin fractions [47,52]. Similarly, at 1029 cm−1, the C-H in-plane deformation for the guaiacyl unit and the C-O stretching of primary alcohols and cellulose was observed in D. regia pods. Other studies have found these stretching at 1028, 1032, and 1037 cm−1, which are in close proximity; the slight difference may be accredited to experimental conditions or the nature of the lignocellulosic biomass [46,47,53]. Nonetheless, another study has linked the peak at 1029 cm−1 to the halogen (C-F) group [46]. Some sharp peaks were observed at 1935 and 1314, cm−1, which were attributed to nitriles and carbonyl, respectively; this indicated the fortification of the D. regia pods by their combination. Similar findings have been demonstrated for the fortification of poplar biomass [44], corn cobs, and rice husks biomasses [46].

3.3. Optimization of Physicochemical Parameters by RSM

The RSM (MINITAB 17) was employed to statistically optimize the interactive effects of four variables (two variables at a time) for the pre-treatment of D. regia pods. RSM is an efficient, cost-effective, and widely used method for designing and conducting experiments in biofuel production to achieve optimal conditions. RSM assesses the effects of different independent variables and their interactive effects with RSM-dependent variables, assisting in the reduction in experimental trials [54,55,56,57,58]. Additionally, it can predict results and generate 3D surface plots. RSM-based pre-treatment methods have been employed vastly to pretreat a wide range of lignocellulosic biomasses, including bamboo, corn stover, corn cobs, elephant grass, sugarcane, switchgrass, wheat straw, and Vachellia nilotic (Reviewed in [59]).
The minimum and maximum coded values (the lowest −α, lower −1, mid 0, high +1, and the highest +α) of four variables (amount of substrate, H2SO4 concentration, temperature, and time) were used. The RSM analysis created the Box-Behnken Design (BBD) matrix of the uncoded values of the variables with five levels of testing (Table 2). Design Expert v 7.0 software was used to analyze the experimental data [60].
The rationality of the fitted model for glucose, lignin, and xylose production was analyzed through analysis of variance for the response surface models, and the F-test was opted to control the statistical significance (Tables S1–S9). Tables S1, S4 and S7 showed the analysis of variance for the response surface models of glucose, xylose, and lignin, respectively. The table shows that the regression models for glucose, xylose, and lignin yields were highly significant at confidence levels of 96.52%, 97.08%, and 96.52%, respectively, with very low probability values, i.e., (ca. 0.0001), and a high F-values of 29.72, 35.66, and 29.72, respectively. Model-fitted reliabilities of glucose, xylose, and lignin were calculated by determination coefficients ad were found to be 0.96 for all three. This indicates that around 96% of the variance is attributed to the variables. At the same time, the model could not elucidate only 4.0% of the overall variations. In addition, for the analyzed glucose, lignin, and xylose responses; R2, adjusted and predicted, were all high, and the difference between both was less than 0.2, indicating that the model fit the data well (Tables S2, S5 and S8).
The response surface regression analysis for glucose production showed that two-way interaction analysis of all variables, except interaction between time and temperature, were non-significant at p ≤ 0.05 (Table S1). For xylose production, the interaction of incubation time and the temperature was significant at p ≤ 0.05 (Table S4). Likewise, for lignin production, the interaction of substrate and the temperature was non-significant at p ≤ 0.05 (Table S7). This indicated the fitness and reliability of regression models. Our results corroborated an earlier report where the value of model fitness was 98.5% [25].

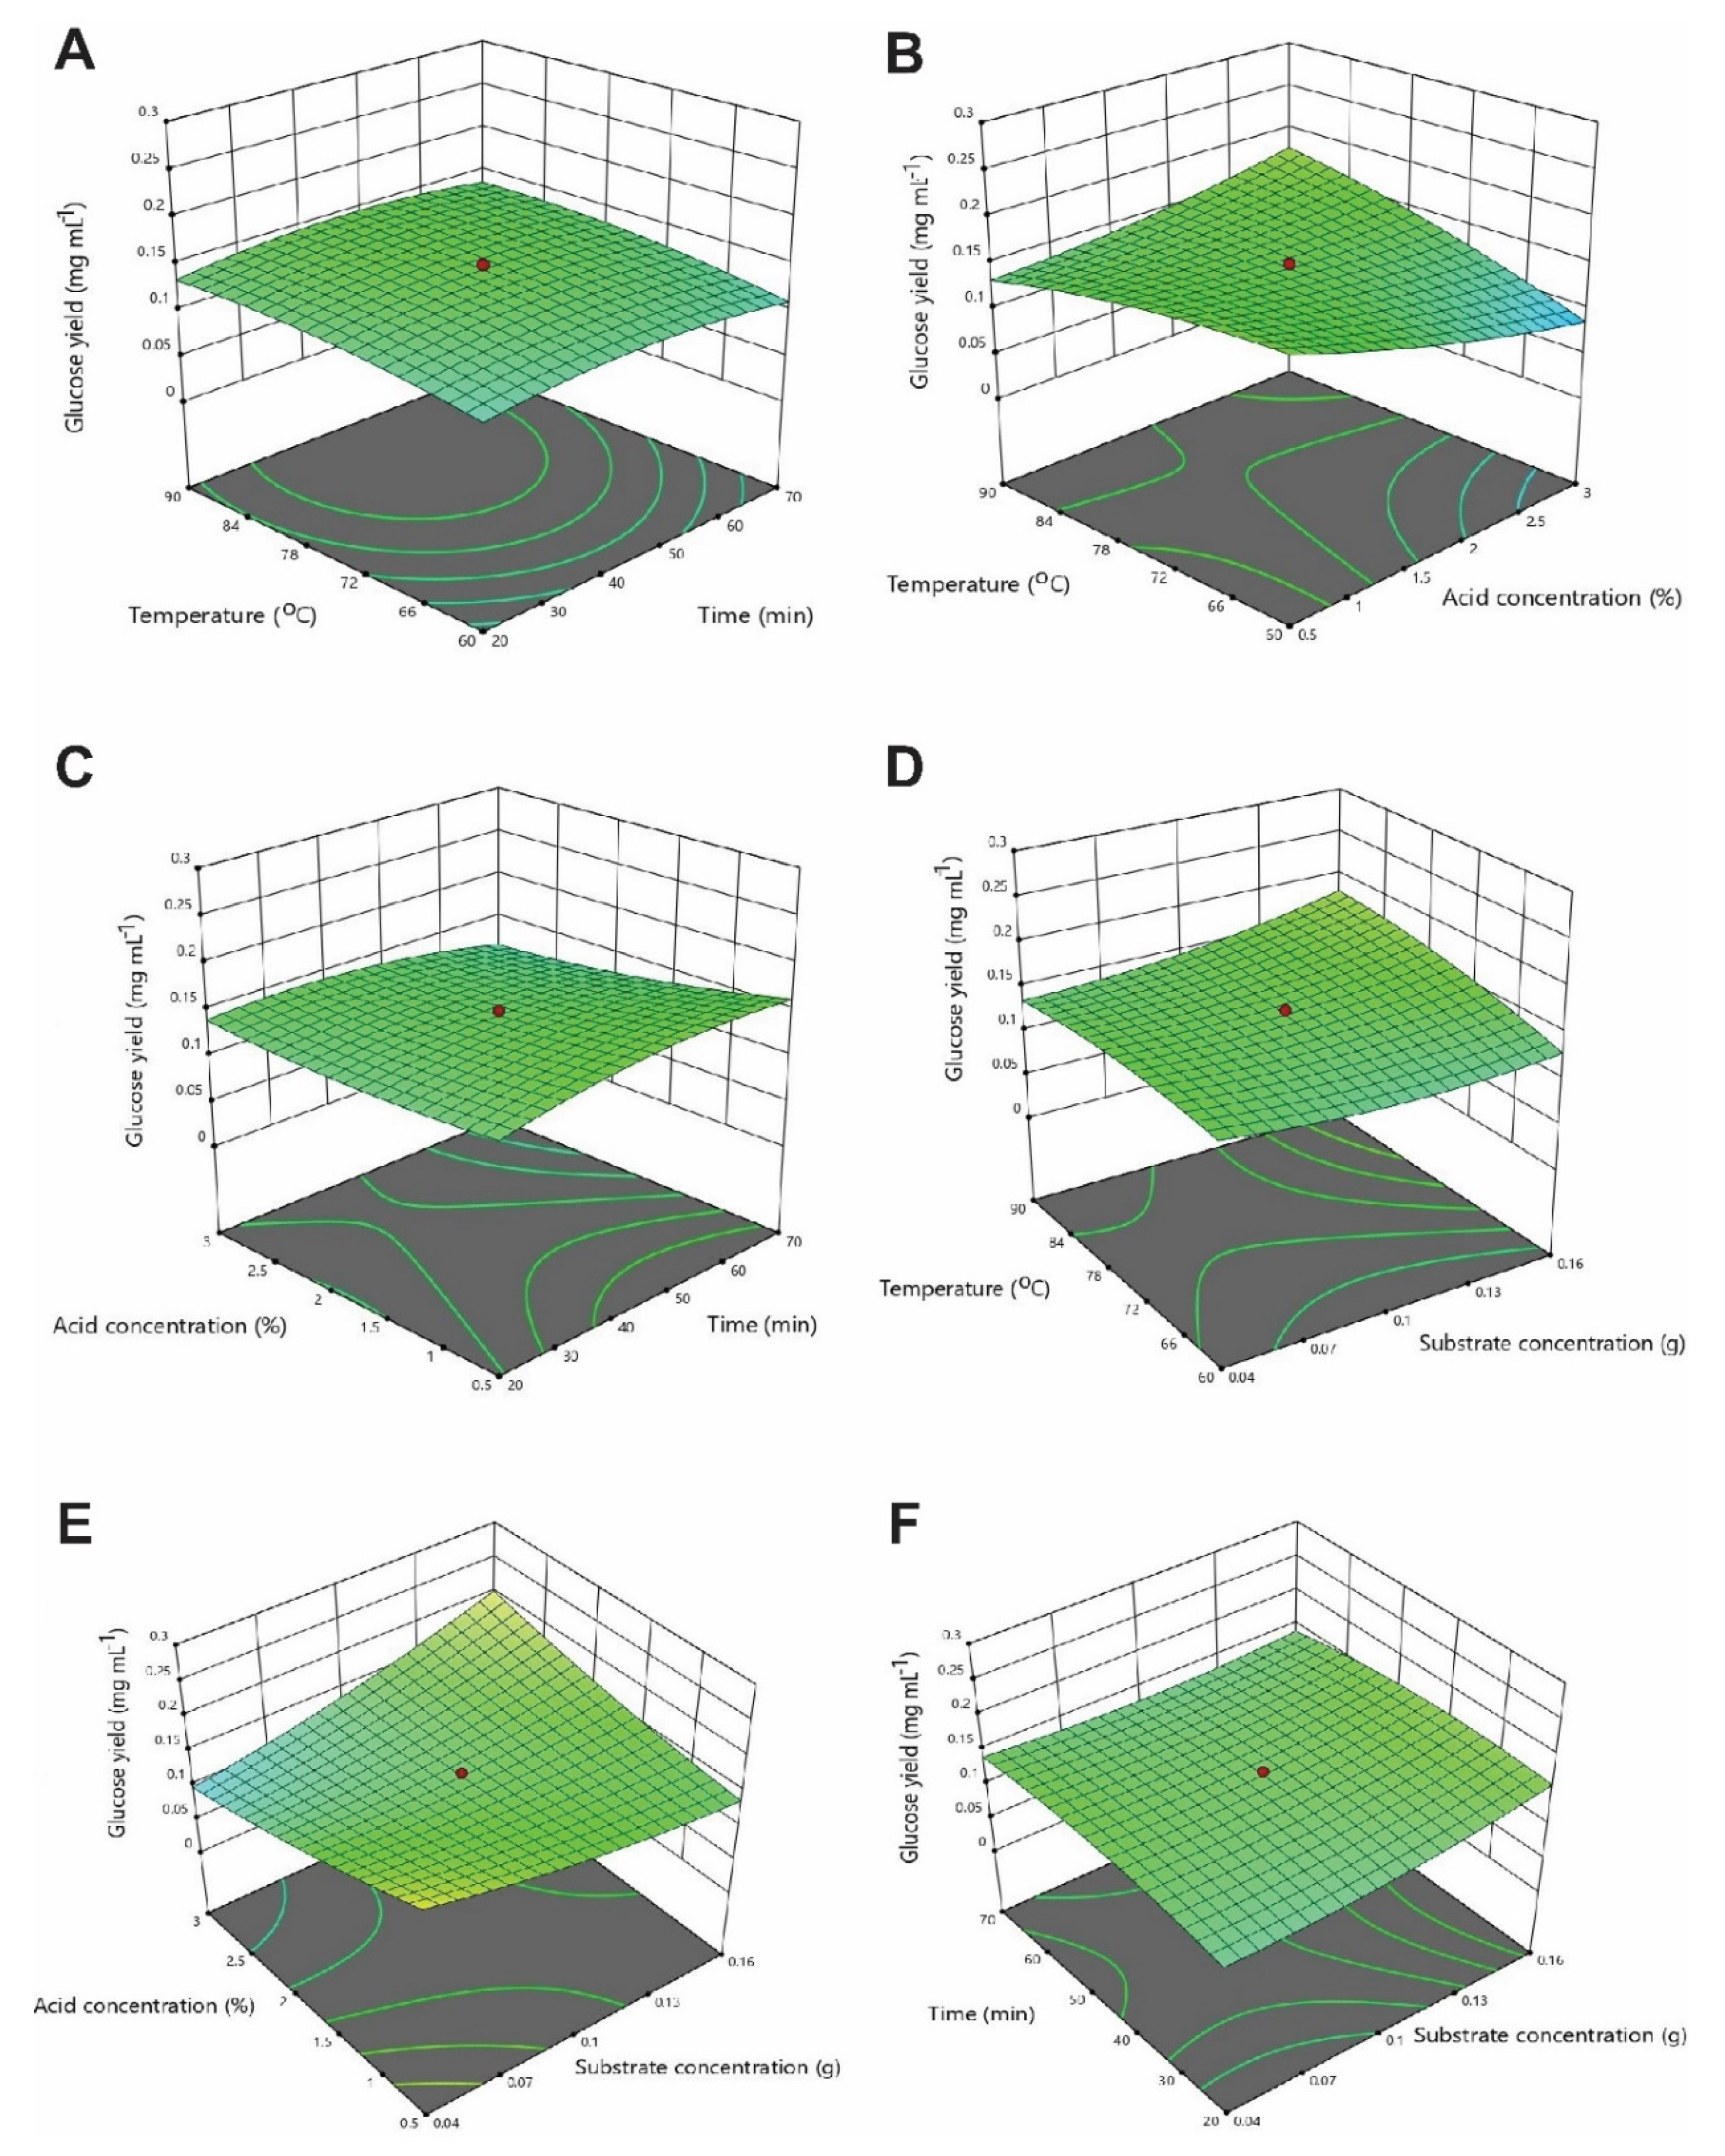
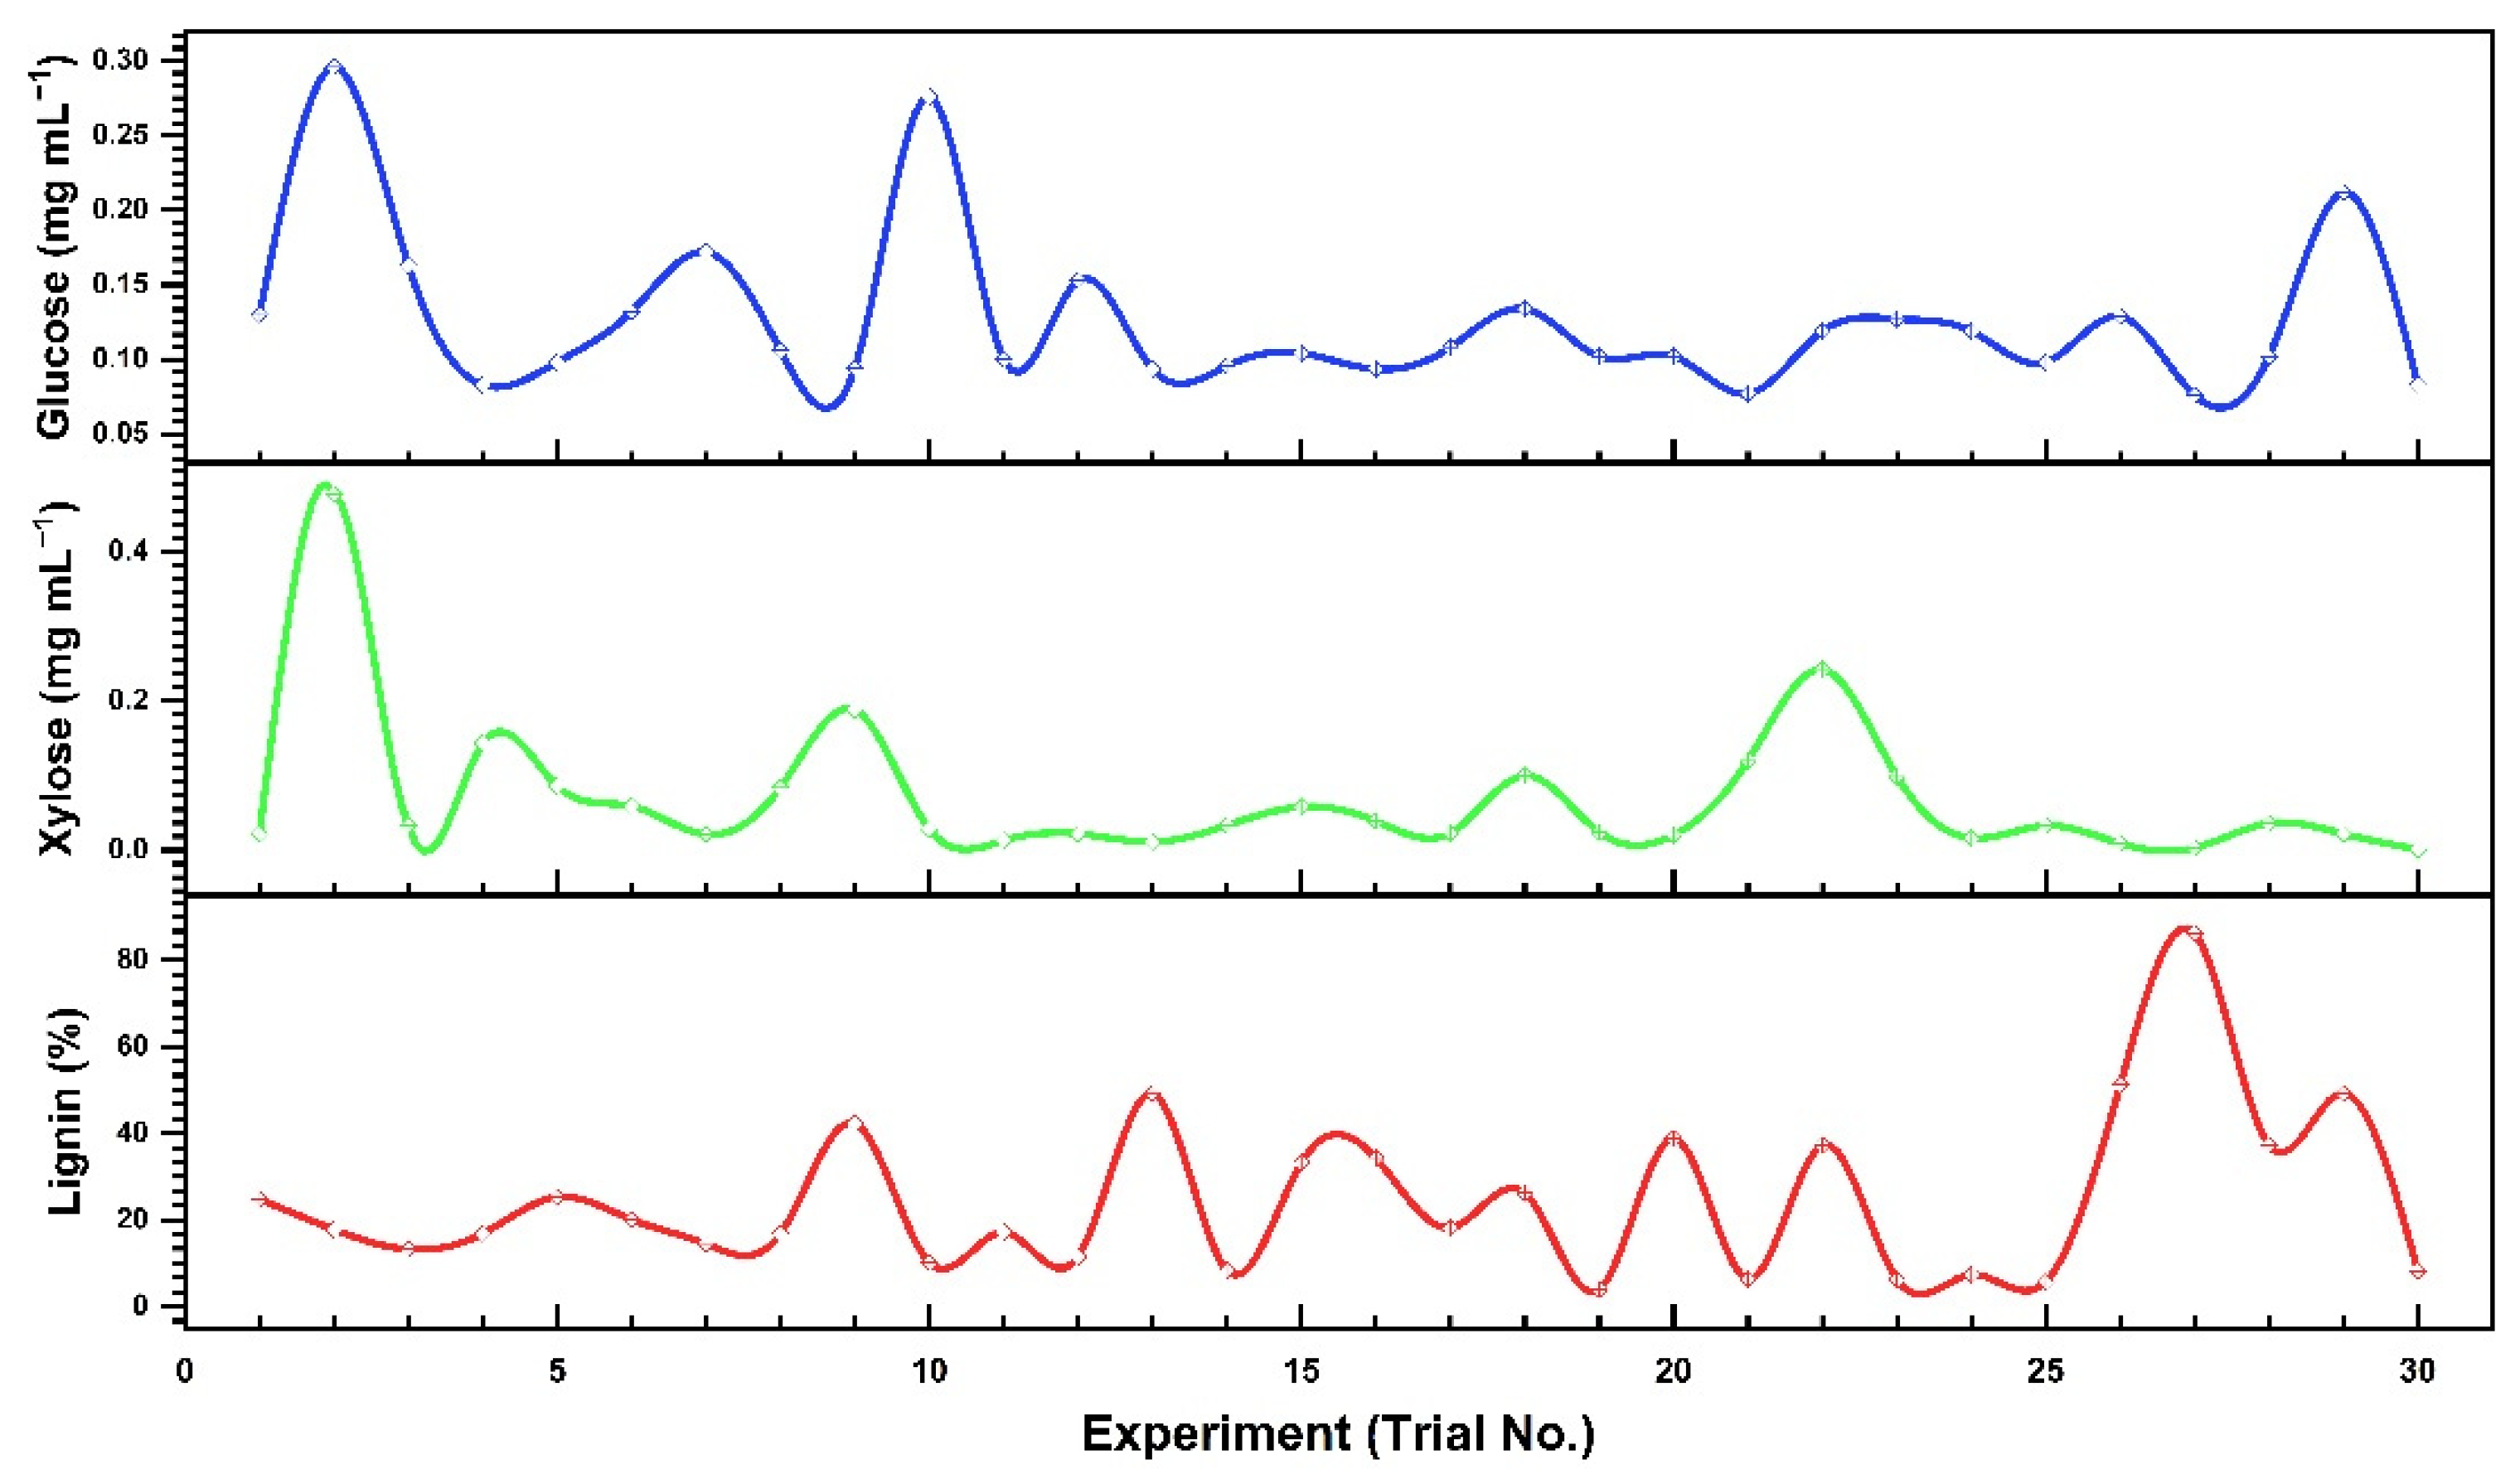
3.3.1. Optimization of Interactive Variables for Glucose Production

For glucose production, 3D contour plots were inferred to yield the optimized interactive effects of the tested variables (Figure 2). An optimized relationship between temperature and incubation time revealed that longer incubation time and higher temperature resulted in higher glucose production. The glucose yield increased as hyperbolic from lower (20 min) to higher (50 min) residence time and temperature (~80 °C). The interactive effect of both these variables could yield the highest glucose (~0.14 mg·mL−1) at an incubation time of 50 min and 80 °C (Figure 2A).
The interactive effects of temperatures and H2SO4 revealed that a higher temperature (~90 °C) and a higher acid concentration (~3%) could yield the highest glucose (~0.17 mg·mL−1) production (Figure 2B). Likewise, the interactive effect of temperature and substrate showed that the highest glucose (~0.17 mg·mL−1) production could be yielded at a higher residence temperature (~90 °C) and substrate of 0.16 g (Figure 2D).
In Figure 2C, glucose yield increases as a hyperbolic plane with the increase in incubation time from 20–70 min. In contrast, acid concentration exhibited an opposite trend to incubation time. An interactive effect of acid concentration and incubation time revealed that the highest glucose production could be achieved by heating the biomass at a higher acid concentration (Figure 2C). In Figure 2E, both lower substrate- and acid concentrations could yield higher glucose. Nonetheless, the interactive effect showed the highest glucose (~0.2 mg·mL−1) yield at 3% H2SO4 and an optimal amount of 0.16 g substrate (Figure 2E). The glucose yield increases linearly with an increase in substrate amount and incubation time; however, incubation of a high substrate amount (~0.13 g) at a high temperature (~45 °C) could lead to higher glucose (~0.15 mg·mL−1) yield (Figure 2F).

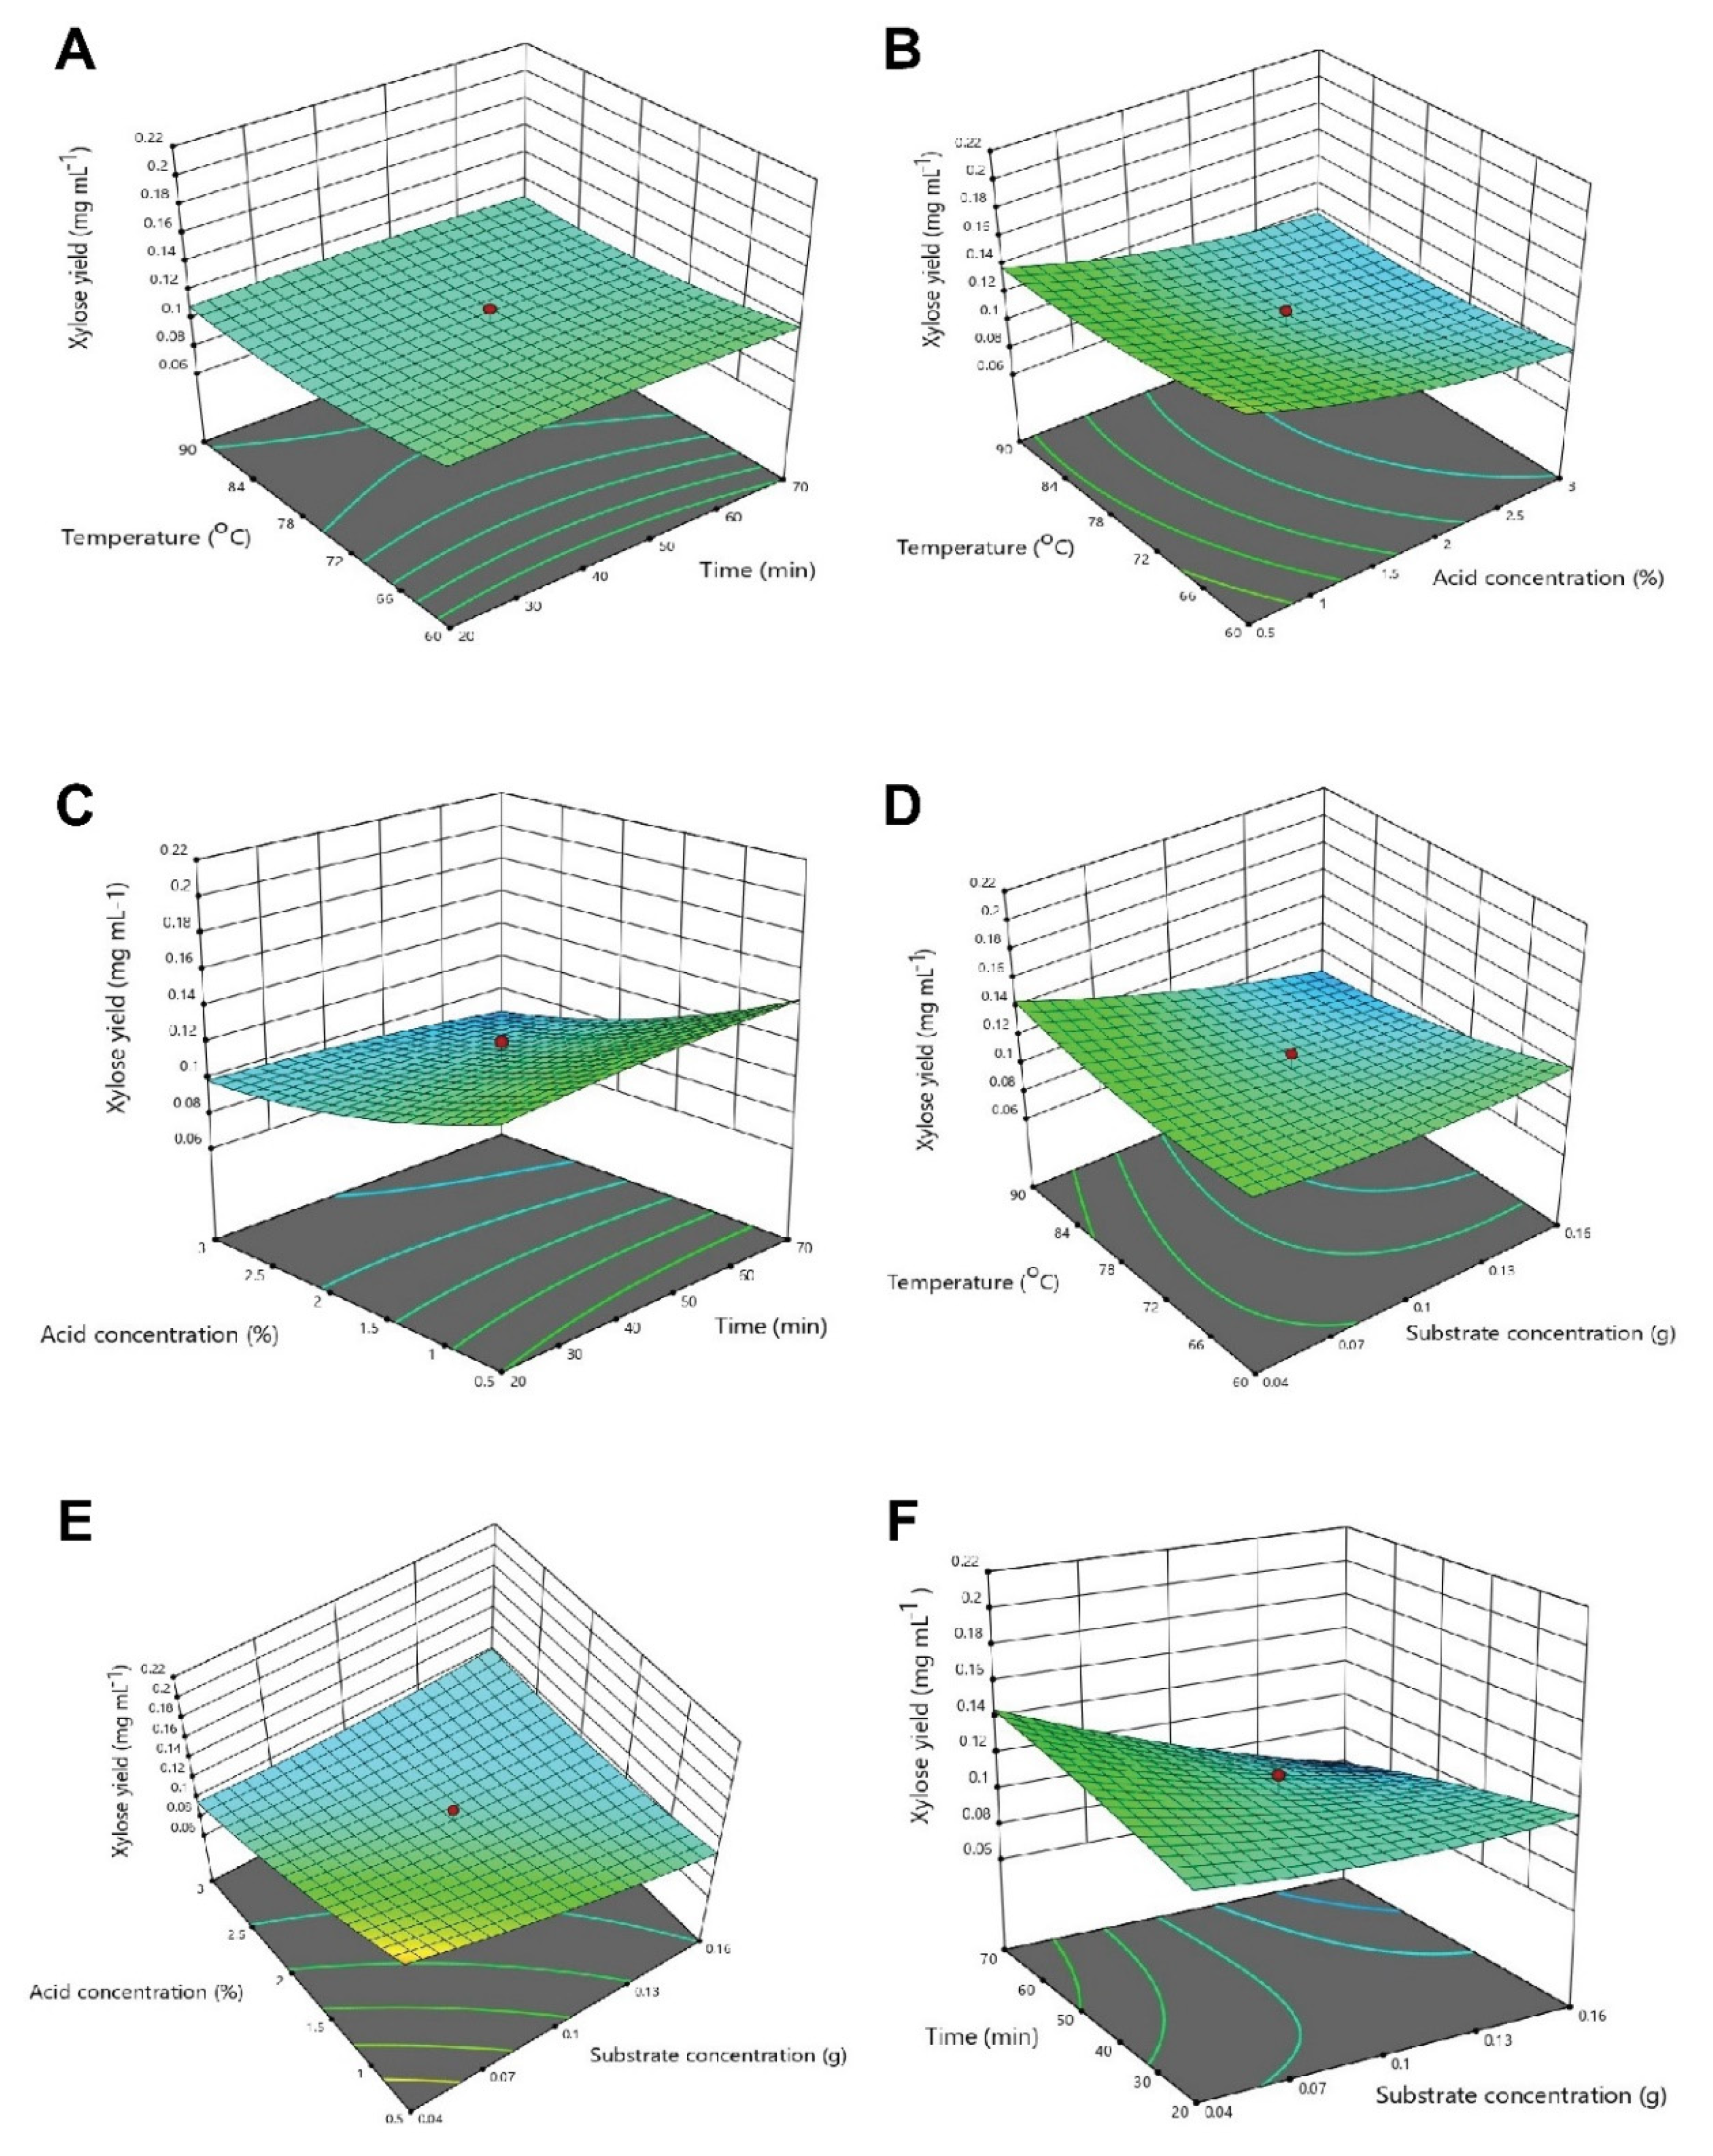
3.3.2. Optimization of Interactive Variables for Xylose Production

A 3D contour plot for optimal xylose production (Figure 3) showed that incubation had no effect on the xylose yield, whereas lower (60 °C) and higher (90 °C) temperatures favored xylose production (Figure 3A). The interactive effect of temperature and time showed that 60 °C and 40–50 min of incubation could yield optimal xylose (~0.11 mg·mL−1) production (Figure 3A).
The interactive effects of temperatures and acid concentrations revealed that a higher temperature and a lower acid concentration could yield higher xylose contents (Figure 3B). Likewise, the optimal xylose (~0.14 mg·mL−1) could be released from the 0.04 of D. regia substrate at 90 °C (Figure 3D). The interactive effect of acid concentration and incubation time revealed that low acid concentration positively affected xylose production, whereas a very slight positive effect was observed on xylose production from 20–70 °C. The interactive effect of both these variables showed that the optimal xylose (~0.142 mg·mL−1) could be yielded at 0.5% H2SO4 after 70 min of incubation time (Figure 3C). Figure 3E shows that xylose yield decreases slightly with increasing substrate amount and acid concentration, and 0.5% H2SO4 yields the highest xylose (~0.10 mg·mL−1) from 0.04 g of substrate. In contrast, higher incubation time favored xylose production, and substrate amount had an almost negligible effect on xylose production. However, their interactive effect revealed that incubating 0.04 g of substrate for 70 min could yield the highest xylose (Figure 3F).

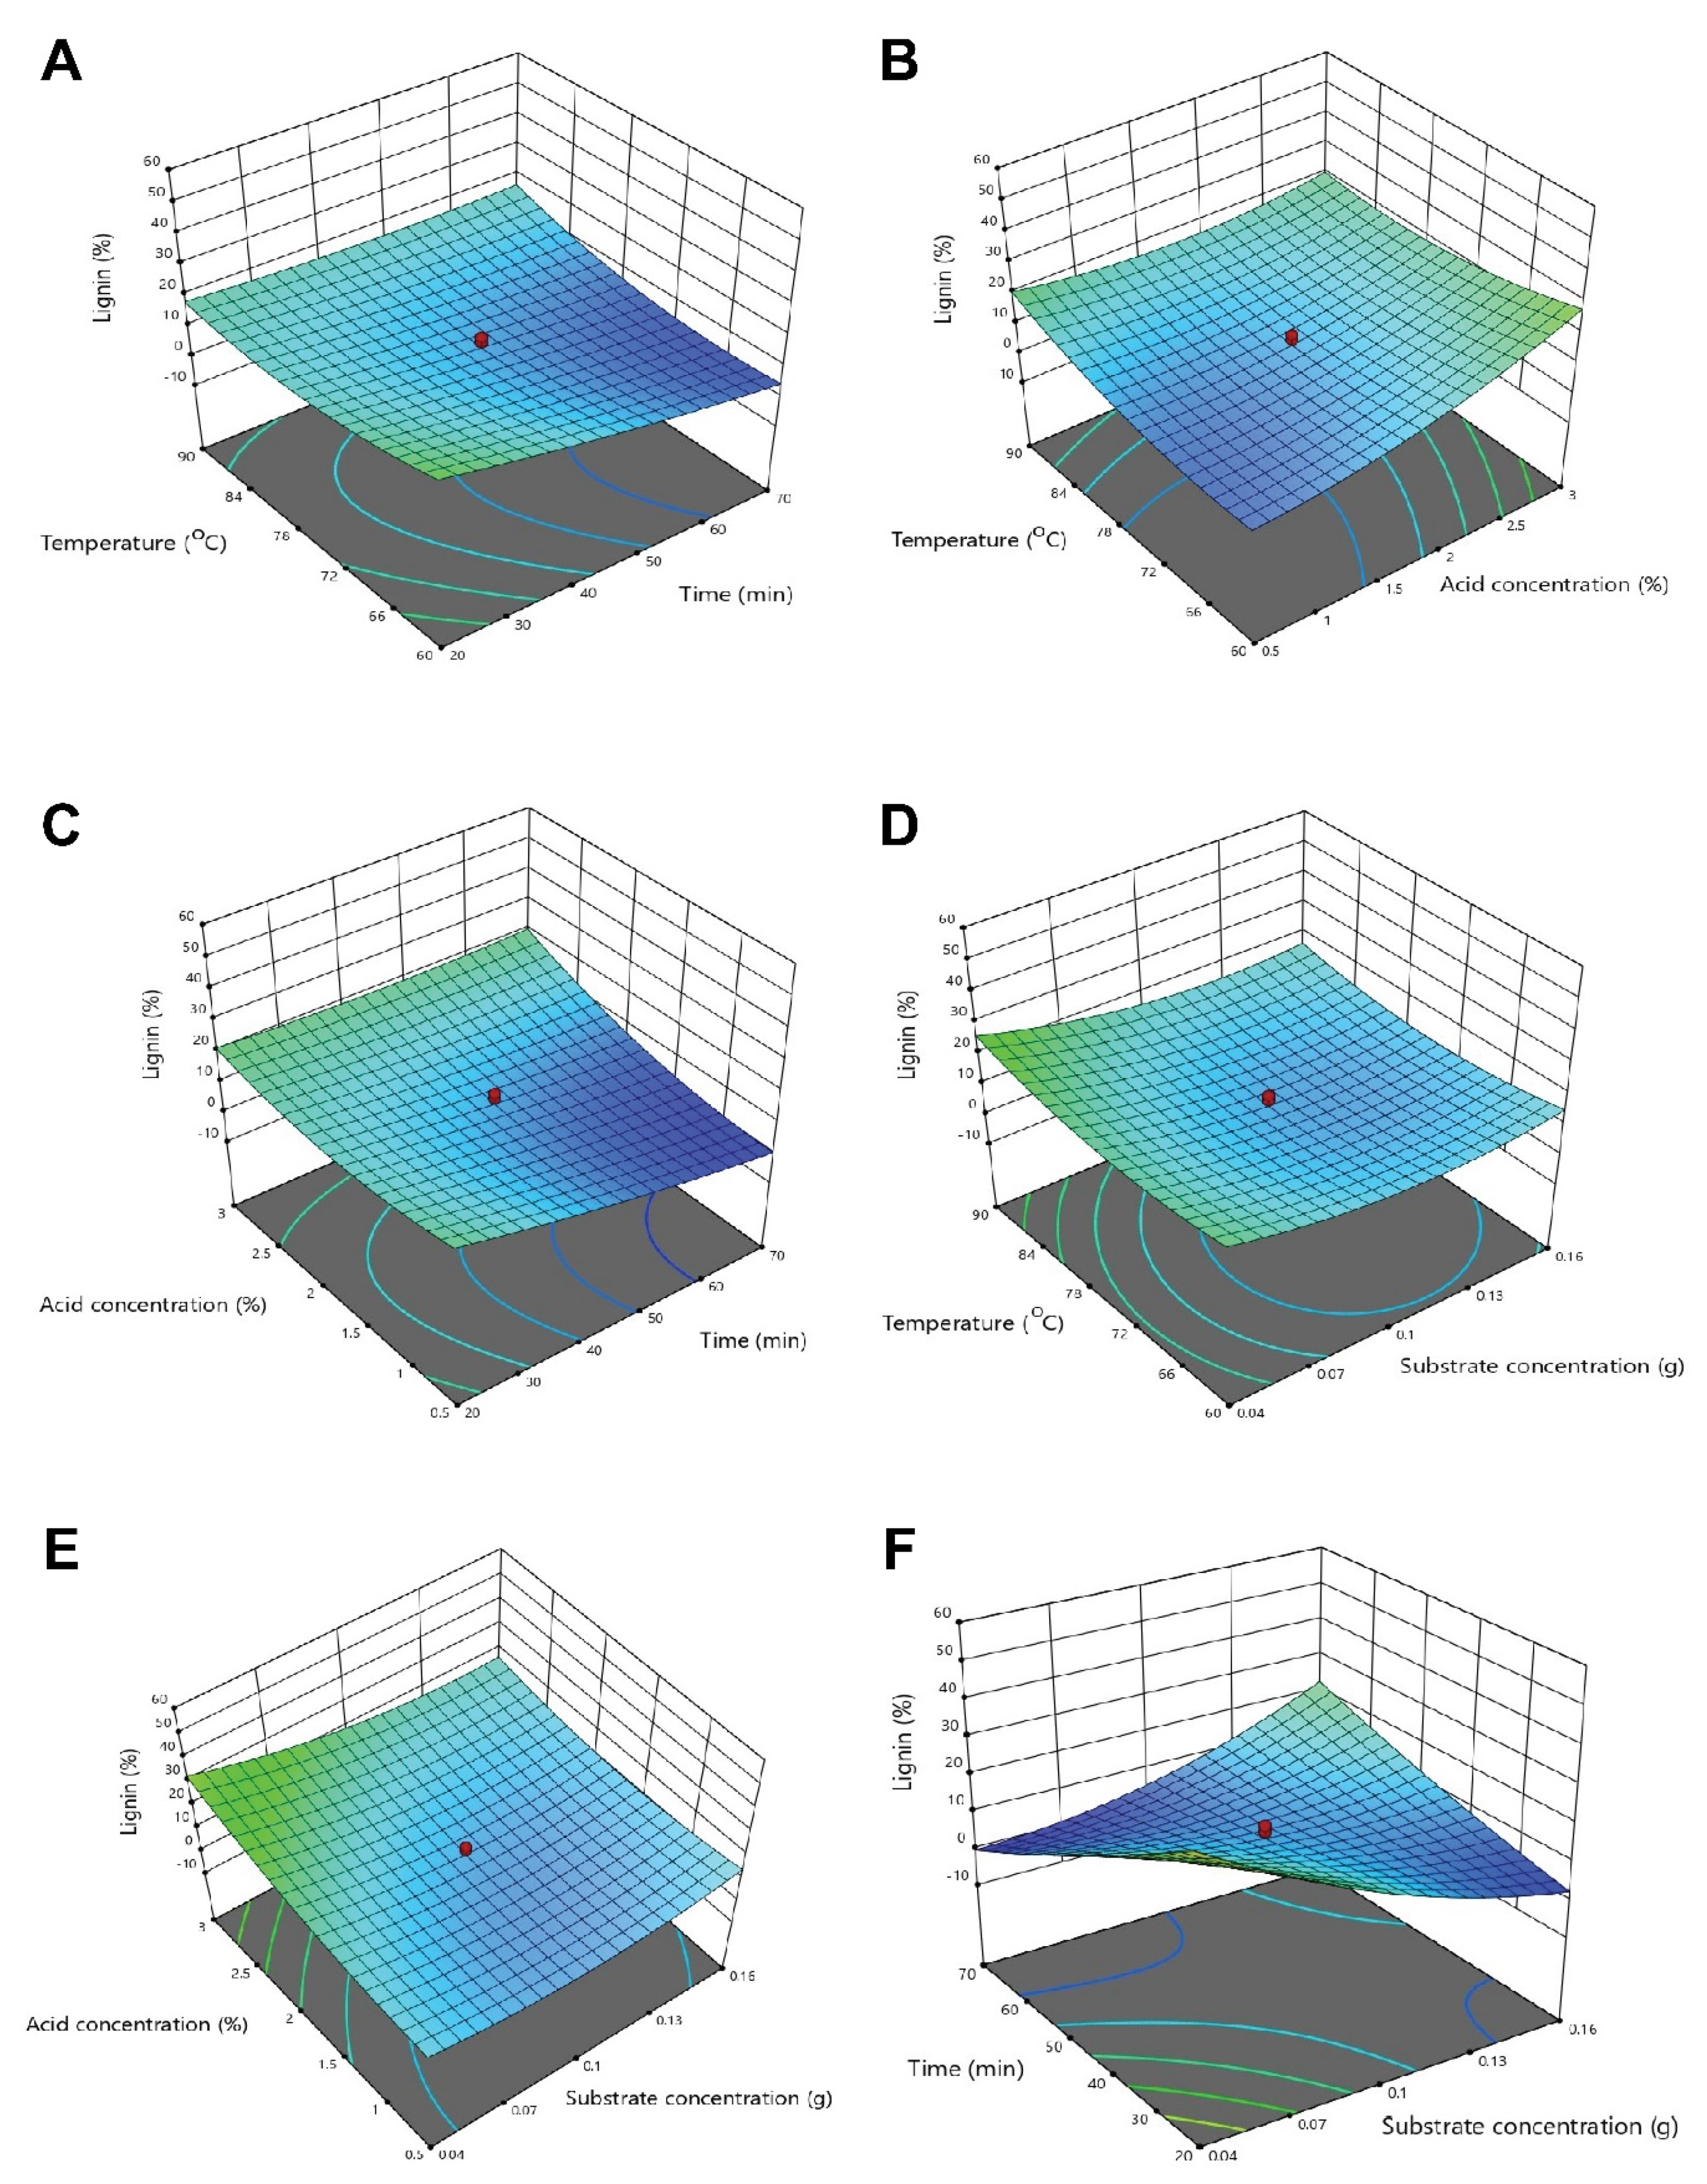
3.3.3. Optimization of Interactive Variables for Delignification

For percent soluble lignin estimation, 3D contour plots showed that the delignification of D. regia was affected severely at high temperatures, high acid concentration, and low residence time (Figure 4). In Figure 4A, the percent lignin decreases as incubation time increases, whereas time has a parabolic relation with delignification.
The higher acid concentration or temperature could lead to an increase in the percent lignin yield. The interactive effects of temperatures and acid concentrations showed that higher temperature (90 °C) and higher acid (3%) concentrations remarkably affect delignification (20%) (Figure 4B). Likewise, the optimal delignification could be yielded at a temperature of 60 °C and a substrate amount of 0.12 g; nonetheless, their interactive effect yielded the best results (~18%) at 90 °C and 0.016 g substrate (Figure 4D). Figure 4C reveals that delignification decreases linearly from 20–70 min and has parabolic relation from 0.5–3% H2SO4. The interactive effect of acid- and substrate-concentration showed the highest (~17%) lignin at 3% H2SO4 and 0.04 g of substrate, implying that low acid favors the delignification of D. regia pods (Figure 4E). The highest amount of lignin (~22%) could be yielded when 0.04 g or 0.16 g of the substrate was incubated for 20 min or 70 min, respectively (Figure 4F).

3.4. Experimental Testing and Optimal Experimental Values

The effect of four variables and their interaction on the production of reducing sugars (glucose and xylose) and delignification is presented (Table 3; Figure 5). RSM proposed 30 different experimental conditions (trials) of four variables and combinations of their different uncoded values to yield the optimal glucose, xylose, and lignin degradation (Table 3). The results of 30 trials revealed that trial 2 (with 3% H2SO4 at 90 °C for 70 min incubation time) produced the highest amount of glucose (0.296 mg·mL−1) and xylose (0.477 mg·mL−1) with the lowest amount of insoluble (residual) lignin (17.783%). Conversely, trial 27 produced the least amount of glucose (0.076 mg·mL−1) and xylose (0.003 mg·mL−1) with a higher amount of residual lignin (86.192%) (Table 3; Figure 5). These conditions of trial 2 were opted in the subsequent enzymatic hydrolysis, as it not only yielded a relatively low amount of insoluble lignin but also because of a higher amount of glucose and xylose. This implied that the interaction of four variables in trial 2 led to the swelling of the cellulose structure, thereby increasing the surface area and improving the digestibility of the residual lignocellulosic biomass [61].
Acid is a critical component in the pre-treatment process. Different types of inorganic and organic acids have been used for the pre-treatment of biomasses. Acid pretreatment is relatively inexpensive and has cascading effects on downstream processes. In this work, D. regia pods were pretreated with 3% H2SO4 resulted in the highest amount of reducing sugars. It may be due to the amorphous nature of the biomass, the dilute acid increased cellulose accessibility, and the release of fermentable sugars [62,63]. Predominantly, H2SO4 is regarded as a good choice for the pre-treatment process due to its greater ability to dissolve hemicellulose, alter the structure of lignin, and act as a catalyst. The dilute acid treatment had an unparalleled advantage over the concentrated acid and alkaline treatments because it is less toxic, less corrosive, and produces fewer byproducts of sugars [64,65,66]. Acid pretreatment methods change the lignin structure, increase hemicellulose solubilization, decrease cellulose crystallinity, and provide a larger surface area for the subsequent enzymatic hydrolysis step [65]. Furthermore, the acid itself hydrolyzes the biomass to fermentable sugars [67] and can release up to ~21.02% of reducing sugars from Eulaliopsis binate [68] and hydrolyze polysaccharides with minimum production of inhibitory compounds [69]. Dilute acid pre-treatment of Bambusa spp. with 5% acid for 30 min yielded 0.319 g·L−1 of reducing sugar at 15% (w/w) [70,71], while pre-treatment of sugarcane biomass with 4.95% of acid at 80 °C for 375 min resulted in more than 99% saccharification and a concentration of 50.6 g·L−1 monosaccharides [72]. Similarly, dilute acid hydrolysis of wheat straw for reducing sugar production at 106 °C, 0.98% H2SO4 for 45 min yielded 11.36 g·L−1 of reducing sugars [58]. Pretreatment of bagasse pith with 4% H2SO4 for 90 min released the maximum glucose [73]. Pre-treatment of cobs, stalks, and maize leaves with dilute acid yielded 18.4 g·L−1 (66.8%), 16.2 g·L−1 (64.1%), and 11.0 g·L−1 (49.5%) glucose yield, respectively [74]. Although 3% H2SO4 yielded the most glucose (0.296 mg·mL−1) and xylose (0.2477 mg·mL−1) from D. regia pods, these were the sub-optimal amount of reducing sugars to yield bioethanol. The precise reason is difficult to conclude, but we may speculate that structural feature of D. regia pods, such as crystallinity and surface area, were not sufficiently impacted during the acid pretreatment [75].
The current study found that a higher concentration of D. regia substrate (0.16 g) yielded the highest amount of reducing sugars. Several studies have achieved remarkable results in terms of yielding the highest amount of glucose, xylose, and maximum lignin degradation in a short time period through the acidic degradation of biomass at different temperatures. The substrate concentration of Oil palm fruit bunches revealed that higher substrate concentrations resulted in a higher glucose yield of 3.2 g·L−1 [76]. When a high concentration of aspen wood chips substrate (8%) was used, 85% of the cellulose could be hydrolyzed to glucose [77]. Substrate concentration behaves differently at different reaction times, and higher substrate concentration boosts glucose release as the reaction time increases [78].
Lignin provides rigidity to plant cell walls, protects them from physical and microbial breakdown, and renders the bio-polymeric structure to solubilization [79]. The strong bond between lignin and hemicellulose usually prevents easy access to the cellulose fraction during pre-treatment conditions [80,81]. The soluble % lignin contents (lignocellulosic biomass) were highest (~20%) in the D. regia pods at higher acid concentrations and temperatures, and this trend was consistent with previous studies [82,83]. Nonetheless, the results of 30 trials showed that polymeric lignin was not effectively degraded to monomeric sugars in many of them. In general, trials with higher reducing sugars contained less lignin, indicating that acid and temperatures boosted the conversion of polymeric lignocelluloses to low molecular weight phenolic compounds and monomeric carbohydrates [84]. Our results deviated from previous studies, which reported that delignification increased after biomass pre-treatment at a higher temperature (121 °C) and low acid concentration [85,86]. D. regia biomass was calcitrant at higher temperatures and acid concentrations, implying that D. regia pods may have a unique ratio of hemicellulose, cellulose, and lignin. This may also be accredited to the formation of pseudo-lignin due to carbohydrates dehydration and polymerization [87], or a prolonged incubation time adversely affects the delignification process by disrupting other bonds in lignin and producing other compounds [88]. Furthermore, longer incubation time could lead to dehydration of xylose, hampering the maximum possible xylose yield [89,90].

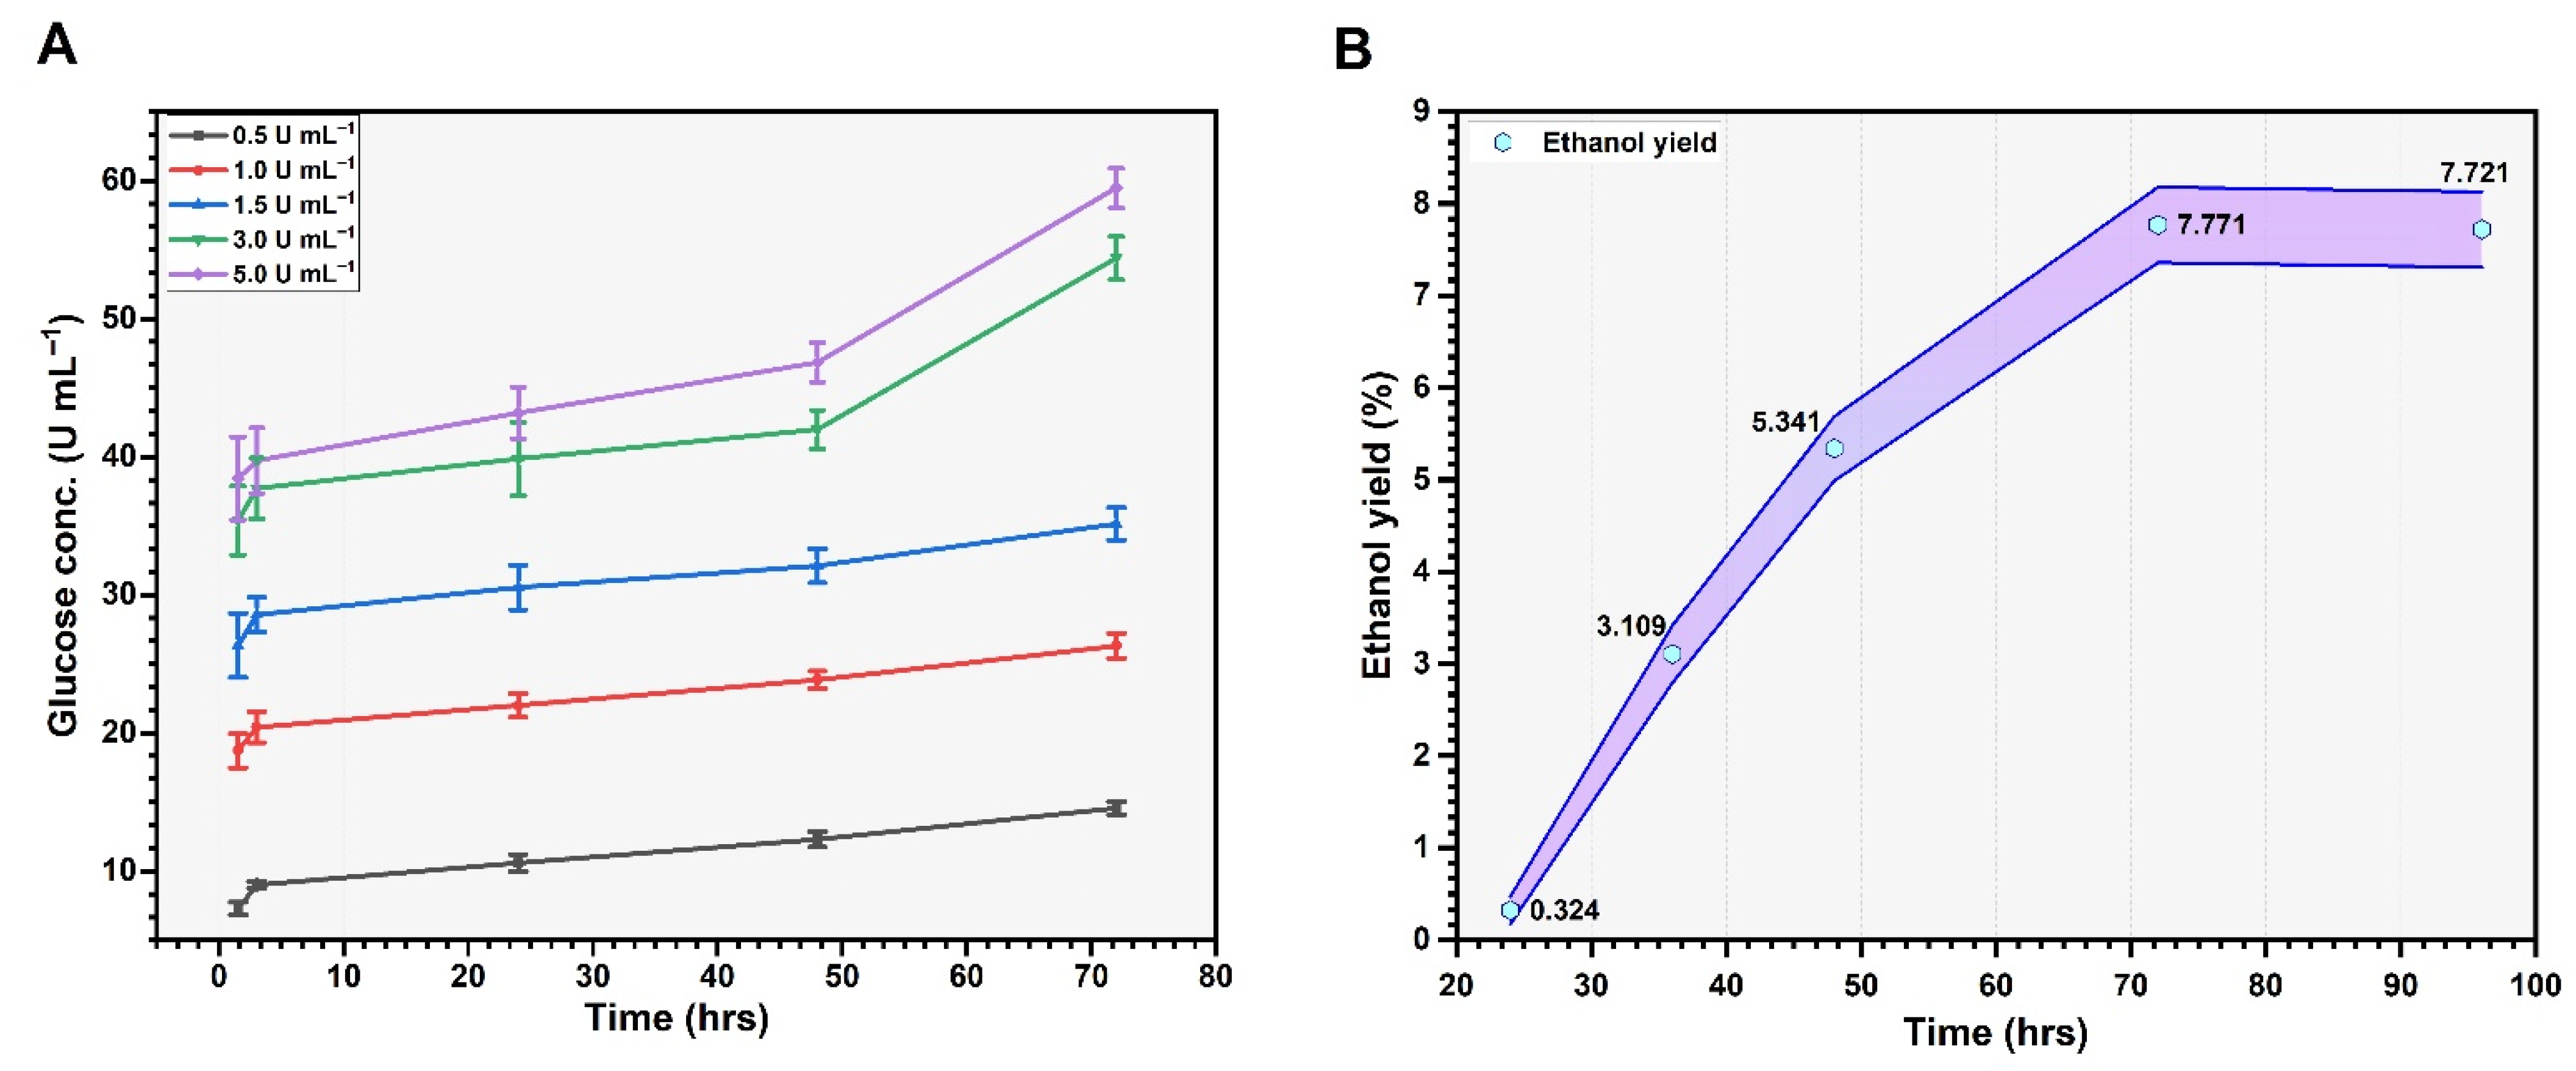
3.5. Enzymatic Hydrolysis and Bioethanol Production

The recalcitrant nature of celluloses and hemicelluloses rendered their complete breakdown. So, to release the maximum fermentable sugars, a second treatment could opt. Enzymatic saccharification has been proven to be a highly beneficial process for releasing the highest amount of glucose from lignocellulosic biomass [91]. The effective pre-treatment strategies overcome biomass’s recalcitrant nature and provide an amenable substrate for subsequent enzymatic hydrolysis. To circumvent the recalcitrant nature of D. regia pods, a severe pretreatment with aggressive chemistry, followed by enzymatic hydrolysis, can be used [92]. In this study, the pretreated D. regia pods with the highest amount of glucose and xylose and comparatively less insoluble lignin were subjected to enzymatic hydrolysis with an indigenously produced cellulase enzyme. The results demonstrated that the enzymatic load of 5 U mL−1 yielded the highest glucose concentration (55.57 mg·mL−1) after 72 h of incubations (Figure 6A).
Notably, acidic pretreatment of D. regia pods merely produced 0.296 mg·mL−1 of glucose, pinpointing the calcitrant nature of D. regia pods. Similar findings have earlier shown that two different types of pretreatment methods could yield optimal biodiesel production from D. regia pods [93]. Our results are in line with an earlier study, which reported that 50% of glucose was recovered from the rice hull after 48 h of enzymatic treatment [94]. Likewise, 80% of total glucose yield was achieved after pretreating wheat bran with 0.5–4% (w/w) of H2SO4 and then with 5% enzymatic load for 72 h [95]. Likewise, wheat bran pretreated with acid and subsequently with different enzymes, such as cellulase, xylanase, hemicellulase, and glucosidase, produced a higher concentration (95%) of total fermentable sugars [96].
After optimization of all physiochemical parameters, acidic pretreatment, and enzymatic saccharification of D. regia pods, the fermentation was carried out by S. cerevisiae. A gradual and logarithmic increase in ethanol concentration was observed from 24 h to 72 h of incubation, and then a slight decline was observed up to 96 h of incubation (Figure 6B; Table S10). The highest concentration of ethanol, 7.771%, was obtained after 72 h of incubation (Figure 6B). After 72 h of incubation, the yeast consumed the maximum amount of carbon source and approached the plateau phase, or the product entered into the product inhibition phase. In this research, different incubation temperatures were used to yield the highest bioethanol concentration. The temperature has a noticeable influence on bioethanol production. So, it is indispensable to optimize this parameter [97]. Nimbkar and his colleagues fermented unsterilized sweet sorghum juice at 25, 30, and 35 °C, yielding the maximum ethanol (12.45%) at the 30 °C incubation temperature [98]. Our results are in harmony with Chongkhong et al. [66], who proclaimed high ethanol yield with increasing pH (4.4–5.9) and temperature of (27 to 36 °C), but the gradual decrease in yield was also reported with further increase in pH and temperature. Likewise, a high ethanol concentration was produced from the bagasse hydrolysate through Pichia stipitis BCC15191 at 30 °C, pH 5.5, after 72 h of incubation [99]. Our results deviated from Markou et al., who reported a fermentation yield is 56% by using Antrosphira platensis [100], and Ho et al., who reported a fermentation yield of 90% by using Chlorella vulgaris [101]. The reason behind the low production of bioethanol may be accredited to different microorganisms and their growth conditions.
Although we successfully entailed the valorization of D. regia pods to bioethanol, however, to make this process more viable and economically acceptable, the cost of bioethanol production must not exceed the current gasoline price. This is achievable by improving the efficiency of D. regia pods processing technologies and could be the interest of futuristic study.

4. Conclusions

Conclusively, the FTIR analysis revealed that D. regia pods contained all the essential components that make it an excellent source of lignocellulosic biomass for bioethanol production. RSM and CCD are found to be effective tools for optimizing the physicochemical parameters for the pre-treatment of D. regia biomass. The interactions of different variables significantly impacted the hydrolytic potential of D. regia pods, as demonstrated by glucose and xylose yields with 3% H2SO4 at 90 °C for 70 min. However, acidic pretreatment of D. regia pods alone is insufficient to yield an optimal amount of fermentable sugars, so enzymatic hydrolysis was carried out to enhance the yield. In the fermentation, the highest amount of yielded ethanol was 7.771% using a commercial strain of S. cerevisiae. The current findings have opened the myriads of opportunities for utilizing D. regia pods for bioethanol production, which can be opted for on a pilot or industrial scale after making it more economical and cost-effective.

Supplementary Materials

The following supporting information can be downloaded at: https://www.mdpi.com/article/10.3390/fermentation9030289/s1, Table S1: Response surface regression analysis for glucose production and the interactive effects of substrate concentration versus substrate concentration (g), time (min), Acid concentration (%), and temperature (°C); Table S2: Model fit summary for Glucose production; Table S3: Final equation of glucose production in terms of actual factors; Table S4: Response surface regression analysis for xylose production and the interactive effects of substrate concentration versus substrate concentration (g), time (min), Acid concentration (%), temperature (°C); Table S5: Model fit summary for Xylose production; Table S6: Final equation of xylose production in terms of actual factors; Table S7: Response surface regression analysis for lignin degradation and the interactive effects of substrate concentration versus substrate concentration (g), time (min), Acid concentration (%), temperature (°C); Table S8: Model fit summary for lignin degradation; Table S9: Final equation of Lignin degradation in terms of actual factors; Table S10: Glucose recovery after enzymatic hydrolysis at different time-periods.

Author Contributions

Conceptualization, Z.A. and Z.I.; Investigation, A.S.; methodology, A.S., Z.A. and Z.I.; writing—original draft preparation, A.S., Z.I. and Z.A.; writing—review and editing, Z.I. and M.M. All authors have read and agreed to the published version of the manuscript.

Funding

The authors extend their appreciation to the Deputyship for Research and Innovation, Ministry of Education in Saudi Arabia, for funding this research work (Project# INST012).

Institutional Review Board Statement

Not applicable.

Informed Consent Statement

Not applicable.

Data Availability Statement

All the data related to this study is mentioned in the manuscript.

Acknowledgments

Authors are thankful to M. Adnan (University of Florida, USA) for critical reading and improving the language of the script.

Conflicts of Interest

There is no conflict of interest among the authors.

References

  1. Dessie, W.; Luo, X.; Wang, M.; Feng, L.; Liao, Y.; Wang, Z.; Yong, Z.; Qin, Z. Current advances on waste biomass transformation into value-added products. Appl. Microbiol. Biotechnol. 2020, 104, 4757–4770. [Google Scholar] [CrossRef]
  2. Tripathi, C.; Baredar, P.; Tripathi, L. Air pollution in Delhi:Biomass energy and suitable environmental policies are sustainable pathways for health safety. Curr. Sci. 2019, 117, 1153. [Google Scholar] [CrossRef]
  3. Casabar, J.T.; Unpaprom, Y.; Ramaraj, R. Fermentation of pineapple fruit peel wastes for bioethanol production. Biomass Convers. Biorefinery 2019, 9, 761–765. [Google Scholar] [CrossRef]
  4. Pasha, M.K.; Dai, L.; Liu, D.; Guo, M.; Du, W. An overview to process design, simulation and sustainability evaluation of biodiesel production. Biotechnol. Biofuels 2021, 14, 129. [Google Scholar] [CrossRef] [PubMed]
  5. Balat, M. Global bio-fuel processing and production trends. Energy Explor. Exploit. 2007, 25, 195–218. [Google Scholar] [CrossRef]
  6. Pant, S.; Ritika; Kuila, A. Chapter 8—Pretreatment of lignocellulosic biomass for bioethanol production. In Advanced Biofuel Technologies; Tuli, D., Kasture, S., Kuila, A., Eds.; Elsevier: Amsterdam, The Netherlands, 2022; pp. 177–194. [Google Scholar] [CrossRef]
  7. Rodionova, M.V.; Poudyal, R.S.; Tiwari, I.; Voloshin, R.A.; Zharmukhamedov, S.K.; Nam, H.G.; Zayadan, B.K.; Bruce, B.D.; Hou, H.J.M.; Allakhverdiev, S.I. Biofuel production: Challenges and opportunities. Int. J. Hydrog. Energy. 2017, 42, 8450–8461. [Google Scholar] [CrossRef]
  8. Sarris, D.; Matsakas, L.; Aggelis, G.; Koutinas, A.A.; Papanikolaou, S. Aerated vs non-aerated conversions of molasses and olive mill wastewaters blends into bioethanol by Saccharomyces cerevisiae under non-aseptic conditions. Ind. Crops Prod. 2014, 56, 83–93. [Google Scholar] [CrossRef]
  9. Shah, S.H.; Raja, I.A.; Rizwan, M.; Rashid, N.; Mahmood, Q.; Shah, F.A.; Pervez, A. Potential of microalgal biodiesel production and its sustainability perspectives in Pakistan. Renew. Sust. Energ. Rev. 2018, 81, 76–92. [Google Scholar] [CrossRef]
  10. Chew, K.W.; Chia, S.R.; Show, P.L.; Ling, T.C.; Arya, S.S.; Chang, J.-S. Food waste compost as an organic nutrient source for the cultivation of Chlorella Vulgaris. Bioresour. Technol. 2018, 267, 356–362. [Google Scholar] [CrossRef]
  11. Hans, M.; Lugani, Y.; Chandel, A.K.; Rai, R.; Kumar, S. Production of first- and second-generation ethanol for use in alcohol-based hand sanitizers and disinfectants in India. Biomass Convers. Biorefinery 2021, 1–18. [Google Scholar] [CrossRef]
  12. Lin, Y.; Tanaka, S. Ethanol fermentation from biomass resources: Current state and prospects. Appl. Microbiol. Biotechnol. 2006, 69, 627–642. [Google Scholar] [CrossRef] [PubMed]
  13. Ishola, M.M.; Babapour, A.B.; Gavitar, M.N.; Brandberg, T.; Taherzadeh, M.J. Effect of high solids loading on bacterial contamination in lignocellulosic ethanol production. Bioresources 2013, 8, 4429–4439. [Google Scholar] [CrossRef] [Green Version]
  14. Surendhiran, D.; Sirajunnisa, A.R. Role of genetic engineering in bioethanol production from algae. In Bioethanol Production from Food Crops; Ray, R.C., Ramachandran, S., Eds.; Academic Press: Cambridge, MA, USA, 2019; pp. 361–381. [Google Scholar] [CrossRef]
  15. Edgardo, A.; Carolina, P.; Manuel, R.; Juanita, F.; Baeza, J. Selection of thermotolerant yeast strains Saccharomyces cerevisiae for bioethanol production. Enzyme Microb. Technol. 2008, 43, 120–123. [Google Scholar] [CrossRef]
  16. Kumar, A.; Priyadarshinee, R.; Roy, A.; Dasgupta, D.; Mandal, T. Current techniques in rice mill effluent treatment: Emerging opportunities for waste reuse and waste-to-energy conversion. Chemosphere 2016, 164, 404–412. [Google Scholar] [CrossRef] [PubMed]
  17. Broda, M.; Yelle, D.J.; Serwańska, K. Bioethanol production from lignocellulosic biomass-challenges and solutions. Molecules 2022, 27, 8717. [Google Scholar] [CrossRef]
  18. Scully, S.M.; Orlygsson, J. Recent advances in second generation ethanol production by thermophilic bacteria. Energies 2015, 8, 1–30. [Google Scholar] [CrossRef] [Green Version]
  19. McMillan, J.D. Pretreatment of lignocellulosic biomass. In Enzymatic Conversion of Biomass for Fuels Production; American Chemical Society: Washington, DC, USA, 1994; Volume 566, pp. 292–324. [Google Scholar]
  20. Esteghlalian, A.; Hashimoto, A.G.; Fenske, J.J.; Penner, M.H. Modeling and optimization of the dilute-sulfuric-acid pretreatment of corn stover, poplar and switchgrass. Bioresour. Technol. 1997, 59, 129–136. [Google Scholar] [CrossRef]
  21. Mosier, N.; Wyman, C.; Dale, B.; Elander, R.; Lee, Y.Y.; Holtzapple, M.; Ladisch, M. Features of promising technologies for pretreatment of lignocellulosic biomass. Bioresour. Technol. 2005, 96, 673–686. [Google Scholar] [CrossRef]
  22. De Oliveira Costa, A.; Silva, L.A.S.; Duarte, I.M.; Machado, M.; da Silva, G.Z.; da Silva, D.F.P.; da Costa Netto, A.P.; Rocha, D.I. Shoot proliferation and in vitro organogenesis from shoot apex and cotyledonary explants of royal poinciana (Delonix regia), an ornamental leguminous tree. Trees 2020, 34, 189–197. [Google Scholar] [CrossRef]
  23. Gilman, E.F.; Watson, D.G.; Klein, R.; Koeser, A.; Hilbert, D.; McLean, D. Delonix regia: Royal Poinciana. In The Institute of Food and Agricultural Sciences (IFAS); University of Florida: Gainesville, FL, USA, 2019. [Google Scholar]
  24. Mirahmadi, K.; Kabir, M.; Jeihanipour, A.; Karimi, K.; Taherzadeh, M. Alkaline pretreatment of spruce and birch to improve bioethanol and biogas production. Bioresources 2010, 5, 928–938. [Google Scholar]
  25. Anwar, Z.; Gulfraz, M.; Imran, M.; Asad, M.J.; Shafi, A.; Anwar, P.; Qureshi, R. Optimization of dilute acid pretreatment using response surface methodology for bioethanol production from cellulosic biomass of rice polish. Pak. J. Bot. 2012, 44, 169–176. [Google Scholar]
  26. Minitab, LLC. Minitab. Available online: https://www.minitab.com (accessed on 25 November 2022).
  27. Miller, G.L. Use of dinitrosalicylic acid reagent for determination of reducing sugar. Anal. Chem. 1959, 31, 426–428. [Google Scholar] [CrossRef]
  28. Sluiter, A.; Hames, B.; Ruiz, R.; Scarlata, C.; Sluiter, J.; Templeton, D.; Crocker, D. Determination of structural carbohydrates and lignin in biomass. Lab. Anal. Proced. 2008, 1617, 1–15. [Google Scholar]
  29. Anwar, Z.; Gulfraz, M.; Asad, M.J.; Imran, M.; Akram, Z.; Mehmood, S.; Rehman, A.; Anwar, P.; Sadiq, A. Bioethanol productions from rice polish by optimization of dilute acid pretreatment and enzymatic hydrolysis. Afr. J. Biotech. 2012, 11, 992–998. [Google Scholar]
  30. Imran, M.; Hussain, A.; Anwar, Z.; Zeeshan, N.; Yaseen, A.; Akmal, M.; Idris, M. Immobilization of fungal cellulase on calcium alginate and xerogel matrix. Waste Biomass Valorization 2020, 11, 1229–1237. [Google Scholar] [CrossRef]
  31. Ghose, T.K. Measurement of cellulase activities. Pure Appl. Chem. 1987, 59, 257–268. [Google Scholar] [CrossRef]
  32. Yu, J.; Zhang, X.; Tan, T. An novel immobilization method of Saccharomyces cerevisiae to sorghum bagasse for ethanol production. J. Biotechnol. 2007, 129, 415–420. [Google Scholar] [CrossRef]
  33. Bennett, C. Spectrophotometric acid dichromate method for the determination of ethyl alcohol. Am. J. Med. Technol. 1971, 37, 217–220. [Google Scholar]
  34. Comitre, A.L.D.; Reis, B.F. Automatic multicommutated flow system for ethanol determination in alcoholic beverages by spectrophotometry. Lab Rob. Autom. 2000, 12, 31–36. [Google Scholar] [CrossRef]
  35. Sugumaran, P.; Susan, V.P.; Ravichandran, P.; Seshadri, S. Production and characterization of activated carbon from banana empty fruit bunch and Delonix regia fruit pod. J. Sust. Energy Environ. 2012, 3, 125–132. [Google Scholar]
  36. Olugbenga, O.; James, O.; Lukman, B.; Olayinka, O.; Olusegun, O. Delonix regia seeds and pods: Characterization and its potential as a feedstock for thermochemical conversion. J. Appl. Chem. 2020, 13, 39–49. [Google Scholar]
  37. Adapa, P.; Tabil, L.; Schoenau, G. Compaction characteristics of barley, canola, oat and wheat straw. Biosyst. Eng. 2009, 104, 335–344. [Google Scholar] [CrossRef]
  38. Mani, S.; Tabil, L.G.; Sokhansanj, S. Effects of compressive force, particle size and moisture content on mechanical properties of biomass pellets from grasses. Biomass Bioenerg. 2006, 30, 648–654. [Google Scholar] [CrossRef]
  39. Jiménez, L.; Pérez, I.; de la Torre, M.J.; López, F.; Ariza, J. Use of formaldehyde for making wheat straw cellulose pulp. Bioresour. Technol. 2000, 72, 283–288. [Google Scholar] [CrossRef]
  40. Ghaly, A.E.; Al-Taweel, A. Physical and thermochemical properties of cereal straws. Energy Sources 1990, 12, 131–145. [Google Scholar] [CrossRef]
  41. Liang, C.; Das, K.C.; McClendon, R.W. The influence of temperature and moisture contents regimes on the aerobic microbial activity of a biosolids composting blend. Bioresour. Technol. 2003, 86, 131–137. [Google Scholar] [CrossRef]
  42. Pommier, S.; Chenu, D.; Quintard, M.; Lefebvre, X. Modelling of moisture-dependent aerobic degradation of solid waste. Waste Manag. 2008, 28, 1188–1200. [Google Scholar] [CrossRef] [PubMed]
  43. Asadieraghi, M.; Wan Daud, W.M.A. Characterization of lignocellulosic biomass thermal degradation and physiochemical structure: Effects of demineralization by diverse acid solutions. Energy Convers. Manag. 2014, 82, 71–82. [Google Scholar] [CrossRef]
  44. Zhuang, J.; Li, M.; Pu, Y.; Ragauskas, A.J.; Yoo, C.G. Observation of potential contaminants in processed biomass using fourier transform infrared spectroscopy. Appl. Sci. 2020, 10, 4345. [Google Scholar] [CrossRef]
  45. Tucker, M.P.; Nguyen, Q.A.; Eddy, F.P.; Kadam, K.L.; Gedvilas, L.M.; Webb, J.D. Fourier transform infrared quantitative analysis of sugars and lignin in pretreated softwood solid residues. Appl. Biochem. Biotechnol. 2001, 91, 51–61. [Google Scholar] [CrossRef]
  46. Awoyale, A.A.; Lokhat, D. Experimental determination of the effects of pretreatment on selected Nigerian lignocellulosic biomass in bioethanol production. Sci. Rep. 2021, 11, 557. [Google Scholar] [CrossRef]
  47. Li, M.; Han, G.; Song, Y.; Jiang, W.; Zhang, Y. Structure, composition, and thermal properties of cellulose fibers from pueraria lobata treated with a combination of steam explosion and laccase mediator system. BioResources 2016, 11, 6854–6866. [Google Scholar] [CrossRef] [Green Version]
  48. Onoji, S.E.; Iyuke, S.E.; Igbafe, A.I.; Nkazi, D.B. Rubber seed oil: A potential renewable source of biodiesel for sustainable development in sub-Saharan Africa. Energy Convers. Manag. 2016, 110, 125–134. [Google Scholar] [CrossRef]
  49. Oh, S.Y.; Yoo, D.I.; Shin, Y.; Kim, H.C.; Kim, H.Y.; Chung, Y.S.; Park, W.H.; Youk, J.H. Crystalline structure analysis of cellulose treated with sodium hydroxide and carbon dioxide by means of X-ray diffraction and FTIR spectroscopy. Carbohydr. Res. 2005, 340, 2376–2391. [Google Scholar] [CrossRef] [PubMed]
  50. Boukir, A.; Fellak, S.; Doumenq, P. Structural characterization of Argania spinosa Moroccan wooden artifacts during natural degradation progress using infrared spectroscopy (ATR-FTIR) and X-Ray diffraction (XRD). Heliyon 2019, 5, e02477. [Google Scholar] [CrossRef] [PubMed] [Green Version]
  51. Bodirlau, R.; Teaca, C. Fourier transform infrared spectroscopy and thermal analysis of lignocellulose fillers treated with organic anhydrides. Rom. J. Phys. 2009, 54, 93–104. [Google Scholar]
  52. Sun, S.-L.; Wen, J.-L.; Ma, M.-G.; Sun, R.-C.; Jones, G.L. Structural features and antioxidant activities of degraded lignins from steam exploded bamboo stem. Ind. Crops Prod. 2014, 56, 128–136. [Google Scholar] [CrossRef]
  53. Colom, X.; Carrillo, F.; Nogués, F.; Garriga, P. Structural analysis of photodegraded wood by means of FTIR spectroscopy. Polym. Degrad. Stab. 2003, 80, 543–549. [Google Scholar] [CrossRef]
  54. Ezhumalai, S.; Thangavelu, V. Kinetic and optimization studies on the bioconversion of lignocellulosic material into ethanol. Bioresources 2010, 5, 1879–1894. [Google Scholar]
  55. Akkaravathasinp, S.; Narataruksa, P.; Prapainainar, C. Optimization of semi-batch reactive distillation using response surface method: Case study of esterification of acetic acid with methanol in a process simulation. Appl. Sci. Eng. Prog. 2019, 12, 209–215. [Google Scholar] [CrossRef]
  56. Khan, Y.; Munir, H.; Anwar, Z. Optimization of process variables for enhanced production of urease by indigenous Aspergillus niger strains through response surface methodology. Biocatal. Agric. Biotechnol. 2019, 20, 101202. [Google Scholar] [CrossRef]
  57. Nadeem, F.; Mehmood, T.; Anwar, Z.; Saeed, S.; Bilal, M.; Meer, B. Optimization of bioprocess steps through response surface methodology for the production of immobilized lipase using Chaetomium globosum via solid-state fermentation. Biomass Convers. Biorefinery 2021, 1–12. [Google Scholar] [CrossRef]
  58. Chawla, S.K.; Goyal, D. Optimization of pre-treatment using RSM on wheat straw and production of Lactic scid using thermotolerant, inhibitor tolerant and xylose utilizing Bacillus sonorenesis strain DGS15. Res. Sq. 2022. preprint. [Google Scholar] [CrossRef]
  59. Ifeanyichukwu, E. Bioethanol Production: An Overview. In Bioethanol Technologies; Freddie, I., Ed.; IntechOpen: Rijeka, Croatia, 2020; Chapter 1. [Google Scholar] [CrossRef]
  60. Expert, D. Version 7.0.0. Stat-Ease, Design Expert Inc., Minneapolis, USA. Available online: https://www.statease.com/software/design-expert/ (accessed on 12 November 2022).
  61. Chatkaew, C.; Panakkal, E.J.; Rodiahwati, W.; Kirdponpattara, S.; Chuetor, S.; Sriariyanun, M.; Cheenkachorn, K. Effect of sodium hydroxide pretreatment on released sugar yields from pomelo peels for biofuel production. E3S Web Conf. 2021, 302, 02015. [Google Scholar] [CrossRef]
  62. Gao, X.; Kumar, R.; Singh, S.; Simmons, B.A.; Balan, V.; Dale, B.E.; Wyman, C.E. Comparison of enzymatic reactivity of corn stover solids prepared by dilute acid, AFEX™, and ionic liquid pretreatments. Biotechnol. Biofuels 2014, 7, 71. [Google Scholar] [CrossRef] [PubMed] [Green Version]
  63. Kshirsagar, S.D.; Waghmare, P.R.; Loni, P.C.; Patil, S.A.; Govindwar, S.P. Dilute acid pretreatment of rice straw, structural characterization and optimization of enzymatic hydrolysis conditions by response surface methodology. RSC Adv. 2015, 5, 46525–46533. [Google Scholar] [CrossRef]
  64. Galbe, M.; Zacchi, G. A review of the production of ethanol from softwood. Appl. Microbiol. Biotechnol. 2002, 59, 618–628. [Google Scholar] [CrossRef]
  65. Brodeur, G.; Yau, E.; Badal, K.; Collier, J.; Ramachandran, K.B.; Ramakrishnan, S. Chemical and physicochemical pretreatment of lignocellulosic biomass: A review. Enzyme Res. 2011, 2011, 787532. [Google Scholar] [CrossRef] [PubMed] [Green Version]
  66. Zheng, Y.; Zhao, J.; Xu, F.; Li, Y. Pretreatment of lignocellulosic biomass for enhanced biogas production. Prog. Energy Combust. Sci. 2014, 42, 35–53. [Google Scholar] [CrossRef]
  67. Rasmussen, H.; Sørensen, H.R.; Meyer, A.S. Formation of degradation compounds from lignocellulosic biomass in the biorefinery: Sugar reaction mechanisms. Carbohydr. Res. 2014, 385, 45–57. [Google Scholar] [CrossRef]
  68. Tang, J.; Chen, K.; Huang, F.; Xu, J.; Li, J. Characterization of the pretreatment liquor of biomass from the perennial grass, Eulaliopsis binata, for the production of dissolving pulp. Bioresour. Technol. 2013, 129, 548–552. [Google Scholar] [CrossRef] [PubMed]
  69. Nair, R.B.; Lundin, M.; Lennartsson, P.R.; Taherzadeh, M.J. Optimizing dilute phosphoric acid pretreatment of wheat straw in the laboratory and in a demonstration plant for ethanol and edible fungal biomass production using Neurospora intermedia. J. Chem. Technol. Biotechnol. 2017, 92, 1256–1265. [Google Scholar] [CrossRef] [Green Version]
  70. Parveen, H.; Tewari, L.; Pradhan, D.; Chaudhary, P. Comparative study of diverse pretreatment approaches to degrade lignin from Bambusa balcooa. BioResources 2022, 17, 5578–5599. [Google Scholar] [CrossRef]
  71. Kadivar, M.; Gauss, C.; Stanislas, T.T.; Ahrar, A.J.; Charca, S.; Savastano, H. Effect of bamboo species and pre-treatment method on physical and mechanical properties of bamboo processed by flattening-densification. Mater. Chem. Phys. 2022, 291, 126746. [Google Scholar] [CrossRef]
  72. Morais, W.G.; Pacheco, T.F.; Corrêa, P.S.; Martins, A.A.; Mata, T.M.; Caetano, N.S. Acid pretreatment of sugarcane biomass to obtain hemicellulosic hydrolisate rich in fermentable sugar. Energy Rep. 2020, 6, 18–23. [Google Scholar] [CrossRef]
  73. Sritrakul, N.; Nitisinprasert, S.; Keawsompong, S. Evaluation of dilute acid pretreatment for bioethanol fermentation from sugarcane bagasse pith. Agric. Nat. Resour. 2017, 51, 512–519. [Google Scholar] [CrossRef]
  74. Aboagye, D.; Banadda, N.; Kambugu, R.; Seay, J.; Kiggundu, N.; Zziwa, A.; Kabenge, I. Glucose recovery from different corn stover fractions using dilute acid and alkaline pretreatment techniques. J. Ecol. Environ. 2017, 41, 26. [Google Scholar] [CrossRef] [Green Version]
  75. Li, J.; Zhou, P.; Lv, X.; Xiao, W.; Gong, Y.; Lin, J.; Liu, Z. Use of sugarcane bagasse with different particle sizes to determine the relationship between physical properties and enzymatic hydrolysis. BioResources 2016, 11, 4745–4757. [Google Scholar] [CrossRef]
  76. Mardawati, E.; Putri, A.V.; Yuliana, T.; Rahimah, S.; Nurjanah, S.; Hanidah, I. Effects of substrate concentration on bioethanol production from oil palm empty fruit bunches with simultaneous saccharification and fermentation (SSF). IOP Conf. Ser. Earth Environ. Sci. 2019, 230, 12079. [Google Scholar] [CrossRef]
  77. Schwald, W.; Breuil, C.; Brownell, H.H.; Chan, M.; Saddler, J.M. Assessment of pretreatment conditions to obtain fast complete hydrolysis on high substrate concentrations. Appl. Biochem. Biotechnol. 1989, 20, 29–44. [Google Scholar] [CrossRef]
  78. Aliberti, A.; Ventorino, V.; Robertiello, A.; Galasso, M.; Blaiotta, G.; Comite, E.; Faraco, V.; Pepe, O. Effect of cellulase, substrate concentrations, and configuration processes on cellulosic ethanol production from pretreated Arundo donax. BioResources 2017, 12, 5321–5342. [Google Scholar] [CrossRef] [Green Version]
  79. Hendriks, A.; Zeeman, G. Pretreatments to enhance the digestibility of lignocellulosic biomass. Bioresour. Technol. 2009, 100, 10–18. [Google Scholar] [CrossRef]
  80. Roslan, A.; Yee, P.; Shah, U.; Aziz, S.; Hassan, M. Production of bioethanol from rice straw using cellulase by local Aspergillus sp. Int. J. Agric. Res. 2011, 6, 188–193. [Google Scholar] [CrossRef] [Green Version]
  81. Satimanont, S.; Luengnaruemitchai, A.; Wongkasemjit, S. Effect of temperature and time on dilute acid pretreatment of corn cobs. Int. J. Chem. Biol. Eng. 2012, 6, 333–337. [Google Scholar]
  82. Cui, Z.; Wan, C.; Shi, J.; Sykes, R.W.; Li, Y. Enzymatic digestibility of corn stover fractions in response to fungal pretreatment. Ind. Eng. Chem. Res. 2012, 51, 7153–7159. [Google Scholar] [CrossRef]
  83. De Carvalho, D.M.; Colodette, J.L. Comparative study of acid hydrolysis of lignin and polysaccharides in biomasses. BioResources 2017, 12, 6907–6923. [Google Scholar] [CrossRef]
  84. Lee, J.W.; Gwak, K.S.; Park, J.Y.; Park, M.J.; Choi, D.H.; Kwon, M.; Choi, I.G. Biological pretreatment of softwood Pinus densiflora by three white rot fungi. J. Microbiol. 2007, 45, 485–491. [Google Scholar]
  85. Yan, X.; Wang, Z.; Zhang, K.; Si, M.; Liu, M.; Chai, L.; Liu, X.; Shi, Y. Bacteria-enhanced dilute acid pretreatment of lignocellulosic biomass. Bioresour. Technol. 2017, 245, 419–425. [Google Scholar] [CrossRef] [PubMed]
  86. Thite, V.S.; Nerurkar, A.S. Valorization of sugarcane bagasse by chemical pretreatment and enzyme mediated deconstruction. Sci. Rep. 2019, 9, 15904. [Google Scholar] [CrossRef] [Green Version]
  87. Sannigrahi, P.; Kim, D.H.; Jung, S.; Ragauskas, A. Pseudo-lignin and pretreatment chemistry. Energy Environ. Sci. 2011, 4, 1306–1310. [Google Scholar] [CrossRef]
  88. Zhang, X.; Yuan, Z.; Wang, T.; Zhang, Q.; Ma, L. Effect of the temperature on the dissolution of corn straw in ethanol solution. RSC Adv. 2016, 6, 102306–102314. [Google Scholar] [CrossRef]
  89. Soares, I.B.; Mendes, K.C.S.; Benachour, M.; Abreu, C.A.M. Evaluation of the effects of operational parameters in the pretreatment of sugarcane bagasse with diluted sulfuric acid using analysis of variance. Chem. Eng. Commun. 2017, 204, 1369–1390. [Google Scholar] [CrossRef]
  90. Patri, A.S.; McAlister, L.; Cai, C.M.; Kumar, R.; Wyman, C.E. CELF significantly reduces milling requirements and improves soaking effectiveness for maximum sugar recovery of Alamo switchgrass over dilute sulfuric acid pretreatment. Biotechnol. Biofuels 2019, 12, 177. [Google Scholar] [CrossRef]
  91. McIntosh, S.; Vancov, T. Optimisation of dilute alkaline pretreatment for enzymatic saccharification of wheat straw. Biomass Bioenerg. 2011, 35, 3094–3103. [Google Scholar] [CrossRef]
  92. Gao, J.; Anderson, D.; Levie, B. Saccharification of recalcitrant biomass and integration options for lignocellulosic sugars from Catchlight Energy’s sugar process (CLE Sugar). Biotechnol. Biofuels 2013, 6, 10. [Google Scholar] [CrossRef] [Green Version]
  93. Karmakar, B.; Samanta, S.; Halder, G. Delonix regia heterogeneous catalyzed two-step biodiesel production from Pongamia pinnata oil using methanol and 2-propanol. J. Clean. Prod. 2020, 255, 120313. [Google Scholar] [CrossRef]
  94. Saha, B.C.; Nichols, N.N.; Qureshi, N.; Cotta, M.A. Comparison of separate hydrolysis and fermentation and simultaneous saccharification and fermentation processes for ethanol production from wheat straw by recombinant Escherichia coli strain FBR5. Appl. Microbiol. Biotechnol. 2011, 92, 865–874. [Google Scholar] [CrossRef]
  95. Palmarola-Adrados, B.; Chotěborská, P.; Galbe, M.; Zacchi, G. Ethanol production from non-starch carbohydrates of wheat bran. Bioresour. Technol. 2005, 96, 843–850. [Google Scholar] [CrossRef] [PubMed]
  96. Favaro, L.; Basaglia, M.; van Zyl, W.H.; Casella, S. Using an efficient fermenting yeast enhances ethanol production from unfiltered wheat bran hydrolysates. Appl. Energy 2013, 102, 170–178. [Google Scholar] [CrossRef]
  97. Siqueira, P.F.; Karp, S.G.; Carvalho, J.C.; Sturm, W.; Rodríguez-León, J.A.; Tholozan, J.-L.; Singhania, R.R.; Pandey, A.; Soccol, C.R. Production of bio-ethanol from soybean molasses by Saccharomyces cerevisiae at laboratory, pilot and industrial scales. Bioresour. Technol. 2008, 99, 8156–8163. [Google Scholar] [CrossRef] [PubMed]
  98. Nimbkar, N.; Ghanekar, A.; Joseph, R. Development of improved cultivars and management practices in sweet sorghum as a source for ethanol, Technology and applications for alternative uses of sorghum. In Proceedings of the National Seminar, Parbhani, India, 2–3 February 1987; Marathwada Agricultural University: Maharashtra, India, 1987; pp. 180–188. [Google Scholar]
  99. Buaban, B.; Inoue, H.; Yano, S.; Tanapongpipat, S.; Ruanglek, V.; Champreda, V.; Pichyangkura, R.; Rengpipat, S.; Eurwilaichitr, L. Bioethanol production from ball milled bagasse using an on-site produced fungal enzyme cocktail and xylose-fermenting Pichia Stipitis. J. Biosci. Bioeng. 2010, 110, 18–25. [Google Scholar] [CrossRef] [PubMed]
  100. Markou, G.; Angelidaki, I.; Nerantzis, E.; Georgakakis, D. Bioethanol production by carbohydrate-enriched biomass of Arthrospira (Spirulina) platensis. Energies 2013, 6, 3937–3950. [Google Scholar] [CrossRef]
  101. Ho, S.-H.; Huang, S.-W.; Chen, C.-Y.; Hasunuma, T.; Kondo, A.; Chang, J.-S. Bioethanol production using carbohydrate-rich microalgae biomass as feedstock. Bioresour. Technol. 2013, 135, 191–198. [Google Scholar] [CrossRef] [PubMed]
Figure 1. Fourier-transform infrared spectroscopy spectrum of D. regia pods.
Fermentation 09 00289 g001
Figure 2. A 3D response surface plots for optimizing the interactive effects of temperature and acid concentration (A); temperature and time (B); acid concentration and time (C); temperature and substrate amount (D); acid concentration and substrate amount (E); and time and substrate amount (F) on glucose production.
Fermentation 09 00289 g002
Figure 3. A 3D response surface plots for optimizing the interactive effects of temperature and acid concentration (A); temperature and time (B); acid concentration and time (C); temperature and substrate amount (D); acid concentration and substrate amount (E); and time and substrate amount (F) on xylose production.
Fermentation 09 00289 g003
Figure 4. A 3D response surface plots for optimizing the interactive effects of temperature and acid concentration (A); temperature and time (B); acid concentration and time (C); temperature and substrate amount (D); acid concentration and substrate amount (E); and time and substrate amount (F) on delignification.
Fermentation 09 00289 g004
Figure 5. Glucose, xylose, and insoluble lignin were determined in 30 different trials.
Fermentation 09 00289 g005
Figure 6. Glucose concentration (mg·mL−1) yielded after the different time periods of enzymatic hydrolysis (A); and ethanol production (%) at different time-period (h) of fermentation (B). The graphs used the mean values of three replicates.
Fermentation 09 00289 g006
Table 1. Fourier transform infrared (FTIR) band assignment of D. regia pods.
Sr. No.Wave Number (cm−1)Functional GroupsBond
13276.53AlcoholO-H
22915.78AlkaneC-H
32192.24AlkynesC≡C
42135.55AlkynesC≡C
52070.01AlkynesC≡C
61935.93NitrilesC≡N
71590.96AlkenesC=C
81314.96CarbonylC=O
91236.79AminesN-H and C=O (Hemicellulose)
101121.28SulfoxideS=O
111029.29HalogenC-F, C-H (guaiacyl unit of lignin) and C-O (primary alcohol and cellulose)
Table 2. Coded and un-coded values of the variables for Box-Behnken Design.
Sr. NoVariables Un-Coded Values
1Amount of substrate (g)0.020.040.10.160.22
2Acid (%)0.0250.51.7534.25
3Temperature (°C)45607590100
4Time (minutes)1020457090
  Coded values
  −α−10+1
Table 3. Effects of experimental variables (substrate amount, time, acid concentration, and temperature) on the yield of glucose, xylose, and insoluble lignin.
Trial No.Substrate (g)Time (min)Acid conc. (%)Temperature (°C)Glucose
(mg·mL−1)
Xylose
(mg·mL−1)
Insoluble Lignin
(%)
10.16200.5900.1300.02224.768
20.16703.0900.2960.47717.783
30.04200.5900.1630.03313.212
40.16703.0900.0830.14316.783
50.16203.0600.0980.08625.269
60.16700.5600.1320.05920.096
70.04200.5600.1720.02114.485
80.16703.0600.1060.08416.792
90.04703.0600.0940.18842.291
100.10451.75750.2760.02810.094
110.04203.0600.1000.01317.185
120.16200.5600.1530.02211.467
130.10451.75450.09350.01149.292
140.22451.75750.09560.0338.271
150.10101.75750.1040.05833.261
160.10454.25750.09350.03934.231
170.10451.75750.1080.02318.184
180.02451.75750.1340.126.291
190.10951.75750.1020.0243.91
200.16203.0900.1020.0238.849
210.16700.5900.0770.126.292
220.16203.0900.1190.24237.292
230.10451.751000.1270.0996.246
240.10450.25750.1190.0167.332
250.10703.0900.0980.0335.651
260.16700.5600.1290.00951.192
270.10451.751000.0760.00386.192
280.10701.75750.1020.03637.242
290.04700.5600.2120.02249.209
300.16700.5600.0830.0018.207
Disclaimer/Publisher’s Note: The statements, opinions and data contained in all publications are solely those of the individual author(s) and contributor(s) and not of MDPI and/or the editor(s). MDPI and/or the editor(s) disclaim responsibility for any injury to people or property resulting from any ideas, methods, instructions or products referred to in the content.

