Article

Anaerobic Co-Digestion of Agricultural Residues Produced in Southern and Northern Greece

1
Department of Environmental Engineering, University of Patras, 2 Seferi Str, 30100 Agrinio, Greece
2
Department of Chemical Engineering, University of Patras, 1 Karatheodori Str, University Campus-Rio, 26504 Patras, Greece
3
Department of Civil Engineering, University of Patras, University Campus-Rio, 26504 Patras, Greece
4
Biomass Energy and Environmental Engineering Research Center, Beijing University of Chemical Technology, Beijing 100029, China
*
Author to whom correspondence should be addressed.
Fermentation 2023, 9(2), 131; https://doi.org/10.3390/fermentation9020131
Submission received: 23 December 2022 / Revised: 19 January 2023 / Accepted: 27 January 2023 / Published: 29 January 2023

Abstract

:
In Greece biomass is often being disposed of uncontrollably, resulting in significant environmental impacts. The aim of this study is the single-stage anaerobic co-digestion assessment, valorizing Northern and Southern Greece mixtures, resulting from previous literature reviews, experimental designs, and biochemical methane potential (BMP) assays. Regarding the methane yield maximization, in Northern Greece, the most suitable mixture was 10% corn silage, 80% cattle manure, and 10% malt; while in Southern Greece it was 10% corn silage, 57% cattle manure, 23% orange peels, and 10% olive pomace for fall/winter season. The hydraulic retention time (HRT) was set at 20 d and an initial organic loading rate (OLR) of 2 g COD/(L·d) was applied, with a view to gradually increase it. However, volatile fatty acids accumulation was observed, which led to OLR reduction to 1.5 g COD/(L·d) for both experiments. The Northern Greece reactor operated successfully for OLR 1.5–5 g COD/(L·d), while further increase led to system failure. On the other hand, the reactor of the Southern Greece mixture operated successfully at OLR 1.5–2 g COD/(L·d), but further operation indicated inadequacy, probably due to inhibitor (such as limonene) accumulation. Mixtures consisting of corn silage, cattle manure, and malt can be successfully valorized at high OLR. However, further investigation for mixtures with orange peels is suggested due to the presence of inhibitors.

1. Introduction

Renewable energy resources (RES) are considered clean energy resources and are very significant due to their environmental-friendly nature [1]. RES focuses mainly on limiting greenhouse gas emissions, diversifying the energy supply, and reducing the dependence on unreliable and volatile fossil fuel markets [2]. In this view, biomass is a renewable source of bioenergy and its utilization via thermal or biological processes establishes it as one of the most essential contributors to the global energy supply [3]. Biomass is defined as the biodegradable fraction of products, wastes, and residues originating from agriculture (including plant and livestock), forestry, and related industries, including fisheries and aquaculture, as well as the biodegradable fraction of industrial, and household waste [2,4]. Biomass is also considered CO2-neutral. When biomass is burned to produce energy, it does not contribute to CO2 emissions because it is sourced from near-term fixation via photosynthesis [2,5].
In 2021, 22% of the energy consumed in the EU was generated from RES. From 2020 to 2021 the share of renewable energy in the EU grew by only 0.1% (from 22.1% to 22.2%) [6]. It should be noted that the lower energy demand in 2020 was due to the COVID-19 pandemic and subsequently the growth of RES in 2021 remained constant. The COVID-19 pandemic has struck renewable energy manufacturing facilities, supply chains, and companies and slowed down the transition to renewables [7]. However, in 2021, renewable consumption was more than 13 Mtoe, which is the highest annual increase since 2012 [6]. In order to mitigate climate change, reduce the emission of air pollutants and improve energy security, the EU had set the goal of ensuring that 20% of its gross final energy consumption came from renewable sources by 2020, which will increase to 32% by 2030 [8,9]. Furthermore, the European Commission proposed an amendment to the Renewable Energy Directive with a more ambitious target of 40% by 2030, to pave the way for climate neutrality by 2050 [10].
Due to its climatic and geomorphological characteristics, Greece has high prospects for RES development. Since 2010, when the Greek Parliament implemented Directive 2001/77/EC to the Greek Constitution, significant progress has been observed. However, the contribution of biomass to the total RES power installed is very low mainly due to the complex institutional framework and the negative reactions of the local community [2]. Even nowadays, biomass is being disposed of uncontrollably, often followed by incineration in the fields, resulting in significant environmental impacts [11].
As mentioned above, thermochemical conversion or biological processes are two pathways for renewable energy production through biomass utilization. According to the literature, anaerobic digestion (AD) is a method whereby organic-biodegradable waste (e.g., crop residues, macroalgae, livestock waste, etc.) is converted into valuable energy while decreasing its volume [4,12]. The decomposition of organic matter includes four main stages: (i) hydrolysis, (ii) acidogenesis, (iii) acetogenesis, and (iv) methanogenesis [13,14]. A consortium of microorganisms and specifically fermentative bacteria, hydrogen-producing acetogenic bacteria, hydrogen-consuming acetogenic bacteria, carbon dioxide-reducing methanogens, and acetoclastic methanogens are responsible for the performance of the process [14]. These anaerobic microorganisms break down the organic substances and two distinct output streams are produced: biogas and digestate, which can usually be used as soil additive [4,14].
Even though AD technology has been performed for large-scale applications, volatile fatty acids (VFAs) accumulation, process instability, and low waste-to-energy conversion efficiency are some examples of operational barriers [15]. The efficiency of the process can be affected by several parameters such as pH, humidity (wet or dry AD), the use of one- or two-stage systems, temperature, microbial communities of the inoculum, pre-treatment, hydraulic retention time (HRT), organic loading rate (OLR), the characteristics of the substrates and the co-digestion mixture [14,16,17,18].
HRT is considered one of the most significant parameters affecting the performance of AD. Reduction of HRT is able to increase methane production, and thus economic efficiency [17,19]. However, changes in HRT may also affect the microbiome community structure and thus the microbial balance within the digester. More specifically, low HRT may lead to an imbalance between the fast-growing microorganisms (hydrolytic and acetogenic bacteria) and slow-growing methanogens, and therefore, problems such as insufficient utilization of hydrolysis-acidogenesis products and/or washout effect of methanogens may occur. Hence, the correlations between microbial community structure and operational conditions are of great importance [19].
Anaerobic co-digestion is a well-established technology that offers various advantages. One of them is the dilution of toxic compounds such as ammonia that usually tend to inhibit the efficient operation of the process. In addition, the simultaneous digestion of two or more substrates provides improved nutrient balance to the system and reduces the cost of managing each waste stream separately via equipment sharing [3,16]. For example, when an easily biodegradable substrate is digested, VFAs accumulation may occur, resulting in inhibition of the methanogenesis and pH drop. In order to mitigate this inhibition, manure is usually proposed for co-digestion due to its high alkalinity [20]. Through the optimization of the process, concerning the mixture ratios, the synergistic effects during co-digestion can be enhanced [21].
The AD process has been widely studied in both batch and continuous stirred tank reactor (CSTR) systems for the evaluation of the process performance during the examination of some of the aforementioned parameters. Each mode is characterized by several advantages and disadvantages. Concerning batch tests, they are usually characterized by simple operation, low working volume, and limited experimentation time [22], in contrast to continuous operation. For this reason, several researchers usually conduct batch tests (derived for example by a factorial experimental design), and then further investigate the best results in CSTR systems [23]. For example, regarding the temperature range, solid content, and inoculum origin investigation during olive mill wastewater valorization, several batch biochemical methane potential (BMP) assays were preceded [24] prior to the high-rate continuous systems tests [25,26]. Some parameters (for instance HRT) or even two-stage configurations cannot be investigated in batch mode; however, both modes are important for the investigation of the process variables in order to maximize the biogas efficiency and the overall yield of the process. Moving from the lab to a pilot or an industrial scale, according to the authors’ knowledge, the utilized reactors are principally operating in a continuous mode.
The aim of this study was to valorize the main abundant biomass derived from agricultural residues, which can be found in Greece. Optimum mixtures were tested in continuous reactors concerning Northern Greece (whole year production) and Southern Greece fall/winter season that resulted from the previous literature reviews, experimental designs, and BMP assays performed by Aravani et al. [3]. The current study focused on anaerobic co-digestion conducted in lab-scale experiments in CSTRs, in order to maximize the valorization potential of the aforementioned mixtures. A gradual increase in OLR was implemented in order to achieve the most favorable valorization rate of the mixture, while after maximizing the OLR, the HRT was reduced (where it was possible) to assess the system’s performance and operation limits.

2. Materials and Methods

2.1. Anaerobic Digestion Feedstock and Inoculum

In Northern Greece, suitable substrates for AD throughout a year were those of corn silage, cattle manure, and malt (the main by-product of breweries), while in Southern Greece the most suitable substrates for AD during the fall/winter period were corn silage, cattle manure, orange peels, and olive pomace. A previous extensive review by Aravani et al. [27] revealed the most promising agricultural, agro-industrial, and animal residues in Greece in terms of biogas production through AD. More details about the samples’ characteristics are described by Aravani et al. [28]. The raw residues used in the current study were collected from local plants in the region of Western Greece and stored at −18 °C until their use throughout the experimental period, in order to maintain their physicochemical characteristics constant.
Anaerobic sludge, obtained from an active biogas plant in Messolonghi (Western Greece) that treats different kinds of waste such as animal manure, olive mill waste, and corn silage [3], was used as inoculum for the bioreactor experiments. Concerning the characteristics of the anaerobic inoculum, total solids (TS) were measured at 73.5 ± 3.3 g/L, 64.3% of which were volatile solids (VS).

2.2. Experimental Configuration

Two mesophilic (37 ± 0.5 °C) double-walled CSTRs constructed of stainless steel (INOX316), cylindrical in shape, with an operating volume of 750 mL were used for the AD experiments. Hot water recirculation by an aquarium pump ensured stable temperature conditions. Continuous agitation was controlled by a geared motor drive installed on the top of the reactors. Tsigkou et al. [16] and Dareioti et al. [29] explain in detail the configuration of the reactor. A precise plastic syringe of 50 mL volume was used for feeding the methanogenic reactor manually every 6 h, 4 times per day from daily feedstock stored in the refrigerator (4 °C).

2.3. Measurement of Biogas Production

An automated tailor-made device consisting of an engine oil-filled U-tube, an electron valve, and a counter was used to measure biogas production. The number of constant oil volume displacements represents the produced biogas [16,25].

2.4. Start-Up of the CSTR Reactors

The reactors were filled up with anaerobic inoculum and remained without feeding addition, in order to acclimatize the microorganisms to the current system conditions. Afterward, the Northern Greece reactor was fed with a mixture of 10% corn silage, 80% cattle manure, and 10% malt, while the Southern Greece fall/winter reactor was fed with 10% corn silage, 57% cattle manure, 23% orange peels, and 10% olive pomace, as described by Aravani et al. 2022 [3].

2.5. Tested Runs

The initial OLR of the reactors was set at 2 g COD/(L·d). Due to VFAs accumulation at the aforementioned OLR value, experiments with reduced OLR (1.5 g COD/(L·d)) followed. After reaching a steady state in terms of biogas production, the OLR was further increased to assess the system’s performance and operation limits. In order to achieve the desired OLR for each run, dilution with tap water was performed while the HRT remained constant at 20 d [30]. At the maximum OLR (feedstock with no dilution), the HRT was reduced. Table 1 presents the operating conditions of the AD systems. When VFAs accumulation and pH drop were observed, the systems remained without feeding for 1–2 days.

2.6. Analytical Methods

Physicochemical parameters concerning the mixtures and/or the bioreactor’s effluent such as pH, alkalinity, TS and VS, total and volatile suspended solids (TSS and VSS), total and dissolved chemical oxygen demand (t-COD, d-COD), were measured according to the “Standard Methods for the Examination of Water and Wastewater” [31]. Total and dissolved carbohydrates were determined according to Joseffson (1983) [32]. In the case of particulate COD and carbohydrates estimation, the soluble content was subtracted from the total content, for each parameter. The soluble phenolic compounds’ concentration was determined spectrophotometrically using the Folin–Ciocalteu method [33]. The biogas composition analysis was conducted using a gas chromatograph (Agilent Technologies 7890A) with a thermal conductivity detector (TCD). VFAs and ethanol determination were performed on acidified samples (with H2SO4 (20%)) using gas chromatography (Agilent Technologies, 7890A) equipped with a capillary column (DBFFAP, 30 m in length, 0.25 mm I.D. and 0.25 mm film), and a flame ionization detector (FID). The analyses were performed in duplicate, except for biogas composition. Tsigkou et al. [16,34] describe in detail the biogas and VFAs quantification methods.

3. Results and Discussion

3.1. Northern Greece

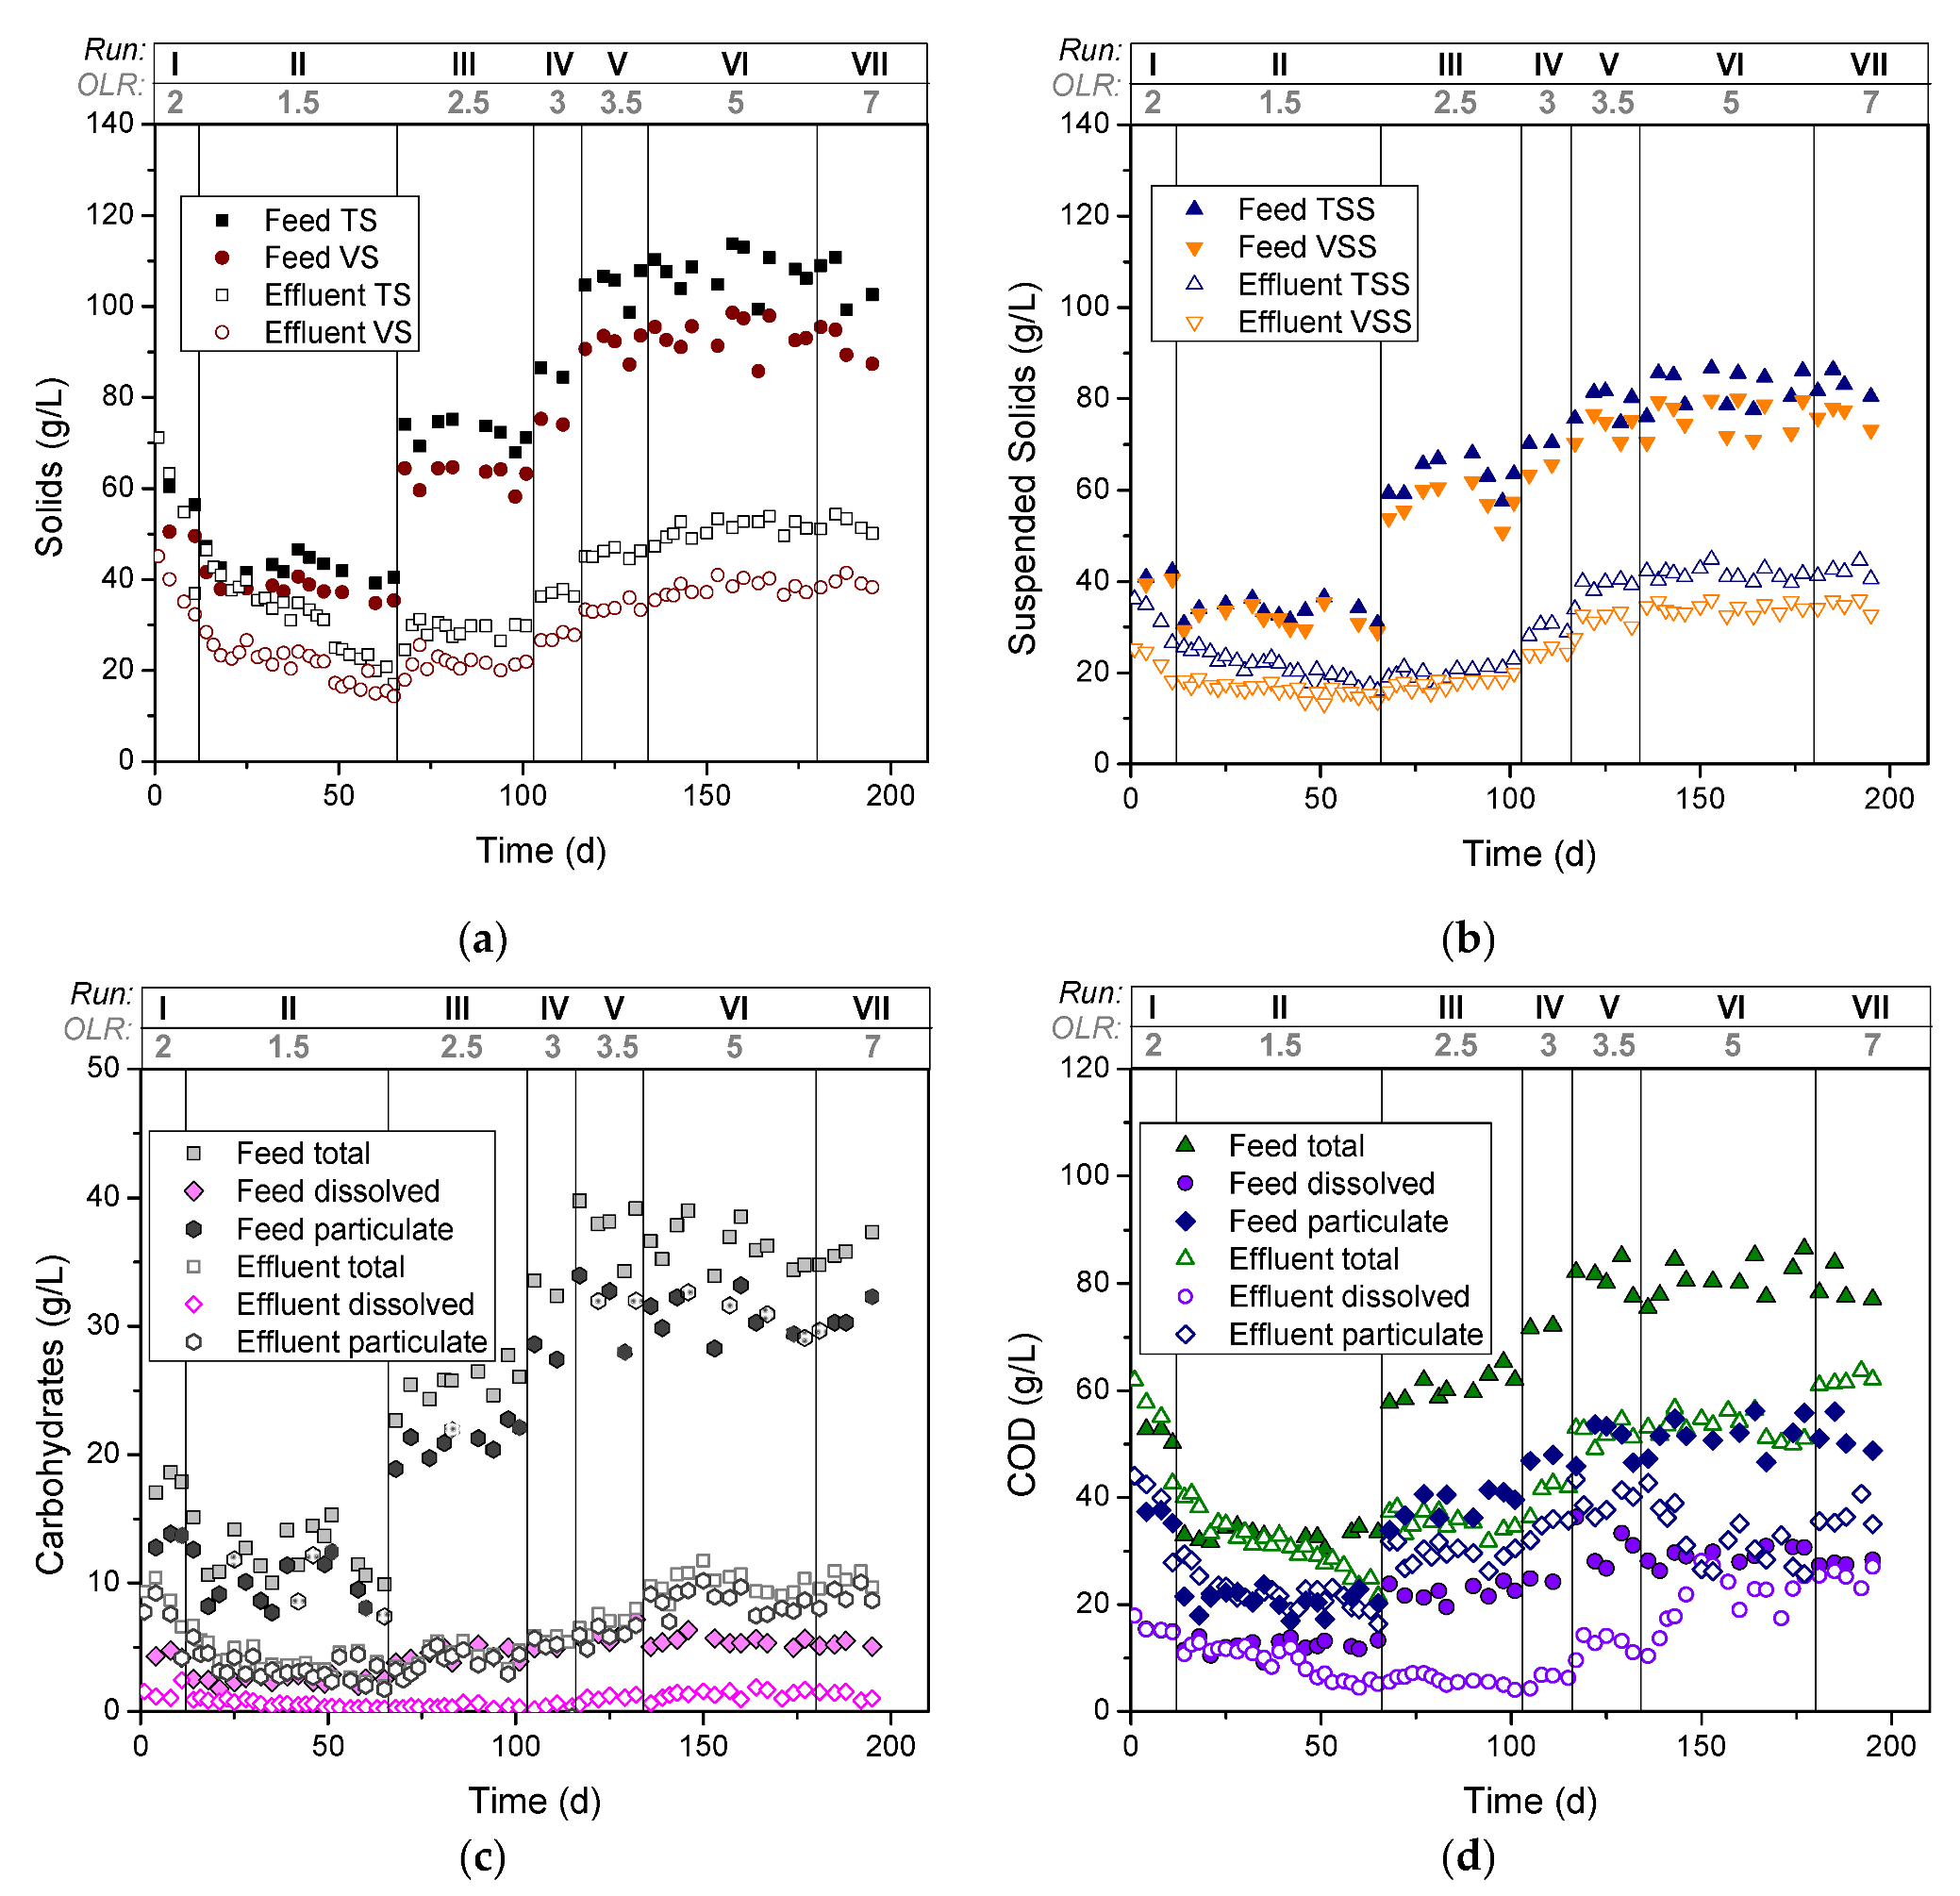
3.1.1. Solids’ Decomposition

Initially, the bioreactor was filled with the anaerobic inoculum and therefore its high initial solids concentration was washed out daily until a steady state concentration of solids was reached (after 25 days), as can be seen in diagrams a and b (Figure 1). For the OLRs of 1.5 and 2.5 g COD/(L·d) (run II, III) the average output of TS, VS, TSS, and VSS did not seem to be affected with average values of 29.4 ± 5.5 g/L, 20.8 ± 3.1 g/L, 20.6 ± 2.5 g/L, and 16.8 ± 1.5 g/L, respectively. Thereafter, the solids’ content showed an upward trend reaching an average of 51.4 ± 1.9 g/L for TS, 38.4 ± 1.6 g/L for VS, 41.7 ± 1.4 g/L for TSS, and 34.3 ± 1.2 g/L for VSS at OLR 5 and 7 g COD/(L·d) (run VI, VII). This increase was accompanied by an increase in feed TS and OLR. According to the literature, such concentrations of solids are prohibitive for direct disposal of the digestate. However, post-treatment could be applied for further utilization of the digestate (e.g., composting, filtration, and utilization of the solids for solid-state fermentation or pyrolysis, etc.) [35,36].

3.1.2. Carbohydrates Consumption

Figure 1c presents the carbohydrates concentration profile. Only a small part of the solids seems to be carbohydrates and this is indicated by the following ratios: particulate carbohydrates/TS = 0.14 and particulate carbohydrates/VS = 0.19. During the experimentation period, the maximum average concentration of approximately 40 g total carbohydrates/L was fed to the reactor. However, the effluent total carbohydrates concentration at runs II-V was less than 8 g/L, while at runs VI and VII was around 10 g/L. The dissolved carbohydrates remained at very low concentrations in all tested runs. More specifically, the average value of dissolved carbohydrates reduction was 82.9 ± 8.1%, while the average value of total carbohydrates reduction at OLR 1.5–3.5 g COD/(L·d) was 79.0 ± 6.1% g/L and 72.3 ± 2.4% at the OLRs of 5 and 7 g COD/(L·d), respectively. Higher total carbohydrates removal (>90%) was reported by Tsigkou et al. [16] and Dareioti et al. [17] in two-stage CSTR systems. One possible barrier for the degradation of carbohydrates in the AD process of the current study could be the presence and slow removal of xylan (a major component of plant hemicellulose and ingredient of malt and corn silage), as well as the inaccessibility of cellulose to the enzyme systems of the microorganisms involved [37].

3.1.3. COD Removal

The COD concentrations of the feed and the effluent are presented in Figure 1d. The gradual increase in OLR resulted in a subsequent increase in COD concentration. The distribution of the effluent’s COD was similar to the effluent’s solids concentration profile, with values decreasing over time due to the washout of the anaerobic inoculum. At run II the particulate COD value (19.8 ± 1.3 g/L, Table 2) of the effluent was quite lower than the values of the other runs, which presented no statistically significant differences. In addition, the highest COD removal (45.2 ± 2.8%) was presented at OLR 2.5 g COD/(L·d) (run III). According to Jo et al. [38], COD removal decreases as OLR is gradually increased in both single and two-stage systems, operating with food waste as substrate. Concerning the profile of dissolved COD at the effluent, non-statistically significant differences for OLR 1.5–3 g COD/(L·d) were observed. However, with the increase of OLR, d-COD accumulated at values of up to 22 g/L at runs VI and VII. This d-COD value increase was accompanied by VFAs accumulation, as described below. The high d-COD values were a result not only of intermediate product accumulation, such as acetate and propionate (Figure 2a), but also of the hydrolysis of the solid particulate material into soluble organic compounds. In particular, the concentration of acetate and propionate in terms of COD compound was 1.3 g COD/L and 7.8 g COD/L, respectively. In addition, from the value of 22 g/L d-COD only a small percentage is carbohydrates (1.3 g COD/L), as indicated by Figure 1c.
All the previous data indicate that from the 22 g d-COD/L, the amount of 10.4 g d-COD/L was acetate, propionate, and sugars. At the first stage of AD (hydrolysis step) complex substrates such as polysaccharides, proteins, and lipids are depolymerized into smaller units by hydrolytic organisms. Afterward, the hydrolysates are utilized by acidifying microorganisms by which organic acids such as acetic acid, propionic acid, alcohols, and hydrogen (H2) are formed [39]. Even though hydrolysis was performed (Figure 1a,b), microorganisms probably did not have the appropriate time to ferment the protein and fat monomers under these conditions. The presence of major particulate organic components (i.e., protein, and lipid) would affect the stability and efficiency of AD because they are degraded into various metabolites via different biochemical pathways [40]. Taking into consideration the total consumption of dissolved carbohydrates (Figure 1c), the d-COD accumulation (Figure 1d), and the low limits of VFAs (Figure 2a) during the last runs, it can be assumed that amino acids and fatty acids were accumulated, leading to the conclusion that the rate-limiting step of the AD process in this system is the VFAs production [22]. According to Veeken et al. [41] the produced fermentation products rise slower than the d-COD demonstrating some accumulation of monomers, as happened in the current study.

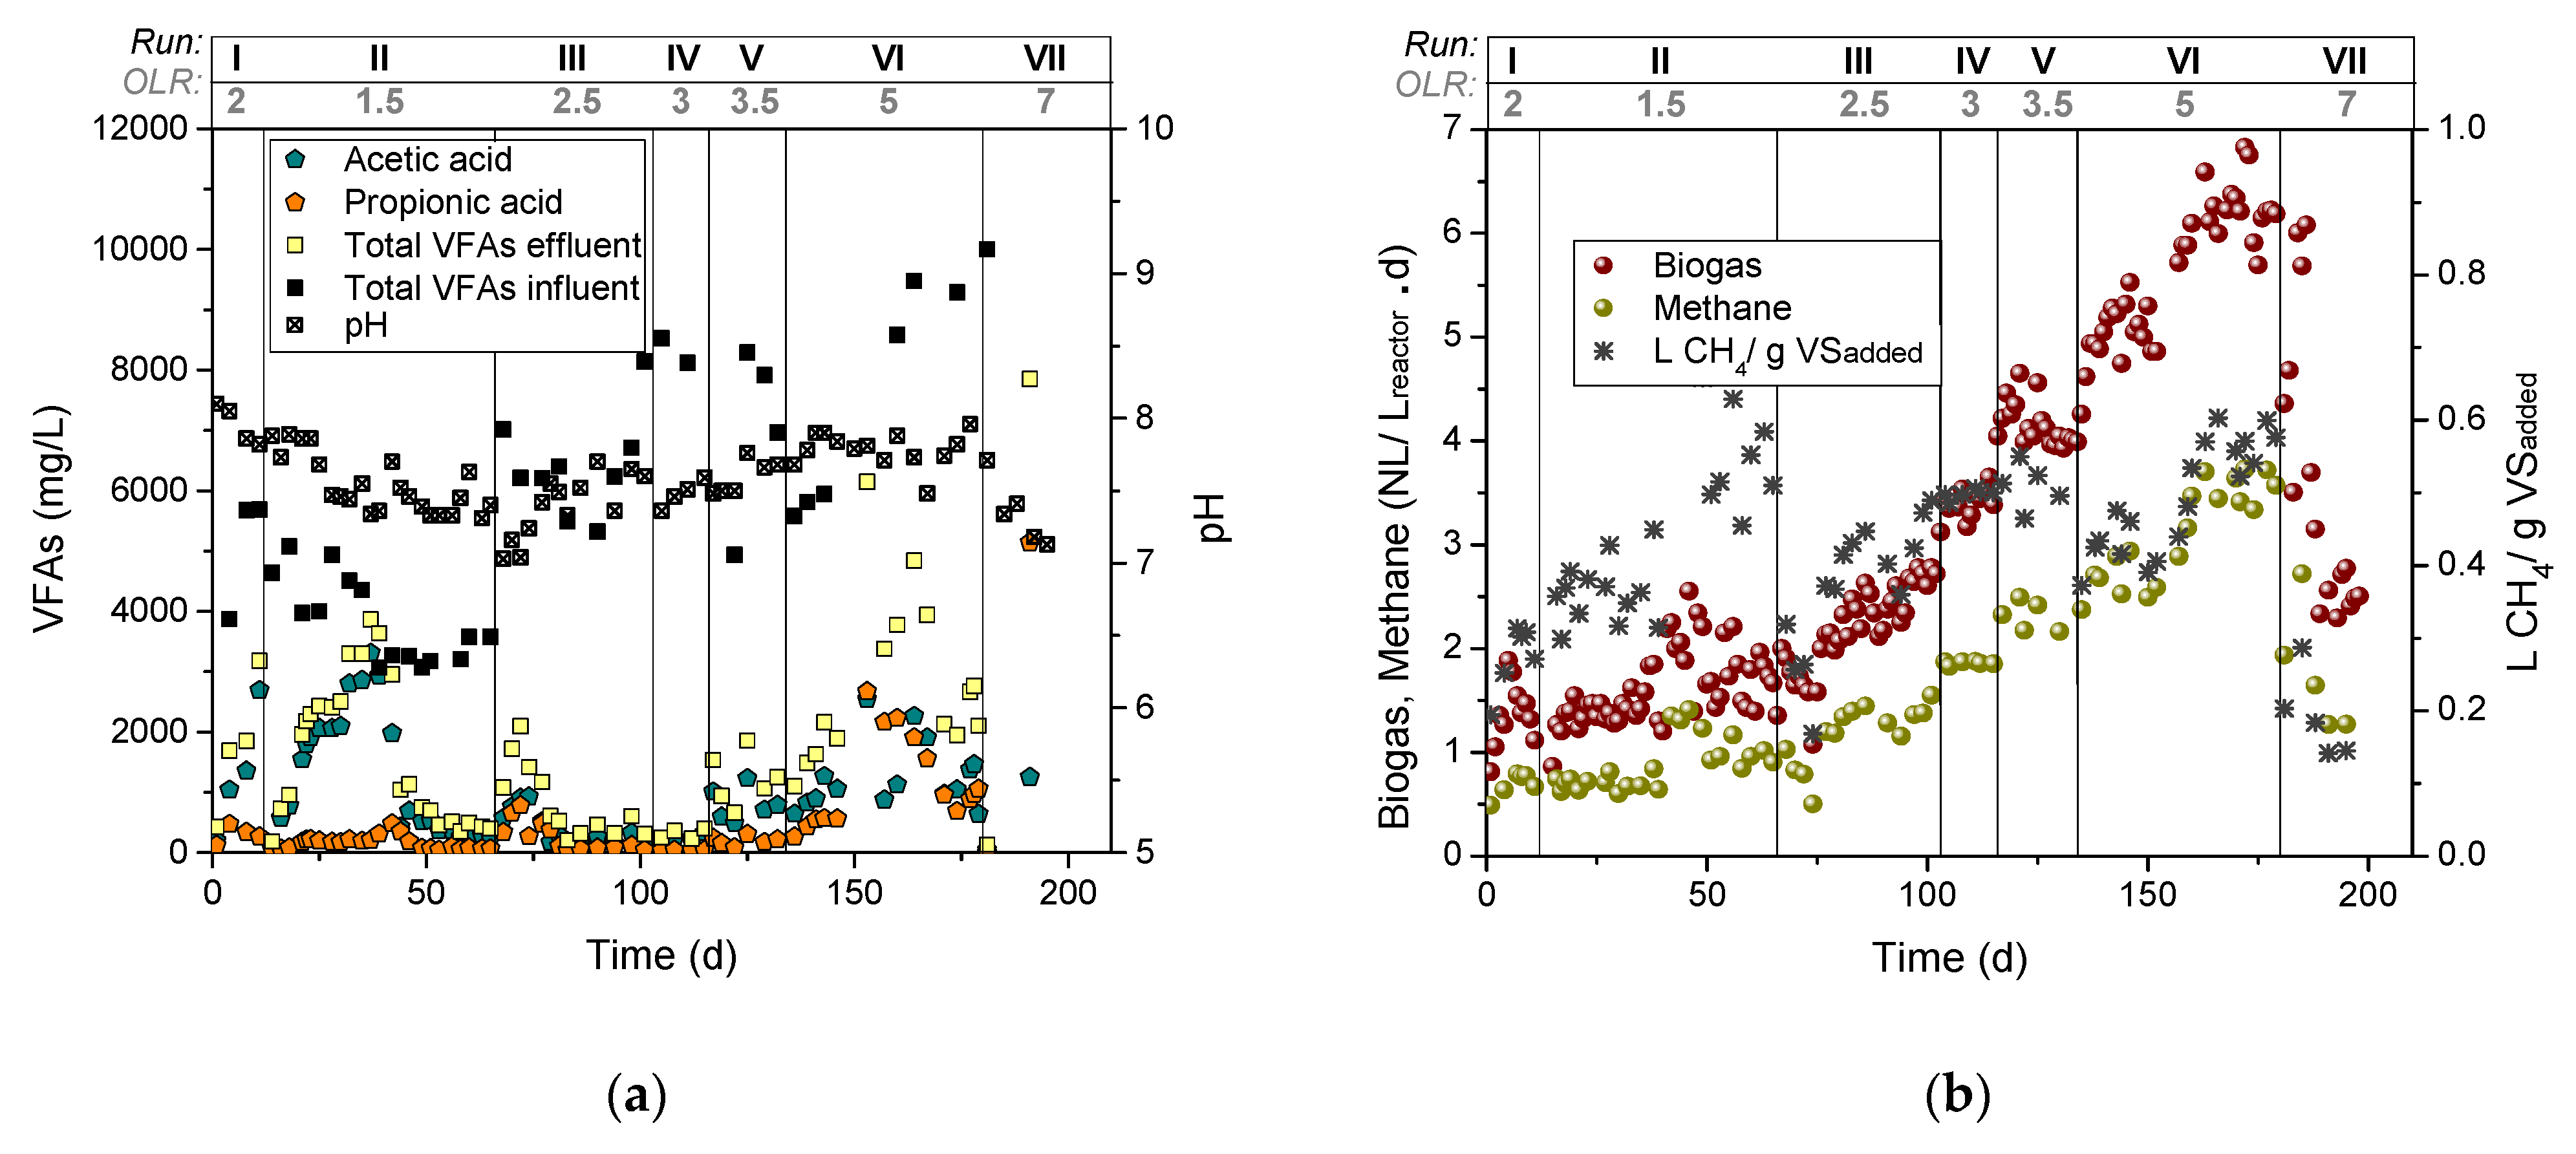
3.1.4. VFAs/Ethanol Concentration and pH

The VFAs concentration and the pH values are presented in Figure 2a. Accumulation of VFAs could lead to decreasing buffering capacity and pH values and thus to an inhibitory environment in the AD system. VFAs are therefore considered reliable indicators for process imbalance [42]. In extremely stressed high buffering capacity systems, when pH changes are small, VFAs can be considered reliable parameters for process monitoring [43]. The initial VFAs concentration of 4–6 g/L, which entered the reactor in the current study, resulted in an initial accumulation of acetate (approx. 3 g/L). Over time, the methanogenic consortium consumed this amount, and the total VFAs values remained low until run IV. Nevertheless, VFAs accumulation (acetate and propionate) was observed again when the influent exceeded 8 g/L of total VFAs. According to Neshat et al. [44], a concentration of about 1500–2000 mg/L of VFAs may inhibit the AD process. However, no apparent inhibition in methane production was observed in the current study, as arising from the stable methane yield (L CH4/g VSadded, Figure 2b) till the end of run VI. Nevertheless, the pH values remained in the desired range for AD (ideal pH range 6.8–7.4) [18], except in the last run (VII) where a gradual decrease was observed.

3.1.5. Biogas and Methane Production

The gradual OLR increase, as described in Figure 2b, resulted in higher biogas production of the system until the last run (VII), where the decline was observed due to unfavorable conditions and specifically due to VFAs accumulation and incomplete consumption of organic compounds, which both led subsequently to high COD effluent values (Figure 1d). The decline in biogas production was accompanied by methane composition change and methane yield decrease. Regarding the methane yield, except runs I and VII, in all the other cases and specifically for OLR 1.5–5 g COD/(L·d) (runs II-VI) the methane yield did not exhibit significant statistical differences, as can be seen in Table 2. At the last run, it was evident that there was a decrease in methane yield, while at run I the values are not representative, probably due to the fact that the anaerobic inoculum was not adequately acclimatized [3]. The value range of 0.44 ± 0.06–0.57 ± 0.02 L CH4/g VSadded was very close to the theoretical value of the mixture 16.66% corn silage-66.66% cattle manure-16.66% malt (0.54 L CH4/g VSadded) [3], indicating a very promising mixture for a continuous AD system. The methane proportion in biogas was in the range of 52.6–56.7% in the whole experimental period (Table 2). Similar values of methane content were reported by Comino et al. [45] (52–59%), where 80% cow manure with 20% silage was treated. Taking into consideration the most efficient, sustainable, and cost-effective scenario, in terms of yield, water utilization, and operational conditions, run VI seems to be the most favorable option.

3.2. Southern Greece

3.2.1. Solids’ Decomposition

As in the case of the Northern Greece scenario, the bioreactor during the first operating days was full of anaerobic inoculum (100% of the reactor volume was filled up with inoculum during the start-up). Therefore, the solids’ content was high at the beginning and over time started to decline (Figure 3a,b). In runs III, IV, and V the TS, VS, TSS, and VSS concentration of the effluent remained quite stable with average values of 22.2 ± 1.8 g/L, 14.9 ± 1.3 g/L, 14.1 ± 1.3 g/L and 12.5 ± 0.8 g/L, respectively. At the last run (VI) the solids’ concentration started to rise, and no steady-state conditions were observed. Due to the application of lower OLRs, and due to the lower solids concentration in the feed, bioreactor solids concentrations did not increase significantly, compared to the Northern Greece system operation. In any case, it is evident from Figure 3a,b that the solid content of the effluent after AD treatment was still in high concentration. Digestate consists of various kinds of organic matter (C), macronutrients (N, P), and micronutrients (K, Na, Ca, and others). Direct disposal of the bioreactor’s digestate without appropriate treatment could be an essential threat to the quality of the environment and could lead to significant greenhouse gas emissions [35]. In this view, the solid fraction of the digestate can be further valorized e.g., through thermochemical processes (for syngas and bio-char production), while the liquid fraction can be tested for irrigation purposes or microalgae cultivation [35,36,46].

3.2.2. Carbohydrates Consumption

The carbohydrates concentrations of the feed and the effluent are presented in Figure 3c. Concerning the total carbohydrates of the system, for runs II to VI, their value remained below 6 g/L. In almost all tested runs (except run I), the dissolved carbohydrates remained at very low concentrations (<1 g/L). Specifically, the reduction of total and dissolved carbohydrates was 81.4 ± 5.8% and 95.5 ± 3.3%, respectively. Such ratios indicate that the carbohydrates were almost totally consumed by the microorganisms. Plenty of data can be found in the literature regarding the types of carbohydrates, which can be found in the substrates tested in the current study. Citrus processing residues contain both soluble and insoluble carbohydrates, with the latter being present in the cell walls of the peels in the form of pectin, cellulose, and hemicellulose [47]. According to Hussain et al. [48], dried orange peel consists of sugars (30–40%), pectin (15–25%), cellulose (8–10%), and hemicellulose (5–7%). Olive pomace is characterized by high carbohydrate content (cellulose, hemicellulose, and pectins) [49,50]. The carbohydrate content included in the olive fruit consists mainly of glucose, fructose, mannose, galactose, sucrose, and polysaccharides, including cellulose, hemicellulose, and gums [51]. Corn silage, as a lignocellulosic material is composed of three essential polymers in the plant cell wall that are rich in carbohydrates in the form of starch and sugar, namely cellulose, hemicellulose, and lignin. It was reported that wheat straw and corn cob contain a high amount of glucose equal to 406 g/kg and 344 g/kg, respectively [52]. Finally, cattle manure is cellulosic biomass that mainly includes lignocellulose and mineral nutrients. The lignocellulosic content of cattle manure is quite lower than crop straws, although it is considered a promising candidate feedstock for biorefineries [53].

3.2.3. Soluble Phenolic Compounds

Figure 3e depicts the soluble phenolic compounds concentration of the feed and the effluent. Olive pomace contains extremely high organic load and phenolic substances [50]. Phenolic compounds inhibit the function of various microorganisms due to their toxicity [3], while specific (according to Milledge et al. [54]) phenolic compounds damage the microbial cells by altering the permeability of their membrane and therefore leakage in intracellular components and inactivation of essential enzymatic systems is performed. Due to the initial filling of the anaerobic bioreactor with anaerobic inoculum, the soluble phenolic compounds’ concentration was high at the beginning and through time started to decrease. The anaerobic inoculum, as mentioned above (“Anaerobic digestion feedstock and inoculum” subsection), was obtained from a biogas plant that uses a different kind of substrates including olive mill waste. Thus, the initial high concentration of phenols in the bioreactor is attributed to the olive mill wastewater, as described by several authors in the literature [25,26,55]. In the present study, olive pomace was used in a very low percentage (10%). Therefore, the concentration of soluble phenolic compounds in the bioreactor remained at a low concentration (<0.5 g gallic acid/L). Such phenolic content is not inhibitory, as reported in the literature. According to Delgenes et al. [56] phenolic compounds and specifically syringaldehyde and vanillin at concentrations of 2–5 g /L cause almost total inhibition to some microorganisms namely glucose-fermenting Saccharomyces cerevisiae yeast, xylose-fermenting Pichia stipitis yeast, and xylose-fermenting Candida shehatae yeast that are sensitive to the presence of inhibitors. In general, the inhibitory effect depends greatly on the type of microorganisms involved and their metabolism [57]. For example, phenolic compounds at a concentration of 1 g/L decreased the hydrogen yield from xylose at dark fermentation experiments as reported by Monlau et al. [57], but did not lead to total inhibition of the process.

3.2.4. COD Removal, VFAs/Ethanol Concentration, and pH

The COD profile is once again similar to the solids’ profile (Figure 3d). In the beginning, the COD values were high due to the anaerobic sludge inoculum and over time started to decrease reaching steady-state conditions. Total COD concentrations of the effluent remained quite stable until run V. Concerning the d-COD concentration, for runs III and IV the values were below 7 g/L, while at OLR V and VI, a gradual increase was observed with values exceeding 10 g/L at the last run. The t-COD removal values exhibited a minimum of 23.6% (run V) and a maximum of 47.8% (run IV). Such a low removal percentage might be due to the absence of easily biodegradable fractions in the corresponding mixture [58]. However, due to the high removal of carbohydrates, the latter assumption could be rejected, and possibly the low removal in COD concentration might be attributed to inhibition factors [40]. In addition, as mentioned above, the soluble phenolic compounds concentration remained at low levels for the whole experimentation period, indicating that this factor could not cause inhibition. Concerning the high d-COD values at the last run (around 10 g d-COD/L), one possible reason is that the solid particulate material is converted into soluble organic compounds (in this case acetate and propionate as described below) and the hydrolysis and fermentation rate of solid organic matter is higher than the utilization rate of microorganisms to produce biogas [59]. More specifically, at the last run the acetic and propionic acid values were equal to 3 g COD/L and 4.2 g COD/L (summing 7.2 g COD/L), respectively, indicating that indeed the highest amount of the solid particulate material is converted into acetate and propionate.
Figure 4a depicts the VFAs concentration and pH values profiles. During the whole experimental period, only VFAs were measured, while ethanol concentrations above 250 mg/L were not detected. At the inserted concentration of VFAs (around 3 g/L), VFAs accumulation, especially of acetic and propionic acid, was observed. Gradually, the high concentration of acetic acid started to decrease and remained at values below 1 g/L until run IV. However, propionic acid values remained at high levels (1–1.5 g/L) until run IV, where less than 500 mg/L of propionic acid was detected. An additional VFAs accumulation was observed during runs V and VI, with values above 2 g/L of acetic and propionic acid to be detected. The accumulation of VFAs was accompanied by a pH decrease. Food waste, such as orange peels, is readily fermented and prone to acidification [38]. In order to control the bioreactor’s behavior in terms of alkalinity levels stability, an appropriate amount of NaHCO3 was added. At run II, when the pH value was below 7 and the alkalinity was close to 4 g CaCO3/L, 2 g of NaHCO3 was added to the bioreactor, while after run III 0.10–0.12 g, NaHCO3 was added constantly to the daily feedstock. However, at the last run, NaHCO3 addition was not able to balance the exceeded accumulation of VFAs, leading subsequently to pH values drop.
Increased biogas production is the expected result when increasing OLR, within limits, in a conventional AD CSTR digester. However, at high OLR the high content of non-fiber carbohydrates and fats in food waste is possible to increase the rate of propionic acid production to a point that exceeds the rate of its consumption [20]. Under these conditions, the microorganisms require more time for population adjustment to the high propionic acid concentrations. According to the literature, propionic acid degradation has been reported as a slow process that requires long HRT [60].

3.2.5. Biogas and Methane Production

Figure 4b depicts the biogas and methane production of the current system. The gradual increase of OLR did not result in a subsequent increase in biogas and methane production. At runs II and III the biogas and methane concentrations had an average of 1.22 NL/Lreactor·d and 0.57 NL/Lreactor·d, respectively. By applying OLR 2.5 g COD/(L·d) (run IV), sharp decreases in biogas and methane concentrations were observed and therefore OLR was reduced to 2 g COD/(L·d) (run V) in order to achieve smoother operation of the bioreactor. Even though runs III and V had similar conditions, lower values of biogas at run V were observed. This can be attributed mainly to the presence of compounds that inhibit anaerobes [40] or serve as a source of perturbation to a reactor system [39], such as D-limonene [61]. Finally, the application of OLR 2.5 g COD/(L·d) at the last run resulted in system failure. Research conducted by Zema et al. [62] indicated that under mesophilic conditions in a system that treated orange peel waste, the highest daily specific methane yield was achieved at OLR of 1.0 g TVS/(L·d), while partial inhibition of the AD process was detected at OLR 1.98 g TVS/(L·d) and the process irreversibly stopped when OLR reached 2.5 g TVS/(L·d). Such results are perfectly in line with the findings of the current study, where orange peels were included in the substrate mixture at a ratio of 23% w/w.
The main issue when treating orange peels in biological processes is their high content in D-limonene [61]. This is an antimicrobial compound that constitutes 90% of oranges’ essential oil as 2–3% of the dry matter of the orange. According to the literature, limonene is reported to be highly toxic to AD and it causes ultimate failure of the process at a concentration of 400 μL/L on mesophilic digestion and in the range of 450 to 900 μL/L on thermophilic digestion [63]. A recent environmentally sustainable method to reduce the inhibition effect of limonene is the co-digestion of orange peels with other substrates in order to dilute the limonene concentration during AD [64]. However, in this study, it is possible that the percentage of orange peels in the Southern Greece fall/winter mixture was too high so that the limonene concentration was not diluted at a non-inhibitory level.
The experimental methane yield of around 0.31 L CH4/g VSadded that resulted from Southern Greece fall/winter mixture in our previous study [3] when optimization batch BMP assays were conducted for defining the optimum substrate mixture for maximum methane yield, is very close to the methane yield that resulted in run II (0.37 ± 0.03 L CH4/g VSadded) and run III (0.26 ± 0.04 L CH4/g VSadded). The highest methane yield is also accompanied by the highest methane content in run II (51.1 ± 2.1%) and run III (51.3 ± 2.1%). In the current experimentation, an increase in the OLR resulted in a methane yield and content decrease. Similar results were reported by Varol et al. [65], who studied the comparative evaluation of biogas production from dairy manure and co-digestion with maize silage by a CSTR and a new anaerobic hybrid reactor.

3.3. Proposed Systems Operation and Further Investigation

Water supply is limited, while the pressing need for water conservation is a result of the huge demand for water supplies. Therefore, the preservation of freshwater reservoirs has gained a great attention, and thus one of the main elements of sustainable development is water management [66]. For this reason, a constraint followed in the current study was to exploit the moisture already contained in the substrates, avoiding, if possible, the addition of water so that no consumption of a natural resource is being made. Furthermore, in the current study, a lot of lignocellulosic materials were used based on our previous survey and BMP assays. According to the literature, pretreatment is often considered a prerequisite for cellulose conversion processes as it aims to change the structure of cellulosic biomass to render cellulose more available to the enzymes that convert the carbohydrate polymers into fermentable sugars [67]. Anyhow, the pretreatment process should be cost-effective, energy-efficient, with a high-performance rate, and should also lead to the yield of high fermentable sugars with the least inhibitor formation [68]. Over time, different methods of pretreatment have been reported such as physical, biological, and chemical processes as well as their combination [68,69]. However, these methods, besides their beneficial effects, also present some risks and are cost-intensive due to the additional requirement of chemicals or energy [70]. For example, physical pretreatment methods such as milling, crumbling, cutting, etc. are usually combined with other pretreatment methods and this increases the processes’ cost. On the other hand, biological approaches are aiming to improve the efficiency of the bioconversion processes and to overcome barriers to the scale-up and commercialization of renewable biorefineries [71]. A variety of bacteria and fungi can hydrolyze cellulose and hemicellulose into the corresponding mono-sugars such as glucose, arabinose, xylose, etc. [68]. Biological pretreatment is characterized by mild reaction conditions, less energy consumption, and simple equipment [72]. However, pure cultures of microorganisms for such a pretreatment are difficult to maintain in an open system when a long pretreatment time is often required [73]. Chemical pretreatment includes different chemicals such as acids, alkalis, and oxidizing agents e.g., peroxide and ozone, while dilute acid pretreatment using H2SO4/HCl is the most widely used method [68]. Alkaline pretreatment using a high concentration of NaOH solution (an example of chemical pretreatment) can accelerate the process of hydrolysis and acidification for VFAs, at a level that would inhibit the production of methane [72]. Taking into account the pros and cons of the various pretreatment methods, no pretreatment was performed in the present experiment.
Taking into consideration the most efficient, sustainable, and cost-effective scenario in terms of yield, water utilization, and operational conditions, for Northern Greece, run VI (OLR 5 g COD/(L·d)) seems to be the most favorable option, while for Southern Greece fall/winter mixture run III (2 g COD/(L·d)) seems to be the most desirable option. OLR represents the amount of feed that is added to the CSTR system per unit of volume and day. In case the value of OLR is too high or if a sudden shock load of feed is added to the system, then the latter will destabilize, resulting in an increase in VFAs concentration and to gas production drop [74]. For this reason, a gradual increase in OLR is strongly suggested. Lastly, due to the low efficiency of the Southern Greece fall/winter mixture, further investigation is needed for mixtures containing orange peels due to the presence of the aforementioned inhibition phenomena that might occur due to a high proportion of essential oils. D-limonene (the main element of essential oils in orange peels) is highly toxic to microorganisms and decreases the biogas yield of orange peel AD. Unfortunately, in the present study, this inhibition could not be avoided through co-digestion with other available agro-wastes. Another possible solution in order to increase the energy efficiency of orange peels could be their pretreatment using for example hexane extraction, steam distillation (in terms of a biorefinery concept), or via the addition of enzymes [62].

4. Conclusions

In the current study different mixtures concerning Northern Greece (10% corn silage-80% cattle manure-10% malt) and Southern Greece fall/winter season (10% corn silage-57% cattle manure-23% orange peels-10% olive pomace) were valorized through one-stage AD. The Northern Greece mixture performed effectively until the OLR of 5 g COD/(L·d) and HRT 15 d, exhibiting a methane yield of 0.57 ± 0.02 L CH4/g VSadded, which is close to the theoretical one. The application of OLR 2.5 g COD/(L·d) at Southern Greece fall/winter mixture resulted in system failure so a maximum OLR of 2 g COD/(L·d) is recommended, which led to the production of 0.21–0.27 L CH4/g VSadded. Mixtures consisting of corn silage, cattle manure, and malt can be successfully valorized through AD at high OLR. However, further investigation for mixtures that include orange peels is suggested due to their inhibitory effect on methanogenesis.

Author Contributions

Conceptualization, V.P.A., K.T., V.G.P. and M.K.; methodology, V.P.A., K.T. and M.K.; software, K.T.; validation, V.P.A., K.T., V.G.P., W.W. and M.K.; formal analysis, V.P.A., K.T. and M.K.; investigation, V.P.A., V.G.P., and M.K.; resources, V.G.P., W.W. and M.K.; data curation, V.P.A., K.T. and M.K.; writing—original draft preparation, V.P.A., K.T., V.G.P., and M.K.; writing—review and editing, V.P.A., K.T., W.W., and M.K.; visualization, K.T., and V.P.A.; supervision, V.G.P., and M.K.; project administration, V.G.P.; funding acquisition, V.G.P., and M.K.. All authors have read and agreed to the published version of the manuscript.

Funding

This work was supported by the project SYNAGRON, a joint RT&D project under Greece–China Call for Proposals launched under the auspices of the Ministry of Science and Technology (MOST) of the People’s Republic of China and the Ministry of Development & Investments/General Secretariat of Research and Technology (GSRT) of the Hellenic Republic. Greece: Funded under European Regional Development Fund (ERDF) and National Resources (GSRT). China: Funded under the Ministry of Science and Technology of the People’s Republic of China.

Institutional Review Board Statement

Not applicable.

Informed Consent Statement

Not applicable.

Data Availability Statement

Data are contained within the article, in Section 3, and can be available upon request.

Conflicts of Interest

The authors declare no conflict of interest.

References

  1. Qazi, A.; Hussain, F.; Rahim, N.A.B.D.; Hardaker, G.; Alghazzawi, D.; Shaban, K.; Haruna, K. Towards Sustainable Energy: A Systematic Review of Renewable Energy Sources, Technologies, and Public Opinions. IEEE Access 2019, 7, 63837–63851. [Google Scholar] [CrossRef]
  2. Alatzas, S.; Moustakas, K.; Malamis, D.; Vakalis, S. Biomass Potential from Agricultural Waste for Energetic Utilization in Greece. Energies 2019, 12, 1095. [Google Scholar] [CrossRef] [Green Version]
  3. Aravani, V.P.; Tsigkou, K.; Papadakis, V.G.; Kornaros, M. Biochemical Μethane Potential of Most Promising Agricultural Residues in Northern and Southern Greece. Chemosphere 2022, 296, 133985. [Google Scholar] [CrossRef] [PubMed]
  4. Moustakas, K.; Parmaxidou, P.; Vakalis, S. Anaerobic Digestion for Energy Production from Agricultural Biomass Waste in Greece: Capacity Assessment for the Region of Thessaly. Energy 2020, 191, 116556. [Google Scholar] [CrossRef]
  5. Liu, Y.; He, Y.; Wang, Z.; Xia, J.; Wan, K.; Whiddon, R.; Cen, K. Characteristics of Alkali Species Release from a Burning Coal/Biomass Blend. Appl. Energy 2018, 215, 523–531. [Google Scholar] [CrossRef] [Green Version]
  6. European Environmental Agency. Share of Energy Consumption from Renewable Sources in Europe; European Environmental Agency: Copenhagen, Denmark, 2021. [Google Scholar]
  7. Hosseini, S.E. An Outlook on the Global Development of Renewable and Sustainable Energy at the Time of COVID-19. Energy Res. Soc. Sci. 2020, 68, 101633. [Google Scholar] [CrossRef] [PubMed]
  8. European Union. Directive 2009/28/EC of the European Parliament and of the Council of 23 April 2009 on the Promotion of the Use of Energy from Renewable Sources and Amending and Subsequently Repealing Directives 2001/77/EC and 2003/30/EC. Off. J. Eur. Union 2009, 5, 2009. [Google Scholar]
  9. EU Agenda. Directive (EU) 2018/2001 of the European Parliament and of the Council of 11 December 2018 on the Promotion of the Use of Energy from Renewable Sources. Off. J. Eur. Union 2018, 5, 82–209. [Google Scholar]
  10. European Commission. EU Proposal for a DIRECTIVE OF THE EUROPEAN PARLIAMENT AND OF THE COUNCIL Amending Directive (EU) 2018/2001 of the European Parliament and of the Council, Regulation (EU) 2018/1999 of the European Parliament and of the Council and Directive 98/70/EC of the European Parliament and of the Council as Regards the Promotion of Energy from Renewable Sources, and Repealing Council Directive (EU) 2015/652 2021. European Commission: Brussels, Belgium, 2021. [Google Scholar]
  11. Maragkaki, A.E.; Kotrotsios, T.; Samaras, P.; Manou, A.; Lasaridi, K.; Manios, T. Quantitative and Qualitative Analysis of Biomass from Agro-Industrial Processes in the Central Macedonia Region, Greece. Waste Biomass Valorization 2016, 7, 383–395. [Google Scholar] [CrossRef]
  12. Lopresto, C.G.; Paletta, R.; Filippelli, P.; Galluccio, L.; de la Rosa, C.; Amaro, E.; Jáuregui-Haza, U.; de Frias, J.A. Sargassum Invasion in the Caribbean: An Opportunity for Coastal Communities to Produce Bioenergy Based on Biorefinery—An Overview. Waste Biomass Valorization 2022, 2769–2793. [Google Scholar]
  13. Rabii, A.; Aldin, S.; Dahman, Y.; Elbeshbishy, E. A Review on Anaerobic Co-Digestion with a Focus on the Microbial Populations and the Effect of Multi-Stage Digester Configuration. Energies 2019, 12, 1106. [Google Scholar]
  14. Lohani, S.P.; Havukainen, J. Anaerobic Digestion: Factors Affecting Anaerobic Digestion Process. In Waste Bioremediation; Springer: Singapore, 2018; pp. 343–359. [Google Scholar]
  15. Liu, N.; Jiang, J. Valorisation of Food Waste Using Salt to Alleviate Inhibition by Animal Fats and Vegetable Oils during Anaerobic Digestion. Biomass Bioenergy 2020, 143, 105826. [Google Scholar]
  16. Tsigkou, K.; Tsafrakidou, P.; Kopsahelis, A.; Zagklis, D.; Zafiri, C.; Kornaros, M. Used Disposable Nappies and Expired Food Products Valorisation through One-& Two-Stage Anaerobic Co-Digestion. Renew Energy 2020, 147, 610–619. [Google Scholar]
  17. Dareioti, M.A.; Kornaros, M. Effect of Hydraulic Retention Time (HRT) on the Anaerobic Co-Digestion of Agro-Industrial Wastes in a Two-Stage CSTR System. Bioresour Technol 2014, 167, 407–415. [Google Scholar] [CrossRef] [PubMed]
  18. Mao, C.; Feng, Y.; Wang, X.; Ren, G. Review on Research Achievements of Biogas from Anaerobic Digestion. Renewable and sustainable energy reviews 2015, 45, 540–555. [Google Scholar]
  19. Bi, S.; Hong, X.; Yang, H.; Yu, X.; Fang, S.; Bai, Y.; Liu, J.; Gao, Y.; Yan, L.; Wang, W. Effect of Hydraulic Retention Time on Anaerobic Co-Digestion of Cattle Manure and Food Waste. Renew Energy 2020, 150, 213–220. [Google Scholar]
  20. Han, Y.; Green, H.; Tao, W. Reversibility of Propionic Acid Inhibition to Anaerobic Digestion: Inhibition Kinetics and Microbial Mechanism. Chemosphere 2020, 255, 126840. [Google Scholar] [CrossRef] [PubMed]
  21. Cortesi, A.; Gallo, V.; Solinas, D.; Vitanza, R. Assessing the Synergistic Effects of Co-Digestion of Maize Silage and Red Chicory Waste. Chem Biochem Eng Q 2018, 32, 383–390. [Google Scholar] [CrossRef]
  22. Tsigkou, K.; Zagklis, D.; Parasoglou, M.; Zafiri, C.; Kornaros, M. Proposed Protocol for Rate-Limiting Step Determination during Anaerobic Digestion of Complex Substrates. Bioresour Technol 2022, 361, 127660. [Google Scholar] [CrossRef]
  23. Lukitawesa; Patinvoh, R.J.; Millati, R.; Sarvari-Horvath, I.; Taherzadeh, M.J. Factors Influencing Volatile Fatty Acids Production from Food Wastes via Anaerobic Digestion. Bioengineered 2020, 11, 39–52. [Google Scholar] [CrossRef] [Green Version]
  24. Tsigkou, K.; Sakarika, M.; Kornaros, M. Inoculum Origin and Waste Solid Content Influence the Biochemical Methane Potential of Olive Mill Wastewater under Mesophilic and Thermophilic Conditions. Biochem Eng. J. 2019, 151, 107301. [Google Scholar] [CrossRef]
  25. Zakoura, M.; Kopsahelis, A.; Tsigkou, K.; Ntougias, S.; Ali, S.S.; Kornaros, M. Performance Evaluation of Three Mesophilic Upflow Anaerobic Sludge Blanket Bioreactors Treating Olive Mill Wastewater: Flocculent and Granular Inocula Tests, Organic Loading Rate Effect and Anaerobic Consortia Structure. Fuel 2022, 313, 122951. [Google Scholar] [CrossRef]
  26. Tsigkou, K.; Kornaros, M. Development of a High-Rate Anaerobic Thermophilic Upflow Packed Bed Reactor for Efficient Bioconversion of Diluted Three-Phase Olive Mill Wastewater into Methane. Fuel 2022, 310, 122263. [Google Scholar] [CrossRef]
  27. Aravani, V.P.; Sun, H.; Yang, Z.; Liu, G.; Wang, W.; Anagnostopoulos, G.; Syriopoulos, G.; Charisiou, N.D.; Goula, M.A.; Kornaros, M. Agricultural and Livestock Sector’s Residues in Greece & China: Comparative Qualitative and Quantitative Characterization for Assessing Their Potential for Biogas Production. Renew. Sustain. Energy Rev. 2022, 154, 111821. [Google Scholar]
  28. Aravani, V.P.; Tsigkou, K.; Kornaros, M.; Papadakis, V.G. Laboratory Analyses for Assessing the Potential for Biogas Production of Various Agricultural Residues in Greece. Agron. Res. 2021, 19, 1339–1350. [Google Scholar]
  29. Dareioti, M.A.; Vavouraki, A.I.; Tsigkou, K.; Kornaros, M. Assessment of Single-vs. Two-Stage Process for the Anaerobic Digestion of Liquid Cow Manure and Cheese Whey. Energies 2021, 14, 5423. [Google Scholar] [CrossRef]
  30. Nkuna, R.; Roopnarain, A.; Rashama, C.; Adeleke, R. Insights into Organic Loading Rates of Anaerobic Digestion for Biogas Production: A Review. Crit Rev Biotechnol 2022, 42, 487–507. [Google Scholar] [CrossRef]
  31. APHA; AWWA; WEF. Standard Methods for the Examination of Water and Wastewater, 20th ed.American Public Health Association: Washington DC, USA, 2012. [Google Scholar]
  32. Joseffson, B. Rapid Spectrophotometric Determination of Total Carbohydrates. Methods of seawater analysis; Wiley-VCH: Weinheim, Germany, 1983; pp. 340–342. [Google Scholar]
  33. Lamuela-Raventós, R.M. Folin-Ciocalteu Method for the Measurement of Total Phenolic Content and Antioxidant Capacity. Measurement of Antioxidant Activity & Capacity: Recent Trends and Applications; John Wiley & Sons, Inc.: Hoboken, NJ, USA, 2017; pp. 107–115. [Google Scholar]
  34. Tsigkou, K.; Terpou, A.; Treu, L.; Kougias, P.G.; Kornaros, M. Thermophilic Anaerobic Digestion of Olive Mill Wastewater in an Upflow Packed Bed Reactor: Evaluation of 16S RRNA Amplicon Sequencing for Microbial Analysis. J. Environ. Manage 2022, 301, 113853. [Google Scholar] [CrossRef]
  35. Wang, W.; Lee, D.-J. Valorization of Anaerobic Digestion Digestate: A Prospect Review. Bioresour Technol. 2021, 323, 124626. [Google Scholar]
  36. Tsigkou, K.; Zagklis, D.; Tsafrakidou, P.; Zafiri, C.; Kornaros, M. Composting of Anaerobic Sludge from the Co-Digestion of Used Disposable Nappies and Expired Food Products. Waste Management 2020, 118, 655–666. [Google Scholar] [CrossRef]
  37. Pakarinen, A.; Kymalainen, M.; Stoddard, F.L.; Viikari, L. Conversion of Carbohydrates in Herbaceous Crops during Anaerobic Digestion. J. Agric. Food Chem. 2012, 60, 7934–7940. [Google Scholar] [PubMed]
  38. Jo, Y.; Kim, J.; Hwang, K.; Lee, C. A Comparative Study of Single-and Two-Phase Anaerobic Digestion of Food Waste under Uncontrolled PH Conditions. Waste Management 2018, 78, 509–520. [Google Scholar] [CrossRef]
  39. de Jonge, N.; Moset, V.; Møller, H.B.; Nielsen, J.L. Microbial Population Dynamics in Continuous Anaerobic Digester Systems during Start up, Stable Conditions and Recovery after Starvation. Bioresour Technol. 2017, 232, 313–320. [Google Scholar] [CrossRef] [PubMed]
  40. Lee, J.; Han, G.; Shin, S.G.; Koo, T.; Cho, K.; Kim, W.; Hwang, S. Seasonal Monitoring of Bacteria and Archaea in a Full-Scale Thermophilic Anaerobic Digester Treating Food Waste-Recycling Wastewater: Correlations between Microbial Community Characteristics and Process Variables. Chem. Eng. J. 2016, 300, 291–299. [Google Scholar]
  41. Veeken, A.; Kalyuzhnyi, S.; Scharff, H.; Hamelers, B. Effect of PH and VFA on Hydrolysis of Organic Solid Waste. J. Environ. Eng. 2000, 126, 1076–1081. [Google Scholar] [CrossRef] [Green Version]
  42. Franke-Whittle, I.H.; Walter, A.; Ebner, C.; Insam, H. Investigation into the Effect of High Concentrations of Volatile Fatty Acids in Anaerobic Digestion on Methanogenic Communities. Waste Manag. 2014, 34, 2080–2089. [Google Scholar]
  43. Murto, M.; Björnsson, L.; Mattiasson, B. Impact of Food Industrial Waste on Anaerobic Co-Digestion of Sewage Sludge and Pig Manure. J. Environ. Manage 2004, 70, 101–107. [Google Scholar] [CrossRef]
  44. Neshat, S.A.; Mohammadi, M.; Najafpour, G.D.; Lahijani, P. Anaerobic Co-Digestion of Animal Manures and Lignocellulosic Residues as a Potent Approach for Sustainable Biogas Production. Renew. Sustain. Energy Rev. 2017, 79, 308–322. [Google Scholar]
  45. Comino, E.; Rosso, M.; Riggio, V. Investigation of Increasing Organic Loading Rate in the Co-Digestion of Energy Crops and Cow Manure Mix. Bioresour Technol. 2010, 101, 3013–3019. [Google Scholar]
  46. Koutra, E.; Mastropetros, S.G.; Ali, S.S.; Tsigkou, K.; Kornaros, M. Assessing the Potential of Chlorella Vulgaris for Valorization of Liquid Digestates from Agro-Industrial and Municipal Organic Wastes in a Biorefinery Approach. J. Clean Prod. 2021, 280, 124352. [Google Scholar] [CrossRef]
  47. Pourbafrani, M.; Talebnia, F.; Niklasson, C.; Taherzadeh, M.J. Protective Effect of Encapsulation in Fermentation of Limonene-Contained Media and Orange Peel Hydrolyzate. Int. J. Mol. Sci. 2007, 8, 777–787. [Google Scholar] [CrossRef] [Green Version]
  48. Hussain, Z.; Sajjad, W.; Khan, T.; Wahid, F. Production of Bacterial Cellulose from Industrial Wastes: A Review. Cellulose 2019, 26, 2895–2911. [Google Scholar]
  49. Fathy, S.A.; Mahmoud, A.E.; Rashad, M.M.; Ezz, M.K.; Mohammed, A.T. Improving the Nutritive Value of Olive Pomace by Solid State Fermentation of Kluyveromyces Marxianus with Simultaneous Production of Gallic Acid. Int. J. Recycl. Org. Waste Agric. 2018, 7, 135–141. [Google Scholar]
  50. Sygouni, V.; Pantziaros, A.G.; Iakovides, I.C.; Sfetsa, E.; Bogdou, P.I.; Christoforou, E.A.; Paraskeva, C.A. Treatment of Two-Phase Olive Mill Wastewater and Recovery of Phenolic Compounds Using Membrane Technology. Membranes 2019, 9, 27. [Google Scholar] [CrossRef] [PubMed] [Green Version]
  51. Pantziaros, A.G.; Trachili, X.A.; Zentelis, A.D.; Sygouni, V.; Paraskeva, C.A. A New Olive Oil Production Scheme with Almost Zero Wastes. Biomass Convers Biorefin. 2021, 11, 547–557. [Google Scholar] [CrossRef]
  52. Huzir, N.M.; Aziz, M.M.A.; Ismail, S.B.; Abdullah, B.; Mahmood, N.A.N.; Umor, N.A.; Muhammad, S.A.F.S. Agro-Industrial Waste to Biobutanol Production: Eco-Friendly Biofuels for next Generation. Renew. Sustain. Energy Rev. 2018, 94, 476–485. [Google Scholar] [CrossRef]
  53. Zhu, Q.-L.; Wu, B.; Pisutpaisal, N.; Wang, Y.-W.; Ma, K.; Dai, L.-C.; Qin, H.; Tan, F.-R.; Maeda, T.; Xu, Y. Bioenergy from Dairy Manure: Technologies, Challenges and Opportunities. Sci. Total Environ. 2021, 790, 148199. [Google Scholar]
  54. Milledge, J.J.; Nielsen, B.V.; Harvey, P.J. The Inhibition of Anaerobic Digestion by Model Phenolic Compounds Representative of Those from Sargassum Muticum. J. Appl. Phycol. 2019, 31, 779–786. [Google Scholar]
  55. Vavouraki, A.I.; Dareioti, M.A.; Kornaros, M. Olive Mill Wastewater (OMW) Polyphenols Adsorption onto Polymeric Resins: Part i—Batch Anaerobic Digestion of OMW. Waste Biomass Valorization 2021, 12, 2271–2281. [Google Scholar]
  56. Delgenès, J.-P.; Moletta, R.; Navarro, J.M. Effects of Lignocellulose Degradation Products on Ethanol Fermentations of Glucose and Xylose by Saccharomyces Cerevisiae, Zymomonas Mobilis, Pichia Stipitis, and Candida Shehatae. Enzyme Microb. Technol. 1996, 19, 220–225. [Google Scholar] [CrossRef]
  57. Monlau, F.; Sambusiti, C.; Barakat, A.; Quéméneur, M.; Trably, E.; Steyer, J.-P.; Carrère, H. Do Furanic and Phenolic Compounds of Lignocellulosic and Algae Biomass Hydrolyzate Inhibit Anaerobic Mixed Cultures? A Comprehensive Review. Biotechnol. Adv. 2014, 32, 934–951. [Google Scholar]
  58. Lim, J.W.; Park, T.; Tong, Y.W.; Yu, Z. The Microbiome Driving Anaerobic Digestion and Microbial Analysis. In Advances in Bioenergy; Elsevier: Amsterdam, The Netherlands, 2020; Volume 5, pp. 1–61. ISBN 2468-0125. [Google Scholar]
  59. Wan, S.; Sun, L.; Douieb, Y.; Sun, J.; Luo, W. Anaerobic Digestion of Municipal Solid Waste Composed of Food Waste, Wastepaper, and Plastic in a Single-Stage System: Performance and Microbial Community Structure Characterization. Bioresour Technol. 2013, 146, 619–627. [Google Scholar]
  60. Zhao, J.; Westerholm, M.; Qiao, W.; Yin, D.; Bi, S.; Jiang, M.; Dong, R. Impact of Temperature and Substrate Concentration on Degradation Rates of Acetate, Propionate and Hydrogen and Their Links to Microbial Community Structure. Bioresour Technol. 2018, 256, 44–52. [Google Scholar] [CrossRef] [PubMed]
  61. Calabrò, P.S.; Panzera, M.F. Anaerobic Digestion of Ensiled Orange Peel Waste: Preliminary Batch Results. Therm. Sci. Eng. Prog. 2018, 6, 355–360. [Google Scholar]
  62. Zema, D.A.; Fòlino, A.; Zappia, G.; Calabrò, P.S.; Tamburino, V.; Zimbone, S.M. Anaerobic Digestion of Orange Peel in a Semi-Continuous Pilot Plant: An Environmentally Sound Way of Citrus Waste Management in Agro-Ecosystems. Sci. Total Environ. 2018, 630, 401–408. [Google Scholar] [CrossRef] [PubMed]
  63. Wikandari, R.; Nguyen, H.; Millati, R.; Niklasson, C.; Taherzadeh, M.J. Improvement of Biogas Production from Orange Peel Waste by Leaching of Limonene. Biomed Res. Int. 2015, 2015, 494182. [Google Scholar] [CrossRef] [PubMed] [Green Version]
  64. Bouaita, R.; Derbal, K.; Panico, A.; Iasimone, F.; Pontoni, L.; Fabbricino, M.; Pirozzi, F. Methane Production from Anaerobic Co-Digestion of Orange Peel Waste and Organic Fraction of Municipal Solid Waste in Batch and Semi-Continuous Reactors. Biomass Bioenergy 2022, 160, 106421. [Google Scholar] [CrossRef]
  65. Varol, A.; Ugurlu, A. Comparative Evaluation of Biogas Production from Dairy Manure and Co-digestion with Maize Silage by CSTR and New Anaerobic Hybrid Reactor. Eng. Life Sci. 2017, 17, 402–412. [Google Scholar]
  66. EL-Nwsany, R.I.; Maarouf, I.; Abd el-Aal, W. Water Management as a Vital Factor for a Sustainable School. Alex. Eng. J. 2019, 58, 303–313. [Google Scholar] [CrossRef]
  67. Amin, F.R.; Khalid, H.; Zhang, H.; Zhang, R.; Liu, G.; Chen, C. Pretreatment Methods of Lignocellulosic Biomass for Anaerobic Digestion. AMB Express 2017, 7, 72. [Google Scholar]
  68. Lopresto, C.G.; Verardi, A.; Nicoletti, C.; Mukherjee, D.; Calabro, V.; Chakraborty, S.; Curcio, S. Technological Aspects of Lignocellulose Conversion into Biofuels: Key Challenges and Practical Solutions. In Sustainable Biotechnology-Enzymatic Resources of Renewable Energy; Springer: Cham, Switzerland, 2018; pp. 117–154. [Google Scholar]
  69. Wagner, A.O.; Schwarzenauer, T.; Illmer, P. Improvement of Methane Generation Capacity by Aerobic Pre-Treatment of Organic Waste with a Cellulolytic Trichoderma Viride Culture. J. Environ. Manage 2013, 129, 357–360. [Google Scholar] [CrossRef]
  70. Lim, J.W.; Wang, J.-Y. Enhanced Hydrolysis and Methane Yield by Applying Microaeration Pretreatment to the Anaerobic Co-Digestion of Brown Water and Food Waste. Waste Management 2013, 33, 813–819. [Google Scholar] [CrossRef] [PubMed]
  71. Verardi, A.; Lopresto, C.G.; Blasi, A.; Chakraborty, S.; Calabrò, V. Bioconversion of Lignocellulosic Biomass to Bioethanol and Biobutanol. In Lignocellulosic biomass to liquid biofuels; Elsevier: Amsterdam, The Netherlands, 2020; pp. 67–125. [Google Scholar]
  72. Yu, Q.; Liu, R.; Li, K.; Ma, R. A Review of Crop Straw Pretreatment Methods for Biogas Production by Anaerobic Digestion in China. Renew. Sustain. Energy Rev. 2019, 107, 51–58. [Google Scholar] [CrossRef]
  73. Wen, B.; Yuan, X.; Li, Q.X.; Liu, J.; Ren, J.; Wang, X.; Cui, Z. Comparison and Evaluation of Concurrent Saccharification and Anaerobic Digestion of Napier Grass after Pretreatment by Three Microbial Consortia. Bioresour Technol. 2015, 175, 102–111. [Google Scholar] [CrossRef] [PubMed]
  74. Lindmark, J.; Thorin, E.; Fdhila, R.B.; Dahlquist, E. Effects of Mixing on the Result of Anaerobic Digestion. Renew. Sustain. Energy Rev. 2014, 40, 1030–1047. [Google Scholar] [CrossRef]
Figure 1. Northern Greece scenario: (a) Feed and effluent TS and VS concentration, (b) Feed and effluent TSS and VSS concentration, (c) Feed and effluent total, dissolved and particulate carbohydrates concentration, (d) Feed and effluent total, dissolved and particulate COD concentration for all the tested runs.
Fermentation 09 00131 g001
Figure 2. Northern Greece scenario: (a) Main accumulated VFAs, total VFAs amount of influent and effluent, and pH values, (b) biogas and methane yields for all the tested runs.
Fermentation 09 00131 g002
Figure 3. Southern Greece fall/winter scenario: (a) Feed and effluent TS, and VS concentration, (b) Feed and effluent TSS, and VSS concentration, (c) Feed and effluent total, dissolved, and particulate carbohydrates concentration, (d) Feed and effluent total, dissolved and particulate COD concentration, (e) Feed and effluent soluble phenolic compounds concentration for all the tested runs.
Fermentation 09 00131 g003
Figure 4. Southern Greece fall/winter scenario: (a) Main accumulated VFAs, total VFAs amount of influent and effluent, and pH values, (b) biogas and methane yields for all the tested runs.
Fermentation 09 00131 g004
Table 1. Methanogenic bioreactors’ operating conditions during the valorization of Northern Greece and Southern Greece fall/winter mixtures.
Northern Greece
RunIIIIIIIVVVIVII
Feed (mL/d)37.537.537.537.537.55075
OLR (g COD/(L·d))21.52.533.557
HRT (d)20202020201510
Southern Greece
RunIIIIIIIVVVI-
Feed (mL/d)37.537.537.537.537.537.5-
OLR (g COD/(L·d))21.522.522.5-
HRT (d)20-
Table 2. Average values and standard deviation for the particulate and dissolved COD concentration of the effluent, the percentages of total COD removal and methane content, as well as for the methane yield, regarding both the Northern and Southern Greece scenarios. Statistical analysis (n = 4, during steady state) and Tukey’s post hoc test were carried out for pairwise comparison (the same letter (A, B, C, D) indicates statistically insignificant differences (p > 0.05) among the values of each parameter).
GreeceRunParticulate COD (g/L)Dissolved COD (g/L)Total COD
Removal (%)
Methane
Content (%)
Methane Yield
(L CH4/g VSadded)
NorthI38.6 ± 7.3 A15.8 ± 1.4 B-54.0 ± 4.0 A0.30 ± 0.02 C
II19.8 ± 1.3 C5.2 ± 0.6 C28.0 ± 7.1 B,C54.5 ± 1.5 A0.53 ± 0.06 A,B
III28.9 ± 1.8 B5.1 ± 0.8 C45.2 ± 2.8 A52.6 ± 2.1 A0.44 ± 0.06 B
IV34.6 ± 1.8 A, B6.0 ± 1.2 C43.5 ± 3.9 A53.9 ± 0.7 A0.50 ± 0.01 A,B
V38.9 ± 2.3 A12.8 ± 1.3 B36.3 ± 2.6 A,B53.9 ± 0.8 A0.51 ± 0.04 A,B
VI28.5 ± 3.1 B22.1 ± 3.3 A39.0 ± 2.6 A56.7 ± 2.2 A0.57 ± 0.02 A
VII36.8 ± 2.6 A25.4 ± 1.8 A22.1 ± 3.1 C56.7 ± 2.2 B0.19 ± 0.07 D
F-Value16.2296.3120.156.7240.37
p-Value0.000.000.000.000.00
South
Fall/winter
I44.2 ± 2.9 A17.5 ± 1.5 A-47.1 ± 4.2 A0.27 ± 0.04 B
II17.9 ± 2.1 C5.2 ± 1.0 D33.5 ± 7.1 B51.1 ± 2.1 A0.37 ± 0.03 A
III18.7 ± 1.5 C4.5 ± 1.1 D37.7 ± 3.3 B51.3 ± 2.1 A0.26 ± 0.04 B
IV19.4 ± 0.4 B,C4.7 ± 0.7 D47.8 ± 1.6 A48.7 ± 2.3 A0.20 ± 0.05 B,C
V20.8 ± 0.8 B,C9.1 ± 0.7 C23.6 ± 4.6 C47.1 ± 3.5 A0.21 ± 0.11 B,C
VI23.2 ± 1.1 B13.2 ± 0.4 B30.8 ± 2.8 B,C46.2 ± 2.4 A0.15 ± 0.06 C
F-Value142.81123.3317.192.3013.07
p-Value0.000.000.000.090.00
Disclaimer/Publisher’s Note: The statements, opinions and data contained in all publications are solely those of the individual author(s) and contributor(s) and not of MDPI and/or the editor(s). MDPI and/or the editor(s) disclaim responsibility for any injury to people or property resulting from any ideas, methods, instructions or products referred to in the content.

