Article

Optimisation of Bioethanol Production in a Potato Processing Industry

Unit of Environmental Science & Technology, School of Chemical Engineering, National Technical University of Athens, 9 Iroon Polytechniou Str., Zographou Campus, GR-15780 Athens, Greece
*
Authors to whom correspondence should be addressed.
Fermentation 2023, 9(2), 103; https://doi.org/10.3390/fermentation9020103
Submission received: 13 December 2022 / Revised: 20 January 2023 / Accepted: 20 January 2023 / Published: 23 January 2023
(This article belongs to the Collection Food Waste Valorization)

Abstract

:
Nowadays, there is a requirement for industries to eliminate carbon from their energy mix and substitute it with greener options. This calls for investment in efforts to facilitate the scaling up of technical advancements. Because of the huge amount of waste, a life cycle strategy has been used by industries, especially the food industry, to lessen the environmental impact of their products. One of the sectors that burdens the environment with a significant amount of waste is the potato processing industrial sector. The current study focuses on the valorisation of all the potato processing waste streams (potato peels, potato tubers and slices, starch and low-quality chips) towards bioethanol production at a pilot level. After their physico-chemical characterisations, several experimental trials were performed in order to determine the optimum pretreatment and hydrolysis conditions for each waste stream. Acid hydrolysis, alkaline hydrolysis and hydrothermal pretreatment were examined when no pretreatment resulted in low ethanol yields (below 60%). The optimum results that were obtained were applied in a pilot plant of 200L to examine the upscaling factor. It was verified that upscaling by 1000 times generates comparable and, in some cases, greater results. From the integration of the results and the mass balances of a typical potato processing company, a full-scale implementation plan was also set up, where it was calculated that around 2 m3 bioethanol per week could be produced.

1. Introduction

The population’s constant growth has provoked noticeable food demand worldwide, which is expected to increase by up to 50% by 2050, according to the Food and Agriculture Organization of the United Nations (FAO) [1]. However, no viable solution has been provided for the production of more and better food with the same or less use of resources [2]. This has led to excessive resource consumption, which is accompanied by vast volumes of industrial waste [3]. Annually, one-third of the produced food is wasted worldwide in the overall value chain, from farm to fork, corresponding to 1.3 billion tons yearly [1]. Thus, the tendency of the European Commission to adapt to a circular economy is nowadays an undeniable fact. In light of the Green Deal’s recent reveal, that is, an aspirational plan to make Europe carbon-neutral by 2050, it is evident that companies will be forced to use closed resource loops in the future to limit waste and diminish the environmental effect of their processes [4]. The Green Deal’s Farm to Fork strategy mainly emphasises the food system and intends to apply the circular economy approach to improve the sustainability of food production [5]. Closing the loop in the framework of food production systems would entail improving the use of food surplus, waste and by-products.
As the world is trying to make a transition to a low-carbon economy, the European Potato Processors’ Association (EUPPA) members welcome green ambitions and desire to contribute to the shift to greater sustainability [6]. Companies target reducing energy, freshwater intake, carbon emissions and zero waste to landfill in food processing plants. Thus, they are urged to demonstrate not just their decarbonization strategies, but also to reduce negative impacts on biodiversity. Potato is the third most important food crop on a global level [7]. As a result, from 2001 to 2020, worldwide potato output climbed by around 18% [1]. During the processing of these crops, potato companies produce enormous volumes of waste; for every ton of processed potatoes, 0.16 tons of solid waste are generated [8]. The two primary sources of potato waste are potato agricultural operations (5–20%) and the potato chip industry (18%) [
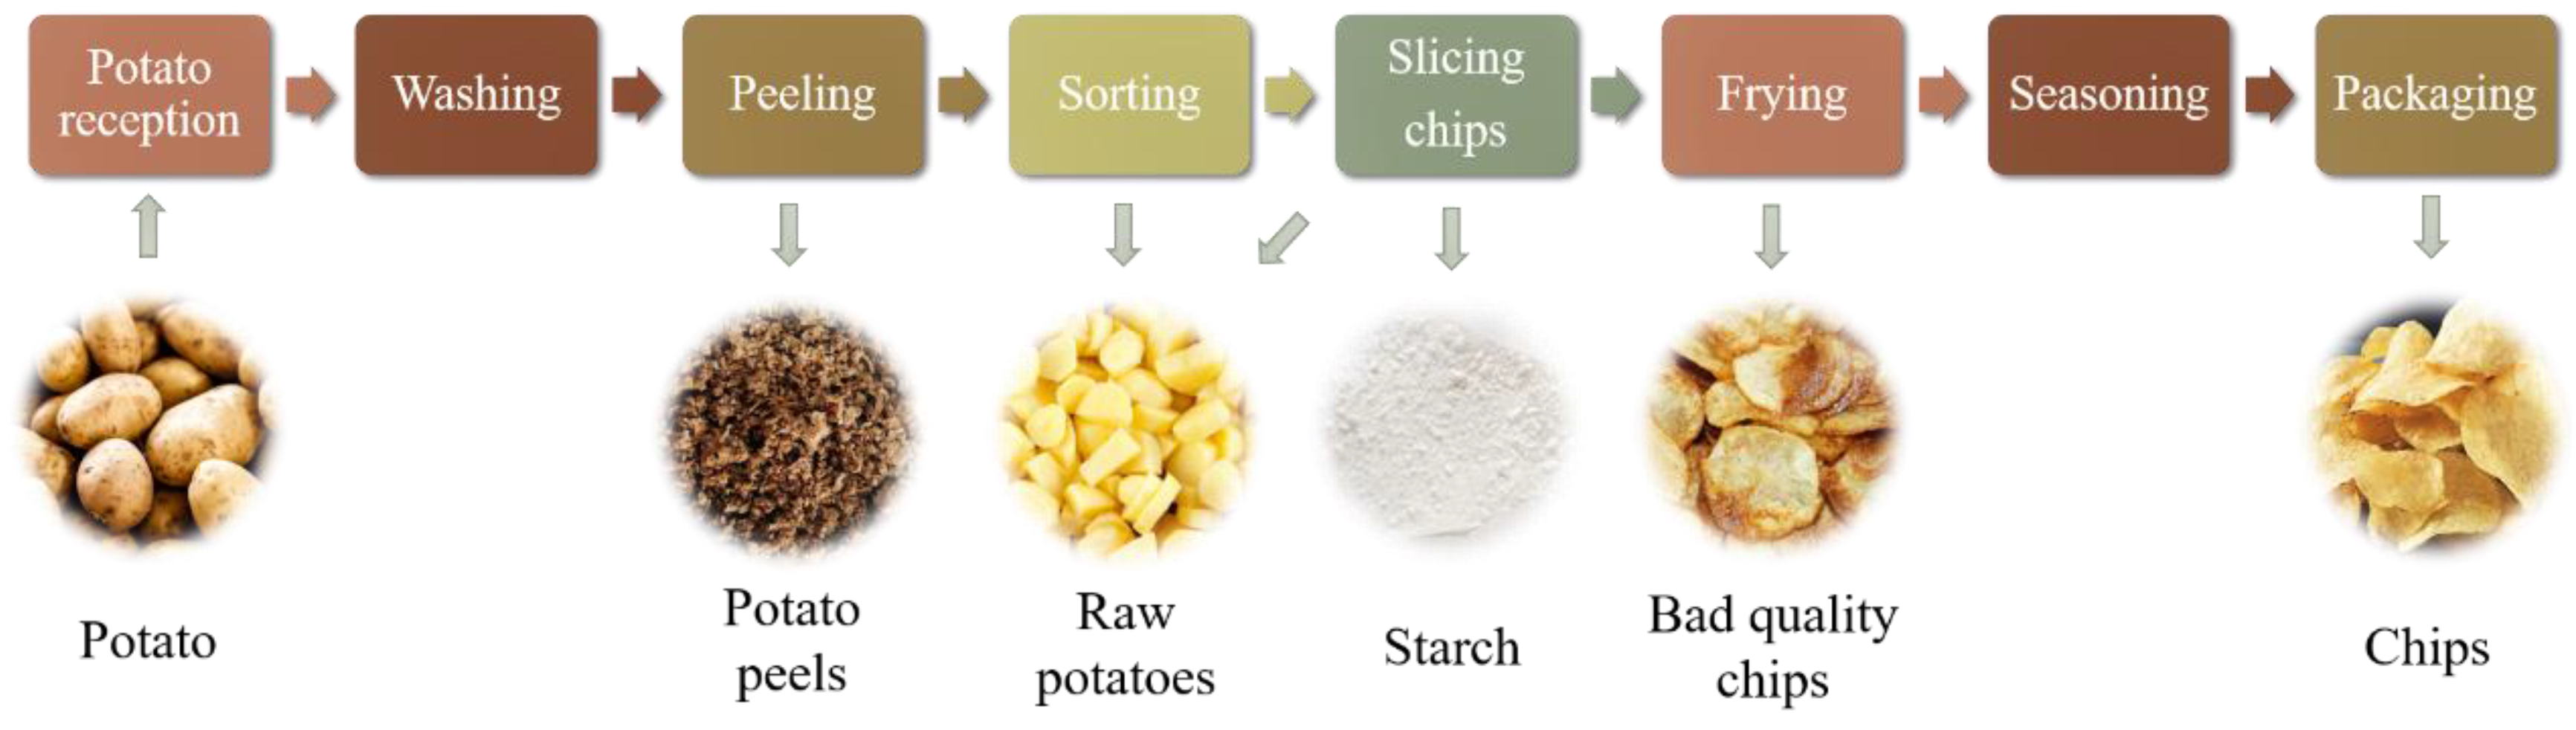
9]. For instance, the production of potato chips generates waste from the following processes: peeling (potato peels), sorting (potato tubers), cutting (starch and potato slices) and frying (low-quality chips). These substrates are mainly composed of lignocellulosic materials, such as hemicellulose, cellulose and lignin, as well as carbohydrates, proteins, lipids and fatty acids. Given their properties, these waste streams may be characterised as promising feedstocks for the food-processing, pharmaceutical and biosynthetic industries. This has increased interest in valorising them for the production of bioproducts with added value [10]. Turning them into biofuels might be another viable way for developing alternative energy sources and minimizing harmful gas emissions [11].
Generated bioethanol through the microbial fermentation of sugar-based, starchy and lignocellulosic feedstock has been considered as a potential renewable fuel [12]. The feedstock’s chemical and structural properties determine the difficulty of the production process. The total world ethanol production in 2021 is 27,310 million gallons, of which 60%, approximately, originates from starchy materials [13,14].
Few research studies for bioethanol production from potato processing industrial waste have been conducted, investigating the three steps of bioethanol synthesis by starchy and lignocellulosic matter: pretreatment, hydrolysis and fermentation. According to Khawla et. al. [15], enzymatic hydrolysis has been proved to be preferable to acid hydrolysis, with significant concentrations of reducing sugars (69 g·L−1), by the use of potato peel waste as feedstock. Another research study showed that 11.9 g·L−1 of bioethanol was obtained from the enzymatic saccharification of potato peels using amylolytic and cellulolytic enzymes [16]. Some of the steps mentioned above have been applied simultaneously, leading to even higher ethanol yields (simultaneous saccharification fermentation, SSF). Thus, SSF has replaced the separate hydrolysis and fermentation (SHF) process as a more economical and effective way to produce bioethanol. Specifically, a high ethanol yield was observed using Saccharomyces cerevisiae after 48 h of incubation from potato peel waste at a temperature of 35 °C and pH of 6.0 [17].
The objective of the present study is to produce bioethanol by degradation and valorisation of all the potato processing waste streams and not just one, as is the case in the literature. Four solid waste streams are utilised as substrates for bioethanol production. Firstly, the selection of the appropriate pretreatment was investigated in order to optimize the bioethanol production. Other operational conditions, such as solid loading, dosages of enzymes, etc., were also studied. Moreover, the kinetics of ethanol production under the optimal operational parameters were examined on a pilot scale of 200 L. Finally, based on the experimental results, a full-scale implementation plan is proposed as an innovative solution for the management of potato processing industrial waste, with remarkable perspectives from both the economic and environmental aspects.

2. Materials and Methods

2.1. Raw Material

A potato processing company producing potato chips, located in Central Greece, Greece, supplied the different potato waste streams: potato peels, potato tubers and slices, starch and potato chip waste. These streams are produced in different process units, as presented in Figure 1. They were transferred to the Unit of Environmental Science and Technology (UEST), School of Chemical Engineering, National Technical University of Athens (NTUA), Greece. The large potato tubers were cut into smaller pieces (4–7 cm dice), and the rest of the waste streams were used as they were. All the potato waste streams were fully physico-chemically characterised in triplicate.

2.2. Lab Scale

2.2.1. Pretreatment

Prior to the enzymatic hydrolysis and fermentation of the potato waste samples, the need for and the effect of different pretreatment techniques were examined: acid, alkali and hydrothermal pretreatments. To this end, experiments with acid or alkaline media, autoclave, or no pretreatment were performed to determine the chemical pretreatment that suits best the raw material under study. The substrates were prepared in the desired solid loading (5% w/w for the potato peels and 15% w/w for the other substrates). Next, the mixtures were pretreated with 1% w/w NaOH at 50 °C for 6 h, or 1% v/v H2SO4 at 60 °C for 1 h, or autoclaved at 121 °C for 15 min. The pretreatment conditions were selected based on the literature [15,18,19] and on the preliminary experiments. The chemical pretreatment that resulted in the optimum results regarding ethanol concentration and/or ethanol yield in the preliminary experimental trials was selected for further investigation. After the pretreatment step, the samples were allowed to cool to ambient temperature, and the resulting slurry was then pH-adjusted before being utilized as feedstock for the enzymatic saccharification. The experimental runs were carried out three times, and the mean values and standard deviations are presented. The slurry was also filtered in order to separate the solid phase, which was then dried in a convection oven for 48 h at 45 °C. Both the solid and the liquid phases were analysed.

2.2.2. Bioethanol Production

Simultaneous saccharification and fermentation (SSF) was applied to all the potato waste streams for bioethanol production. At first, all the experiments were conducted on a lab scale in 250 mL autoclavable bottles, using a shaker (KS 3000 i control, IKA, Staufen, Germany). For the preliminary experiments, after the pretreatment step, 40 μ L Spirizyme   Excel   XHS · g starch 1   and 2% w/w S. cerevisiae at 35 °C were added for 24 h. In the case of the potato peels, 175 μ L NS 87014 · g cellulose 1   was added, as well, in order to break down the cellulose. For the optimisation trials, the experiments were performed under different solid loadings, different concentrations of chemical means and/or different enzyme loadings (cellulolytic and/or amylolytic, where appropriate) by applying the principles of factorial design. Enzyme loadings of 20, 40 and 60   μ L · g starch 1 for Spirizyme Excel XHS and 100, 175 and 250 μ L · g cellulose 1 for NS87014 were tested by applying solid loadings of 10%, 15% and 20% w/w. The applied concentrations of the chemical medium were 0%, 1% and 2%. The zero value of the concentration was not assumed as no pretreatment, since the samples were subjected to mild thermal treatment prior to SSF. The SSF process was conducted at 35 °C for 48 h using 2% w/w of yeast Saccharomyces cerevisiae.
The ethanol yield was quantified in order to assess the efficiency of the hydrolysis and fermentation by the following equation:
Y E t O H = Produced   Ethanol   ( g ) Theoretical   Ethanol   ( g ) × 100 %
The theoretical ethanol was estimated in accordance with the stoichiometry of the reaction:
C 6 H 12 O 6 yeast 2 C 2 H 5 OH + 2 CO 2
Theoretical   Ethanol   ( g ) =   Theoritical   Glucose   ( g ) × 2 × M r EtOH M r Glucose

2.2.3. Pilot Scale

The pilot-scale experimental runs were carried out in a bio-conversion pilot plant within the premises of the National Technical University of Athens, Unit of Environmental Science and Technology. This pilot plant includes two 200 L stainless steel horizontal cylindrical reactors with a rotating shaft for the mixing of the material, which can operate autonomously under varying operational conditions. Water recirculates in external double walls in order to control the reactors’ temperature. A fully automated PLC (programmable logic controller) is used to control the pilot plant operation. Each bioreactor has an independent heating circuit that allows the reaction mixture temperature to be set and controlled through the PLC. Four digital temperature displays and control modules are included in the central switchboard. The user has the ability to set both the reaction temperature and the recirculated water temperature. The pH is monitored and controlled through a fully automated system that includes pH probes, a display and controlling module and four peristaltic pumps for the addition of the necessary chemicals. The pilot operator may set all the operational parameters (T, pH, mixing time and direction, total duration) through the installed 7′’touch screen. A single distillation step will be applied for the ethanol recovery. When the fermentation is finished, the fermentation broth is heated up to 75 °C, and a low vacuum is applied by a vacuum pump. The produced vapours, via insulated pipes, pass through the coil of the heat exchanger and condensate. The resulting effluent is collected in the bottom of the vessel.
The experimental runs in pilot scale were carried out under the optimal conditions that had been obtained from the lab-scale experimentation, aiming to estimate not only ethanol yield but also the effect of upscaling. During the saccharification and fermentation process, with regard to more efficient process monitoring, samples were retrieved from the pilot plant on an hourly basis and were characterised in terms of glucose and bioethanol. The ethanol yield was calculated in order to evaluate the performance of the process. After the 24 h fermentation period and distillation, the remaining stillage was fully characterised.

2.3. Chemical Analysis

The raw materials and residues were characterised according to the NREL laboratory analytical protocol [20,21]. After every technical process, all the samples were centrifuged for 9 min at 3100 rpm, in order to proceed for further chemical analysis. In the solid fractions, the total solids, volatile solids, moisture, ash, lignin (acid-soluble lignin and acid-insoluble residue), hemicellulose, cellulose [20] and starch [21] were measured. The starch was estimated by the Total Starch Assay Kit, using the AOAC Method 996.11 (K-TSTA-100A, Megazyme, Wicklow, Ireland) [22]. In the liquid phase, the glucose was determined with a commercial kit (Biosis S.A., Athens, Greece), using the glucose oxidase–peroxidase method (GOD/PAP, Biosis S.A., Athens, Greece). The ethanol content was calculated by the ethanol assay kit, using the AOAC Method 2019.08 (K-ETOH 05/21, Megazyme, Wicklow, Ireland) [23], the total reducing sugars’ concentration by the 3,5-dinitrosalicylic acid method [23], and the total nitrogen (TN) and total organic carbon (TOC) were estimated by standard methods [24] using SHIMADZU (Kyoto, Japan) TOC-VCHS and TNM-1. The characterisation analysis was carried out thrice.

3. Results and Discussion

3.1. Chemical Composition

A crucial first step to begin the investigation is the determination of the composition of the waste streams, which indicates their potential as bioethanol feedstocks. The composition of industrial waste varies, impacted by multiple factors, including the production line and the type of production, apart from the variety of the raw material. Hence, the four raw material waste streams were chemically characterised in their dry basis.
The potato peels and potato tubers and slices had a high moisture content, around 85% and 76%, respectively. From Table 1, it is obvious that the four waste streams consist of carbohydrates, lipids and lignocellulosic substances, ingredients revealing an ideal substrate for biofuel production. More specifically, potato peels (PP) contain starch (17.3% ± 0.6%) and cellulose (18.9% ± 1.6%) in similar percentages, and 20.4% ± 0.6% acid insoluble residue (AIR). The high lignin content makes the saccharification of raw material difficult and less effective, thus a suitable pretreatment may be favourable. The potato tubers and slices (PT&S) contained 62.5% ± 5.6% starch. Starch waste (ST) is made of 83.4% ± 5.0% starch. Chips waste (CH) mainly consists of starch (51.0% ± 1.9%) and oils (36.6% ± 0.7%), implying that it is a rich medium for both bioethanol production and biodiesel.
In Table 1, apart from the chemical composition of the four waste streams, a literature comparison is also presented. Regarding the potato peels, the experimental values fall within the literature range, apart from hemicellulose. This fact may be attributed to the different techniques applied and machinery used in the industrial plants for peeling, as well as the different potato varieties cultivated. The same also applies for the discrepancies noted for potato tubers and slices, along with the fact that there is not much literature available for this feedstock. Low-quality chips also fall well within the literature range.

3.2. Pretreatment Method Investigation in Lab-Scale

Each feedstock, although they all derive from potatoes, has a different chemical composition and structural characteristics. Thus, the need and the kind of pretreatment technique is dependent on the feedstock. Therefore, various pretreatment methods were examined. At first, no pretreatment was tested; instead, simultaneous saccharification and fermentation (SSF) was applied directly to each substrate. It was decided in advance that, for the substrates that would reach an ethanol yield over 60% without pretreatment, then no pretreatment would be applied, in order to keep the costs as low as possible.
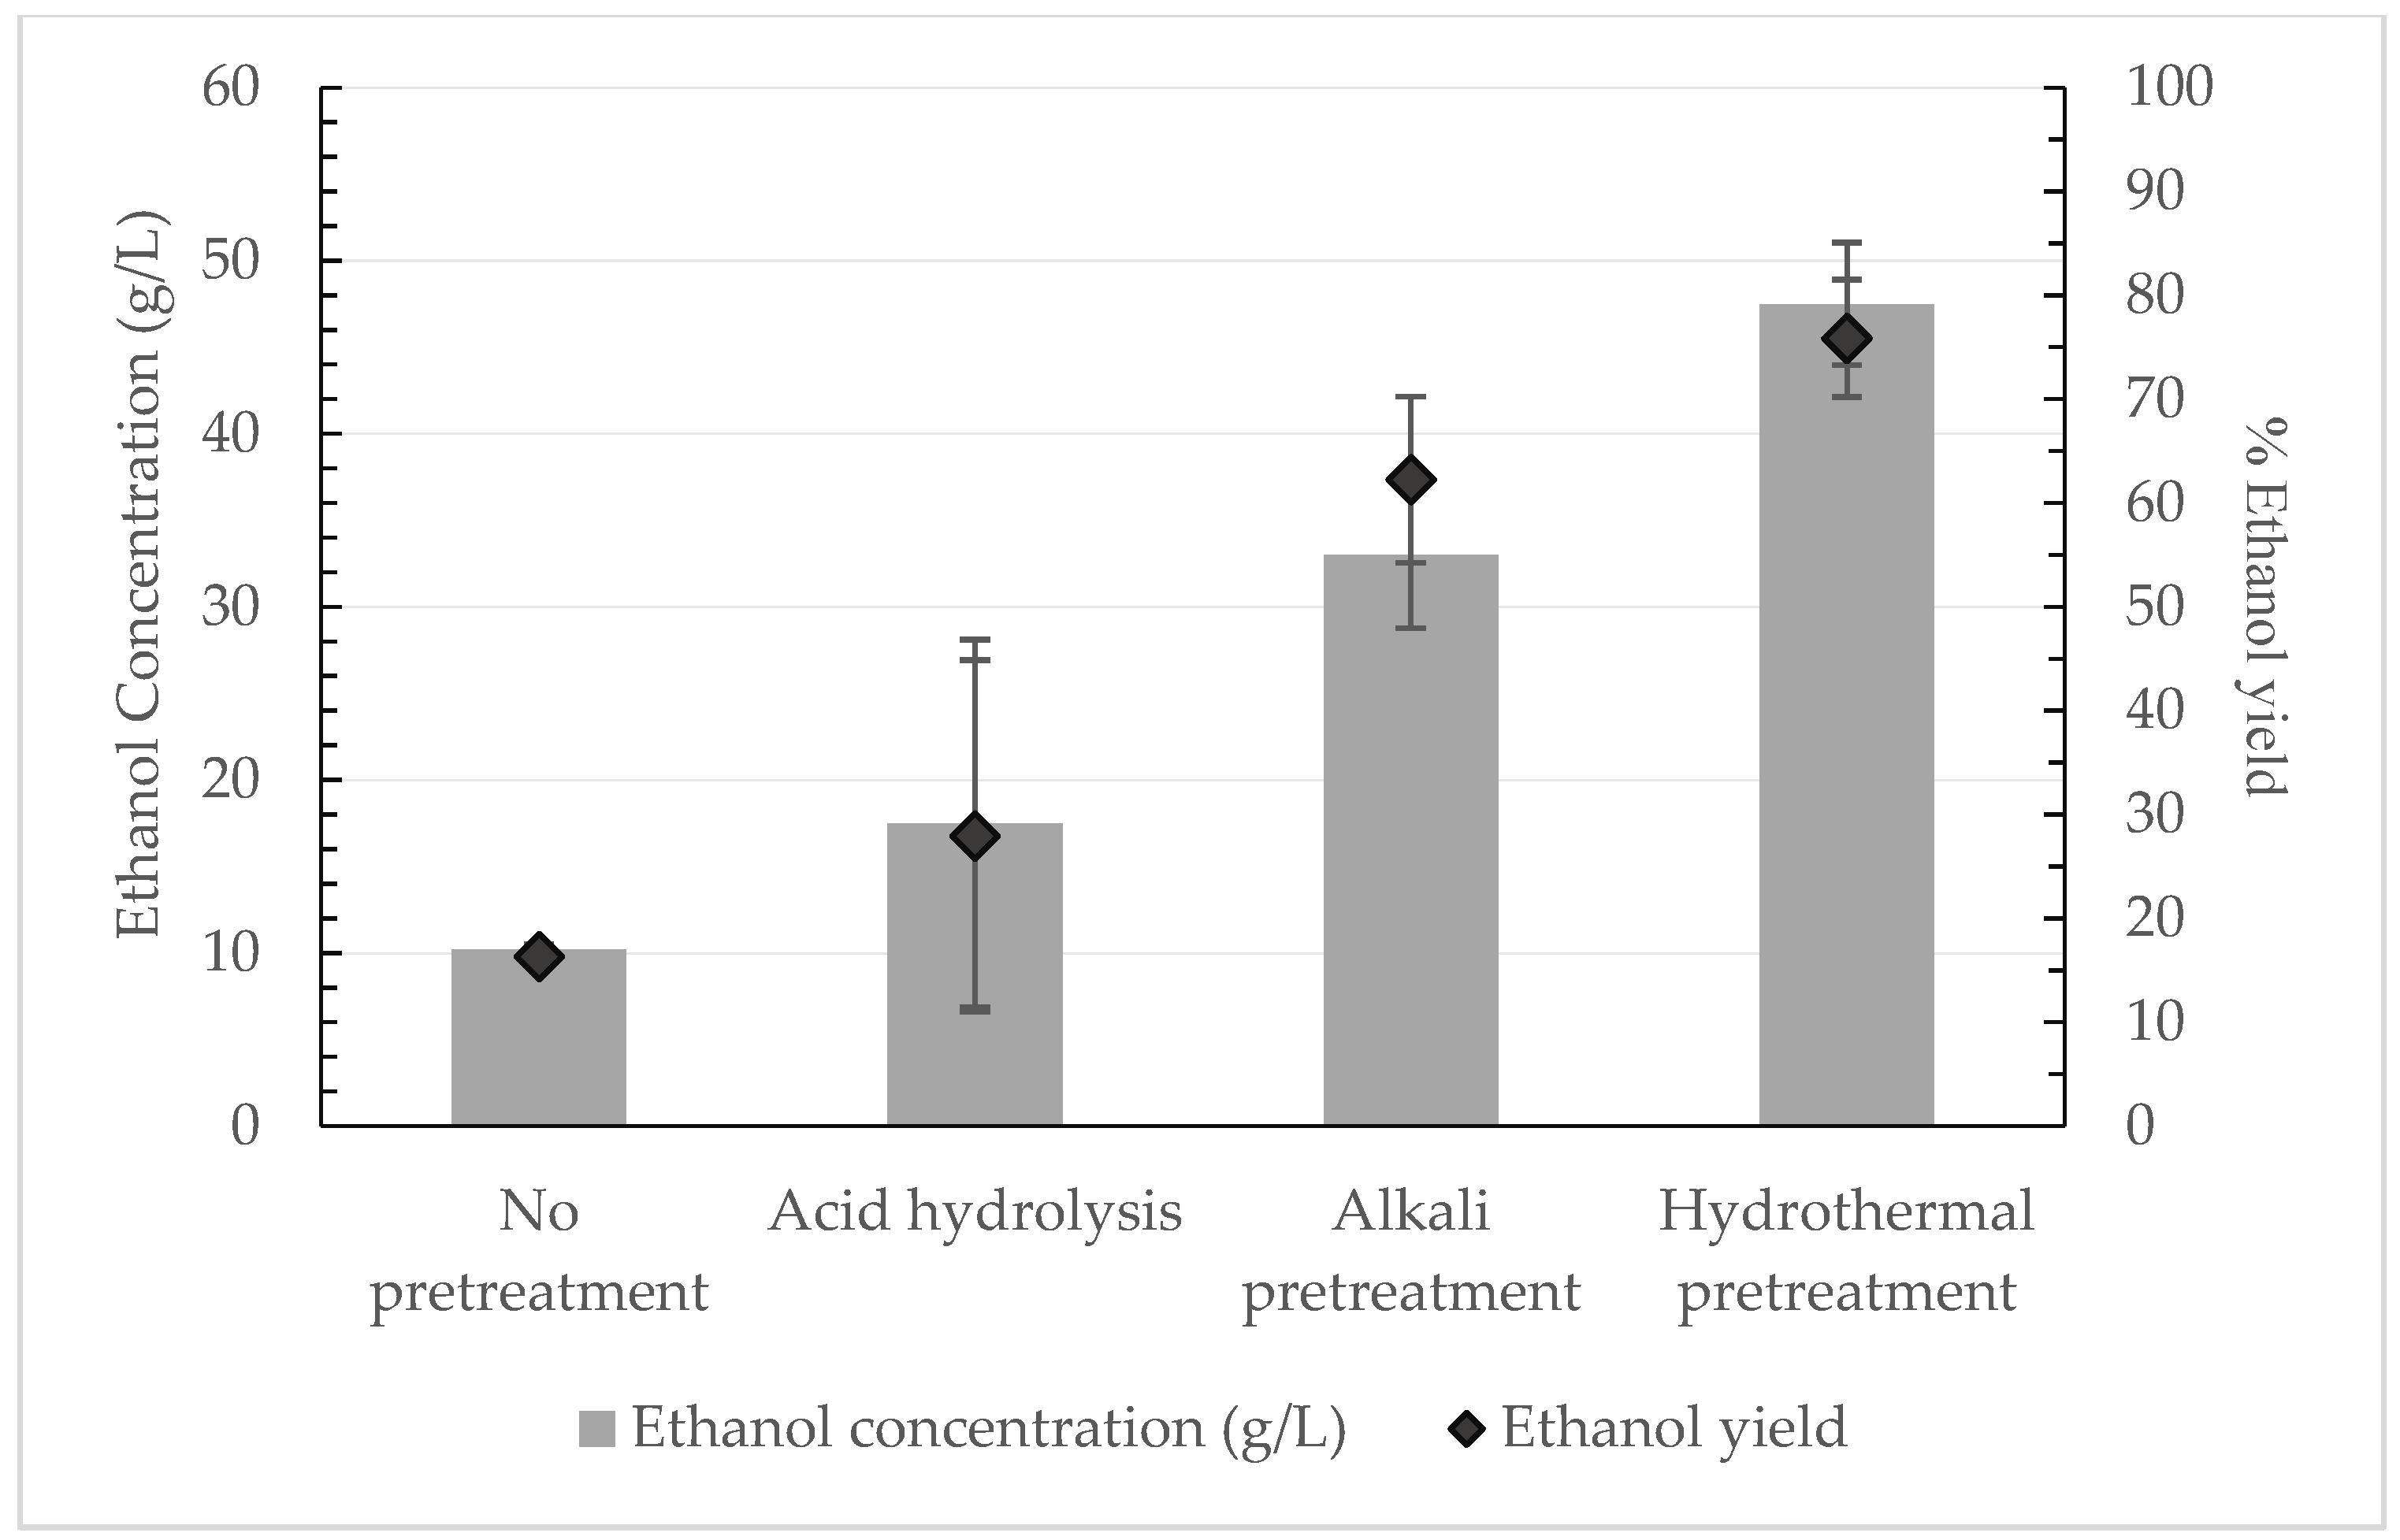
According to Figure 2, the most effective substrate for producing bioethanol, without the requirement for pretreatment, was found to be the potato chips, since 37.0 ± 2.0 g ·   L 1 of bioethanol was produced by the use of 40 μ L Spirizyme   Excel   XHS ·   g starch 1   and 2% w/w S. cerevisiae at 35 °C, for 24 h at 15% solid loading. The corresponding ethanol yield obtained was 72.4% ± 3.9%. The thermal processing pretreatment within the production line of the potato chips during frying may have affected positively the ethanol yield. Furthermore, the starch waste also achieved a high bioethanol concentration (49.0 ± 6.0 g ·   L 1 ) and rather high ethanol yield, 64.6% ± 3.4%.
Subsequently, three pretreatment methods were applied to the potato peels and the potato tubers and slices in order to select the appropriate one for further study. Firstly, an acid hydrolysis was tested, which can be considered as both pretreatment and hydrolysis methods for the raw material [30]. Secondly, an alkali pretreatment was applied, which can break down the lignin, providing better access to enzymes for cellulose hydrolysis [18]. Finally, a hydrothermal pretreatment was conducted, as it modifies the internal structure of the solid, enhancing the enzymatic degradation [31].
Figure 3 and Figure 4 illustrate the ethanol concentration and yield that was obtained for each pretreatment method and for each waste stream.
For the potato peels, alkali pretreatment provided the best results, as the ethanol yield reached 96.6% ± 0.7%. Similar ethanol yields were observed from hydrothermal and alkali pretreatment of potato peels, according to Taher et al., which is also inferred from Figure 3 [28]. On the other hand, Taher et al. [28] observed a 58% saccharification yield when potato peels were pretreated with 1% w/v NaOH and followed by incubation at 121 °C for 30 min. For the potato tubers and slices, hydrothermal pretreatment seemed favourable and was examined deeper, since the other pretreatment techniques examined did not adequately decompose the carbohydrates. Atitallah et al. [32] stated that a 96% saccharification yield was obtained via hydrothermal pretreatment, demonstrating the effectiveness of the technique. Nevertheless, a direct comparison with the results of the present study cannot be performed, since a different fermentation mode was applied. Even though hydrothermal pretreatment seems beneficial for all the substrates, it is not always favourable because of its significant energy consumption.
It appears that acid hydrolysis did not benefit any substrate, contrary to the literature, in which the total hydrolysis of the starch and approximately 65–67% ethanol yield was achieved in some reports [15,32,33]. Furthermore, Izmirlioglu et al. [34] reached a 92% theoretical ethanol yield in biofilm reactors from potato waste hydrolysate at 34 °C. In addition, Hashem et al. [35] reported that the maximum ethanol yield (97%) was achieved by fully hydrolysed starch (with 1% H2SO4 at 100 °C) at 35 °C by S. cerevisiae.

3.3. Factorial Designs

Based on the optimum pretreatment, four factorial designs, one for each feedstock, were performed to evaluate the bioethanol production in terms of bioethanol concentration. For this purpose, the liquid phase of the residues after fermentation was analysed in terms of ethanol and glucose concentrations. These results are presented in Table 2, Table 3, Table 4 and Table 5.
The potato peels seem to offer the highest ethanol concentration (9.5 ± 0.4 g · L 1 ), when 1% w/v NaOH was added, with 40 μ L spirizyme   Excel   XHS   · g starch 1 and 175   μ L NS 87014 ·   g cellulose 1 . The ethanol concentration from the potato tubers and slices reached 66.3 ± 1.8 g · L 1 , with 60 μ L spirizyme   Excel   XHS · g starch 1 and 20% solid loading, after hydrothermal pretreatment and SSF. The starch waste produced 58.0 ± 2.8 g · L 1 of bioethanol, with 60 μ L spirizyme   Excel   XHS · g starch 1 and 20% solid loading, when SSF took place for 48 h. As far as the chips are concerned, the optimum results were obtained under SSF, with a low dosage of enzyme (20 μ L spirizyme   Excel   XHS · g starch 1 ) and 20% solid loading, which were the most favourable conditions within the range studied. It should be noted that, in all the cases and waste streams, a fairly high ethanol yield was acquired. Additionally, the fact that the glucose concentration is essentially zero at the end of fermentation implies that S. cerevisiae has completely metabolized it.
Taking into consideration the results of the factorial experiments presented Table 2, Table 3, Table 4 and Table 5, the following equations were constructed (in coded and physical values) in order to indicate the impact of the chosen operational conditions on the maximum ethanol concentration.
Coded values:
C E t O H ,   P P = 3.9 + 2.3   X 1
C E t O H , P T & S = 41.3 + 7.5   X 1 + 13.7   X 2 + 3.8   X 1   X 2
C E t O H , S T = 37 + 14   X 1   X 2
C E t O H , C H = 37.3 1.8   X 1 + 9.3   X 2 1.8   X 1   X 2
Physical values:
C E t O H ,   P P = 2.8 + 112.5   NaOH
C E t O H , P T & S = 18.9 + 0.2 · Spirizyme   Excel   XHS + 137.2 · Solid   loading + 0.9 · Spirizyme   Excel   XHS · Solid   loading
C E t O H , S T = 16 + 140 · Solid   loading
C E t O H , C H = 22.5 0.04 · Spirizyme   Excel   XHS + 92.5 · Solid   loading 0.4 · Spirizyme   Excel   XHS · Solid   loading
Equations (4)–(7) refer to the coded values, while Equations (8)–(11) refer to the corresponding physical values. The ethanol generation from potato peels seems to be mostly impacted by the quantity of NaOH. For the ethanol production from potato tubers and slices, all the parameters are statistically important, along with their interaction. However, the statistically most important parameter is the solid loading. Contrarily, the ethanol production from starch waste seems to be positively influenced by solid loading, meaning that, as the solid loading increases, the ethanol concentration levels rise, which is beneficial. Of course, this was anticipated, but there are mass low restrictions regarding how high the solid loading may be. Finally, it seems that, in the case of chips, the amount of enzyme negatively affects the ethanol concentration, while the ethanol concentration is again mostly affected by the solid loading. Given the mild pretreatment that potato chips have undergone within the production line, the concentration of glucose may rise extremely quickly, inhibiting the functioning of the yeast.

3.4. Pilot Scale

The overall conversion efficiencies indicate the potential of potato processing industry waste as biomass for large-scale bioethanol production. Thus, experiments for each substrate were conducted on a pilot scale, applying the conditions that reached the maximum ethanol concentration. The potato peels were pretreated with 1% w/v NaOH for 6 h at 50 °C. After temperature and pH adjustment, the mixture of 5% solid loading was fermented at 35 °C by adding 40 μ L Spirizyme   Excel   XHS · g starch 1 , 175 μ L NS 87014 · g cellulose 1 and 2% w/w S. cerevisiae. The potato tubers and slices underwent hydrothermal pretreatment and then SSF of 20% solid loading with 60 μ L Spirizyme   Excel   XHS · g starch 1 and 2% w/w S. cerevisiae at 35 °C. Direct SSF was performed for the starch, with 60 μ L Spirizyme   Excel   XHS · g starch 1 and 2% w/w S. cerevisiae at 35 °C, and also for the chips, with 20 μ L Spirizyme   Excel   XHS · g starch 1 and 2% w/w S. cerevisiae at 35 °C.
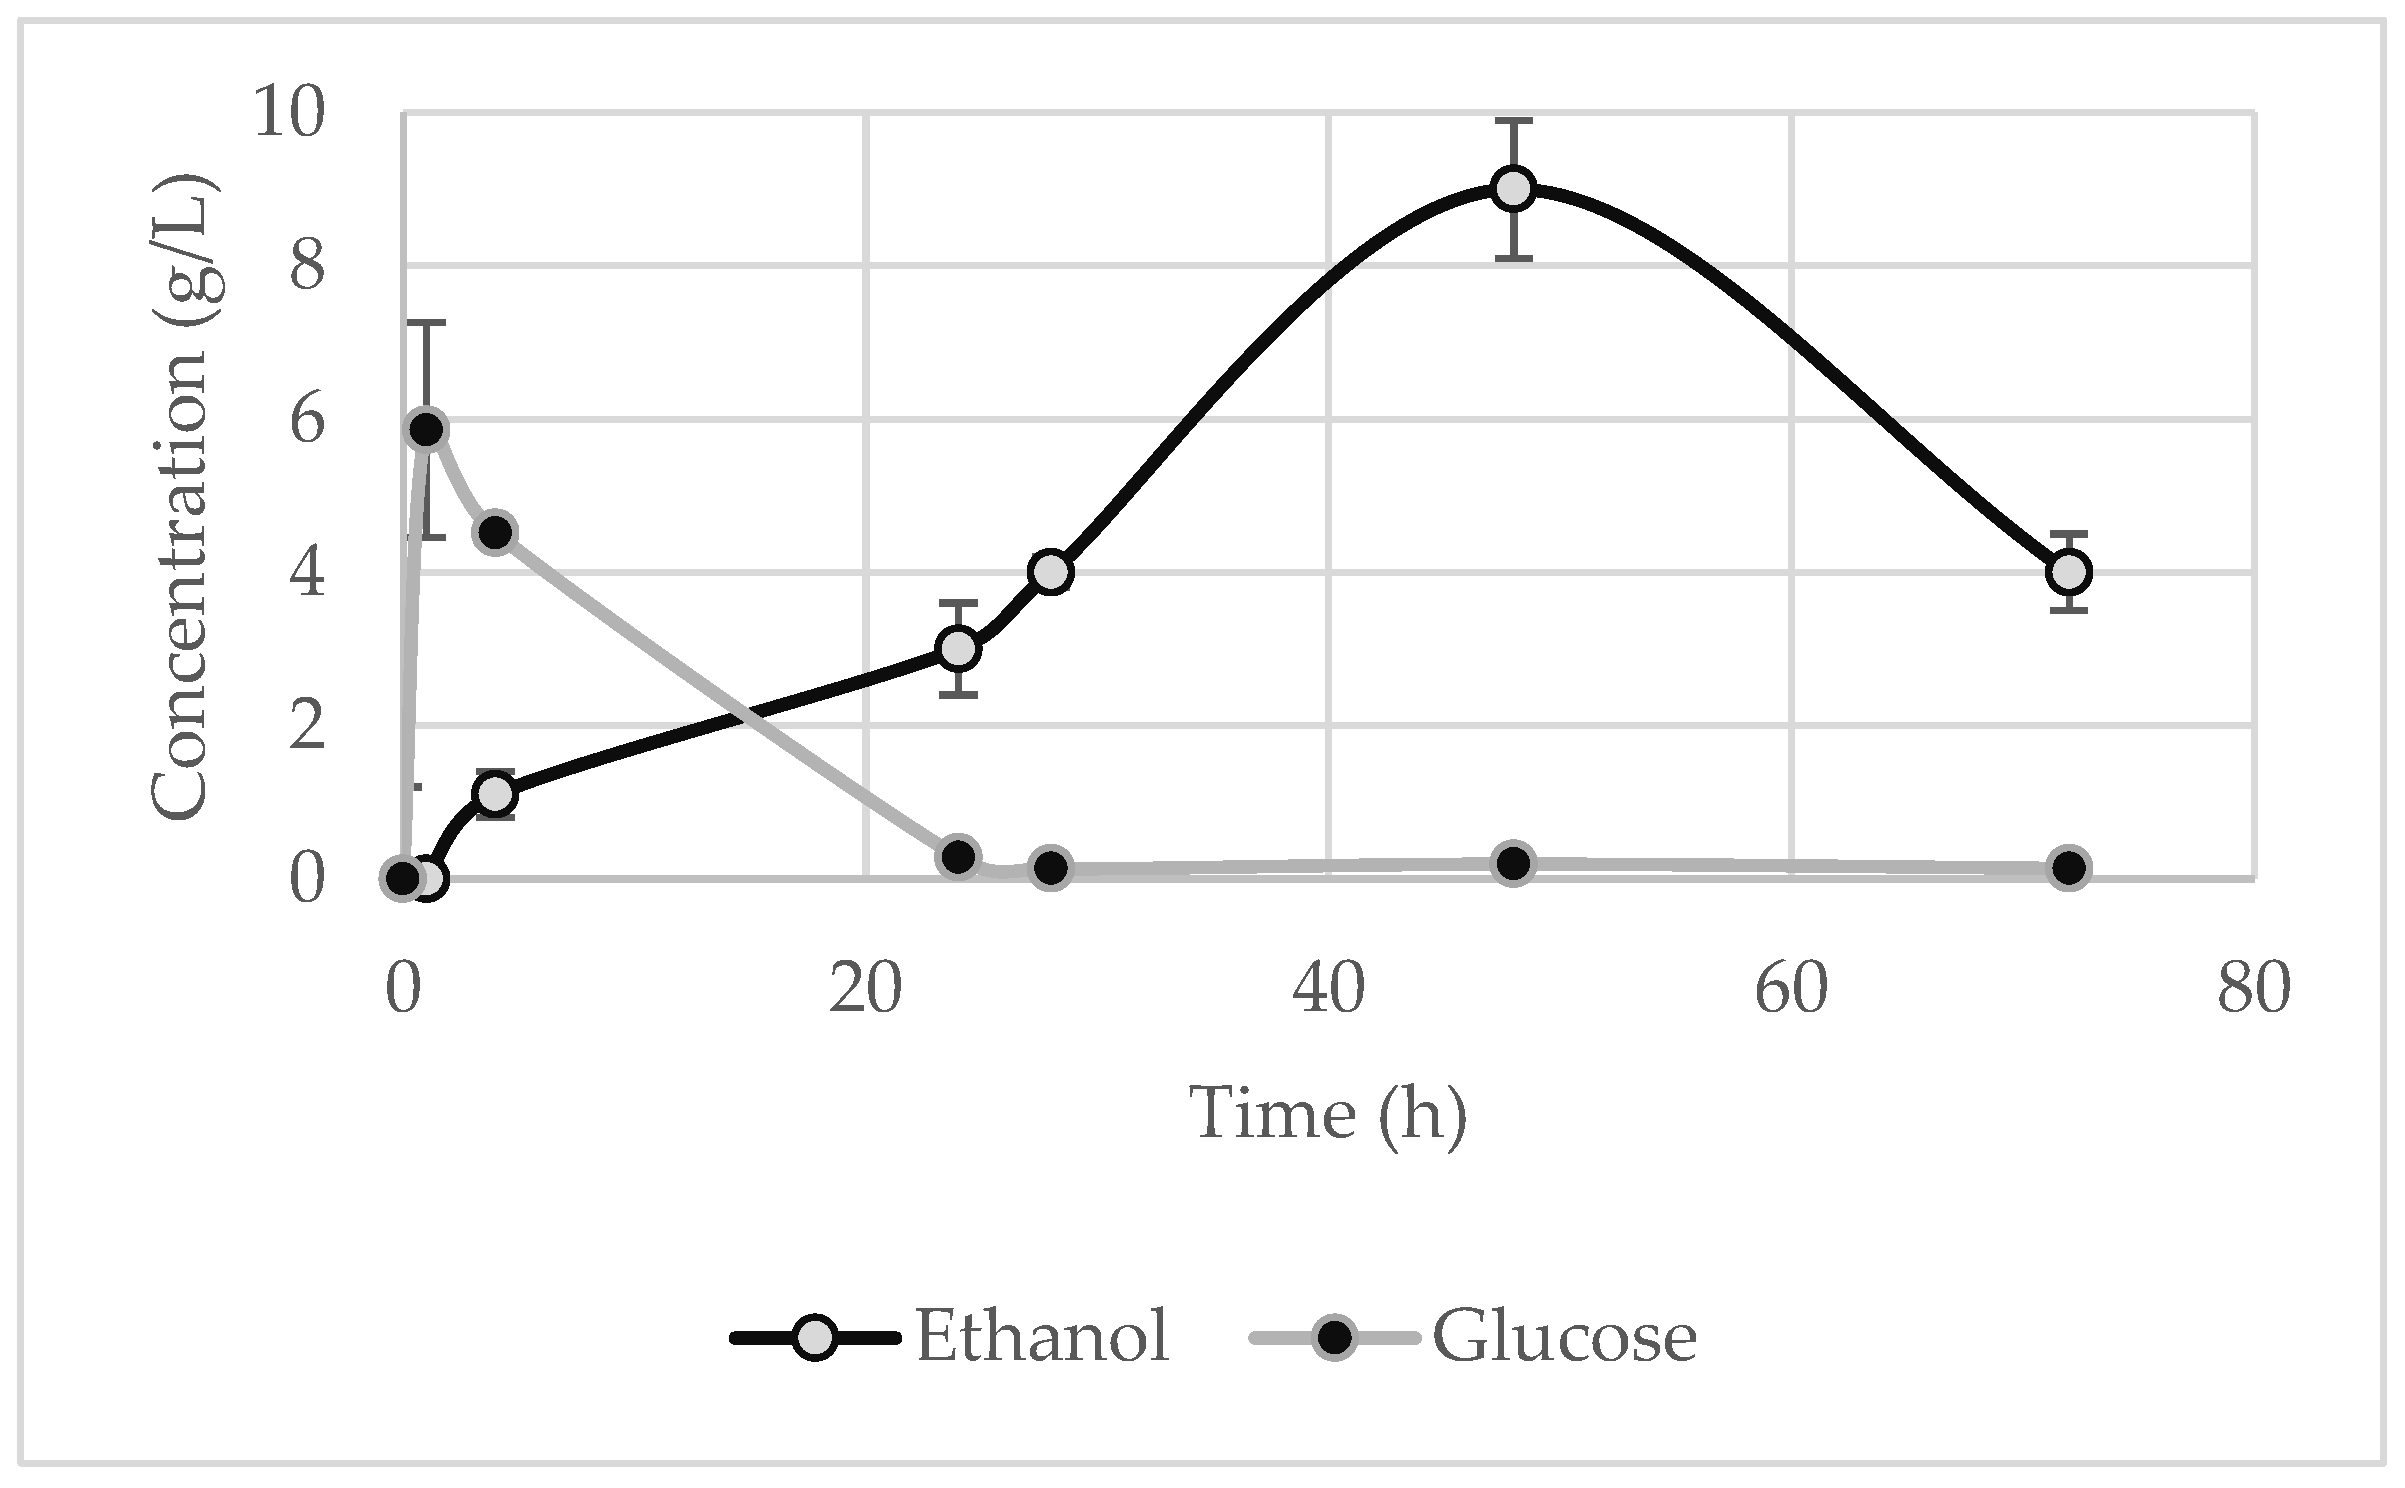
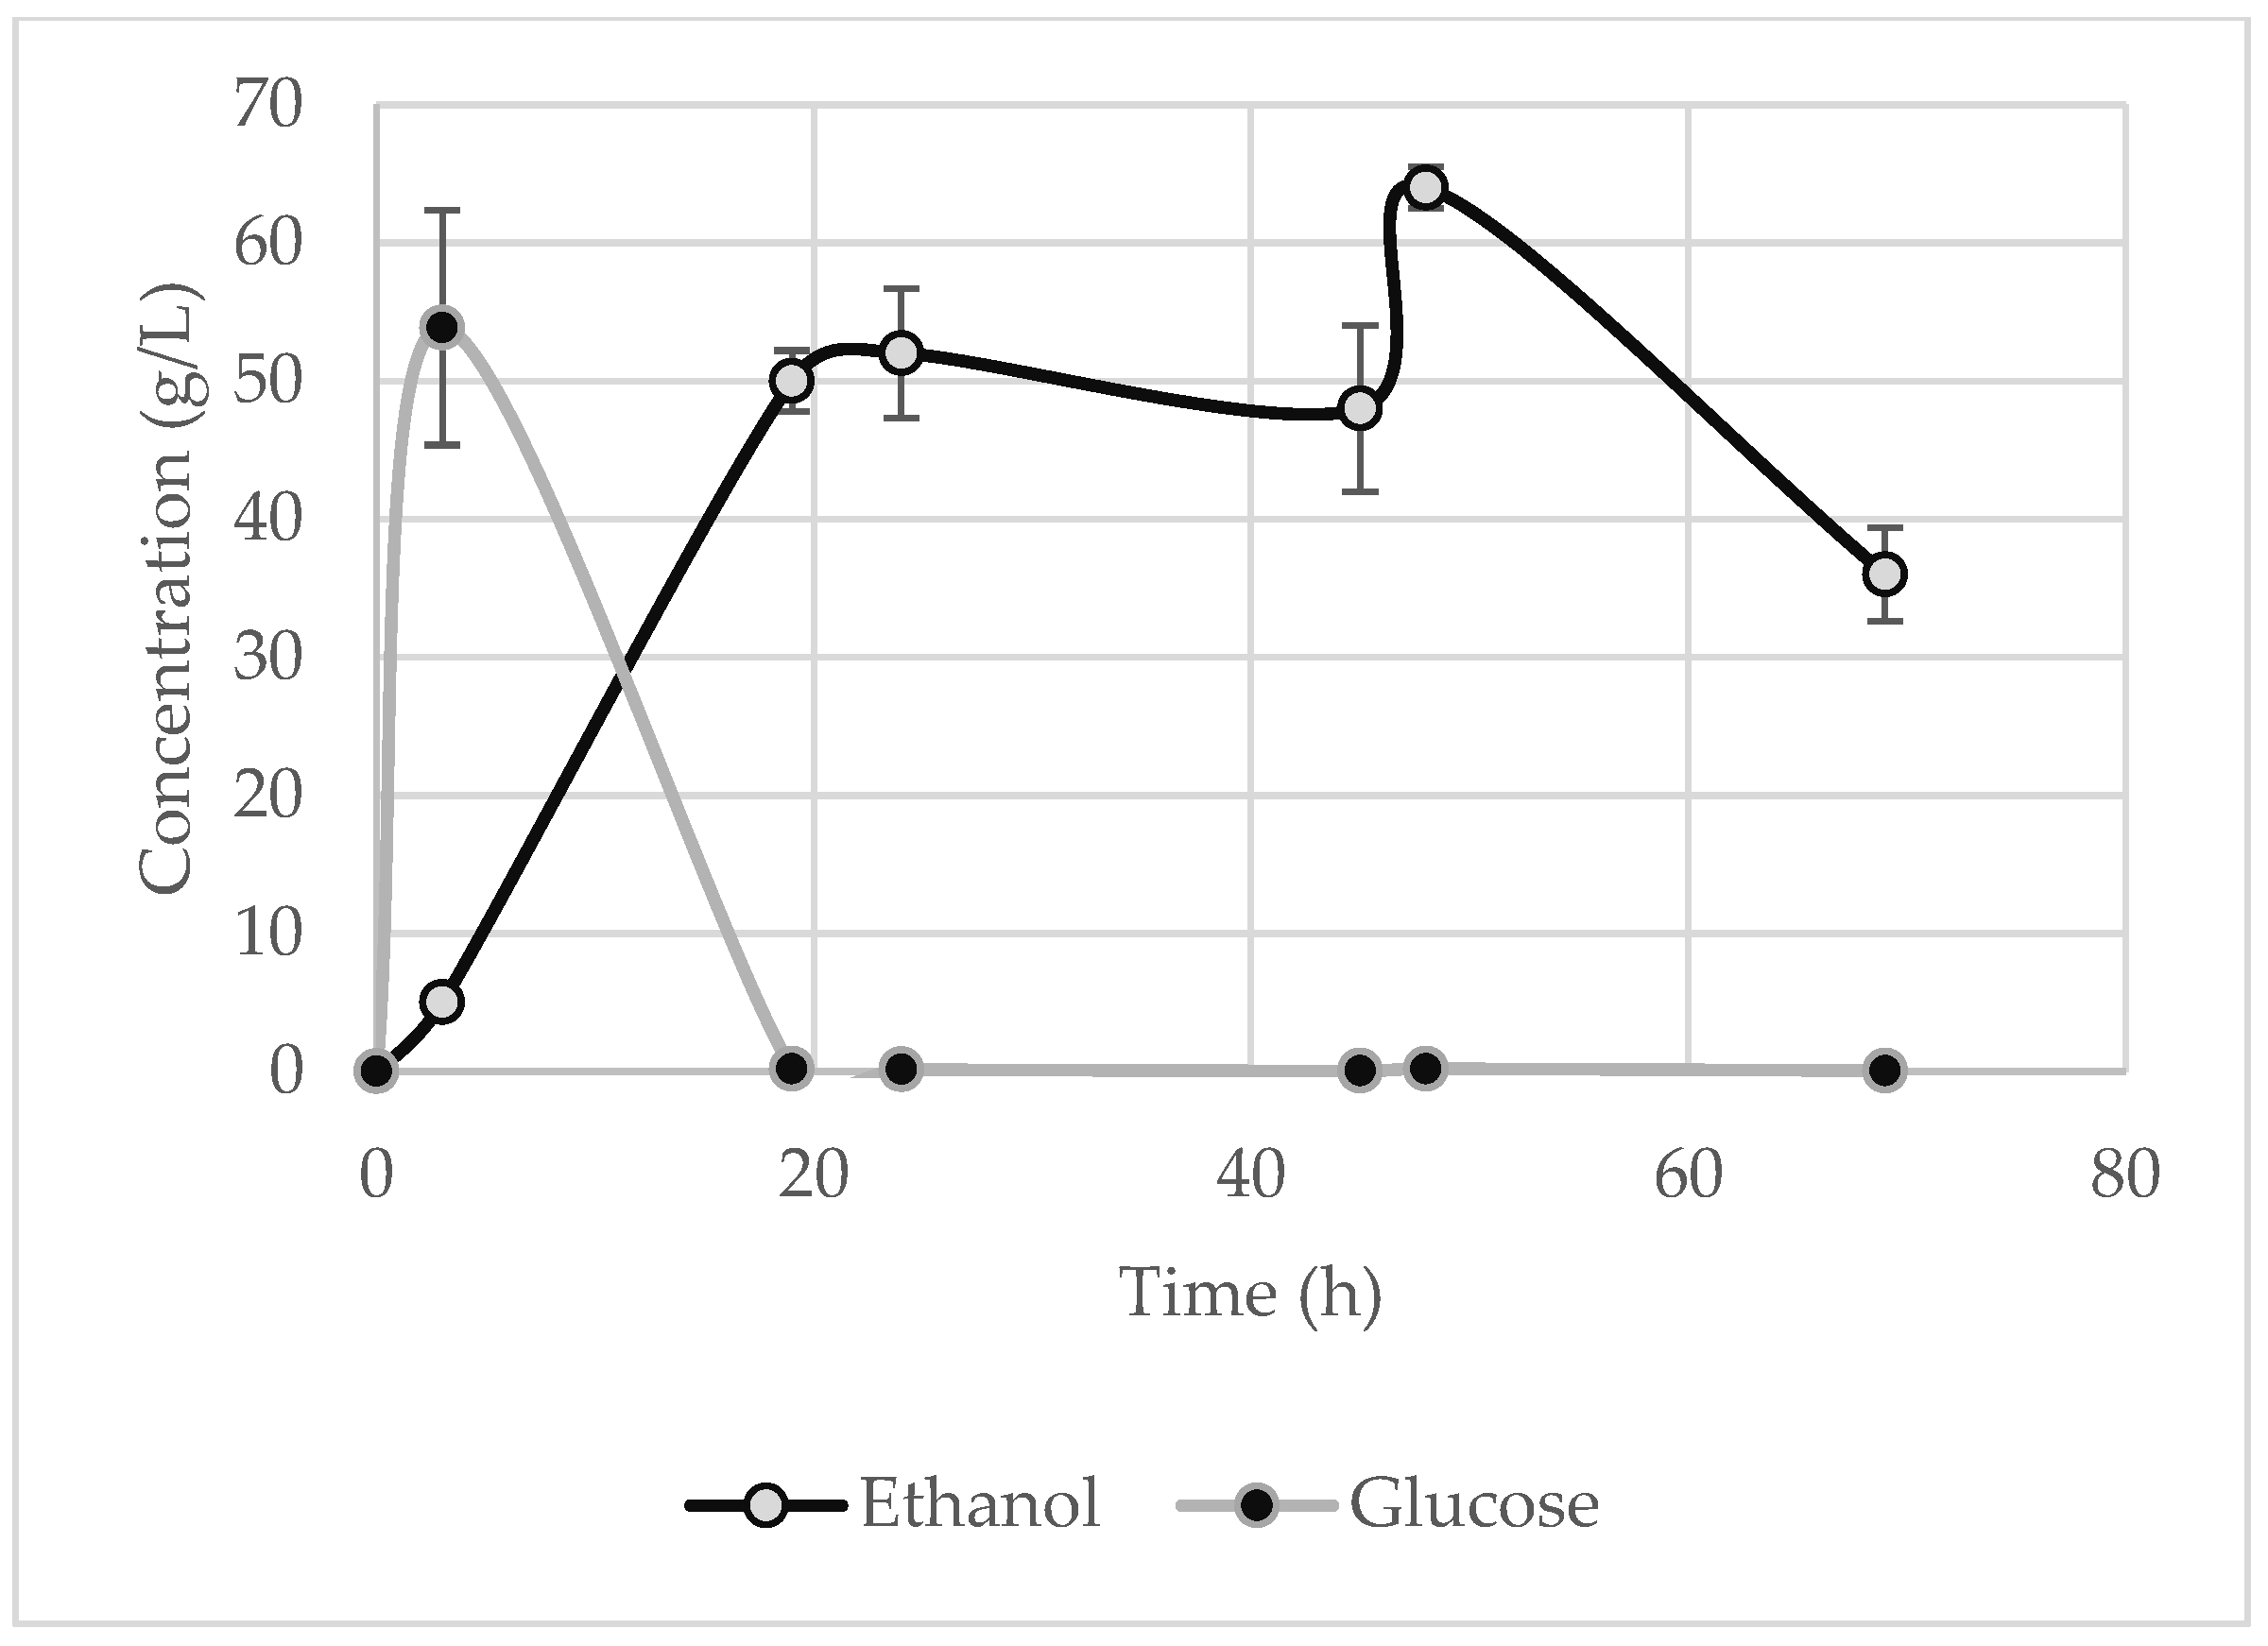
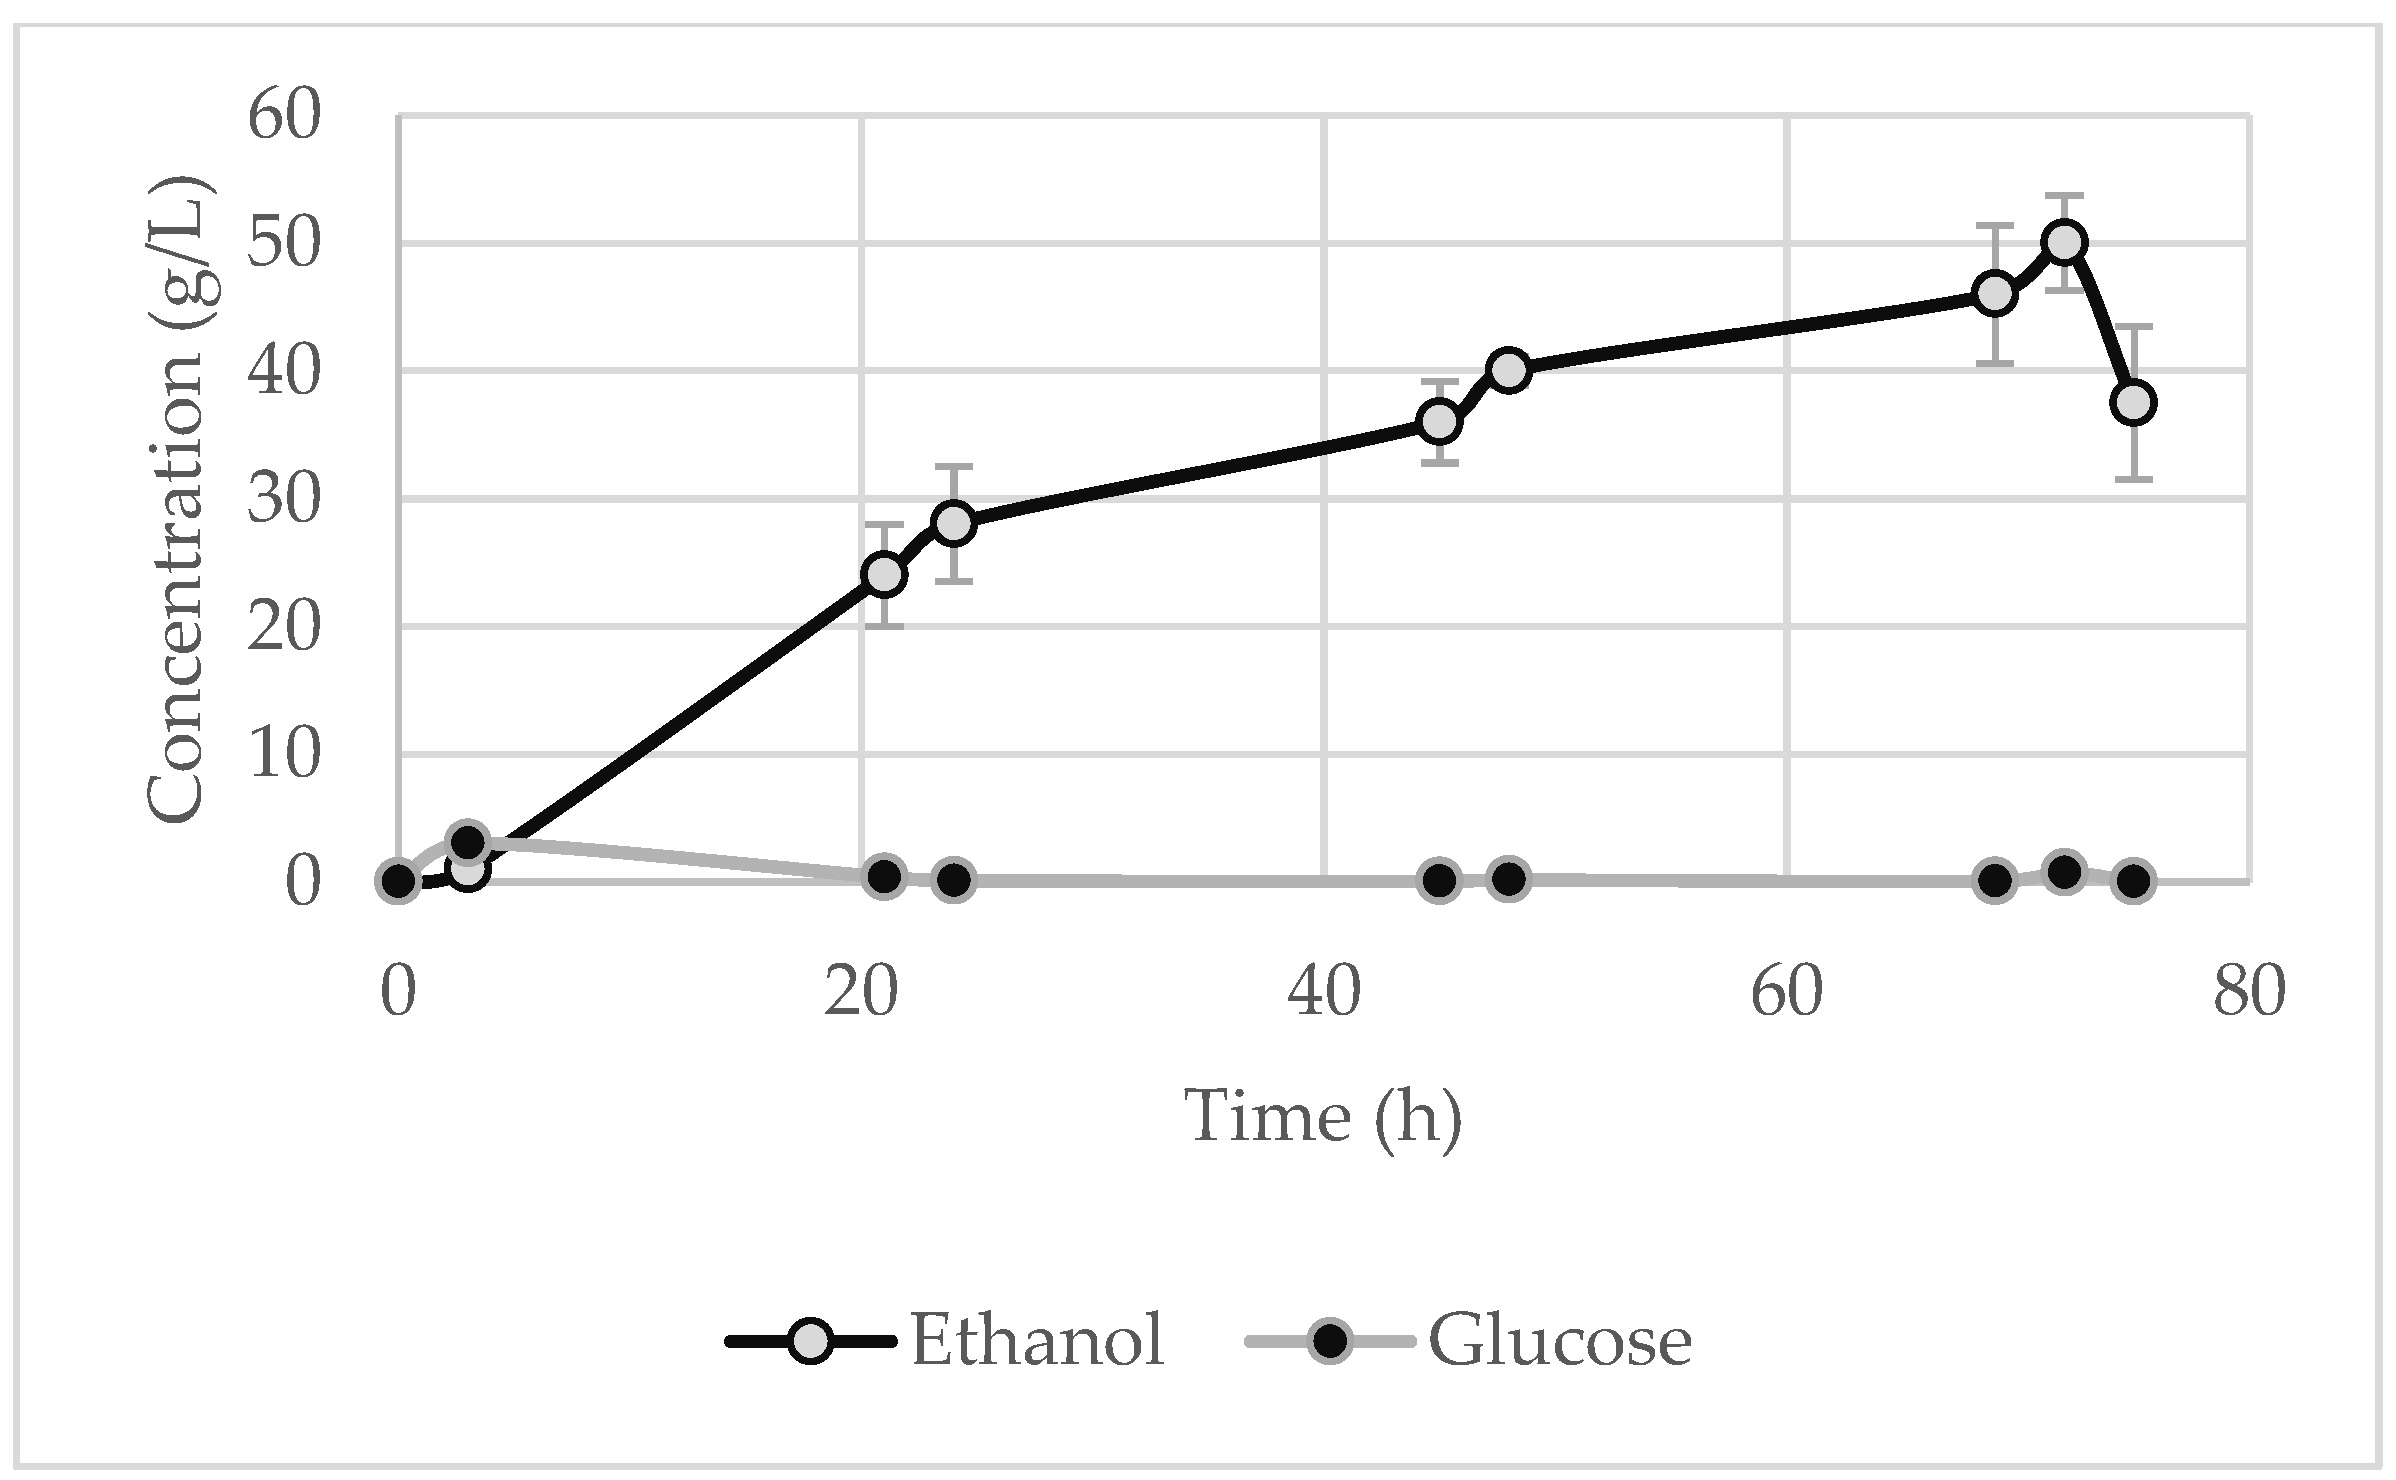
At regular time intervals, a sample was collected to measure the glucose and ethanol in order to study the kinetics of the reaction and to determine the maximum ethanol concentration. It is clear from the figures below that, during the first few hours, the glucose reached a peak before being entirely assimilated by the yeast. It should be noted, though, that for the starch waste (Figure 7), the glucose concentration did not rise as sharply, since probably the high starch content and the low temperature discouraged the enzymes’ ability to rapidly break down the starch. Thus, the microorganisms directly metabolise the produced glucose, as seen by the gradual generation of ethanol, and no sharp peaks are evident for glucose.
The maximum ethanol concentration was observed at 48 h for the potato peels and the potato tubers and slices, whose values are 9 ± 0.9 g·L−1 (Figure 5) and 64 ± 1.5 g·L−1 (Figure 6), respectively. These results are identical to those of the laboratory-scale trials. The highest ethanol concentration for the starch waste was recorded at 72 h (50 ± 3.7 g·L−1) (Figure 7), which corresponds to a 42.2% ± 2.2% ethanol yield. By comparing these values to the values that had derived from the experiments of the factorial design, lower ethanol concentrations were achieved for longer durations of fermentation. In contrast, the upscaling for the chips operated effectively, since the ethanol concentration reached 57.5 ± 3.2 g·L−1 after 27 h (Figure 8). Thus, it can be concluded that, in terms of ethanol production, scaling up by 1000 times generates comparable and, in some cases, greater results.
Table 6 presents the degradation of the total solids and starch of the feedstocks after SSF. As expected, the starch was almost fully converted to glucose, which, in turn, was fully consumed, thereby achieving a high percentage of starch degradation in all the substrates. The solid degradations achieved were also quite high (apart from the potato peels), which is very important given that the solid waste is converted to a bioproduct and to a liquid waste that is more easily handled. It is also worth noting that, for the potato peels, the degradation of cellulose was 69.1% of the initial solid, a quite high degradation efficiency for lignocellulosic feedstocks.

3.5. Full Scale Implementation

3.5.1. Mass Flows

A potato chip company, in 2021, processed 7800 tons of potatoes, producing 2200 tons of chips as the final product. Four distinct waste streams are produced from the potato chip production line: waste from peeling (potato peels), from sorting (potato tubers), from slicing (potato slices and starch) and from frying (bad-quality chips). According to the record data from the company for 2021, 330 tons of potato tubers and slices, 76 tons of potato peels, 201 tons of starch and 76 tons of rejected chips were derived as waste.
Considering 260d annual operation, the potato chips company is processing 30 tons/d potatoes to produce 8.5 tons/d of chips, and the daily mass flows of waste are presented in Table 7. The quantities of waste are expressed on a dry basis.

3.5.2. Current Waste Management

In regard to the current waste management of the potato chip company, the potato peels along, with the sewage sludge from the existing aerobic wastewater treatment plant, end up in a landfill, resulting in an additional cost for the company. The potato slices and tubers are distributed to farmers free of charge, while the bad-quality potato chips are sold for 80–90 €/ton as animal feed for pigs. Finally, the starch from the slicing step is sold for 120 €/ton to a company for starch glue production. As a result, the company’s profit from waste is approximately 2300 € per month. However, it must be considered that the use of raw waste as animal feed is restricted by European legislation, which outlines the regulations that control the trade of raw ingredients used in animal feed and compound feed [36]. Apart from that, the landfilling of waste results in an extra environmental cost that burdens the carbon footprint of the industry. Hence, there is a pressing need to strive toward producing food with a low carbon footprint, reducing food waste, and finding new uses for the waste produced during food production.

3.5.3. Valorisation of Waste

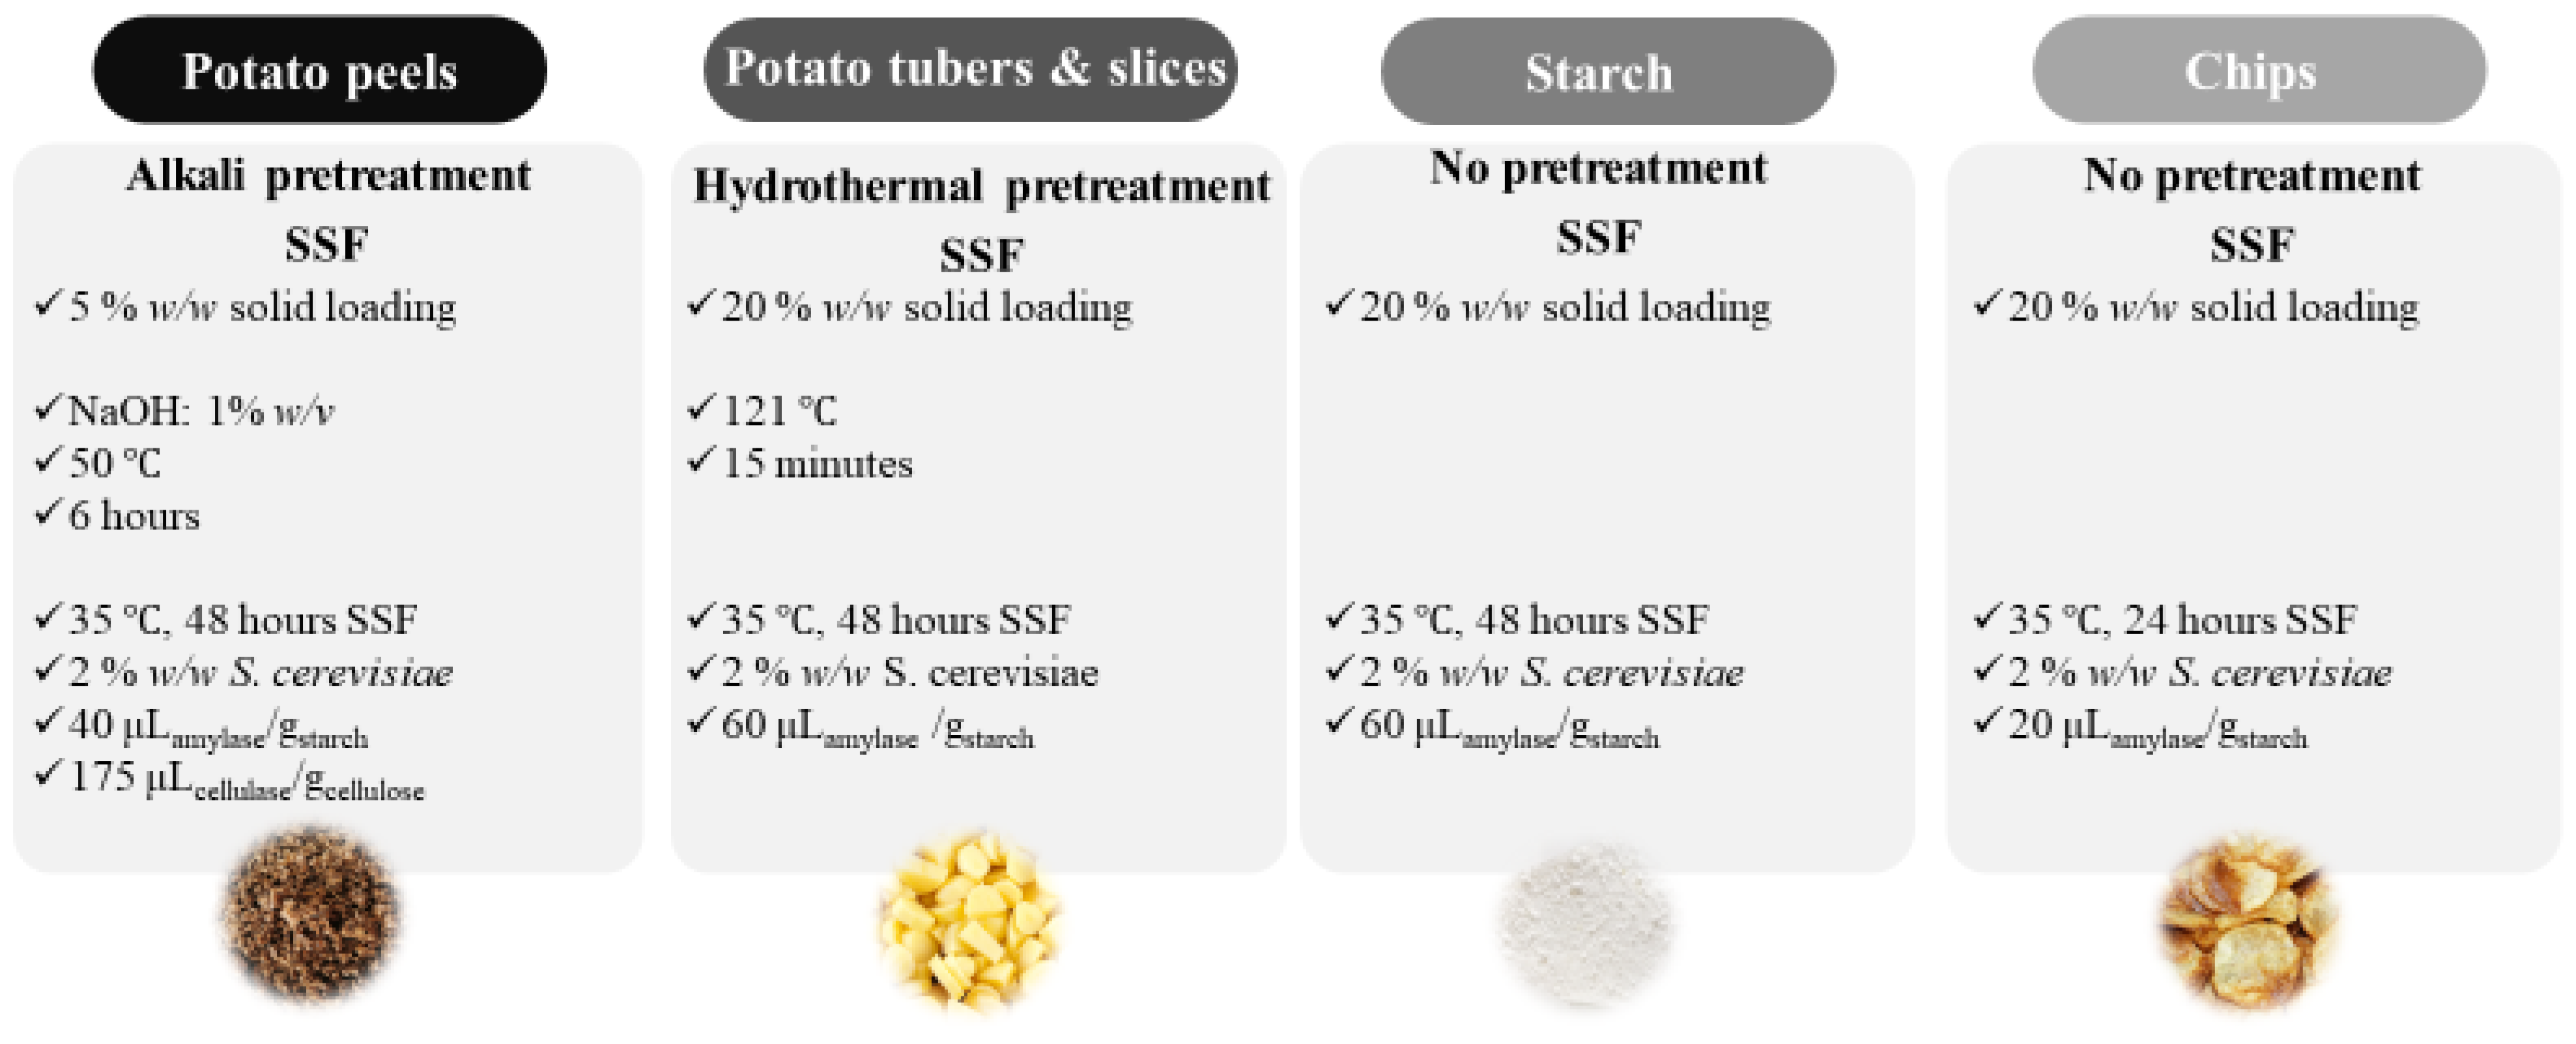
According to the results presented in this study, the conditions shown in Figure 9 were considered optimal for bioethanol production. As mentioned, each feedstock requires different pretreatment, due to the different chemical and structural properties. More specifically, potato peels and potato tubers and slices have high moisture content (85 and 75%), therefore, minimising storage is necessary. Potato peels require alkali pretreatment, while potato tubers and slices need to undergo hydrothermal pretreatment. For the starch and the chips flows, no pretreatment is needed.
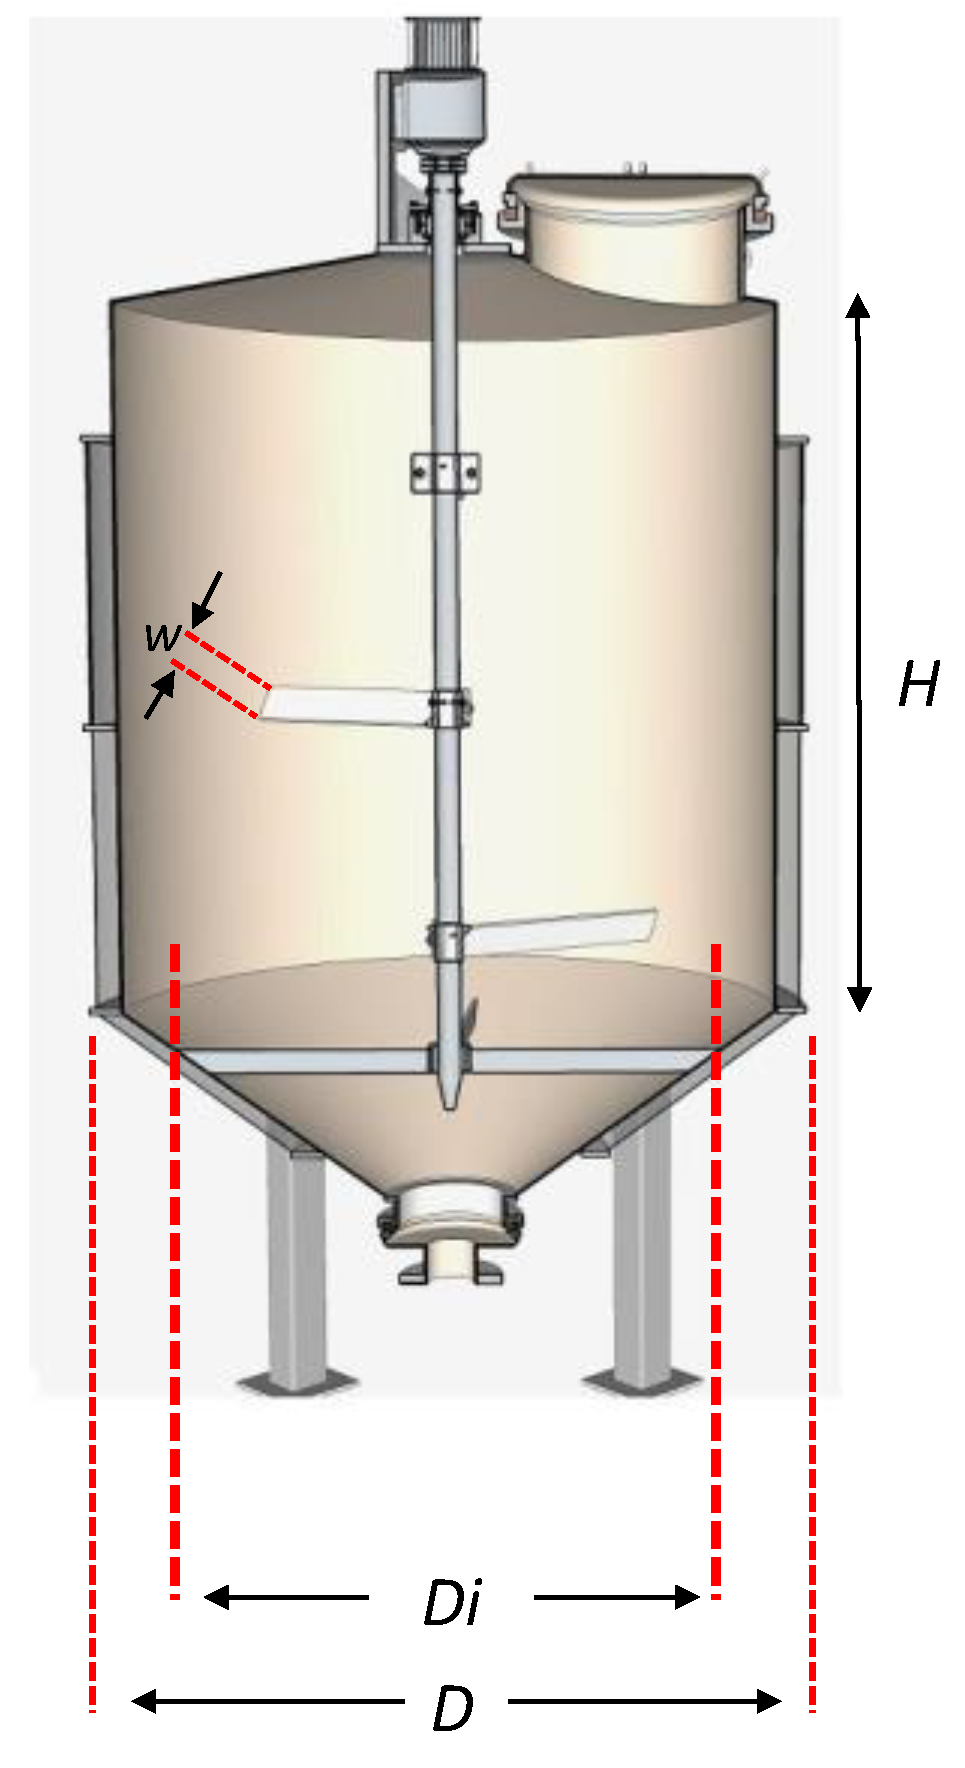
A potato chip production line operates five days per week (Monday–Friday), which corresponds to the days of waste generation. However, the bioethanol production unit may operate seven days per week. The assumptions made are as follows: (a) five days waste generation, (b) seven days waste processing, (c) 6 h idle time (loading—temperature and pH adjustment—unloading) for each batch, (d) 6 h alkali pretreatment or 15 min hydrothermal pretreatment at 121 °C, (e) 48 h fermentation, (f) 6 h distillation. Taking into consideration these assumptions, a reactor was designed to process the potato peels in two fermentation batches per week and a second reactor for the potato tubers and slices in three fermentation batches per week. For the processing of the starch and chips, a third reactor is proposed, which will perform three fermentation batches per week. Figure 10 is a graphical representation of the reactor, while Table 8 presents the dimensions of the three bioreactors.
In view of examining the mass balances and the consumables needed, Table 9 presents the inputs required per week in mass terms for bioethanol production; waste, water, NaOH, H2SO4, enzymes and yeast. There is no need for fresh water, since the treated effluent from the already existing activated sludge system could be used. Alternatively, the water from the starch filtration could be used as input water, with a positive effect on the bioethanol production.
In this way, the weekly outputs produced are bioethanol, water and solid residue. The respective quantities are presented in Table 9. The solid residue, in the form of a slurry, could be treated along with the wastewater in the activated sludge system. The produced bioethanol, after further dehydration, could be used either within the plant or be promoted to the market, either as a biofuel or fuel additive or as an industrial biosolvent. The bioethanol market is very dynamic in Europe, while there is no production of bioethanol in Greece [37]. The required quantities are imported. From the experimentation, it was estimated that the total solids of the waste are degraded by 84%. Thus, the solid waste that needs management from the industry on a weekly basis is reduced from 7.0 tons to 1.1 tons.

3.5.4. Economic Considerations

Capital Expenditure

The capital expenditure for the full-scale implementation of the proposed process includes the construction and installation costs of the required number of prototype units. In order to calculate the cost of the necessary equipment, the following equation, which expresses the rule of six-tenths, was used for the capital expenditure:
C B = C A ( S B S A ) 0.6
where C B   is the cost of equipment of size S B (m2); C A is the known cost of equipment of size S A (m2); and S B / S A is the dimensionless size factor [38]. Thus, the total construction cost for a capacity of 17.1m3 was estimated at 189,655 €.
Moreover, another important aspect of the capital expenditure is the installation cost. In the economic analysis of the pilot plant, it was calculated that the installation cost reached a percentage of 10% of the total capital cost. Therefore, the same percentage can be used to calculate the installation of the full-scale equipment, which reaches the amount of 18,965.5 €. The total capital expenditure for a plant to valorise the waste of the potato chips company is calculated to be 208,620.5 €.

Operating Expenditure

Concerning the operating expenditure of the plant, the annual staff costs are considered low, since the plant will be fully automated and the existing staff of the industry could operate it. Regarding the cost of consumables, Table 10 presents their cost on a weekly basis, based on the optimum conditions and the applied pretreatment method.
Another aspect of the operational cost is the cost of energy consumption from Table 11. According to the operation of the pilot plant of a 200L capacity, the energy consumption of the proposed plant was calculated, taking into consideration the upscaling factor.
Conclusively, the total operational cost is calculated at 1647 €/week.

Economic Benefits

As described above, the potential uses of the bioethanol produced will be as biofuel or as biosolvent. It has been estimated that 1928 L/week bioethanol could be produced by the valorisation of potato chips industry waste. The mean price of ethanol is 1.10 USD/L globally. Nevertheless, there is a great price range among countries, from 0.771 in France to 1.433 in Sweden and 1.898 in Spain. Product prices are determined based on four critical factors: (a) product quality, (b) market demand for bioethanol and competing product prices, (c) production and distribution costs, and (d) results from market research, based on how much the consuming public would be willing to spend to obtain the product. The high volatility of the bioethanol price has led to selecting the average value as the price of the bioethanol for the examined business case at 1.2 €/L.
Regarding the capacity of the unit, the plant is expected to produce 1928L per week. Based on the aforementioned, the annual economic benefit from the bioethanol sales is expected to reach 103,649 €.

4. Conclusions

In conclusion, because of the high carbohydrate content in waste derived from the potato chips industry, a wide range of bioprocesses can be utilized to generate value-added bioproducts. An investment in waste treatment could be profitable for a company from an economic and environmental point of view. The volatility of the biofuels market renders it much more interesting.
Simultaneous saccharification and fermentation (SSF) was applied after the appropriate pretreatment, which rendered the desired carbohydrates available to the enzymes, producing glucose, which, in turn, was converted to bioethanol. Under the optimal conditions a typical potato processing company can obtain 1928 L/week of bioethanol. As a result, the valorisation of waste via ethanolic fermentation provides an innovative solution for a potato chips company, since an 84% reduction of solid waste that needs treatment could be achieved, and, at the same time, the monthly economic benefit from the ethanol sales could reach 8639 €, which is 3.7 times greater than the profit from the waste sales to farmers and the glue industry.
It is noteworthy that residues from ethanol distillation may be used as fuel for anaerobic digestion, which produces biogas and biofertilizer, and that the oil content of potato chips can be recovered and used to produce biodiesel. This constitutes a biorefinery approach, based on the circular economy, aiming to enhance the sustainability of the potato industry.
Conclusively, the proposed treatment scheme could improve significantly the industry’s carbon footprint, which may be easily calculated by the application of life cycle assessment techniques.

Author Contributions

Conceptualisation, S.M. and E.M.B.; data curation, C.S., S.M. and E.M.B.; formal analysis, S.M. and E.M.B.; funding acquisition, D.M.; investigation, V.F. and C.S.; methodology, S.M. and E.M.B.; project administration, D.M.; supervision, S.M. and E.M.B.; validation, S.M. and E.M.B.; visualization, S.M. and E.M.B.; writing—original draft, C.S., S.M. and E.M.B.; writing—review and editing, S.M. and E.M.B. All authors have read and agreed to the published version of the manuscript.

Funding

This research was funded by the EU LIFE project “CIRCforBIO” (LIFE Ref. No: LIFE18 CCM/GR/001180).

Institutional Review Board Statement

Not applicable.

Informed Consent Statement

Not applicable.

Data Availability Statement

The data presented in this study are available on request from the corresponding author. The data are not publicly available due to commercial restrictions.

Acknowledgments

This work was supported by the EU LIFE project “CIRCforBIO” (LIFE Ref. No: LIFE18 CCM/GR/001180).

Conflicts of Interest

The authors declare no conflict of interest.

References

  1. FAOSTAT. Available online: https://www.fao.org/faostat/en/#data (accessed on 4 November 2022).
  2. Dongyu, Q. Role and Potential of Potato in Global Food Security Challenges of global Food Security Contribution of Potato to the World Potential of Global Potato Production Strategies for Promoting Potato Development. Food and Agriculture Organization of the United Nations, May 2022. Available online: https://www.fao.org/3/cc0330en/cc0330en.pdf (accessed on 25 October 2022).
  3. Nikolaou, A.; Kourkoutas, Y. Exploitation of olive oil mill wastewaters and molasses for ethanol production using immobilized cells of Saccharomyces cerevisiae. Environ. Sci. Pollut. Res. 2018, 25, 7401–7408. [Google Scholar] [CrossRef] [PubMed]
  4. EU Economy and Society to Meet Climate Ambitions. Available online: https://ec.europa.eu/commission/presscorner/detail/en/IP_21_3541 (accessed on 4 November 2022).
  5. Farm to Fork Strategy. Available online: https://food.ec.europa.eu/horizontal-topics/farm-fork-strategy_en (accessed on 4 November 2022).
  6. How the European Potato Processing Industry Is Driving Sustainability throughout the Sector EUPPA Sustainability Report 2021 from Growers to Consumers. Available online: www.euppa.eu (accessed on 4 November 2022).
  7. Case for investment: Climate Change Adaptation—International Potato Center. Available online: https://cipotato.org/climate-change/ (accessed on 4 November 2022).
  8. Pathak, P.D.; Mandavgane, S.A.; Puranik, N.M.; Jambhulkar, S.J.; Kulkarni, B.D. Valorization of potato peel: A biorefinery approach. Crit. Rev. Biotechnol. 2018, 38, 218–230. [Google Scholar] [CrossRef] [PubMed]
  9. Izmirlioglu, G.; Demirci, A. Simultaneous saccharification and fermentation of ethanol from potato waste by co-cultures of Aspergillus niger and Saccharomyces cerevisiae in biofilm reactors. Fuel 2017, 202, 260–270. [Google Scholar] [CrossRef]
  10. Wu, D. Recycle Technology for Potato Peel Waste Processing: A Review. Procedia Environ. Sci. 2016, 31, 103–107. [Google Scholar] [CrossRef] [Green Version]
  11. Li, J.; Zhao, R.; Xu, Y.; Wu, X.; Bean, S.R.; Wang, D. Fuel ethanol production from starchy grain and other crops: An overview on feedstocks, affecting factors, and technical advances. Renew. Energy 2022, 188, 223–239. [Google Scholar] [CrossRef]
  12. Arpia, A.A.; Chen, W.H.; Lam, S.S.; Rousset, P.; de Luna, M.D.G. Sustainable biofuel and bioenergy production from biomass waste residues using microwave-assisted heating: A comprehensive review. Chem. Eng. J. 2021, 403, 126233. [Google Scholar] [CrossRef]
  13. Friedl, A. Bioethanol from Sugar and Starch. In Energy from Organic Materials (Biomass); Springer: New York, NY, USA, 2019; pp. 905–924. [Google Scholar] [CrossRef]
  14. Annual Ethanol Production. Available online: https://ethanolrfa.org/markets-and-statistics/annual-ethanol-production (accessed on 4 November 2022).
  15. Khawla, B.J.; Sameh, M.; Imen, G.; Donyes, F.; Dhouha, G.; Raoudha, E.G.; Oumèma, N.E. Potato peel as feedstock for bioethanol production: A comparison of acidic and enzymatic hydrolysis. Ind. Crops Prod. 2014, 52, 144–149. [Google Scholar] [CrossRef]
  16. Chavez, A.Y.; Morales, R.; Gonzalez, C.; Moya, F.V. Production of Ethanol from Two Varieties of Potato Peel Waste through Cellulolytic and Amylolytic Enzymes. Int. J. Energy Clean Environ. 2019, 21, 41–58. [Google Scholar] [CrossRef]
  17. Malik, K.; Mehta, S.; Sihag, K. Optimization of conditions for bioethanol production from potato peel waste. Int. J. Chem. Stud. 2021, 6, 2021–2024. [Google Scholar]
  18. Kim, J.S.; Lee, Y.Y.; Kim, T.H. A review on alkaline pretreatment technology for bioconversion of lignocellulosic biomass. Bioresour. Technol. 2016, 199, 42–48. [Google Scholar] [CrossRef]
  19. Nitsos, C.K.; Matis, K.A.; Triantafyllidis, K.S. Optimization of hydrothermal pretreatment of lignocellulosic biomass in the bioethanol production process. ChemSusChem 2013, 6, 110–122. [Google Scholar] [CrossRef] [PubMed]
  20. Sluiter, A.; Hames, B.; Ruiz, R.; Scarlata, C.; Sluiter, J.; Templeton, D.; Crocker, D. Determination of Structural Carbohydrates and Lignin in Biomass: Laboratory Analytical Procedure (LAP); Issue Date: April 2008; Revision Date: July 2011 (Version 07-08-2011). 2011. Available online: http://www.nrel.gov/biomass/analytical_procedures.html (accessed on 3 November 2022).
  21. Michel, K.; Sluiter, J.; Payne, C.; Ness, R.; Thornton, B.; Reed, M.; Schwartz, A.; Wolfrum, E. Determination of Cellulosic Glucan Content in Starch Containing Feedstocks. Laboratory Analytical Procedure (LAP); Issue Date: February 26, 2021. Available online: www.nrel.gov/publications (accessed on 7 November 2022).
  22. Total Starch Assay Procedure (amyloglucosidase/α-amylase method). 2020. Available online: www.megazyme.com (accessed on 25 November 2022).
  23. Lorenz Miller, G. Use of Dinitrosalicylic Acid Reagent for Determination of Reducing Sugar. Anal. Chem. 1959, 31, 426–428. [Google Scholar] [CrossRef]
  24. Baird, R.B.; Eaton, A.D.; Rice, E.W. Standard Methods for the Examination of Water and Wastewater; American Public Works Association, 2017; p. 1469. Available online: https://www.worldcat.org/title/156744115 (accessed on 7 November 2022).
  25. Kot, A.M.; Pobiega, K.; Piwowarek, K.; Kieliszek, M.; Błażejak, S.; Gniewosz, M.; Lipińska, E. Biotechnological Methods of Management and Utilization of Potato Industry Waste—A Review. Potato Res. 2020, 63, 431–447. [Google Scholar] [CrossRef]
  26. Liang, S.; McDonald, A.G. Chemical and thermal characterization of potato peel waste and its fermentation residue as potential resources for biofuel and bioproducts production. J. Agric. Food Chem. 2014, 62, 8421–8429. [Google Scholar] [CrossRef]
  27. Chintagunta, A.D.; Jacob, S.; Banerjee, R. Integrated bioethanol and biomanure production from potato waste. Waste Manag. 2016, 49, 320–325. [Google Scholar] [CrossRef]
  28. Taher, I.; Fickers, P.; Chniti, S.; Hassouna, M. Optimization of enzymatic hydrolysis and fermentation conditions for improved bioethanol production from potato peel residues. Biotechnol. Prog. 2017, 33, 397–406. [Google Scholar] [CrossRef]
  29. Yaseen, S.S.; Khalf, A.A.; AI-Hadidy, Y.I. A study of Chemical Composition and determination of acrylamide in fried potato chips. IOP Conf. Ser. Mater. Sci. Eng. 2020, 928, 052002. [Google Scholar] [CrossRef]
  30. Knappert, D.; Grethlein, H.; Converse, A. sPartial acid hydrolysis of cellulosic materials as a pretreatment for enzymatic hydrolysis. Biotechnol. Bioeng. 1980, 22, 1449–1463. [Google Scholar] [CrossRef]
  31. Sun, Q.; Chen, W.J.; Pang, B.; Sun, Z.; Lam, S.S.; Sonne, C.; Yuan, T.Q. Ultrastructural change in lignocellulosic biomass during hydrothermal pretreatment. Bioresour. Technol. 2021, 341, 125807. [Google Scholar] [CrossRef]
  32. Atitallah, I.B.; Antonopoulou, G.; Ntaikou, I.; Alexandropoulou, M.; Nasri, M.; Mechichi, T.; Lyberatos, G. On the evaluation of different saccharification schemes for enhanced bioethanol production from potato peels waste via a newly isolated yeast strain of Wickerhamomyces anomalus. Bioresour. Technol. 2019, 289, 121614. [Google Scholar] [CrossRef]
  33. Tasić, M.B.; Konstantinović, B.; Lazić, M.L.; Veljković, V.B. The acid hydrolysis of potato tuber mash in bioethanol production. Biochem. Eng. J. 2009, 43, 208–211. [Google Scholar] [CrossRef]
  34. Izmirlioglu, G.; Demirci, A. Ethanol production in biofilm reactors from potato waste hydrolysate and optimization of growth parameters for Saccharomyces cerevisiae. Fuel 2016, 181, 643–651. [Google Scholar] [CrossRef]
  35. Hashem, M.; Darwish, S.M.I. Production of bioethanol and associated by-products from potato starch residue stream by Saccharomyces cerevisiae. Biomass Bioenergy 2010, 34, 953–959. [Google Scholar] [CrossRef]
  36. Dame-Korevaar, A.; Boumans, I.J.M.M.; Antonis, A.F.G.; van Klink, E.; de Olde, E.M. Microbial health hazards of recycling food waste as animal feed. Future Foods 2021, 4, 100062. [Google Scholar] [CrossRef]
  37. Vouitsis, I.; Geivanidis, S.; Samaras, Z. Liquid biofuels in Greece—Current status in production and research. J. Renew. Sustain. Energy 2014, 6, 022703. [Google Scholar] [CrossRef]
  38. Process Equipment Cost Estimating by Ratio and Proportion. 2012. Available online: www.PDHcenter.com (accessed on 22 October 2022).
Figure 1. Potato chip production line.
Fermentation 09 00103 g001
Figure 2. Ethanol concentration and yield of potato industry waste streams after SSF without pretreatment.
Fermentation 09 00103 g002
Figure 3. Ethanol concentration and yield of potato peels (PP) after the pretreatment steps and SSF.
Fermentation 09 00103 g003
Figure 4. Ethanol concentration and yield of potato tubers and slices (PT&S) after the pretreatment steps and SSF.
Fermentation 09 00103 g004
Figure 5. The profile of glucose consumption and ethanol production for potato peels on pilot-scale under SSF conditions after alkali pretreatment.
Fermentation 09 00103 g005
Figure 6. The profile of glucose consumption and ethanol production for potato tubers and slices on pilot scale under SSF conditions after hydrothermal pretreatment.
Fermentation 09 00103 g006
Figure 7. The profile of glucose consumption and ethanol production for starch waste on pilot scale under SSF conditions.
Fermentation 09 00103 g007
Figure 8. The profile of glucose consumption and ethanol production for low-quality chips on pilot scale under SSF conditions.
Fermentation 09 00103 g008
Figure 9. Optimum conditions for bioethanol production from potato chips industry waste.
Fermentation 09 00103 g009
Figure 10. Design of the reactors.
Fermentation 09 00103 g010
Table 1. Chemical composition of all waste streams from a potato processing industry.
Parameter
(% d.b)
Potato PeelsPotato Tubers & SlicesStarchChips
Experimental values in the present study
Moisture85 ± 1.775 ± 0.21.2 ± 0.42.9 ± 0.1
Total solids15 ± 1.725 ± 0.298.8 ± 0.497.1 ± 0.1
Oils---36.6 ± 0.7
Starch17.3 ± 0.662.5 ± 5.683.4 ± 5.051.0 ± 1.9
Cellulose18.9 ± 1.618.3 ± 3.6-7.4 ± 4.9
Hemicellulose13.1 ± 0.411.7 ± 0.3-2.4 ± 1.3
Insoluble Acid Residue20.4 ± 0.61.2 ± 0.88.6 ± 0.40.8 ± 0.1
Literature range [15,25,26,27,28,29,30]
Oils---13.7–34.0
Starch16.8–42.037.0–49.8-33.0–51.8
Cellulose5.7–33.52.7–17.0-3.7–5.6
Hemicellulose5.5–7.414--
Insoluble Acid Residue5.7–22.9--2.4–3.1
Table 2. Ethanol concentration and ethanol yield after alkali pretreatment and 48 h of SSF for potato peels (PP).
NoConditionsLiquid Phase after FermentationYield
NaOH (%w/v) Spirizyme   Excel   XHS   ( μ L · g s t a r c h 1 ) NS 87014   ( μ L · g cellulose 1 ) Ethanol Concentration (g·L−1)Glucose Concentration (g·L−1) Y E t O H ( % )
10201001.3 ± 0.10.1 ± 0.011.6 ± 3.1
20202502.3 ± 0.20.1 ± 0.120.8 ± 3.3
30601001.8 ± 0.10.1 ± 0.016.2 ± 2.9
40602501.3 ± 0.40.1 ± 0.011.6 ± 3.4
52201005.8 ± 0.50.1 ± 0.053.2 ± 3.8
62202506.3 ± 0.50.1 ± 0.057.8 ± 3.2
72601005.8 ± 0.40.1 ± 0.153.2 ± 2.8
82602506.8 ± 0.20.1 ± 0.062.4 ± 3.6
Centre1401759.5 ± 0.40.1 ± 0.087.8 ± 3.8
Table 3. Ethanol concentration and ethanol yield after hydrothermal pretreatment and 48 h of SSF for potato tubers and slices (PT&S).
NoConditionsLiquid Phase after FermentationYield
Spirizyme   Excel   XHS   ( μ L · g s t a r c h 1 ) Solid Loading (%)Ethanol Concentration (g·L−1)Glucose Concentration (g·L−1) Y E t O H   ( % )
1201023.9 ± 1.00.0 ± 0.060.5 ± 2.5
2602066.3 ± 1.80.4 ± 0.374.7 ± 2.0
3202043.8 ± 1.80.3 ± 0.149.3 ± 2.0
4601031.3 ± 1.80.3 ± 0.179.3 ± 4.5
Centre401551.9 ± 3.10.3 ± 0.082.8 ± 5.0
Table 4. Ethanol concentration and ethanol yield after 48 h of SSF for starch (ST).
NoConditionsLiquid Phase after FermentationYield
Spirizyme   Excel   XHS   ( μ L · g s t a r c h 1 ) Solid Loading (%)Ethanol Concentration (g·L−1)Glucose Concentration (g·L−1) Y E t O H   ( % )
1201024.0 ± 0.00.2 ± 0.145.6 ± 0.0
2602058.0 ± 2.80.2 ± 0.049.0 ± 2.4
3202044.0 ± 11.30.1 ± 0.037.2 ± 9.6
4601022.0 ± 2.80.4 ± 0.341.8 ± 5.4
Centre401529.0 ± 6.00.1 ± 0.164.5 ± 7.2
Table 5. Ethanol concentration and ethanol yield after 48 h of SSF for chips (CH).
NoConditionsLiquid Phase after FermentationYield
Spirizyme   Excel   XHS   ( μ L · g s t a r c h 1 ) Solid Loading (%) Ethanol   Concentration   ( g ·   L 1 ) Glucose   Concentration   ( g ·   L 1 ) Y E t O H ( % )
1201028.0 ± 0.00.1 ± 0.087.0 ± 0.0
2602043.0 ± 1.40.0 ± 0.059.4 ± 2.0
3202050.0 ± 0.00.1 ± 0.069.1 ± 0.0
4601028.0 ± 0.00.1 ± 0.187.0 ± 0.0
Centre401537.0 ± 2.00.2 ± 0.172.4 ± 3.9
Table 6. Solid fractions’ degradations and ethanol yields of pilot trials.
FeedstockYieldDegradation
Y E t O H ( % ) Solid Degradation (%)Starch Degradation (%)
PP83.2 ± 2.856.5 ± 2.099.6 ± 0.4
PT&S72.1 ± 2.085.0 ± 5.099.4 ± 0.2
ST42.2 ± 6.385.0 ± 4.287.7 ± 2.2
CH79.4 ± 5.985.0 ± 2.398.6 ± 0.1
Table 7. Daily mass flows of solid waste of the potato chips production line on a dry basis.
WasteMass Flows (kg/d, d.b)
Potato peels44
Potato tubers and slices317
Starch753
Bad-quality chips290
Table 8. Dimensions of reactors.
ReactorV (m3)D (m)H (m)Di (m)Wi (m)
12.81.32.00.90.08
23.31.23.00.80.08
311.01.94.01.20.08
Table 9. Input and output quantities per week.
Input
ReactorFeedstockWater (m3)NaOH (kg)H2SO4 (L)Amylase (L)Cellulase (L)Yeast (kg)
1Potato peels & 3.04226184
2Potato tubers & slices1.6--60-32
3Starch & Chips15.0--202-75
TOTAL 19.642262638111
Output
Solid residue (kg)Water (L)Bioethanol (L)
110845001928
Table 10. Cost of consumables for the operation of the plant on weekly basis.
ReactorWaste (kg TS) H2O (L)NaOH (kg)H2SO4 (L)Amylase (L)Cellulase (L)Yeast (kg)
122029364226184
215851585--60-32
3376614,984--202-75
Sum557119,50542262648111
Price0 €/kg TS0 €/L0.84 €/kg1.3 €/L2 €/L2 €/L1.2 €/kg
Cost0.000.0035.1434.35527.4715.41133.71
Total Cost746.09 €/week
Table 11. Energy consumption and the respective cost.
Pretreatment and Bioconversion5130kWh/week
Distillation8796kWh/week
Energy Cost 0.0647€/kWh
Total cost902€/week
Disclaimer/Publisher’s Note: The statements, opinions and data contained in all publications are solely those of the individual author(s) and contributor(s) and not of MDPI and/or the editor(s). MDPI and/or the editor(s) disclaim responsibility for any injury to people or property resulting from any ideas, methods, instructions or products referred to in the content.

