Article

Growth Kinetics of Kazachstania unispora and Its Interaction with Lactic Acid Bacteria during Qymyz Production

1
Faculty of Biology and Biotechnology, Al-Farabi Kazakh National University, 71 Al-Farabi Av., Almaty 050040, Kazakhstan
2
Qualisud, University Montpellier, Avignon Université, CIRAD, Institut Agro Montpellier, IRD, Université de La Réunion, F-97490 Montpellier, France
3
Antigen Co., Ltd., Almaty Region, 4 Azerbayev Str., Abay v., Almaty 040905, Kazakhstan
4
CIRAD, UMR Qualisud, F-34398 Montpellier, France
*
Author to whom correspondence should be addressed.
Fermentation 2023, 9(2), 101; https://doi.org/10.3390/fermentation9020101
Submission received: 11 January 2023 / Accepted: 16 January 2023 / Published: 23 January 2023
(This article belongs to the Special Issue Yeast - Fermentation)

Abstract

:
Qymyz is a traditional acidic and ethanolic beverage in central Asian countries made from mare milk fermentation with lactic acid bacteria (LAB) and yeasts. Modeling the growth of microorganisms during fermentation is one of the methods used to control the quality of fermented products. The objective of the study was, firstly, to model the growth kinetics of Kazachstania unispora found in qymyz, and, secondly, to understand their interaction with Lacticaseibacillus casei and Lactobacillus kefiri during the fermentation of mare milk. The K. unispora optimum values of pH and temperature were 4.81 ± 0.22 and 30.16 ± 0.53 °C, respectively, with an optimal growth rate (µopt) of 0.56 ± 0.02 h−1. K. unispora had an ethanol production rate of 6.1 × 10⁻⁸ mg·CFU−1. Growth, in terms of limiting substrates showed a lower Ks value for galactose at 0.13 ± 0.04 mg·mL−1 with µopt of 0.45 ± 0.01 h−1, while, for glucose, the Ks was 0.24 ± 0.03 mg·mL−1 with the same µopt. Cocultures of K. unispora were conducted with L. casei and L. kefiri in a synthetic medium and mare milk. The results showed that K. unispora growth was limited and, thus, its ethanol production capacity was inhibited. VOC analysis of mare milk fermented with the studied strains and their cocultures resulted in 37 major volatile compounds. Statistical analysis of the VOC profiles showed that K. unispora modulates the aroma production in coculture with LAB.

1. Introduction

Fermented mare milk is called qymyz (koumiss). Qymyz flavor is described as sharp acidic and alcoholic. It is traditionally obtained by spontaneous fermentation by LAB and yeast [1]. Traditional starters for qymyz production are boiled millet, malt, soured cow’s milk, soured soup, etc. The preparation process involves a series of churnings and fermentations with addition of fresh mare milk. Due to the use of unpasteurized mare milk [2], the specific microflora in qymyz can vary by geographic location of fermentation [3]. As a result, generally qymyz has a variable and unstable quality, with ethanol content used as the main criterion to describe the quality.
Predictive microbiology has been used in both microbiological safety and food quality fields; notably, the concept’s early development was centered on seafood spoilage [4]. The concept is based on detailed knowledge of microbial responses to environmental conditions, synthetized in a mathematical model. It is used to describe microorganisms’ behavior in different conditions, such as population growth at different pH and temperatures [5]. It can also be used to describe production of metabolites and its effect on the growth of both the producing microorganism itself and the cocultured microorganisms [6]. Additionally, models are used to describe interactions between microorganisms in mixed fermentations [7]. Consequently, predictive microbiology has been found to be powerful tool in preparation of quality starters that provide better control over production of fermented foods.
The main actors in qymyz fermentation are LAB and yeasts. Even though lactose is the main sugar of mare milk, lactose non-fermenting yeasts K. unispora (formerly Saccharomyces unisporus) were reported to be the main yeast in qymyz [8]. This finding indicates that yeasts rely on bacteria for the provision of monosaccharides. Different biological pathways for lactose absorption and its component monosaccharides, glucose and galactose, have been described for LAB. Lactose is reported to be absorbed by phosphoenolpyruvate (PEP), lactose phosphotransferase system (lac-PTS), and lactose permease system [9]. Hickey et al. [10] in their study could not find evidence for lac-PTS or galactose-PTS and concluded that, in lactobacilli, lactose could be mainly absorbed by the permease system. Lac-PTS-negative S. thermophiles were reported to have a galactose–lactose antiporter [11], with galactose being released into the extracellular medium when grown in medium containing excess lactose. This carbohydrate transfer within LAB can explain the prevalence of lactose nonfermenting yeast in qymyz, whose growth is enabled by the galactose released from LAB [8].
While the main role of LAB is lactose fermentation, yeasts on the other hand can take part in lactate assimilation, lipolysis, proteolysis, and ethanol and carbon dioxide production, thereby greatly impacting aroma and the sensory properties in general of the product [12]. Despite this, studies about correlation between microorganism species and flavor in qymyz are still scarce [1,13]. For instance, authors reported that Lactobacillus helveticus and Dekkera anomala were associated with sourness, astringency, bitterness, and aftertaste, whereas Lactococcus lactis and Kazachstania unispora were associated with umami taste [1]. Meng et al. [14] conducted a study of VOCs during fermentation of qymyz using complex starters. They showed that the formation of qymyz flavor was largely determined by the type and amount of acids, esters, and alcohols. The main molecules found were acetic acid, octanoic acid, n-decanoic acid, 9-decanoic acid, dodecanoic acid, ethyl acetate, ethyl octanoate, ethyl dodecanoic, ethyl-9-decanoic, ethyl decanoic, ethanol, 3-methyl-1-butanol, and hexanol.
The goal of this study was to better understand qymyz fermentation by examining the growth of K. unispora isolated from qymyz under various fermentation conditions and in coculture with lactic acid bacteria. The results of this study can provide practical information on the growth parameters of K. unispora under different pH, temperature, and substrate conditions, which would be useful for various production processes involving this strain. Additionally, comparing the growth of K. unispora with that of LAB in the specific context of qymyz production will help to understand the individual contributions of each species to the final quality of qymyz.

2. Materials and Methods

2.1. Microorganisms

Fourteen cultures of yeast were isolated using Sabouraud agar medium (Biomerieux, Marcy-l’Étoile, France) from samples of local qymyz collected in the Almaty region of Kazakhstan. Identification by sequencing of the internal transcribed spacer (ITS) region showed that all strains belonged to Kazachstania unispora (Genbank accession numbers OP984713–OP984726). A small organoleptic analysis was conducted by fermenting mare milk with these yeast strains, and strain Y1.5 (OP984717) was selected for further study.
In order to mimic qymyz production, the already characterized bacteria Lactobacillus kefiri (B2) and Lacticaseibacillus casei (B7) were taken from a previous study [15] for use in a coculture.

2.2. Growth Media Composition

Yeast growth characterization was performed using standard Sabouraud broth medium (Biomerieux, Marcy-l’Étoile, France). For experiments that required changes in carbon source (lactose, galactose, or different amount of glucose), the Sabouraud composition was kept the same using the following reagents: Bacto Peptone (ThermoFisher, Waltham, MA, USA), yeast extract, magnesium sulfate, potassium phosphate dibasic, ammonium citrate dibasic (Sigma-Aldrich, St. Louis, MO, USA), lactose or galactose, manganese sulfate-1-hydrate, and sodium dihydrogen phosphate (Panreac, Barcelona, Spain).
Coculture of yeast and LAB was carried out on a modified De Man Rogosa and Sharpe (MRS) (Biomerieux, Marcy-l’Étoile, France) synthetic medium with removal of sodium acetate due to its antifungal activity [16] and substitution of glucose with 5% lactose. Peptone was also increased to 2% to meet the needs of both strains for substrates.
Additionally, coculture experiments were repeated in reconstituted mare milk using organic mare milk powder (Chevalait, Chailloué, France). The milk was reconstituted according to producer’s instruction and contained ~6% lactose. It was then pasteurized at 70 °C for 30 min in the Minifor Lambda fermenters (LAMBDA Instruments, Brno, Czech Republic) before inoculation.

2.3. Growth Experiments

2.3.1. Effect of Temperature

Temperature effect experiments were conducted in Minifor Lambda fermenters (LAMBDA Instruments, Brno, Czech Republic) with a working volume of 800 mL and using an infrared radiator to control temperature. Yeast was grown at temperatures ranging from 5 °C to 40 °C (5, 10, 15, 20, 25, 27, 30, 32, 35, 37, and 40 °C). Yeast precultures grown overnight were prepared at 30 °C, and the initial population was set at approximately 106 CFU·mL−1. The pH was set to 5.6 and automatically adjusted using sterile 2 M sodium hydroxide for all temperatures. The agitation was set at 240 rpm. The yeast growth was monitored using an inline near-infrared turbidity sensor (Optek FC20-ASD19-N, Elscolab, Arcueil, France). Fermentations were carried out until reaching a stationary phase.

2.3.2. Effect of Carbohydrate Source and pH

These experiments were conducted using Bioscreen C MBR (Labsystems, Helsinki, Finland) which is an automated system used for the analysis of high-throughput microbial growth curves in aqueous media.
Maximal growth rates at 30 °C in different pH, ranging from 2.6 to 9.6 (pH 2.6, 3.1, 3.6, 4.1, 4.6, 4.8, 5.6, 6.6, 7.6, 8.6, and 9.6), and limiting substrates (galactose, glucose, and lactose), the concentration of which ranged from 1 g·L−1 to 40 g·L−1 (1, 5, 10, 20, and 40 g·L−1), were calculated using the technique described by Augustin et al. [17].

2.3.3. LAB–K. unispora Coculture Experiments

Coculture experiments were performed on modified MRS and in reconstituted mare milk. The initial populations of LAB and yeast were set to 105 CFU·mL−1. Fermentation was carried out in Minifor Lambda fermenters at 25 °C for L. casei–K. unispora coculture, while L. kefiri–K. unispora coculture was performed at 30 °C. The initial pH of the modified MRS was set at 6.8 to mimic mare milk. All experiments were performed in duplicate.

2.3.4. Plate-Counting Methods for the Calibration Curve

A tenfold serial dilution of the homogenized samples (0.1 mL) was prepared in sterile 9 g·L−1 NaCl water and plated on the surface of Sabouraud and MRS agar plates. Additionally, for the coculture samples, 0.05 g·L−1 bromocresol green in MRS agar was used to distinguish between LAB and yeast colonies. Colonies of LAB change pH around and turn the medium to yellow, while yeast colonies do not change the color of the medium. The plates were incubated at 30 °C for 48 h. Colony-forming unit (CFU) counting was plotted against turbidity values given by the fermenter sensor and optical density at 600 nm (OD600) to obtain the proportionality coefficient.

2.4. Chemical Analyses

2.4.1. HPLC Analysis

The carbohydrate contents and the production of lactic acid and ethanol were measured by HPLC with separation on an Aminex HPX-87H column (Biorad, Hemel Hempstead, UK). Detection was performed using a refractive index detector for the ethanol and carbohydrates, while an ultraviolet (UV) (210 nm) detector was used for lactic acid detection. Aliquots of 20 μL were injected and elution was performed at 30 °C with 5 mM sulfuric acid at a flow rate of 0.6 mL·min−1 [6]. Samples were filtered through a 0.45 µm pore size filter before injection.

2.4.2. Volatile Organic Compound Analysis

A solid-phase microextraction (SPME) technique with carboxen (CAR) extraction fiber was used for the detection of VOCs. The extraction temperature was 50 °C, extraction time was 45 min, and desorption time was 3 min. After the extraction, the fiber was placed in the injector of a gas chromatograph and heated to 250 °C in splitless mode. Separation of VOCs was carried out using a 60 m capillary column DB5 (Agilent, Santa Clara, CA, USA) with an inner diameter of 0.25 mm and a film thickness of 0.25 μm at a constant gas carrier (helium) rate of 1.0 mL/min.
The chromatography temperature was programmed from 40 °C (5 min) to 140 °C at a heating rate of 2 °C/min, followed by heating to 250 °C (0 min) at 10 °C/min. The total chromatographic time was 66 min. The temperatures of the interface, ion source, and quadrupole of the mass spectrometric detector were 250, 230, and 150 °C, respectively. Mass spectrometric detection was performed in the SCAN mode.
Analyses were performed on an Agilent 6890 series GC with Agilent 5975 mass spectrometer detector, with electron impact ionization. Analyses were performed in triplicate. Just before GC–MS analysis, 1 μL of the internal standard 3-heptanol (0.8 g/L in water) was applied to 1 mL of the samples.

2.4.3. Odor Activity Value

The odor activity value (OAV), which is the flavor contribution of each flavor compound, was calculated as the ratio of the concentration of each compound to its reported sensory threshold concentration according to Dan et al. [18].

2.5. Mathematical Modeling

2.5.1. Microorganism Growth

The logistic growth model [19] was chosen to describe microbial growth according to Equation (1).
dNt dt = 0                                                                   i f   t λ dNt dt = µ m a x N t 1 Nt Nmax   i f   t > λ ,
where Nt and Nmax (CFU/mL) are the values of the microbial population at time t and at the end of the growth curve, respectively, µmax is the maximal growth rate (h−1), and λ is the lag time (h).
The gamma concept model [20] was used as a secondary model to describe the impact of temperature and pH on the maximum growth rate ( µ max ) , according to Equation (2).
µ max =   µ opt ×   γ T × γ pH ,
with γ values ranging between 0 and 1.
The effect of pH on µ max was expressed using the cardinal temperature and pH model (CTPM) proposed by [5], according to Equation (3).
CM n X = X X min ; 0 X X min n X X max X opt X min n 1 X opt X min X X opt X X max n 1 X opt + X min nX X X max ; 0 ,
where X corresponds to environmental factors such as pH and temperature, and the n values are 1 for pH and 2 for temperature.

2.5.2. Limiting Substrate

The Monod equation was chosen to relate growth rates to different limiting substrates:
µ = µ max S Ks + S + µ max 0 ,
where μ is the specific growth rate, μmax is the maximum specific growth rate, μmax0 is the maximum specific growth rate in the absence of a limiting substrate, S is the concentration of the limiting substrate for growth, and Ks is the “half-velocity constant”—the value of S when μ/μmax = 0.5

2.5.3. Metabolite Production Modeling

The kinetics of metabolite production was set as being directly proportional to yeast growth, as shown in Equation (5), as a simplification of the Luedeking and Piret equation [6]:
d metabolite dt = Y metabolite N ×   μ N ,
where Y(metabolite)/N is the yield for ethanol production over population, N is the population, and µ is the growth rate.

2.5.4. Model Fitting and Statistical Analyses

Model fitting and estimation of the model parameters were conducted by the least squares minimization technique using the Solver add-in routine of Microsoft Excel. Standard deviations were calculated using the SolverAid macro of Microsoft Excel. Standard errors of regression lines were calculated using the Data Analysis add-in of Microsoft Excel. The ANOVA, principal component analysis (PCA using Pearson (n − 1)), and discriminant analysis were carried out using XLStat 2016 software (Addinsoft SARL, New York, NY, USA).

3. Results and Discussion

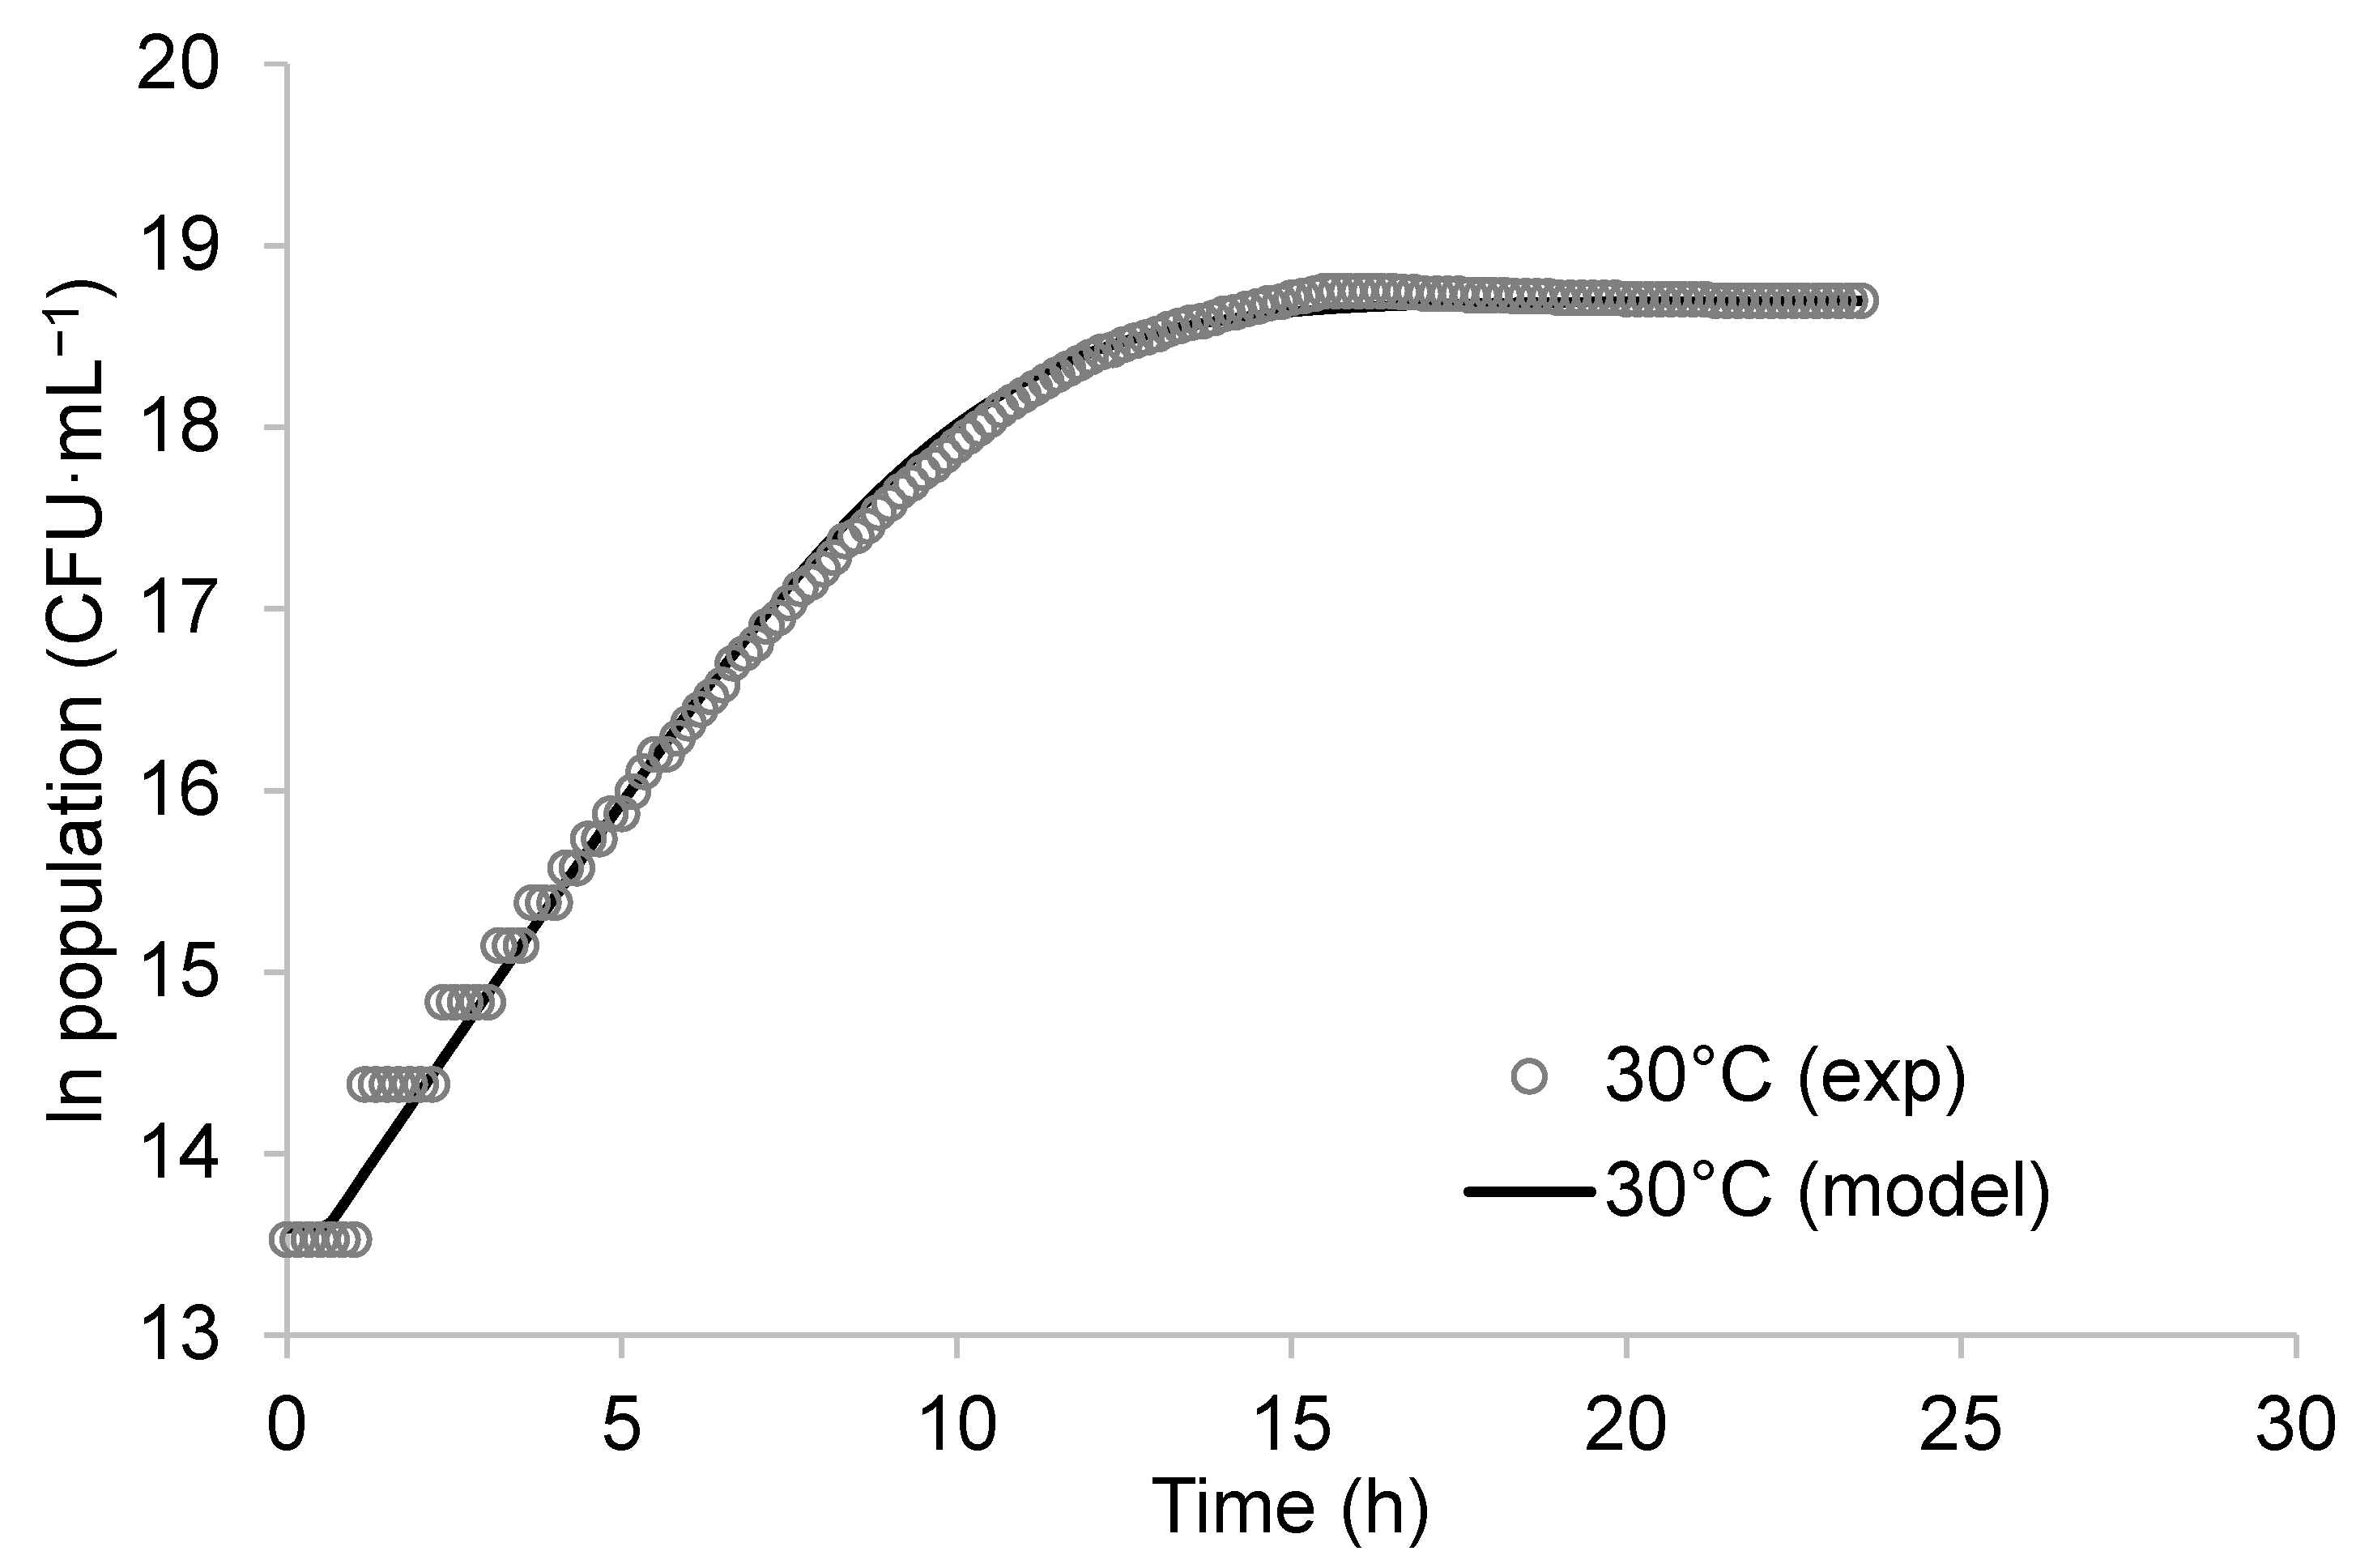
3.1. Growth Characteristic of K. unispora

3.1.1. Microorganism Growth Modeling

The population of K. unispora in the fermenter at 30 °C is plotted as a function of time in Figure 1. The primary models (Equation (1)) exhibited a good fit with the experimental data. From this regression, the specific growth rate obtained at 30 °C and pH 5.6 was 0.55 ± 0.01 h−1. Rough calculations of K. unispora growth from graphs in Korcari et al. [21] revealed a growth rate of approximately 0.5 h−1, which is comparable to our value. In comparison, the Saccharomyces cerevisiae growth rate ranges from 0.38 to 0.57 h−1 [22].

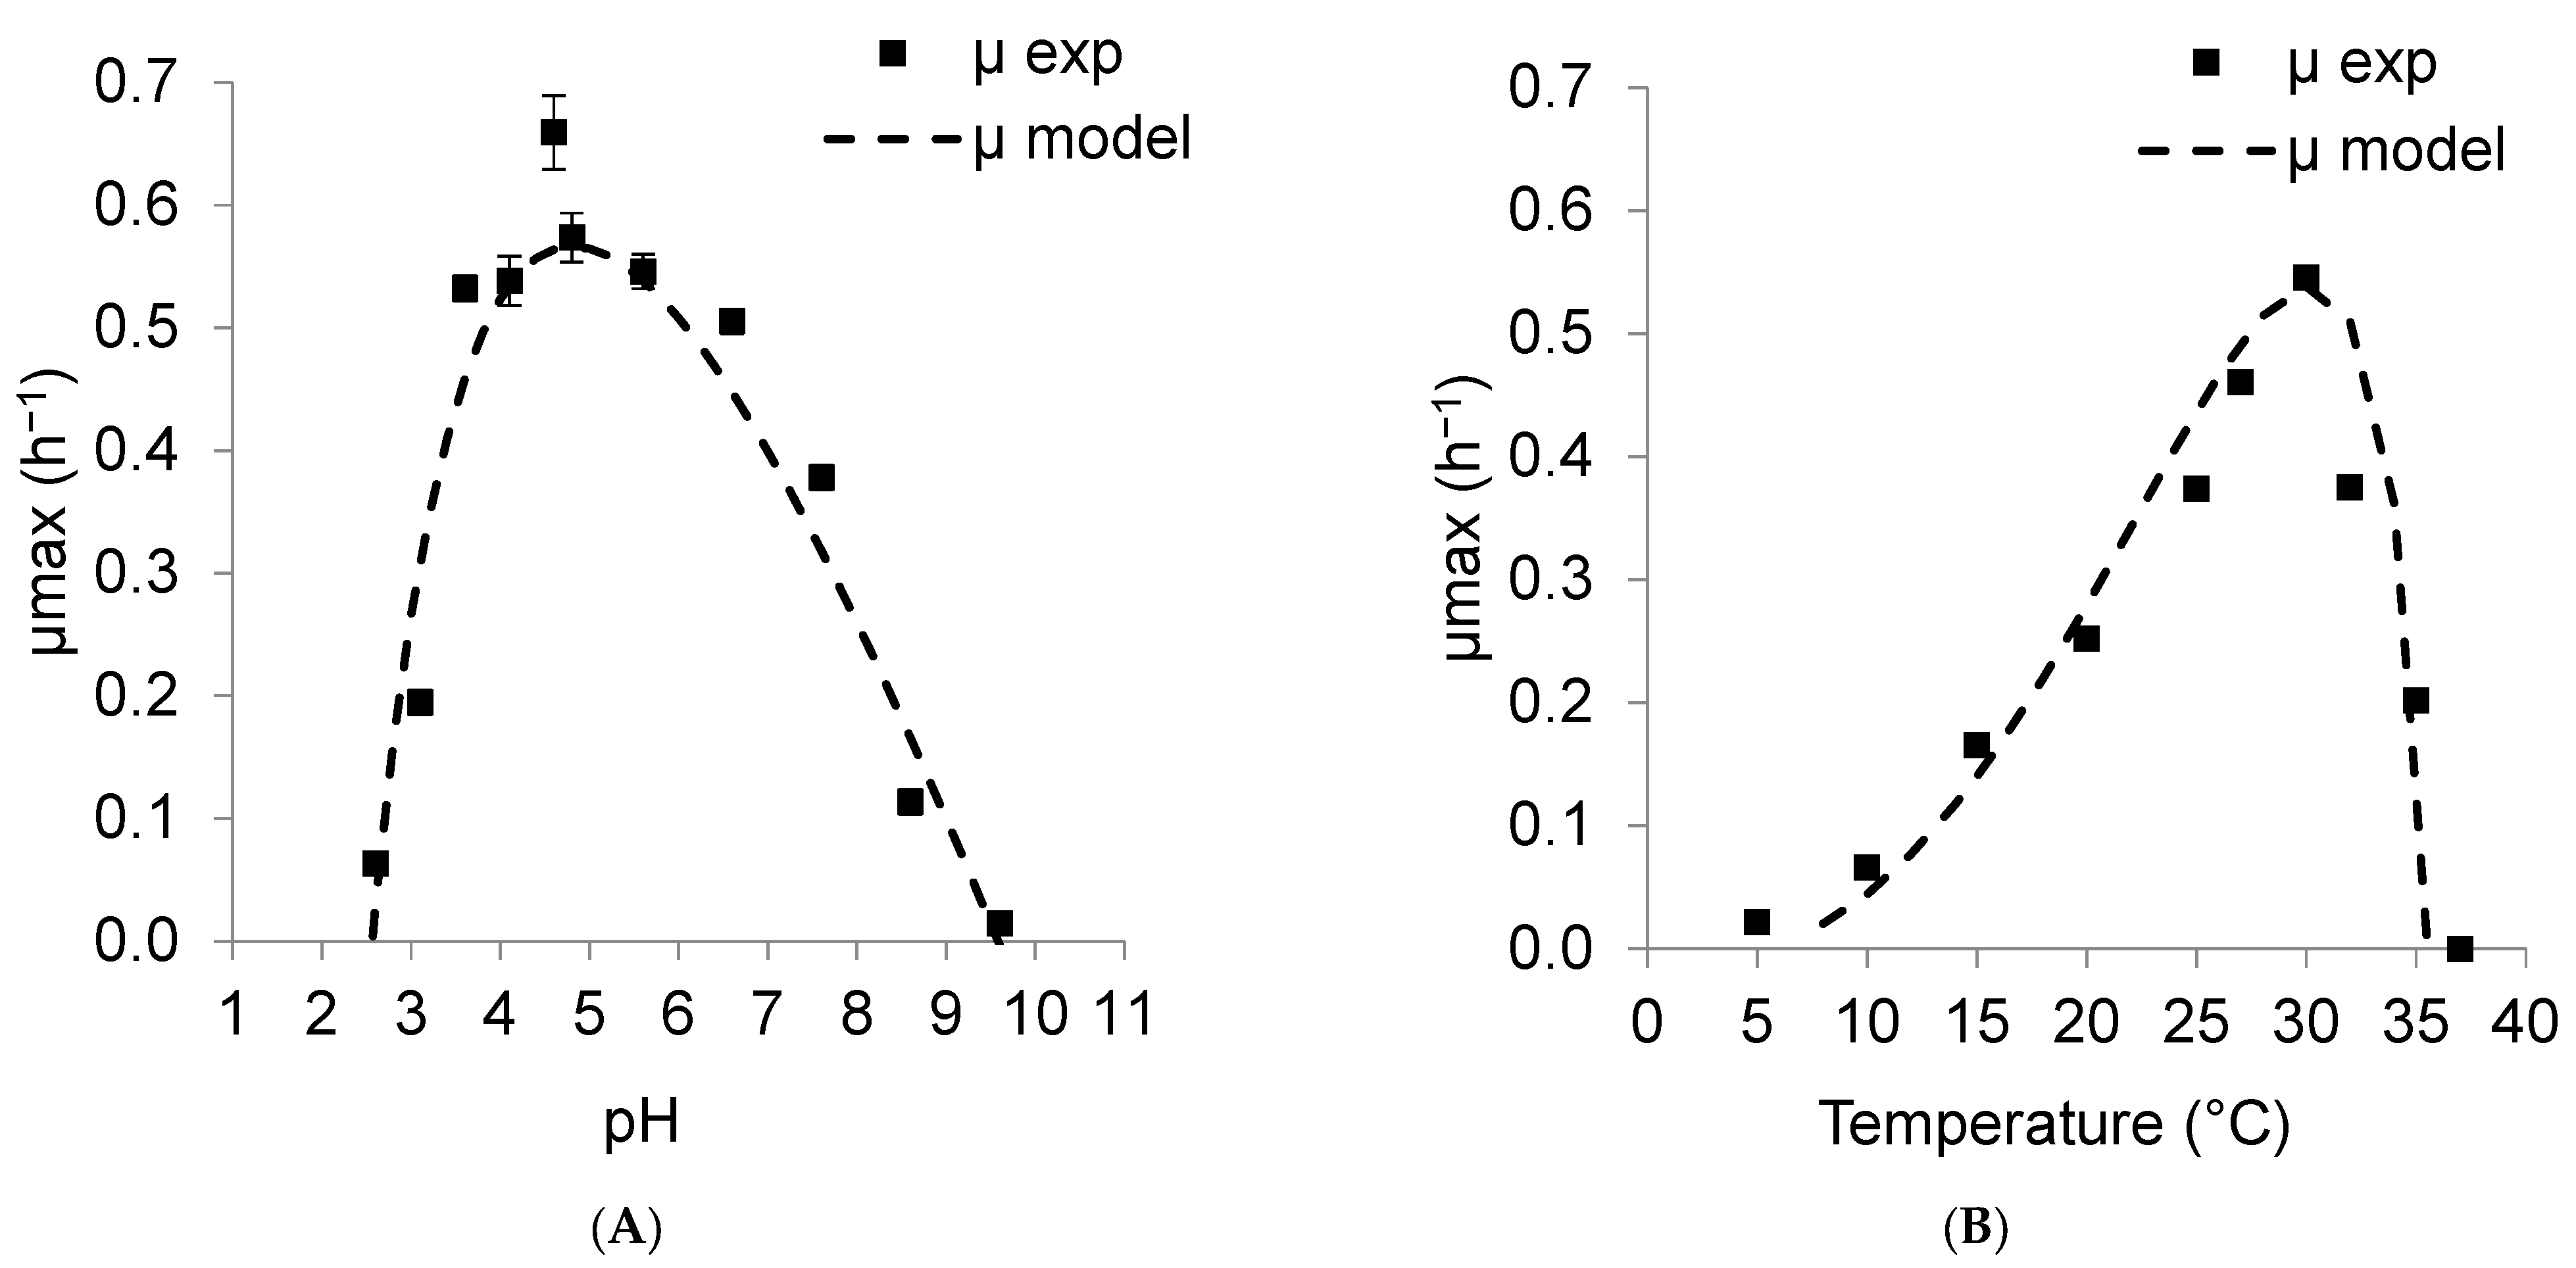
3.1.2. Modeling Effect of pH and Temperature for K. unispora

To understand the effect of pH and temperature on K. unispora growth, specific growth rates were identified from experimental data obtained from 5 °C to 40 °C at a fixed pH of 5.6 (Figure 2A) and from pH 1.8 to 9.6 at a fixed temperature of 30 °C (Figure 2B). Again, the CTPM model fitted the experimental data (Equation (3)). The results showed that the optimal pH pHopt and temperature Topt for K. unispora were equal to 4.81 ± 0.22 and 30.16 ± 0.53 °C, respectively, with µopt of 0.57 ± 0.02 h−1. The minimal and maximal growth temperatures were Tmin = 3.8 ± 3.33 °C and Tmax = 35.7 ± 0.20 °C, while the maximal and minimal growth pH values were pHmin = 2.6 ± 0.09 and pHmax = 9.6 ± 0.30. These parameters can be used to represent K. unispora growth kinetics at any temperature and pH.

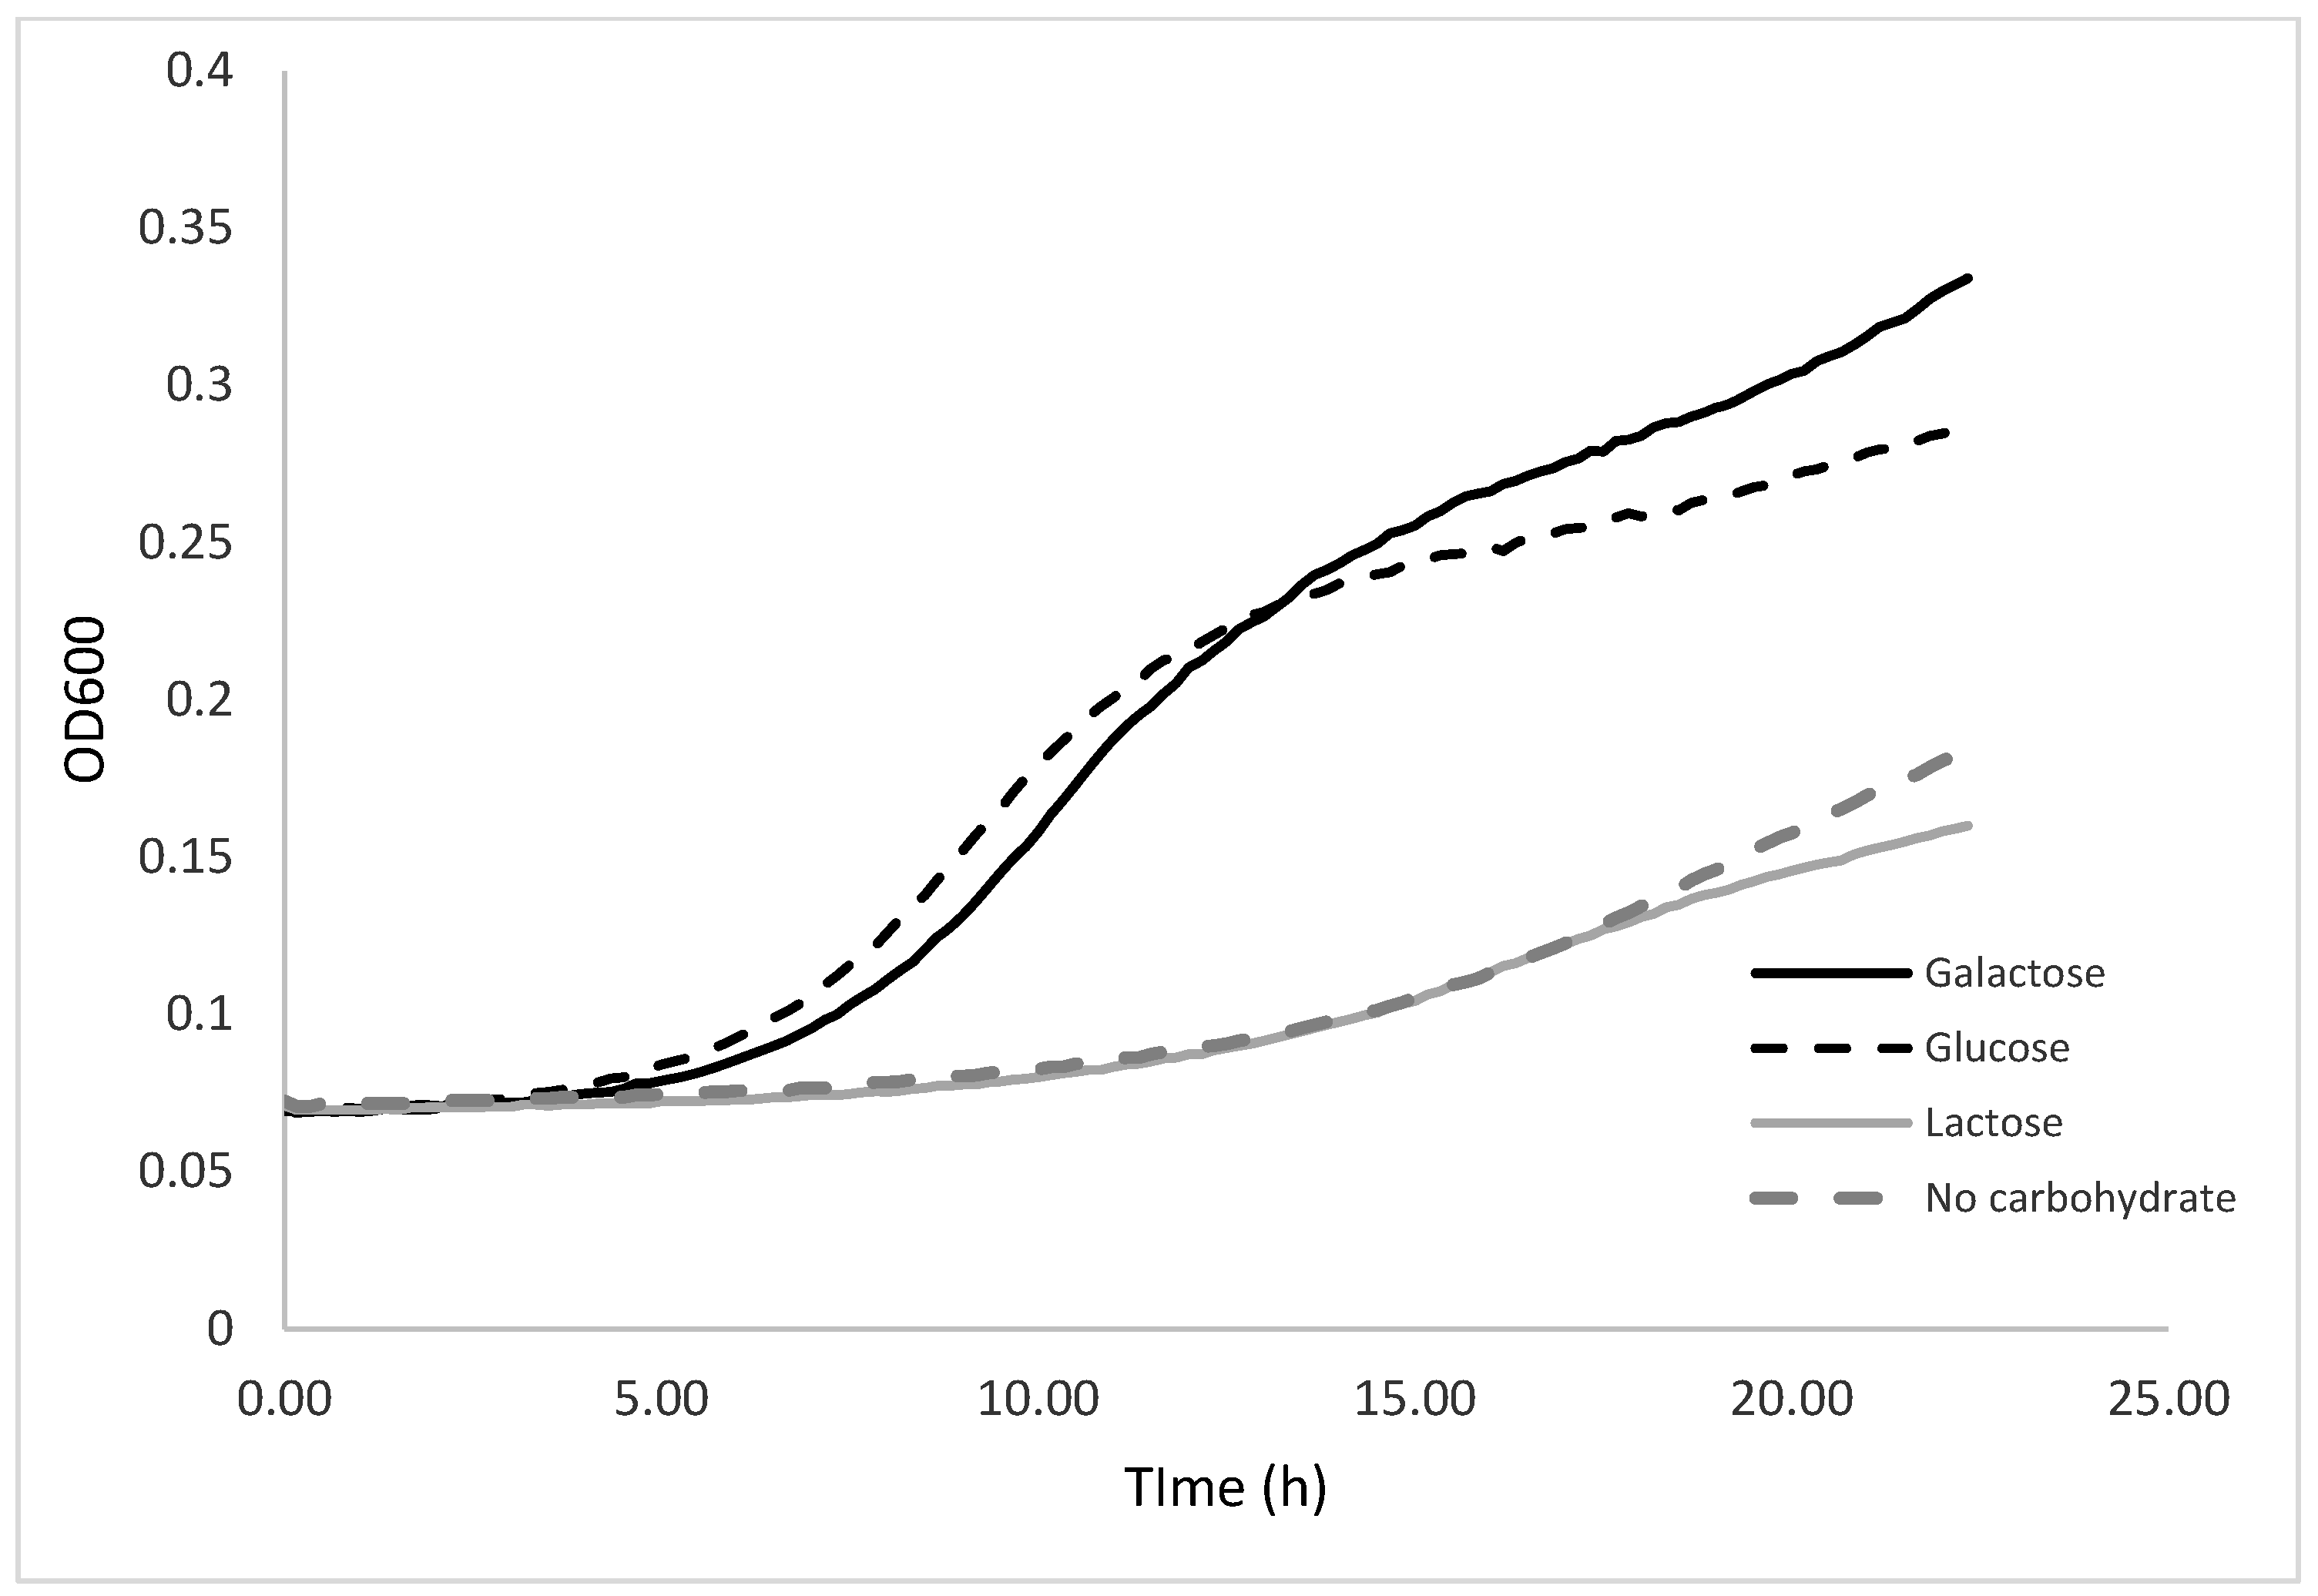
3.1.3. Effect of the Carbohydrate Source on K. unispora Growth

The effect of the substrate (lactose, glucose, and galactose) was investigated at the optimal temperature of 30 °C using the Bioscreen C MBR device. As expected, the K. unispora specific growth rate was high in the glucose media with µopt of 0.45 ± 0.01 h−1. Interestingly, the K. unispora specific growth rate was the same in galactose. In contrast to S. cerevisiae, no lag phase was observed in galactose [23]. The Ks value was 0.13 ± 0.04 mg·mL−1 for galactose, while, for glucose, it was 0.24 ± 0.03 mg·mL−1. These data mean that K. unispora can achieve its maximal growth rate even with a lower amount of galactose. As expected, the growth rate in 2% w/v lactose was 2.5-fold lower than in glucose or galactose, with a value of 0.18 h−1. This value was similar to growth in medium containing no carbohydrate (0.17 h−1), which confirmed that K. unispora does not consume lactose. The growth without carbohydrate could be explained by the use of peptones in the culture medium as a carbon source. The Bioscreen growth curves in different carbohydrates are presented in Figure 3.

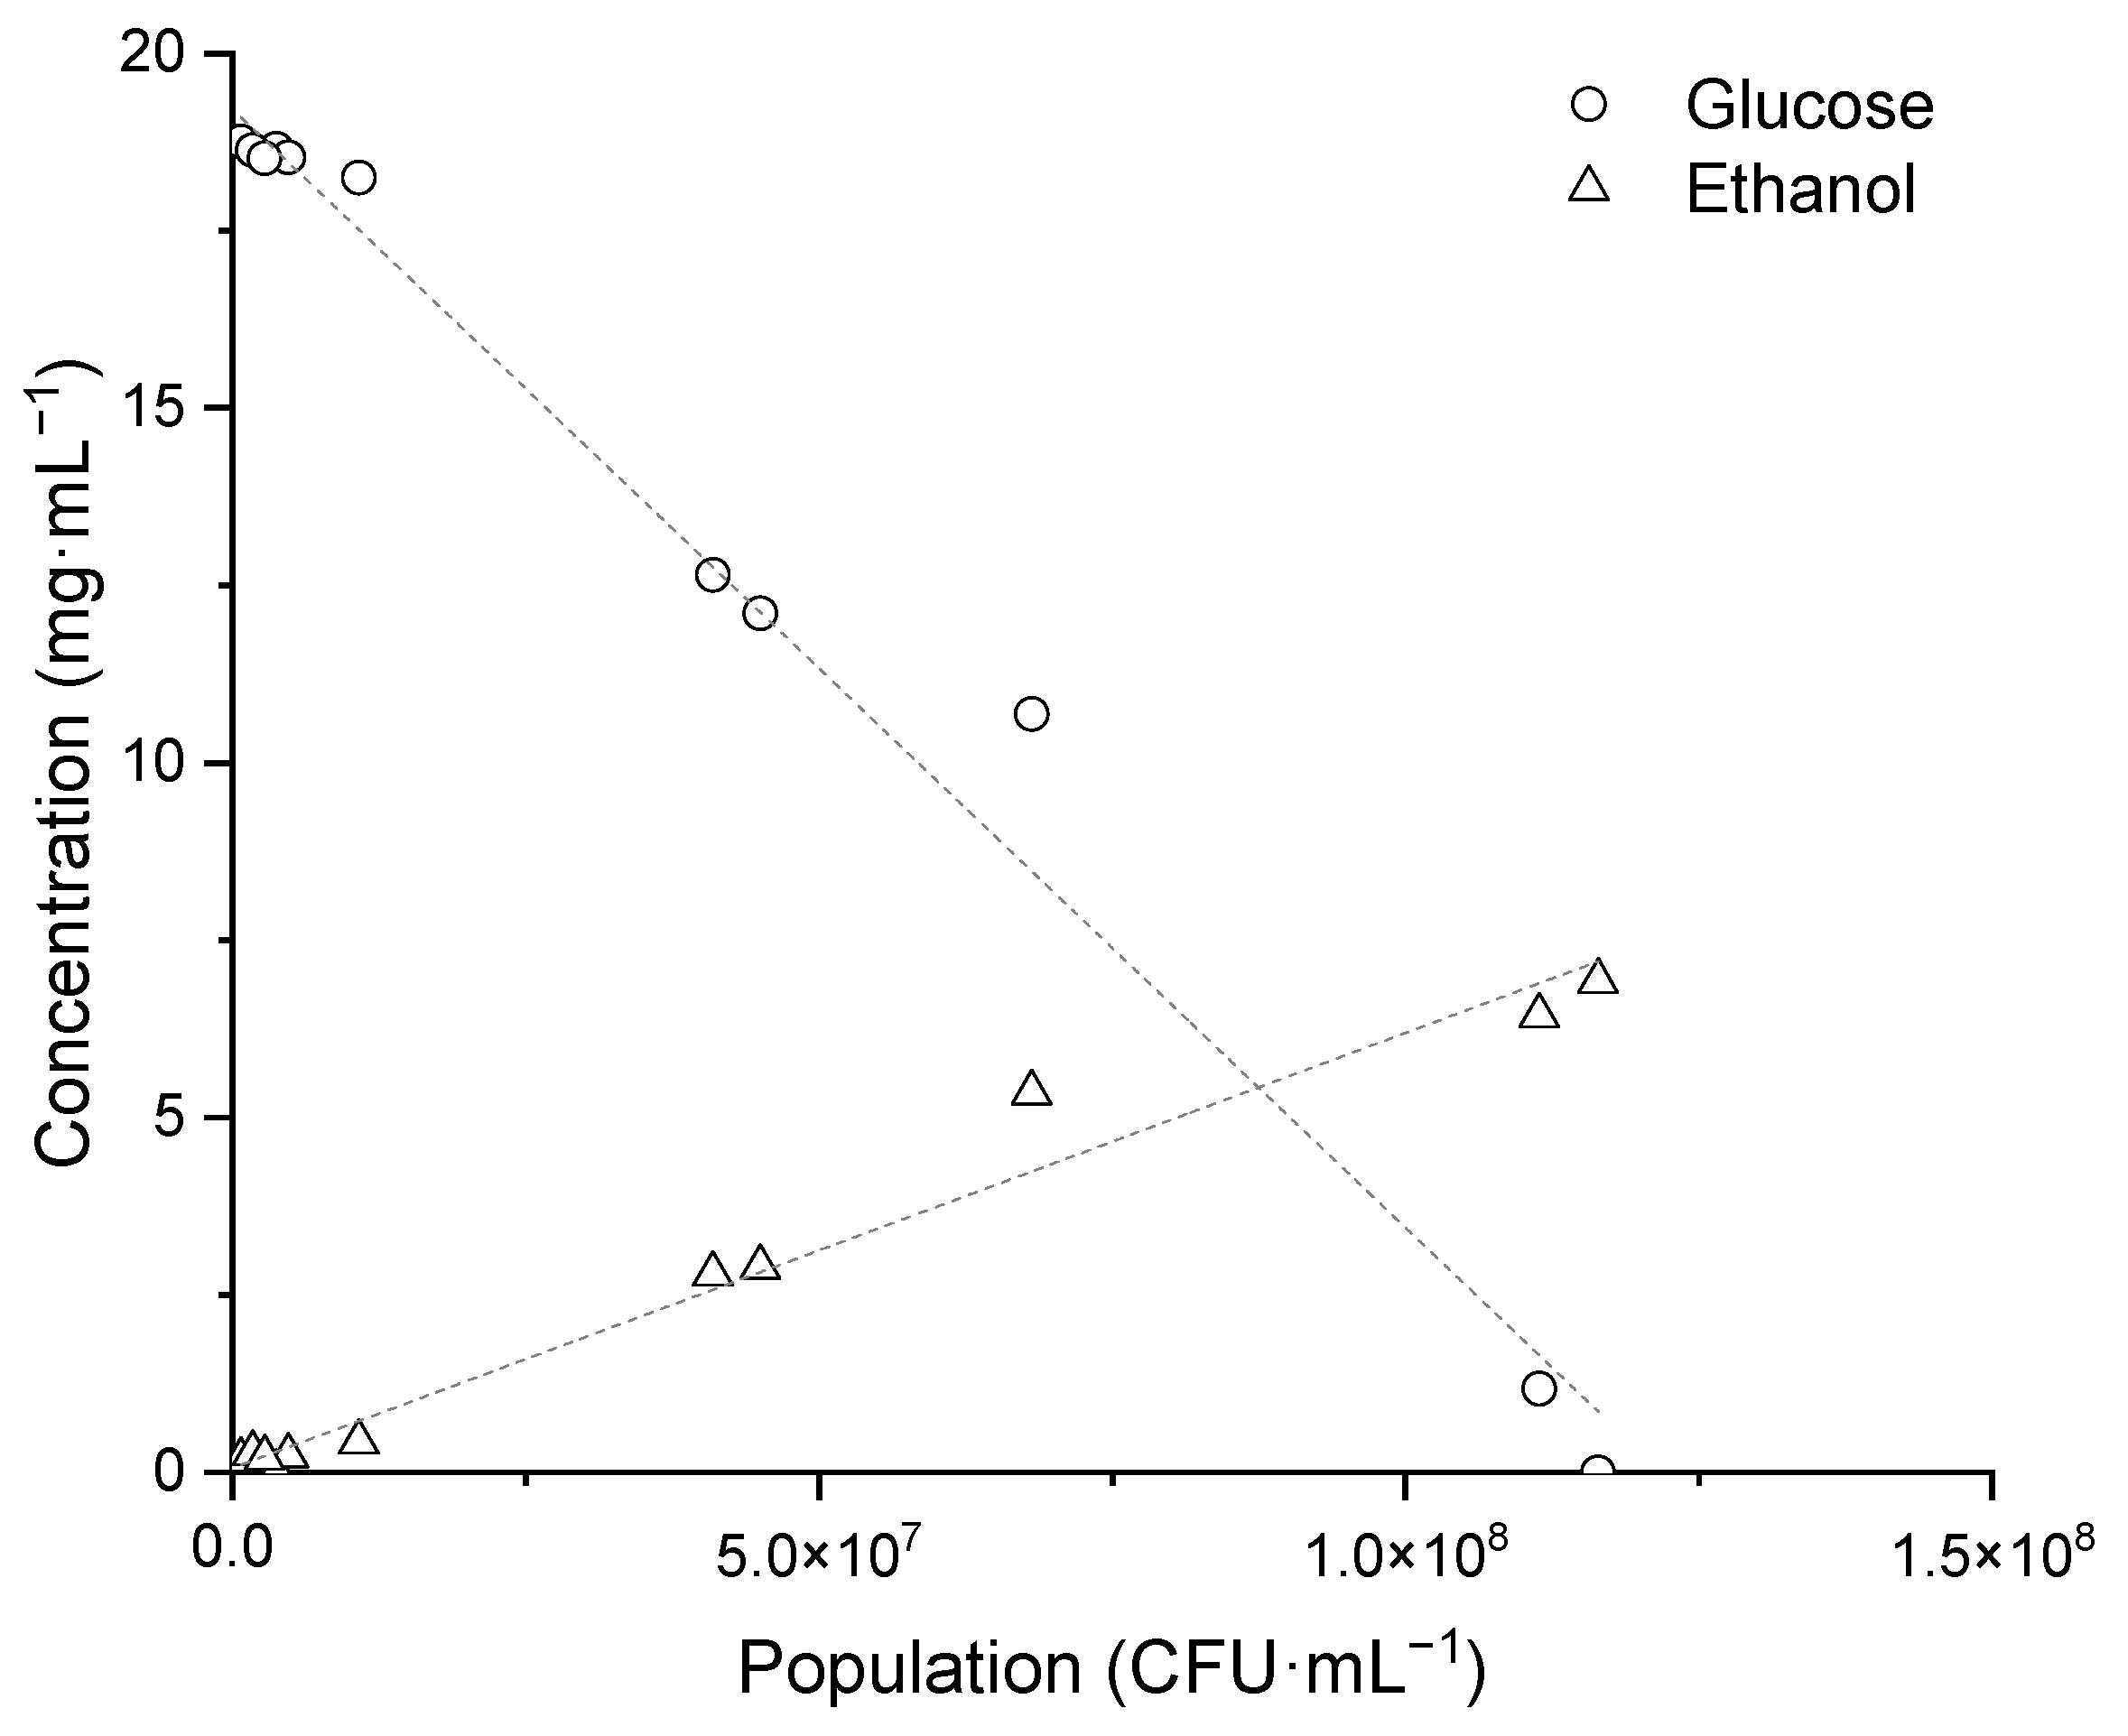
3.2. Ethanol Production from K. unispora Growth

Ethanol production was measured during the growth of K. unispora in the fermenter in Sabouraud broth (Figure 4). The production of approximately 7 mg·mL−1 of ethanol was observed from 20 mg·mL−1 glucose. The ethanol production rate was 6.1 × 10⁻⁸ mg·CFU−1 (Figure 3). Korcari et al. [21] obtained 7.9 mg·mL−1 of ethanol from same glucose concentration, but found that, in subsequent hours, ethanol was consumed. Other authors were able to obtain a similar amount of ethanol with K. unispora from a medium containing 34.82 mg·mL−1 sucrose, 11.24 mg·mL−1 glucose, and 88.26 mg·mL−1 maltose [24].

3.3. Resulting Parameters of Models

The model parameters of Kazachstania unispora are given in Table 1.
The lower µopt in carbohydrate experiments is due to higher than optimal pH of the prepared medium (pH ≈ 7).

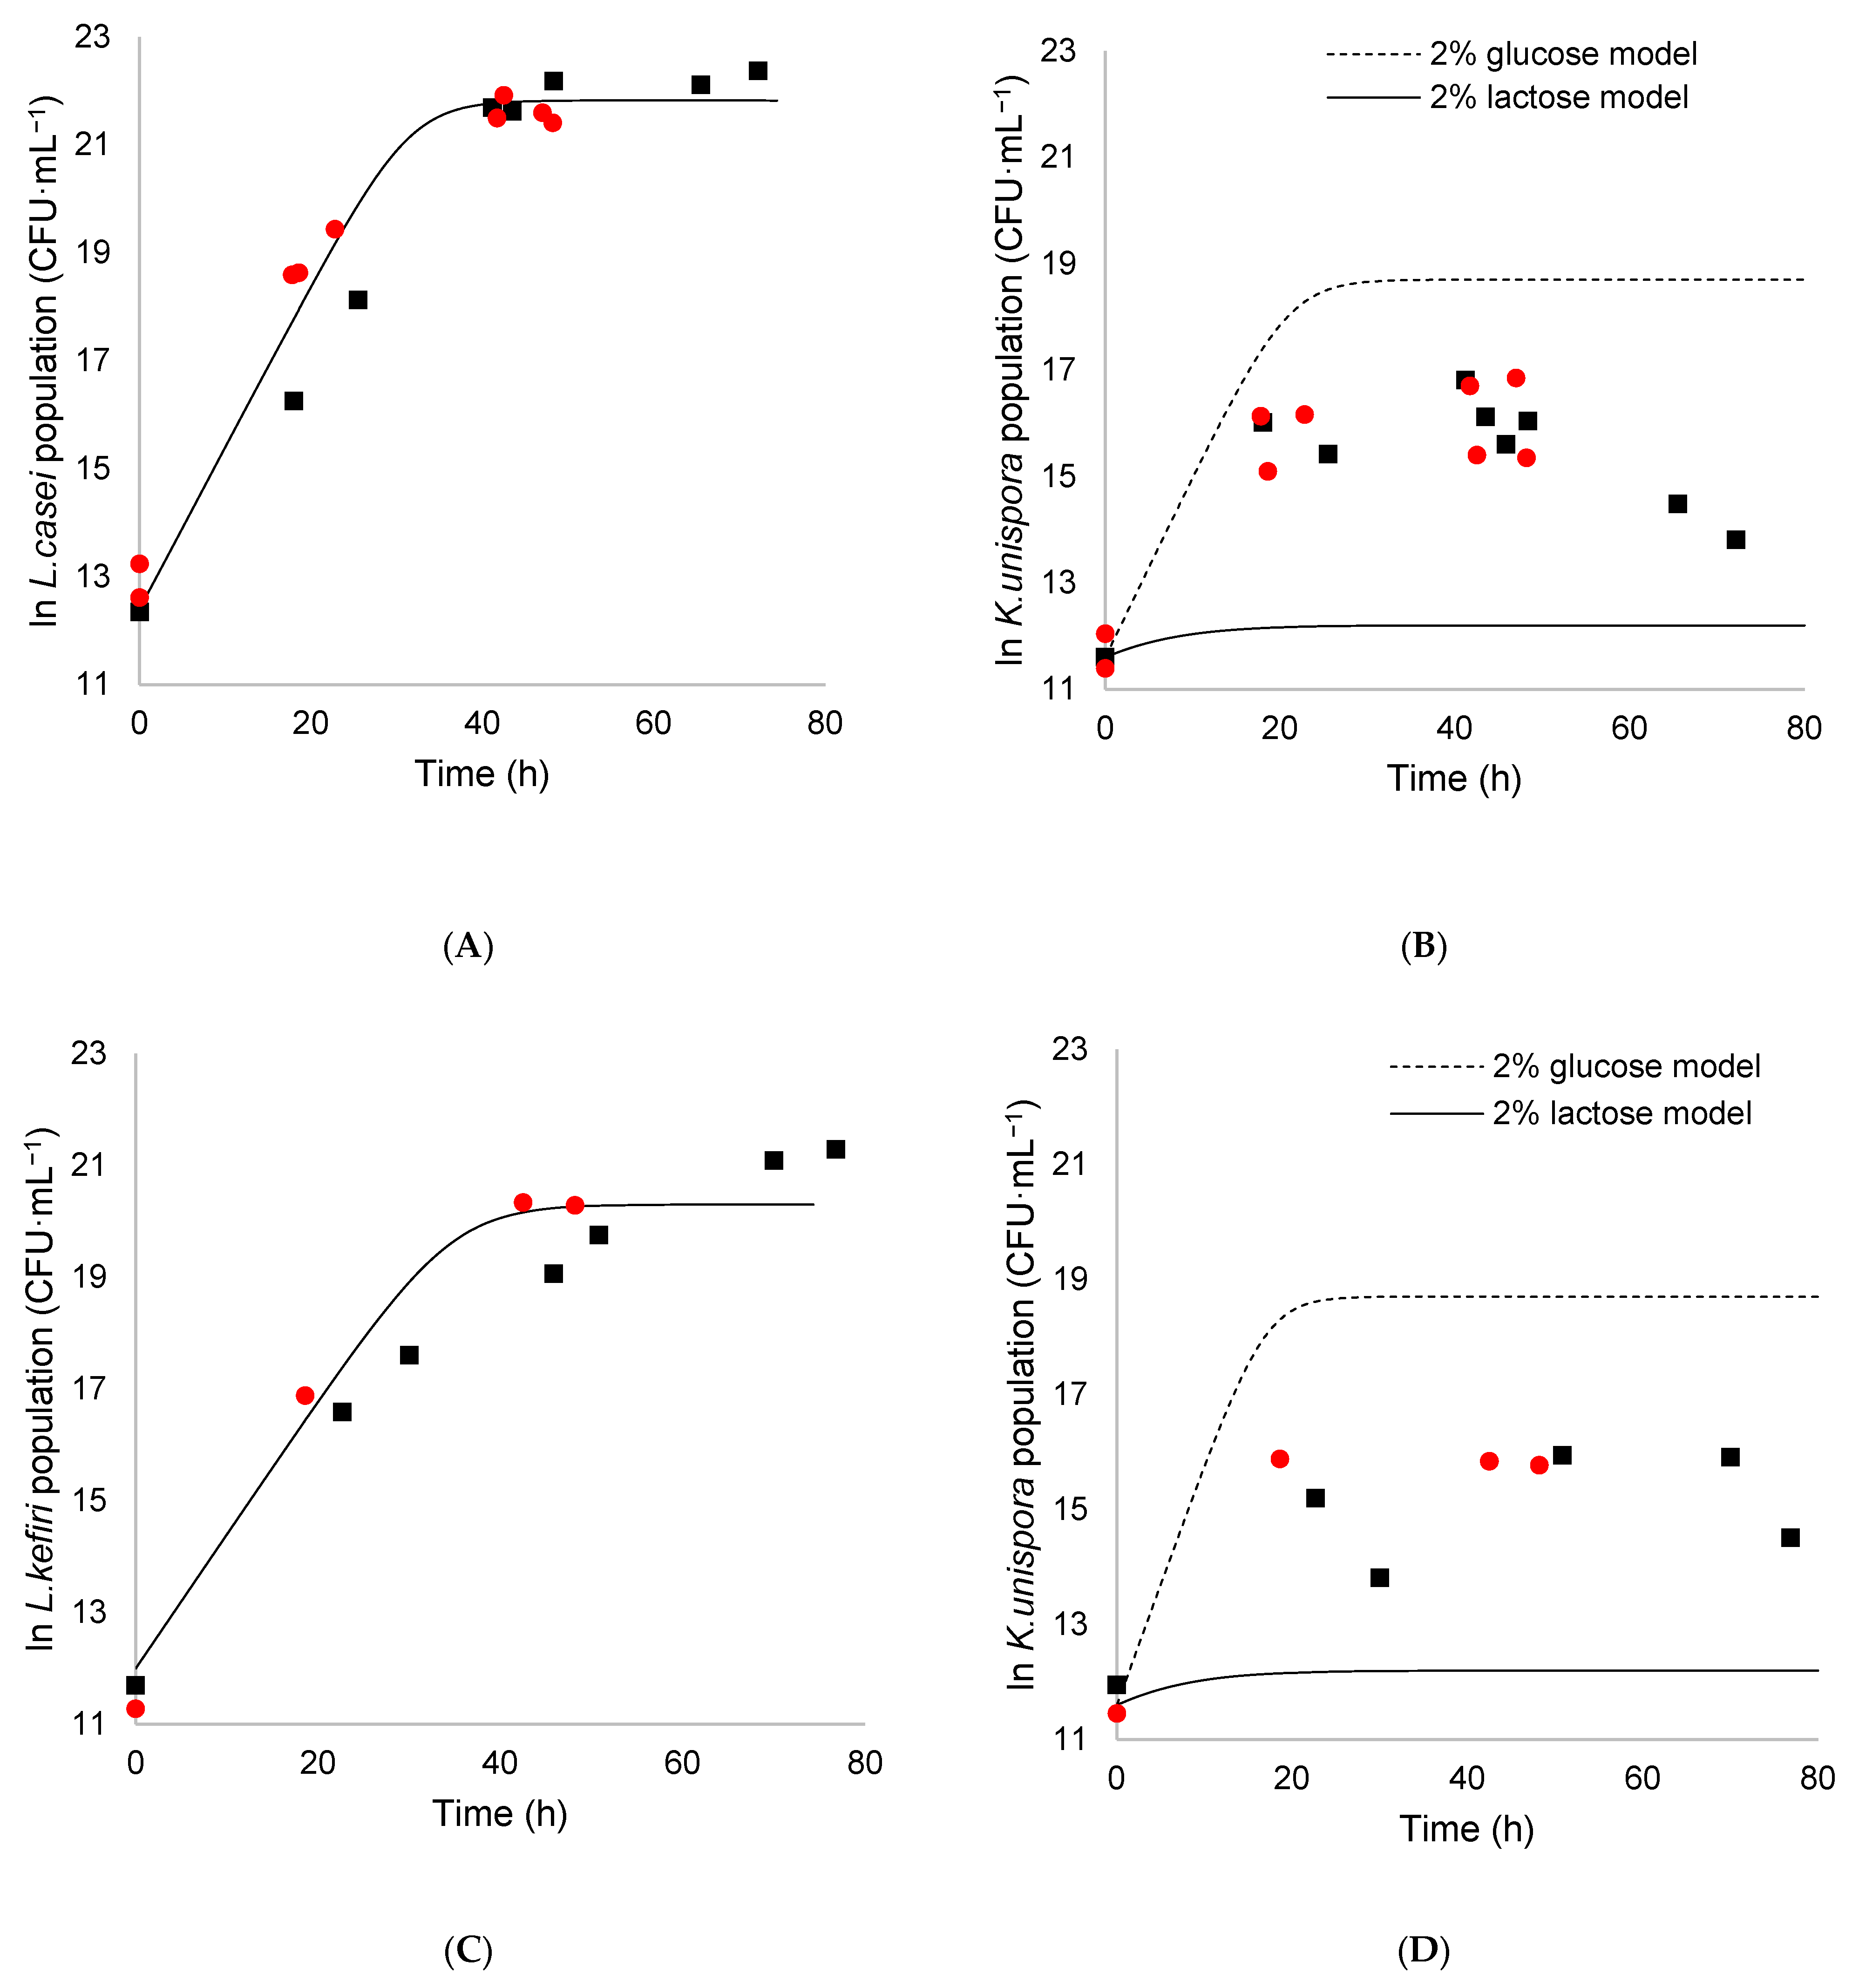
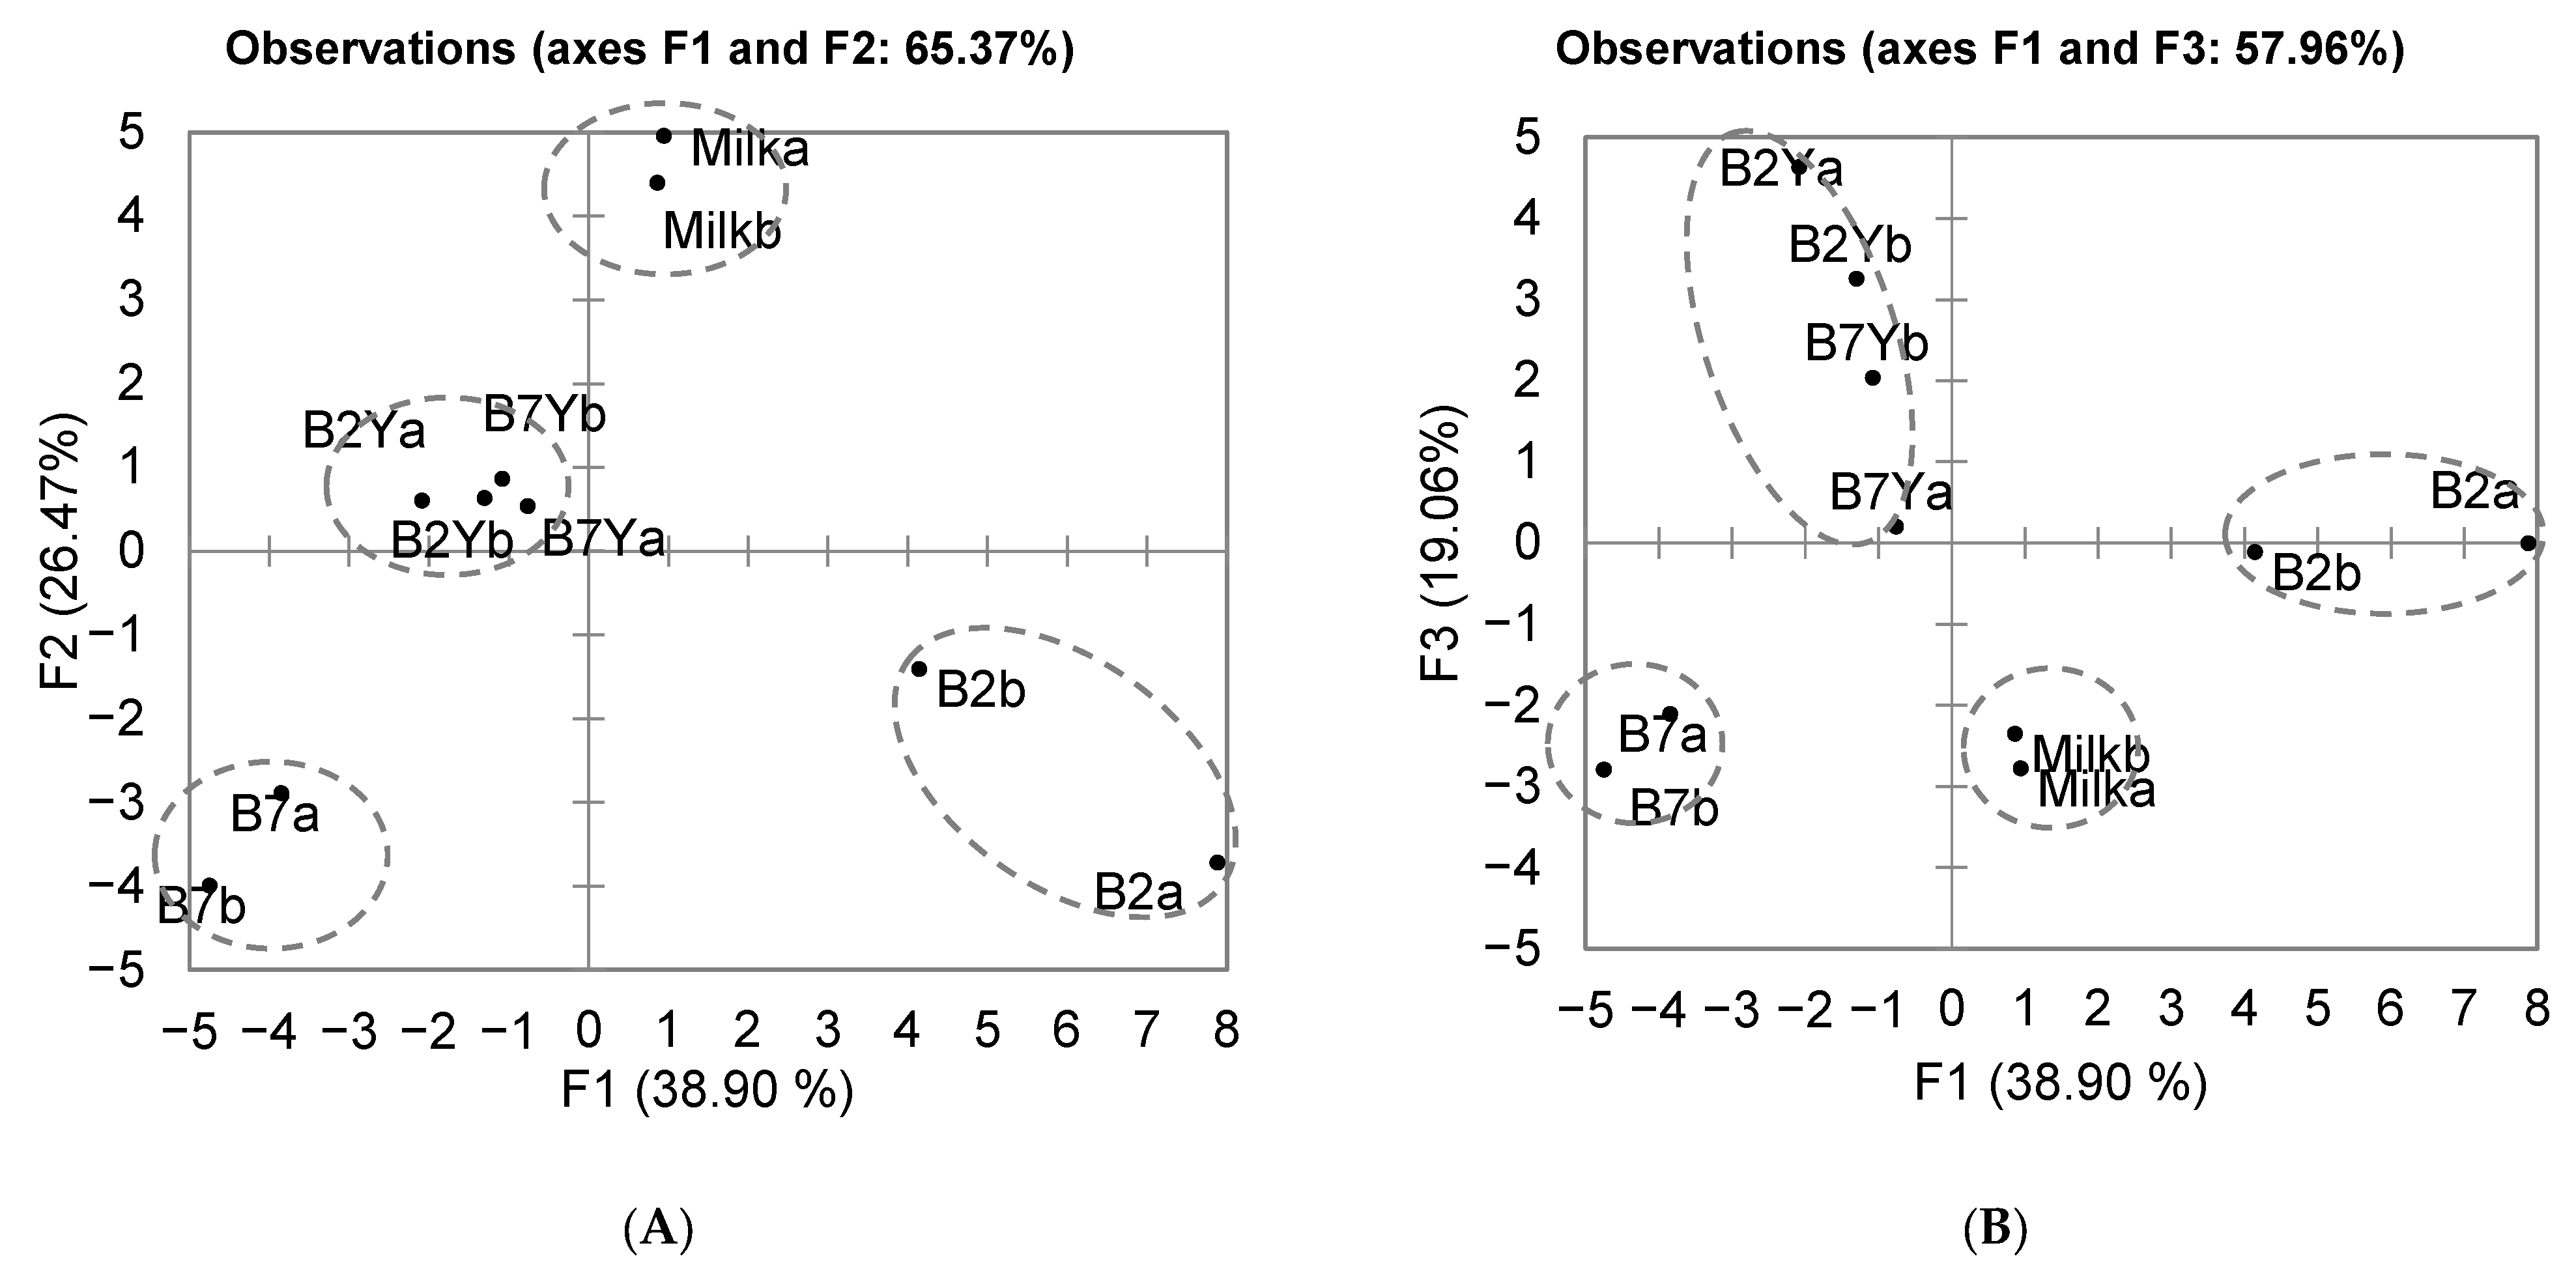
3.4. Coculture of K. unispora with Lactic Acid Bacteria

3.4.1. Evolution of the Population

K. unispora was grown with two lactic acid bacteria, namely, L. casei and L. kefiri, in modified MRS and reconstituted milk. The growth of L. casei and K. unispora at 25 °C are presented in Figure 5A,B, while the growth of L. kefiri and K. unispora at 30 °C is presented in Figure 5C,D.
In general, the results showed that the population obtained in a synthetic medium was similar to that obtained in reconstituted mare milk. Figure 5A,C shows that LAB simulated population obtained with the monoculture growth parameters obtained by Kondybayev et al. [15] fitted well with the experimental population of LAB in coculture. This means that the LAB population growth rate and final population was not significantly affected by the coculture with K. unispora. The only observable difference was an increase in the lag time of 5–6 h in the synthetic medium. On the other hand, for K. unispora, the simulated monoculture trend obtained with the growth parameters previously identified on lactose was significantly different from the experimental data (Figure 5B,D). It is interesting to observe that the experimental yeast population was higher than the expected simulated population in lactose. Therefore, the interaction with LAB is significant and confirms the role of LAB as a monosaccharide provider. However, the experimental population was below the population that could be achieved in a 2% glucose medium, represented by the dotted line. Similar observations were made by Korcari et al. [25] in MRS and spelt-based sourdough during coculture of maltose-negative K. unispora with other bacteria. They showed that K. unispora growth was possible, but to a lower extent, when cocultured with LAB. The limited growth of K. unispora may be more due to substrate scarcity rather than metabolite inhibition, as their growth stops around 12 h, while the composition of the medium remains similar to its initial state.
K. unispora had almost twice the population in the L. casei coculture (~9 × 10⁶ CFU·mL−1) compared with the L. kefiri coculture (~5 × 10⁶ CFU·mL−1), which is best visualized through the turbidity measurement, where even the diminished population of K. unispora had a visible impact on turbidity due to its cell size (Figure 5).
In Figure 6, we see that K. unispora growth started as expected but had a limited growth, while the growth of both LAB was lagging behind the models. The final population of K. unispora in cocultures reached a turbidity of 0.13 CU with L. casei vs. 0.06 CU with L. kefiri.
On the basis of above results and information from the literature on lactose consumption, the difference in K. unispora population could be explained by the difference in the growth rate of LAB and, as a result, their population difference, where a faster growth rate denoted faster monosaccharide production and yield. However, this does not explain the limited growth of K. unispora. In a monoculture, K. unispora can grow to a turbidity of 1.3 CU in a medium containing 20 mg·mL−1 glucose, which indicates that, in coculture, K. unispora was receiving only approximately 0.1–0.2 mg·mL−1 of monosaccharide. This amount of carbohydrate could be explained if the LAB were releasing glucose instead of galactose. This is based on the Monod values of LAB, where galactose Ks values were similar for both LAB, while glucose Ks values were twice those in L. casei (0.43 mg·mL−1) than in L. kefiri (0.21 mg·mL−1). Ks values demonstrate the amounts of limiting substrates at which microbial growth reaches half of the maximum growth rate. LAB first consume galactose due to a lower Ks, while glucose is released to the medium. When the released glucose reaches the bacterial Ks values, LAB start to grow faster on glucose and consume it themselves. This could explain the difference in K. unispora populations and their limited growth. However, in this case, K. unispora should have a prolonged lag phase instead of LAB, as K. unispora would wait for the digestion of lactose and release of glucose.
Another possibility could be the release of beta-galactosidase to the medium by LAB. As a result, the LAB lag could be explained by competition for monosaccharides released by the hydrolysis of lactose in the medium. In this competition for the newly formed monosaccharides, whose concentration is increasing gradually, organisms with a lower demand for carbohydrates could outperform organisms with a higher concentration demand. As a result, K. unispora has an advantage over LAB strains due to its lower glucose and galactose Ks values that contribute to reaching its maximal growth rate rapidly, but it needs a high amount of free monosaccharides to keep up the growth rate with an increasing population. When the monosaccharide concentration reaches the bacterial Ks values, they take over the overall growth as their upkeep is lower.
All hypotheses about the interactions between LAB and K. unispora, particularly the release of monosaccharides by LAB, which is a key factor in the growth of lactose nonfermenting yeasts should be tested in future woks.

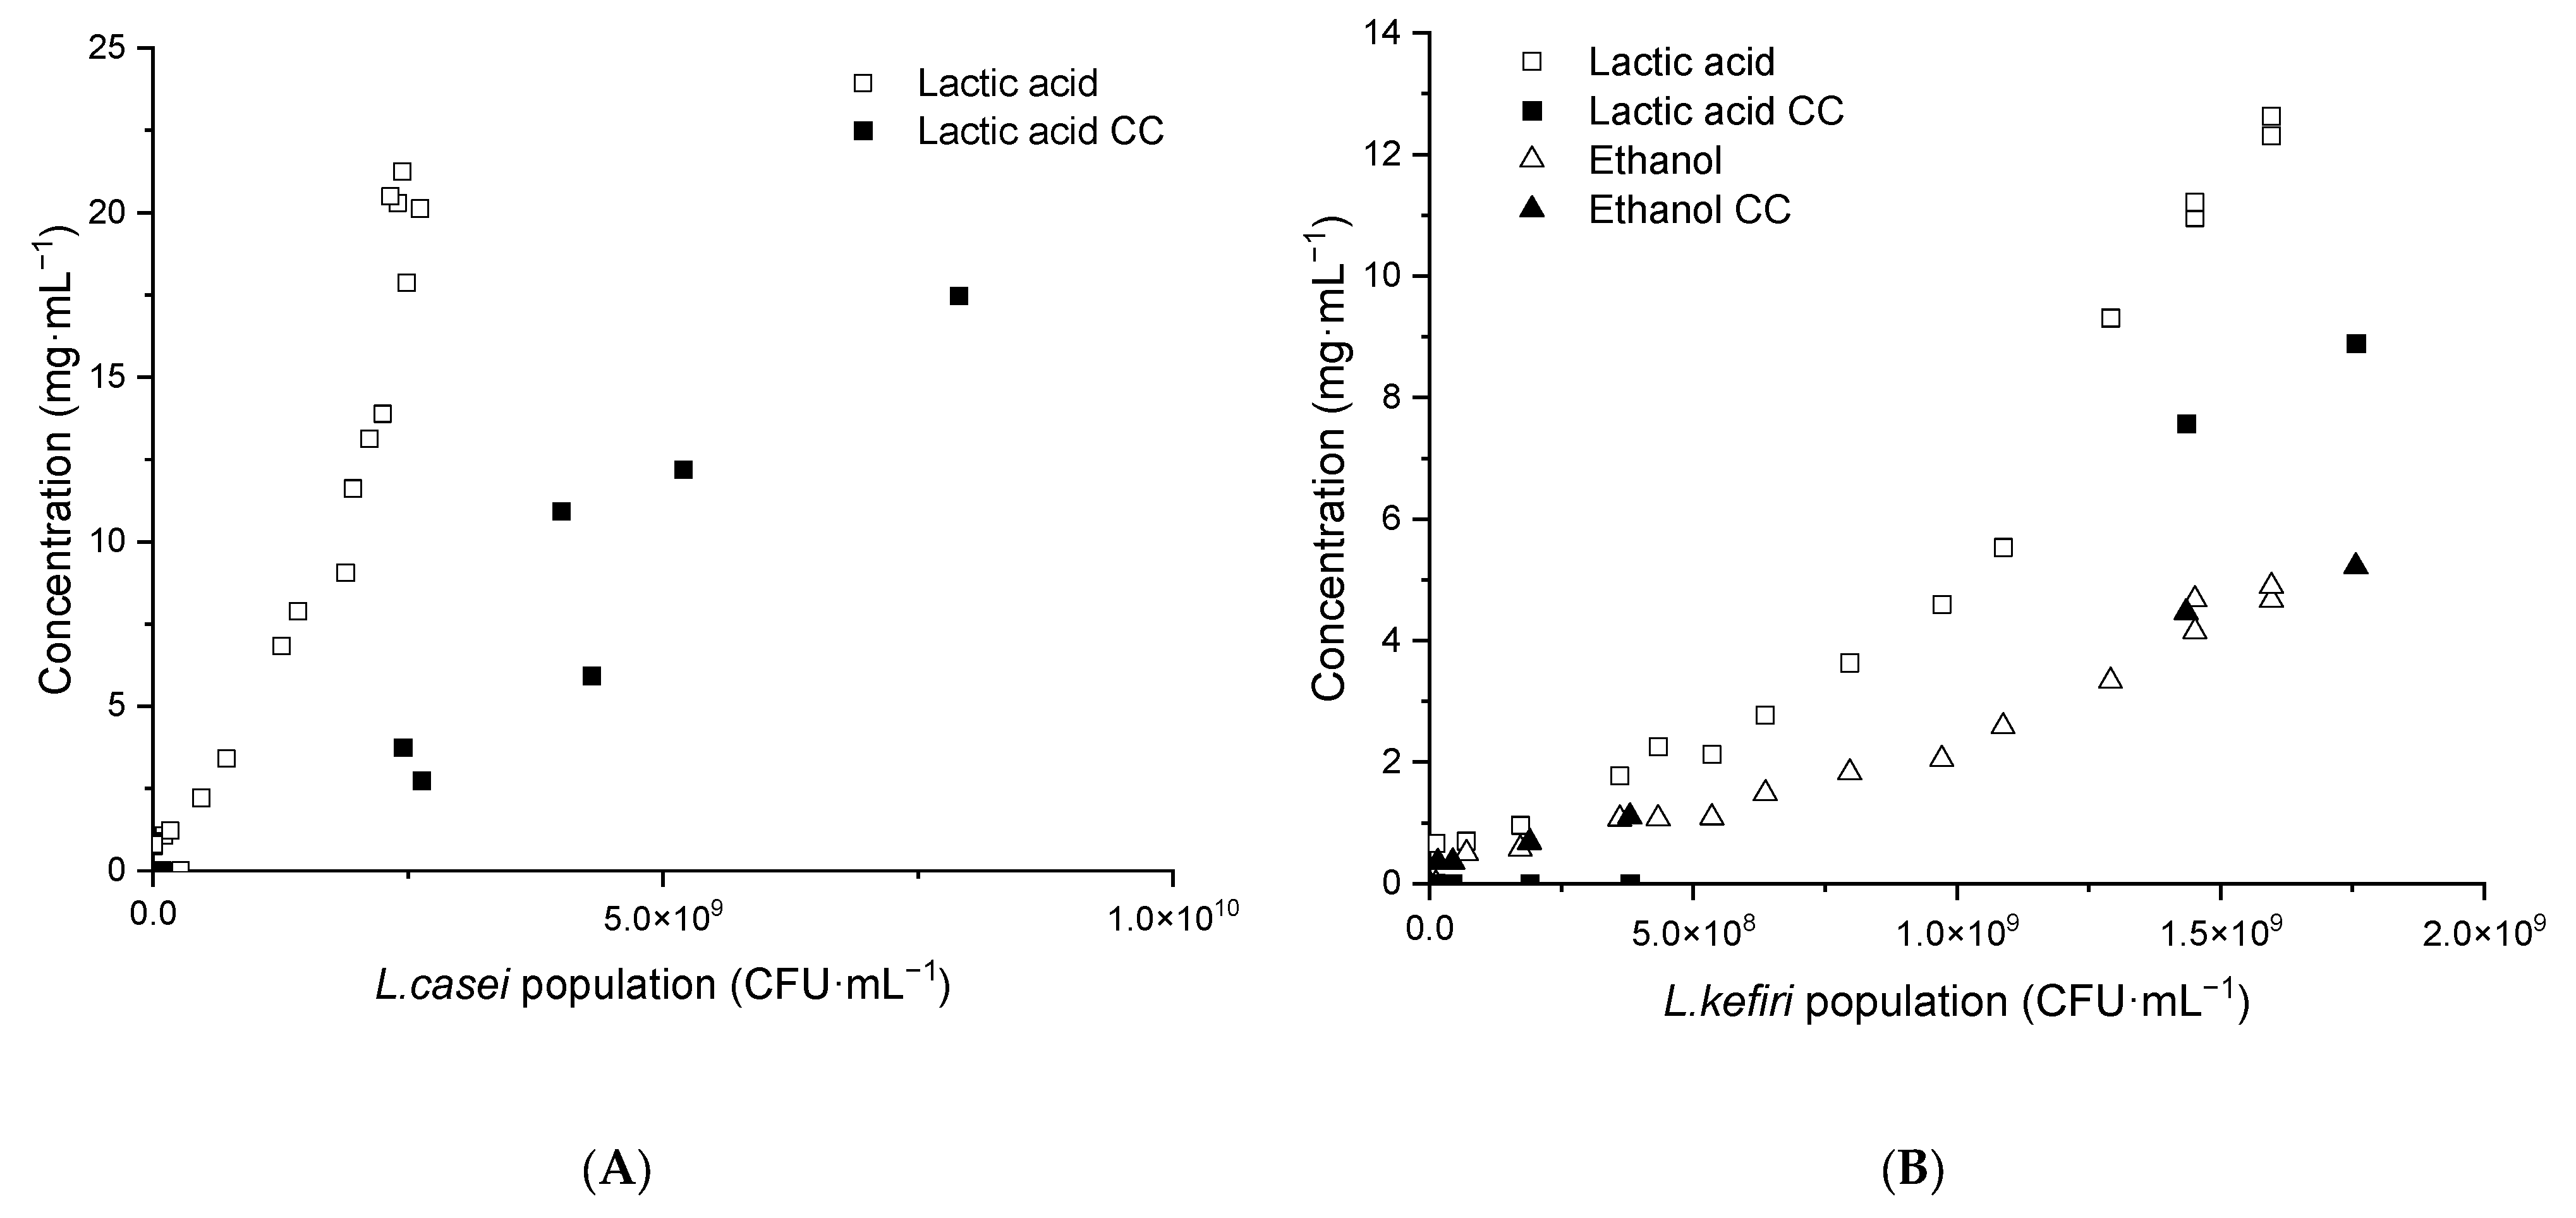
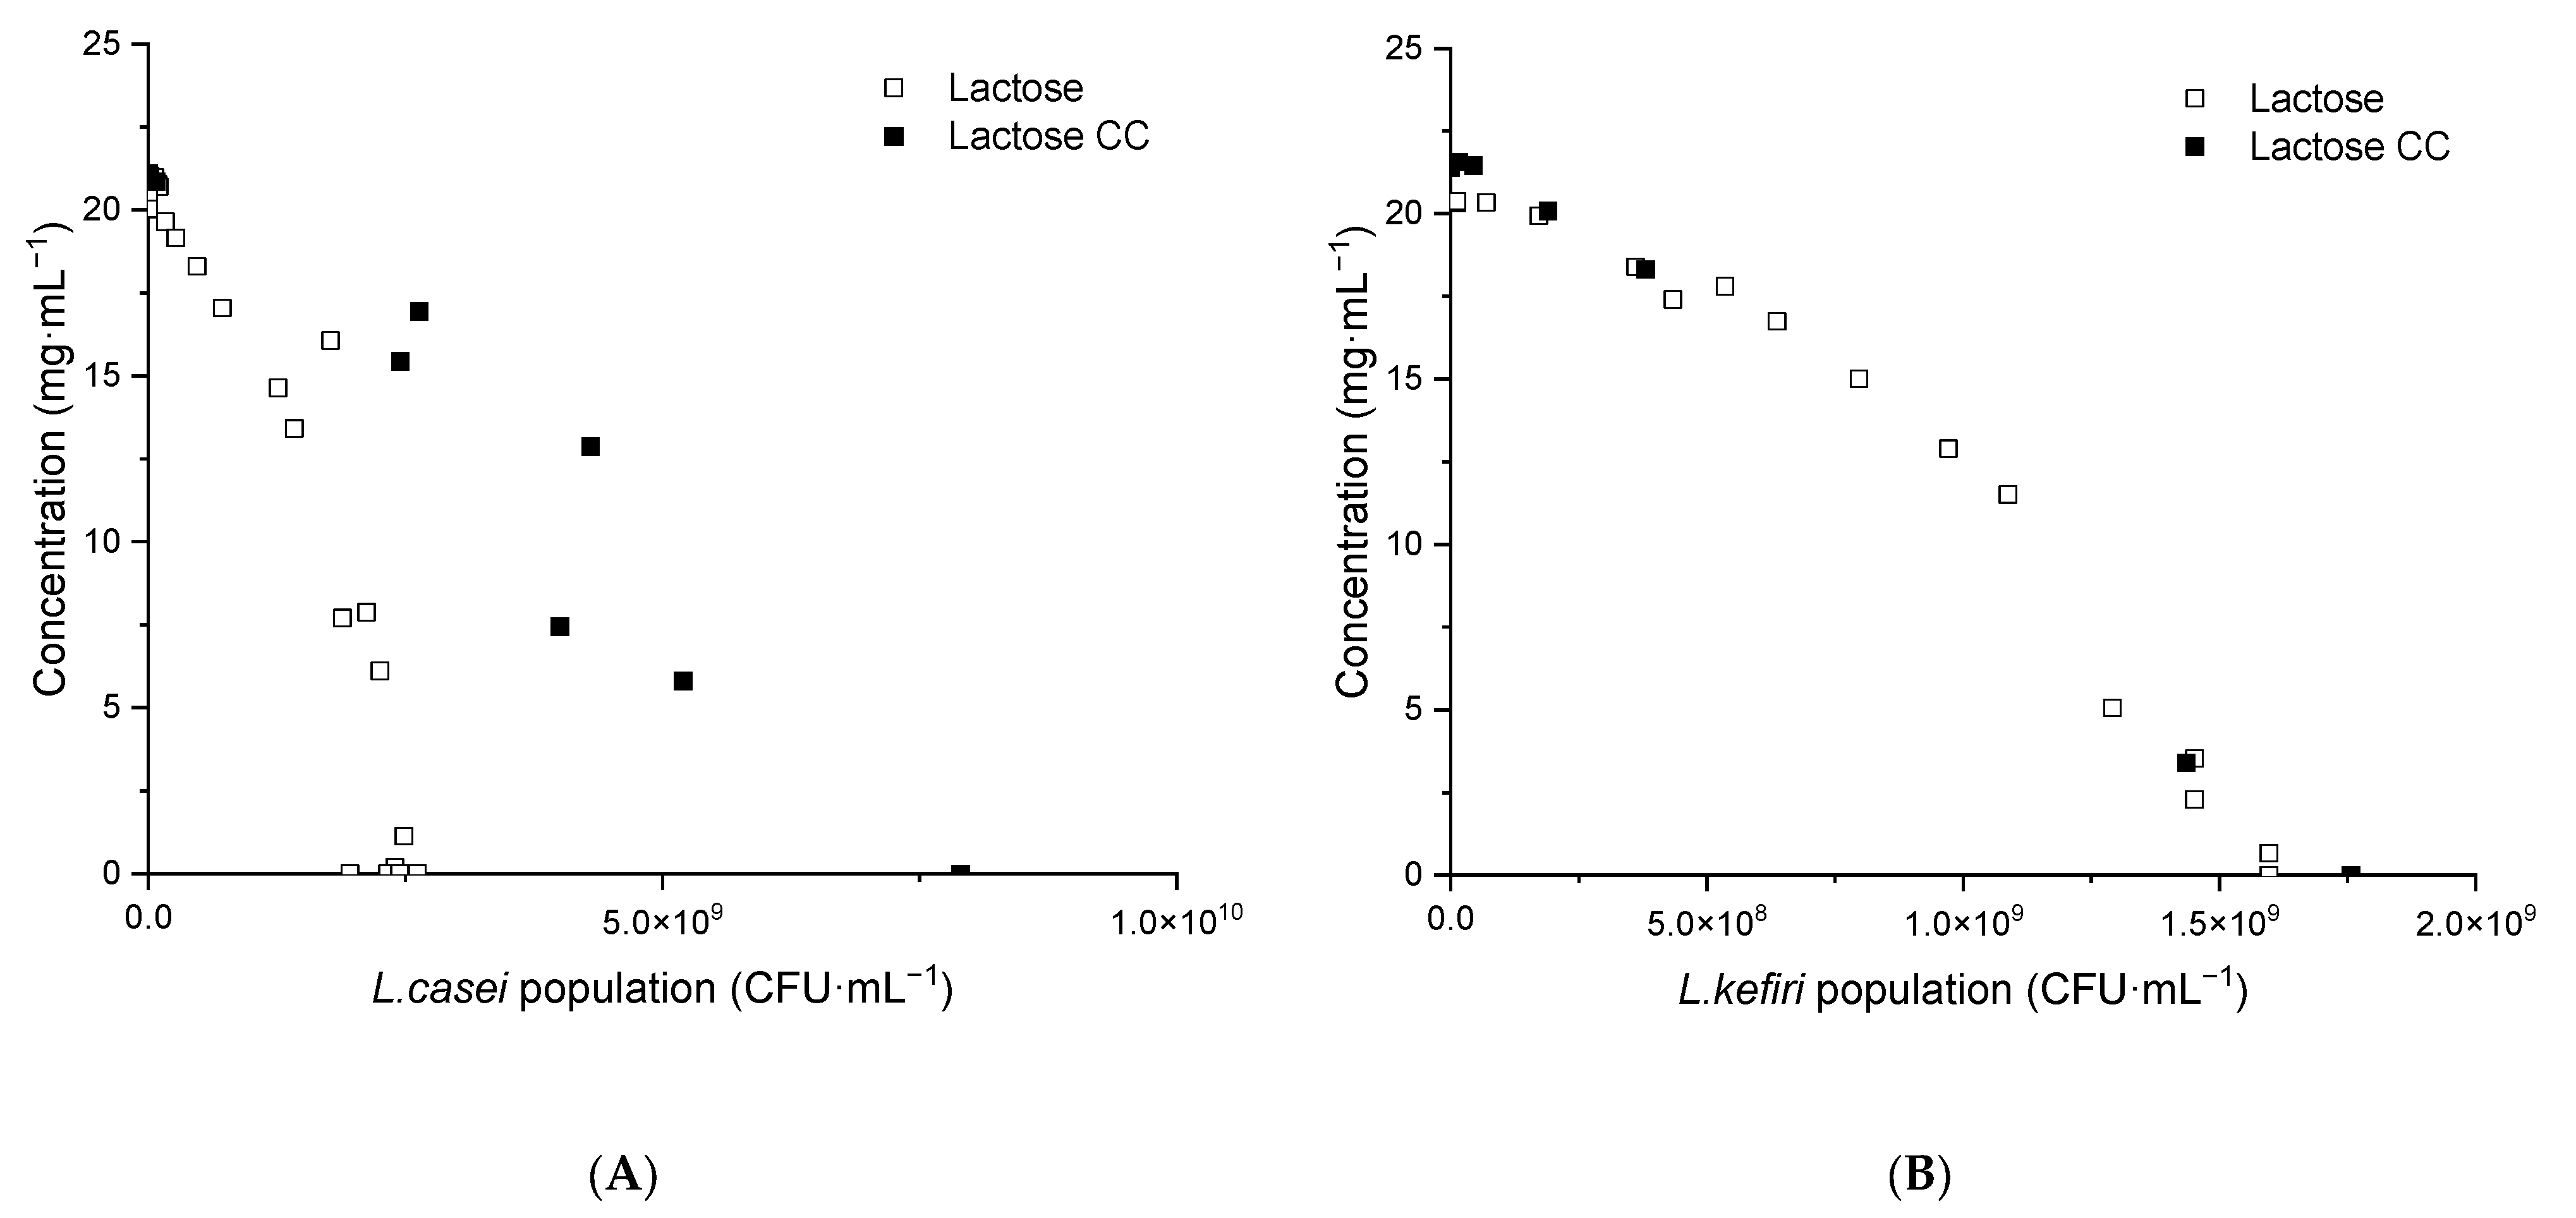
3.4.2. Lactic Acid and Ethanol Production

Figure 7 shows the amount of lactic acid and ethanol produced in the frame of the coculture (CC) as a function of the LAB population. Lactic acid production in both cocultures was slower than in individual LAB fermentations, which is expected as a portion of the carbohydrates were used by K. unispora (Figure 7).
Among the studied LAB, only L. kefiri produces ethanol [15]. The content of ethanol in the L. kefiri coculture reached ~7.8 g·L−1, which was the same level as in the monoculture of this strain. On the other hand, 0.45 g·L−1 of ethanol was observed in L. casei fermentation, which is slightly below the amount that the K. unispora population (~9 × 10⁶ CFU·mL−1) could produce. This indicates that K. unispora was very limited in its ethanol production in coculture with LAB due to its low population.
Regarding lactose consumption, a considerable amount of lactose remained undigested with amounts of 27.2 g·L−1 in K. unispora–L. casei and 19.3 g·L−1 in K. unispora–L. kefiri cocultures. This high content could be explained by the LAB growth sensitivity to the pH drop. Indeed, the fermentation slowed down close to the minimum pH value of L. casei at 3.8 and at 3.4 for L. kefiri.
Lactose consumption is presented as lactose change during coculture and compared to individual lactose consumption models of LAB in Figure 8. Lactose consumption in mono- and coculture followed the same trend for L. kefiri.
Interestingly, for L. casei, more than a twofold population increase was observed from a similar lactose change. This could be due to slower lactic acid production and, consequently, slower pH decrease in the coculture. Indeed, an increase in the initial population of L. casei to 107 CFU·mL−1 in coculture led to faster acidification and, consequently, to a lower final population of L. casei (3.1 × 10⁹ CFU·mL−1).
The results showed that qymyz fermentation is mainly driven by LAB, while, in the case of L. casei and K. unispora, they are able to enhance their growth by slowing the pH decrease. In traditional qymyz, producers continue diluting qymyz with fresh mare milk over several days, which keeps the pH higher and, thus, keeps the LAB active.

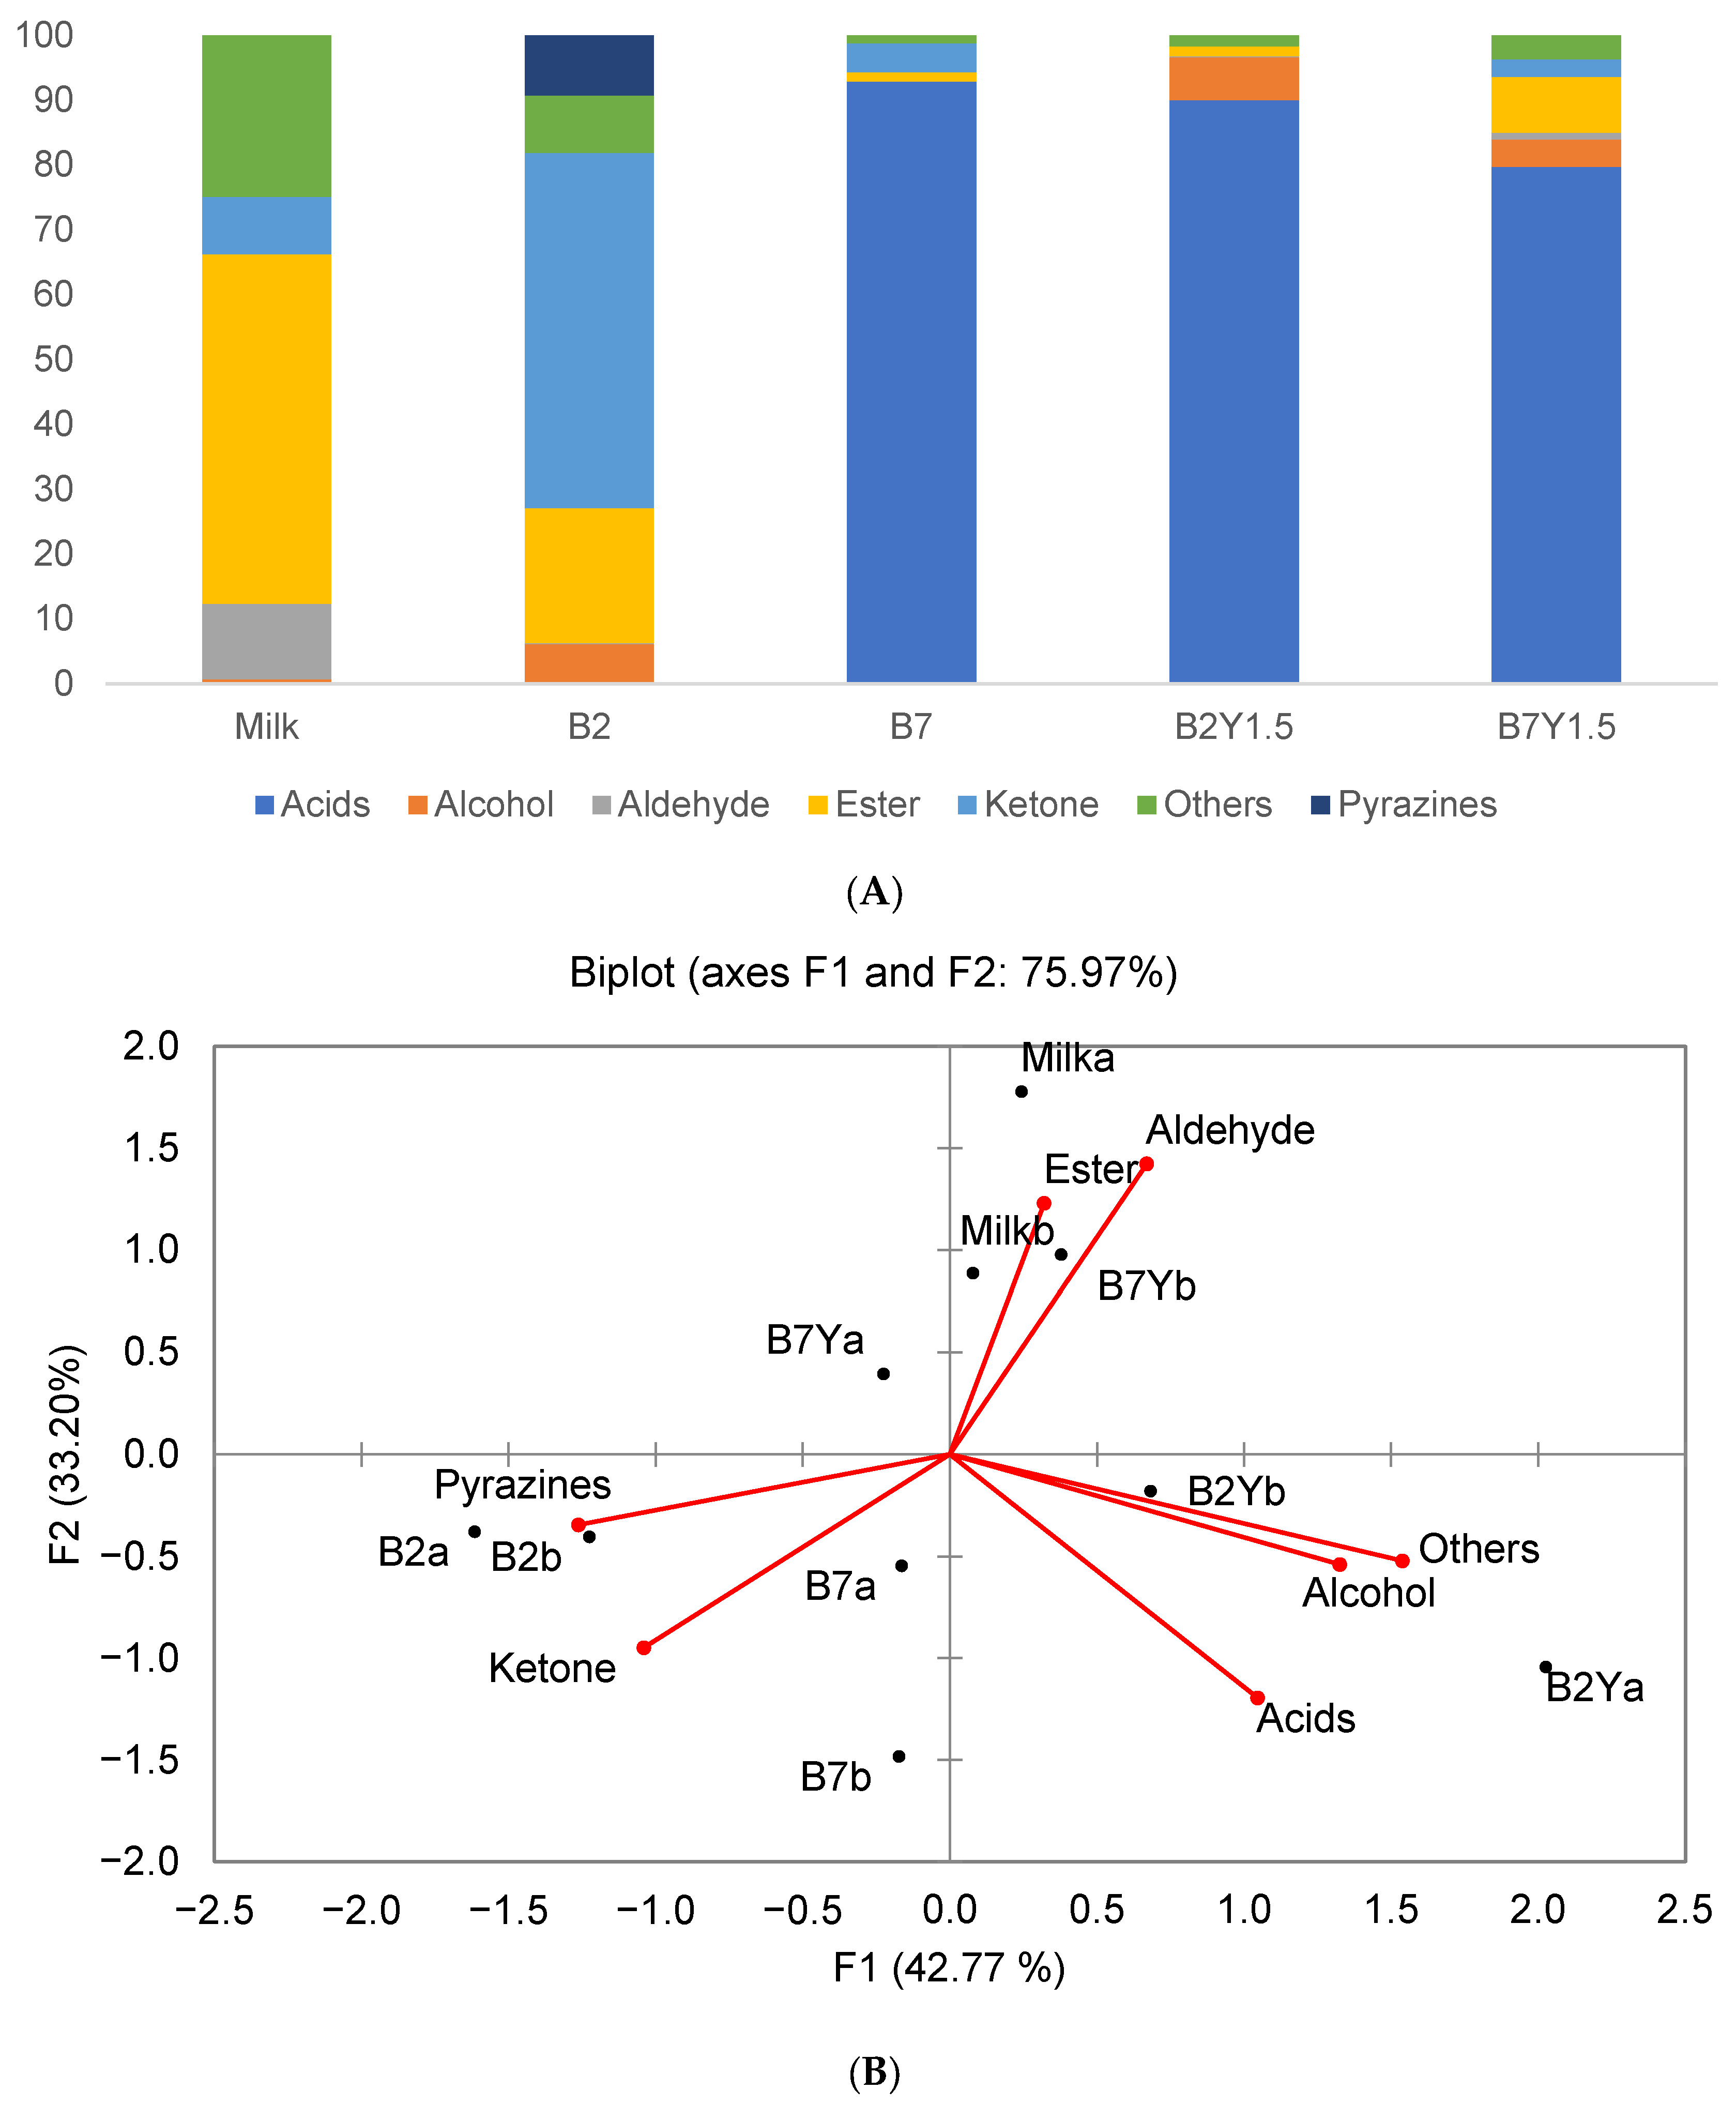
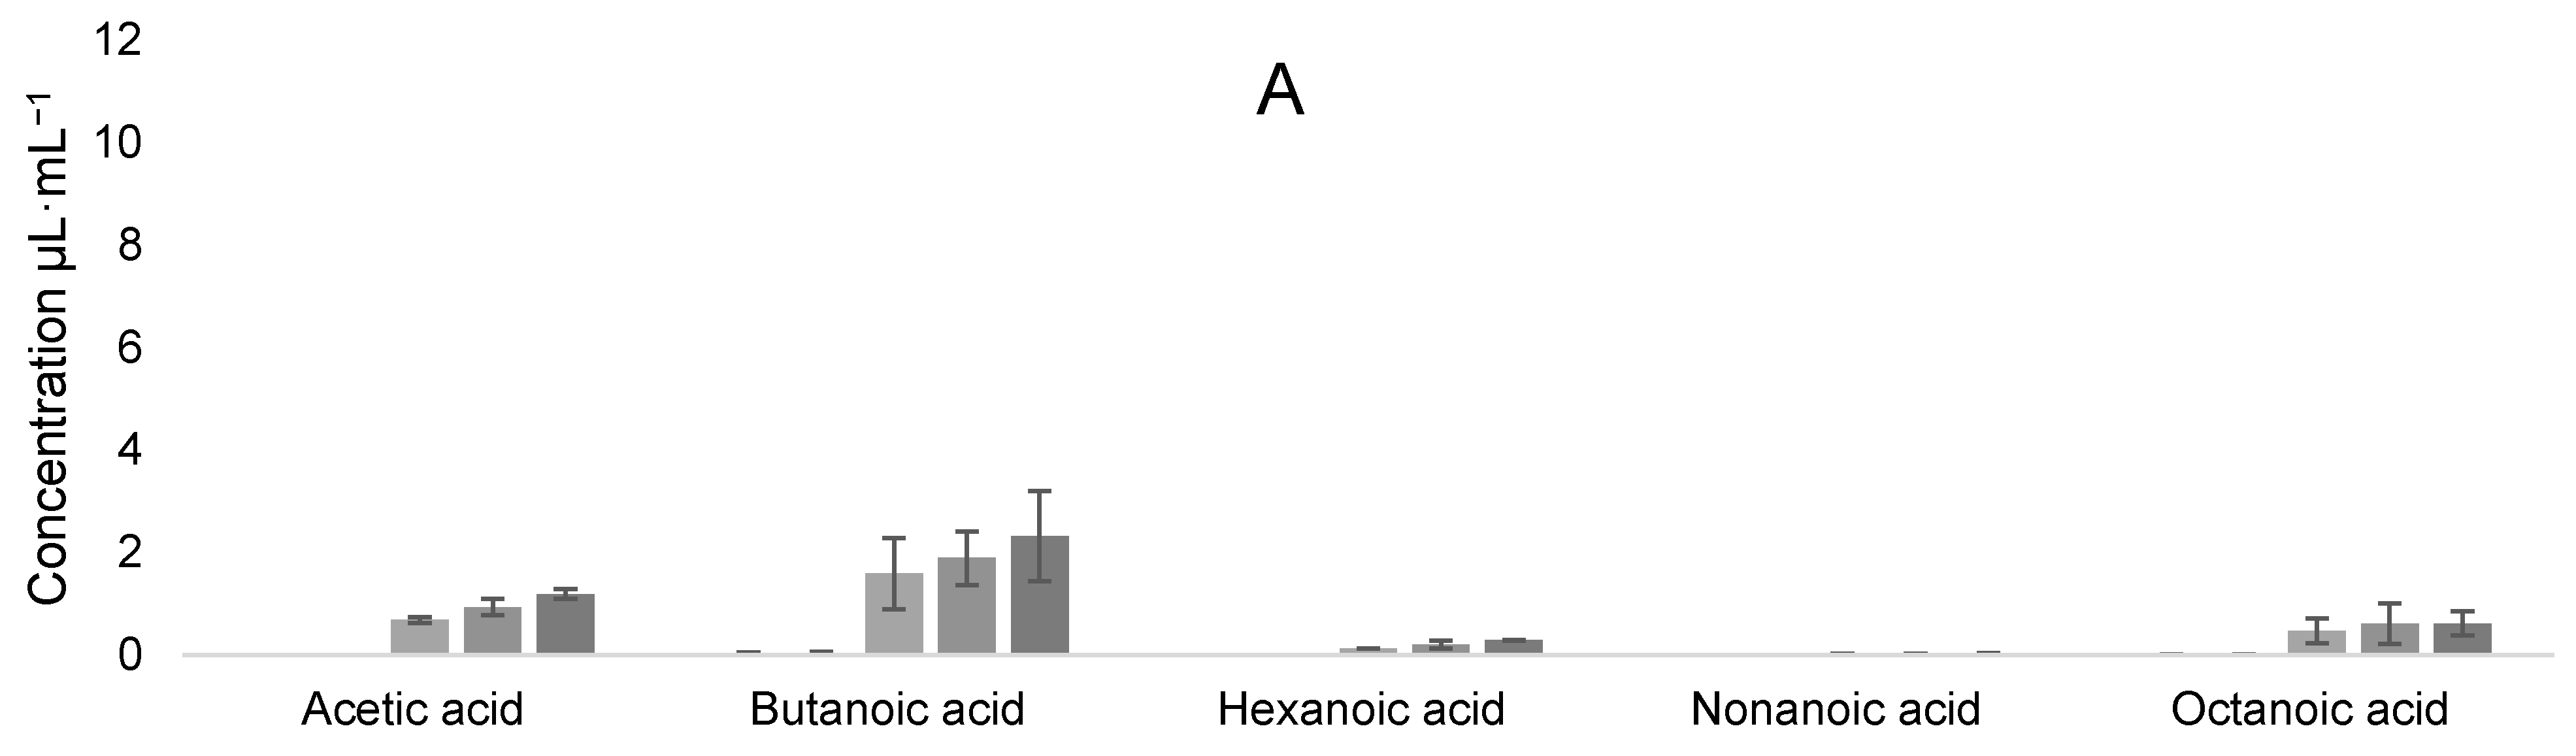
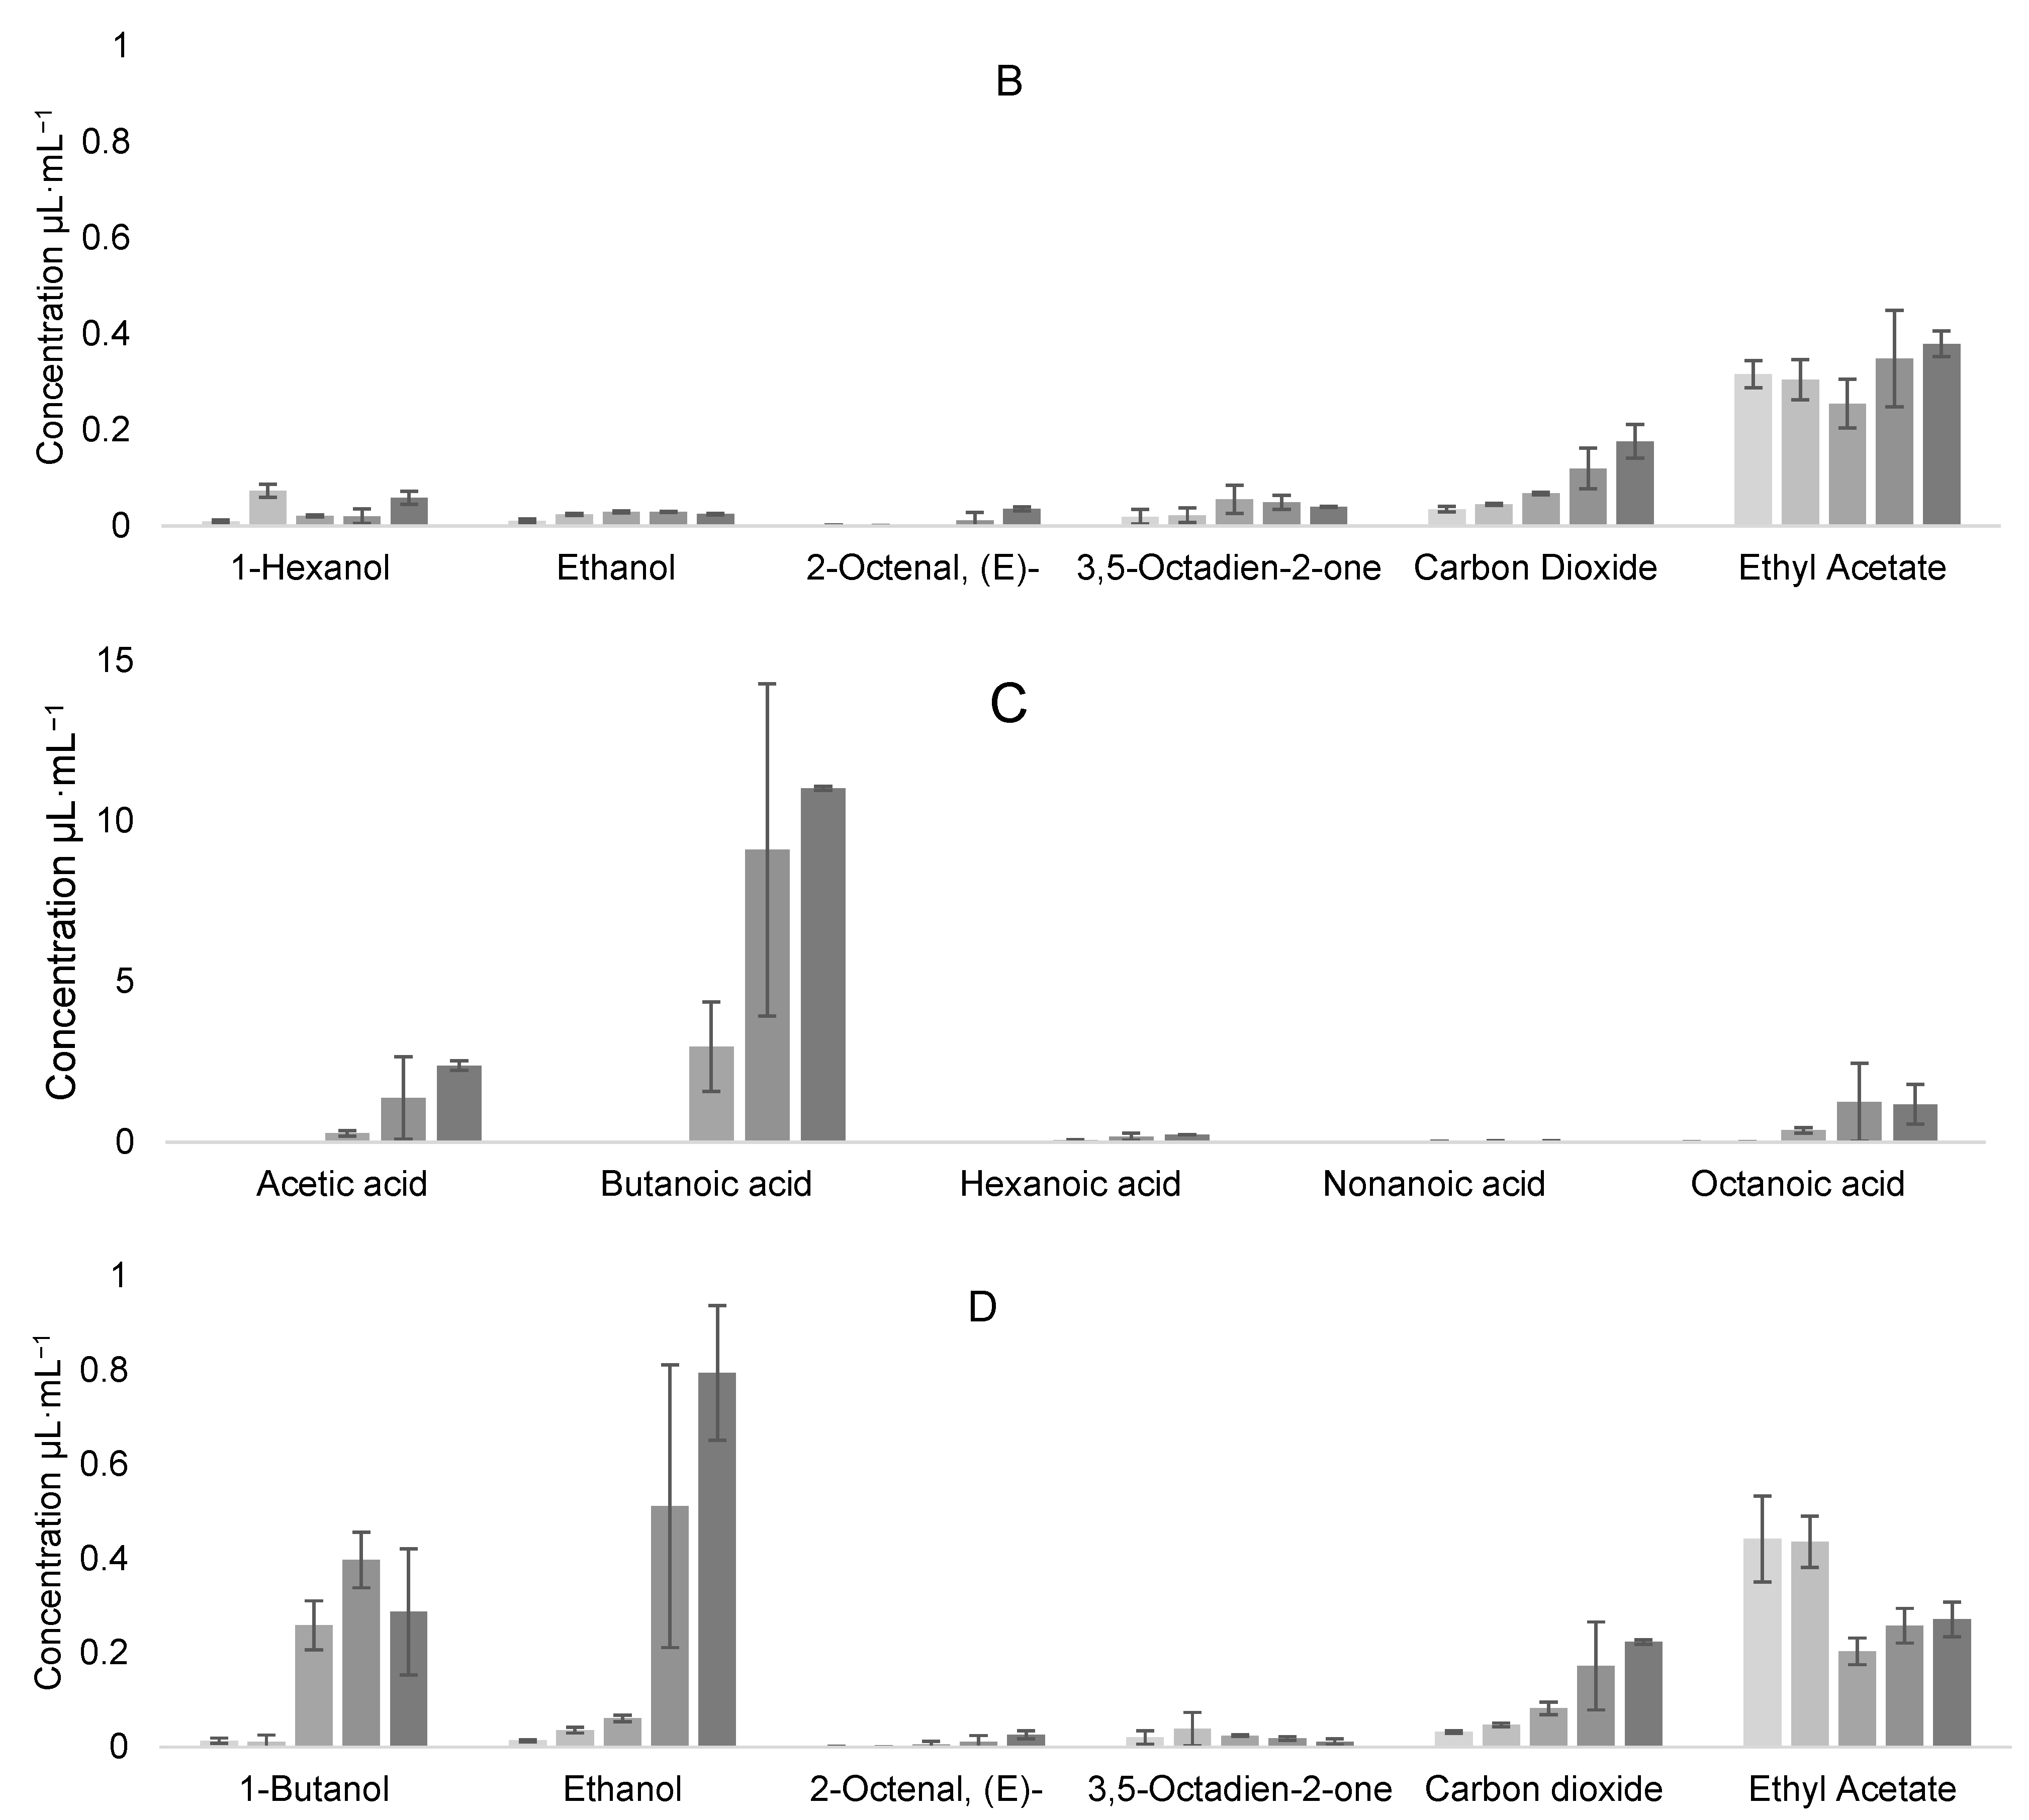
3.5. Volatile Organic Compound Production

Analysis of VOCs was conducted on reconstituted mare milk fermented with individual LAB and their coculture with K. unispora (Y1.5). K. unispora is a lactose nonfermenting yeast; hence, it had to be cocultured with bacteria. The analysis resulted in 37 VOCs that were grouped by their chemical family, namely, acids, alcohols, aldehydes, esters, ketones, pyrazines, and others. The relative composition of samples by chemical family of VOCs is illustrated in Figure 9A.
The PCA of VOC groups is shown in Figure 9B. The main factors of the PCA explained 72% of the variance. The results show that the mare milk mainly consisted of esters. Milk fermented with L. kefiri (B2) contained high amounts of ketones and pyrazines. Acids such as acetic, butanoic, and octanoic acids were the main compounds in L. casei (B7), L. casei–K. unispora (B7Y), and L. kefiri–K. unispora (B2Y) samples. The full VOC composition of each sample according to the compound groups is presented in Table S1 of the Supplementary Materials. PCA analysis of all VOCs is presented in Figure 10. Four distinct groups were identified: L. kefiri only (B2a,b), L. casei only (B7a,b), LAB–K. unispora (B2,7Y), and the milk group. The main factors of the PCA explained 65% of the variance (Figure 10A). Due to proximity of the coculture group to the center of the PCA, the PCA with factors 1 and 3 is also provided for better separation (Figure 10B).
The overall VOC PCA analysis shows that the two LAB strains produced a different aroma; however, when cocultured with K. unispora, the VOC profiles of the samples grouped together. This confirms the findings of other authors that yeasts have an important role in aroma modulation when cocultured with LAB [26].
Discriminant analysis between LAB only and LAB–yeast groups showed that the following compounds from most to least discriminating were involved: 2-octenal, 3,5-octadien-2-one, hexanoic acid, 2-methyl-propanoic acid, and 2,5-dimethyl-pyrazine. Furthermore, 2-octenal, 3,5-octadien-2-one, and hexanoic acid were found in milk and cheese fermented with LAB [27,28]. In addition, 2-methyl-propanoic acid was found in UHT milk containing Bacillus sporothermodurans [29], whereas 2,5-dimethyl-pyrazine was found to be produced by Corynebacterium glutamicum and is described as having a nutty, roasted flavor [30].

Evolution of VOCs during Coculture Fermentation

Samples from different times during fermentation were also analyzed at 0, 19, 42.5, 114, and 138 h. The results of the evolution of VOCs can be seen in Figure 11A,B for the L. casei–K. unispora coculture, and Figure 11C,D for the L. kefiri–K. unispora coculture.
In addition, some of the VOCs that increased significantly during the coculture are given with their odor threshold and odor activity value in Table 2. As can be seen, esters, aldehydes, and acids become the main contributors in the final qymyz odor, with 2-octenal having fatty and herbal notes, ethyl acetate having fruity notes, butanoic acid having cheesy notes, and acetic acid having vinegar notes.
Even if the VOCs were similar in their nature for both cocultures, they differed by their contribution. Logically, ethanol contribution was higher for the K. unispora–L. kefiri coculture, but butanoic acid was also at a higher concentration. In the case of the K. unispora–L. casei coculture, the 2-octenal and ethyl acetate contribution was higher, certainly because of a higher yeast population. Carbon dioxide, which is produced mainly by K. unispora, was also higher in this coculture. Therefore, the substrate interaction between LAB and yeast is of major importance to modulate the final VOCs in qymyz.

4. Conclusions

In conclusion, K. unispora is a yeast that does not digest lactose and is frequently discovered in the qymyz microbiota. The abundance of non-lactose-fermenting yeasts in milk is suggestive of a symbiotic interaction between LAB and K. unispora, where LAB act as the provider of carbohydrate source. Our study found that the K. unispora growth rate was comparable to that of S. cerevisiae on glucose. However, K. unispora can tolerate a more acidic environment, which may explain its potential for coculture with LAB. In terms of temperature, K. unispora was unable to grow at temperatures above 37 °C and preferred temperatures around 30 °C. The growth of K. unispora was limited when it was cocultured with LAB, which negatively impacted its ethanol production capacity. Furthermore, coculture experiments showed that the growth of LAB and acid release were delayed. These findings suggest that the limited growth of K. unispora was due to a shortage of monosaccharides provided by LAB to K. unispora. Despite limited growth, VOC analysis shows that the aroma in qymyz was mainly modulated by K. unispora.

Supplementary Materials

The following supporting information can be downloaded at https://www.mdpi.com/article/10.3390/fermentation9020101/s1: Table S1. Full VOC composition of qymyz samples (in µL·mL−1).

Author Contributions

Conceptualization, N.A. (Nawel Achir) and G.K.; methodology, N.A. (Nawel Achir), C.M., I.C., C.S. and J.G.; validation, C.M., N.A. (Nawel Achir) and G.K.; formal analysis, A.K., C.M. and N.A. (Nawel Achir); investigation, A.K., J.G., A.A., U.K. and W.G.; data curation, A.K., C.M., J.G. and N.A. (Nawel Achir); writing—original draft preparation, A.K.; writing—review and editing, A.K., N.A. (Nawel Achir), C.M., I.C., C.S. and G.K.; supervision, N.A. (Nawel Achir), C.M., I.C., C.S., J.G., N.A. (Nurlan Akhmetsadykov) and G.K. All authors have read and agreed to the published version of the manuscript.

Funding

This research was partly funded by the Ministry of Education and Science of the Republic of Kazakhstan (AP09563488).

Informed Consent Statement

Not applicable.

Data Availability Statement

The data presented in this study are available within the article and its Supplementary Materials.

Acknowledgments

The work was supported by the Abaï-Verne joint program of the Ministry of Education and Science of the Republic of Kazakhstan and the French Ministry for Europe and Foreign Affairs.

Conflicts of Interest

The authors declare no conflict of interest.

References

  1. Tang, H.; Ma, H.; Hou, Q.; Li, W.; Xu, H.; Liu, W.; Sun, Z.; Haobisi, H.; Menghe, B. Profiling of koumiss microbiota and organic acids and their effects on koumiss taste. BMC Microbiol. 2020, 20, 85. [Google Scholar] [CrossRef] [PubMed]
  2. ST RK 1004-98. Natural Koumiss. Committee for Standardization, Metrology and Certification of the Republic of Kazakhstan: Astana City, Kazakhstan, 1999.
  3. Kondybayev, A.; Loiseau, G.; Achir, N.; Mestres, C.; Konuspayeva, G. Fermented mare milk product (Qymyz, Koumiss). Int. Dairy J. 2021, 119, 105065. [Google Scholar] [CrossRef]
  4. McKellar, R.C.; Lu, X. Modeling Microbial Responses in Food; CRC Press: Boca Raton, FL, USA, 2003. [Google Scholar]
  5. Rosso, L.; Lobry, J.R.; Bajard, S.; Flandrois, J.P. Convenient Model To Describe the Combined Effects of Temperature and pH on Microbial Growth. Appl. Environ. Microbiol. 1995, 61, 610–616. [Google Scholar] [CrossRef] [PubMed] [Green Version]
  6. Munanga, B.D.J.C.; Loiseau, G.; Grabulos, J.; Mestres, C. Modeling Lactic Fermentation of Gowé Using Lactobacillus Starter Culture. Microorganisms 2016, 4, 44. [Google Scholar] [CrossRef] [PubMed] [Green Version]
  7. Cornu, M.; Billoir, E.; Bergis, H.; Beaufort, A.; Zuliani, V. Modeling microbial competition in food: Application to the behavior of Listeria monocytogenes and lactic acid flora in pork meat products. Food Microbiol. 2011, 28, 639–647. [Google Scholar] [CrossRef]
  8. Montanari, G.; Zambonelli, C.; Grazia, L.; Kamesheva, G.K.; Shigaeva, M.K. Saccharomyces unisporus as the principal alcoholic fermentation microorganism of traditional koumiss. J. Dairy Res. 1996, 63, 327–331. [Google Scholar] [CrossRef]
  9. Wood, B.J.; Holzapfel, W. The Genera of Lactic Acid Bacteria; Springer Science & Business Media: Berlin/Heidelberg, Germany, 1992; Volume 2. [Google Scholar]
  10. Hickey, M.W.; Hillier, A.J.; Jago, G.R. Transport and Metabolism of Lactose, Glucose, and Galactose in Homofermentative Lactobacilli. Appl. Environ. Microbiol. 1986, 51, 825–831. [Google Scholar] [CrossRef] [Green Version]
  11. Hutkins, R.W.; Ponne, C. Lactose uptake driven by galactose efflux in Streptococcus thermophilus: Evidence for a galactose-lactose antiporter. Appl. Environ. Microbiol. 1991, 57, 941–944. [Google Scholar] [CrossRef] [Green Version]
  12. Gadaga, T.H.; Mutukumira, A.N.; Narvhus, J.A. The growth and interaction of yeasts and lactic acid bacteria isolated from Zimbabwean naturally fermented milk in UHT milk. Int. J. Food Microbiol. 2001, 68, 21–32. [Google Scholar] [CrossRef]
  13. Mu, Z.; Yang, X.; Yuan, H. Detection and identification of wild yeast in Koumiss. Food Microbiol. 2012, 31, 301–308. [Google Scholar] [CrossRef]
  14. Meng, Y.; Chen, X.; Sun, Z.; Li, Y.; Chen, D.; Fang, S.; Chen, J. Exploring core microbiota responsible for the production of volatile flavor compounds during the traditional fermentation of Koumiss. LWT 2021, 135, 110049. [Google Scholar] [CrossRef]
  15. Kondybayev, A.; Konuspayeva, G.; Strub, C.; Loiseau, G.; Mestres, C.; Grabulos, J.; Manzano, M.; Akhmetsadykova, S.; Achir, N. Growth and Metabolism of Lacticaseibacillus casei and Lactobacillus kefiri Isolated from Qymyz, a Traditional Fermented Central Asian Beverage. Fermentation 2022, 8, 367. [Google Scholar] [CrossRef]
  16. Stiles, J.; Penkar, S.; Plocková, M.; Chumchalova, J.; Bullerman, L. Antifungal activity of sodium acetate and Lactobacillus rhamnosus. J. Food Prot. 2002, 65, 1188–1191. [Google Scholar] [CrossRef]
  17. Augustin, J.-C.; Rosso, L.; Carlier, V. Estimation of temperature dependent growth rate and lag time of Listeria monocytogenes by optical density measurements. J. Microbiol. Methods 1999, 38, 137–146. [Google Scholar] [CrossRef]
  18. Dan, T.; Chen, H.; Li, T.; Tian, J.; Ren, W.; Zhang, H.; Sun, T. Influence of Lactobacillus plantarum P-8 on fermented milk flavor and storage stability. Front. Microbiol. 2019, 9, 3133. [Google Scholar] [CrossRef]
  19. Delhalle, L.; Daube, G.; Adolphe, Y.; Crevecoeur, S.; Clinquart, A. Les modèles de croissance en microbiologie prévisionnelle pour la maitrise de la sécurité des aliments (synthèse bibliographique). Biotechnol. Agron. Soc. Environ. 2012, 16, 369–381. [Google Scholar]
  20. Zwietering, M.H.; Wijtzes, T.; Rombouts, F.M.; Riet, K. A decision support system for prediction of microbial spoilage in foods. J. Ind. Microbiol. 1993, 12, 324–329. [Google Scholar] [CrossRef]
  21. Rodrigues, C.I.S.; Wahl, A.; Gombert, A.K. Aerobic growth physiology of Saccharomyces cerevisiae on sucrose is strain-dependent. FEMS Yeast Res. 2021, 21, foab021. [Google Scholar] [CrossRef]
  22. Korcari, D.; Ricci, G.; Capusoni, C.; Fortina, M.G. Physiological performance of Kazachstania unispora in sourdough environments. World J. Microbiol. Biotechnol. 2021, 37, 88. [Google Scholar] [CrossRef]
  23. Bruder, S.; Reifenrath, M.; Thomik, T.; Boles, E.; Herzog, K. Parallelised online biomass monitoring in shake flasks enables efficient strain and carbon source dependent growth characterisation of Saccharomyces cerevisiae. Microb. Cell Factories 2016, 15, 127. [Google Scholar] [CrossRef] [Green Version]
  24. Canonico, L.; Zannini, E.; Ciani, M.; Comitini, F. Assessment of non-conventional yeasts with potential probiotic for protein-fortified craft beer production. LWT 2021, 145, 111361. [Google Scholar] [CrossRef]
  25. Korcari, D.; Secchiero, R.; Laureati, M.; Marti, A.; Cardone, G.; Rabitti, N.S.; Ricci, G.; Fortina, M.G. Technological properties, shelf life and consumer preference of spelt-based sourdough bread using novel, selected starter cultures. LWT 2021, 151, 112097. [Google Scholar] [CrossRef]
  26. Shigaeva, M.K.; Ospanova, M.S. Microflora of National Fermented Milk Drinks; Nauka: Alma-Ata, Kazakhstan, 1983. [Google Scholar]
  27. Dan, T.; Wang, D.; Wu, S.; Jin, R.; Ren, W.; Sun, T. Profiles of Volatile Flavor Compounds in Milk Fermented with Different Proportional Combinations of Lactobacillus delbrueckii subsp. bulgaricus and Streptococcus thermophilus. Molecules 2017, 22, 1633. [Google Scholar] [CrossRef] [PubMed] [Green Version]
  28. Kourkoutas, Y.; Bosnea, L.; Taboukos, S.; Baras, C.; Lambrou, D.; Kanellaki, M. Probiotic Cheese Production Using Lactobacillus casei Cells Immobilized on Fruit Pieces. J. Dairy Sci. 2006, 89, 1439–1451. [Google Scholar] [CrossRef]
  29. Tabit, F.T. Prevalence and growth characteristics of Bacillus sporothermodurans in UHT milk. Br. Food J. 2018, 120, 2250–2260. [Google Scholar] [CrossRef]
  30. Dickschat, J.S.; Wickel, S.; Bolten, C.J.; Nawrath, T.; Schulz, S.; Wittmann, C. Pyrazine Biosynthesis in Corynebacterium glutamicum. Eur. J. Org. Chem. 2010, 2010, 2687–2695. [Google Scholar] [CrossRef]
  31. Boonbumrung, S.; Tamura, H.; Mookdasanit, J.; Nakamoto, H.; Ishihara, M.; Yoshizawa, T.; Varanyanond, W. Characteristic aroma components of the volatile oil of yellow keaw mango fruits determined by limited odor unit method. Food Sci. Technol. Res. 2001, 7, 200–206. [Google Scholar] [CrossRef] [Green Version]
  32. Qian, M.; Reineccius, G. Quantification of aroma compounds in Parmigiano Reggiano cheese by a dynamic headspace gas chromatography-mass spectrometry technique and calculation of odor activity value. J. Dairy Sci. 2003, 86, 770–776. [Google Scholar] [CrossRef] [Green Version]
  33. Buttery, R.G.; Turnbaugh, J.G.; Ling, L.C. Contribution of volatiles to rice aroma. J. Agric. Food Chem. 1988, 36, 1006–1009. [Google Scholar] [CrossRef]
Figure 1. Growth in fermenter of Kazachstania unispora () in Sabouraud broth at 30 °C and pH 5.6. Experimental data (symbols) and predicted data from logistic growth model (continuous lines).
Fermentation 09 00101 g001
Figure 2. Effect of environmental factors (A) pH and (B) temperature on growth rate of K. unispora. Experimental data (symbols) and predicted data from CTP model (continuous lines).
Fermentation 09 00101 g002
Figure 3. Bioscreen growth curves of K. unispora in media containing 2% w/v of different carbohydrates.
Fermentation 09 00101 g003
Figure 4. Glucose consumption and ethanol production as a function of population during fermentation of K. unispora.
Fermentation 09 00101 g004
Figure 5. L. casei and K. unispora coculture (A,B), and L. kefiri and K. unispora coculture (C,D) with initial population of each strain of 105 CFU·mL−1 in modified MRS (■) and reconstituted mare milk (●). (A) Experimental L. casei population at 25 °C. (B) Experimental population of K. unispora at 25 °C. (C) Experimental L. kefiri population at 30 °C. (D) Experimental population of K. unispora at 30 °C. Lines represent theoretical monoculture growth in lactose (plain line) for LAB and in glucose (dotted lines) and lactose (plain line) for K. unispora.
Fermentation 09 00101 g005
Figure 6. K. unispora coculture with (A) L. casei at 25 °C and (B) L. kefiri at 30 °C, with initial populations of each strain of 105 CFU·mL−1.
Fermentation 09 00101 g006
Figure 7. Experimental metabolite production in K. unispora and LAB cocultures compared with individual LAB metabolite production models. (A) L. casei. (B) L. kefiri. CC—coculture.
Fermentation 09 00101 g007
Figure 8. Experimental lactose consumption in K. unispora and LAB cocultures compared with individual LAB lactose consumption models. (A) L. casei. (B) L. kefiri. CC—coculture.
Fermentation 09 00101 g008
Figure 9. (A) Relative composition of VOCs in mare milk samples fermented with individual L. kefiri (B2) and L. casei (B7) and their cocultures with K. unispora (Y1.5). (B) PCA by class of organic compound.
Fermentation 09 00101 g009
Figure 10. PCA by full VOC profiles: (A) F1–F2 PCA; (B) F1–F3 PCA.
Fermentation 09 00101 g010
Figure 11. Evolution of VOCs at 0, 19, 42.5, 114, and 138 h for (A) acids and (B) other compounds during L. casei–K. unispora coculture, and for (C) acids and (D) other compounds during L. kefiri–K. unispora coculture.
Fermentation 09 00101 g011aFermentation 09 00101 g011b
Table 1. Model parameters according to growth model, Monod equation, and Luedeking–Piret equation.
ParametersKazachstania unispora (Value ± SD)
pHmin2.56 ± 0.09
pHmax9.58 ± 030
pHopt4.81 ± 0.22
Tmin (°C)3.81 ± 3.33
Tmax (°C)35.70 ± 0.20
Topt (°C)30.16 ± 0.53
µopt (h−1)0.57 ± 0.02
Glucose µopt (h−1)0.45 ± 0.01
Glucose Ks (g·L−1)0.24 ± 0.03
Galactose µopt (h−1)0.45 ± 0.01
Galactose Ks (g·L−1)0.13 ± 0.04
Ethanol Production (10−8 mg·CFU−1)6.13 ± 0.27
Table 2. Odor threshold (OT) and odor activity value (OAV) for some VOCs that increased during coculture of K. unispora with LAB.
CompoundOT ppmL. kefiri–K. unisporaL. casei–K. unisporaReferences
OAV 0 hOAV 138 hOAV 0 hOAV 138 h
1-Butanol4.30.00320.06680.00220.0138[31]
Ethanol4.50.00310.17660.00250.0056[31]
2-Octenal, (E)-0.0030.65598.73220.757212.0579[18]
3,5-Octadien-2-one-
Ethyl Acetate3.20.13820.08480.09900.1186[31]
Acetic acid320.00000.07390.00000.0367[32]
Butanoic acid2.70.00174.08270.01370.8597[32]
Hexanoic acid270.00000.00870.00000.0104[32]
Nonanoic acid30.00140.01360.00060.0104[33]
Octanoic acid110.00040.10480.00060.0547[32]
Disclaimer/Publisher’s Note: The statements, opinions and data contained in all publications are solely those of the individual author(s) and contributor(s) and not of MDPI and/or the editor(s). MDPI and/or the editor(s) disclaim responsibility for any injury to people or property resulting from any ideas, methods, instructions or products referred to in the content.

