Article

Screening and Molecular Identification of Lactic Acid Bacteria Producing β-Glucan in Boza and Cider

by
Shatha A. Allaith
1,2,
Mohamed E. Abdel-aziz
2,
Zaid Akram Thabit
3,
Ammar B. Altemimi
4,5,
Khalid Abd El-Ghany
6,
Angelo Maria Giuffrè
7,*,
Alaa Jabbar Abd Al-Manhel
4,
Hanan S. Ebrahim
8,
Reda Mahgoub Mohamed
2 and
Tarek Gamal Abedelmaksoud
2,*
1
Field Crops Department, Faculty of Agriculture, Karbala University, Karbala 56001, Iraq
2
Food Science Department, Faculty of Agriculture, Cairo University, Giza 12613, Egypt
3
Biotechnology Research Center, Environmental Biotech Department, Al-Nahrain University, Baghdad 64074, Iraq
4
Department of Food Sciences, College of Agriculture, University of Basrah, Basrah 61004, Iraq
5
College of Medicine, University of Warith Al-Anbiyaa, Karbala 56001, Iraq
6
Microbiology Department, Egyptian Drug Authority, Cairo 12611, Egypt
7
Dipartimento di Agraria, Università degli Studi Mediterranea di Reggio Calabria, 89124 Reggio Calabria, Italy
8
Biotechnology Research Institute, National Research Centre (NRC), Cairo 12622, Egypt
*
Authors to whom correspondence should be addressed.
Fermentation 2022, 8(8), 350; https://doi.org/10.3390/fermentation8080350
Submission received: 1 July 2022 / Revised: 20 July 2022 / Accepted: 22 July 2022 / Published: 25 July 2022
(This article belongs to the Special Issue Evolution of Microbial Communities during Food Fermentation)

Abstract

:
The goal of this study was screening and molecular identification of Lactic Acid Bacteria (LAB) producing β-glucan from different species isolated from boza and cider compared to a standard strain for Lactobacillus rhamnosus NRRL 1937 (LGG). From 48 unknown isolates, four LAB strains were selected. Based on the NCBI database, their nomenclature was A3, B6, and C9 for Limosilactobacillus fermentum SH1, SH2, and SH3 along with D6 for Leuconostoc mesenteroides SH4. Also, their similarity values were 100%, 99.8%, 100%, and 100%, respectively. The potential of Exopolysaccharide (EPS) (as β-glucan) production for selected LAB strains by gtf gene, conventional PCR and gene expression using both LGG as a control and LAB 16S rRNA gene as a house-keeping gene was investigated. In addition, EPS (mg/100 mL), cell mass (mg/100 mL), pH, total carbohydrate%, total protein% and β-glucan% by the HPLC for all selected LAB isolates were studied. All results of genetic and chemical tests proved the superiority of B6 treatment for L. fermentum SH2. The results showed the superiority of B6 treatment in gtf gene expression (14.7230 ± 0.070-fold) followed by C9 and A3 treatments, which were 10.1730 ± 0.231-fold and 8.6139 ± 0.320-fold, respectively. while D6 treatment recorded the lowest value of gene expression (0.8566 ± 0.040-fold) compared to the control LGG (one-fold). The results also demonstrated that B6 treatment was superior to the other treatments in terms of EPS formation, with a value of 481 ± 1.00 mg/100 mL, followed by the C9 treatment at 440 ± 2.00 mg/100 mL, compared to the LGG (control) reaching 199.7 ± 3.51 mg/100 mL. Also, the highest % of quantitative and qualitative β-glucan in EPS was observed in B6 followed by C9, D6 and A3 which were 5.56 ± 0.01%, 4.46 ± 0.01%, 0.25 ± 0.008% and 0.12 ± 0.008%, respectively compared to control (0.31 ± 0.01%). Finally, the presented results indicate the importance of screening the local LAB isolates to obtain a superior strain for β-glucan production which will be introduced in a subsequent study under optimum conditions.

1. Introduction

Due to the bioactivity and health-promoting qualities of polysaccharides, notably beta-glucan (β-glucan), in recent years, the food industry has shown significant interest in incorporating polysaccharides derived from microbial sources into food items in recent years [1,2,3]. Lactic Acid Bacteria (LAB) create exopolysaccharides (EPS) as a protective matrix to endure all the challenges associated with fermentation processes, including pH, temperature, and osmotic stress, among others which allow LAB to survive [4]. Additionally, EPS also play a crucial role in biofilm formation, cell aggregation, and adherence to abiotic and biotic surfaces (i.e., intestinal mucosa). EPS regulate microbial life by enhancing bacterial colonization of technological or gastrointestinal microenvironments through stable cell recognition, microbes’ cooperation, and by functioning as a barrier against hazardous substances (i.e., antibiotics, toxic compounds), leading to increased bacterial survival [5]. β-glucan, comprises a group of β-d-glucose polysaccharides naturally occurring in the cell wall of cereals, bacteria and fungi, and have significantly different physicochemical properties depending on their source [3]. There are three structural classes of bacterial β-glucan including the linear glucan (curdlan) (1 3)-β-glucans, (1→3,1→6)-β-glucans with branched or cyclic structures and branched β-glucans with the side-chain (1→3,1→2) [6]. β-glucans are important bioactive molecules with biological actions such as prebiotic, anti-cancer, anti-inflammatory, and immune-modulating capabilities, and are thus used in the medical and cosmetic industries. Due to its unique physical qualities, such as water solubility, viscosity, and gelation, β-glucan is widely utilized in dairy products as a thickener, emulsifier, and improver of texture. On the other hand, and is mainly used in food products particularly bread not only to improve the rheological and sensory properties of the doughs and the resulting bread but also to improve their nutritional value [7,8].
LAB improve in improving the nutritional value of food with significant health benefits, such as reducing some infections, immunomodulatory effect, curbing some types of cancers, and restricting glucose serum levels. According to the U.S. Food and Drug Administration, many species of LAB and their metabolites are categorized as generally regarded as safe [9,10,11,12]. Traditional fermented foods of either animal or plant origins such as boza and cider play a crucial role in human health promotion because of the presence of different genera of LAB and Baker’s yeast. In addition, it is an important source of several vitamins (A, B, and E), organic acids (lactic acid, acidic acid) and ethanol alcohol with a sweet flavor. Boza is a traditional fermented beverage made using yeast, LAB, and many kinds of cereals, usually millet, cooked maize, wheat, or rice semolina/flour. Boza is a valuable fermented food that contributes to human nutrition due to its lactic acid, fat, protein, carbohydrate, and fiber contents [13]. Cider is classified as an alcoholic drink produced by fermented apple juice using yeast and LAB and has been used as medicine in several ancient cultures (i.e., ancient Egypt and ancient Mesopotamia) [14,15].
In previous studies, a number of fermented products such as pickled Chinese cabbage and its juice were produced by L. mesenteroides while L. fermentum was introduced to sourdough production. Moreover, many studies have indicated that some species of LAB were introduced into wine production but resulting in contamination of the final product. Thus, this caused a great economic loss due to their ability to produce EPS with high molecular weight such as β or α-glucans produced by L. fermentum, L. mesenteroides and L. acidophilus [16,17,18].
The easiest and most reliable method to identify the diversity of microbes is a molecular technique 16S rRNA sequencing, through which gtf gene can be used to detect and evaluate the LAB strains [19]. This technique is used to directly recognize the isolated bacterial colonies and related microorganisms by amplifying 16S rRNA using particular universal primers on both ends of the gene in preserved regions and by sequencing the PCR product known as amplicon [20].
In a recent study, phylogenetic analysis of 16S rRNA gene sequences was performed for the detection of bacteria P. parvulus ky425809, which was isolated from different food samples [3]. Due to high sequence similarities as in L. mesenteroides and L. pseudomesenteroides, the gene sequences of both species are nearly identical to 16S rRNA and differ in just 5 of 1483 nucleotides. Consequently, there is a limitation for the utilization of 16S rRNA gene sequence in identification, particularly in Leuconostoc ssp. Therefore, this method is not credible in differentiating Leuconostoc species and sub-species. This led to the use of housekeeping gene sequence analyses of Leuconostoc and Lactobacillus species isolated from different sugarcane industry unit operations [17,21].
For each heteropolysaccharide (HePS) and homopolysaccharide (HoPS), the production of 2-substitutions-(1,3)-β-D-glucan (β-D-glucan) is performed by glycosylotransferase (GTF). In general, the synthesis of HePS requires the use of multiple proteins which are encrypted with genes located within the operon, while HoPS secretion only requires a single protein [22]. The GTF gtf gene (which is responsible for synthesizing β-D-glucan) was detected in a number of LAB species, especially P. parvulus 2.6 strain, L. diolivorans G77, and O. oeni [23]. In this way, three LAB (L. suebicus CUPV221, P. parvulus CUPV1, and P. parvulus CUPV22) were identified and found to produce large quantities of two substituted (1,3)-β-D-glucans by gtf gene [24].
Kralj et al. [25] demonstrated the isolation and characterization of the glucans generated by six different Lactobacillus strains using the gtf genes and GTF enzymes. Lactobacillus species have the same diversity of gtf genes, GTF enzymes, and glucan as in Leuconostoc and Streptococcus species. This study aimed at β-glucan production in local LAB isolated from boza and cider which were identified by the 16S rRNA gene. The β-glucan production from the tested LAB isolates was confirmed by the conventional PCR, quantitative real-time polymerase chain reaction (qRT-PCR) using gtf gene, and HPLC analysis. Finally, only one isolate for polysaccharide production out of the four identified isolates will be introduced in a subsequent study.

2. Materials and Methods

2.1. Chemicals

Pepton water (Himedia®, Mumbai, India), MRS broth (Himedia®, Mumbai, India and BioLab®,Budapest, Hungary), Agar agar (Oxoid®, Basingstoke, UK), Ethanol 96% (Applichem®, Indonesia), Anaerogene kits (Thermofisher®, UK), Methylene blue (Sigma®, Denmark), QIAamp DNA mini kit (QIAGEN®, Düsseldorf, Germany), RNeasy Mini Kit (QIAGEN®, Düsseldorf, Germany), RNase-Free DNase Set (QIAGEN®, Düsseldorf, Germany), RNA protect Bacteria Reagent (QIAGEN®, Düsseldorf, Germany), Lysozyme (Applichem®, Indonesia), TE Buffer (Thermofisher®,UK), QuantiTect SYBR Green PCR kit (QIAGEN®, Düsseldorf, Germany), Revertaid first-strand cDNA synthesis kit (Thermofisher®,UK), Emerald AmpGT PCR mastermix (Takara®, Gothenburg, Sweden), Ladders (QIAGEN®, Düsseldorf, Germany), Agarose (ABgene®, Sweden), Ethidum bromide (ABgene®, Sweden), Tris buffer (Fluka®, London, UK), Boric acid (Fluka®, London, UK) and EDTA (Fluka®, London, UK), Tri-ammonium citrate 97% (SDFCL®, Chennai, India), Sodium hydroxide pellet (SDFCL®, Chennai, India), Glucose and Sucrose (Qualikems®, Vadodara, India), Yeast Extract (Qualikems®, Vadodara, India), Copper sulphate crystals (Fluka®, London, UK), Potassium sodium tartrate (Fluka®, London, UK), Phenol (Merck®, Darmstadt, Germany), Sulfuric acid 99% (Merck®, Darmstadt, Germany), β-glucan standard (Now®, USA) were used.

2.2. Collection and Preparation of Samples

Boza beverage (known as treatment A) was purchased from a local market in Giza, Egypt. It had been made locally by the traditional fermentation method. About 4 L of water is placed in a pot and heated. Before the water boils, 500 g of sugar is added to it and stirred well, then 2 kg of wheat flour and 11 g of dried yeast (Baker’s yeast, Pakmaya, Izmit, Turkey, known for Saccharomyces cerevisiae) is added. Sometime fermented pieces of bread are added as a starter to the mixture to increase the efficiency of the fermentation process, (the bread is prepared by moistening the pieces with water and leaving them in a warm place for at least 12 h).
After the pieces of fermented bread are added to the mixture, it is continuously stirred and boiled. Boiling is terminated when a homogenous pulp is formed, which takes between 1–2 h depending on the raw material and boiling temperature. After cooling, the mixture is beaten with a mixer for 5 min then poured into the sterilized bottles and left for 3–24 h or more at room temperature until it tastes slightly acidic, with a sweet flavor. Sometime a little yeast is added to give a light alcoholic taste.
However, since cider was unavailable at local markets, we made it from apple juice, using the traditional and official method with some modifications as described by Duenas et al. [14] and Valles et al. [26]. Two kg of unwashed apples (Malus domestica) from a local market in Giza, Egypt, cut into small cubes of equal size, 300 g of sugar, one spoonful (8 g) of dried yeast (Pakmaya, Izmit, Turkey, known for Saccharomyces cerevisiae), and 4 L (l) of water were prepared for cider production. Later, the cubed apple was divided into two groups. The first group (Unfermented cider (D), of about 1 kg of apple, was mixed with 2 L of water by a mixer without sugar and yeast, and then poured into a bottle and sealed. In the second group, about 1 kg of apple was mixed with water, sugar, and yeast by a mixer then poured into a bottle and sealed too. In both cases, a hole was made in the bottle cap to allow the gas produced (CO2) from the fermentation process to escape by placing a plastic tube in the hole in the cap and transferring it to another container containing water. The fermentation process was conducted at room temperature for 3 days. The end of fermentation was inferred by the disappearance of gas bubbles for both treatments. After this, the juice was filtered from the remnants of the apple and poured into another bottle and sealed tightly to complete the aging process for 3 months. The second group was divided into two treatments, treatment B (fermented cider with fridge) was stored in the refrigerator, and treatment C (fermented cider stored in an ambient temperature) was stored at room temperature. All treatments above (A, B, C, and D) were collected and prepared from October to December 2020 and stored under the above-mentioned conditions for further utilization.

2.3. Bacterial Isolation, Purification, and Growth Conditions

As shown in Table S1, forty-eight unknown LAB isolates that were divided into twelve isolates for each treatment (A, B, C, D) were detected by the decimal dilution method. Each sample (25 mL) was mixed with 225 mL of sterilized peptone water (0.1%) and then mixed before serial dilution of the treatments. At a final dilution of 10−2, 1 mL was added to the selective media MRS Agar by pour plate method to isolate LAB, then incubated under anaerobic conditions using an anaerobic jar at 37 °C for 48–72 h. The purification steps to obtain a pure culture were conducted by taking up one pure colony from mixed culture on MRS agar using the streaking technique and then incubating it under the same incubation conditions above. After incubation, each pure isolate was stained with methylene blue, and microscopic examination was performed as a complementary step to confirm the purity of all isolates which were purified depending on their culture morphology (viscous isolates) and microscopically (cocci or bacilli). This step was repeated more than once for each isolate until only one pure colony was obtained for each one. Lastly, the plate of pure culture for the 48 unknown LAB isolates was stored at 4 °C for further analysis.

2.4. Genomic DNA Extraction

The genomic DNA of bacterial samples was extracted using a QIAamp DNA micro kit following manufacturers protocol.

2.5. Amplification of 16S rRNA and gtf Genes

The 16S rRNA and gtf gene fragments were amplified using a PCR thermal cycler (Thermoblock, Biometra, Berlin, Germany). The reaction mixture consisted of 12.5 μL of Emerald Amp GT PCR master mix (2× premix), 4.5 μL PCR grade water, 1 μL of each primer (20 pmol), and 6 μL template DNA, making a total volume of 25 μL. Two primers were used to identify the LAB, the first being universal primers, which were designed for 16S rRNA F27 (5′-AGAGTTTGATCMTGGCTCAG-3′), and R1492 (5′-TACGGYTACCTTGTTACGACTT-3′) as described by Lagacé et al. [27]. DNA product (1485 bp) was amplified under PCR conditions, which were 94 °C for 5 min (an initial denaturation), followed by 35 cycles of 94 °C for 30 s, 56 °C for 1 min (annealing), 72 °C for 1 min (extension) and 72 °C for 10 min (final extension). The second pair of primers were used to detect glucan synthase (gtf) F (5′-ACACGCAGGGCGTTATTTTG-3′), and R (5′-GCCACCTTCAACGCTTCGTA-3′), as described by Turpin et al. [28]. Also, DNA product (374 bp) was amplified under PCR conditions, which were the same as above conditions except for 58 °C for 40 s (annealing) and 72 °C for 45 s (extension). Amplicons were electrophoresed and visualized using 1% agarose gel, and the 100 bp DNA ladder [29].

2.6. Sequencing of Amplicon (16S rRNA Product) and Alignment

According to manufacturer’s protocol, amplicon sequencing was conducted using the Big Dye Terminator V3.1 cycle sequencing kit. The Applied Biosystems® 3130 automated DNA Sequencer (ABI, 3130, Foster, USA) was used to sequence a purified amplicon in both directions. FinchTV v.1.4.0 was used to examine the sequences up to 1485 bp (Geospiza, Waltham, UK).

2.7. Blast N and Phylogenetic Tree Analysis

Each 1485 bp amplicon was BLAST® analyzed and aligned with the National Center for Biotechnology Information (NCBI) Sequence comparison database (www.ncbi.nlm.nih.gov, accessed on 18 July 2022) [30] to determine the sequence identity and GenBank accession number [31]. The CLUSTAL W multiple sequence alignment program, the MegAlign module of Lasergene software version 12.1 of package DNASTAR Pairwise (Madison, WI, USA) was used to compare the sequences designed by Thompson et al. [32]. Phylogenetic analysis was done using maximum likelihood in MEGA6 [33].

2.8. Gene Expression

2.8.1. RNA Extraction

Four LAB isolates (A3, B6, C9, D6) and L. rhamnosus NRRL 1937 (LGG as a control) (NRRL, North Regional Research Laboratories, Peoria, IL, USA) were grown in 5 mL of MRS broth and were incubated anaerobically at 37 °C for 48 h. Total bacterial RNA was extracted from five strains using the RNeasy Mini Kit according to the manufacturer’s instructions. All RNA samples were processed with RNase-free DNase to exclude any residual DNA contamination.

2.8.2. Quantitative Real-Time Polymerase Chain Reaction (qRT-PCR) for the gtf Gene Using LAB 16S rRNA as a Housekeeping Gene

Quantitative real-time PCR (Agilent MX3005P Santa System real time PCR, Clara, CA, USA) was performed using the QuantiTect SYBR Green PCR kit to examine the effect of Lactobacillus sp. on the expression levels of the target genes (glucan synthase gtf gene), and LAB 16S rRNA (housekeeping gene) was selected as the control based on results of Kim et al. [34]. The primers used for amplification of lactic acid bacteria were 16S rRNA F (5′-TCCGGATTTATTGGGCGTAAAGCGA-3′), R (5′-TCGAATTAAACCACATGCTCCA-3′), as described by Kim et al. [33], and glucan synthase gtf F (5′-ACACGCAGGGCGTTATTTTG-3′), R (5′-GCCACCTTCAACGCTTCGTA-3′), as described by Turpin et al. [28].
All the reaction mixtures (25 μL) were performed using three replicates and each mixture contained 12.5 μL 2× QuantiTect SYBR Green PCR Master Mix, 0.25 μL Reverse transcriptase (the cDNA was synthesized using Revertaid first-strand cDNA synthesis kit, 0.5 μL Forward primer (20 pmol), 0.5 μL Forward primer (20 pmol), 8.25 μL RNase Free Water, and 3 μL Template RNA.
The cycling conditions of SYBR Green real-time PCR for each target gene were 50 °C, 30 min for reverse transcription; 94 °C, 15 min for primary denaturation and then 40 cycles of secondary denaturation at 94 °C, 15 s. Annealing step at 58–60 °C (depending on primers used) for 40 s, then the extension and fluorescent data collection at 72 °C, 40 s were done.
Finally, one cycle of a dissociation curve was generated at the end of each reaction with secondary denaturation at 94 °C for 1 min. Then annealing at 58–60 °C (depending on primers used) for 1 min was conducted and the final denaturation was conducted at 94 °C for 1 min. The data were analysed using amplification curves and Ct values of the Stratagene MX3005P softwareversion 1.8, Clara, CA, USA). To estimate the variation of gene expression on the RNA of the different samples which were expressed as the fold change in expression levels of genes, the CT of each sample was compared with that of the control group according to the “ΔΔCt” method stated by Yuan et al. [35]. Dissociation curves were compared between different samples to exclude false-positive results.
Whereas
ΔΔCt = ΔCt reference − ΔCt target
ΔCt target = Ct control − Ct treatment
and
ΔCt reference = Ct control − Ct treatment

2.9. The Screening Four LAB Isolates Using L. rhamnosus NRRL 1937 (LGG) as a Control to Produce β-Glucan

Four LAB isolates (A3, B6, C9, D6) and L. rhamnosus NRRL 1937 (LGG as a control) (NRRL, North Regional Research Laboratories, Peoria, IL, USA) were grown in a semi-defined medium (SDM) to produce EPS as a β-glucans. To prepare the inoculum 10% (v/v), all isolates were grown and suspended in MRS broth at 37 °C for 48 h. After incubation, the cell concentration turbidity for all isolates reached 1.5 × 10⁸ CFU/mL using the McFarland turbidity standard. SDM was carried out in flasks (300 mL) containing 100 mL distilled water, 0.5% yeast extract, 1.0% peptone, 0.2% ammonium citrate, 2.0% sucrose, the pH was fixed to be 7 before sterilization after that all flasks was sterilized at 121 °C for 15 min, 15 psi.
Under sterile conditions, the inoculum was added to the flasks and incubated in a rotary shaker (Innova-shaker, Thomas Scientific, Swedesboro, NJ, USA) at 30 °C, 130 rpm, and 48 h. After fermentation, the bacteria were centrifuged (Centrifugation, Thermo, Swedesboro, NJ, USA) (12,000× g, 20 min, 4 °C) the cell pellets were oven-dried at 60 °C for three days. The supernatant was precipitated by adding the two volumes of cold acetone (96%) at 4 °C overnight to precipitate the EPS as (β-glucans) then the precipitate was collected by centrifugation (10,000× g, 10 min, 4 °C). EPS was dissolved and dialyzed in distilled water using 12–14 KDa (MWCO membranes, USA) with a daily change of water for three days, at 4 °C. The solution of EPS was freeze-dried (CHRIST alpha 1–4 LSC plus, Osterode am Harz, Germany), weight was calculated as mg/100 mL and it was stored in a desiccator at room temperature [36,37].

2.10. Total Carbohydrate and Protein Analysis

The total carbohydrate content of the EPS was determined using the phenol sulphuric acid method, with glucose serving as a standard [38]. Total protein content was determined using the Folin Lowry method and bovine serum albumin as a standard Classics [39].

2.11. Determination of β-Glucans Extracted from LAB Isolates by HPLC

HPLC analysis was performed on partially purified EPS produced by LAB strains to determine β-glucans quantitatively and qualitatively by HPLC (The Waters Alliance 2695 Separations Module) using column Benson polymeric Bp100 Ca, Waters 2410 HPLC Refractive Index Detector with a mobile phase of DI H2O, the flow rate of 0.4 mL/min, column temperature 85 °C, sample size 20 µI (30 mg/mL), and column size 100 × 7.8 mm.

2.12. Statistical Analysis

Experimental results were analyzed using analysis of variance (ANOVA) XLSTAT software version 2014, 5.03 (Addinsoft, New York, NY, USA) in three repeats and expressed as the mean ± standard error of the mean. The significance of differences between samples means were calculated at p-value ≤ 0.05 was considered significant.

3. Results and Discussions

Regardless of the different storage conditions of the boza (A), and cider (B, C, D) treatments, the type of microbes that produced a sticky appearance on the culture medium remained consistent. Out of forty-eight isolates, only four had a viscous appearance on the solid medium. This is due to many factors including the three-month aging period, the presence of yeast in most treatments, and alcohol. Many studies backed up our findings by isolating only mucoid colonies and showing how storage and production conditions affect the types of microbes that make polysaccharides appear a viscous [14,16].

3.1. Isolation and Purification of Lactic Acid Bacteria (LAB)

The presented data in Table S1 show 48 isolates of LAB, which were collected from boza and cider, including four identified isolates (A3, B6, C9, D6). which were purified depending on their culture morphology (viscous isolates) and microscopically (cocci or bacilli) by staining with methylene blue (Figure S1). The viscous isolates were chosen to be used in the production of EPS (β-glucan) later. It should be mentioned that unfermented cider (D)was not split into two parts like fermented cider because most EPS are produced by LAB at room temperature. In addition, the proliferation of the microflora present is naturally influenced by the temperature during the storage, particularly that producing EPS. In this regard, Abd El Ghany et al. [16] agree with our results, which reported that the purification of bacteria was based on their mucous appearance.

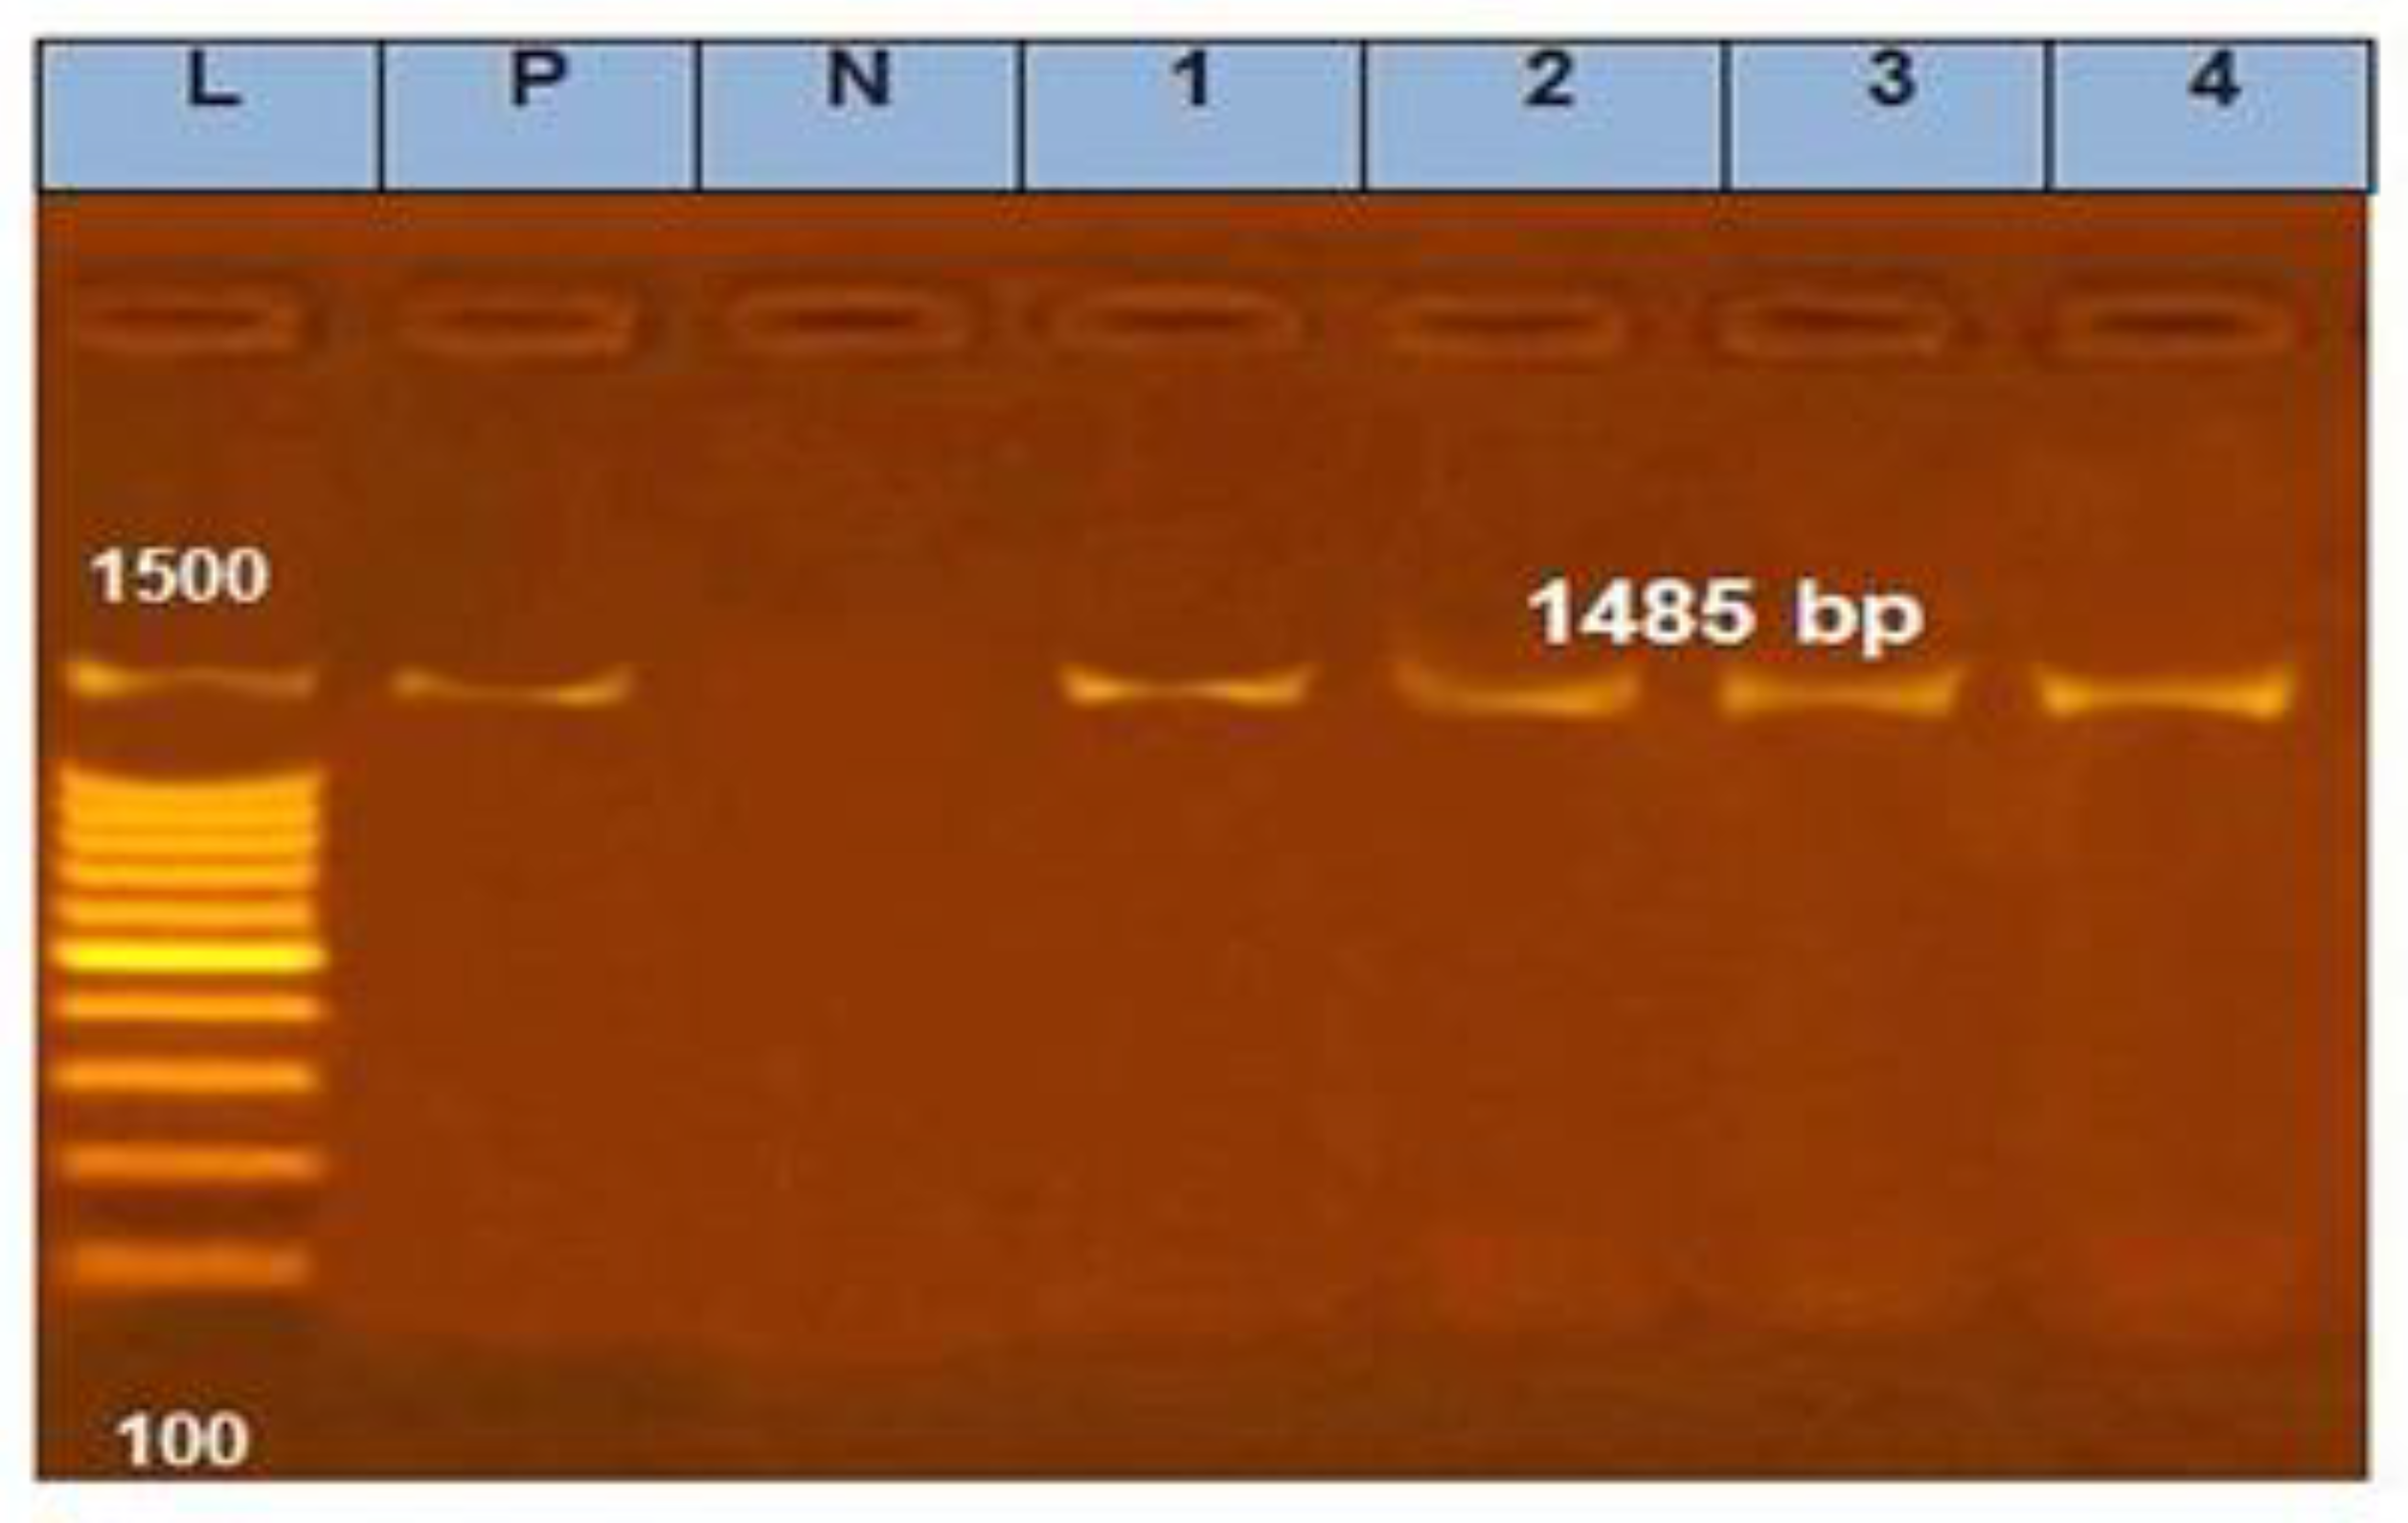
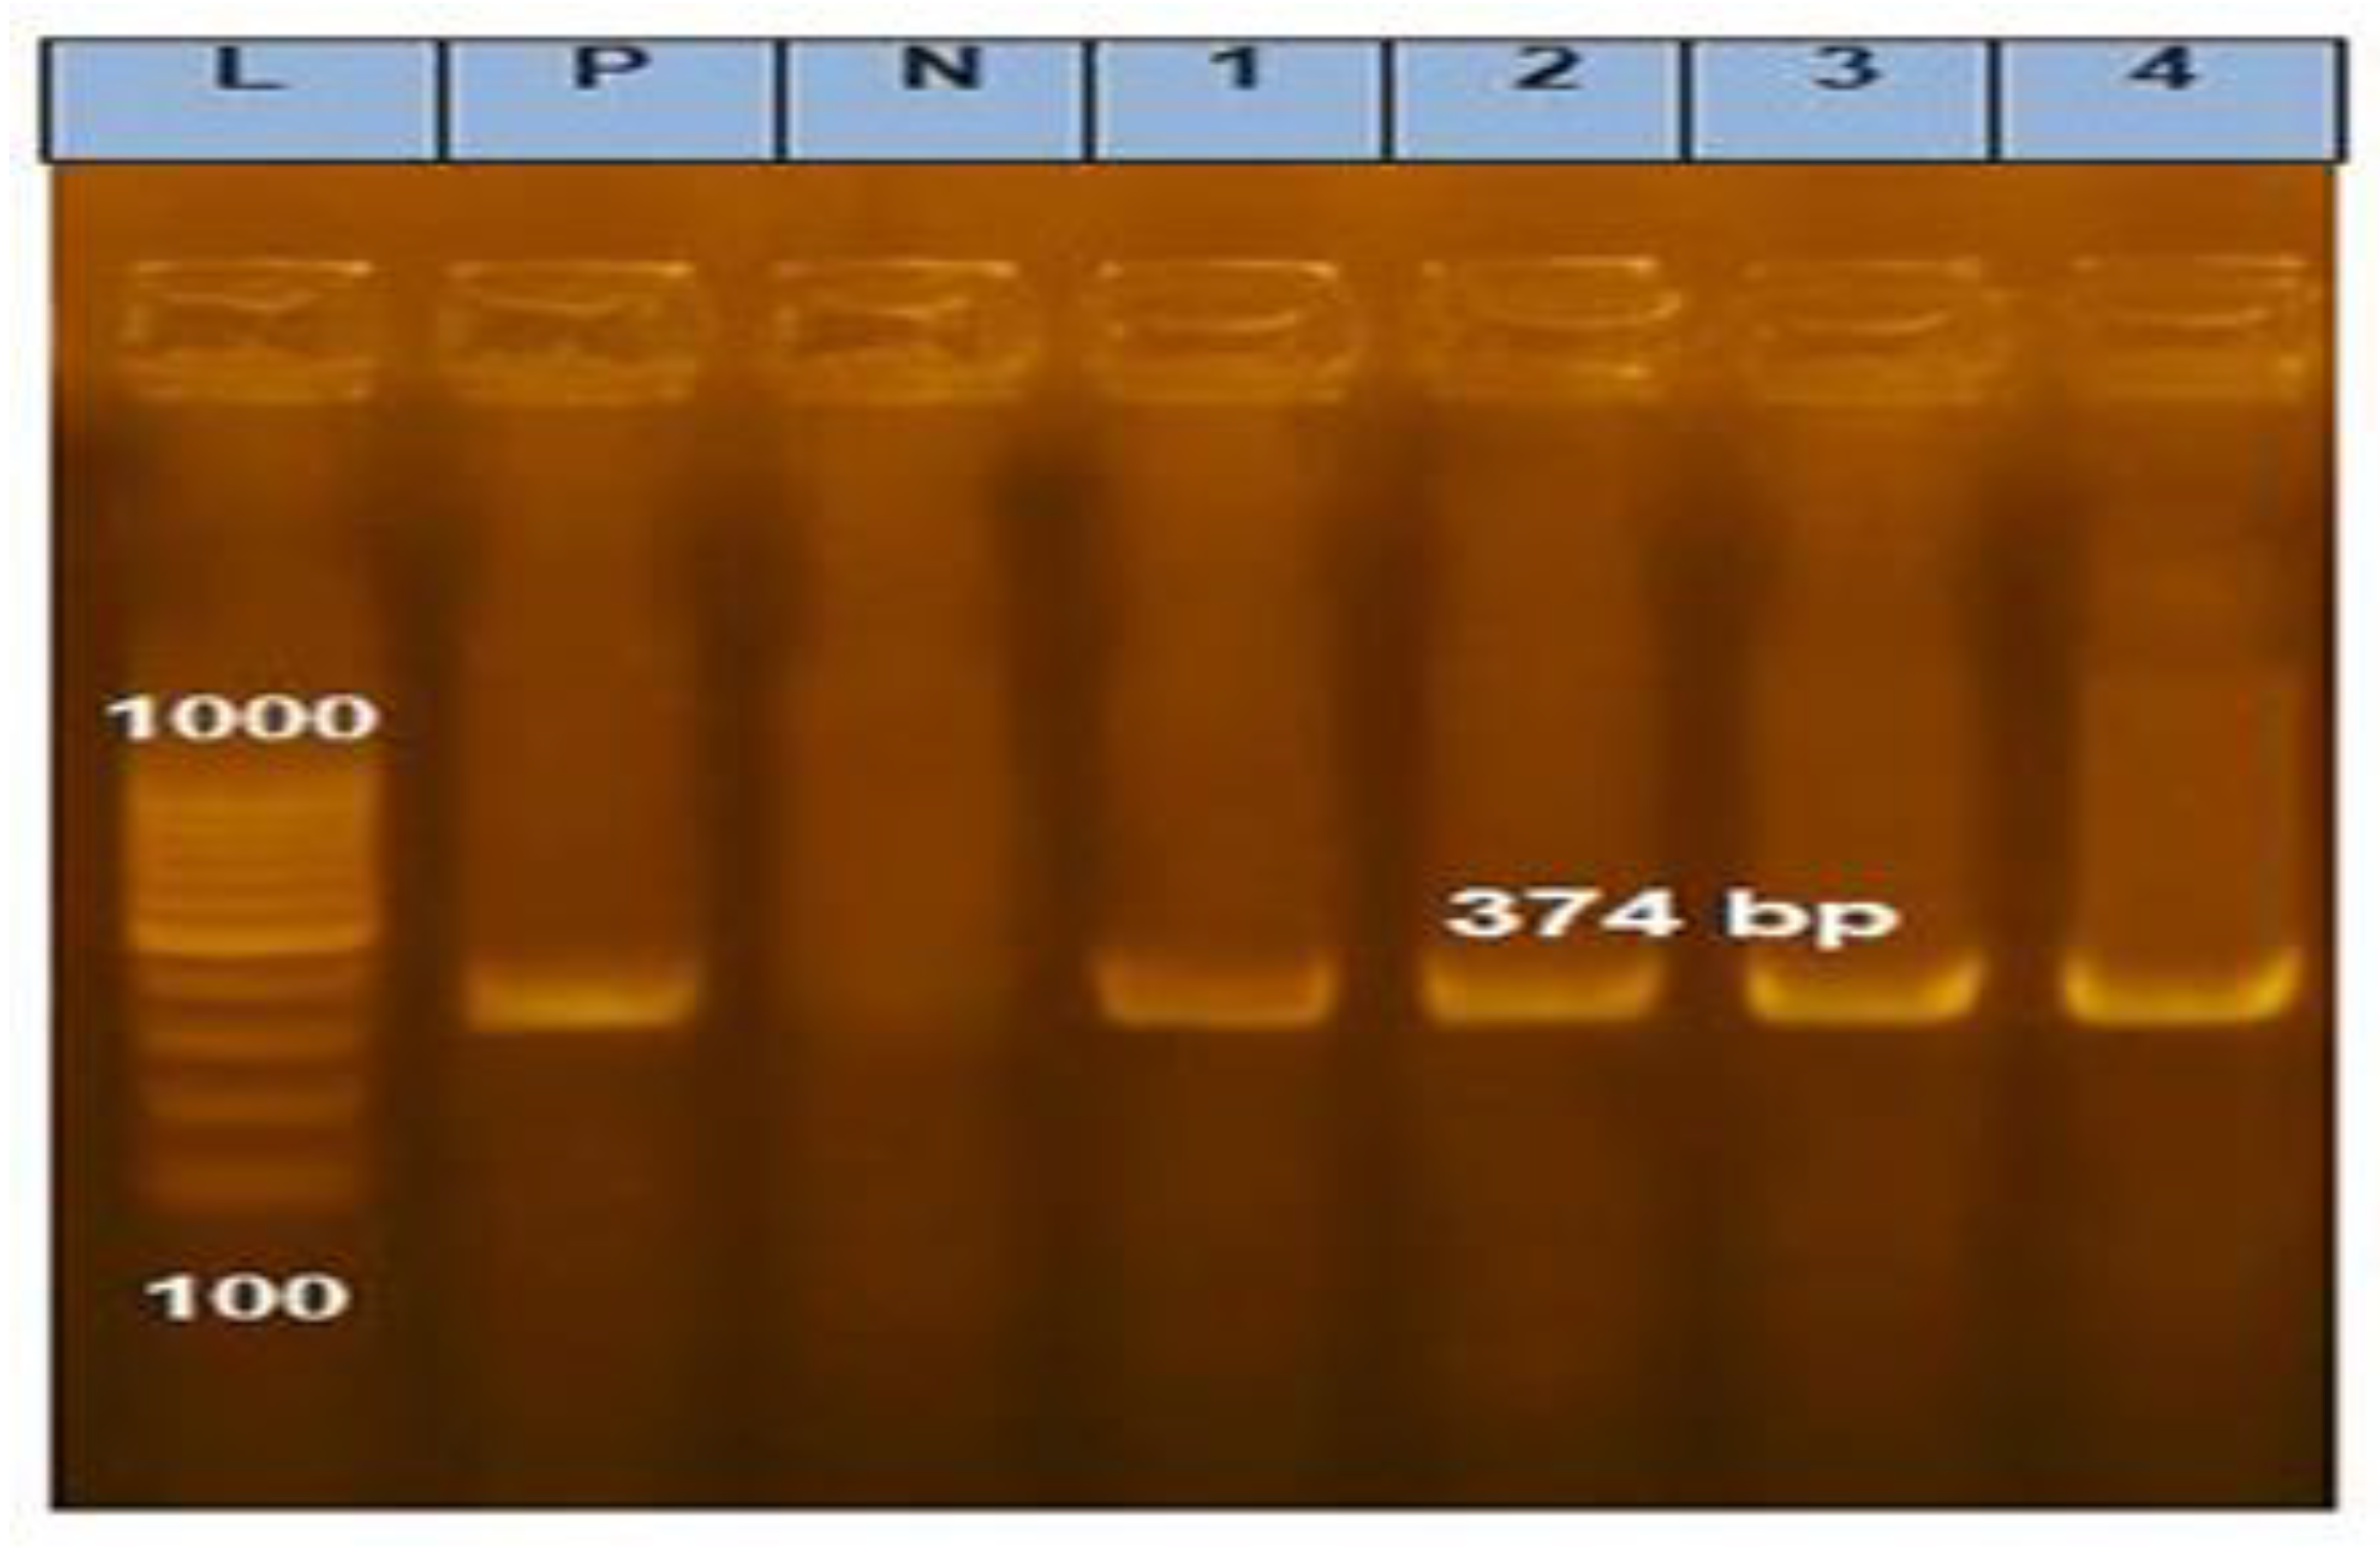
3.2. Amplification of 16S rRNA and gtf Gene for Selected LAB Isolates

Four 16S rRNA amplicons of isolated LAB (A3, B6, C9, and D6) were successfully amplified and designated with codes 1, 2, 3, and 4, respectively. Furthermore, the band size of four isolated treatments was 1485 bp, comparable with ladder (L) 1500 bp as shown in Figure 1. Our results are in accordance with the study by Allaith [40]. Balcázar et al. [41] who reported that a variety of bacteria were diagnosed with variable region fragments such as V1 and V2 (272-bp) within 16S rRNA. On the other hand, Stackebrandt et al. [42] reported that all Lactobacillus species were categorized by 16S rRNA and studied the relationship between them. In our opinion, all the above studies prove the crucial role of 16S rRNA in categorizing and identifying both Gram-positive and negative bacteria due to its conserved and universal character. Moreover, at the taxonomic strain level, bacteria could be identified by whole 16S rRNA sequencing.
In addition, DNA of four LAB strains were subjected to screening and detection for β-glucan production using gtf gene (the gene encoding of β-glucan) as shown in Figure 2 and Figure S2. The band size of all treatments was 374 bp compared to the Marker (L) 100 bp. In this regard, Goh et al. [43] detected the gtf gene in L. fermentum to be (5.11). Also, the isolation of this gene by coding for glycosyltransferase and its production of β-glucan was investigated.
Llamas-Arriba et al. [44] also found the gtf gene encoded for glycosyltransferase (GTF) in P. ethanolidurans CUPV141. Kralj et al. [25] observed the Lactobacillus species and strains have gtf genes, GTF enzymes that can create different types of glucan. For example, Streptococcus and Leuconostoc can create α-glucan such as dextran, alternan and mutan. While L. reuteri 121, also created glucan (reuteran) by gtfA gene encoding GTF enzyme that responsible for forming the main linkages α-(1→4) and α-(1→6), collectively.

3.3. Sequencing of Amplicon (16S rRNA Product) and Alignment for Selected LAB Isolates

Based on the 16S rRNA analyses, GenBank alignment, and MEGA6.0 software (Auckland, New Zealand), the phylogenetic tree by the maximum likelihood method was constructed for four LAB strains and were categorized as members of the genera Limosilactobacillus and Leuconostoc (Figure 3). The results reported that three of them belong to the species L. fermentum, and the last one belongs to L. mesenteroides and their identification numbers were MW897961, MW897962, MW897963, and MW897983, respectively.
The 16S rRNA gene gives an idea about the accurate diagnosis of bacteria types. In this regard, Allaith [39], Balcázar et al. [41], and Stackebrandt et al. [42] reported the accurate detection of beneficial and pathogenic bacteria by the 16S rRNA gene. In addition, Figure 3 shows the tree consisted of two clusters lacking a common ancestor. Cluster 1 is divided into two groups as follows group 1 includes L. fermentum and L. plantarum and group 2 includes Pediococcus species. On the other hand, Cluster 2 has just one group including L. mesenteroides.
In cluster 1, the results showed that the relationship of SH1 (MW897961) and SH3 (MW897963) was closer to each other, when compared to SH2 (MW897962). On the other hand, despite SH4 (MW896983) as one of the group paraphyletic in cluster 2 being branched of the ancestor (cluster 1) it was far from L. fermentum strains.
Based on the findings of Nel et al. [17] using the phylogenetic relationships of the 16S rRNA gene sequence for diagnosis has limitations, particularly in Leuconostoc ssp., because it could not distinguish between species and sub-species. The 16S rRNA sequence scrutiny has a very significant role in studying the relationships among genera of LAB and their effectiveness in environmental diversity.
The outcomes of our study are in accordance with the study of Tajabadi et al. [45] who found the diversity of LAB isolated from bee’s stomach, especially L. dominant strains were among genera that were studied using a phylogenetic tree based on the likelihood relationships. Also, Humblot and Guyot [46] reported that microbial characterization of Lactobacilli and Leuconostoc isolated from fermented Pearl Millet Slurries were identified using pyrosequencing of tagged 16S rRNA gene amplicons and phylogenetic tree analysis. Stackebrandt et al. [42] indicated that a phylogenetically coherent group for L. fermentum and L. mesenteroides using the phylogenetic tree that gave deep taxonomy of each genus, as well as the diversity of different genera because of the difference in the proportion of nitrogen base in variable regions of 16S rRNA.

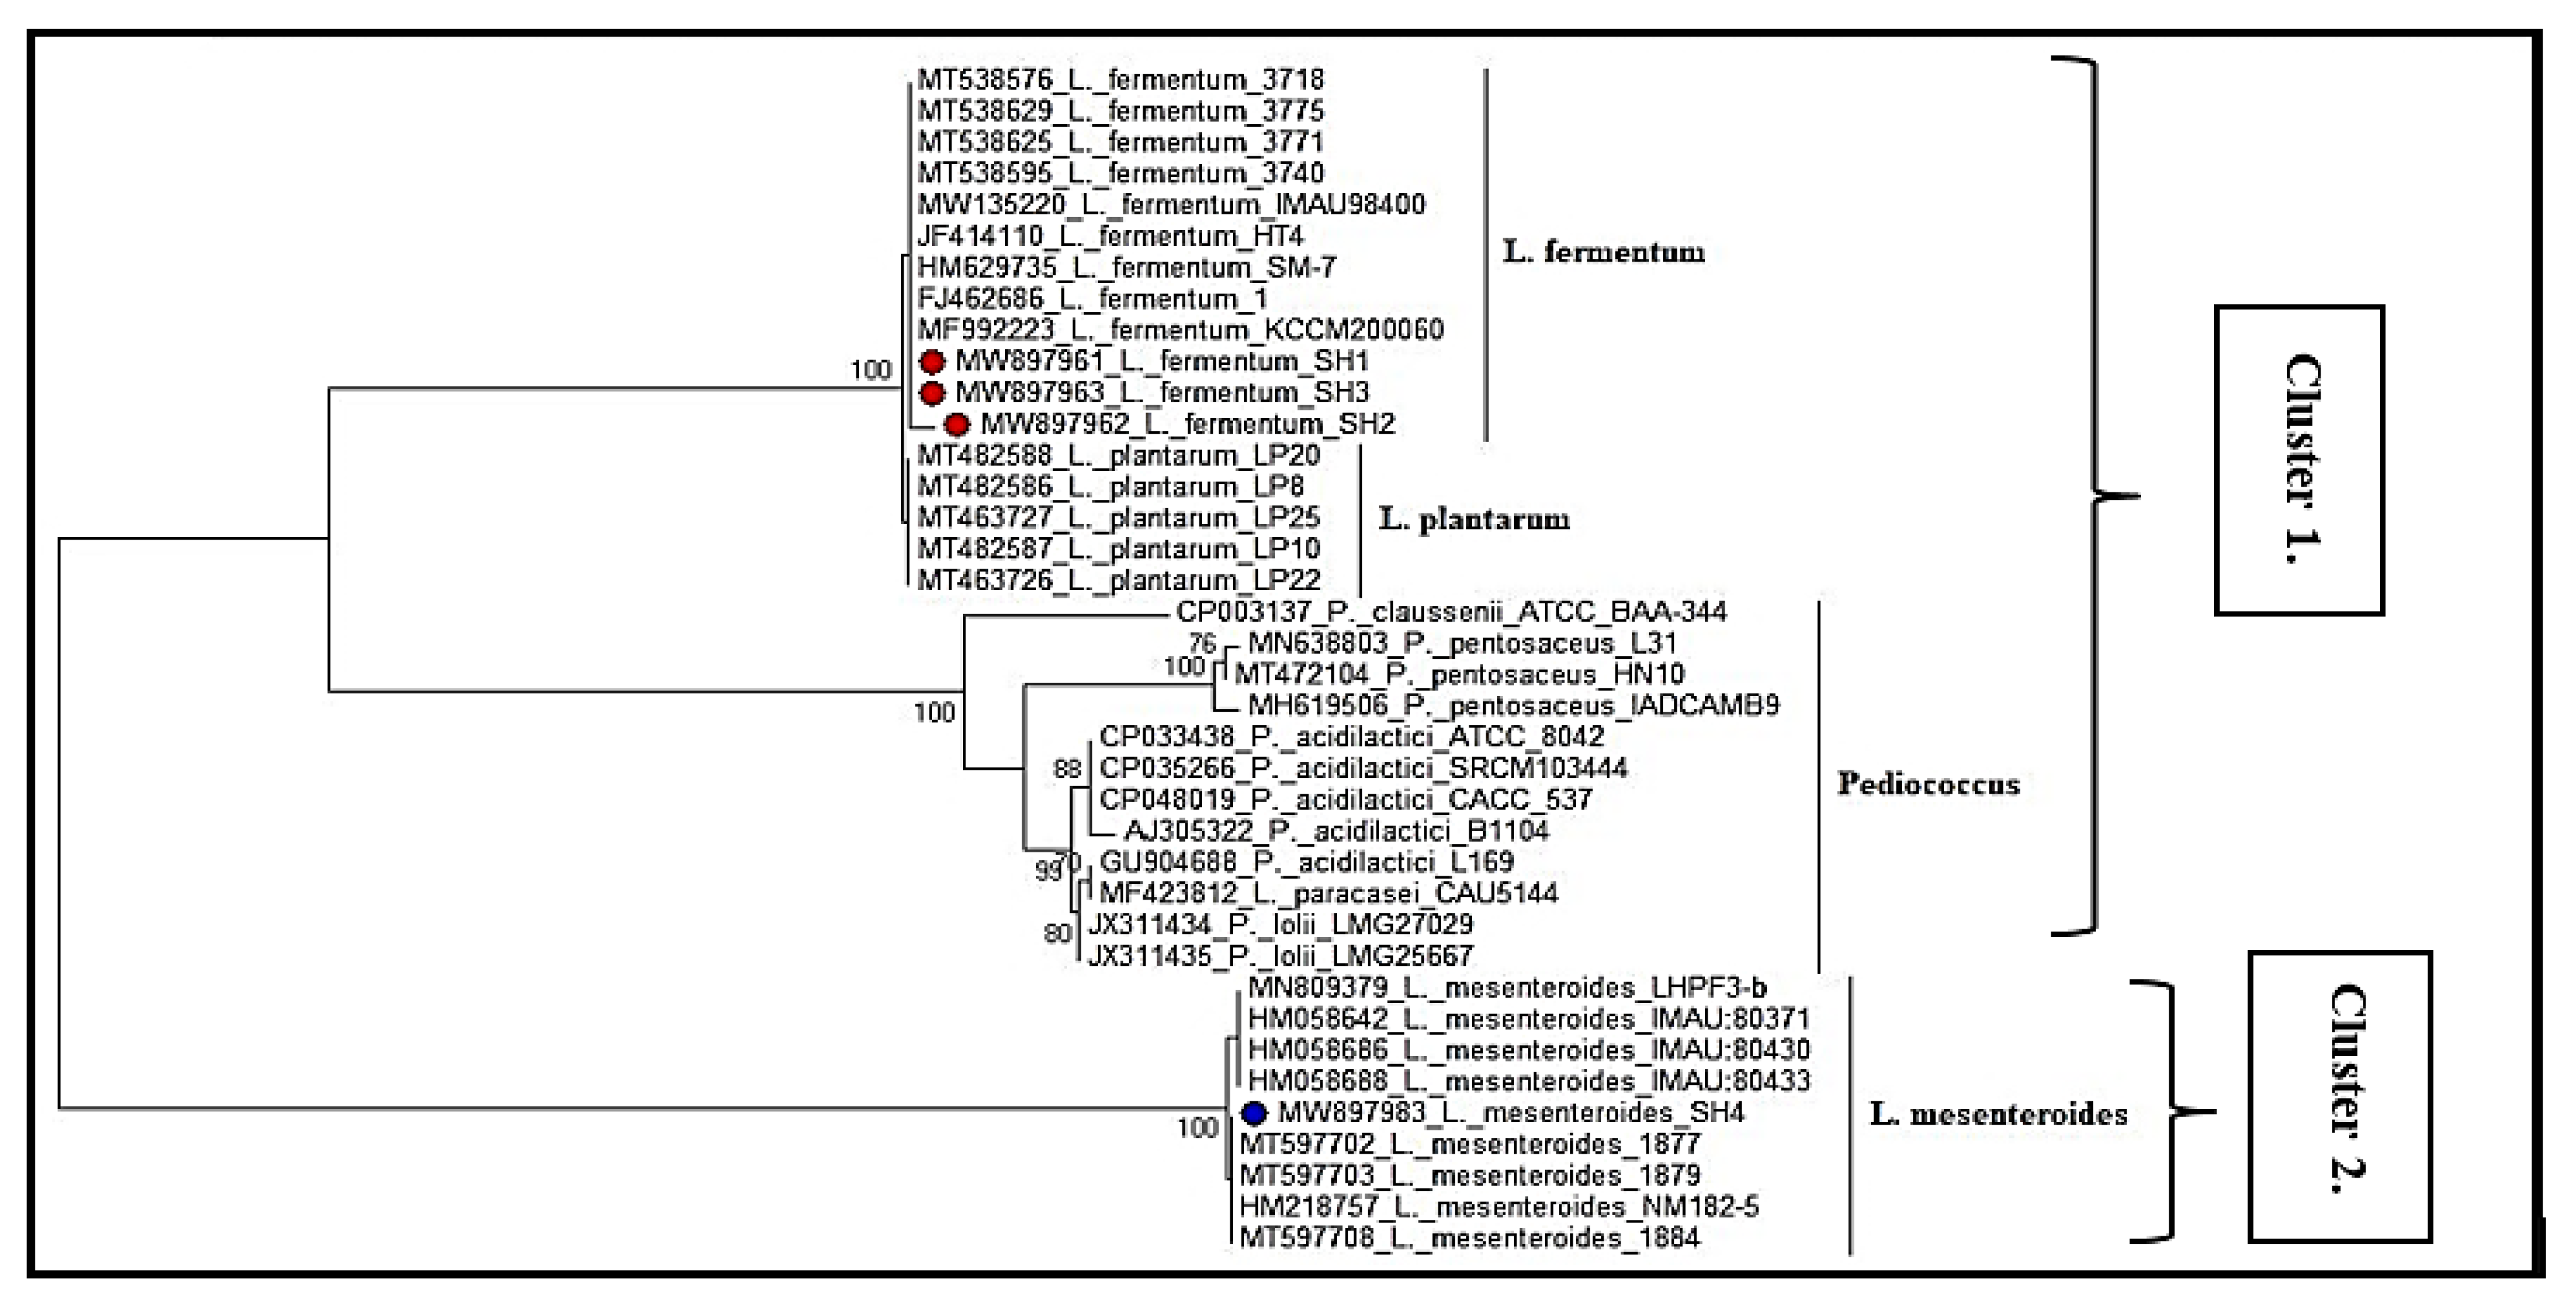
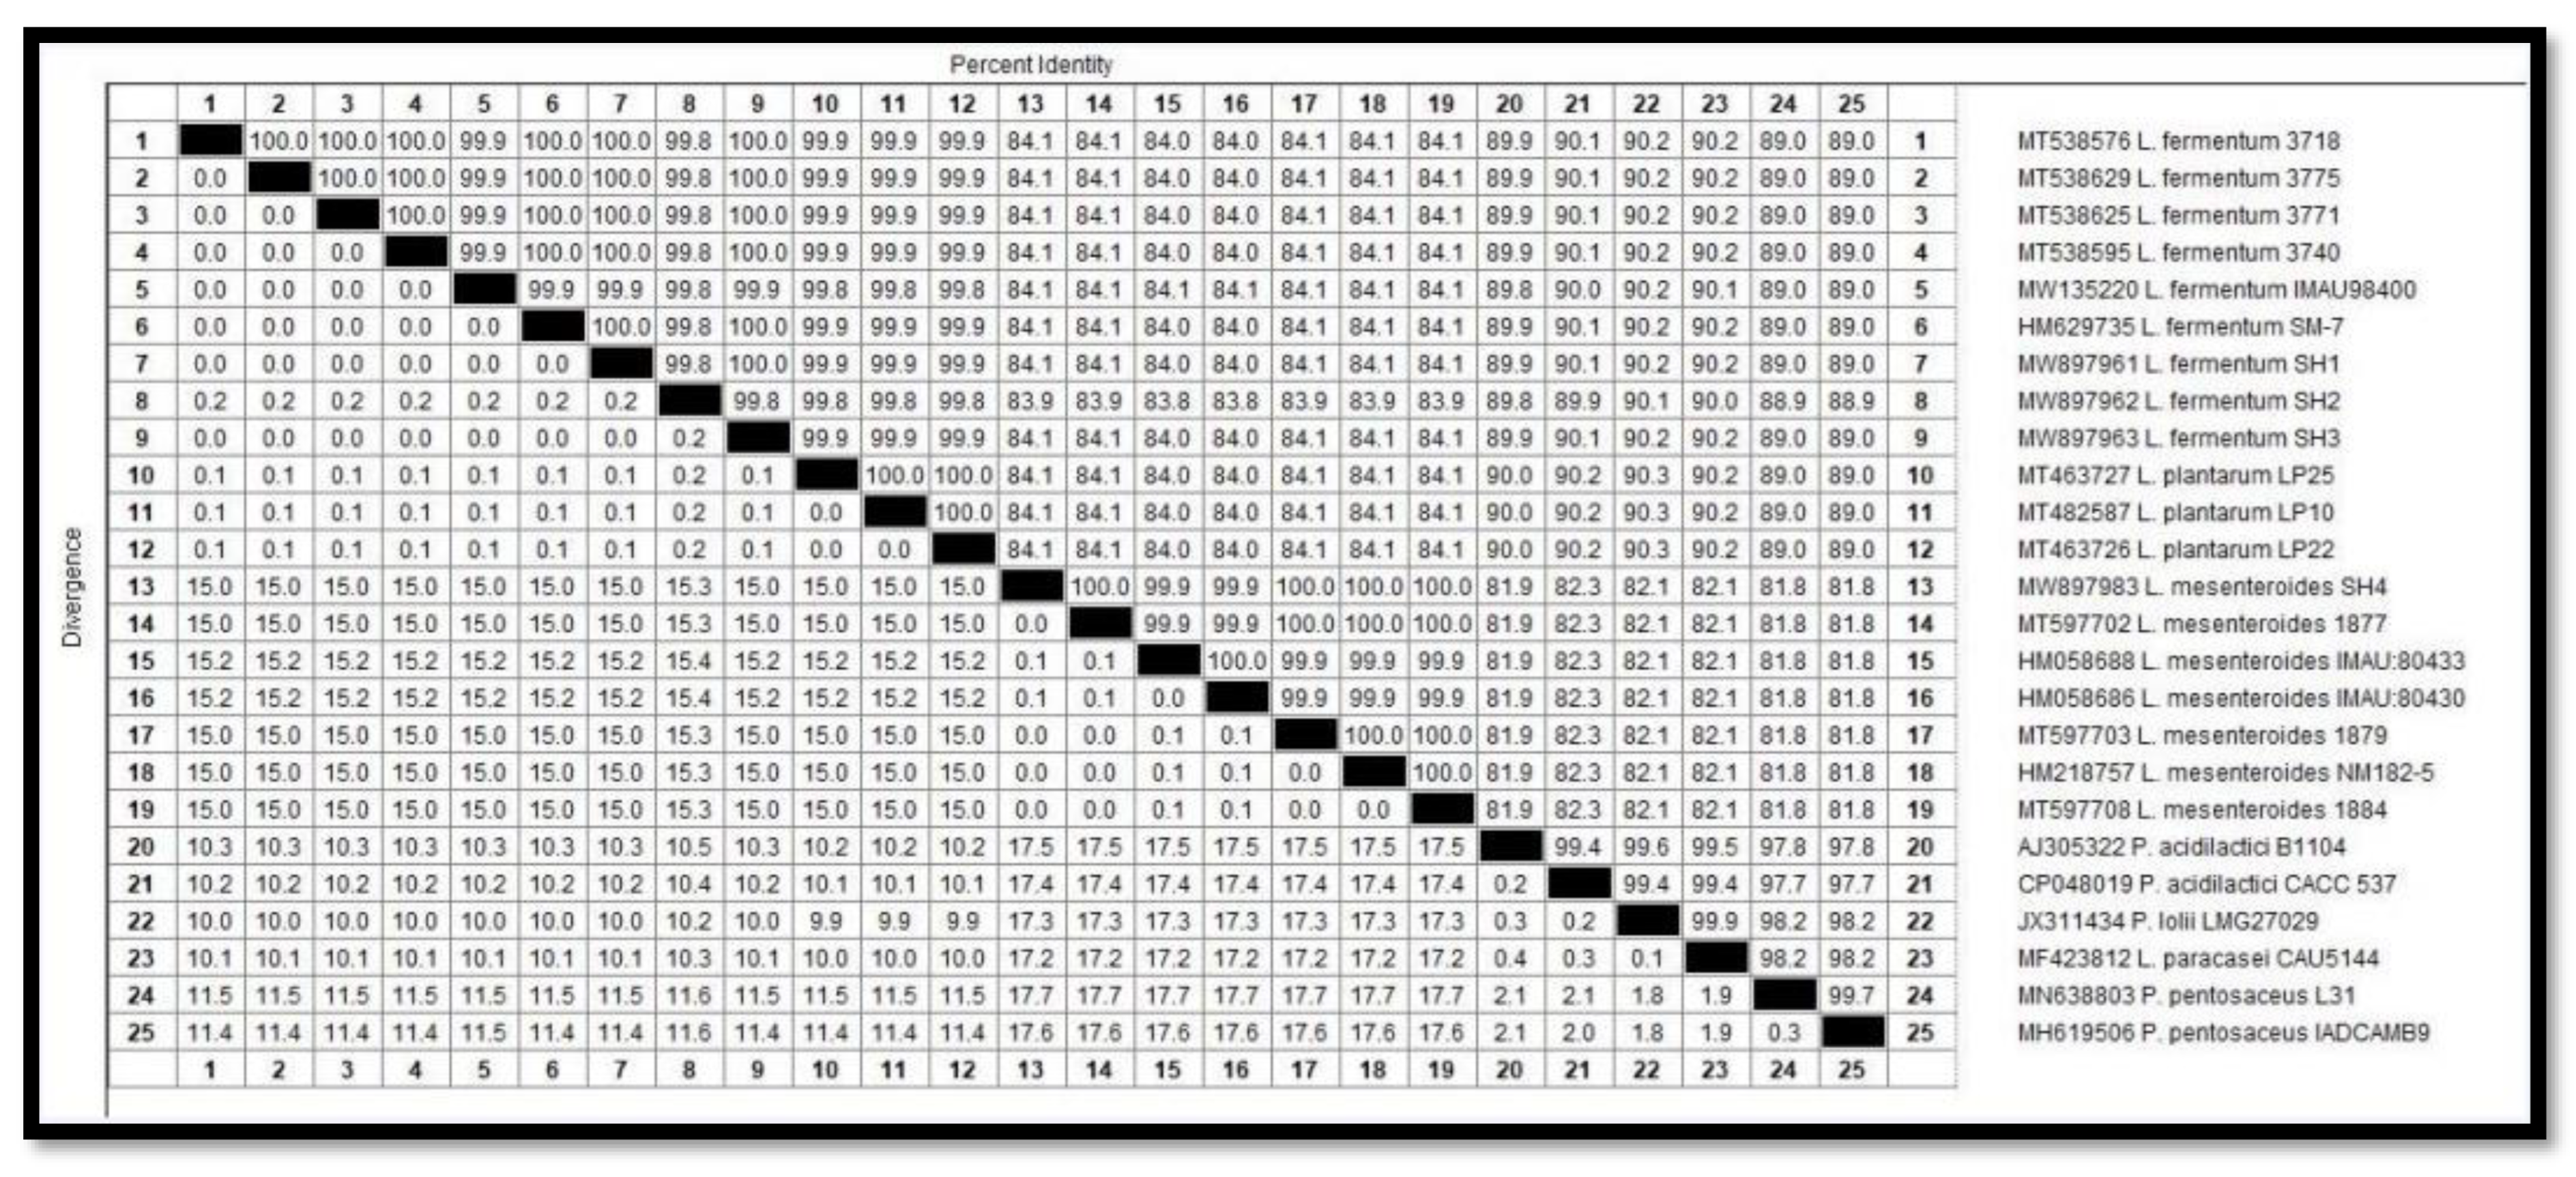
3.4. Blast N and Phylogenetic Tree Analysis of Selected LAB Isolates

The obtained data presented in Table 1 and Figure 4 represents the similarity and divergence values (%) of isolated bacteria by the 16S rRNA gene, which were 7, 8, 9, and 13 for SH1, SH2, SH3, and SH4, respectively. There was a statistical scale that represents the very high similarity between the sequence and the GenBank sequence data. Also, the obtained data for the isolated gene (16S rRNA) was matched with SH1 (MW897961), SH2 (MW897962), SH3 (MW897963), and SH4 (MW896983) accession numbers of all isolates. The similarity values (%) of SH1, SH2, SH3, and SH4 were 100%, 99.8%, 100%, and 100%, respectively. In addition, Table 1 shows the expected value (e-value) for all LAB isolates was zero.
The results of this investigation seem to agree with the theory reported by Balcázar et al. [41] which found the degree of similarity between LAB species depends not only on total 16S rRNA sequencing, but also on the variable regions within 16S rRNA and the values were 77.2–99.5 and 78.1–99.4%, respectively. On the other hand, a collection of nucleotide sequences for Lactobacillus, L. mesenteroides, and P. pentosaceus species appear to show that there was a taxonomic relationship between these organisms and their relationship with Gram positive bacteria as similarity coefficients [43]. In addition, Allaith [40] reported also the similarity value for different kinds of pathogenic bacteria isolated from cooked and uncooked food, which ranged between 99–100%.
Figure 4 shows that the distance between the SH4 isolate and other isolates (SH1, SH2, and SH3) is about 17.6 times. This indicates the number of times the DNA of this genus evolved compared to the other genera. This also was confirmed by the maximum likelihood method when constructing the evolutionary tree. This tree reflects the most likely sequence of evolutionary events given specific rules on how the DNA evolves over time [47]. The period of evolution among bacterial species or genera is related to the diversity of bacteria in their environment, and this could have several reasons, including single nucleotide polymorphism (SNP), G + C content, and environmental conditions (such as pH, temperature, nutrients, growth factor).
Our findings support some of the previous analogous studies, for example, Allaith [40] used 16S rRNA gene PCR to identify diverse pathogenic bacterial isolates of various food types. Likewise, Stackebrandt et al. [42] showed that the Lactobacillus genera were generated by Bacillus and Streptococci species, producing a super-cluster inside Gram-positive eubacteria with a low G + C context. In general, our data succeeded in a diagnosis of the 16S rRNA and gtf genes in different types of the LAB isolates from fermented boza and cider.

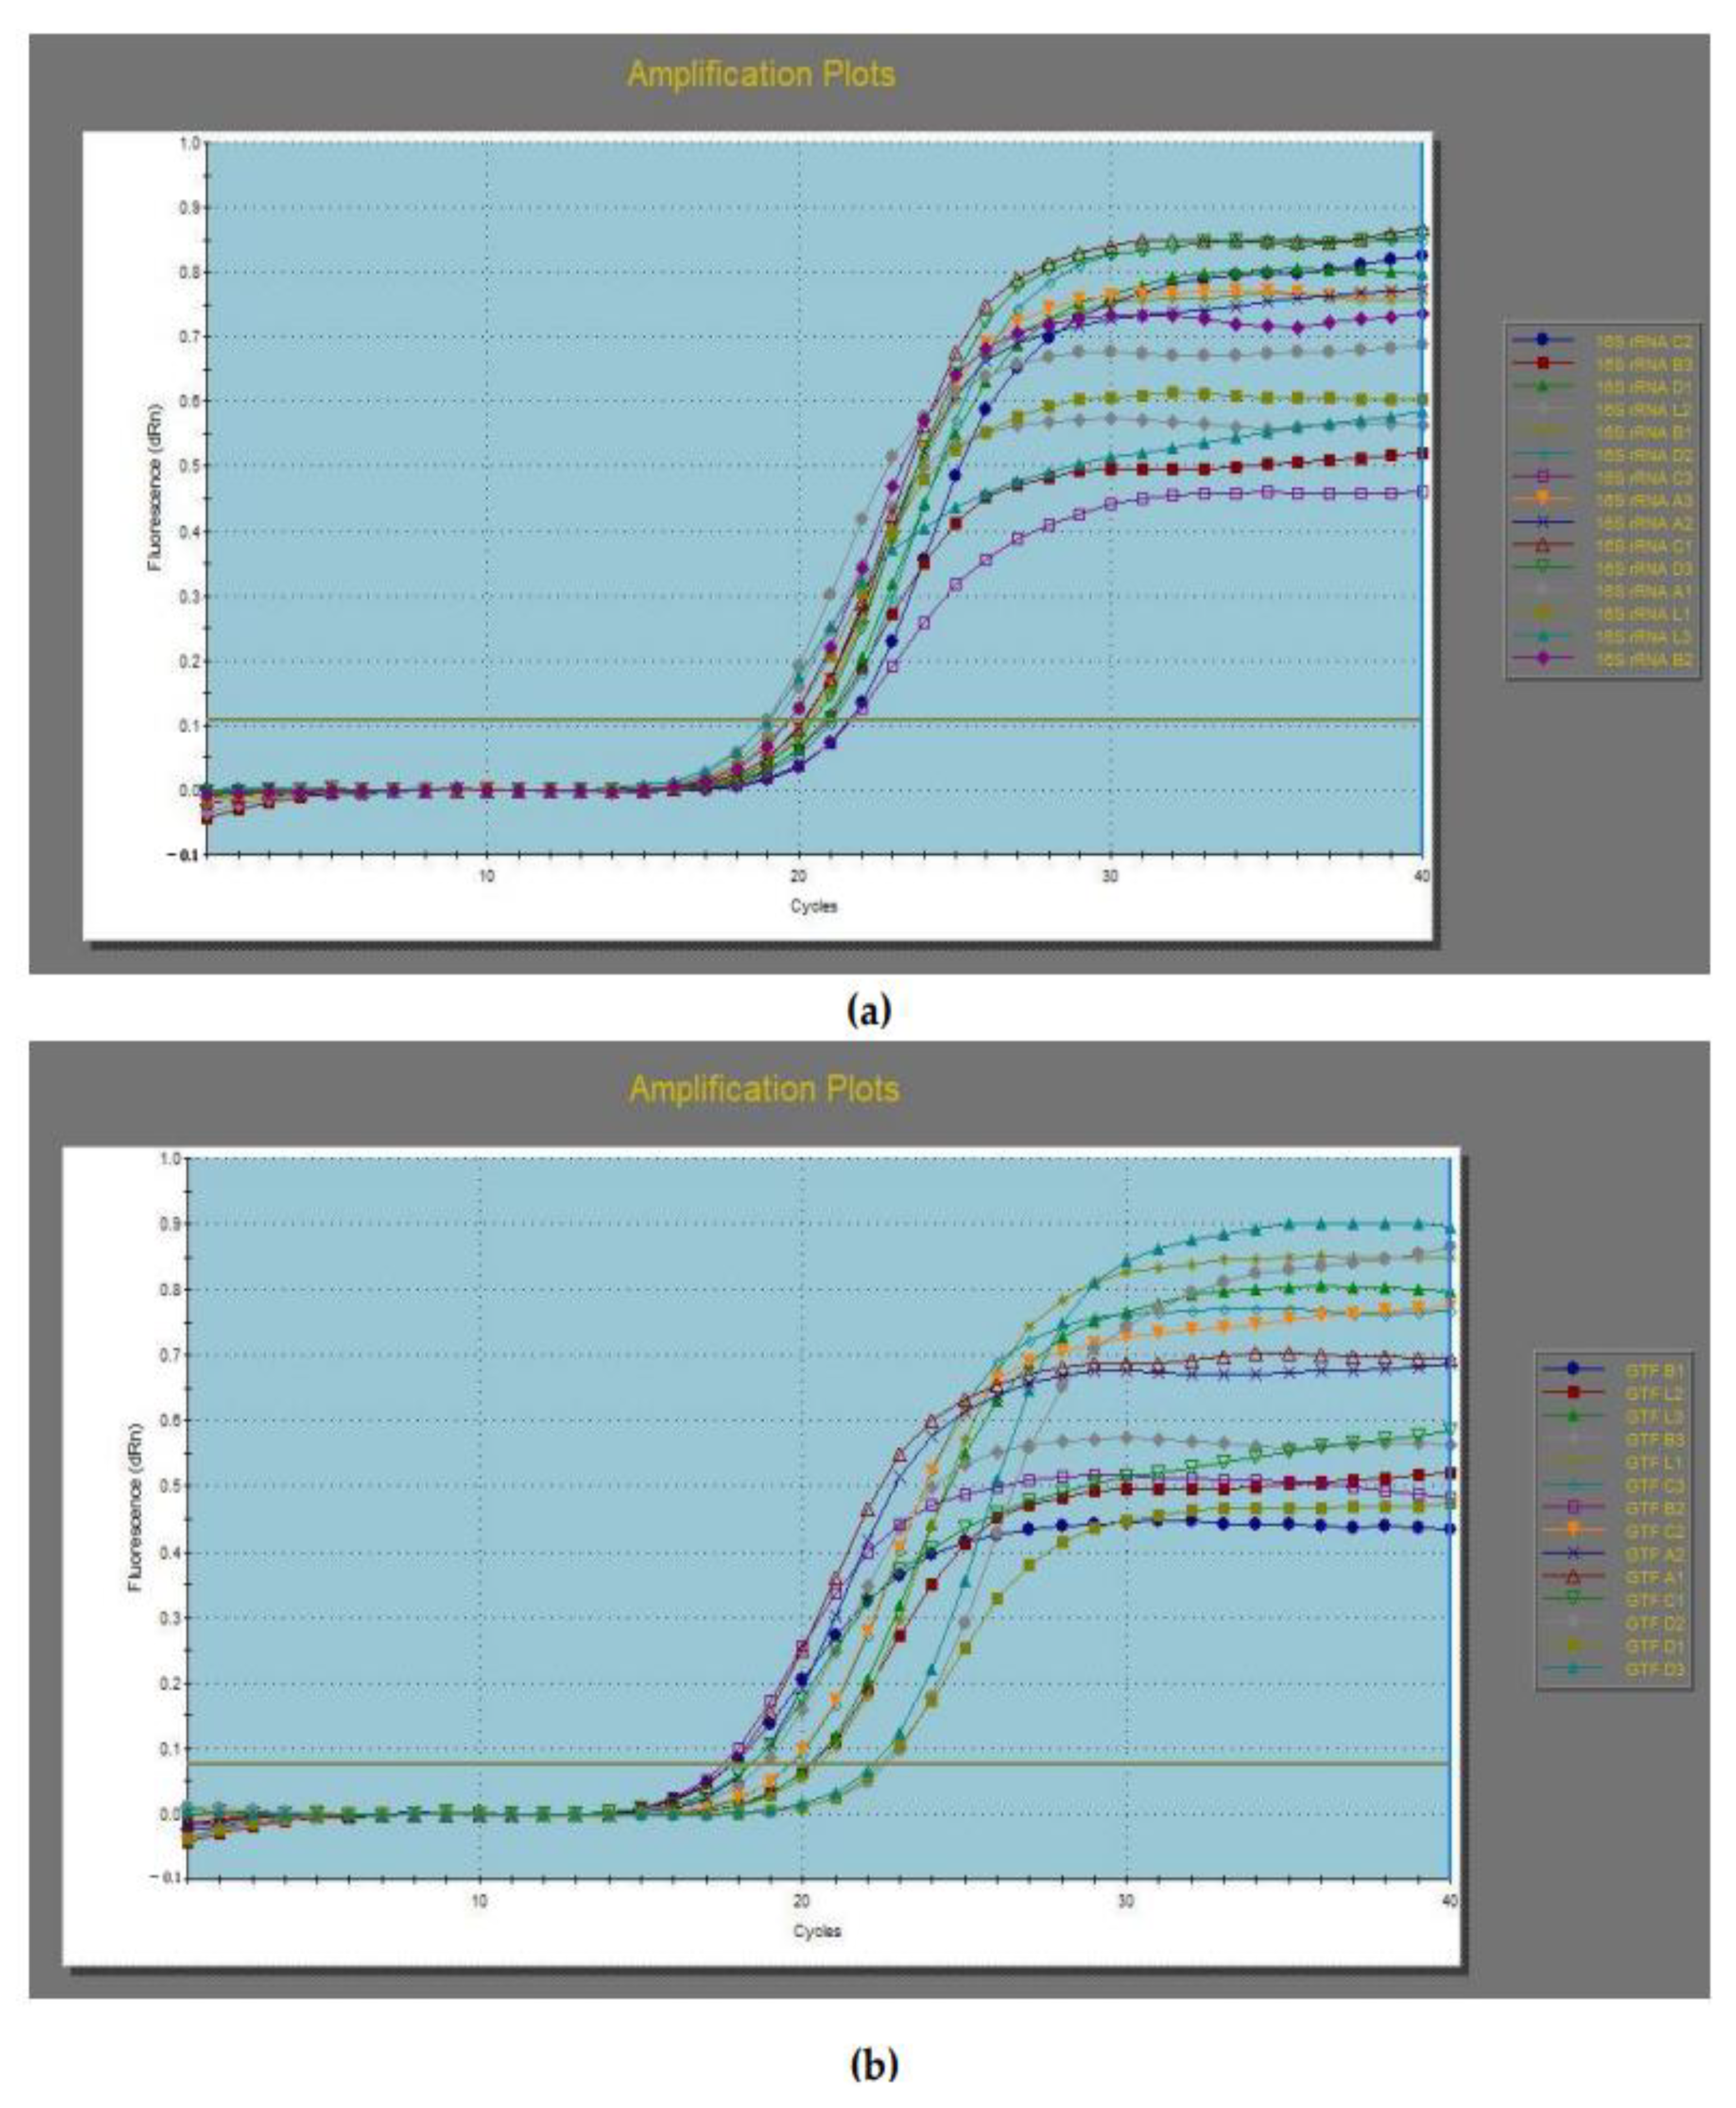
3.5. Gene Expression of Selected LAB Isolates by Quantitative Real-Time Polymerase Chain Reaction (qRT-PCR)

Quantitative real-time polymerase chain reaction (qRT-PCR) has been used to evaluate and compare the impact of gtf gene expression on producing β-glucan in LAB isolates (A3, B6, C9, D6 (in three replicates) compared to L. rhamnosus LGG and LAB 16S rRNA (housekeeping gene as control) (Table 2, Figure 5). It revealed there was an overall significant increase in levels of gtf gene expression for most tested genes among the different groups as shown in Table 2.
The results showed the superiority of B6 treatment in gtf gene expression (14.7230 ± 0.070-fold) followed by C9 and A3 treatments, which were 10.1730 ± 0.231-fold and 8.6139 ± 0.320-fold, respectively. while D6 treatment recorded the lowest value of gene expression (0.8566 ± 0.040-fold) compared to the group control LGG (one-fold). This is due to the control treatment being compared with itself, which the value of the expression is one.
These findings agree with the theory put out by Wasfi et al. [48] who found a significant increase in gene expression of gtf B of L. casei reaching (30-fold change). As well as gene expression for gtf B and gtf C were 20-fold and 17-fold change in L. plantarum, respectively, while gene expression for gtf B and gtf C for L. reuteri was 2.5-fold. They also found S. mutans’ biofilm development was reduced by treated it with the supernatant of all Lactobacillus sp. Lim et al. [49] studied also the antibacterial activity of L. rhamnosus GG, L. s delbrueckii 200170, and L. plantarum 200661, finding that they inhibited three S. mutans strains by reducing biofilm formation and glucan-related gene expression (gtf A, gtf B, and gtf D). All genes (gtf A, gtf B, and gtf D) were down-regulated in S. mutans KCTC 5458 by L. rhamnosus GG and L. plantarum 200661 as compared to control (a 1-fold change).
Also, Table 2 and Figure 5 show the ΔΔCt technique used to compute the mean levels of gene expression across replicates, which were expressed as the fold change in gene expression levels, in comparison to the control. Fold change is equal to 2−ΔΔCt. This means that fold change (>1) represents up-regulation, (<1) represents down-regulation, and (~1) represents an insignificant change. Our findings concurred with the earlier studies that have the similar objectives, which calculated the relative mRNA levels of genes of interest (gtf) by determination and normalization of the expression of the housekeeping gene (16S rRNA) using the ΔΔCt value analysis [48,49].

3.6. The Screening of Four LAB Isolates Using L. rhamnosus NRRL 1937 (LGG) as a Control to Produce β-Glucan

At the beginning of the fermentation process two factors were established. The primary number of inoculum, which was 1.5 × 10⁸ CFU/mL based on the McFarland turbidity criterion, and the pH for the fermentation environment(SDM), which was measured at pH 7. These two factors were established in order to facilitate the study and logical explanation of the remaining elements impacting the production and yield of EPS. In addition, the optimal temperature to activate bacteria was 37 °C whereas the temperature used for EPS production from bacteria was 30 °C. For both, the incubation period was 48 h. Similarly, Ale et al. [36] investigated that the synthesis of β -glucan from L. fermentum Lf2 at 37 °C and 30 °C were used to activate the bacteria, and produce the EPS, respectively. The pH was determined to be 6. In this regard, Ispirli and Dertli [50] identified nine L. fermentum strains from a total of one hundred isolates and showed that they produce EPS at 37 °C for 48 h.

3.6.1. Production and Calculation of EPS, Cell Mass, and pH Levels for Selected LAB Isolates

Various EPS screening procedures for LAB were reported. The partial purification of EPS by precipitation with acetone and subsequent spectrophotometrical measurement provides an additional quick screening method. Thus, Table 3, Figures S3 and S4 display the primary determination of EPS yields (mg/100 mL) produced by all studied LAB isolates (A3, B6, C9, and D) compared to L. rhamnosus LGG (control). The results demonstrated that B6 treatment was superior to the other treatments in terms of EPS formation, with a value of 481 ± 1.00 mg/100 mL, followed by the C9 treatment at 440 ± 2.00 mg/100 mL, compared to the LGG (control) reaching 199.7 ± 3.51 mg/100 mL. In contrast, the EPS production yield of the A3 treatment was 199.5 ± 1.80 mg/100 mL compared to LGG (control). As for the D6, its EPS production was the lowest compared to the control, reaching 161 ± 2.65 mg/100 mL. In addition, the mass of bacterial cells was greatest in A3 (225 ± 5.0) mg/100 mL, followed by B6, C9, and D6 (116.33 ± 1.53, 41.7 ± 1.53, and 12.33 ± 1.53, respectively) mg/100 mL, when compared to the control (33.33 ± 1.53) mg/100 mL.
In accordance with our results, the bacterial cell mass was lower in treatment C9 (41.7 ± 1.53) mg/100 mL in conjunction with a higher EPS yield (440 ± 2.00) mg/100 mL which was the closest to B6 (481 ± 1.00) mg/100 mL. In comparison, the greater cell mass in A3 (225 ± 5.0) mg/100 mL was the closest to the control in EPS yield (199.5 ± 1.80) mg/100 mL. The EPS production strongly depended on gtf gene expression for the tested isolates and is not related to the cell mass, as explained in paragraph 3.5. According to recent studies, it has been demonstrated after 13 h of fermentation, the EPS concentration reached up to 4.64 ± 0.06 g/L and this increase corresponded to the gradually growing gene expression of the eps E gene in L. delbrueckii subsp. bulgaricus 2214, which eventually fell to 2.87 ± 0.05 g/L after 55 h of fermentation [51].
Consistent with this observation, genes encoding EPS-biosynthesis proteins are often grouped in operon clusters in LAB, and genes in the eps operon can be divided into groups depending on the potential or established roles of their products [52]. Other strains of L. fermentum were investigated for their ability to produce EPS without consideration for their functional features. It was found that L. fermentum MTCC 25067 produced 100 mg/L of EPS in pure form when cultured in MRS broth [53,54]. Also, de Albuquerque et al. [55] examined nine wild lactobacillus strains obtained from byproducts of fruit processing. Three of them were L. fermentum 139, L. fermentum 263, and L. fermentum 296 producing 47.4, 55.1 and 55.6 mg EPS per L, respectively.
The amount and composition of EPS produced by LAB of various strains under non-optimized conditions were very variable during this study. Also, growth and fermentation parameters such as pH, temperature, and medium composition are substantially influenced by its formation. Thus, they led to fluctuating EPS yields, even though they are from the same genus (A3, B6, C9). In another study, Notararigo et al. [56] reported that EPS generation could be affected by the composition of the medium, which is connected to microbial growth, carbon, nitrogen content, fermentation temperature, oxygen supply, starting pH, and incubation period. Also, Luyen et al. [57] studied the impact of carbohydrate sources at various concentrations and growing conditions on EPS production in L. fermentum MC3. The results revealed that adding various sugars to the culture medium led to enhanced EPS production reaching 178.2 mg/L. Ale et al. [58] identified also L. fermentum TC21 from ‘Tom Chua,’ a Hue traditional fermented shrimp. The maximum EPS yield (405.7 mg/L) was observed when the medium was treated with lactose and beef extract.
Similarly, Polak et al. [59] reported that EPS production from L. rhamnosus E/N increased to 210.28 mg/L compared to control sample (134.2 mg/L). In another study, an increase in the yield of EPS produced by three strains of L. rhamnosus under optimum conditions gave a maximum value of 1138.2 mg/L compared to the control [60]. Further, EPS was produced by L. mesenteroides SN-8 isolated from soybean paste which was 2.42 g/L using sucrose as a carbon source for the fermentation process. While L. mesenteroides 21.2 isolated from raw milk which produced EPS of about 0.9 g/L [61,62].
Comparing the pH at the beginning of fermentation, the data showed that the pH fluctuated between (4.1–5.1) for all treatments as in Table 3. The drop in pH referred to the efficacy of the isolates during fermentation for 48 h, this is due to their consumption of sucrose in the medium and generation of lactic acid, as well as other components including EPS [16,58]. The previously mentioned researches explain the distinction between the A3, B6, C9, and D6 treatments and the control in the screening of LAB isolates and their EPS production yields.

3.6.2. Determination of Total Carbohydrate and Total Protein in EPS Produced by Selected LAB Isolates

Table 3 showed total carbohydrate % in EPS of tested LAB isolates (A3, B6, C9, D6) compare to LGG, which were 99.17 ± 0.11, 301.48 ± 0.20, 74.77 ± 0.03, 103.72 ± 0.28 and 9.61 ± 0.05, respectively.
Table 3 also showed the total protein % (using Folin Lowry method and bovine serum albumin as a standard) in EPS of tested LAB isolates (A3, B6, C9, D6) compare to LGG were 98.31 ± 0.02, 150.60 ± 0.02, 328.00 ± 2.00, 50.24 ± 0.04 and 180.92 ± 0.03, respectively. The high protein % in the extract is explained as follows: firstly, the high protein content entering the semi define media (SDM) through the use of 0.5% yeast extract and 1% peptone. Secondly, the absence of additional purification methods such as boiling and treatment with trichloroacetic acid (TCA) for the purpose of protein precipitation (which will be followed later when selecting the superior bacteria in EPS production under optimization conditions in the next paper). Thirdly, the use of acetone to precipitate EPS extracted led to the precipitation of cellular proteins, including DNA. All the above factors combined showed the extent of the purity of the extract and methods that were followed later to purify it. Recently, isolation and purification of EPS were crucial for the recovery and characterization of individual EPS. Purification and quantification of EPS require the isolation of EPS from a protein network, or a heating step (e.g., 100 °C for 15 or 30 min) as a pretreatment before isolation can be used to inactivate endogenous enzymes that can cause EPS degradation in the medium. Then, trichloroacetic acid can be used to precipitate proteins (TCA) [63,64,65,66].
In comparable studies, the chemical composition of EPS from L. plantarum NTMI05 and NTMI20 indicate the existence of 95.45% and 92.35% as total carbohydrate, but 0% as total protein due to the absence of a Bradford test reaction [67]. The total carbohydrate % in EPS for the four strains was analyzed by the phenol sulfuric acid method: L. suebicus CUPV225, P. parvulus 2.6, L. lactis and L. mesenteroides RTF10NZ9000[pGTF] which were 144 ± 1 mg /L, 378 ± 3 mg /L, 561 ± 18 mg/L, 1870 ± 180 mg/L. In addition, the total protein % in EPS for the four strains above which were (34.7, 4.5, 83.3, and 2.9%), respectively [56].
Traditionally, colorimetric assays for quantitative determination are the cheapest and simplest procedures, but they are not free from interference, which must be considered when the quantitative formation is required.

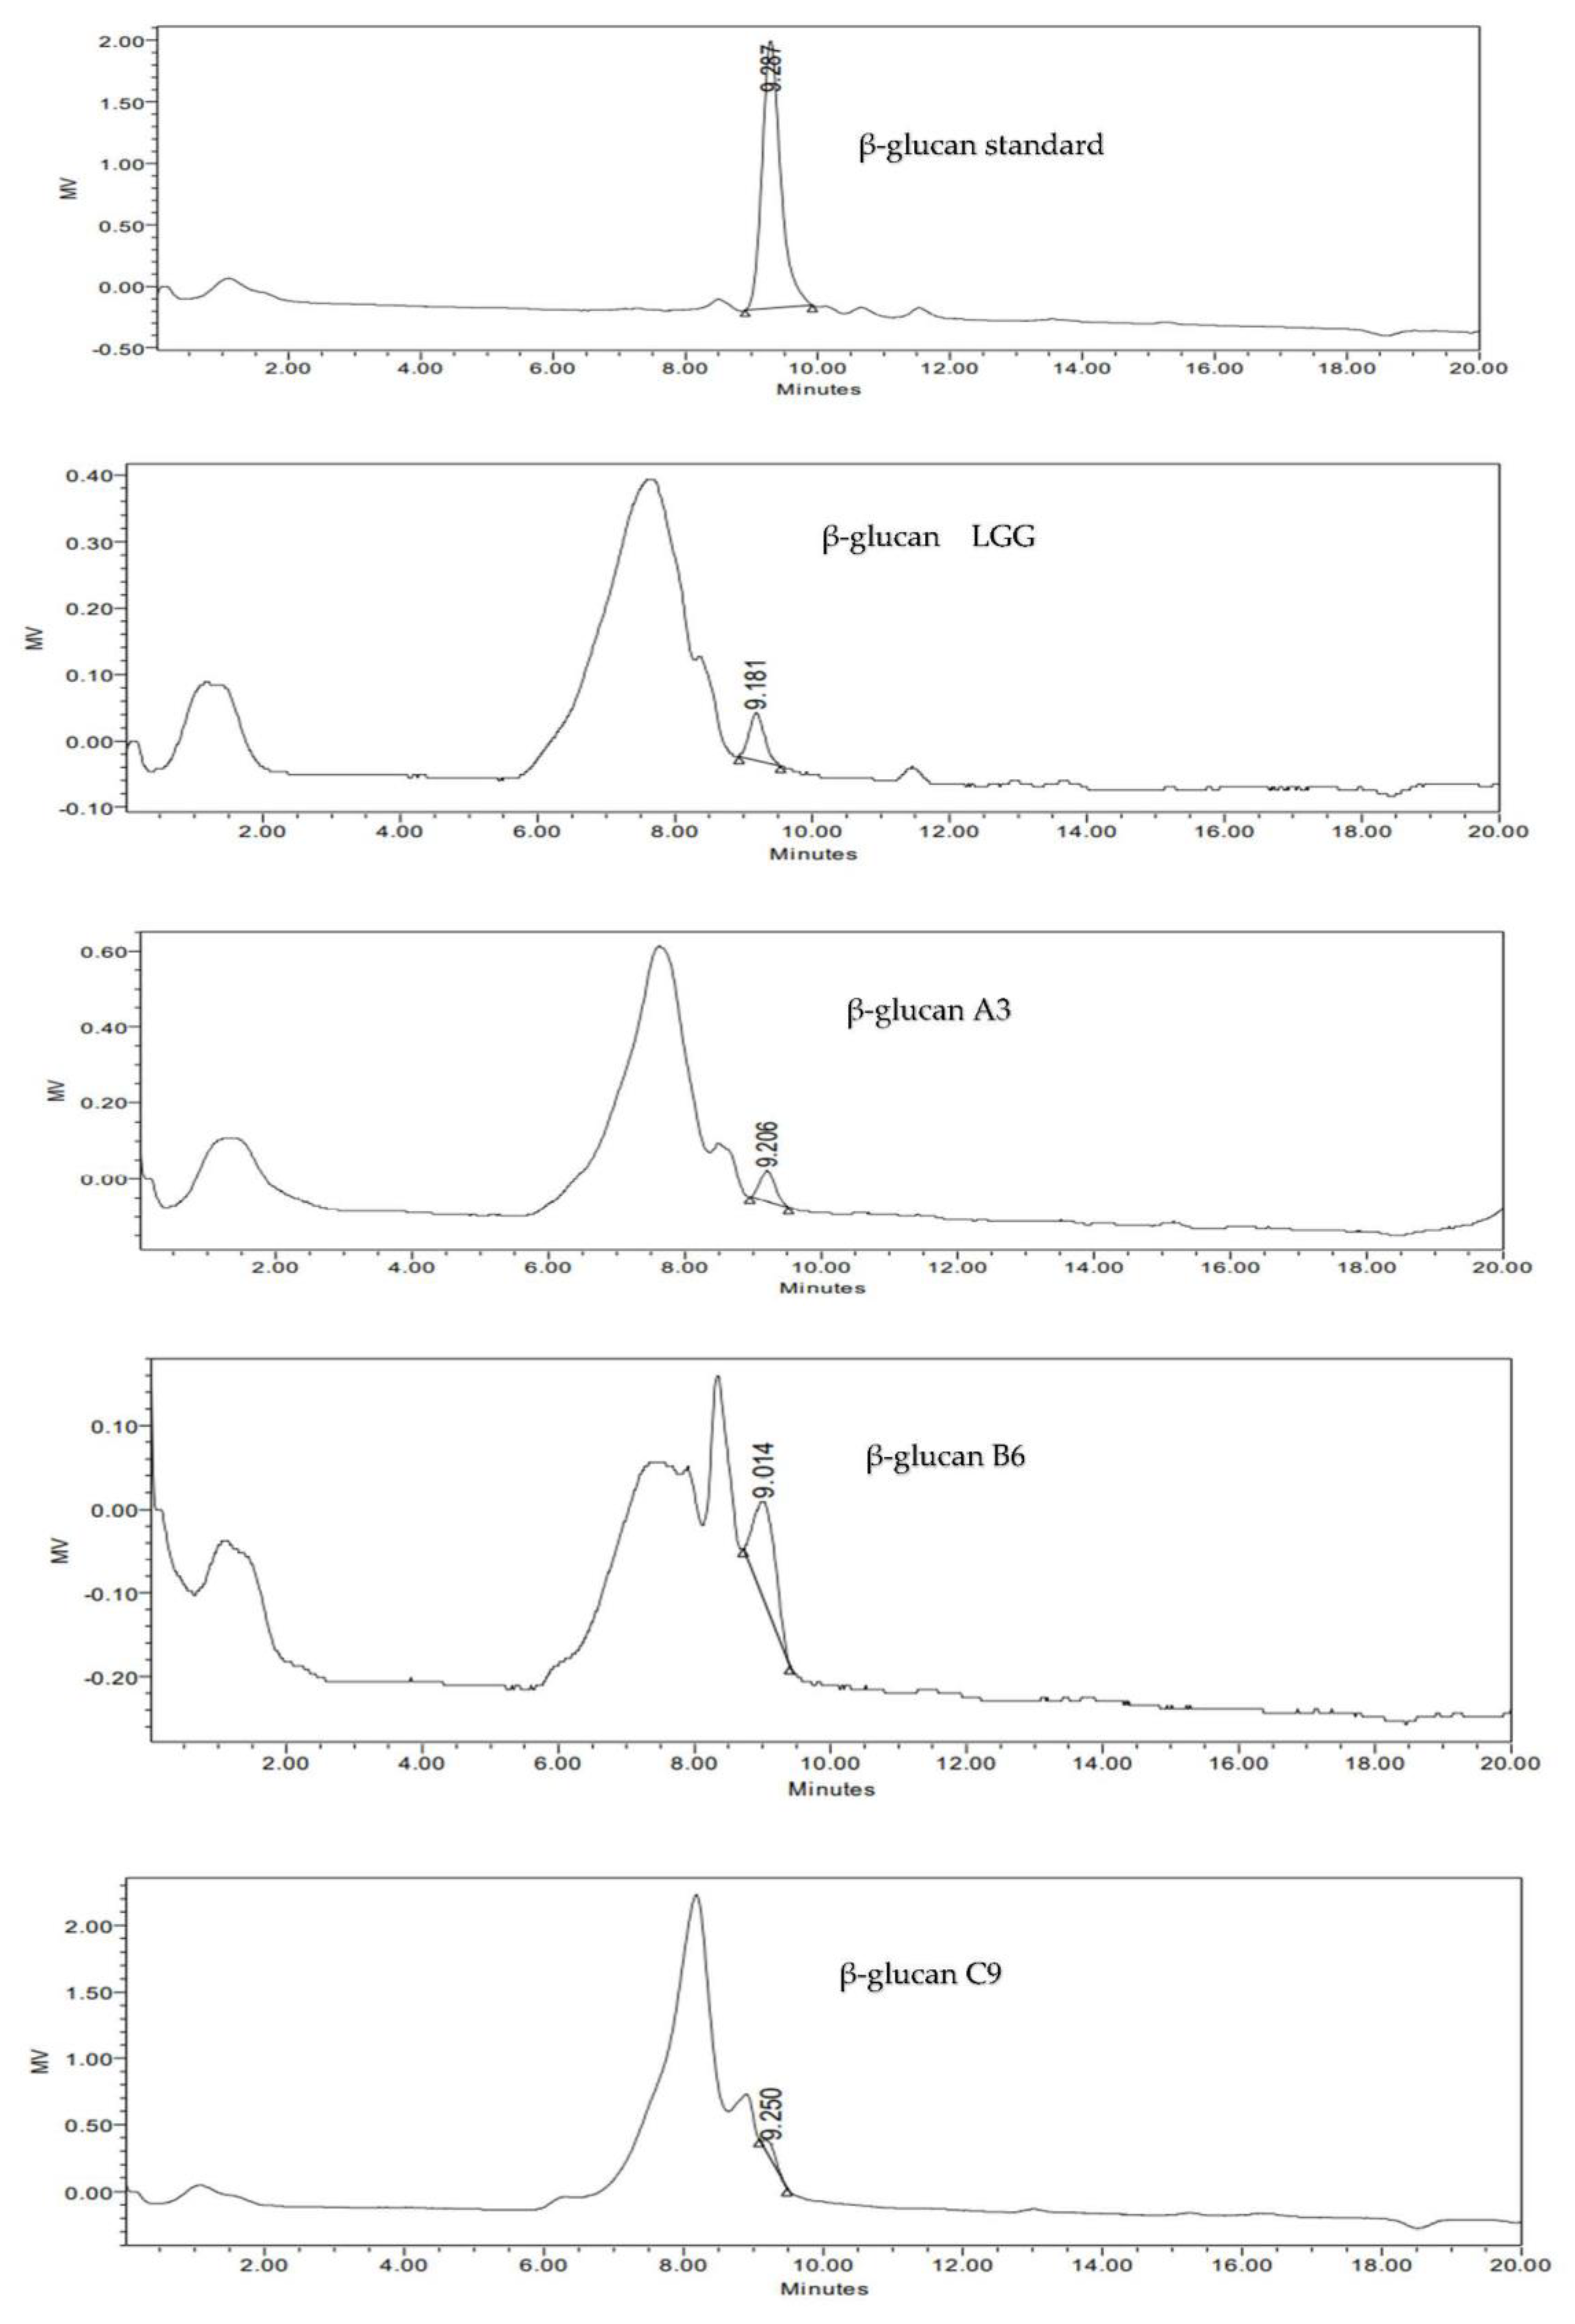
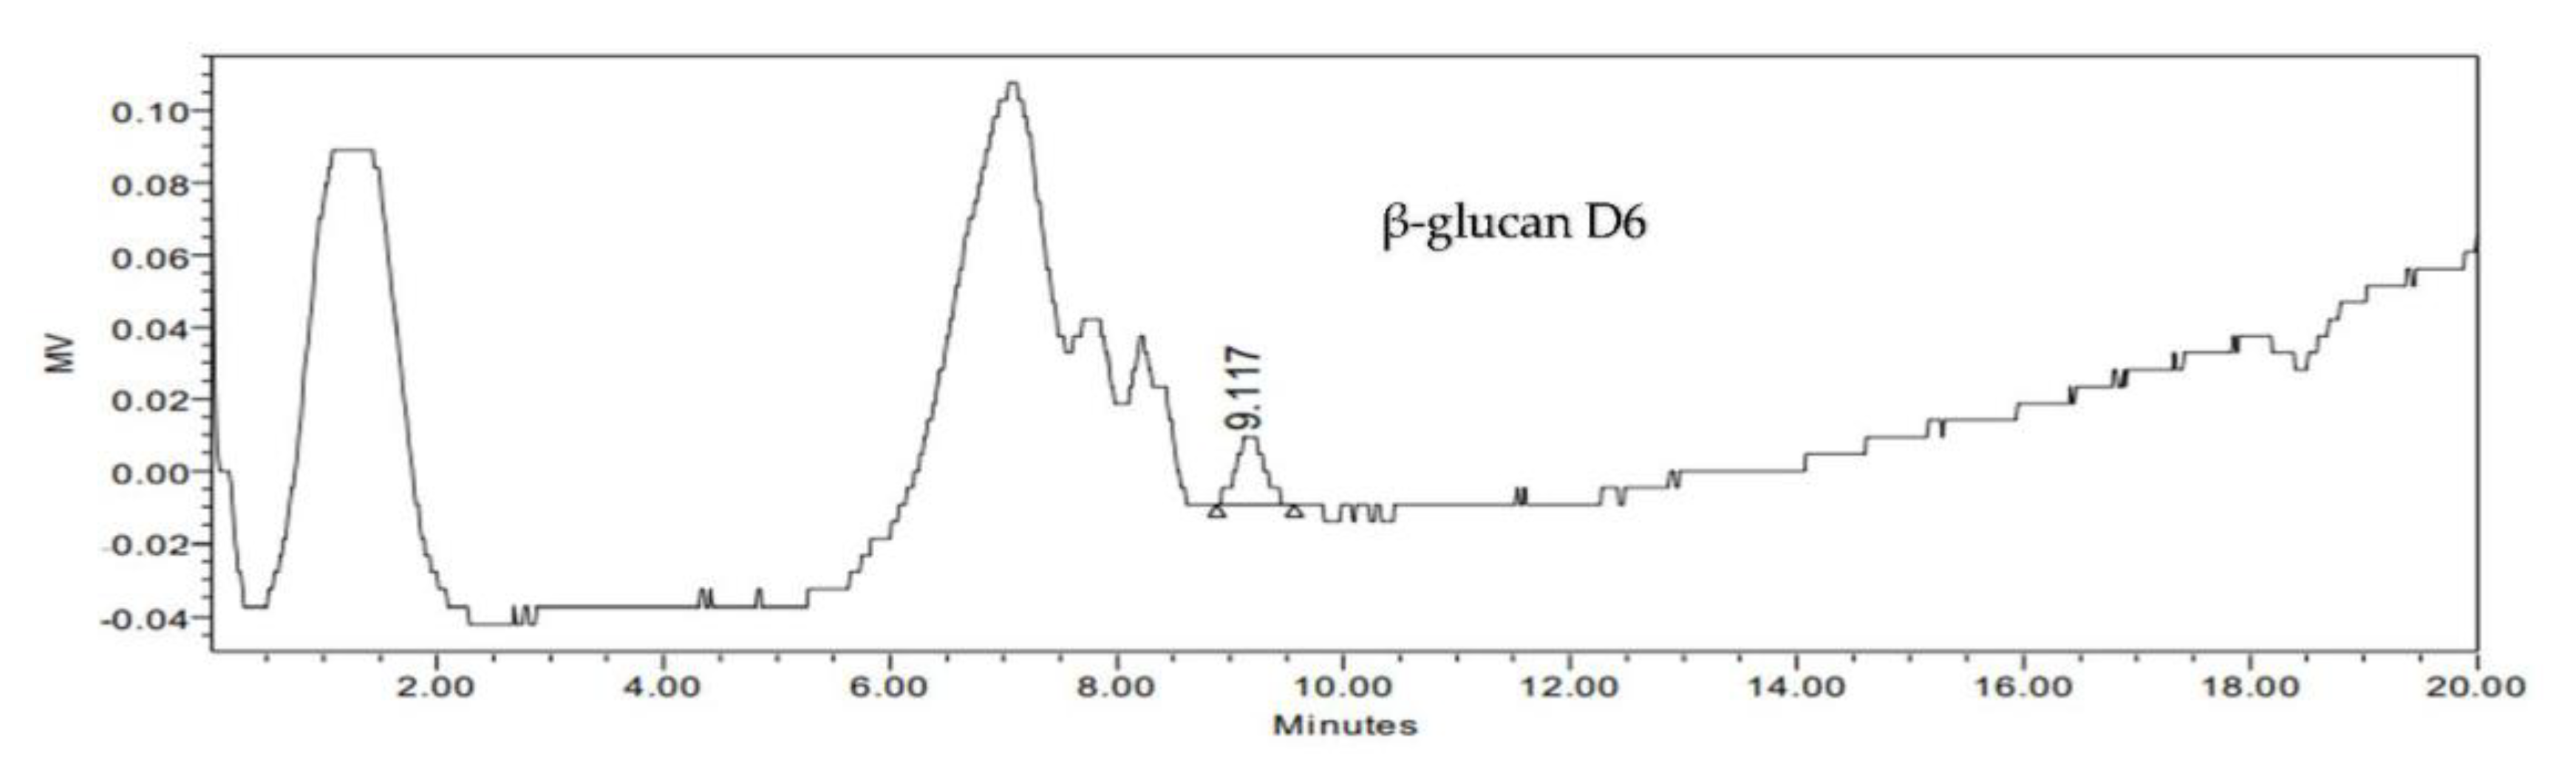
3.6.3. Detection and Identification of β-Glucan Produced by Selected LAB Isolates Using HPLC Analysis

Table 3 and Figure 6 show quantitative and qualitative β-glucan in EPS for all studied LAB isolates (A3, B6, C9, D6) compared to LGG (control), which were (0.12 ± 0.008, 5.56 ± 0.01, 4.46 ± 0.01, 0.25 ± 0.008)%, respectively, compared to control, which was (0.31 ± 0.01)%. The R2 value for the β-glucan standard curve was 0.992. Additionally, the results revealed that EPS from all studied LAB isolates (LGG, A3, B6, C9, D6) showed independent peaks at the retention time (min) which were (9.181, 9.206, 9.014, 9.250, 9.117) min, respectively, compared to the retention time for β-glucan (standard), which was 9.287 min as in Figure 6.
In this regard, Abd El Ghany et al. [16] determined β -glucan in EPS extracted from P. parvulus F1030 by HPLC analysis, with a retention time of 9.024 min for standard β-glucan. L. fermentum Lf2’s EPS is predominantly made of two polysaccharides: a high molecular mass β-glucan, which has a repeating unit of (1.23 × 10⁶ Da), and a medium molecular mass heteroglycan (8.8 × 10⁴ Da) using NMR spectroscopy [36,68,69]. The monosaccharide composition of EPS can be determined using HPLC. First, the EPS must be hydrolyzed to monosaccharides, which are then identified. For the hydrolysis of EPS, acids such as trifluoroacetic acid (TFA), HCl, or H2SO4 can be used at temperatures between (100–121 °C) [65].

4. Conclusions

The results of the present study demonstrate that L. fermentum SH2 (local isolate) was better at producing β-glucan compared to standard strain L. rhamnosus LGG. However, the gene expression of gtf gene showed the potential of some LAB species to produce EPS including β-glucan in different proportions expressed to fold change, which was reinforced by the results of the HPLC analysis. As a result of the significance of microbial EPS in various industrial applications, the majority of research efforts are concentrated on isolating and characterizing these particles. However, owing to the high cost of manufacture, their application in the food sector is still very restricted. The primary challenge to be faced is the need to lower costs and increase yields through the utilization of by-products such as molasses. It is necessary, to make large use of microbial polysaccharides on the market, to improve the fermentation and the subsequent actions for EPS recovery. These are the steps that will be followed and highlighted in the next stage of our research.

Supplementary Materials

The following supporting information can be downloaded at: https://www.mdpi.com/article/10.3390/fermentation8080350/s1, Figure S1: the morphology of Lactic Acid Bacteria on MRS medium and microscopic diagnosis; Figure S2: the original picture of gel electrophoresis for (a. 16S rRNA gene, and b. gtf gene); Figure S3: Exopolysaccharides production from all tested LAB isolates after freeze-drying; Figure S4: Exopolysaccharides production from all tested LAB isolates during freeze-drying in the round flasks; Table S1: Purified and identified Lactic Acid Bacteria from different sources.

Author Contributions

Conceptualization, S.A.A., R.M.M., T.G.A. and A.M.G. formal analysis, S.A.A., T.G.A., H.S.E., A.B.A., Z.A.T., A.J.A.A.-M. and M.E.A.-a.; investigation, K.A.E.-G., S.A.A., T.G.A. and M.E.A.-a. methodology, S.A.A., T.G.A., H.S.E., A.M.G., M.E.A.-a. and A.M.G.; writing original draft, S.A.A., Z.A.T., K.A.E.-G., A.M.G. and T.G.A. writing review and editing, S.A.A., A.B.A., A.J.A.A.-M., A.M.G., T.G.A., and M.E.A.-a. All authors have read and agreed to the published version of the manuscript.

Funding

This research received no external funding.

Institutional Review Board Statement

Not applicable.

Informed Consent Statement

Not applicable.

Data Availability Statement

All data generated or analyzed during this study are included in this article.

Acknowledgments

This work was conducted at Food Microbiology Lab, Faculty of Agriculture, Cairo University. Molecular detection was conducted at Biotechnology Department Lab, Ministry of Agriculture, Animal Health Research Institute. All authors are thankful to Abdalsatar Arafa (Head of Institute Animal Health, and Ahmed Erfan (Head of Biotechnology Unit) for allowing to conduct experiments in their laboratories.

Conflicts of Interest

The authors declare no conflict of interest.

References

  1. Henrion, M.; Francey, C.; Lê, K.-A.; Lamothe, L. Cereal _β-glucans: The Impact of Processing and How It affects Physiological Responses. Nutrients 2019, 11, 1729. [Google Scholar] [CrossRef] [PubMed] [Green Version]
  2. Lamothe, L.M.; Lê, K.-A.; Samra, R.A.; Roger, O.; Green, H.; Macé, K. The scientific basis for healthful carbohydrate profile. Crit. Rev. Food Sci. Nutr. 2019, 59, 1058–1070. [Google Scholar] [CrossRef] [PubMed] [Green Version]
  3. Abd El Ghany, K.; Hamouda, R.A.; Mahrous, H.A.; Sharaf, S.M.; Hamza, H.A. Molecular characterization using gtf gene detection and medium optimization of β -d-glucan production from Pediococcus parvulus F1030 isolated from local Egyptian boza. J. Pharm. Res. Int. 2017, 1–8. [Google Scholar]
  4. Donot, F.; Fontana, A.; Baccou, J.C.; Schorr-Galindo, S. Microbial Exopolysaccharides: Main examples of synthesis, excretion, genetics and extraction. Carbohydr. Polym. 2012, 87, 951–962. [Google Scholar] [CrossRef]
  5. Flemming, H.-C. EPS—Then and Now. Microorganisms 2016, 4, 41. [Google Scholar] [CrossRef] [Green Version]
  6. Verma, D.K.; Niamah, A.K.; Patel, A.R.; Thakur, M.; Sandhu, K.S.; Chávez-González, M.L.; Shah, N.; Aguilar, C.N. Chemistry and microbial sources of curdlan with potential application and safety regulations as prebiotic in food and health. Food Res. Int. 2020, 133, 109–136. [Google Scholar] [CrossRef]
  7. Zhu, F.; Du, B.; Xu, B. A critical review on production and industrial applications of β -glucans. Food Hydrocoll. 2016, 52, 275–288. [Google Scholar] [CrossRef]
  8. Schlörmann, W.; Bockwoldt, J.A.; Hübner, S.M.; Wittwer, E.; Reiners, S.; Lorkowski, S.; Dawczynski, C.; Ehrmann, M.A.; Glei, M. Use of the β-Glucan-Producing Lactic Acid Bacteria Strains Levilactobacillus brevis and Pediococcus claussenii for Sourdough Fermentation—Chemical Characterization and Chemopreventive Potential of In Situ-Enriched Wheat and Rye Sourdoughs and Breads. Nutrients 2022, 14, 1510. [Google Scholar] [CrossRef]
  9. U.S. Food and Drug Administration. GRAS Notice Inventory. Available online: http://www.fda.gov/Food/FoodIngredientsPackaging/GenerallyRecognizedasSafeGRAS/GRASListings/default.htm (accessed on 11 September 2009).
  10. Sutherland, I.W. Novel and established applications of microbial polysaccharides. Trends Biotechnol. 1998, 16, 41–46. [Google Scholar] [CrossRef]
  11. Miao, M.; Bai, A.; Jiang, B.; Song, Y.; Cui, S.W.; Zhang, T. Characterisation of a novel water-soluble polysaccharide from Leuconostoc citreum SK24. 002. Food Hydrocoll. 2014, 36, 265–272. [Google Scholar] [CrossRef]
  12. Verce, M.; De Vuyst, L.; Weckx, S. Comparative genomics of Lactobillus fermentum suggests a free-living lifestyle of this lactic acid bacterial species. Food microbiol. 2020, 89, 103448. [Google Scholar] [CrossRef] [PubMed]
  13. Ilango, S.; Antony, U. Probiotic microorganisms from non-dairy traditional fermented foods. Trends Food Sci. Tech. 2021, 118, 617–638. [Google Scholar] [CrossRef]
  14. Duenas, M.; Irastorza, A.; Fernandez, K.; Bilbao, A.; Huerta, A. Microbial populations and malolactic fermentation of apple cider using traditional and modified methods. J. Food Sci. 1994, 59, 1060–1064. [Google Scholar] [CrossRef]
  15. Marshall, E.; Mejia, D. Fermentation and sustainable livelihoods. In Traditional Fermented Food and Beverages for Improved Livelihoods, 1st ed.; Marshall, E., Ed.; FAO: Rome, Italy, 2011; Volume 18. [Google Scholar]
  16. Abd El Ghany, K.; Hamouda, R.; Mahrous, H.; Abd Elhafez, E.; Ahmed, F.A.H.; Hamza, H.A. Description of isolated LAB producing β -glucan from Egyptian sources and evaluation of its therapeutic effect. Int. J. Pharm. 2016, 12, 801–811. [Google Scholar] [CrossRef] [Green Version]
  17. Nel, S.; Davis, S.B.; Endo, A.; Dicks, L.M. Phylogenetic analysis of Leuconostoc and Lactobacillus species isolated from sugarcane processing streams. MicrobiologyOpen. 2020, 9, e1065. [Google Scholar] [CrossRef] [PubMed]
  18. Kurek, M.A.; Wyrwisz, J.; Brzeska, M.; Moczkowska, M.; Karp, S.; Wierzbicka, A. Effect of different β -glucan preparation pretreatments on fortified bread quality. Food Sci.Technol. 2018, 38, 606–611. [Google Scholar] [CrossRef] [Green Version]
  19. Hugenholtz, P.; Goebel, B.M.; Pace, N.R. Impact of culture independent studies on the emerging phylogenetic view of bacterial diversity. J. Bacteriol. 1998, 180, 4765–4774. [Google Scholar] [CrossRef] [Green Version]
  20. O’Sullivan, D.J. Methods for analysis of the intestinal microflora. Curr. Issues Intest. Microbiol. 2000, 1, 39–50. [Google Scholar]
  21. Martinez-Murcia, A.J.; Collins, M.D. A phylogenetic analysis of the genus Leuconostoc based on reverse transcriptase sequencing of 16S rRNA. FEMS Microbiol. Lett. 1990, 70, 73–83. [Google Scholar] [CrossRef]
  22. Sanalibaba, P.; Çakmak, G.A. Exopolysaccharides production by lactic acid bacteria. Appl. Microbiol. 2016, 2, 1000115. [Google Scholar] [CrossRef]
  23. Werning, M.L.; Ibarburu, I.; Duenas, M.T.; Irastorza, A.N.A.; Navas, J.; Lopez, P. Pediococcus parvulus gtf gene encoding the GTF glycosyltransferase and its application for specific PCR detection of β-D-glucan–producing bacteria in foods and beverages. J. Food Prot. 2006, 69, 161–169. [Google Scholar] [CrossRef] [PubMed]
  24. Garai-Ibabe, G.; Dueñas, M.T.; Irastorza, A.; Sierra-Filardi, E.; Werning, M.L.; López, P.; De Palencia, P.F. Naturally occurring 2-substituted (1, 3)-β-D-glucan producing Lactobacillus suebicus and Pediococcus parvulus strains with potential utility in the production of functional foods. Bioresource Technol. 2010, 101, 9254–9263. [Google Scholar] [CrossRef] [Green Version]
  25. Kralj, S.; van Geel-Schutten, G.H.; Dondorff, M.M.G.; Kirsanovs, S.; Van Der Maarel, M.J.E.C.; Dijkhuizen, L. Glucan sy thesis in the genus Lactobacillus: Isolation and characterization of glucansucrase genes, enzymes and glucan products from six different strains. Microbiology 2004, 150, 3681–3690. [Google Scholar] [CrossRef] [PubMed] [Green Version]
  26. Valles, B.S.; Bedriñana, R.P.; Tascón, N.F.; Simón, A.Q.; Madrera, R.R. Yeast species associated with the spontaneous fermentation of cider. Food Microbiol. 2007, 24, 25–31. [Google Scholar] [CrossRef] [PubMed]
  27. Lagacé, L.; Pitre, M.; Jacques, M.; Roy, D. Identification of the bacterial community of maple sap by using amplified ribosomal DNA (rDNA) restriction analysis and rDNA sequencing. Appl. Environ. Microbiol. 2004, 70, 2052–2060. [Google Scholar] [CrossRef] [PubMed] [Green Version]
  28. Turpin, W.; Humblot, C.; Guyot, J.P. Genetic screening of functional properties of lactic acid bacteria in a fermented pearl millet slurry and in the metagenome of fermented starchy foods. Appl. Environ. Microbiol. 2011, 77, 8722–8734. [Google Scholar] [CrossRef] [Green Version]
  29. Green, M.R.; Hughes, H.; Sambrook, J.; MacCallum, P. Molecular Cloning: A Laboratory Manual; Cold Spring Harbor Laboratory Press: New York, NY, USA, 2012; p. 1890. [Google Scholar]
  30. Available online: https://blast.ncbi.nlm.nih.gov/Blast.cgi#alnHdr_2024212275 (accessed on 18 July 2022).
  31. Altschul, S.F.; Gish, W.; Miller, W.; Myers, E.W.; Lipman, D.J. Basic local alignment search tool. J. Mol. Biol. 1990, 215, 403–410. [Google Scholar] [CrossRef]
  32. Thompson, J.D.; Higgins, D.G.; Gibson, T.J. Clustal W: Improving the sensitivity of progressive multiple sequence alignment through sequence weighting, position-specific gap penalties and weight matrix choice. Nucleic Acids Res. 1994, 22, 4673–4680. [Google Scholar] [CrossRef] [Green Version]
  33. Tamura, K.; Stecher, G.; Peterson, D.; Filipski, A.; Kumar, S. MEGA6: Molecular evolutionary genetics analysis version 6.0. Mol. Biol. Evol. 2013, 30, 2725–2729. [Google Scholar] [CrossRef] [Green Version]
  34. Kim, D.H.; Chon, J.W.; Kim, H.; Kim, H.S.; Choi, D.; Hwang, D.G.; Seo, K.H. Detection and enumeration of lactic acid bacteria, acetic acid bacteria and yeast in kefir grain and milk using Quantitative Real Time PCR. J. Food Saf. 2015, 35, 102–107. [Google Scholar] [CrossRef]
  35. Yuan, J.S.; Reed, A.; Chen, F.; Stewart, C.N. Statistical analysis of real-time PCR data. BMC Bioinform. 2006, 7, 85. [Google Scholar] [CrossRef] [Green Version]
  36. Ale, E.C.; Batistela, V.A.; Correa Olivar, G.; Ferrado, J.B.; Sadiq, S.; Ahmed, H.I.; Reinheimer, J.A.; Vera-Candioti, L.; Laws, A.P.; Binetti, A.G. Statistical optimisation of the exopolysaccharide production by Lactobacillus fermentum Lf2 and analysis of its chemical composition. Int. J. Dairy Technol. 2020, 73, 76–87. [Google Scholar] [CrossRef]
  37. Othman, N.Z.; Din, A.R.J.M.; Azam, Z.M.; Rosli, M.A.; Sarmidi, M.R. Statistical optimization of medium compositions for high cell mass and exopolysaccharide production by Lactobacillus plantarum ATCC 8014. Appl. Food Biotechnol. 2018, 5, 87–96. [Google Scholar]
  38. Dubois, M.; Gilles, K.A.; Hamilton, J.K.; Rebers, P.T.; Smith, F. Colorimetric method for determination of sugars and related substances. Anal. Chem. 1956, 28, 350–356. [Google Scholar] [CrossRef]
  39. Classics Lowry, O.; Rosebrough, N.; Farr, A.; Randall, R. Protein measurement with the Folin phenol reagent. J. Biol Chem. 1951, 193, 265–275. [Google Scholar] [CrossRef]
  40. Allaith, S.A. Genotyping and hemolytic characterization of pathogenic bacteria from some raw and cooked foods. Iraqi J. Agric. Sci. 2018, 49, 5. [Google Scholar]
  41. Balcázar, J.L.; De Blas, I.; Ruiz-Zarzuela, I.; Vendrell, D.; Girones, O.; Muzquiz, J.L. Sequencing of variable regions of the 16S rRNA gene for identification of lactic acid bacteria isolated from the intestinal microbiota of healthy salmonids. Comp. Immunol. Microbiol. Infect. Dis. 2007, 30, 111–118. [Google Scholar] [CrossRef]
  42. Stackebrandt, E.; Fowler, V.J.; Woese, C.R. A phylogenetic analysis of lactobacilli, Pediococcus pentosaceus and Leuconostoc mesenteroides. Syst. Appl. Microbiol. 1983, 4, 326–337. [Google Scholar] [CrossRef]
  43. Goh, Y.J.; Klaenhammer, T.R. Functional roles of aggregation promoting like factor in stress tolerance and adherence of Lactobacillus acidophilus NCFM. Appl. Environ. Microbiol. 2010, 76, 5005–5012. [Google Scholar] [CrossRef] [Green Version]
  44. Llamas-Arriba, M.G.; Pérez-Ramos, A.; Puertas, A.I.; López, P.; Dueñas, M.T.; Prieto, A. Characterization of Pediococcus ethanolidurans CUPV141: A β-D-glucan-and heteropolysaccharide-producing bacterium. Front. Microbiol. 2018, 9, 2041. [Google Scholar] [CrossRef]
  45. Tajabadi, N.; Mardan, M.; Saari, N.; Mustafa, S.; Bahreini, R.; Manap, M.Y.A. Identification of Lactobacillus plantarum, Lactobacillus pentosus and Lactobillus fermentumfrom honey stomach of honeybee. Braz. J. Microbiol. 2013, 44, 717–722. [Google Scholar] [CrossRef] [PubMed] [Green Version]
  46. Humblot, C.; Guyot, J.P. Pyrosequencing of tagged 16S rRNA gene amplicons for rapid deciphering of the microbiomes of fermented foods such as pearl millet slurries. Appl. Environ. Microbiol. 2009, 75, 4354–4361. [Google Scholar] [CrossRef] [PubMed] [Green Version]
  47. Xia, X. Bioinformatics and the Cell: Modern Computational Approaches in Genomics, Proteomics and Transcriptomics, 2nd ed.; Springer International Publishing: Berlin/Heidelberg, Germany, 2018; pp. 1–489. [Google Scholar] [CrossRef]
  48. Wasfi, R.; Ola, A.A.; Mai, M.Z.; Hossam, M.A. Probiotic Lactobacillus sp. inhibit growth, biofilm formation and gene expression of caries inducing Streptococcus mutans. J. Cell. Mol. Med. 2018, 22, 1972–1983. [Google Scholar] [CrossRef] [PubMed] [Green Version]
  49. Lim, S.M.; Lee, N.K.; Paik, H.D. Antibacterial and anticavity activity of probiotic Lactobacillus plantarum 200661 isolated from fermented foods against Streptococcus mutans. LWT 2020, 118, 108840. [Google Scholar] [CrossRef]
  50. Ispirli, H.; Dertli, E. Isolation and characterisation of lactic acid bacteria from traditional koumiss and kurut. Int. J. Food Prop. 2017, 20, S2441–S2449. [Google Scholar] [CrossRef] [Green Version]
  51. Bancalari, E.; D’Incecco, P.; Sardaro, M.L.S.; Neviani, E.; Pellegrino, L.; Gatti, M. Impedance microbiology to speed up the screening of lactic acid bacteria exopolysaccharide production. Int. J. Food Microbiol. 2019, 306, 108268. [Google Scholar] [CrossRef]
  52. Zeidan, A.A.; Poulsen, V.K.; Janzen, T.; Buldo, P.; Derkx, P.M.; Øregaard, G.; Neves, A.R. Polysaccharide production by lactic acid bacteria: From genes to industrial applications. Fems. Microbiol. Rev. 2017, 41, 168–200. [Google Scholar] [CrossRef] [Green Version]
  53. Leo, F.; Hashida, S.; Kumagai, D.; Uchida, K.; Motoshima, H.; Arai, I.; Asakuma, S.; Fukuda, K.; Urashima, T. Studies on a neutral exopolysaccharide of Lactobacillus fermentum TDS030603. J. Appl. Glycosci. 2007, 54, 223–229. [Google Scholar] [CrossRef] [Green Version]
  54. Fukuda, K.; Shi, T.; Nagami, K.; Leo, F.; Nakamura, T.; Yasuda, K.; Senda, A.; Motoshima, H.; Urashima, T. Effects of carbohydrate source on physicochemical properties of the exopolysaccharide produced by Lactobacillus fermentum TDS030603 in a chemically defined medium. Carbohydr. Polym. 2010, 79, 1040–1045. [Google Scholar] [CrossRef]
  55. De Albuquerque, T.M.R.; Garcia, E.F.; de Oliveira Araújo, A.; Magnani, M.; Saarela, M.; de Souza, E.L. In vitro characterization of Lactobacillus strains isolated from fruit processing by-products as potential probiotics. Probiotics Antimicrob. Proteins. 2018, 10, 704–716. [Google Scholar] [CrossRef]
  56. Notararigo, S.; Nácher-Vázquez, M.; Ibarburu, I.; Werning, M.L.; de Palencia, P.F.; Dueñas, M.T.; Aznar, R.; López, P.; Prieto, A. Comparative analysis of production and purification of homo-and hetero-polysaccharides produced by lactic acid bacteria. Carbohydr. Polym. 2013, 93, 57–64. [Google Scholar] [CrossRef] [Green Version]
  57. Luyen, T.T.A.; Thuy, D.B.T.; Thi, T.T.V.; Huyen, P.T.T. Study on the biosynthesis and structure characterization of exopolysaccharide from Lactobacillus fermentum MC3. Hue Uni. J. Sci. Nat. Sci. 2018, 127, 13. [Google Scholar] [CrossRef] [Green Version]
  58. Ale, E.C.; Rojas, M.F.; Reinheimer, J.A.; Binetti, A.G. Lactobacillus fermentum: Could EPS production ability be responsible for functional properties? Food Microbiol. 2020, 90, 103465. [Google Scholar] [CrossRef]
  59. Polak-Berecka, M.; Waśko, A.D.A.M.; Kubik-Komar, A. Optimization of culture conditions for exopolysaccharide production by a probiotic strain of Lactobacillus rhamnosus E/N. Pol. J. Microbiol. 2014, 63, 253. [Google Scholar] [CrossRef]
  60. Oleksy-Sobczak, M.; Klewicka, E. Optimization of media composition to maximize the yield of exopolysaccharides production by Lactobacillus rhamnosus strains. Probiotics Antimicrob. Proteins 2020, 12, 774–783. [Google Scholar] [CrossRef] [Green Version]
  61. Li, Y.; Liu, Y.; Cao, C.; Zhu, X.; Wang, C.; Wu, R.; Wu, J. Extraction and biological activity of exopolysaccharide produced by Leuconostoc mesenteroides SN-8. Int. J. Biol. Macromol. 2020, 157, 36–44. [Google Scholar] [CrossRef]
  62. Van der Meulen, R.; Grosu-Tudor, S.; Mozzi, F.; Vaningelgem, F.; Zamfir, M.; de Valdez, G.F.; De Vuyst, L. Screening of lactic acid bacteria isolates from dairy and cereal products for exopolysaccharide production and genes involved. Int. J. Food Microbiol. 2007, 118, 250–258. [Google Scholar] [CrossRef]
  63. Leroy, F.; De Vuyst, L. Advances in production and simplified methods for recovery and quantification of exopolysaccharides for applications in food and health. J. Dairy Sci. 2016, 99, 3229–3238. [Google Scholar] [CrossRef] [Green Version]
  64. Padmanabhan, A.; Tong, Y.; Wu, Q.; Zhang, J.; Shah, N.P. Transcriptomic insights into the growth phase- and sugarassociated changes in the exopolysaccharide production of a high eps-producing Streptococcus thermophilus ASCC 1275. Front. Microbiol. 2018, 9, 1919. [Google Scholar] [CrossRef]
  65. Tukenmez, U.; Aktas, B.; Aslim, B.; Yavuz, S. The relationship between the structural characteristics of lactobacilli-eps and its ability to induce apoptosis in colon cancer cells in vitro. Sci. Rep. 2019, 9, 8268. [Google Scholar] [CrossRef] [Green Version]
  66. Nachtigall, C.; Surber, G.; Herbi, F.; Wefers, D.; Jaros, D.; Rohm, H. Production and Molecular Structure of Heteropolysaccharides from Two Lactic Acid Bacteria. Carbohydr. Polym. 2020, 236, 116019. [Google Scholar] [CrossRef]
  67. Imran, M.Y.M.; Reehana, N.; Jayaraj, K.A.; Ahamed, A.A.P.; Dhanasekaran, D.; Thajuddin, N.; Alharbi, N.S.; Muralitharan, G. Statistical optimization of exopolysaccharide production by Lactobacillus plantarum NTMI05 and NTMI20. Int. J. Biol. Macromol. 2016, 93, 731–745. [Google Scholar] [CrossRef]
  68. Vitlic, A.; Sadiq, S.; Ahmed, H.I.; Ale, E.C.; Binetti, A.G.; Collett, A.; Humpreys, P.N.; Laws, A.P. Isolation and characterization of a high molecular mass β-glucan from Lactobacillus fermentum Lf2 and evaluation of its immunomodulatory activity. Carbohydr. Res. 2019, 476, 44–52. [Google Scholar] [CrossRef] [Green Version]
  69. Ruas-Madiedo, P.; De Los Reyes-Gavilán, C.G. Invited Review: Methods for the Screening, Isolation, and Characterization of Exopolysaccharides Produced by Lactic Acid Bacteria. J. Dairy Sci. 2005, 88, 843–856. [Google Scholar] [CrossRef] [Green Version]
Figure 1. Gel electrophoresis of four bacterial isolates (16S rRNA amplicon) from fermented boza and cider treatments including (L) marker, (P) Positive control Lactobacillus plantarum, (N) Negative control (1: boza A3; 2: fermented cider, fridge (B6); 3: fermented cider, ambient (C9); 4: unfermented cider (D6).
Fermentation 08 00350 g001
Figure 2. Gel electrophoresis of four bacterial isolates (gtf gene amplicons) from fermented boza and cider treatments including (L) marker, (P) Positive control Lactobacillus plantarum, (N) Negative control, (1: boza A3; 2: fermented cider, fridge (B6); 3: fermented cider, ambient (C9); 4: unfermented cider (D6).
Fermentation 08 00350 g002
Figure 3. Unrooted phylogenetic tree of 16S rDNA gene sequences of the genera Limosilactobacillus and Leuconostoc isolate from boza and cider (1: boza A3 (MW897961_L._fermentum_SH1); 2: Fermented cider, fridge B6 (MW897962_L._fermentum_SH2); 3: Fermented cider, ambient C9 (MW897963_L._ fermentum_SH3); 4: Unfermented cider D6 (MW897983_L._mesenteroides_SH4)). All selected isolates were labeled with a circle ( for SH1, SH2, SH3; for SH4).
Fermentation 08 00350 g003
Figure 4. 16S rRNA degree of similarity to the NCBI database for the isolated bacterium indicated with numerals and symbols 7 (SH1), 8 (SH2), 9 (SH3), and 13 (SH4).
Fermentation 08 00350 g004
Figure 5. The gene expression on the RNA of the different treatments LGG (control), A3, B6, C9, D6 which were expressed as dissociation curves and calculation data for (Δ Ct, and ΔΔCt) using target genes involving (a) LAB 16S rRNA (control), and (b) glucan synthase gtf gene.
Fermentation 08 00350 g005
Figure 6. HPLC analysis of the β-glucan composition of A3, B6, C9, D6 isolates as well as standard (β-glucan) and control strain (LGG).
Fermentation 08 00350 g006aFermentation 08 00350 g006b
Table 1. Alignment of partial 16S rRNA sequencing of LAB under consideration with the sequence of NCBI database.
ID
Sequence
Accession NumberPutative
Strain
TOP Hit
Blast N
Food SourceSimilarity (%)e-ValueRange
SH1MW897961L. fermentumL. fermentum 222Boza (A3)100%0.01–1458
SH2MW897962L. fermentumL. fermentum 222Fermented cider, fridge (B6)99.8%0.01–1458
SH3MW897963L. fermentumL. fermentum 222Fermented cider, ambient (C9)100%0.01–1458
SH4MW897983L. mesenteroidesL. mesenteroides A16–17Unfermented cider (D6)100%0.01–1447
Table 2. The variation of gene expression on the RNA of the different treatments (LGG control, A3, B6, C9, D6), which were expressed as the fold change in expression levels of the target genes.
SpeciesGp IDReplicate No.LAB 16S rRNA Genegtf GeneFold Change in Expression Levels of Genes
CtCtFold Change
L. rhamnosus LGGControl119.4620.511.0001 ± 0.000 d
219.4020.49
319.2720.38
Mean19.3820.46
L. fermentum SH1A3119.1717.228.16818.6139 ± 0.320 c
220.2818.248.6939
320.3918.309.0005
Mean19.9517.928.6139
L. fermentum SH2B6120.7217.9114.825414.7230 ± 0.070 a
219.9217.0915.0324
321.1318.3714.3204
Mean20.5917.7914.7230
L. fermentum SH3C9120.2218.009.849210.1730 ± 0.231 b
221.6619.3710.3388
321.9019.6110.3388
Mean21.2618.9910.1730
L. mesenteroides SH4D6121.0522.260.91380.8566 ± 0.040 d
221.3122.630.8467
320.7422.120.8123
Mean21.0322.340.8566
Gp ID: it refers to group identification; a, b, c, and d: small letters refer to significant differences (p < 0.05) between the means.
Table 3. The screening of LAB isolates to produce β-glucans under different parameters using LGG as a control.
Type of LABEPS mg/100 mLCell Mass mg/100 mLpHTotal Carbohydrate %Total Protein %β-Glucans %
LGG199.7 ± 3.51 c33.33 ± 1.53 c4.1 ± 0.6 b9.61 ± 0.05 e180.92 ± 0.03 b0.31 ± 0.01 c
A3199.5 ± 1.80 c225 ± 5.0 a5.0 ± 0.1 a99.17 ± 0.11 c98.31 ± 0.02 d0.12 ± 0.008 e
B6481 ± 1.00 a116.33 ± 1.53 b4.2 ± 0.3 b301.48 ± 0.20 a150.60 ± 0.02 c5.56 ± 0.01 a
C9440 ± 2.00 b41.7 ± 1.53 c5.0 ± 0.5 a74.77 ± 0.03 d328.00 ± 2.00 a4.46 ± 0.01 b
D6161 ± 2.65 d12.33 ± 1.53 d5.1 ± 0.2a103.72 ± 0.28 b50.24 ± 0.04 e0.25 ± 0.008 d
EPS: exopolysaccharides; LGG: L. rhamnosus; A3: L. fermentum SH1; B6: L. fermentum SH2; C9: L. fermentum SH3; D6: L. mesenteroides SH4; a, b, c, d and e: small letters refer to significant differences (p < 0.05)between the means.
Publisher’s Note: MDPI stays neutral with regard to jurisdictional claims in published maps and institutional affiliations.

