Article

Colaconema formosanum, Sarcodia suae, and Nostoc commune as Fermentation Substrates for Bioactive Substance Production

1
Department of Aquaculture, National Taiwan Ocean University, Keelung City 20224, Taiwan
2
Center of Excellence for the Oceans, National Taiwan Ocean University, Keelung City 20224, Taiwan
3
Center of Excellence for Ocean Engineering, National Taiwan Ocean University, Keelung City 20224, Taiwan
*
Author to whom correspondence should be addressed.
Fermentation 2022, 8(7), 343; https://doi.org/10.3390/fermentation8070343
Submission received: 29 May 2022 / Revised: 15 July 2022 / Accepted: 19 July 2022 / Published: 21 July 2022
(This article belongs to the Special Issue Pigment Production in Submerged Fermentation)

Abstract

:
Bioactive compounds extracted from natural renewable sources have attracted an increased interest from both industry and academia. Recently, algae have been highlighted as promising sources of bioactive compounds, such as polyphenols, polysaccharides, fatty acids, proteins, and pigments, which can be used as functional ingredients in many industrial applications. Therefore, a simple green extraction and purification methodology capable of recovering biocompounds from algal biomass is of extreme importance in commercial production. In this study, we evaluated the application of three valuable algae (Colaconema formosanum, Sarcodia suae, and Nostoc commune) in combination with Pseudoalteromonas haloplanktis (type strain ATCC 14393) for the production of versatile compounds. The results illustrate that after 6 h of first-stage fermentation, the production of phycobiliproteins in C. formosanum was significantly increased by 156.2%, 188.9%, and 254.17% for PE, PC, and APC, respectively. This indicates that the production of phycobiliproteins from algae can be enhanced by P. haloplanktis. Furthermore, we discovered that after S. suae and N. commune were fermented with P. haloplanktis, mannose was produced. In this study, we describe a feasible biorefinery process for the production of phycobiliproteins and mannose by fermenting marine macroalgae with cyanobacteria. We believe it is worth establishing a scale-up technique by applying this fermentation method to the production of phycobiliproteins and mannose in the future.

1. Introduction

In response to the increasing requirement for non-toxic and environmentally friendly products, algae have been considered and are recommended as a good source of naturally derived compounds because they contain multiple bioactive components, such as polysaccharides, pigments, fatty acids, polyphenols, and peptides, which can be used for functional food and in nutraceutical fields [1]. Notably, the cell wall of algae is constituted by complicated cellulosic compounds, and their compositions differ depending on species, e.g., green algae mainly consist of cellulose, pectins, xyloglucans, xylans, extensins, and lignins [2], whereas red algae consist of cellulose, mannans, xylans, sulfated polysaccharides, and lignins [3], and the brown algae produce fucose-containing polysaccharides [4,5].
The diversity in the structure and rigidity of algal cell walls blocks the development of cell disruption for downstream processing. Traditionally, physical high-pressure and chemical solvent extraction methods are used to extract biologically active compounds, for instance, solvent systems, sonication, ultrasound, microwave, enzymatic, super-critical fluid, and subcritical water. However, most of the abovementioned methods are associated with high energy cost and are environmentally unfriendly. Specifically, the main goal of extraction techniques is to achieve a high yield of desired compounds, although it is also desirable to preserve coproducts, minimize energy consumption, investigate recycling methods to minimize waste generation, optimize the process, and increase the production scale [6].
A promising strategy for overcoming the impediment of algal cell walls involves a series of processes called consolidated bioprocessing, which includes lysis enzymes, hydrolysis of biomass, and fermentation; then, the manufacturer finally acquires the desired products [7]. As the digestive capacity of working bacteria species used in fermentation is affected by both material (algae) and fermenting conditions, production consumes and outputs various bioactive substances, such as peptides, phenolics or phenolic compounds, and fucoidan.
In brief, fermentation is a metabolic conversion activity achieved by micro-organisms. Previous studies illustrated that multiple potential micro-organism, such as Saccharomyces cerevisiae, Pichia stipitis, Kluyveromyces fragilis, K. marxianus, Escherichia coli, Klebsiella oxytoca, Zymomonas mobilis, and Pseudoalteromonas haloplanktis, have a positive effect on the algal fermentation process [8,9]. Among those, P. haloplanktis is a marine bacterium that can degrade the cell walls of algae by secreting beta-glucosidase and is therefore regarded as an ideal micro-organism to enable consolidated bioprocessing [10].
Notably, a water-soluble protein, phycobiliprotein, is the oldest photosynthetic light-harvesting pigment present in red algae, cyanobacteria, and cryptomonads. This protein has become increasingly important in the research, clinical, pharmaceutical, and aquaculture industries, owing to its multiple functions and efficacy, as described below. First, these proteins have the potential to be used as a natural dye, and a number of investigations have shown that they also have health-promoting properties and a broad range of pharmaceutical applications [11]. Phycobiliproteins are widely used in clinical and immunological research laboratories as probes in fluorescence flow cytometry, fluorescence microscopy, and fluorescence immunoassays [12]. Hence, it is valuable to develop an efficient and ecofriendly way to mass produce phycobiliprotein.
To improve the extraction efficiency of bioactive compounds, the objective of this study was to determine the optimal microbial fermented conditions to extract protein and polysaccharides contained marine algae. We used the bacteria Pseudo-alteromonas haloplanktis (type strain ATCC 14393) to ferment three algae (Colaconema formosanum, Sarcodia suae, and Nostoc commune) to obtain the valuable pigments and polysaccharides.

2. Materials and Methods

2.1. Algae and Bacterial Strain

The marine macroalgae C. formosanum and S. suae used in the experiment were collected on the Pingtung County coast, southwest Taiwan (January 2017), and cultured in fiberglass tanks in a greenhouse for two years to ensure similar conditions for all samples to avoid any biases. N. communes were collected from Pingtung, South Taiwan, in March 2018. Fresh seaweed was washed twice with seawater and distilled water to remove any visible surface contaminants. The biomass was harvested, washed with seawater, drained with a spinner, and stored at −20 °C until use. This biomass, defined as the wet weight, was used for fermentation. The strain of bacteria used in this fermentation was P. haloplanktis (type strain ATCC 14393), which was purchased from the Bioresource Collection Research Center (BCRC), Food Industry Research and Development Institute (Hsinchu, Taiwan). Before experiments, P. haloplanktis was cultured in Marine Broth 2216 medium (Difco Laboratories, Detroit MI, USA) with a shaking speed of 240 rpm at 22 °C for 12 h to reach the log phase of the strain. (The growth curve of bacteria stain P. haloplanktis ATCC 14393 used in this study can be found in Appendix A). Before experiments, the algal samples were cultured in vessels with sterile media and a clean growth chamber. During cultivation, pollution by other algae or bacteria did not occur due to sterilization and because the algae were fermented in a fresh situation. For the process, we hypothesized that the main fermentation reaction would be contributed by the bacteria P. haloplanktis, as it is the dominant species in the environment. For fermentation, the conditions were adjusted to 22 °C for 0 to 78 h according to experimental design and harvested with 5000× g centrifugation (Allegra X-30R Centrifuge, Beckman counter) for 10 min. The cultural broth was washed out twice with distilled water before application.

2.2. Fermentation of the Three Types of Algae

Fermentation experiments were carried out using shaking incubators under controlled conditions (temperature and shake speed). Fermentation experiments were assigned to the three types of algae. Approximately 37.5 g of milled algae samples (S. suae and N. commune) and an un-milled algae sample (C. formosanum) were mixed with 187.5 mL sterilized sea water. Next, 75 mL precultured P. haloplanktis ATCC 14393 was added to the mixture, which was continuously shaken at 150 rpm and held at 22 °C during the 78 h fermentation. After fermentation, the mixture was centrifuged at 10,000× g for 20 min at 4 °C. The supernatant was collected and used to determine the water-soluble polysaccharide and pigment contents.

2.3. Two-Stage Fermentation

C. formosanum underwent a strong fragmentation using a FastPrep-24 5G (MP Biomedicals, LLC, Santa Ana, CA, USA) under the conditions 4.0 m·s−1 and 5 s for 6 cycles. After fragmentation, the mixture was centrifuged at 10,000× g for 20 min at 4 °C. The supernatant was then collected, and the algal precipitate was used in the subsequent fermentation. For the first phase of fermentation, approximately 30 g of extracted C. formosanum was mixed with 135 mL sterilized sea water. Next, 45 mL precultured P. haloplanktis ATCC 14393 was added to the mixture, which was continuously shaken at 150 rpm and held at 22 °C during the 6 h fermentation. After this first phase of fermentation, the mixture was centrifuged at 10,000× g for 20 min at 4 °C; then, some of the supernatant was collected and used to determine the concentration of phycobiliprotein, chlorophyll a and reducing sugar, and the rest was kept under the same conditions for subsequent fermentation. The second phase of fermentation followed, in which 25 g fermented algae from the first phase was mixed with 112.5 mL sterilized seawater and 37.5 mL P. haloplanktis ATCC 14393. The reaction was allowed to continue at 22 °C for 12, 24, 30, 36, 48, 54, and 60 h. A sufficient amount of fermented product was sampled every 6 h for a fermentation time 24 and 48 h (the important time points for industry utilized) during the second phase of fermentation. Except for the sampled amount of product, the rest was subsequently fermented under the same conditions.

2.4. Determination of Algae Moisture Content

The algae moisture content was determined by heating algae samples using an electronic moisture analyzer (MOC63, Shimadzu, Kyoto, Japan). The results shown by the analyzer were % moisture and weight in g.

2.5. Determination of Phycobiliproteins

Phycobiliprotein samples were evaluated using a spectrophotometer (Ultrospec 8000; Biochrom US, Holliston, MA, USA) to determine phycobiliprotein concentrations. In brief, 1 mL fermentation mix was collected at different time points at 6 h or 12 h intervals over the 72 h fermentation cycle. The mixture was centrifuged at 10,000× g for 20 min at 4 °C; then, the supernatants were collected and used to determine the contents at every check point. The absorbance of the supernatant was taken to determine PE (at 562 nm), PC (at 615 nm), and APC (at 652 nm) concentrations. The calculations of phycobiliprotein concentrations were based on the formulae described by Allen and Lawrence (1973):
PE (mg·mL−1) = [A562 − 2.41(PC) − 0.849(APC)]/9.62
PC (mg·mL−1) = [A615 − 0.474(A652)]/5.34
APC (mg·mL−1) = [A652 − 0.208(A615)]/5.09
PE or PC or APC (mg·g−1) = [(PE1 or PC1 or APC1/total volume)/
total wet weight of algae]
PE or PC or APC extraction yield was expressed as mg·g−1 seaweed wet weight.

2.6. Chlorophyll a Analysis

Chl a concentration was measured by following the methods described by [13]. All algae were extracted by centrifuging samples for 5 min at 3000× g. The absorbance was measured using a spectrophotometer (Ultrospec 8000 UV-Visible spectrophotometer) with selected wavelengths at 750 nm, 664 nm, 647 nm, and 630 nm. The absorbance at 750 nm was subtracted from the other three wavelengths to give the turbidity-corrected value. To calculate the Chl a concentration, the formulae below were used:
Chl a (μg·L−1) = (11.85 × A664) − (1.54 × A647) − (0.08 × A630)
Concentration of Chl a (mg·L−1) = [Chl a × volume of water sample]/volume of sample

2.7. Estimation of the Amount of Reducing Sugar

The method for estimating the reducing sugar was based on [14]. Briefly, each sample was centrifuged at room temperature at 2330× g for 10 min. The clear part of the sample was collected and diluted with distilled deionized water. Then, 0.5 mL of the diluted sample was transferred to a test tube, and 0.5 mL 3,5-dinitrosalicylic acid (DNS) reagent was added. The sample was vortexed and heated to 100 °C for 10 min, then left to cool before 1 mL of distilled deionized water was added. The absorbance was measured at 546 nm against a glucose-reducing sugar standard curve (mg mL−1).

2.8. Purification and Determination of Polysaccharide Composition

Fragmented algal samples and fermented algal samples were centrifuged at 10,000× g for 20 min. The supernatant was recovered and precipitated by the addition of a fourfold volume of 95% (v/v) ethanol. The resulting precipitate was separated by centrifugation, and the crude polysaccharide extract was obtained. The crude polysaccharide extract was dissolved in deionized water and filtered with 0.22 μm pore-size PVDF syringe filters to remove all particulate matter. The crude polysaccharide extract samples were fractionated by high-performance liquid ligand-exchange chromatography (HPLC) on a BP–100 Pb column with an elution flow rate of 0.4 mL min−1 at 80 °C and detected with a refractive index detector using Chrom56 Manager software.

2.9. Determination of Saccharide Components

Matrix-assisted laser desorption ionization time-of-flight (MALDI–TOF) mass spectrometry and NMR spectrometry were used to analyze the monosaccharide and polysaccharide components of fermentation products, following the method described in a previous study [15]. The saccharide component was extracted using a SugarLight (New Taipei City, Taiwan) commercial kit before analysis. The extracted product was labeled with a fluorescent signal before being read by nuclear magnetic resonance (NMR) spectrometry.

2.10. Statistical Analysis

A one-way analysis of variance (ANOVA) was used to compare the means of the collected data. Results are expressed as mean ± standard deviation from experiments conducted in triplicate. Means were tested for significant differences using Duncan’s test as implemented in SAS (SAS, 1999). Differences were considered significant at the p < 0.05 level.

3. Results

3.1. Determination of Moisture Content

To detect the moisture contents, the algae (unfragmented C. formosanum and fragmented S. suae and N. commune) were determined before the fermentation process was initiated. To detect the moisture content, the algae sample was cleaned, redundant water was wiped off before incubation in an oven at 105 ℃ for 24 h. The initial and final weight were recorded as reference to infer the moisture content. The C. formosanum were unfragmented because they were in filamentous form. The algae had similar moisture contents. C. formosanum had a 95.90% moisture level, whereas S. suae and N. commune had moisture levels of 94.76% and 95.55%, respectively.

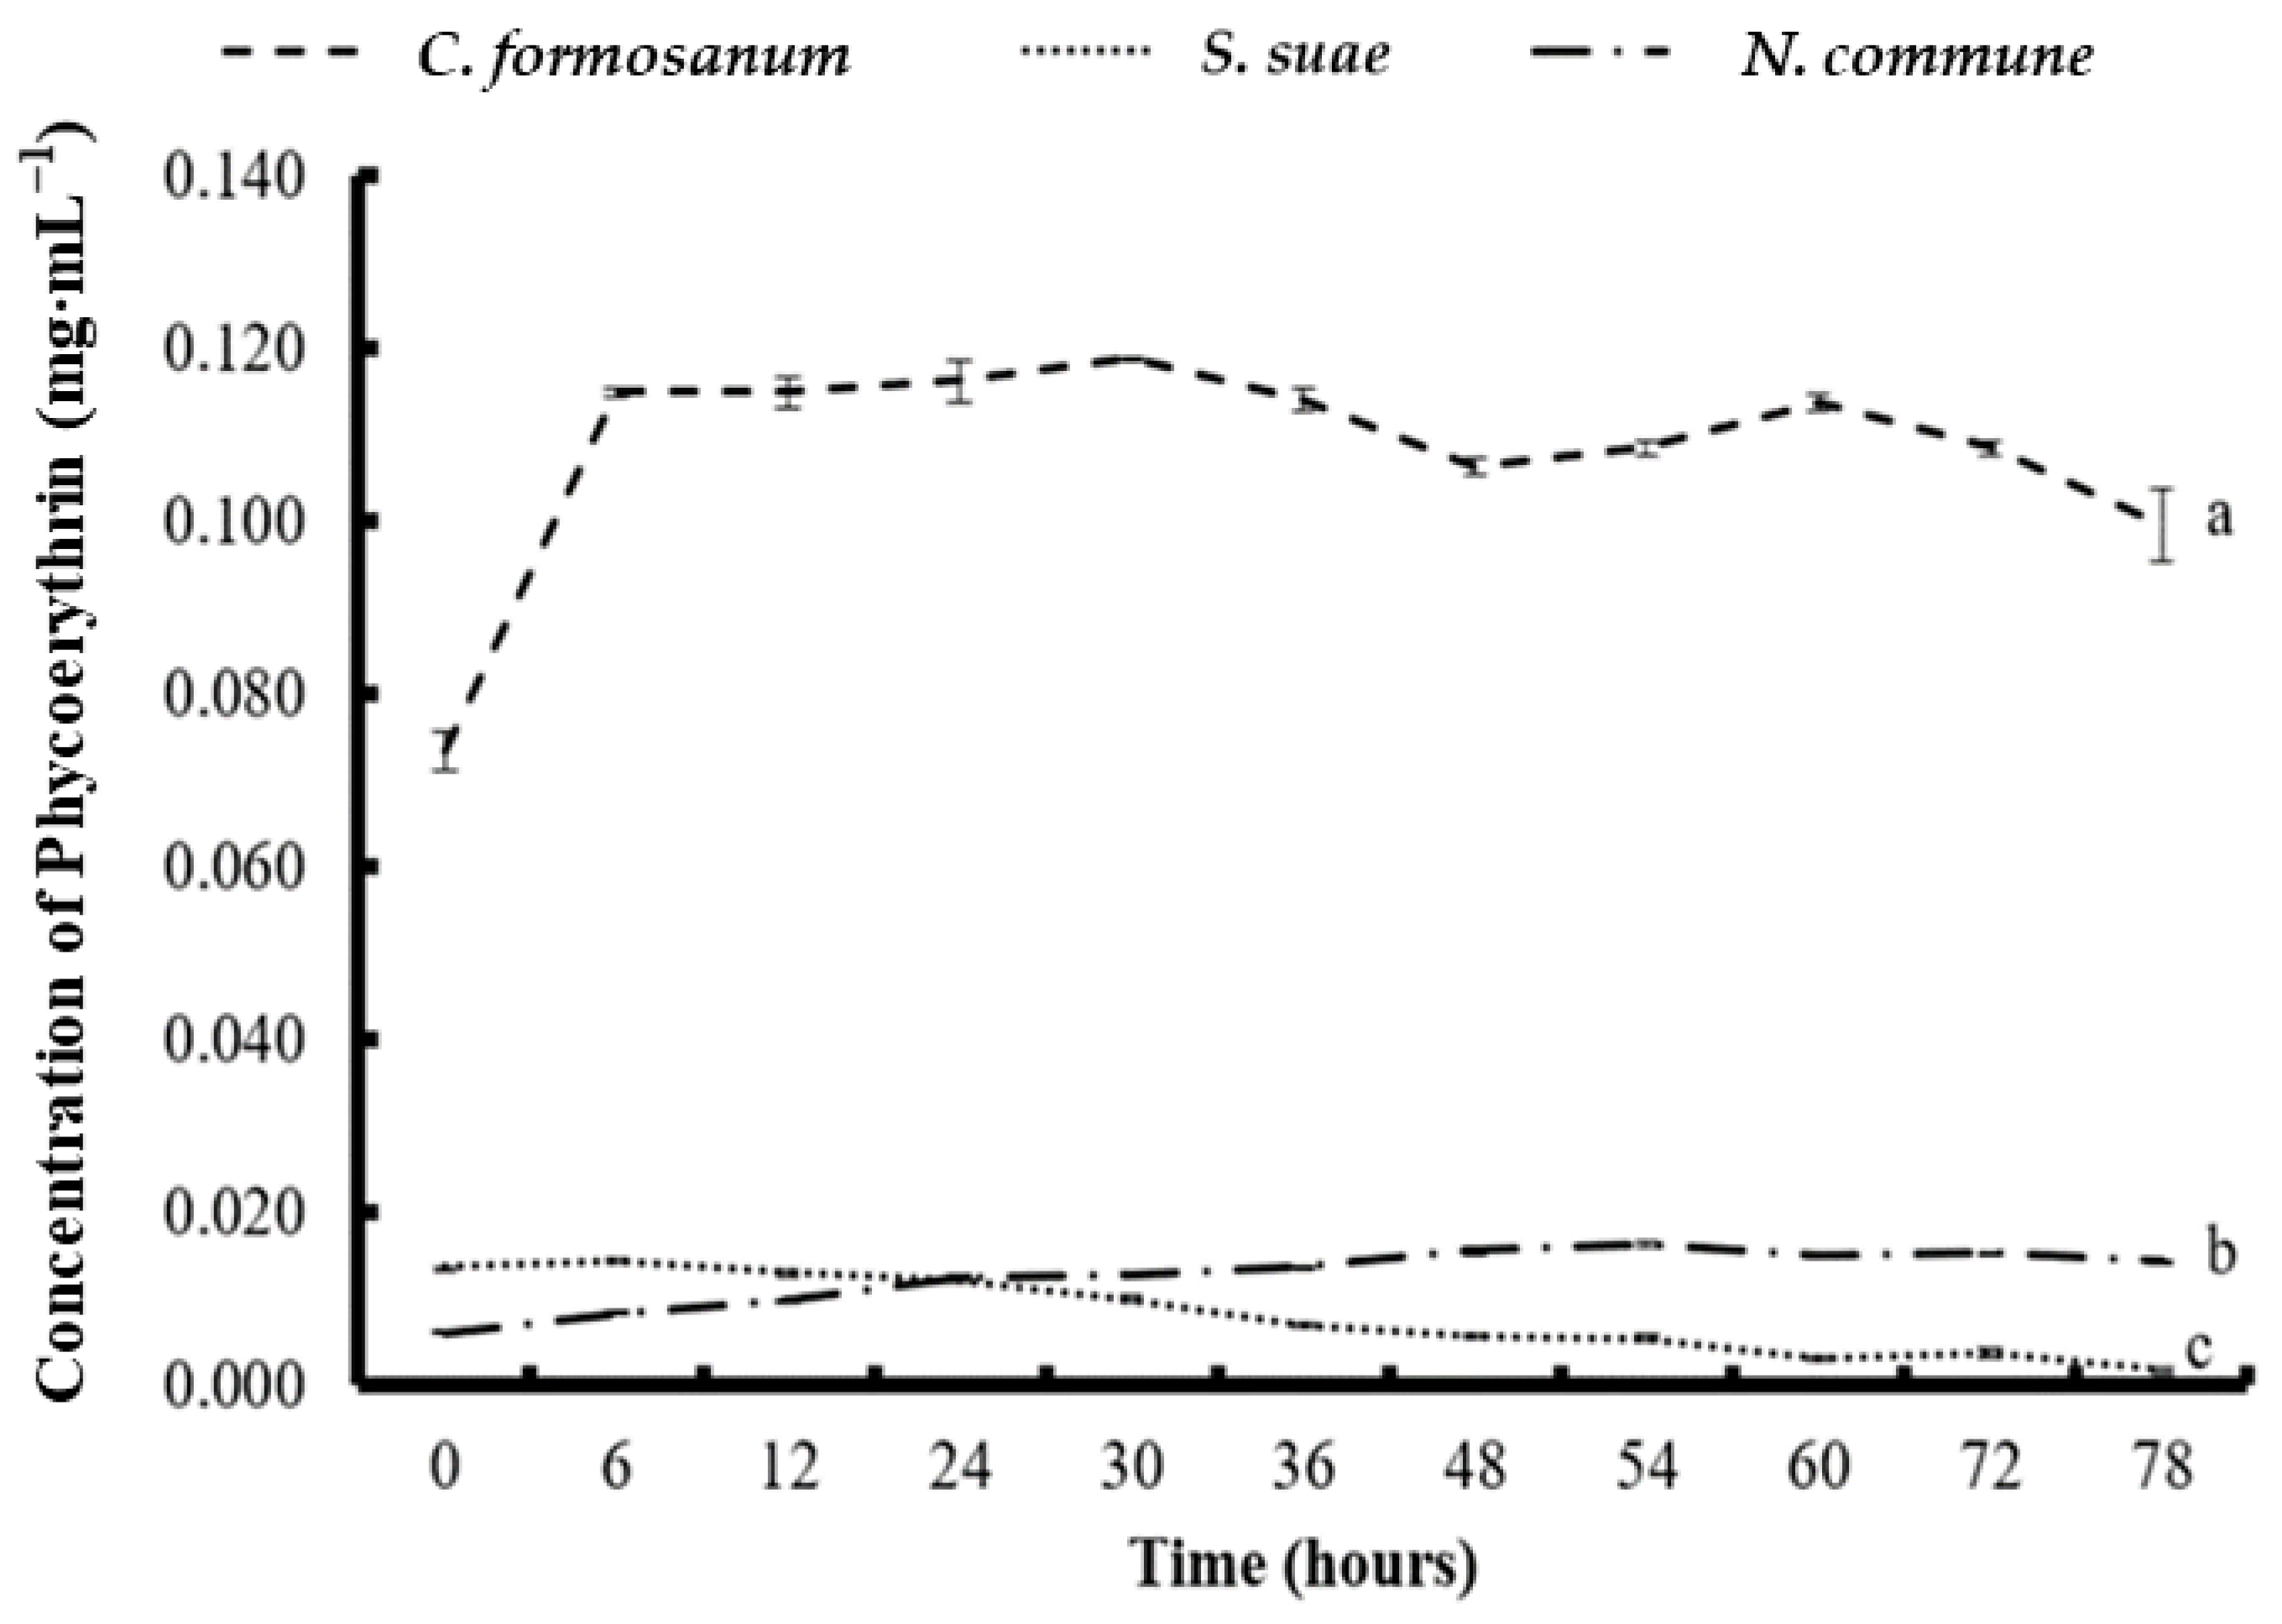
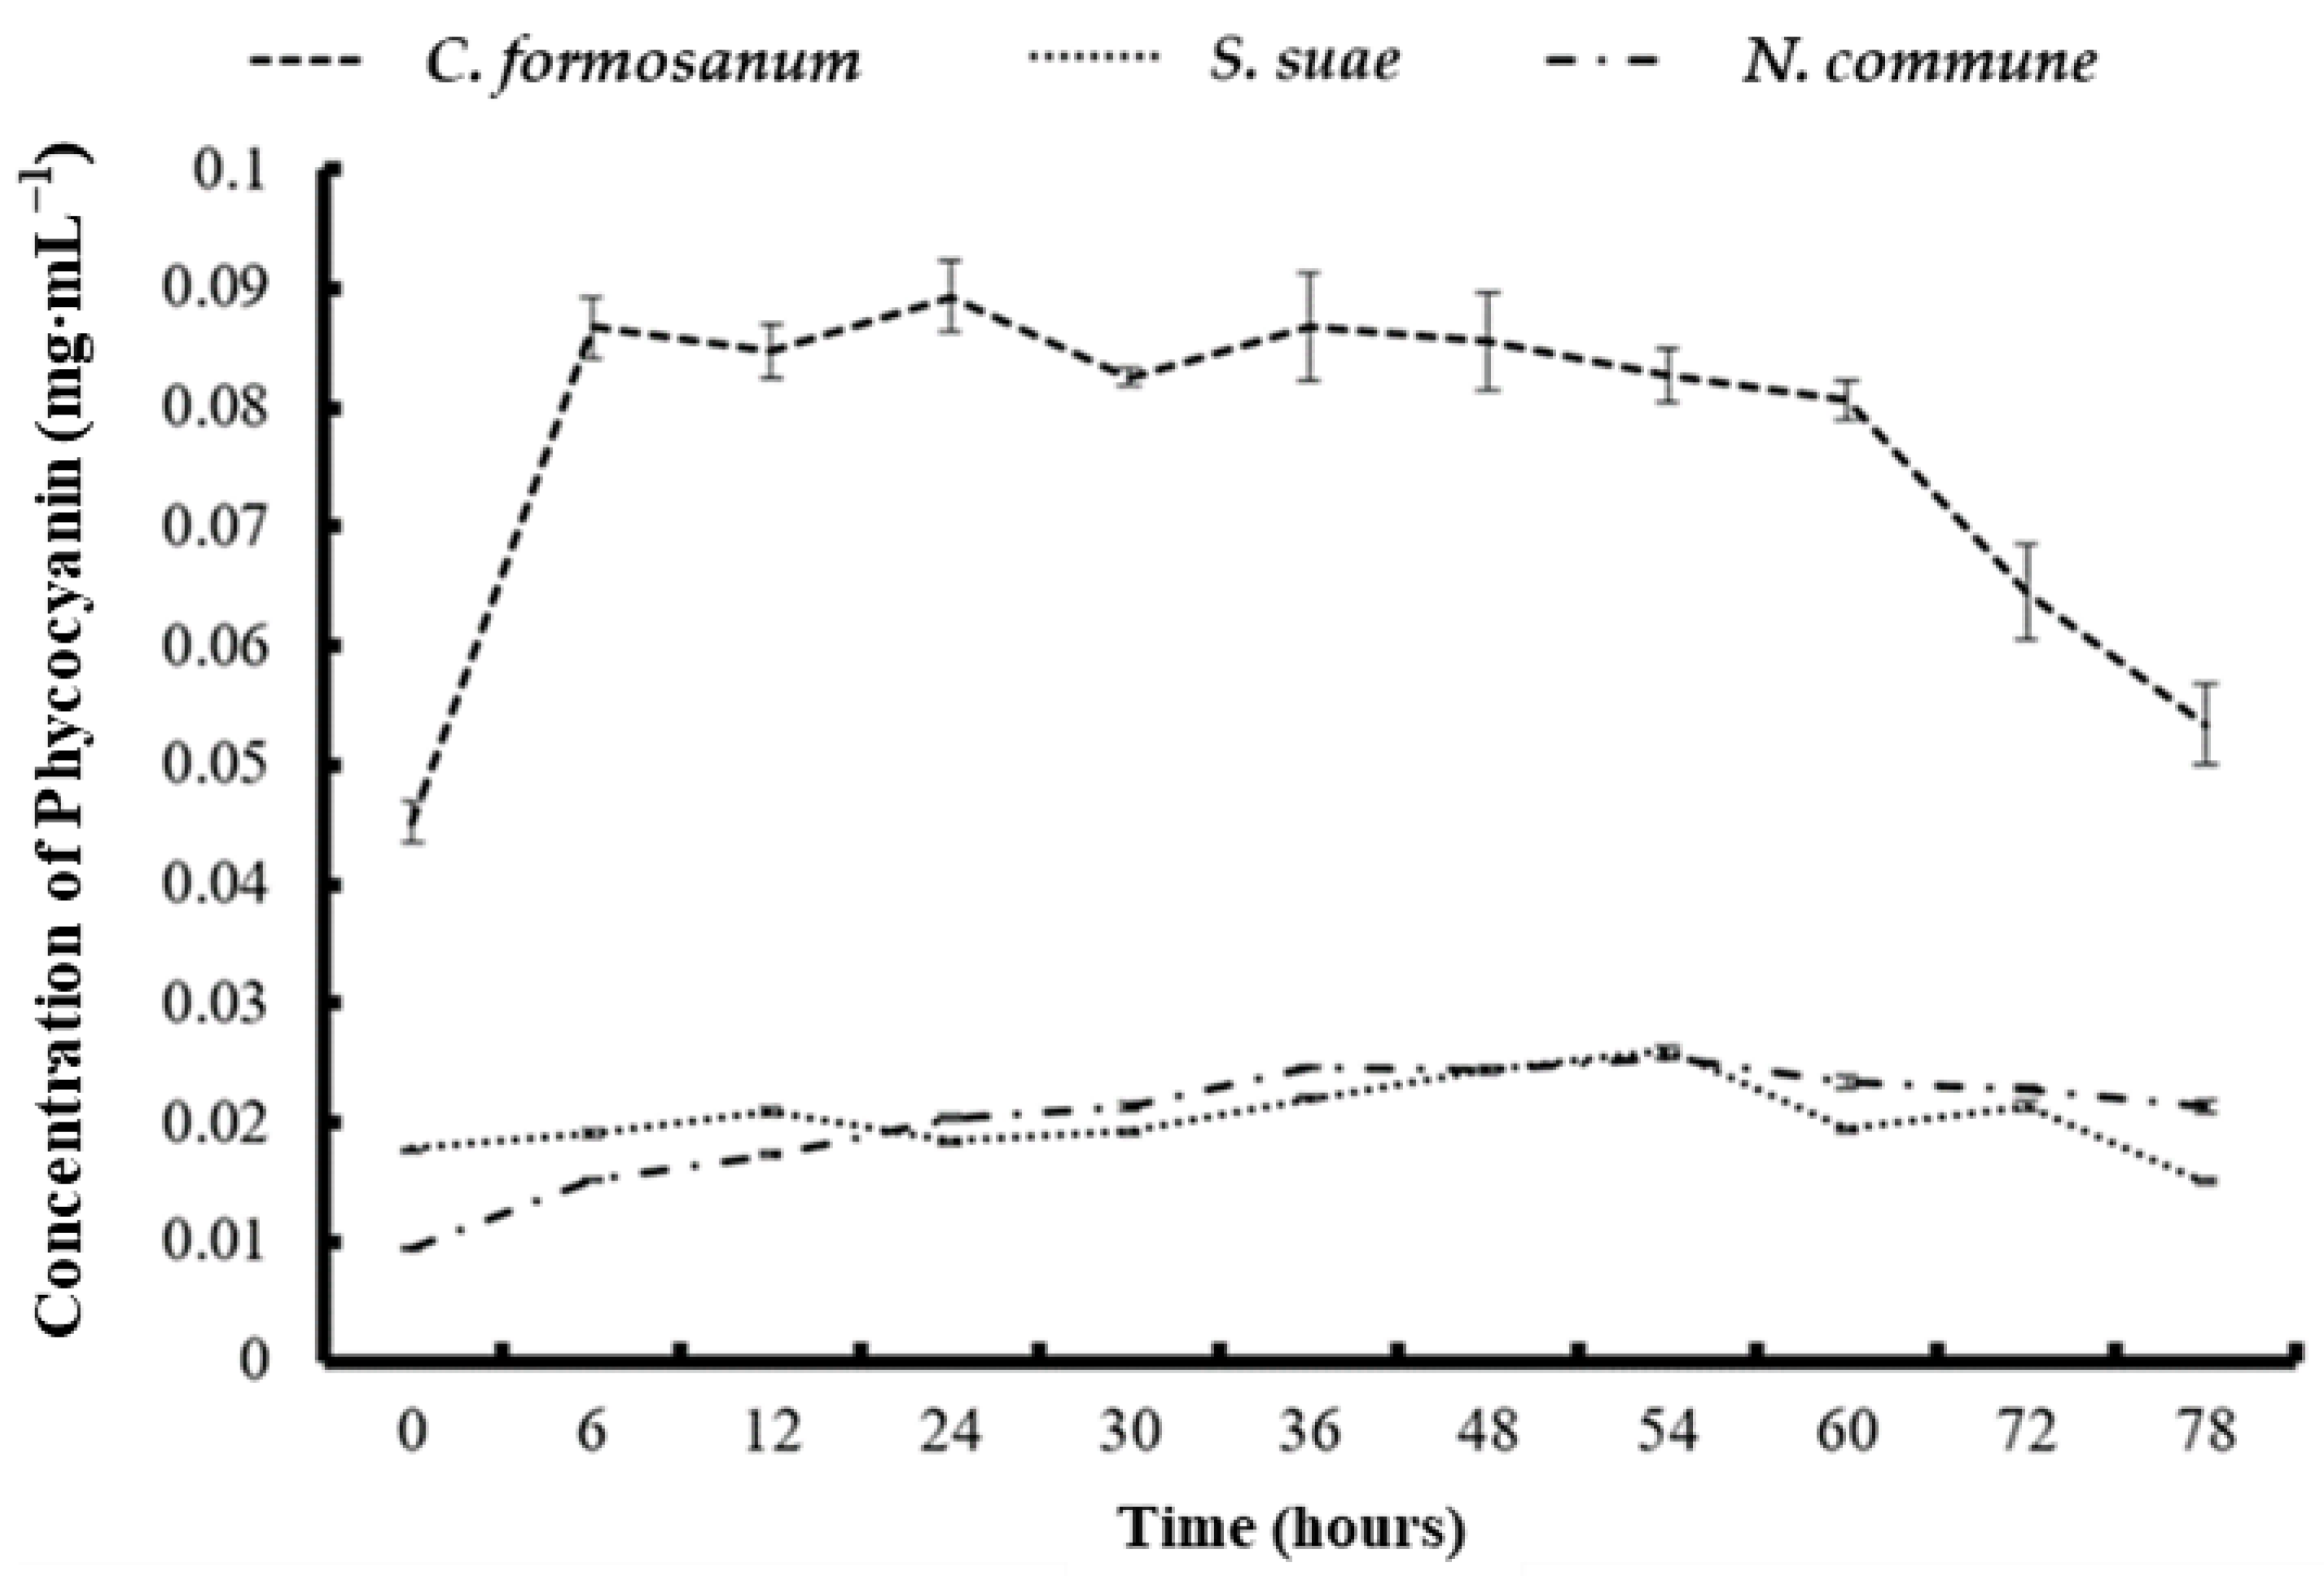
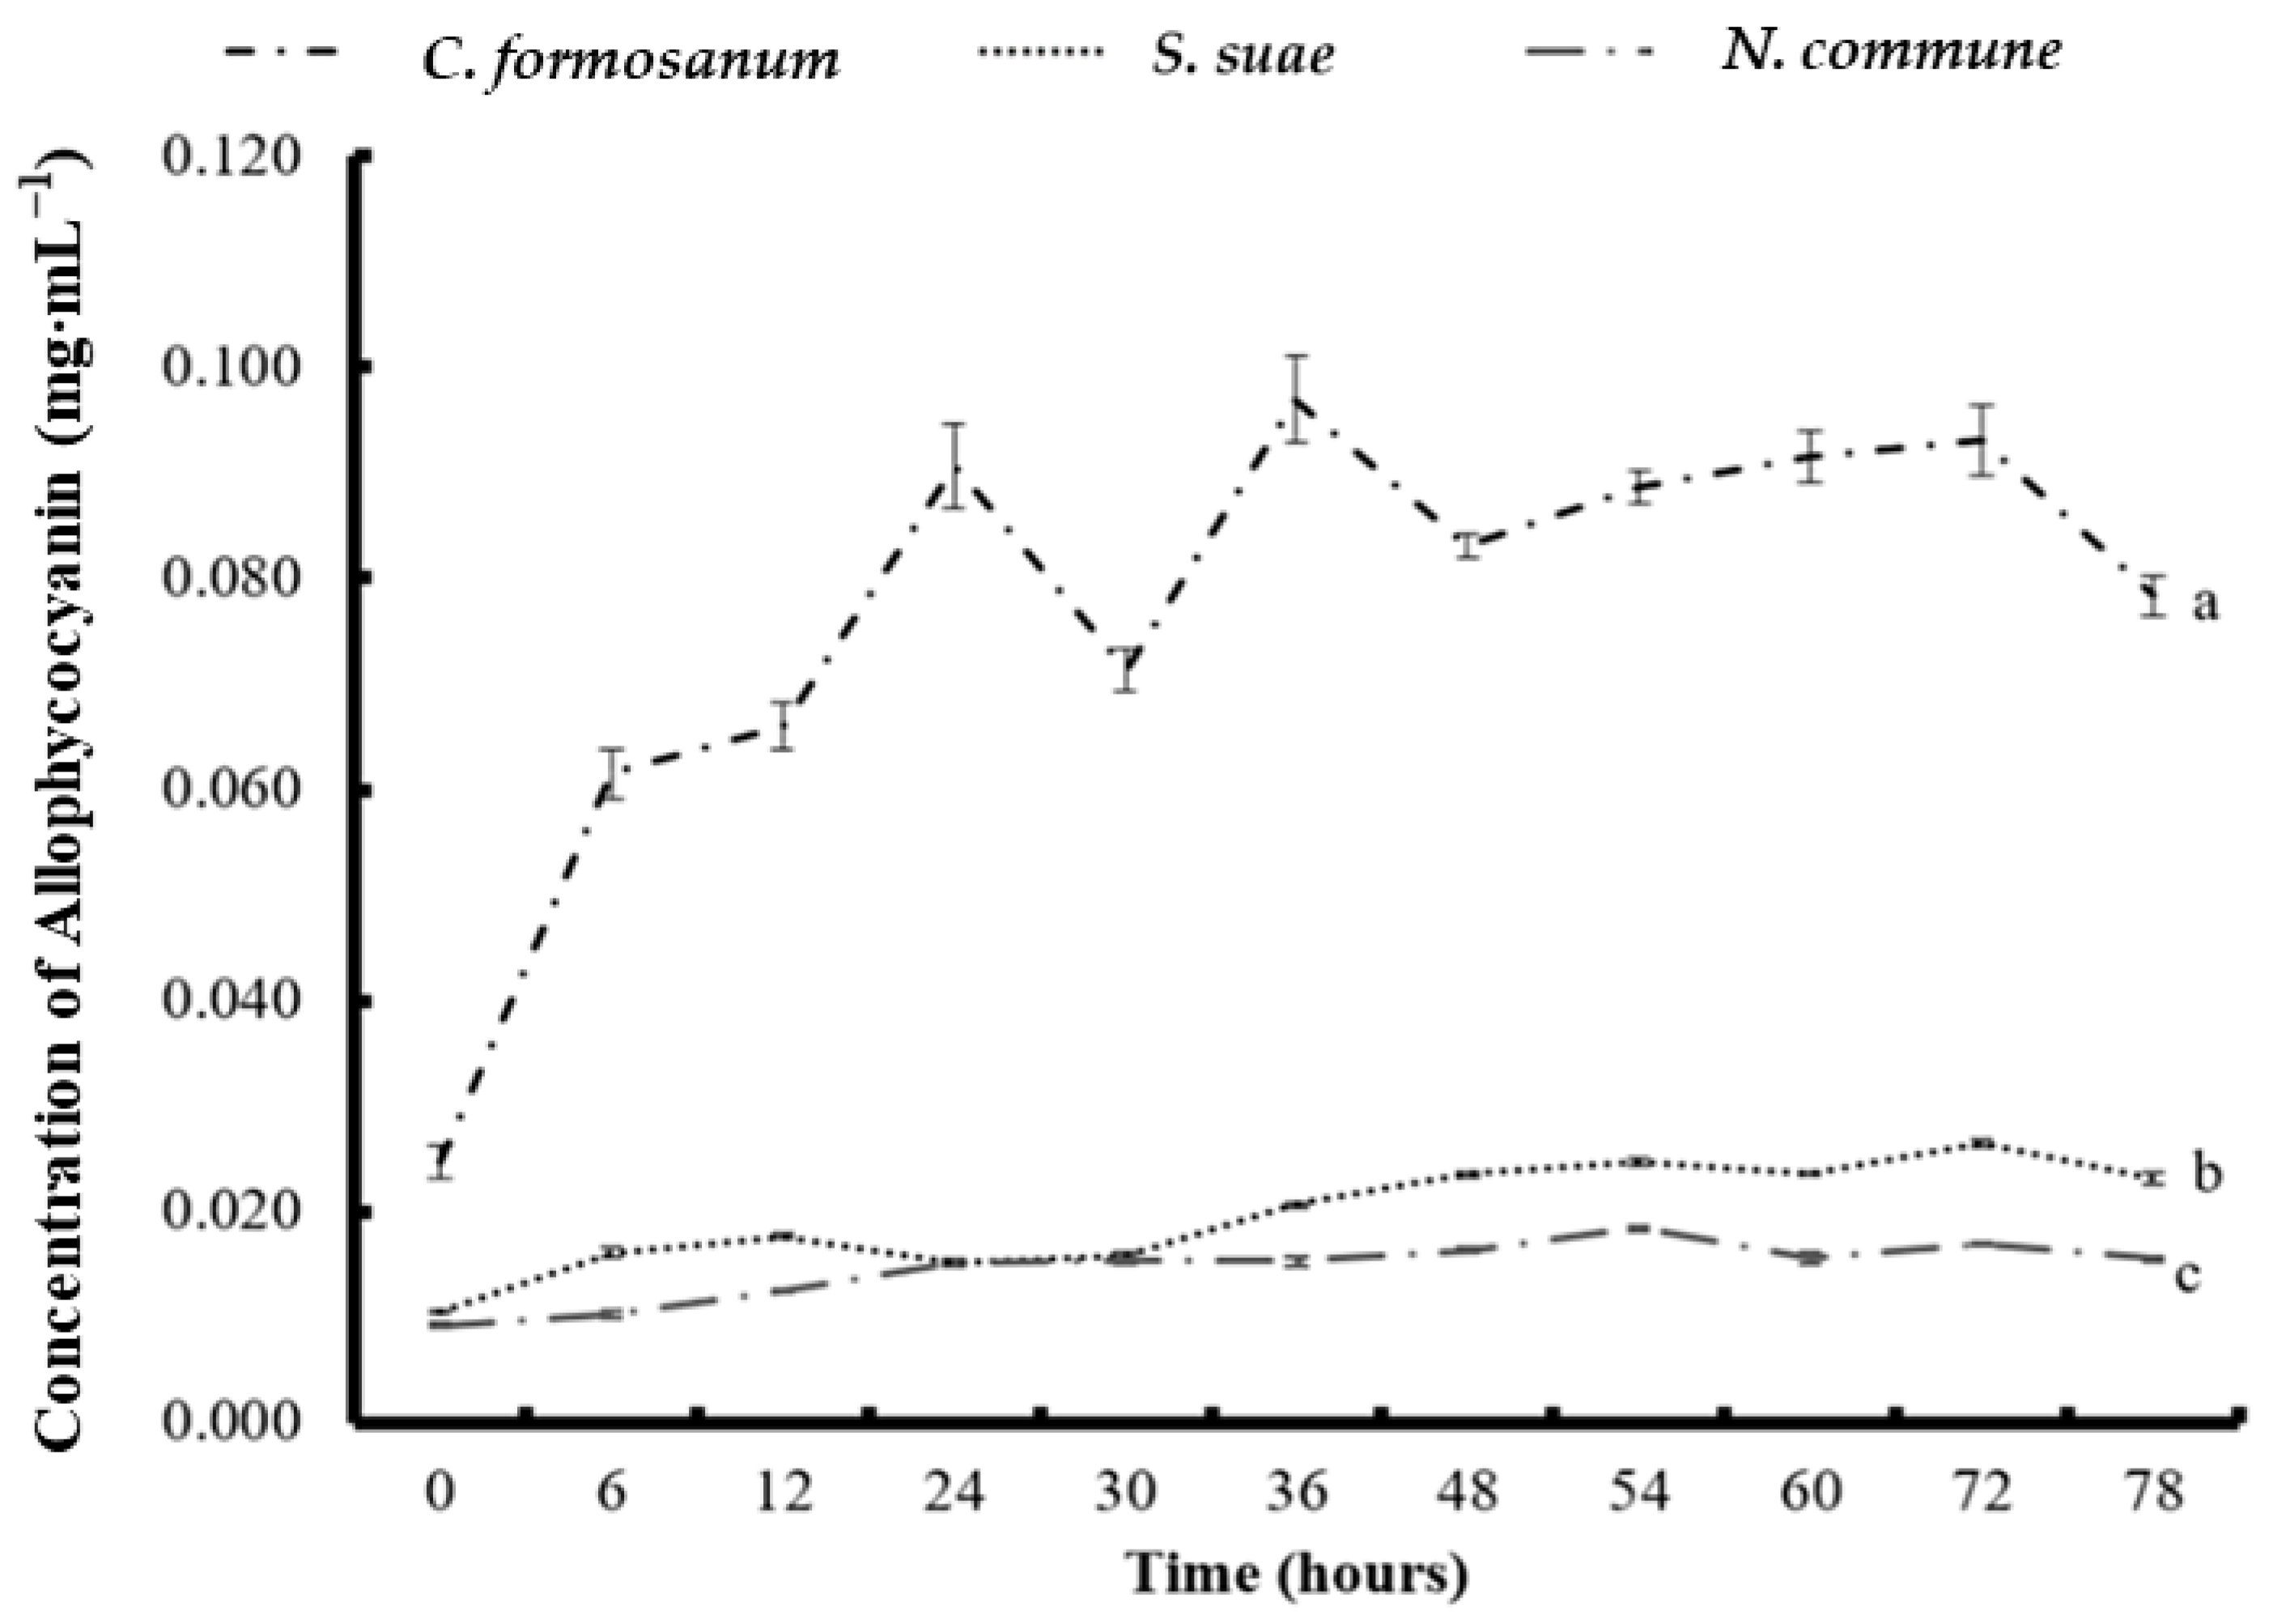
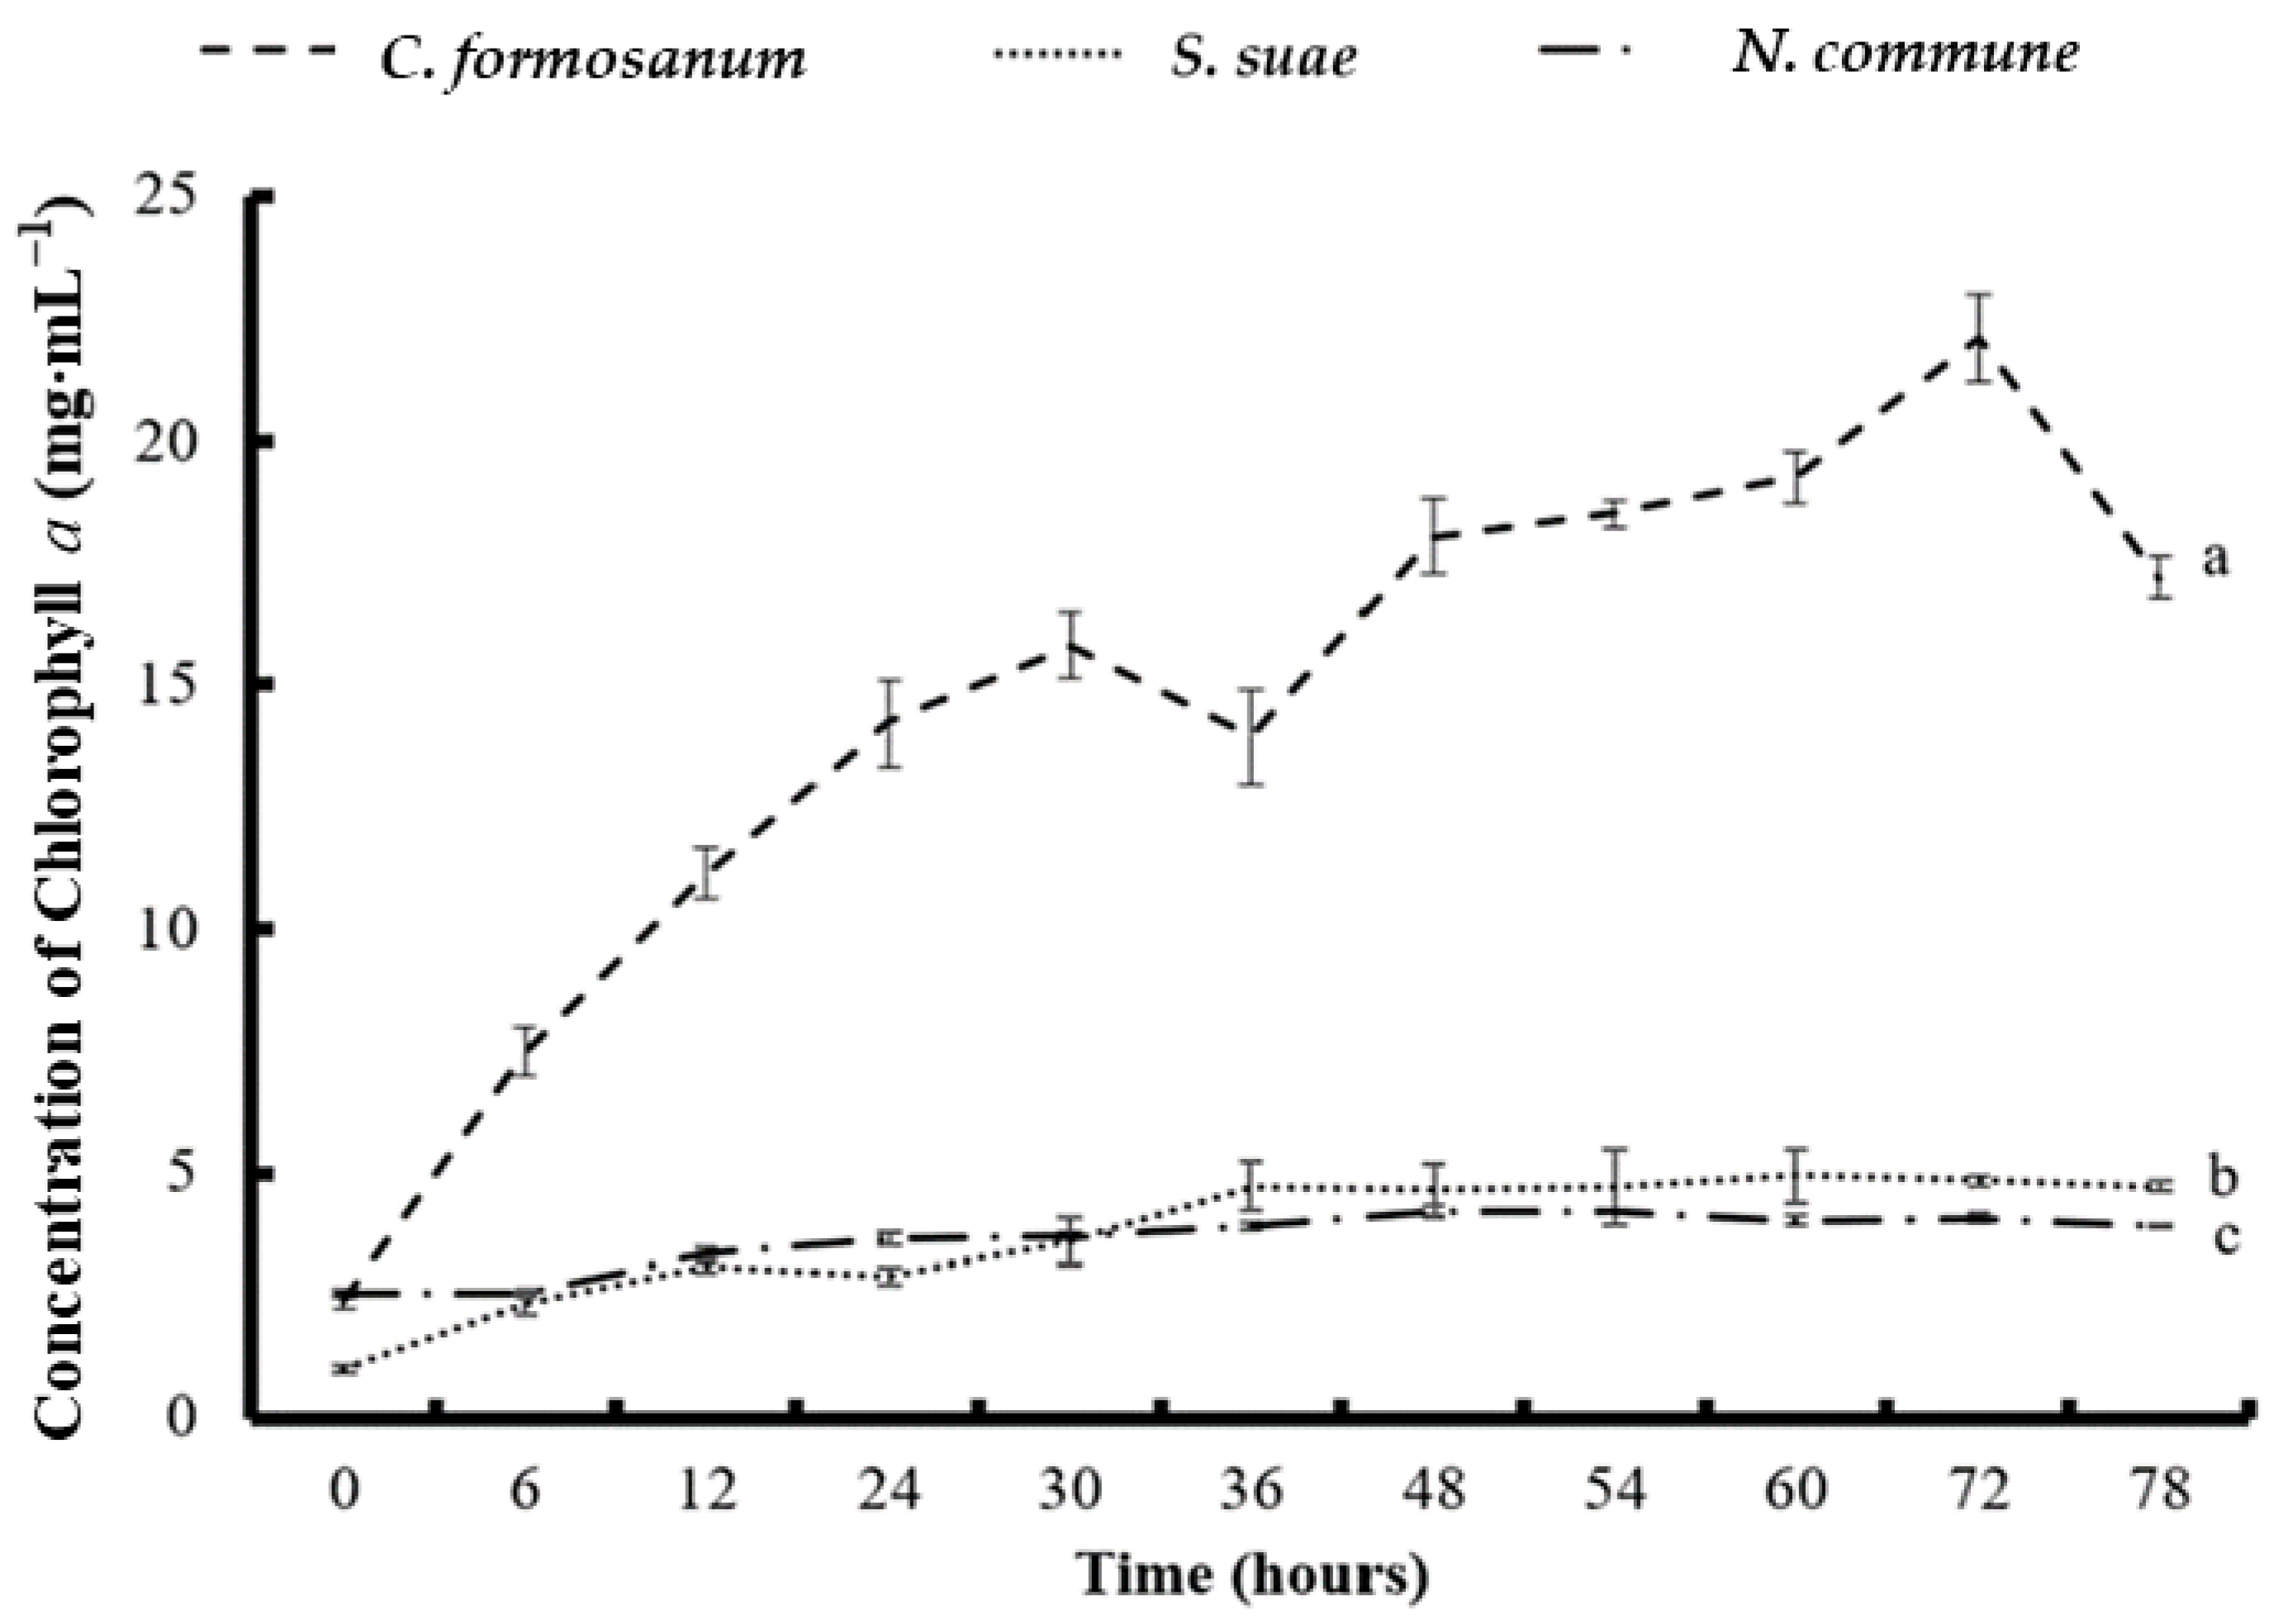
3.2. Concentrations of Phycobiliproteins and Chlorophyll a Obtained from the Three Types of Algae

During the C. formosanum fermentation process, the phycobiliprotein concentration increased noticeably at 6 h. The highest PE and PC concentrations (0.118 and 0.089 mg mL−1) were obtained at 30 h and 24 h, respectively, but the increases were not significant after 6 h (Figure 1 and Figure 2).
The APC concentration increased slightly between the start of fermentation and 36 h, and the highest APC concentration (0.096 mg mL−1) was obtained at 36 h. After 36 h, the APC concentration decreased slightly (Figure 3). The Chl a concentration gradually rose until 72 h, when it reached its highest concentration (22.12 mg mL−1; Figure 4).
In the S. suae fermentation experiment, the highest PE and PC concentrations (0.014 and 0.026 mg mL−1) were obtained at 6 h and 54 h, respectively. The APC concentration gradually increased from the beginning of the experiment until 72 h. The highest APC concentration was 0.027 mg mL−1 at 72 h. Additionally, the Chl a concentration increased slightly and gradually, reaching its highest concentration of 4.93 mg mL−1 at 72 h.
During the N. commune fermentation, the highest PE (0.016 mg mL−1), PC (0.025 mg mL−1), APC (0.018 mg mL−1), and Chl a (4.23 mg mL−1) concentrations were all obtained at 54 h. The phycobiliproteins from the fermentation of N. commune steadily rose from the beginning of the fermentation but gradually decreased after 54 h. Compared to the initial levels, the phycobiliprotein concentrations increased by 1.67 (for PE), 1.7 (for PC), and 1 (for APC) times.

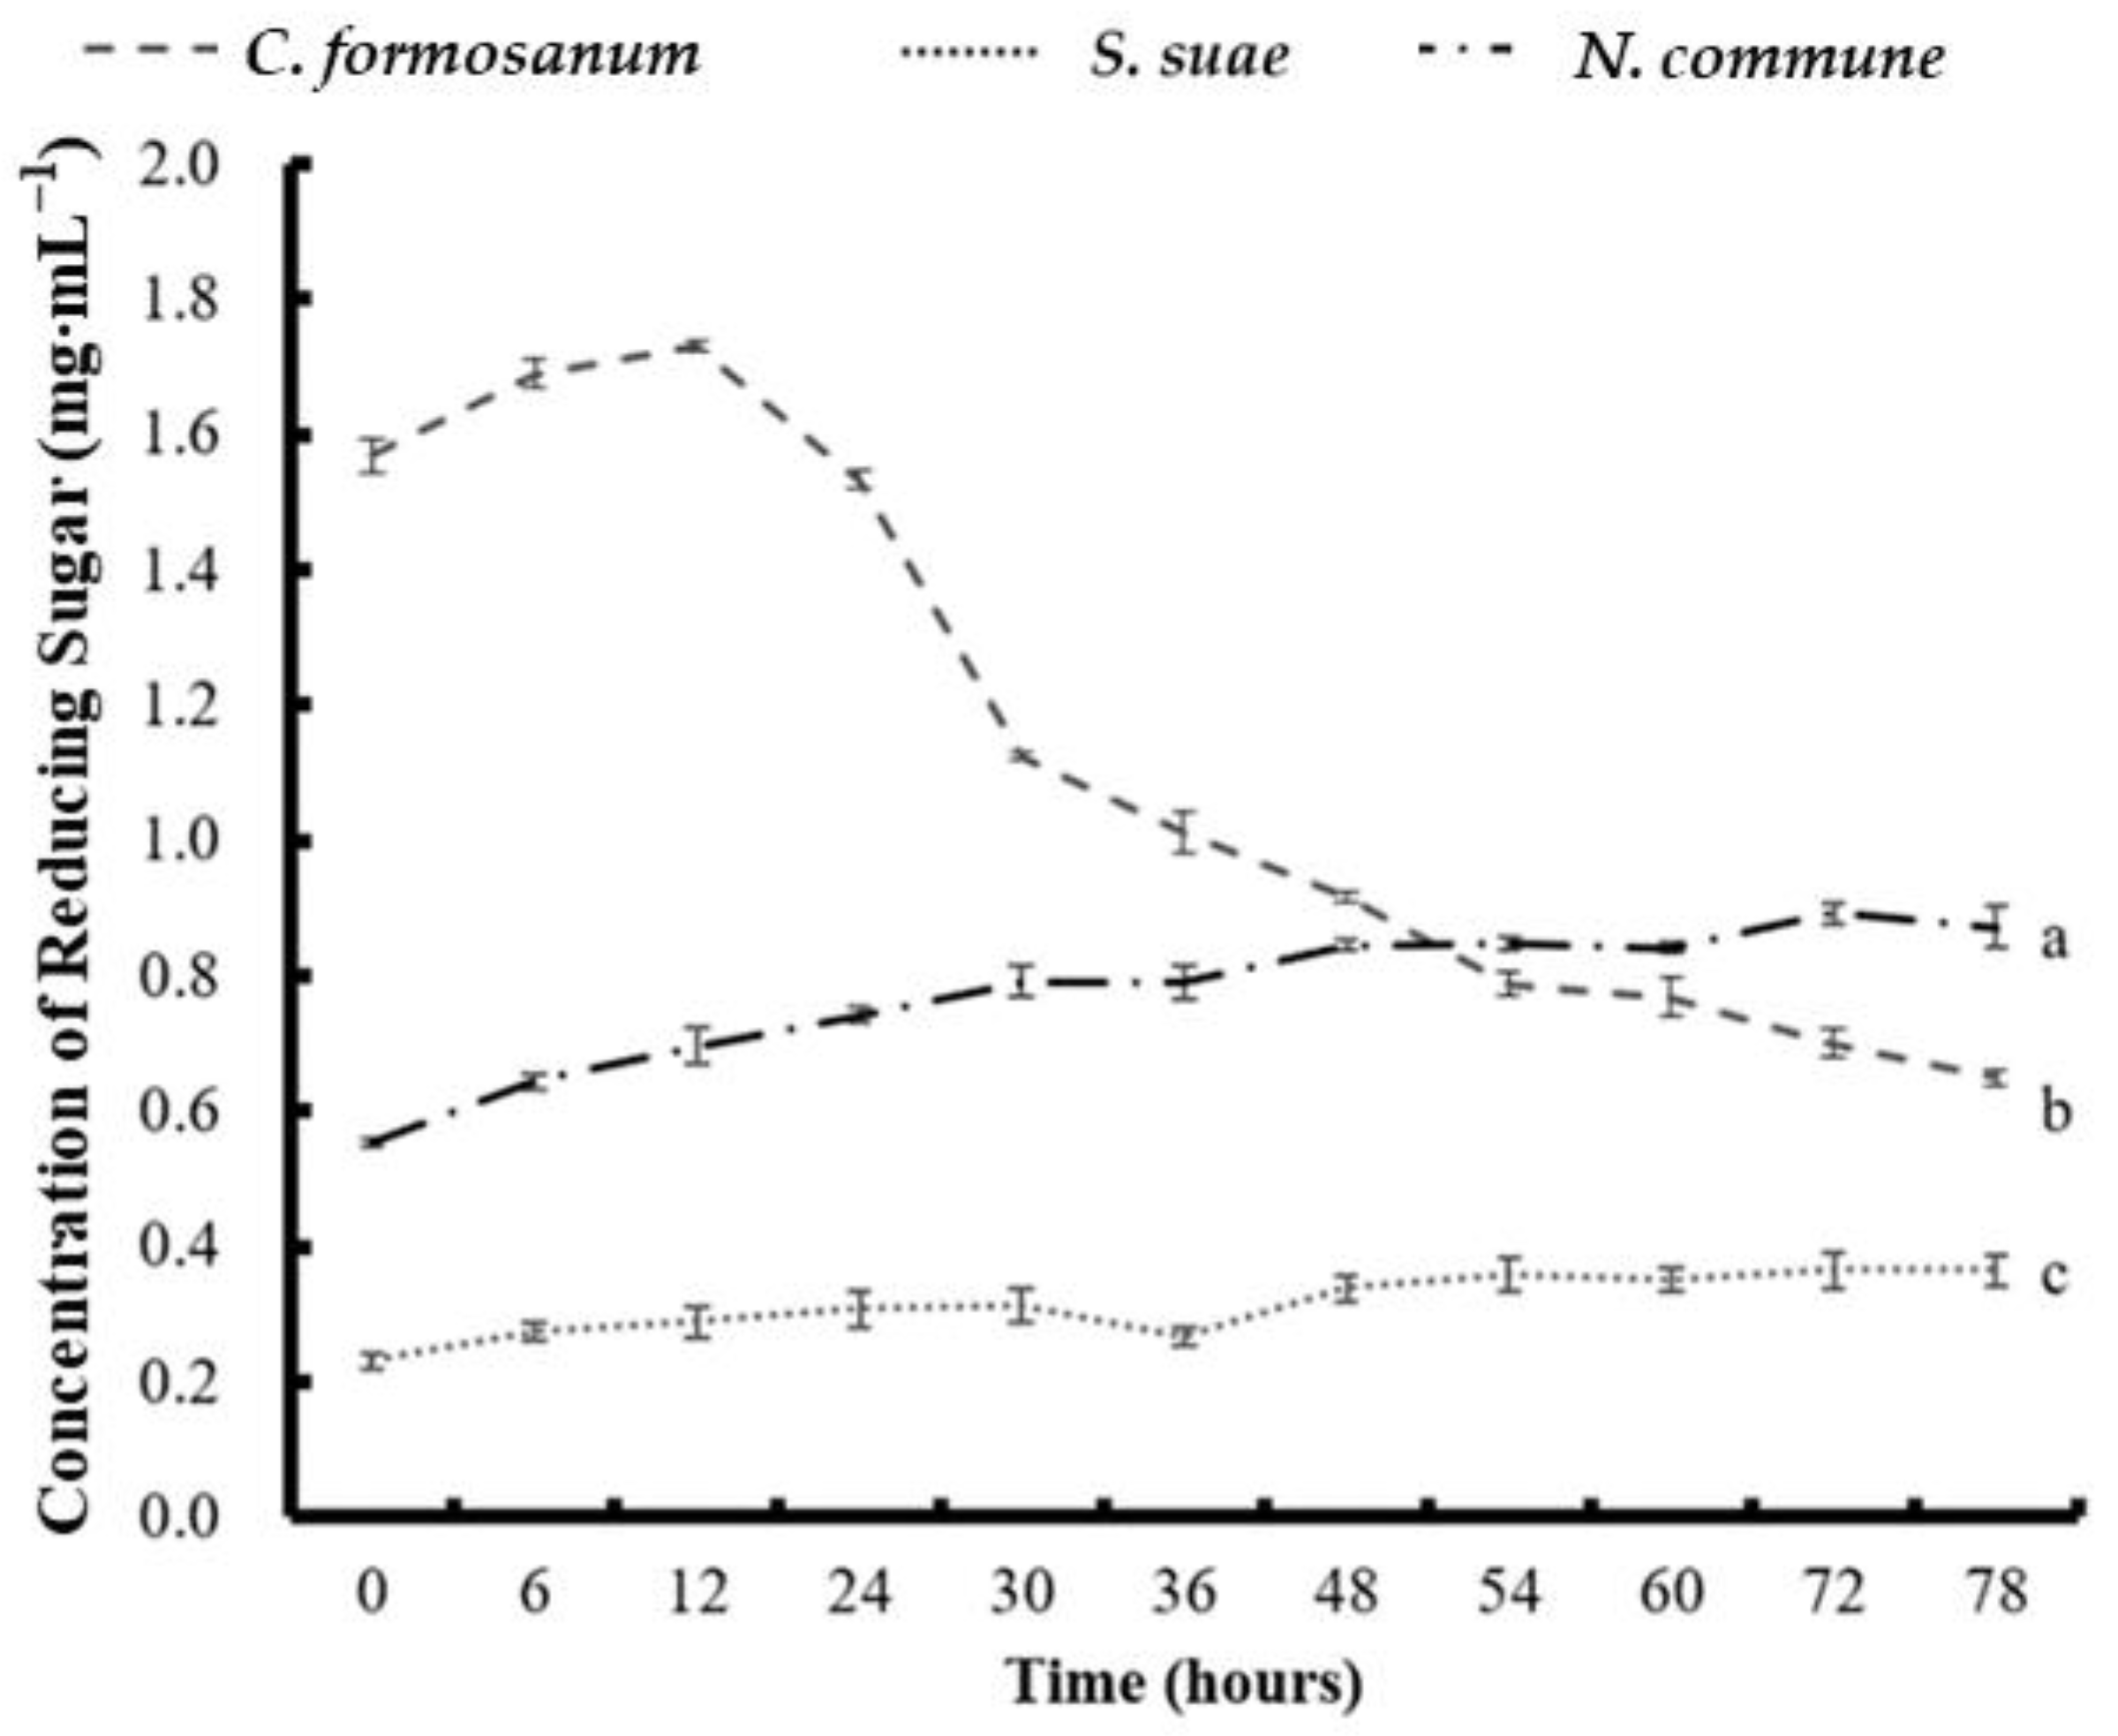
3.3. Determination of the Reducing Sugar Concentration and Monosaccharide Composition of the Three Types of Algae

Figure 5 shows the effect of the different fermentation times on the concentration of reducing sugar in C. formosanum, S. suae, and N. commune fermented with P. haloplanktis ATCC 14393. For the C. formosanum fermentation experiment, the highest reducing sugar concentration (1.729 mg mL−1) was observed at 12 h, after which it gradually decreased. During the S. suae fermentation, the concentration of reducing sugar progressively increased from the beginning of the experiment until 30 h, briefly decreased at 36 h, and then resumed increasing. The concentration of reducing sugar in N. commune increased steadily from 0 h to 72 h. Table 1 shows the different monosaccharide compositions found in the C. formosanum, S. suae, and N. commune fermentation experiments by NMR analysis. After the fermentation process, the total sugar percentage from the C. formosanum and S. suae experiments had noticeably decreased. In contrast, in the N. commune fermentation experiment, the total sugar percentage (w w−1) increased from 42.2% to 81.9%. After fermentation, the mannose percentage (w w−1) increased to 7.1% in C. formosanum, 37.5% in S. suae, and 6.5% in N. commune. The galactose percentage (w w−1) of the fermented samples noticeably decreased to 17.1% in C. formosanum, 39.2% in S. suae, and 17.5% in N. commune. Similar to the decreasing trend observed for galactose percentage, after fermentation, the glucose percentage (w w−1) in C. formosanum and S. suae became undetectable, whereas in N. commune, the glucose percentage decreased from 73.2% to 64.2%. The xylose percentage (w w−1) in the C. formosanum and S. suae fermented samples noticeably increased to 64.1% and 23.3%, respectively. However, the xylose percentage in the fermented N. commune sample decreased to undetectable levels.

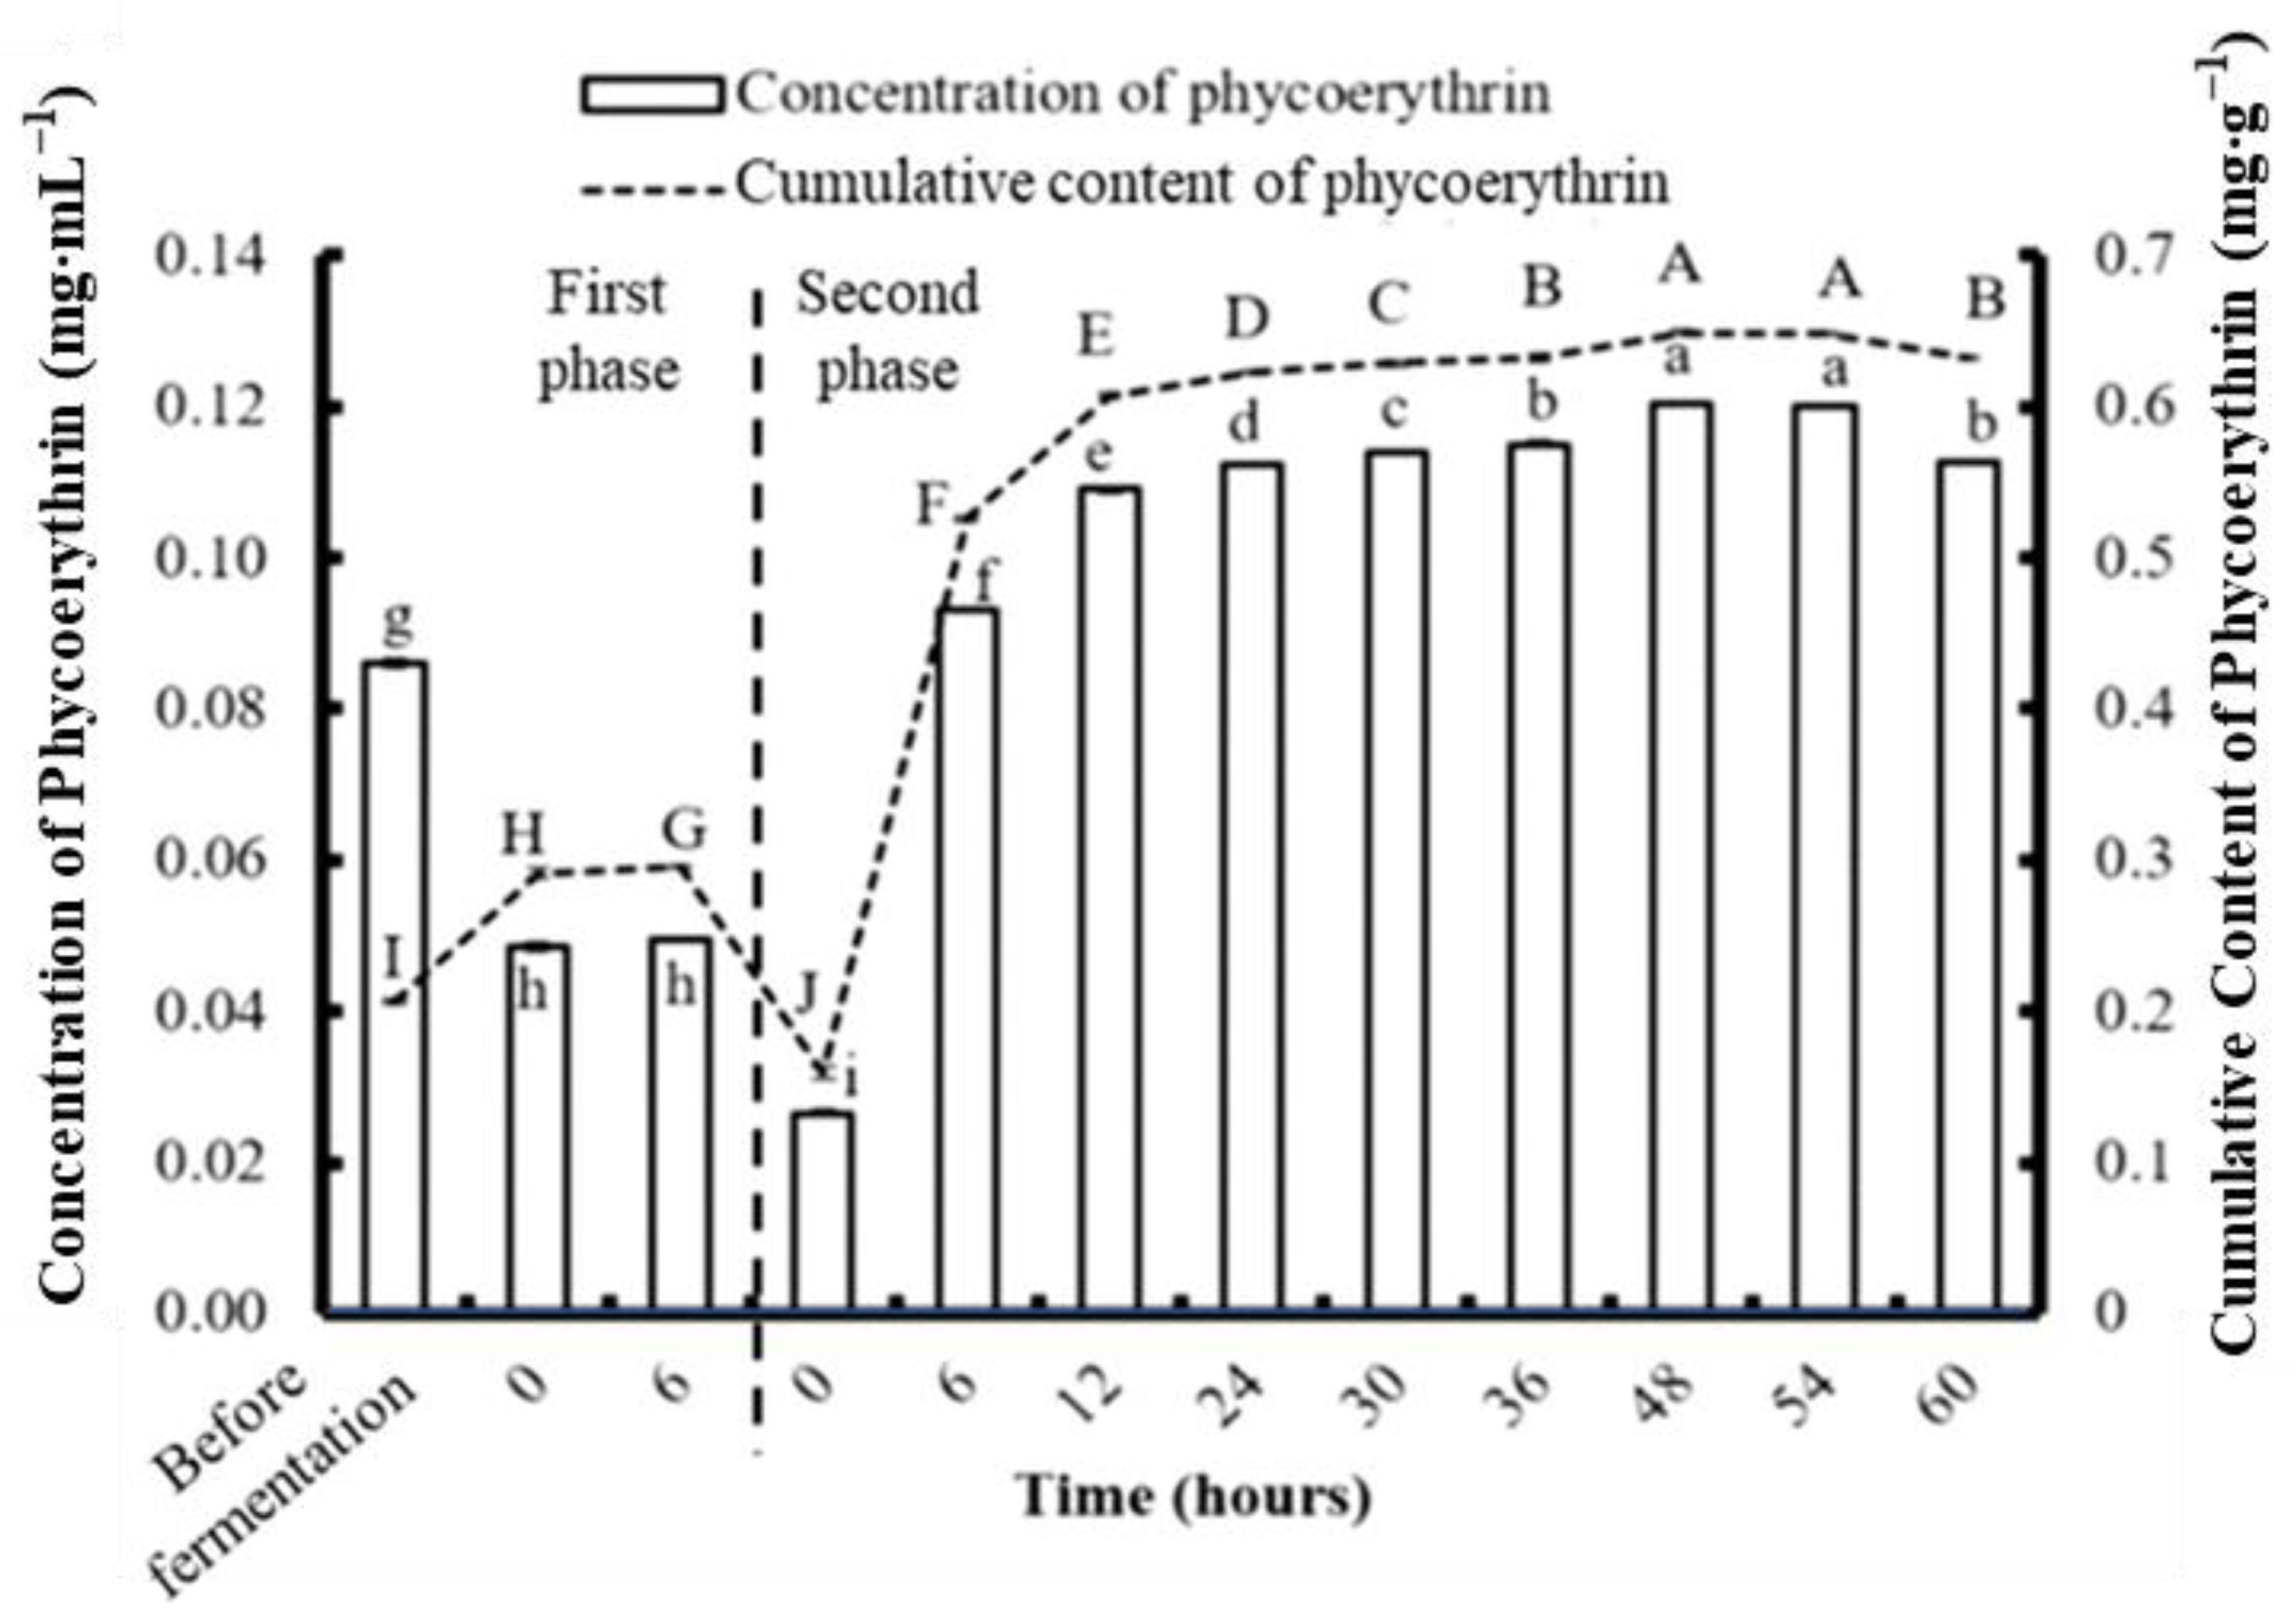
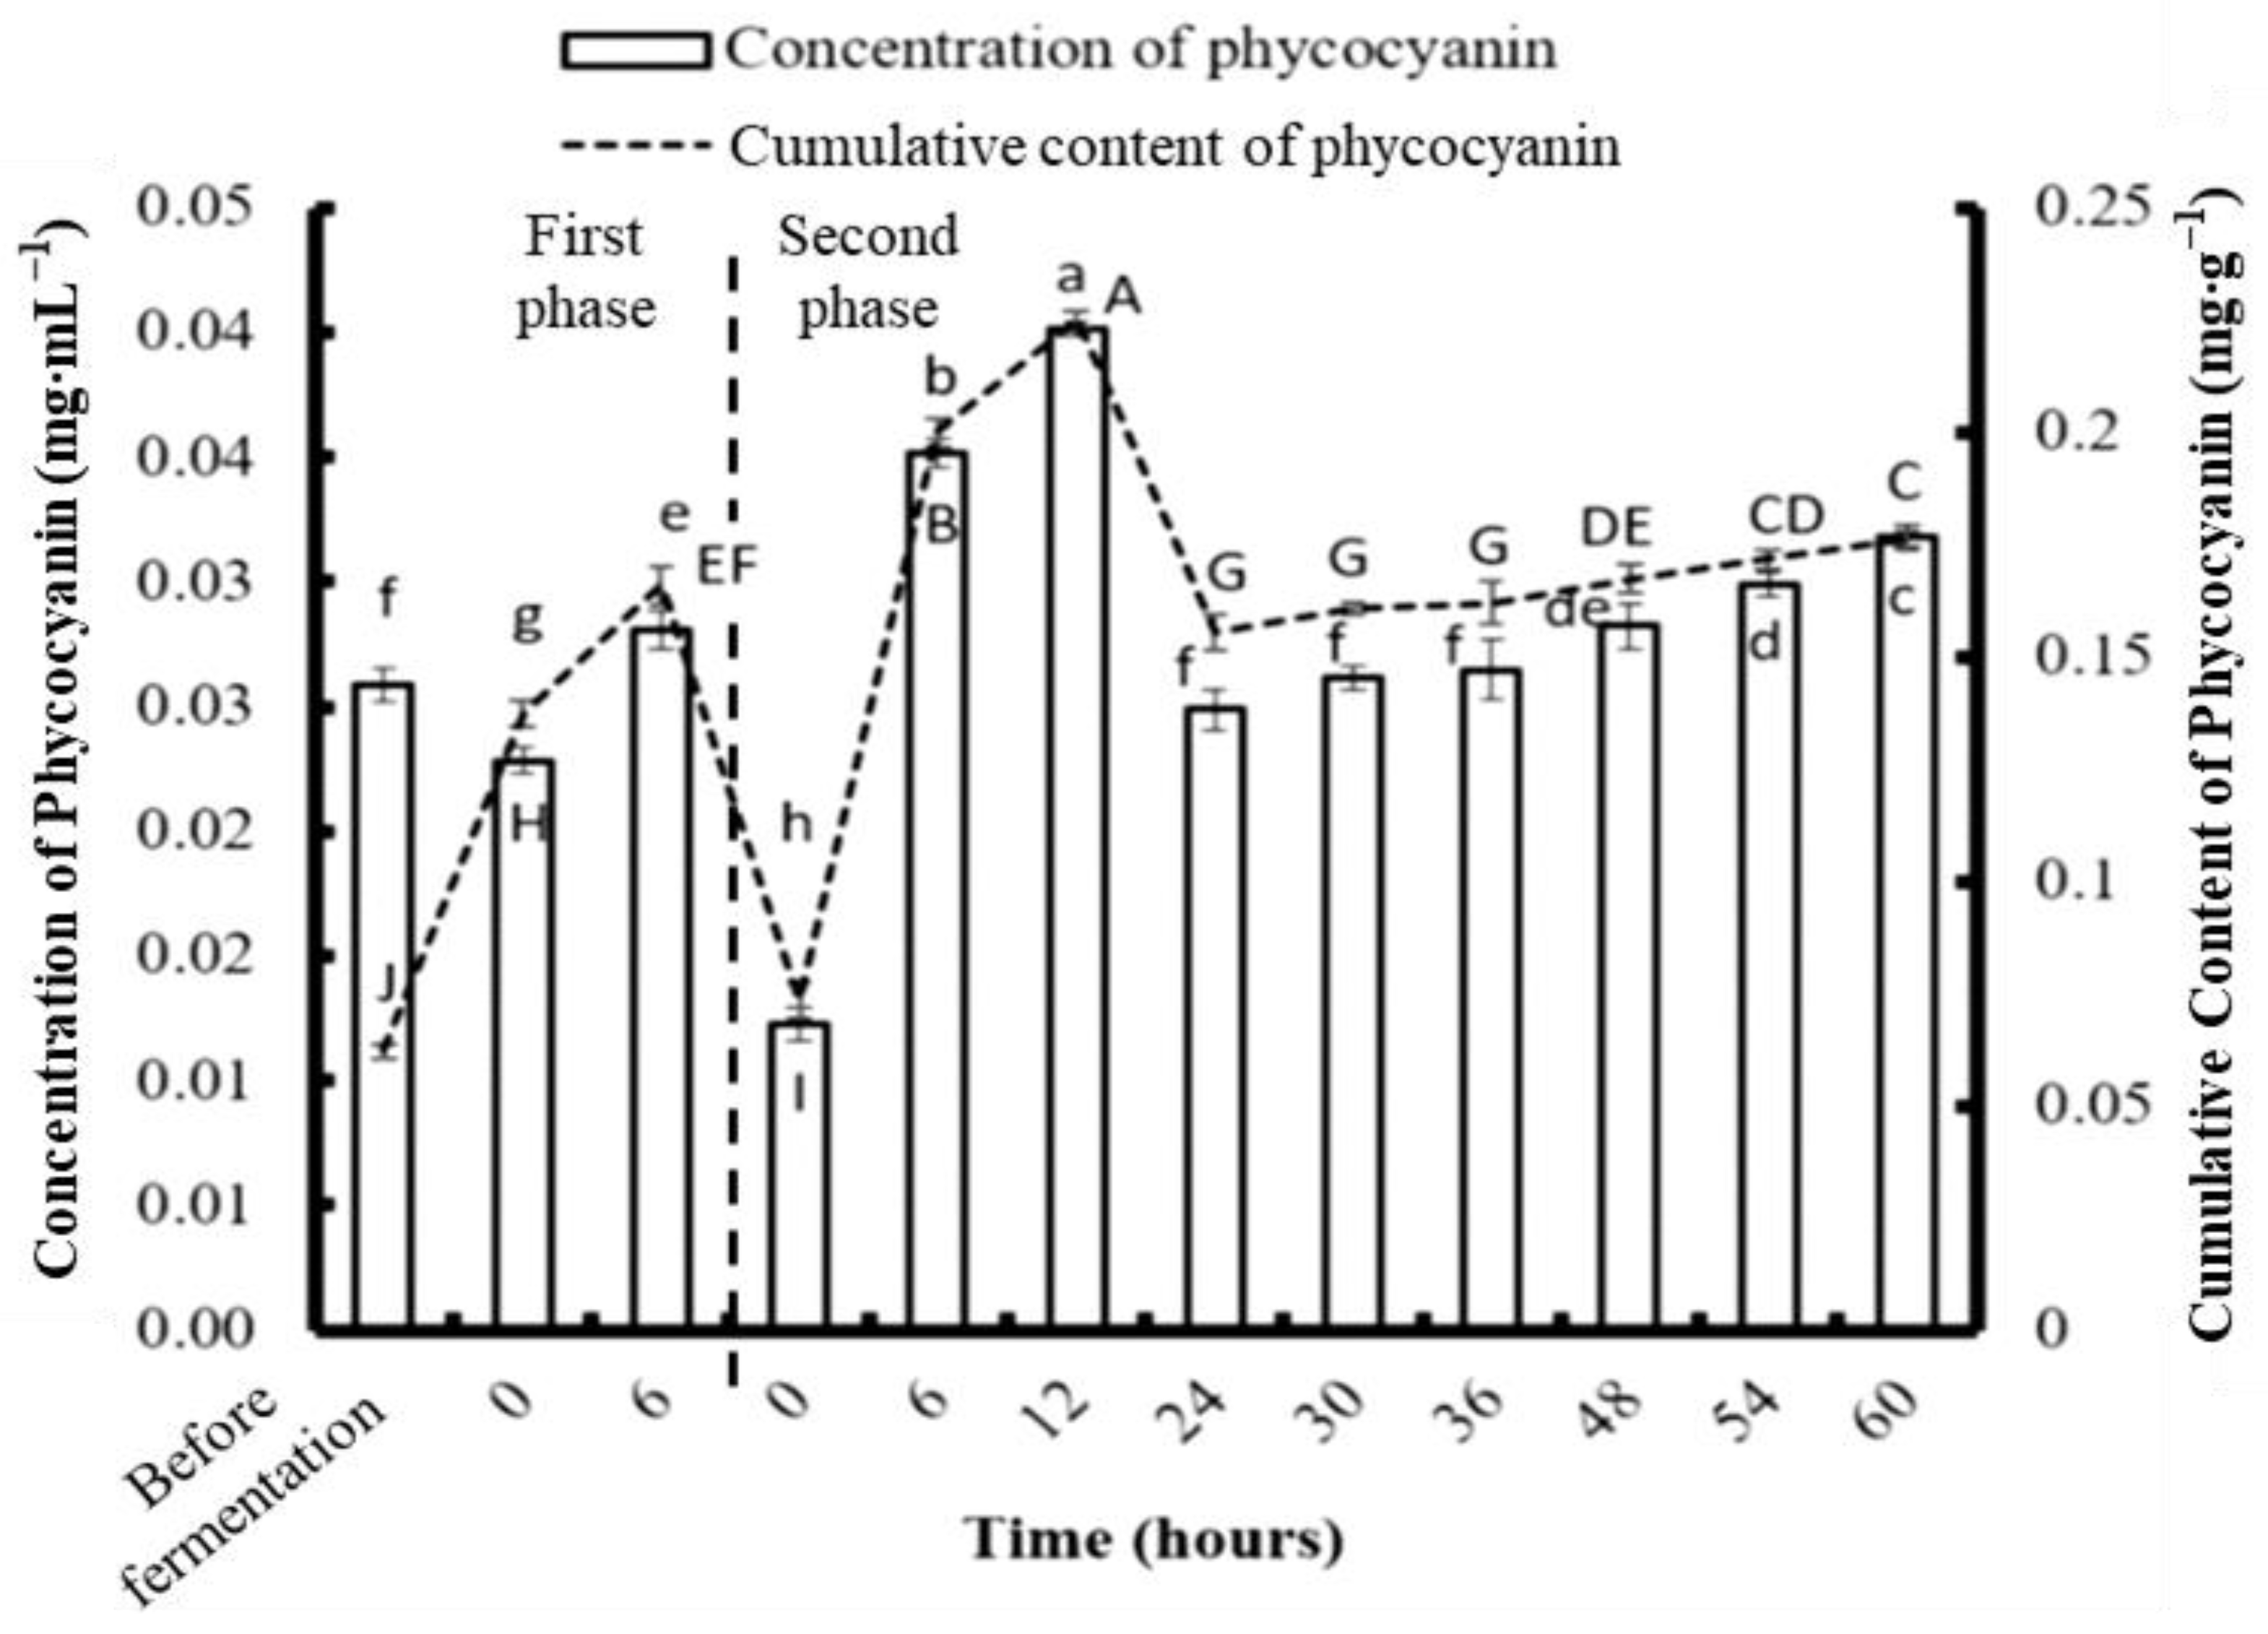
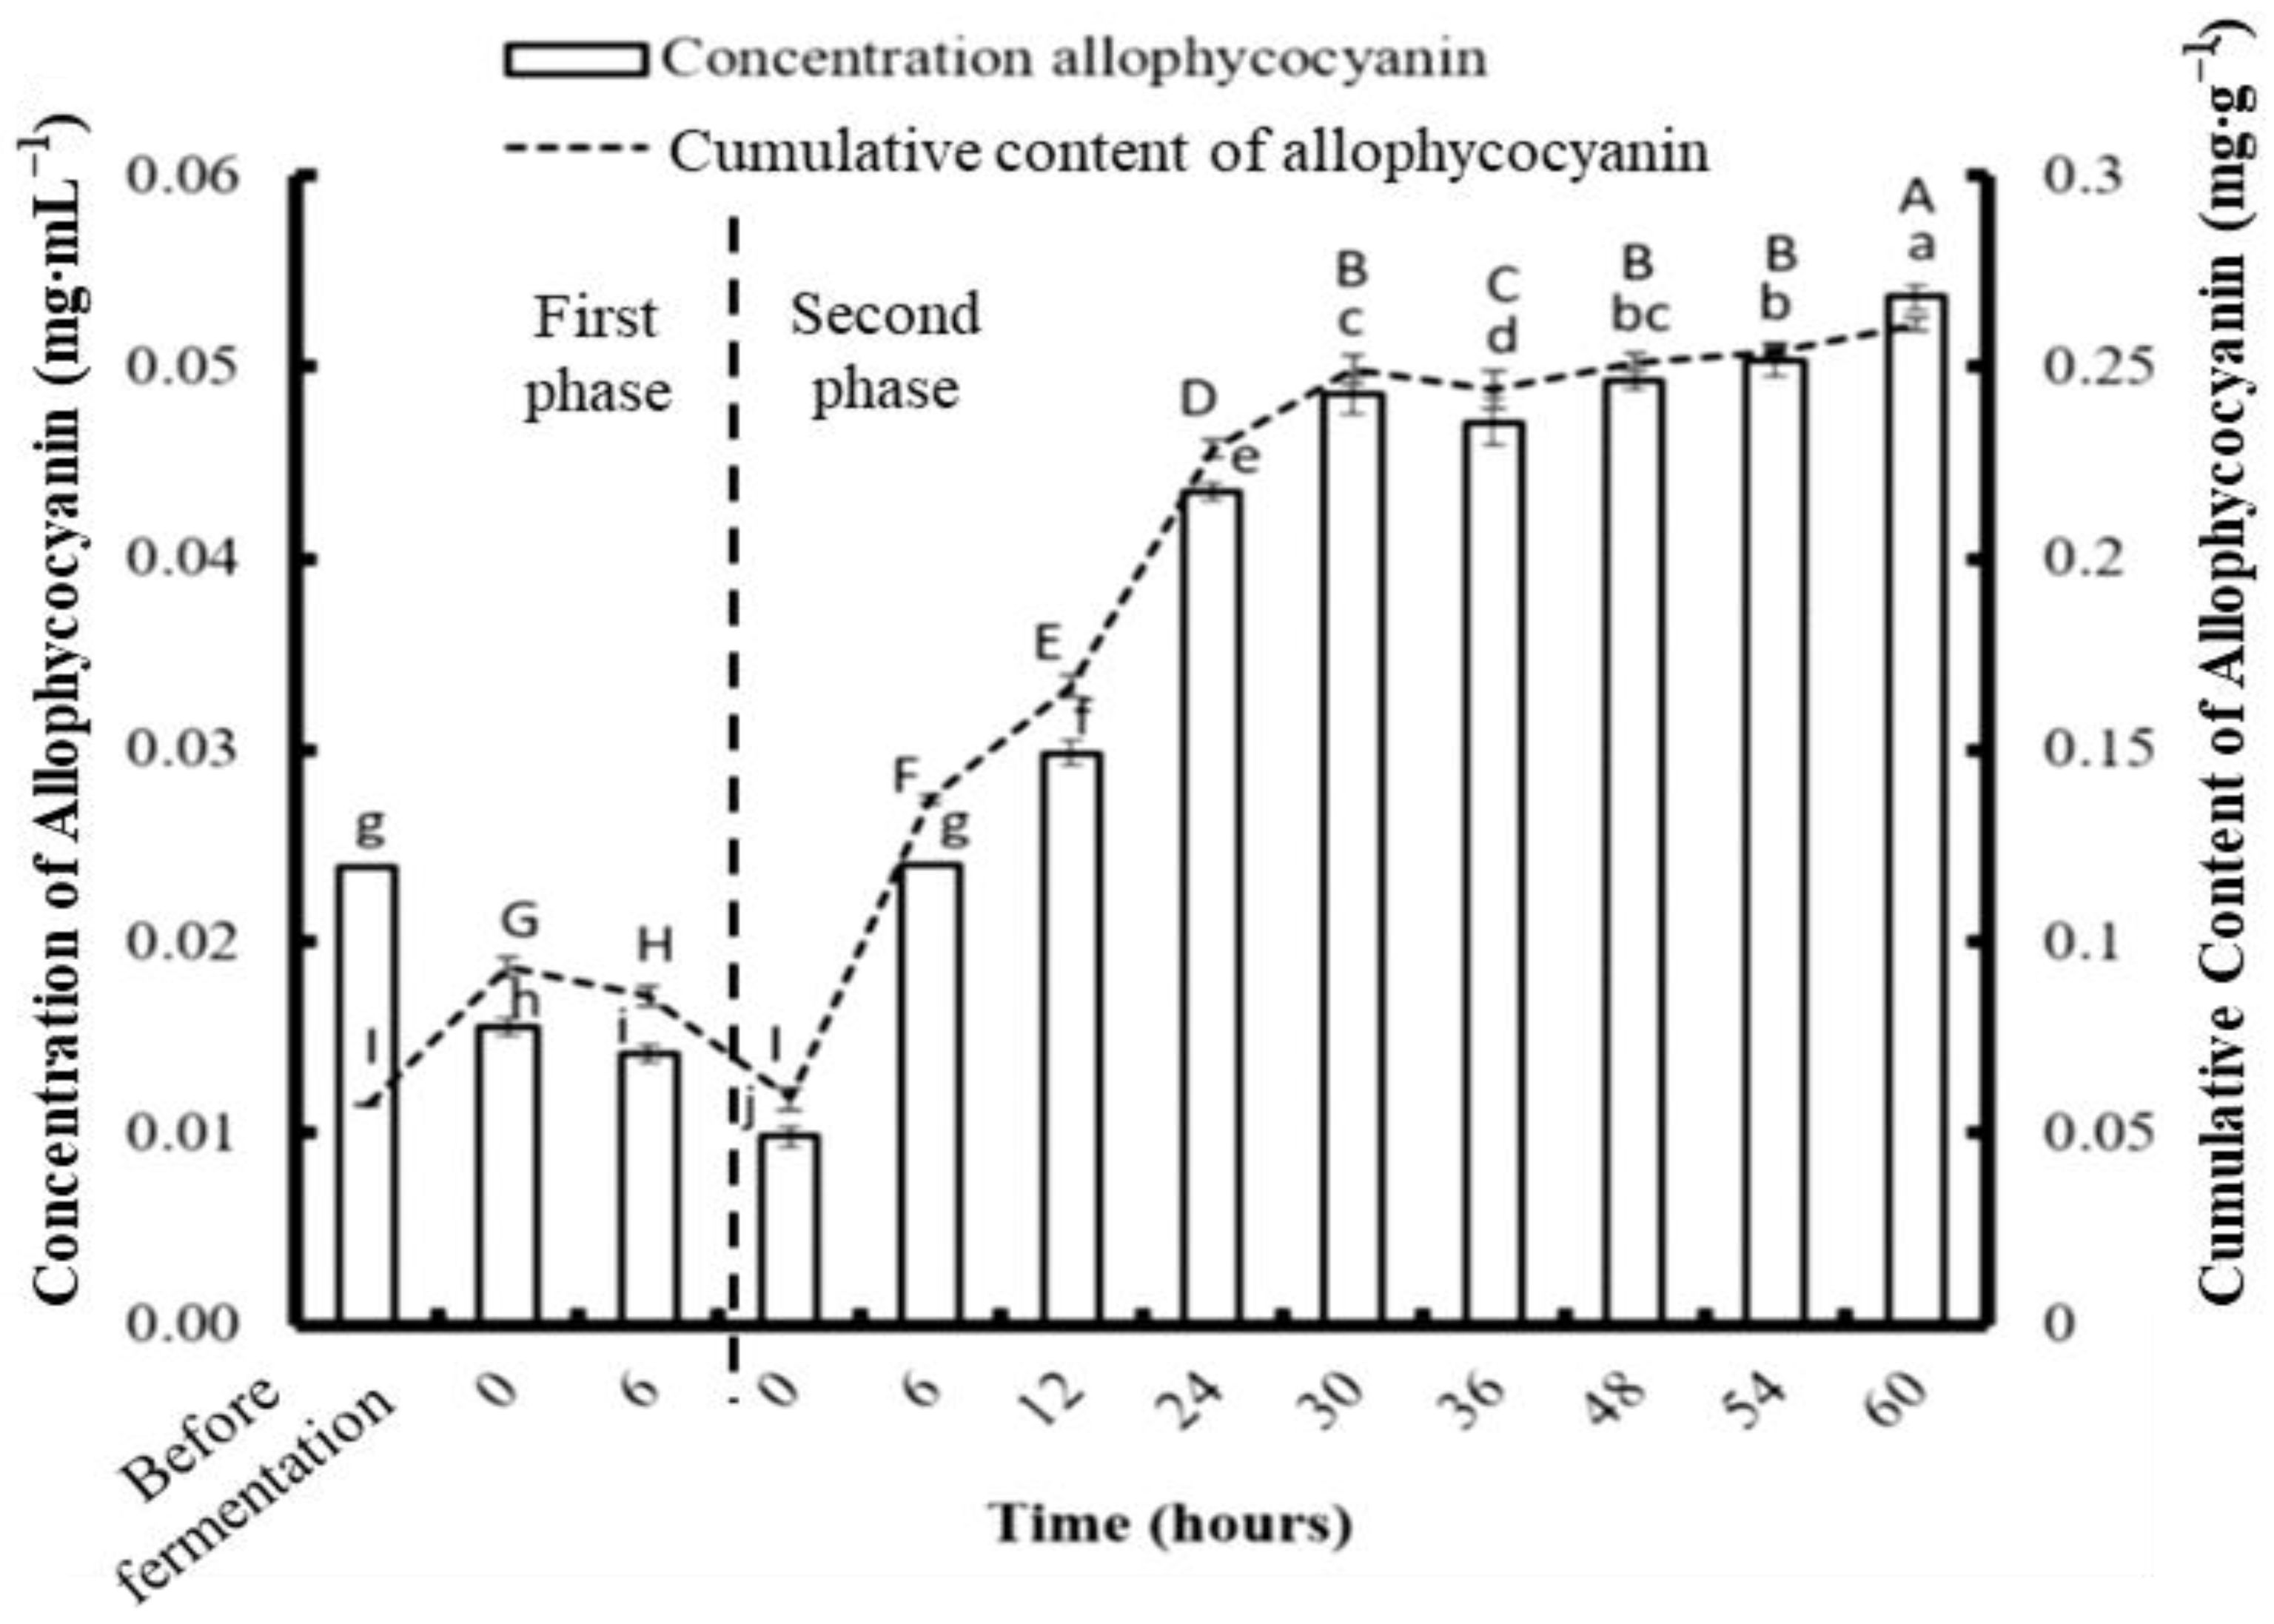
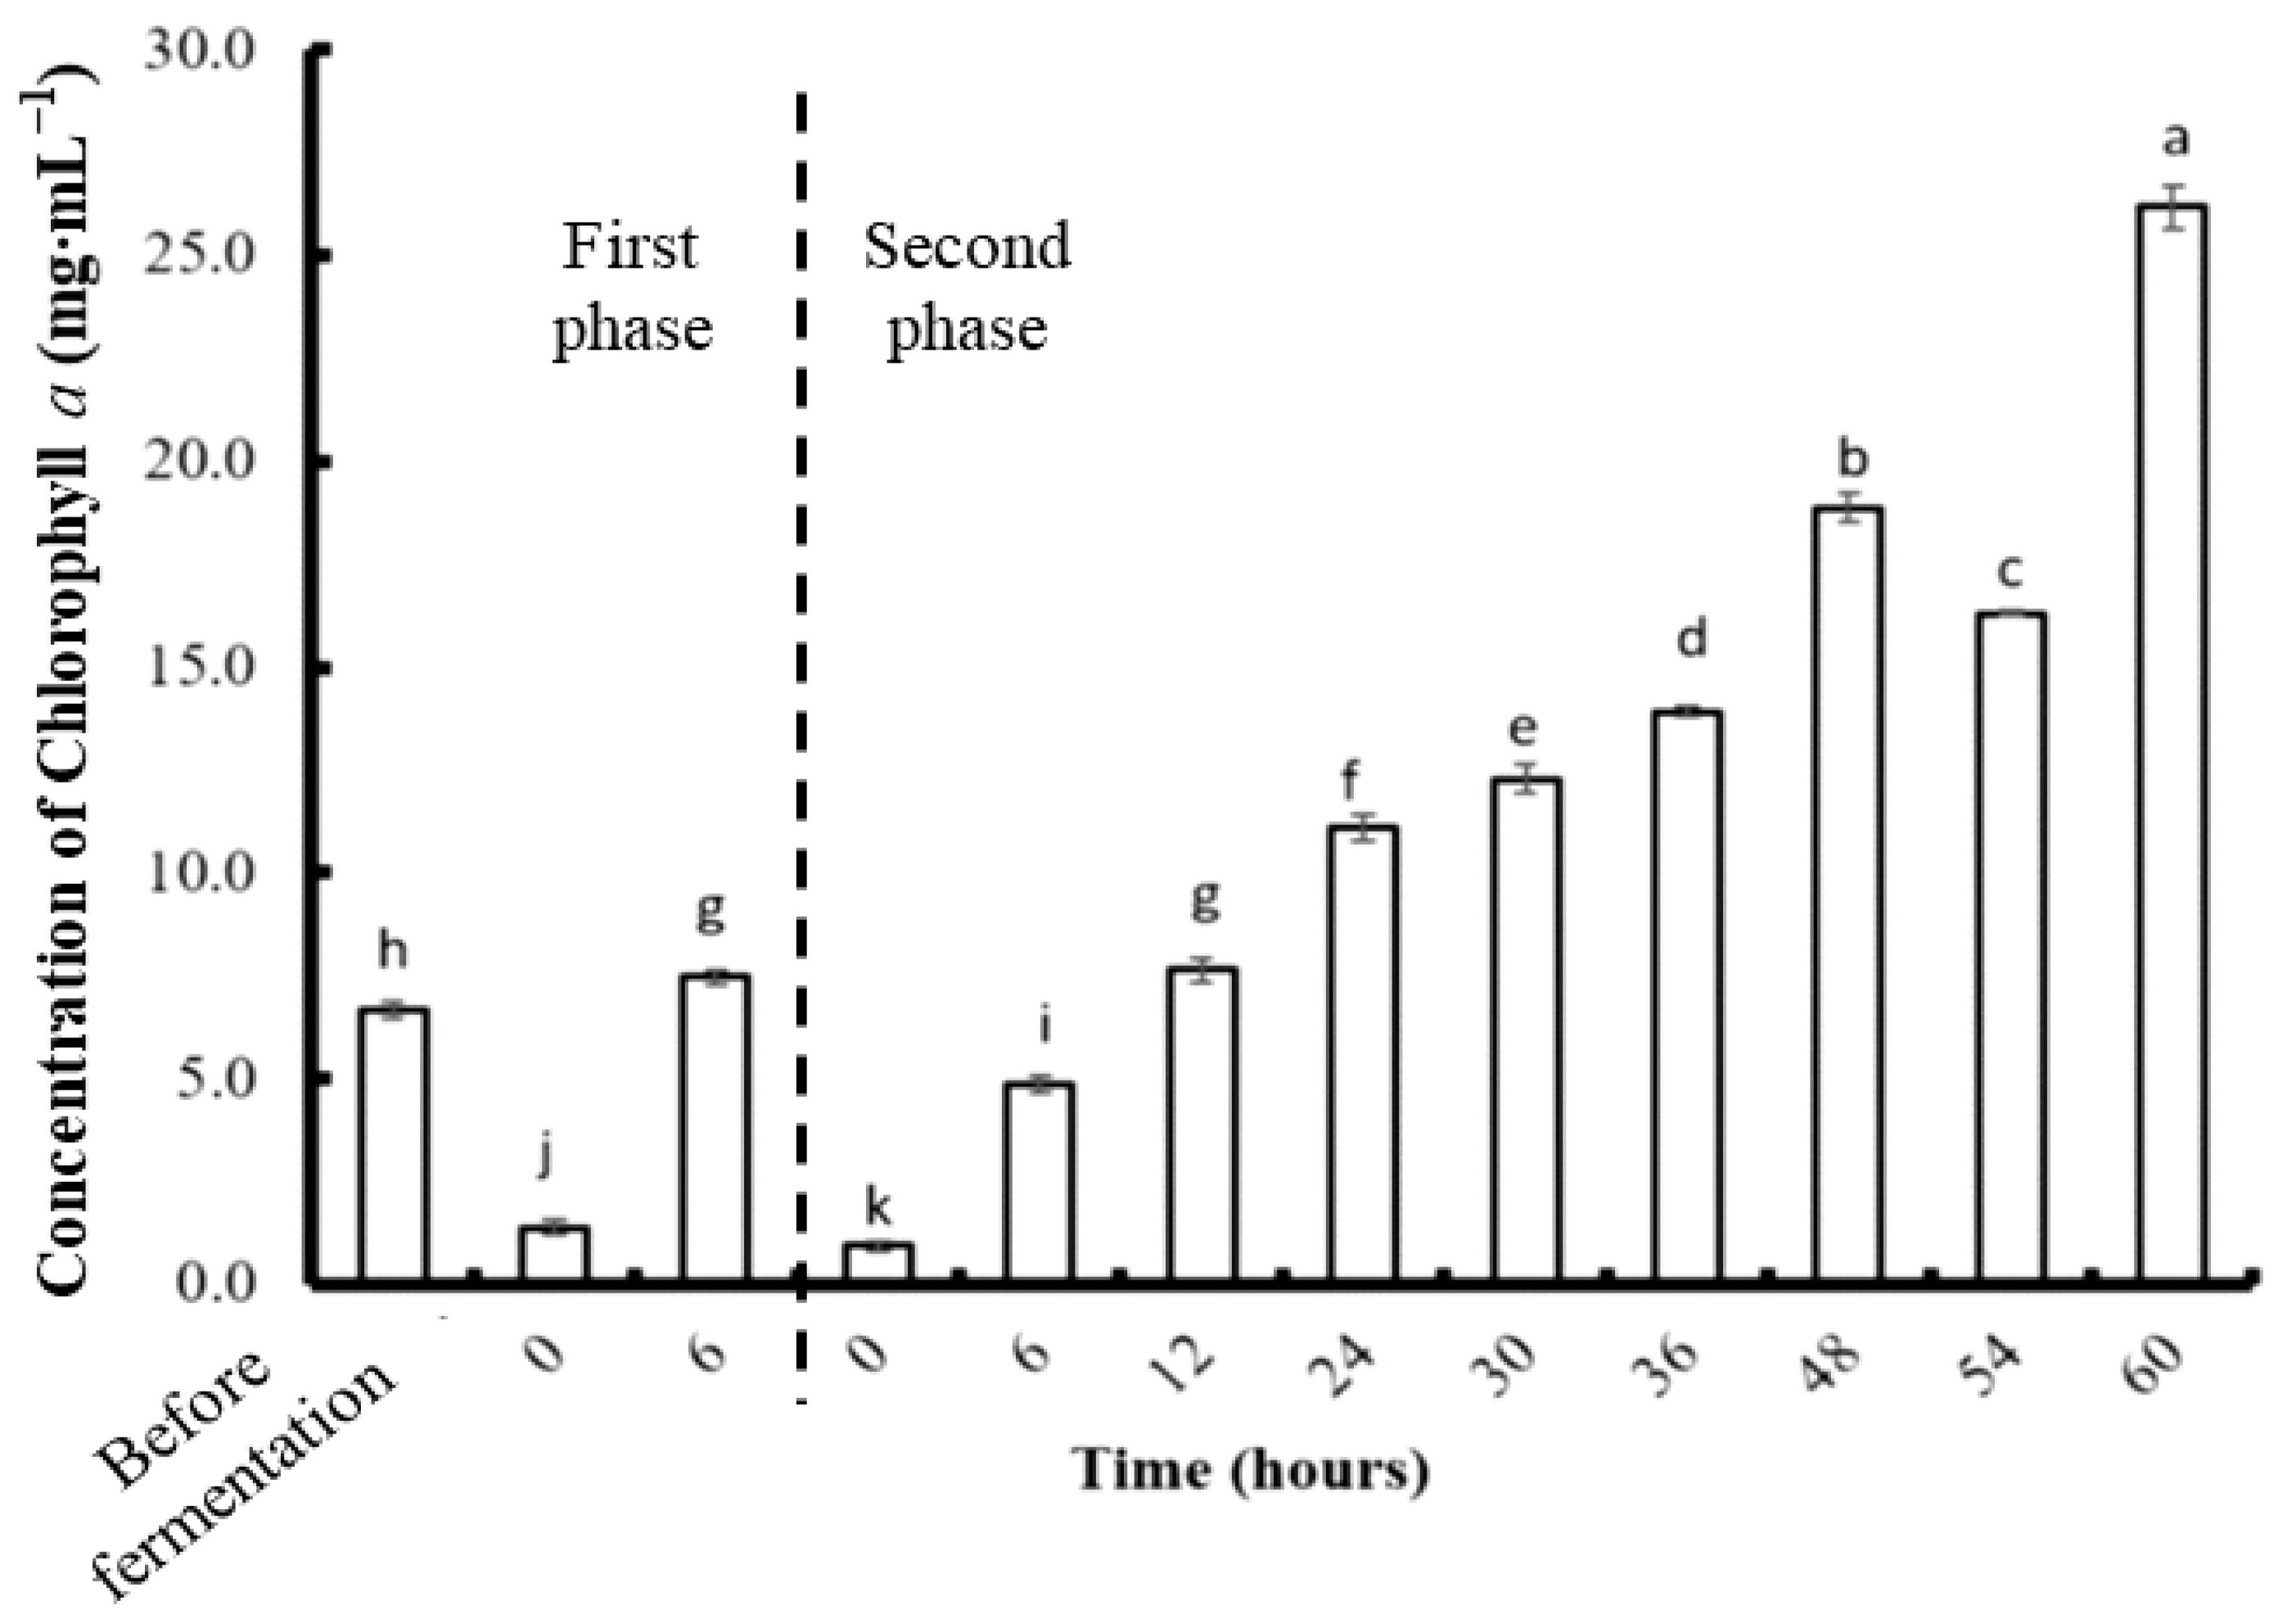
3.4. Phycobiliprotein and Chlorophyll a Concentration after Two-Stage Fermentation

According to the previous fermentation experiment, C. formosanum showed significantly higher production of PE, PC, APC, Chl a, and reducing sugar at 6 h compared to S. suae and N. commune. To further promote the production of those high-value bioactive substances from algae, C. formosanum was used for further analysis. The algae were fragmented using a bead mill homogenizer, and the PE, PC, and APC contents were 0.206, 0.062, and 0.057 mg g−1, respectively (Figure 6, Figure 7 and Figure 8). The most efficient PE extraction time found in the previous (single stage) fermentation experiment was used; therefore, the samples were fermented for six hours prior to collection. This process generated concentrations of 0.296 mg g−1 PE, 0.152 mg g−1 PC, and 0.085 mg g−1 APC during the first phase of the two-stage fermentation.
During the second phase of fermentation, the PE and APC concentrations gradually increased with time. The highest PE concentration was 0.649 mg·g−1 at 48 h, and the highest APC concentration was 0.26 mg·g−1 at 60 h. Unlike the trends in the changing PE and APC concentrations, the PC concentration dramatically increased in the first 12 h and dropped afterwards. The highest PC concentration was 0.23 mg·g−1 at 12 h. Compared to physical fragmentation alone, the combination of fragmenting and fermenting allowed for more phycobiliproteins to be obtained.
After the first phase of fermentation, the PE, PC, and APC from the C. formosanum increased to 43.69%, 145%, and 49.12%, respectively. The highest amounts of PE, PC, and APC were collected from the two-stage fermentation using different fermentation durations. The maximum PE, PC, and APC obtained per gram of C. formosanum was 0.708 mg, 0.265 mg, and 0.238 mg, respectively, after two-stage fermentation. The production yield of PE, PC, and APC from C. formosanum by two-stage fermentation was about 307%, 104%, and 76% higher, respectively, than fermentation without fragmentation.
The concentration of Chl a in C. formosanum fermented with P. haloplanktis ATCC 14393 in the two-stage experiment is shown in Figure 9. After the strong fragmentation step, the concentration of Chl a was 6.67 mg·L−1, which was much higher than in the single-stage experiment (2.39 mg·L−1). The concentration of Chl an increased during the first and second phases of fermentation, along with an increase in fermentation time. The highest concentration (26.17 mg·L−1) was obtained at the end of fermentation (60 h) and was about 18.3% higher than the highest Chl a concentration obtained by fermentation without fragmentation.

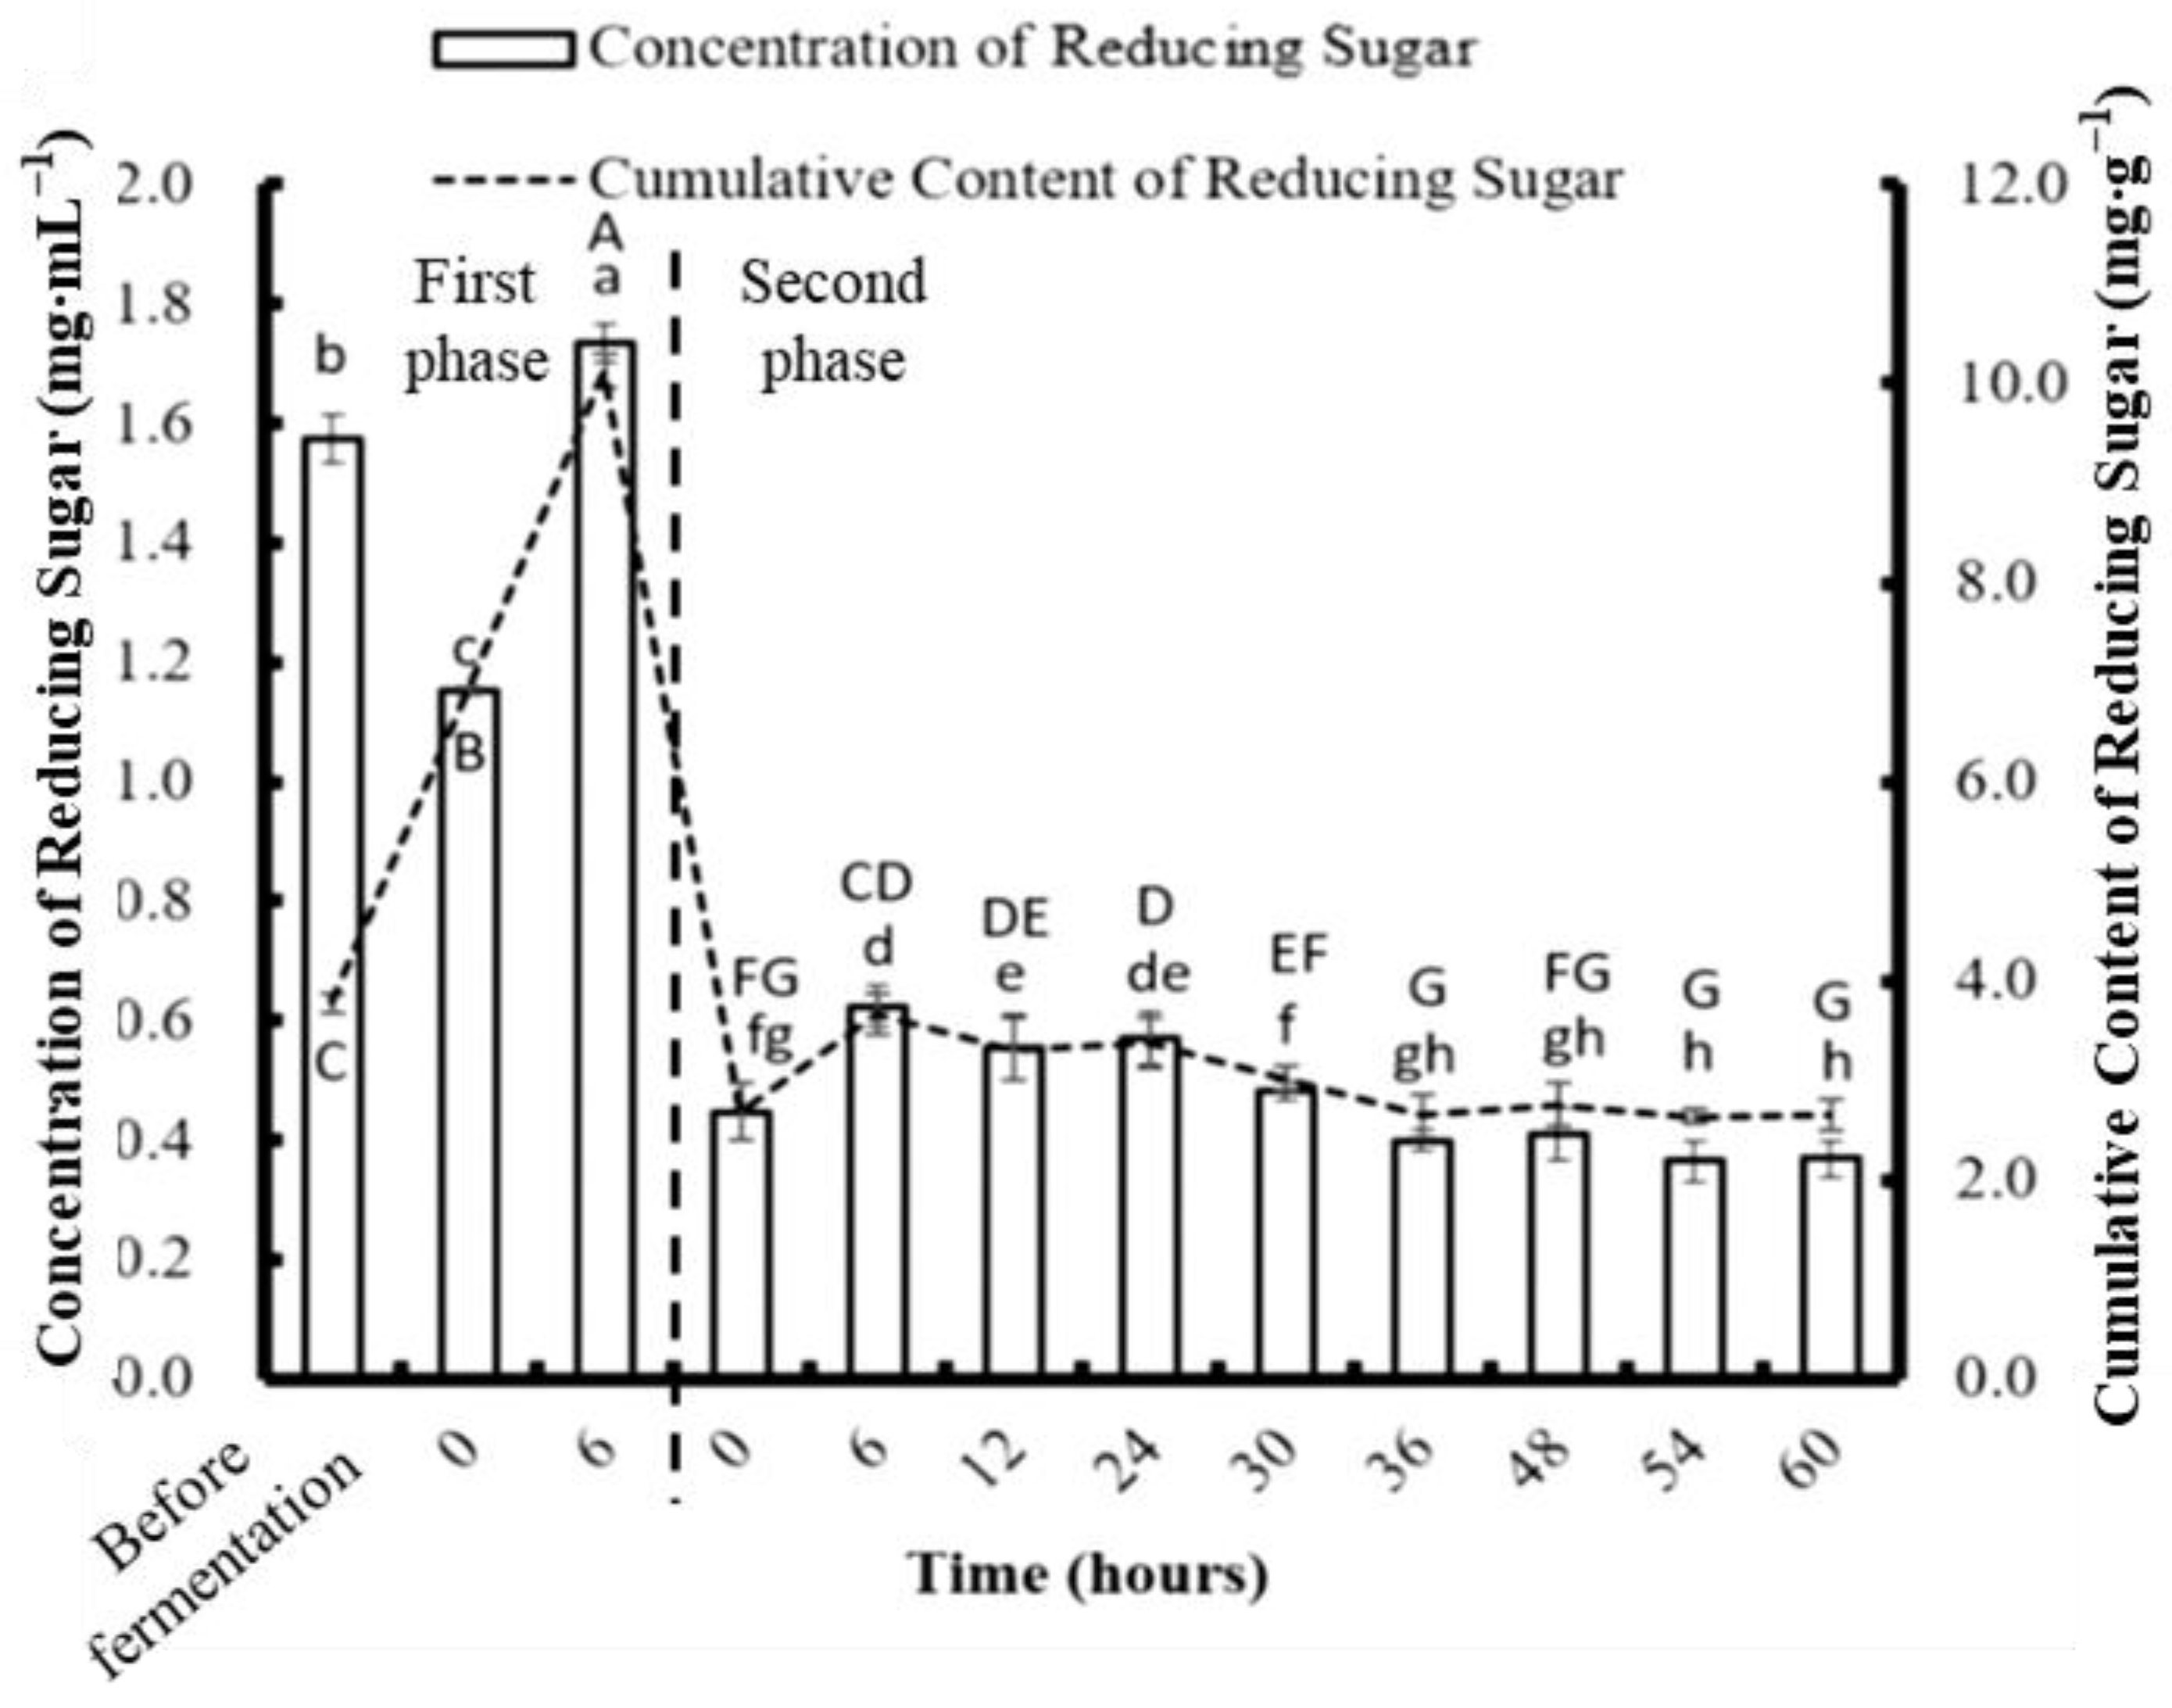
3.5. Determination of Reducing Sugar Concentration Obtained from Two-Stage Fermentation

The concentration of reducing sugar in C. formosanum after different durations of two-stage fermentation with P. haloplanktis ATCC 14393 is shown in Figure 10. After fragmentation, the detected concentration of the reducing sugar (1.574 mg mL−1) was slightly higher than the previous result achieved without fragmentation (1.569 mg mL−1). At the end of the first phase of fermentation, the highest concentration of reducing sugar was produced: 10.13 mg per gram of algae. This could be attributed to the more complete breakage of the cell wall of the alga by the strong fragmentation than the crude fragmentation used during the single-stage experiment. The fragmentation may assist the metabolism of P. haloplanktis ATCC 14393 because the bacterium has more direct access to nutrients to produce greater amounts of reducing sugar.

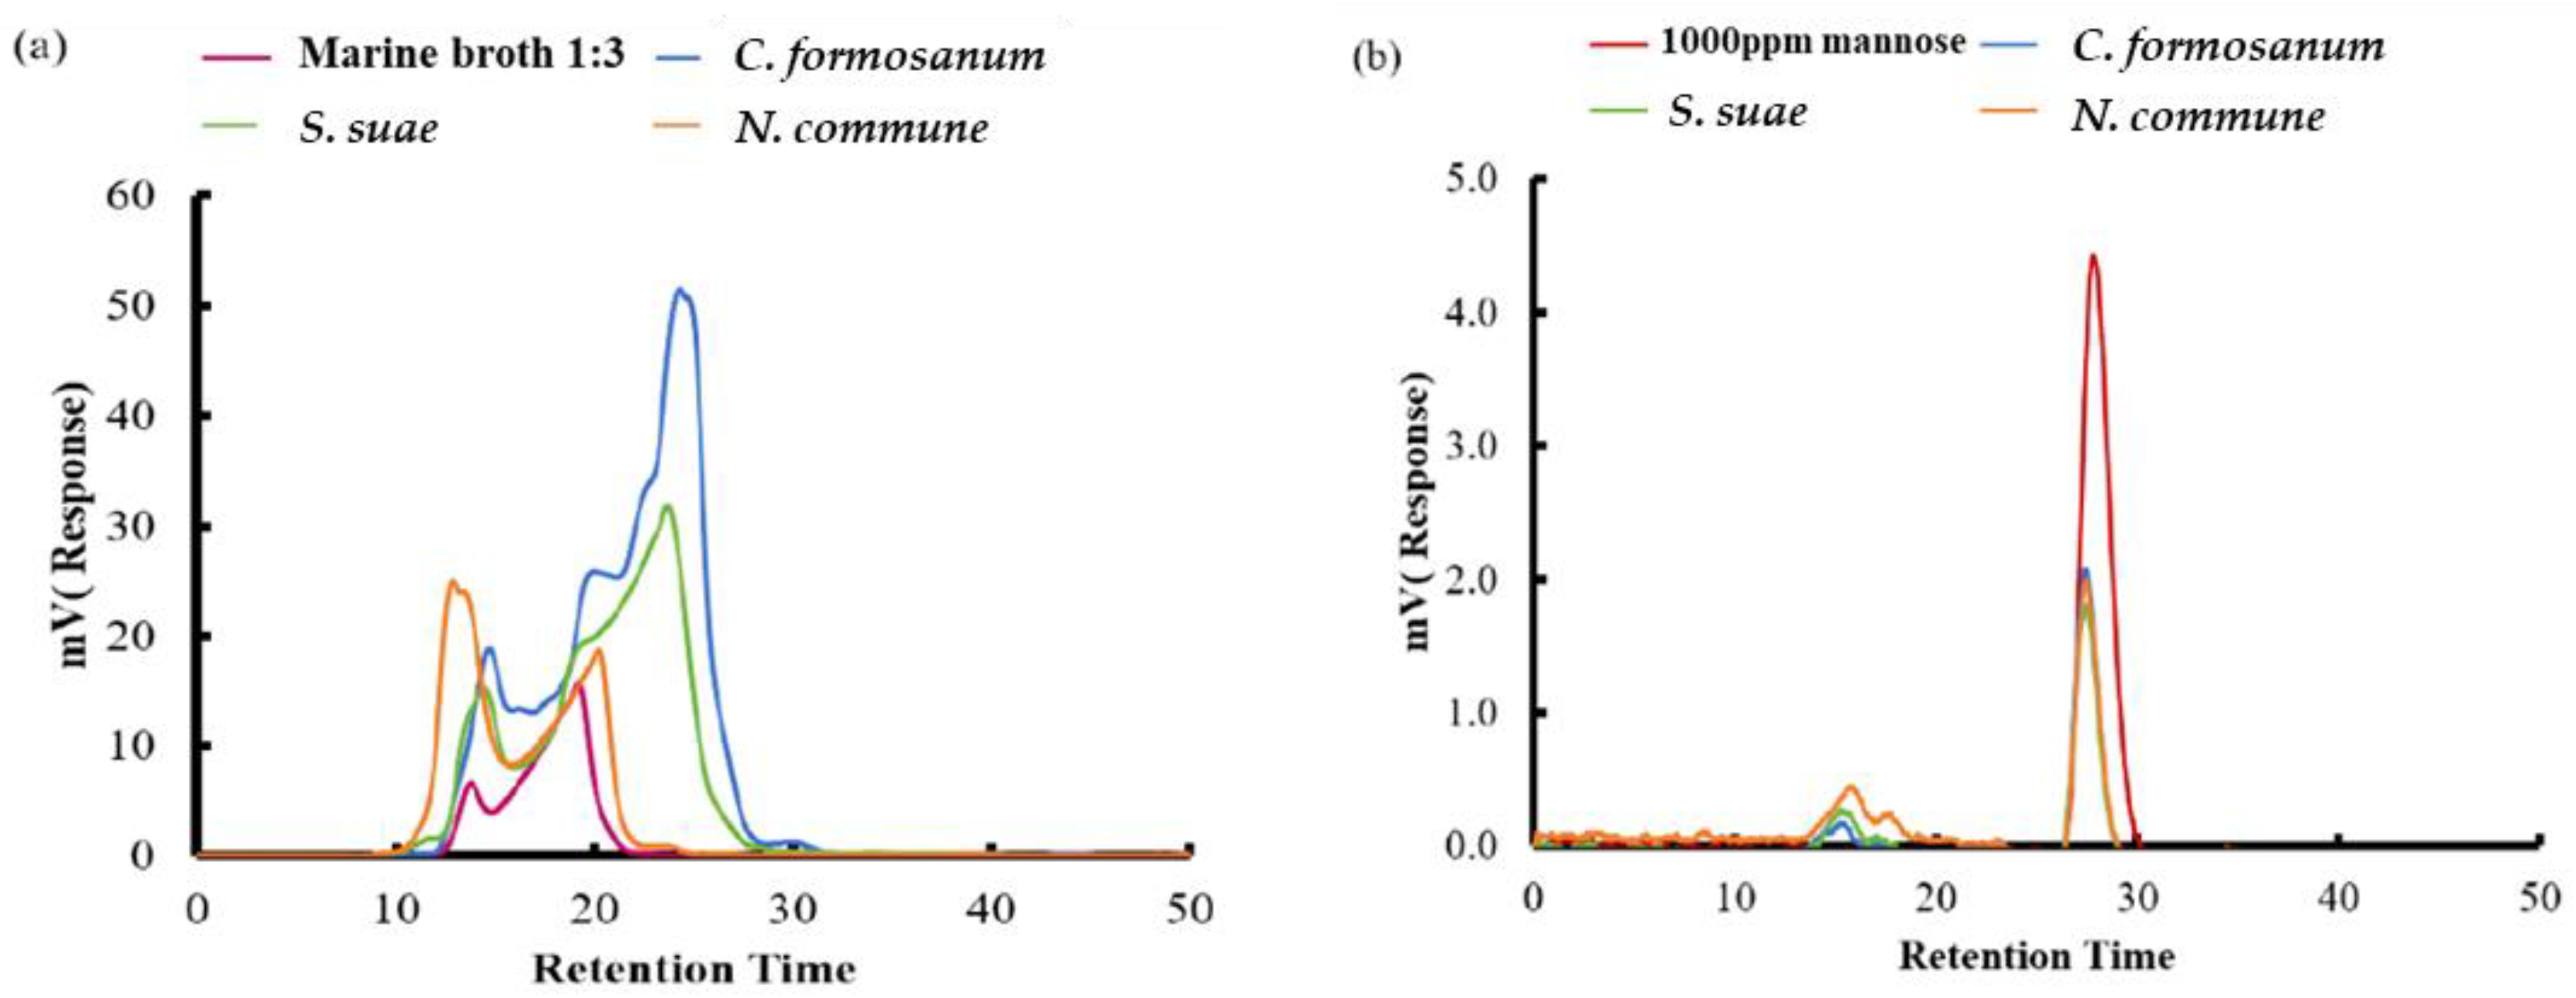
3.6. Determination of Saccharide Composition Obtained from Fermentation with P. haloplanktis ATCC 14393

The type of reducing sugar in C. formosanum, S. suae, and N. commune after two-stage fermentation with P. haloplanktis ATCC 14393 was determined (Figure 11). The produced saccharide was analyzed by HPLC. After fermentation, mannose was detected in the saccharide extracted from C. formosanum, S. suae, and N. commune, indicating that P. haloplanktis ATCC 14393 can enhance the amount of mannose production under fermentation by degrading the polysaccharide from algae. To better understand this effect, an NMR assay was further applied to analyze the monosaccharide composition by detecting enzyme hydrolysis in C. formosanum, S. suae, and N. commune (Table 1). Results reveal that after fermentation with P. haloplanktis ATCC 14393, the sugar contained in the three algae was converted to mannose as the major product. Total sugar content of C. formosanum and S. suae was lower than before, but the production of mannose was elevated.

4. Discussion

An enhanced release of bioactive compounds, such as chlorophyll from spinach, was previously determined to be due to cell rupture and extraction through the cell wall [16]. The current study revealed that a combined fragmenting and fermenting method obtained more Chl a than a method that involves fermentation without fragmentation.
According to a previous study, Pseudoalteromonas spp. have generally been claimed to have the ability to degrade carbohydrate by producing multiple extracellular enzymes (amylase, agarase, carrageenase, xylanase, and cellulase) that can break down the polysaccharides into small units [17]. Notably, the strain P. haloplanktis ATCC 14393, which was utilized in this study for fermentation, was discovered to have the L-Arabinose isomerase, which can catalyze the isomerization between L-arabinose and L-ribulose, in addition to catalyzing D-galactose into D-tagatose [18].
The carbohydrate composition of the three algae used in this study was analyzed previously. The compositions are as follows: C. formosanum with mannose: glucose: galactose: xylose = 11.7%:24.5%:35.6%:28.2% (w/w); S. suae with galactose = 90.9% (w/w) as the major constituent; N. commune with glucose: xylose: fucose = 52.7%:19.2%:21.6% (w/w) (unpublished data by MC Lee). Based on these analysis results, we hypothesized that the cell walls of those algae can be hydrolyzed by P. haloplanktis ATCC 14393 during fermentation. In this study, we applied P. haloplanktis ATCC 14393 in the fermentation of fragmented algae. The result confirmed the hypothesis on the function of P. haloplanktis ATCC 14393 in fermentation. This indicates that fermentation of algae with P. haloplanktis ATCC 14393 can produce pigmented proteins and reducing sugar. Depending on the demand of the product, the best fermentation conditions for pigmented protein and reducing sugar production can be inferred from this study.
A previous study focused on the extraction of PE from Gelidium pusillum by enzymatic hydrolysis demonstrated that a mixture of enzymes (agarase, xylanase, and cellulase) at 25 °C for 5 h significantly improved the extraction yield of PE compared to individual enzymes, which resulted in low extraction efficiency (0.29 mg PE per gram of dry algae) [19]. Referring to our own results, we can conclude that P. haloplanktis ATCC 14393 can utilize C. formosanum, S. suae, and N. commune as substrates. After strong fragmentation followed by two phases of bacteria addition, the algae were more completely hydrolyzed by the bacteria. The hydrolysis of algae leads to breaking of the cells and the release of bioactive substances.
Our result suggests that with the addition of P. haloplanktis ATCC 14393 to the fermentation process, more phycobiliproteins and Chl a can be extracted from algae. As the cell walls of algae are a complex composite made of cellulose, xylan, or mannan fibrils and complex matrix polysaccharides, including carrageenan and agar, degradation by enzymes is expected to release sugars into the extract [20]. After fermentation, mannose and xylose can be detected in samples from C. formosanum and S. suae, whereas mannose and other unknown sugars were detected in the N. commune samples. Our data indicate that P. haloplanktis ATCC 14393 used glucose and galactose as nutrients during the fermentation of these three algae. The variation in reducing sugar concentration shows that C. formosanum contains a higher percentage of glucose and galactose than S. suae or N. commune.
The optimum condition to obtain the most reducing sugar from C. formosanum was determined to be a 12 h fermentation by P. haloplanktis ATCC 14393, which prevented the glucose and galactose from being exhausted. Additionally, the optimum condition to obtain the most reducing sugar from S. suae and N. commune was a 72 h fermentation. The greater disruption to the cell walls of the algae produced by the strong fragmentation may assist the metabolism of P. haloplanktis ATCC 14393 because a more direct access to nutrients was provided for the bacteria. Therefore, more reducing sugar can be produced by the bacteria during the two-stage fermentation. As reported by [21], manipulation of a fermentation step allowed yeasts to use almost all glucose and galactose from coffee residue waste to produce ethanol while retaining large amounts of d-mannose in the fermented broth. We described a feasible fermentation technique that can be used to produce phycobiliproteins and mannose from algae, which is widely available. Due to the potential use of the extracted products in pharmaceutical or research fields (in particular, phycoerythrin has been used as fluorochromes in immunoassays [22]), purification and sterile processes, such as salting-out and filtration, are necessary after the biorefinery process, which is our further research point. In view of the success of fermentation in this research, we suggest that P. haloplanktis ATCC 14393 is an ideal species to ferment algae; in contrast, the threshold in the culture of this bacteria was lower than enzyme collection. Thus, P. haloplanktis ATCC 14393 has high potential to be used for the industrial mass production of algae, and it is worth establishing a scale-up technique for this process in the future.

5. Conclusions

C. formosanum, S. suae, and N. commune were fermented by P. haloplanktis ATCC 14393, and the extraction efficiency of phycobiliproteins and chlorophyll a was increased. For one-step fermentation, a 6 h fermentation is most efficient for collecting phycobiliproteins from C. formosanum and S. suae. Fragmentation in combination with fermentation demonstrated an improved ability to disrupt the complex polysaccharide matrix of the cell wall, resulting in a higher degree of extraction. In C. formosanum, the PE, PC, APC, and Chl a produced during the two-stage fermentation were about 306.9%, 103.8%, 76.3%, and 18.3% higher, respectively, than fermentation without fragmentation. The combined fragmenting and fermenting method collected about three times more reducing sugar than the 6 h one-stage fermentation (without fragmentation). Nuclear magnetic resonance (NMR) analysis was carried out to assess the composition of saccharides after fermentation. P. haloplanktis ATCC 14393 can hydrolyze cellulose and consume glucose and galactose to produce mannose. The bacteria-assisted methods described here can be employed for the enhanced extraction and conversion of biomolecules from other macroalgae to create more economic value. The future scope of this work will include optimizing the conditions of fermentation and the consecutive separation of phycobiliproteins and mannose from the reaction mixture.

Author Contributions

Methodology, M.-C.L. and F.-H.N.; investigation, M.-C.L. and C.-Y.H.; formal analysis, M.-C.L., H.-Y.Y., J.H., C.-L.L., W.Q.C.L. and P.-T.L.; writing—review and editing, supervision, M.-C.L.; writing—original draft, C.-Y.H.; data curation, H.-Y.Y., J.H., C.-L.L., W.Q.C.L., P.-T.L. and F.-H.N.; conceptualization, F.-H.N.; project administration, F.-H.N. All authors have read and agreed to the published version of the manuscript.

Funding

This research received no external funding.

Institutional Review Board Statement

Not applicable.

Informed Consent Statement

Not applicable.

Data Availability Statement

Not applicable.

Acknowledgments

Not applicable.

Conflicts of Interest

The authors declare that they have no known competing financial interest or personal relationship that could have appeared to influence the work reported in this paper.

Abbreviations

S. suaeSarcodia suae
N. communeNostoc commune
P. haloplanktis, ATCC 14393Pseudoalteromonas haloplanktis ATCC 14393
PEphycoerythrin
PCphycocyanin
APCallophycocyanin
Chl aChlorophyll a
NMRnuclear magnetic resonance

Appendix A

The growth curve of Pseudoalteromonas haloplanktis ATCC 14393 cultured in marine broth. The growth of P. haloplanktis ATCC 14393 was observed, revealing its log phase and stationary phase.

References

  1. Ganesan, A.R.; Tiwari, U.; Rajauria, G. Seaweed nutraceuticals and their therapeutic role in disease prevention. Food Sci. Hum. Wellness 2019, 8, 252–263. [Google Scholar] [CrossRef]
  2. Domozych, D.S.; Ciancia, M.; Fangel, J.U.; Mikkelsen, M.D.; Ulvskov, P.; Willats, W.G. The Cell Walls of Green Algae: A Journey through Evolution and Diversity. Front. Plant Sci. 2012, 3, 82. [Google Scholar] [CrossRef] [Green Version]
  3. Synytsya, A.; Čopíková, J.; Kim, W.-J.; Park, Y.I. Cell Wall Polysaccharides of Marine Algae. In Springer Handbook of Marine Biotechnology; Kim, S.K., Ed.; Springer: Berlin/Heidelberg, Germany, 2015. [Google Scholar] [CrossRef]
  4. Deniaud-Bouët, E.; Hardouin, K.; Potin, P.; Kloareg, B.; Hervé, C. A review about brown algal cell walls and fucose-containing sulfated polysaccharides: Cell wall context, biomedical properties and key research challenges. Carbohydr. Polym. 2017, 175, 395–408. [Google Scholar] [CrossRef] [PubMed]
  5. Terauchi, M.; Nagasato, C.; Inoue, A.; Ito, T.; Motomura, T. Distribution of alginate and cellulose and regulatory role of calcium in the cell wall of the brown alga Ectocarpus siliculosus (Ectocarpales, Phaeophyceae). Planta 2016, 244, 361–377. [Google Scholar] [CrossRef] [PubMed]
  6. Ferrell, J. Sarisky-Reed, Valerie. National Algal Biofuels Technology Roadmap; EERE Publication and Product Library: Washington, DC, USA, 2010. [Google Scholar] [CrossRef] [Green Version]
  7. Sawant, S.; Salunke, B.; Tran, K.; Kim, B.S. Lignocellulosic and marine biomass as resource for production of polyhydroxyalkanoates. Korean J. Chem. Eng. 2016, 33, 1505–1513. [Google Scholar] [CrossRef]
  8. Phwan, C.K.; Ong, H.C.; Chen, W.-H.; Ling, T.C.; Ng, E.P.; Show, P.L. Overview: Comparison of pretreatment technologies and fermentation processes of bioethanol from microalgae. Energy Convers. Manag. 2018, 173, 81–94. [Google Scholar] [CrossRef]
  9. Wilmes, B.; Hartung, A.; Lalk, M.; Liebeke, M.; Schweder, T.; Neubauer, P. Fed-batch process for the psychrotolerant marine bacterium Pseudoalteromonas haloplanktis. Microb. Cell Fact. 2010, 9, 72. [Google Scholar] [CrossRef] [PubMed] [Green Version]
  10. Kim, J.D.; Kim, J.Y.; Park, J.K.; Lee, C.G. Selective control of the Prorocentrum minimum harmful algal blooms by a novel algal-lytic bacterium Pseudoalteromonas haloplanktis AFMB-008041. Mar. Biotechnol. 2009, 11, 463–472. [Google Scholar] [CrossRef] [PubMed]
  11. Sekar, S.; Chandramohan, M. Phycobiliproteins as a commodity: Trends in applied research, patents and commercialization. J. Appl. Phycol. 2008, 20, 113–136. [Google Scholar] [CrossRef]
  12. Spolaore, P.; Joannis-Cassan, C.; Duran, E.; Isambert, A. Commercial applications of microalgae. J. Biosci. Bioeng. 2006, 101, 87–96. [Google Scholar] [CrossRef] [Green Version]
  13. Limantara, L.; Dettling, M.; Indrawati, R.; Indriatmoko Brotosudarmo, T.H.P. Analysis on the Chlorophyll Content of Commercial Green Leafy Vegetables. Procedia Chem. 2015, 14, 225–231. [Google Scholar] [CrossRef] [Green Version]
  14. Ghose, T. Measurement of cellulase activities. Pure Appl. Chem. 1987, 59, 257–268. [Google Scholar] [CrossRef]
  15. Tseng, C.-C.; Yeh, H.-Y.; Liao, Z.-H.; Hung, S.-W.; Chen, B.; Lee, P.-T.; Nan, F.-H.; Shih, W.-L.; Chang, C.-C.; Lee, M.-C. An in vitro study shows the potential of Nostoc commune (Cyanobacteria) polysaccharides extract for wound-healing and anti-allergic use in the cosmetics industry. J. Funct. Foods 2021, 87, 104754. [Google Scholar] [CrossRef]
  16. Özkan, G.; Ersus Bilek, S. Enzyme-assisted extraction of stabilized chlorophyll from spinach. Food Chem. 2015, 176, 152–157. [Google Scholar] [CrossRef] [PubMed]
  17. Holmström, C.; Kjelleberg, S. Marine Pseudoalteromonas species are associated with higher organisms and produce biologically active extracellular agents. FEMS Microbiol. Ecol. 1999, 30, 285–293. [Google Scholar] [CrossRef]
  18. Xu, W.; Fan, C.; Zhang, T.; Jiang, B.; Mu, W. Cloning, Expression, and Characterization of a Novel L-Arabinose Isomerase from the Psychrotolerant Bacterium Pseudoalteromonas haloplanktis. Mol. Biotechnol. 2016, 58, 695–706. [Google Scholar] [CrossRef] [PubMed]
  19. Mittal, R.; Raghavarao, K.S.M.S. Extraction of R-Phycoerythrin from marine macro-algae, Gelidium pusillum, employing consortia of enzymes. Algal Res. 2018, 34, 1–11. [Google Scholar] [CrossRef]
  20. Le Guillard, C.; Bergé, J.-P.; Donnay-Moreno, C.; Bruzac, S.; Ragon, J.-Y.; Baron, R.; Fleurence, J.; Dumay, J. Soft liquefaction of the red seaweed Grateloupia turuturu Yamada by ultrasound-assisted enzymatic hydrolysis process. J. Appl. Phycol. 2016, 28, 2575–2585. [Google Scholar] [CrossRef] [Green Version]
  21. Nguyen, Q.A.; Cho, E.; Trinh, L.T.P.; Jeong, J.S.; Bae, H.J. Development of an integrated process to produce d-mannose and bioethanol from coffee residue waste. Bioresour. Technol. 2017, 244, 1039–1048. [Google Scholar] [CrossRef] [PubMed]
  22. Tario, J.D.; Wallace, P.K. Reagents and Cell Staining for Immunophenotyping by Flow Cytometry. In Pathobiology of Human Diseas; McManus, L.M., Mitchell, R.N., Eds.; Academic Press: Cambridge, MA, USA, 2014; pp. 3678–3701. [Google Scholar] [CrossRef]
Figure 1. The concentration of phycoerythrin in (a) Colaconema formosanum, (b) Sarcodia suae, and (c) Nostoc commune as substrates fermented with Pseudoalteromonas haloplanktis, ATCC 14393.
Fermentation 08 00343 g001
Figure 2. The concentration of phycocyanin in Colaconema formosanum, Sarcodia suae, and Nostoc commune as substrates fermented with Pseudoalteromonas haloplanktis, ATCC 14393.
Fermentation 08 00343 g002
Figure 3. The concentration of allophycocyanin in (a) Colaconema formosanum, (b) Sarcodia suae, and (c) Nostoc commune as substrates fermented with Pseudoalteromonas haloplanktis, ATCC 14393.
Fermentation 08 00343 g003
Figure 4. The concentration of chlorophyll a in (a) Colaconema formosanum, (b) Sarcodia suae, and (c) Nostoc commune as substrates fermented with Pseudoalteromonas haloplanktis, ATCC 14393.
Fermentation 08 00343 g004
Figure 5. The concentration of reducing sugar in (a) Colaconema formosanum, (b) Sarcodia suae, and (c) Nostoc commune as substrates fermented with Pseudoalteromonas haloplanktis, ATCC 14393.
Fermentation 08 00343 g005
Figure 6. The effect of different fermentation times on the concentration and content of phycoerythrin in Colaconema formosanum before and during two-phase fermentation with Pseudoalteromonas haloplanktis, ATCC 14393. Lowercase letters (a, b, c…): concentration of phycoerythrin between each fermentation time; uppercase letters (A, B, C…): content of phycoerythrin between each fermentation time (n = 3, Duncan’s test, p < 0.05).
Fermentation 08 00343 g006
Figure 7. The effect of different fermentation times on the concentration and content of phycocyanin in Colaconema formosanum before and during two-phase fermentation with Pseudoalteromonas haloplanktis, ATCC 14393. Lowercase letters (a, b, c…): concentration of phycocyanin between each fermentation time; uppercase letters (A, B, C…): content of phycocyanin between each fermentation time (n = 3, Duncan’s test, p < 0.05).
Fermentation 08 00343 g007
Figure 8. The effect of different fermentation times on the concentration and content of allophycocyanin in Colaconema formosanum before and during two-phase fermentation with Pseudoalteromonas haloplanktis, ATCC 14393. Lowercase letters (a, b, c…): concentration of allophycocyanin between each fermentation time; uppercase letters (A, B, C…): content of allophycocyanin between each fermentation time (n = 3, Duncan’s test, p < 0.05).
Fermentation 08 00343 g008
Figure 9. The concentration of chlorophyll a in Colaconema formosanum before and during two-phase fermentation with Pseudoalteromonas haloplanktis, ATCC 14393. Lowercase letters (a, b, c…): concentration of chlorophyll a between each fermentation time (n = 3, Duncan’s test, p < 0.05).
Fermentation 08 00343 g009
Figure 10. The effect of different fermentation times on the concentration and content of reducing sugar in Colaconema formosanum before and during two-phase fermentation with Pseudoalteromonas haloplanktis, ATCC 14393. Lowercase letters (a, b, c…): concentration of reducing sugar between each fermentation time; uppercase letters (A, B, C…): content of reducing sugar between each fermentation time (n = 3, Duncan’s test, p < 0.05).
Fermentation 08 00343 g010
Figure 11. The mannose variation of Colaconema formosanum, Sarcodia suae, and Nostoc commune assayed by HPLC analysis (a) before fermentation and (b) after fermentation. Fermented C. formosanum, S. suae, and N. commune were diluted 100 times with deionized water before passing the HPLC column.
Fermentation 08 00343 g011
Table 1. Colaconema formosanum, Sarcodia suae, and Nostoc commune through enzyme hydrolysis have different levels of monosaccharides before and after fermentation assayed by NMR analysis.
SampleTotal Sugar % (w·w1)Mannose % (w·w1)Glucose % (w·w1)Galactose % (w·w1)Xylose % (w·w1)Others % (w·w1)
BeforeAfterBeforeAfterBeforeAfterBeforeAfterBeforeAfterBeforeAfter
C. formosanum70.747.211.718.824.5-35.617.128.264.1--
S. suae68.953.8-37.5--9139.29.023.3--
N. commune42.281.9-6.573.264.220.917.53.9-2.011.8
1: ‘Before’ is expressed as before fermentation; ‘after’ is expressed after fermentation, but the sample proceeded enzyme hydrolysis before HPLC analysis; 2: Stage-one experiment: protocol A, B, and C; 3: Moisture content was controlled at 95 ± 1%.
Publisher’s Note: MDPI stays neutral with regard to jurisdictional claims in published maps and institutional affiliations.

