1. Introduction
The gluten-free (GF) product market is expected to expand in the next five years at a CAGR (annual compound growth rate) of approximately 10% [
1]. The increase at a global level of celiac-related diseases, as well as the supposed safer GF diet among healthy consumers, will boost the consumption of GF foods, which have now switched from niche to mainstream products. The GF bakery segment accounts for the largest market share, with GF bread being one of the most widespread products with several commercial goods available on the market in any distribution channel [
2]. However, gluten removal in bread poses many issues from the technological, nutritional, and organoleptic perspectives. Gluten is responsible for the rheological properties of the wheat-based dough and batter, as well as the product’s final structure, with its subtraction leading to less cohesive, non-elastic, hardly leavening, and difficult-to-handle batter and dough. Different flours and starches have been exploited to address these problems, although they have been proven to possess a limited structure-building capacity. This makes the addition of proteins, hydrocolloids, and other additives practically unavoidable to ensure physically acceptable features of GF bread [
3]. Several technological strategies, including high hydrostatic pressure, non-conventional heating methods (microwave, infrared, ohmic, or hybrid), extrusion cooking, active packaging, and sourdough fermentation, have been applied for the same purposes [
4,
5]. From the nutritional point of view, as GF flour and starches are generally high in carbohydrates but low in protein quantity and quality, dietary fibers, and micronutrients, nutritional deficiencies issues related to GF bread consumption should be considered as well [
3]. Moreover, due to the complex formulation, the sensory characteristics of GF Gluten-free bread are generally different in terms of appearance, color, texture, aroma, and taste in comparison to the wheat-made counterpart [
4].
All things considered, one unique ingredient is not able to fully cover all the gluten functions during the bread-making process, resulting in a long list of ingredients/additives to be included. Different compounds can exert a positive effect on one or more quality aspects, while, at the same time, interfering with others, making the proper formulation and processing of GF bread two challenging tasks that still need to be addressed.
Kefir is fermented milk claimed to confer many health-promoting effects [
6]. It can be obtained by mixing kefir grains with milk. Once lactic and alcoholic fermentation occurs, grains can be removed and reused. Kefir granules consist of a symbiotic agglomerate of microorganisms, mainly LAB, acetic acid bacteria, and yeasts, surrounded by a viscous matrix of kefiran. The latter is an exopolysaccharide contributing to kefir’s nutritional properties along with the microorganisms themselves, and many bioactive compounds formed during fermentation or arising from the breakdown of the food matrix. Owing to its nutritional and technological properties, kefir has been exploited as a functional ingredient in the food industry [
7], including the wheat-bread-making process [
8,
9,
10,
11,
12]. More recently, kefir fortification with plant-derived extracts has been recently reviewed by Aiello et al., opening up the possibility of providing foods with other specific bioactive characteristics, in addition to kefir’s peculiar features [
13].
Carob (
Ceratonia siliqua L.) is an evergreen arboreal species belonging to the Leguminosae family. It can be farmed for commercial purposes, although wild-grown carob can also be found extensively as an important component in the Mediterranean environment. Although known for centuries, the carob crop has remained underutilized in recent decades, mostly exploited as a grazing plant and/or as a by-product of the agri-food industry. However, carob pods (pulp and seeds), and to a less extent, the carob leaves, have gained attention in recent years for their nutritional and health features, showing great potential for food, cosmetic, and pharmaceutical applications [
14,
15]. In particular, the extracts obtained from carob leaves have been claimed to possess significant antiproliferative, antioxidant, and enzyme inhibitory activity [
16,
17].
In this context, the research is focused on the preparation of a functional GF bread, obtained by partially replacing water with kefir samples enriched with carob (Ceratonia siliqua L.) leaves extracts as, to the best of authors’ knowledge, this kind of formulation has never been reported elsewhere. The leaves of two carob varieties (Selvatica and Amele) were considered and characterized in terms of their antioxidant features. Different extraction strategies (Soxhlet or ultrasound-assisted extraction) were evaluated by employing water, ethanol, or hydroalcoholic mixture as eco-friendly solvents to select the best extract to be added to the kefir beverage. Finally, during the functional GF bread preparation, the effects on the rheology and shelf-life of the obtained products were investigated.
2. Materials and Methods
2.1. Chemicals and Reagents
Chlorogenic acid was purchased from Phytolab (Aprilia, Noale, Italy). Gallic acid, 4-hydroxy-benzoic acid, ferulic acid, 4-hydroxy-coumaric acid, caffeic acid, syringic acid, catechin, epigallocatechin, epicatechin gallate, epigallocatechin gallate, quercitrin, myricitrin, and rutin were purchased from Extrasynthese (Genay, France) and used as HPLC reference standards. Other chemicals and reagents used in this study were purchased from Merck (Darmstadt, Germany) and VWR International (Milan, Italy) and, unless specified otherwise, were of analytical grade or higher. Formic acid, ethanol, HPLC grade water, and acetonitrile were supplied by Merk Life Science S.r.l. (Milan, Italy). Other solvents and standards were purchased from Merck (Darmstadt, Germany).
2.2. Carob Leaves Extraction
The leaves used in this study belong to two different cultivars of the Carob tree, Selvatica (CS) and Amele (CA), cultivated in the Apulia region (southern Italy, Ostuni (BR)). The extracts obtained using the Ultrasound-Assisted Method (UAE) are labeled CSU and CAU, and those using the Soxhlet are labeled CSS and CAS, respectively. Two solvents were employed: Absolute ethanol (1) and water (2). In a standard procedure, 1.0 g of freeze-dried CS and CA was suspended in 50 mL of solvent and sonicated for 30 min, 40 KHz at 40 °C. The extracts were filtered on Whatman paper N°3, and the resulting solution was dried under vacuum until a constant weight was reached (sample CSU1 and CAU1) or frozen and freeze-dried (freeze dryer Micro Modulyo, Edwards), to afford a vaporous solid (CSU2 and CAU2). Alternatively, 1.0 g of CS and CA, suspended in 100 mL of solvent, was refluxed in a Soxhlet apparatus for 5 h. The extracts were filtered on Whatman paper N°3 and dried under vacuum until a constant weight was reached (sample CSS1 and CAS1). Each extraction was performed in triplicate, and data were expressed as means (±SD). All the extracts were stored at −20 °C before the analysis.
2.3. Characterization of the Extracts by HPLC-DAD
Polyphenol analysis was carried out by HPLC 1260 (Agilent Technologies, Palo Alto, Santa Clara, CA, USA), equipped with a degasser, quaternary pump solvent delivery, thermostated column compartment, and diode array detector. The extracts (3 μL) were injected onto a reverse stationary phase column, Zorbax SB-C18 (Agilent Technologies, Palo Alto, Santa Clara, CA, USA) 3.5 μm (150 × 4.6 mm i.d.), protected by a pre-column, Gemini C18 (Phenomenex, Torrance, CA, USA) 5 μm (4 × 2 mm i.d.), and maintained at 40 °C. Water/formic acid (99.9:0.1, v/v) (solvent A) and acetonitrile (solvent B) were adopted as mobile phase through a binary gradient: 0 min, 10% B; 4 min, 15% B; 8 min, 15% B; 15 min, 30% B; 18 min, 40% B; 22 min, 55% B; 25 min, 55% B; 30 min, 100% B; 32 min, 100% B; 35 min, 10% B; stop time to 35 min. Finally, the column was re-equilibrated with the initial solvent mixture for 5 min. The flow was maintained at 0.8 mL min−1. Diode array detection was between 190 and 400 nm, and absorbance was recorded at 360, 330, and 280 nm. The positions of absorption maxima (λmax.), absorption spectra profile, and retention times (RT) were matched with those from pure standards and used for the compound’s identification. The quantification of polyphenols was performed using the calibration curves in the concentration range of 100-1.25 μg mL−1 of gallic acid (R2 = 0.9975; LOD = 0.094 μg mL−1; LOQ = 0.313 μg mL−1), 4-hydroxy-coumaric acid (R2 = 0.9977; LOD = 0.0082 μg mL−1; LOQ = 0.0302 μg mL−1), and myricitrin (R2 = 0.9974; LOD = 0.094 μg mL−1; LOQ = 0.313 μg mL−1). The detection limit (LOD) and quantification limit (LOQ) were calculated on the basis of chromatograms and defined as a signal-to-noise (six times SD of baseline) ratio of 3 and 10, respectively.
2.4. Polyphenols’ Total Content
The amount of total phenolic content (TPC) in the extracts, expressed in milligrams of gallic acid (GA) per gram of dry sample (mg GA/g dry sample), was determined using the Folin–Ciocalteu reagent by following literature protocols with some changes [
18]. The detailed procedure is reported in the
Supplementary Materials section.
2.5. Phenolic Acid Content
The Arnov test, with some modifications, was used to evaluate the phenolic acid content (PAC) in each extract [
19]. The recorded data were expressed as milligrams of gallic acid per gram of sample (mg GA/g sample). The detailed procedure is reported in the
Supplementary Materials section.
2.6. Flavonoid Content
Flavonoid content (FC) in each extract was determined by a spectrophotometric method reported in the literature with some modifications, and the data were expressed as milligrams of gallic acid per gram of sample (mg GA/g sample) [
20]. The detailed procedure is reported in the
Supplementary Materials section.
2.7. Antioxidant Performances
Free radical scavenging properties of the extracts were estimated toward DPPH (2,2-diphenyl-1-picrylhydrazyl) and ABTS (2,20-azinobis (3-ethylbenzothiazoline-6-sulphonic acid)) radicals [
21]. The scavenging activity of the samples was expressed in terms of IC
50. The antioxidant capacity of the extracts expressed as Trolox equivalents was evaluated following a literature protocol with some changes [
22]. Detailed procedures are reported in the
Supplementary Materials section.
2.8. Preparation of Milk Kefir Fortified with CSU2
In a single-neck glass flask containing 400 mL of pasteurized whole milk, 40 g of Kefir grains KEFIRALIA (Burumart Commerce S.L, Arrasate, Spagna) was added. The glass of kefir, covered with a cotton napkin, was stored at 25 °C for 24 h. After this, the kefir grains were filtered off and the fermented milk was stored at 25 °C for an additional 24 h. Furthermore, 50.0, 150.0, 250.0, and 400.0 mg of CSU2 were added to 10 g of the fermented milk in order to prepare four kefir samples with extract concentrations equal to 5.0 mg g−1 (KF5), 15.0 mg g−1 (KF15), 25.0 mg g−1 (KF25), and 40.0 mg g−1 (KF40), respectively. The samples were kept at 25 °C for 24 h before use. The control sample (KB) was prepared using only kefir milk without the leaves extract.
2.9. Antioxidant Characterization of the Fortified Kefir
The evaluation of the TPC in the enriched kefir samples was performed by the Folin–Ciocalteu assay using the protocol reported for the extracts, and the results were expressed as milligrams of catechin per gram of kefir. Antioxidant performances of the kefir were examined by a TEAC assay and measuring the scavenger activity against the DPPH and ABTS radical species.
2.10. Gluten-Free Bread Preparation
The bread was prepared by following a procedure reported in the literature with some modifications [
9]. A straight dough process was performed using rice flour (200.0 g), yeast (3.0 g), salt (2.0 g), sugar (10.0 g), seed oil (15.0 mL), and water (155.0 mL). Water was partially replaced by KB or KF5. According to the volume of the kefir, three different formulations were prepared, labeled PB50 (50 mL of KB), PB150 (150 mL of KB), and PKF5 (150 mL of KF5). The dough was also prepared without any kefir additions (PB) and used as a control. Each dough was prepared by mixing the ingredients for 20 min using a planetary mixer (speed 2) at 25 ± 2 °C. The lyophilized yeast was firstly solubilized in the water, while other ingredients were gradually added during the mixing. The rising time for each dough was 4 h. The oven was preheated at 180 °C for 30 min and the doughs were then baked at 180 °C for 35 min, with 10 % relative humidity. Three experimental replicates for each formulation were tested. Two hours after baking, bread samples were stored at 20 ± 2 °C in polyethylene bags to evaluate their stability. Rheological and antioxidant features of the bread were then measured at different storage periods (1, 2, and 6 days).
2.11. Rheological Characterization of Dough and Bread Samples
The rheological measurements on the doughs were carried out using a strain-controlled rheometer RFS III (Rheometric Scientific Inc. at Piscataway, NJ, USA) equipped with plate-plate geometry: Gap 2 mm, Φ 25 mm. The temperature was controlled by means of a Peltier system (uncertainty of 0.1 °C). The samples were preliminarily subjected to strain sweep tests at a frequency of 1.0 Hz to determine the region of linear viscoelasticity (a region in which the G′ and G″ vs. strain modules are constant). The trend of the G′ and G″ vs. frequency (frequency sweep tests) in the linear viscoelasticity region was determined in the frequency range of 0.1–16.0 Hz [
23,
24]. The rheological measurements on the final samples (bread) were carried out by means of a dynamic-mechanical analyzer (DMA) with plate–plate geometry (40 mm). Force vs. deformation rheograms were recorded. A controlled force (from 0.1 to 25 N) was applied at 25 °C, and the deformation of the sample was determined [
25].
2.12. Antioxidant Performances of Gluten-Free Bread Samples
The bread samples (PB, PKB50, PKB150, and PKF5) were analyzed in terms of antioxidant properties after 1, 2, and 6 days using a procedure reported in the literature [
26]. The extraction was carried out by taking 5 g from each sample, which was degreased with n-hexane (150 mL, 20 min, 70 °C). The n-hexane fraction was decanted, and the defatted sample was extracted with 40 mL of a mixture (70% methanol, 29.7% water, and 0.3% formic acid) at 70 °C for 45 min under stirring, then filtered, evaporated, and finally dried under vacuum to constant weight.
2.13. Statistical Analysis
The inhibitory concentration (IC50) was calculated by non-linear regression with the use of Prism Graph-Pad Prism, version 4.0 for Windows (GraphPad Software, San Diego, CA, USA). All analyses were performed in triplicate, and data were expressed as the mean ± relative standard deviations (RSD). Studies of the correlation coefficient and linear regression, the calculation of the average, and the assessment of repeatability, standard deviation, and RSD were performed using Microsoft Excel 2010 software. The significance of colorimetric tests was obtained using a one-way analysis of variance (ANOVA) test, employing Duncan’s multiple-range test at a significance level of p < 0.05. After testing their normal distribution and homoscedasticity using Shapiro–Wilk’s W test and Levene tests, respectively, the contents of HPLC-DAD-identified polyphenols were statistically analyzed by the STATISTICA 12.0 (StatSoft Inc., Tulxa, OK, USA) software package. Specifically, a two-way analysis of variance (ANOVA) followed by a Tukey HSD post hoc test was performed to evaluate the effects of the cultivar (Amele vs. Selvatica) and solvent (water vs. ethanol) together with their interaction on the UAE extracts.
3. Results and Discussion
3.1. Extraction of Bioactive Compounds from Carob Leaves
Carob leaves contain different classes of bioactive compounds, such as simple phenols, polyphenols, free flavonoids, glycosylated flavonoids, and tannins [
27]. The characteristics of the extracts are closely linked to the structural diversity of the extractable phenolic compounds and strictly depend on the solvent and extraction techniques, while the temperature, pressure, and time represent important parameters to be considered [
28]. Carob leaves (
Amele and
Selvatica cv) underwent extraction processes using water and ethanol as eco-compatible solvents. At the same time, ultrasound-assisted extraction (UAE) and hot continuous extraction by employing a Soxhlet apparatus were evaluated. The conditions used for both extraction procedures and the yields of the processes expressed as grams of dry matter obtained after the removal of the solvent are described in detail in
Table 1.
3.2. Qualitative Analysis of Polyphenols in Carob Leaf Extracts
Phenolic acids, condensed tannins, and flavonoids, whose qualitative and quantitative compositions vary based on the cultivar, geographic origin, ripening stage, and extraction methods [
15], are the main polyphenols revealed in carob leaf.
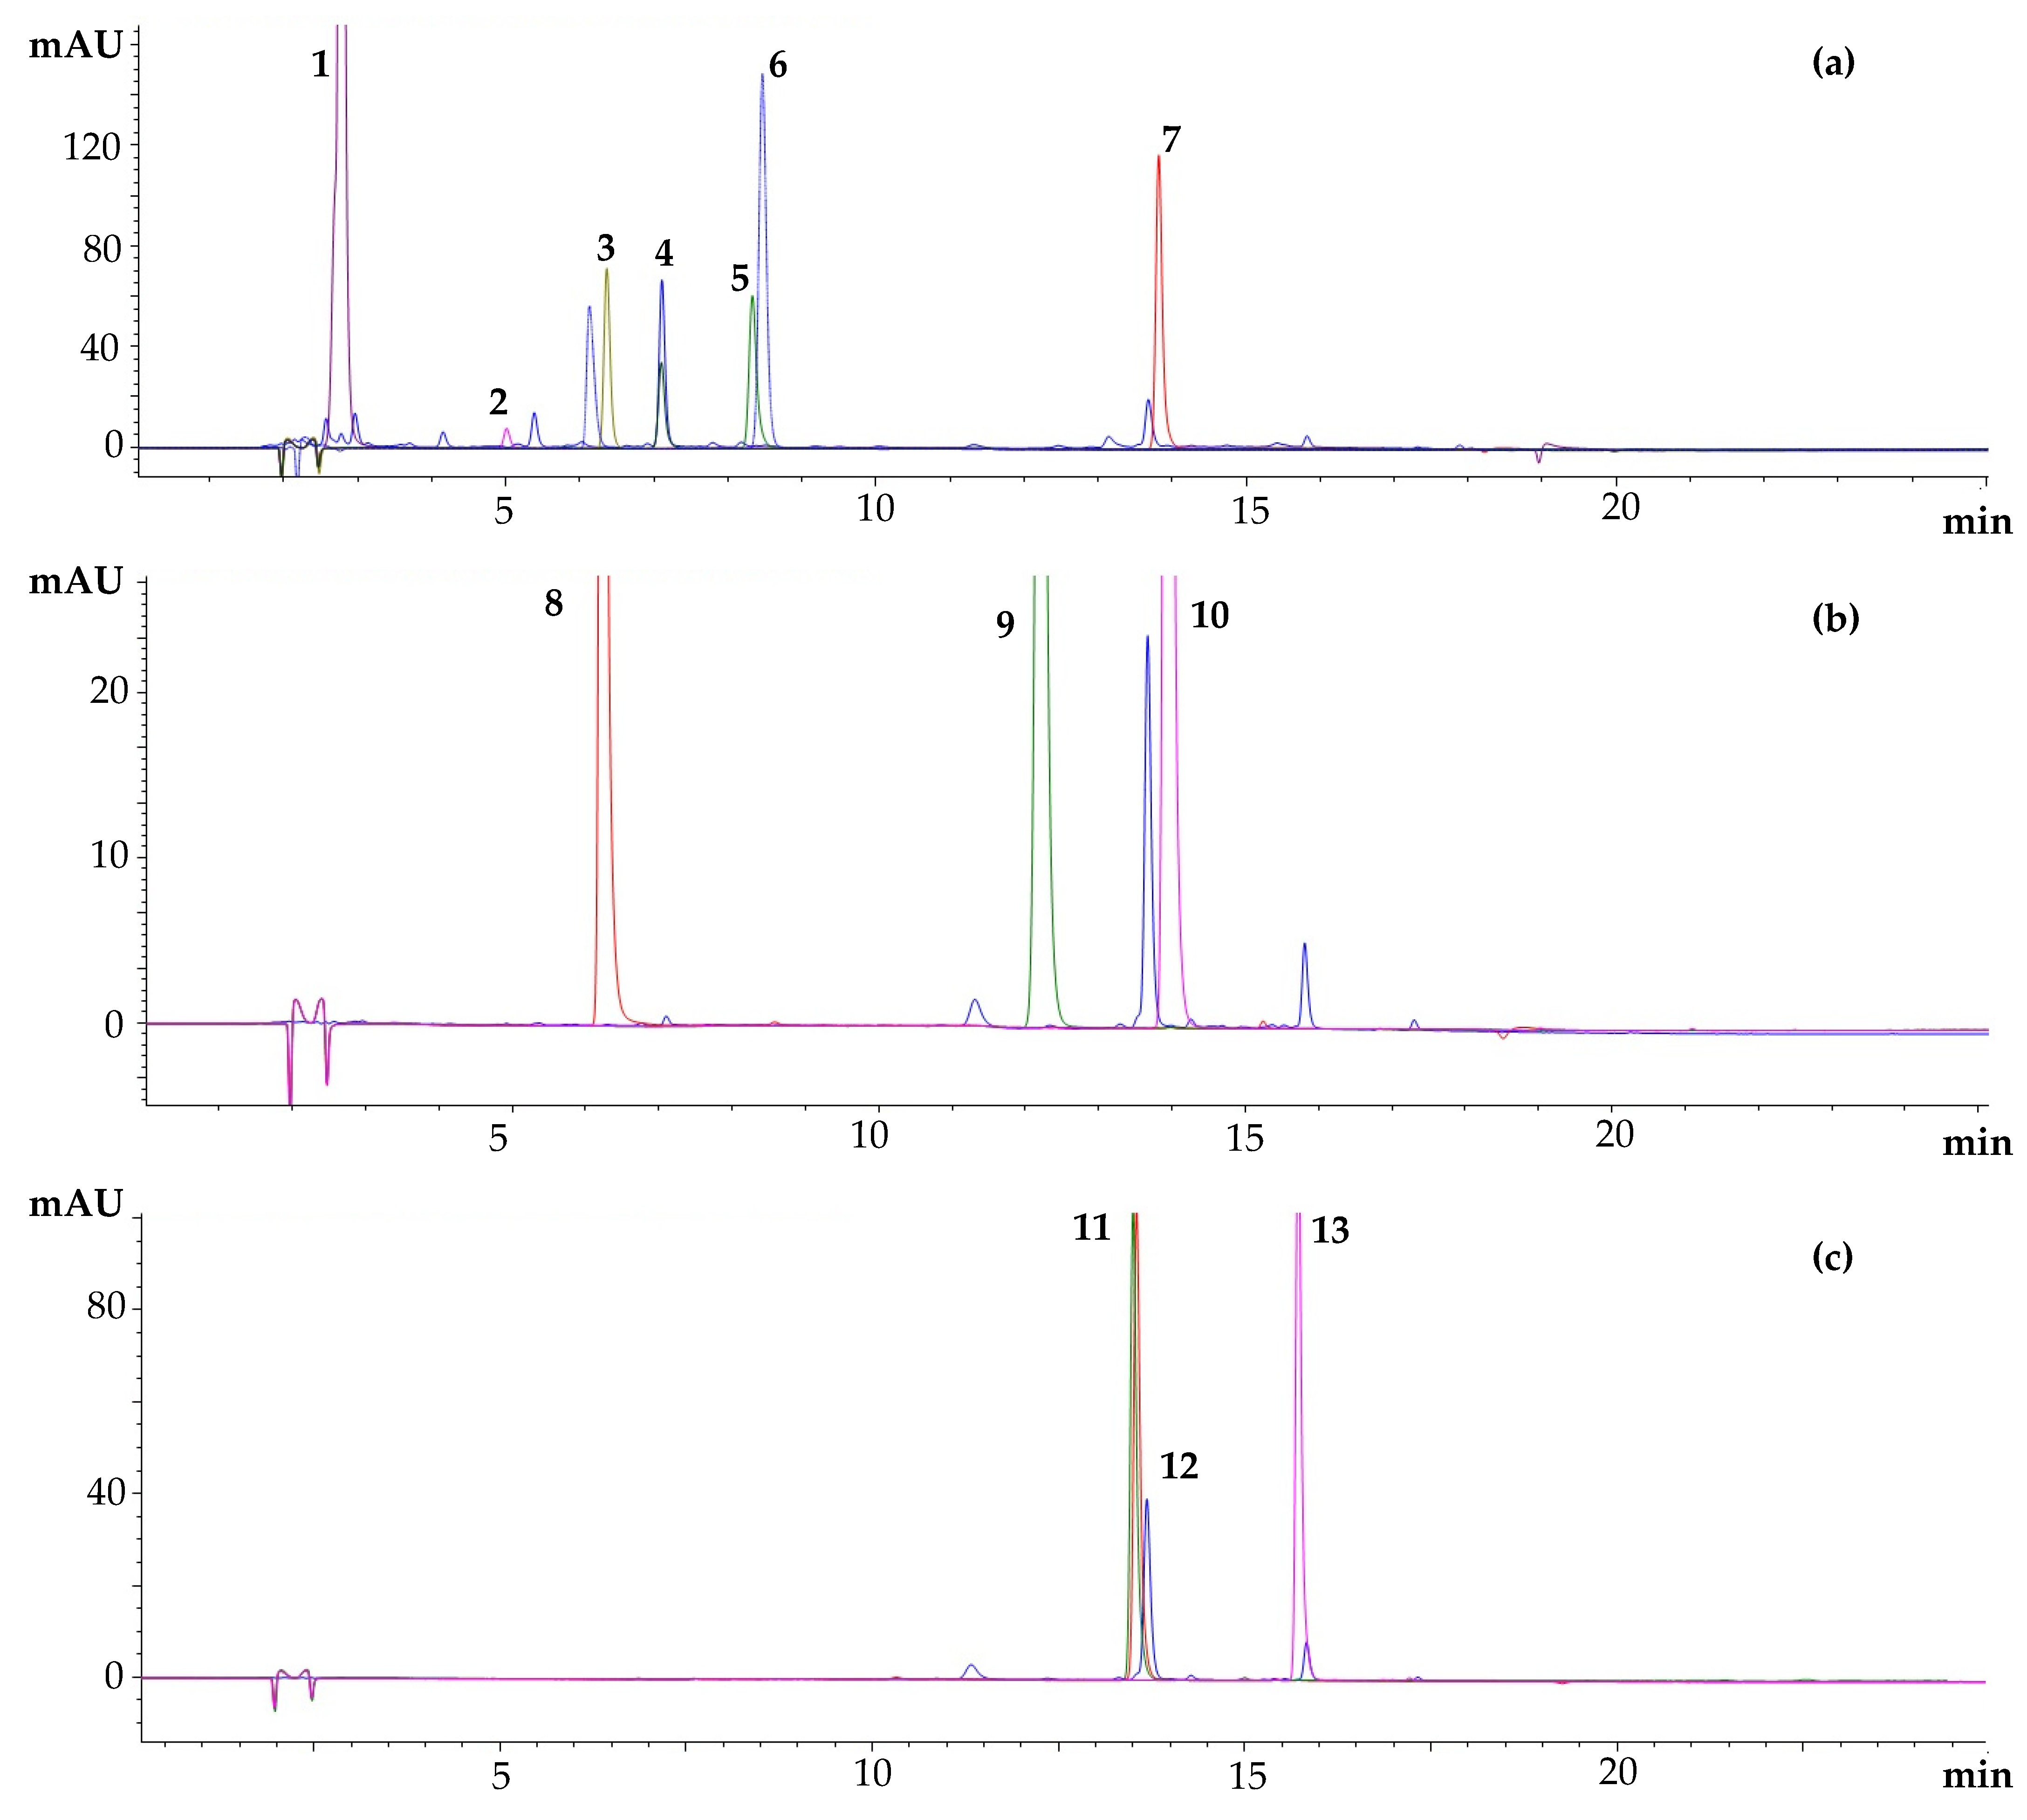
Figure 1 depicts the HPLC-DAD chromatograms, registered at 280, 330, and 360 nm, of CSU2.
According to existing literature [
15], 4-hydroxy-benzoic acid (peak 4, RT = 7.096 min) and myricitrin (myricetin-3O-α-rhamnopiranoside) (peak 12, RT = 13.667 min) were the main phenolic compounds recognized in the carob leaf (
Figure 1a,c). In addition, gallic acid (peak 1, RT = 2.763 min), syringic acid (peak 6, RT = 8.496 min), chlorogenic acid (peak 8, RT = 6.293 min), 4-hydroxy-coumaric acid (peak 9, RT = 12.325 min), and ferulic acid (peak 10, RT = 13.995 min) were the other phenolic acids identified (
Figure 1a,b). Regarding the condensed tannins, epigallocatechin (peak 2, RT = 5.150 min), catechin (peak 3, RT = 6.442 min), epigallocatechin gallate (peak 5, RT = 8.372 min), and epicatechin gallate (peak 7, RT = 13.919 min), typically present in carob leaves [
15], were found at 280 nm (
Figure 1 a). Finally, peak 11 at RT = 13.555 min and peak 13 at RT = 15.810 min were assigned to two flavonols, namely rutin (quercetin-3O-β-rutinoside) and quercitrin (quercetin-3O-α-rhamnopiranoside), respectively (
Figure 1c).
As reported in
Table 2, the quantities of the polyphenols (except for 4-hydroxybenzoic acid and 4-hydroxycoumaric acid) were significantly influenced by the interaction between the two factors, cultivar and extraction solvent (F = 105.38,
p < 0.0014).
Selvatica carob leaf extracts in water generally appeared to be the richest, especially in gallic acid (2.5 ± 0.4 mg g
−1) and syringic acid (0.60 ± 0.11 mg g
−1), epigallocatechin (1.05 ± 0.19 mg g
−1) and epicatechin gallate (0.61 ± 0.11 mg g
−1), and myricitrin (38.0 ± 7.0 mg g
−1). Myricitrin is a plant-origin flavonoid well known for its nutraceutical value and employed as a key ingredient in various foods and drinks. The compound exhibits a wide range of activities, which include strong antioxidant, antitumor, antidiabetic, and anti-inflammatory activities [
29]. It is also used as a preservative agent to extend the shelf life of foods containing oils and fats due to its ability to protect lipids from oxidation [
30].
3.3. Antioxidant Performances of Carob Leaf Extracts
TPC (mg GA g
−1) of the extracts is shown in
Table 3. Water represents the best extraction solvent, while UAE appears to be the more frequently performed procedure in terms of extraction yield and TPC value. A comparison between the two cultivars highlights that
Selvatica cv returned a better result (TPC for CSU2 equal to 313.04 mg GA g
−1), being two times higher compared to the
Amele cv (TPC for CAU2 equal to 174.44 mg GA g
−1).
TPC often appears strictly related to the antioxidant performances of the natural extract. Specifically, the scavenger activity of all the extracts was investigated, both in organic and hydrophilic environments, against DPPH and ABTS radical species, respectively (
Table 3). The results clearly highlighted the best performances (one order of magnitude) of the extracts against hydrophilic ABTS radical (IC
50 values in the range of 0.0018–0.0080 mg mL
−1), confirming the preponderance in the extracts of the hydrophilic moieties compared to the lipophilic ones. TPC values and scavenging activity pointed out that CSU2 extract was the most promising extract to be further explored for its nutraceutical properties. These findings were in accordance with the HPLC-DAD results, displaying CSU2 as the richest extract in myricitrin (38.0 mg g
−1) and 4-hydroxybenzoic acid (36.0 mg g
−1). Specifically, phenolic acid and flavonoid contents were investigated by employing colorimetric tests, and the data returned total phenol acid equal to 281.52 mg GA per gram of the extract, while the flavonoid content was 302.13 mg GA per gram of the extract. Finally, the antioxidant capacity of CSU2 was also expressed as the Trolox equivalent (TEAC). TEAC value related to the specific extract was performed by an analytical method recording the reduction in the concentration of ABTS induced by antioxidant molecules in the extract to the Trolox equivalents per gram of extract. The TEAC value for CSU2 was equal to 6.34 meq of Trolox per gram of extract.
3.4. Preparation and Antioxidant Performances of Kefir Enriched with CSU2
The best-performing extract (CSU2) in terms of total phenols and antioxidant performances was employed to prepare functional kefirs, with improved nutraceutical features. Specifically, four enriched kefirs were prepared (labeled KF5, KF15, KF25, and KF40) by varying CSU2 concentrations in the range of 5–40 mg g
−1. In addition, a control sample (KB), without any added extract, was also prepared. Antioxidant properties of the functional kefirs were evaluated by employing specific colorimetric tests, and the results are reported in
Table 4.
The results showed the successful enrichment of the beverage, as well as highlighting that the fermentation did not significantly damage the biologically active compounds of CSU2. A linear increase of TPC values, according to the amount of CSU2 added to the beverage, was observed. In particular, the sample with the highest extract concentration (KF40) displayed TPC values almost three times higher than KF5. The experiments also allowed us to identify KF5 as the most enriched kefir containing the minimum amount of extract able to display remarkable antioxidant activity. The blank beverage (KB) also provided a significant response to the Folin–Ciocalteu test. However, this result should be ascribed to the free hydroxyl groups of the kefiran. This finding was confirmed by the DPPH and ABTS assays performed on KB, which does not display any antioxidant activity, both in aqueous and organic environments. The results were also confirmed by evaluating the antioxidant activity as Trolox equivalents (0.0360–0.2336 meq of Trolox per gram of CSU2).
3.5. Preparation and Antioxidant Activity of Gluten-Free Bread
The absence of gluten in baked goods represents a technological challenge due to the low nutritional and functional properties of the flour. In fact, these products have a rather lower resistance to hardening compared to bread prepared with wheat flour. However, by using new sources of proteins, polysaccharides, and minerals able to imitate the network behavior of gluten, these problems can be minimized [
31]. The addition of new protein sources, such as dairy dry powders, improves the appearance, volume, and sensory aspects of the loaves [
32]. Literature data suggested that the addition of kefir to gluten-free dough had a positive effect on the volume of the loaf, porosity, moisture of the crumb, and color of the crust [
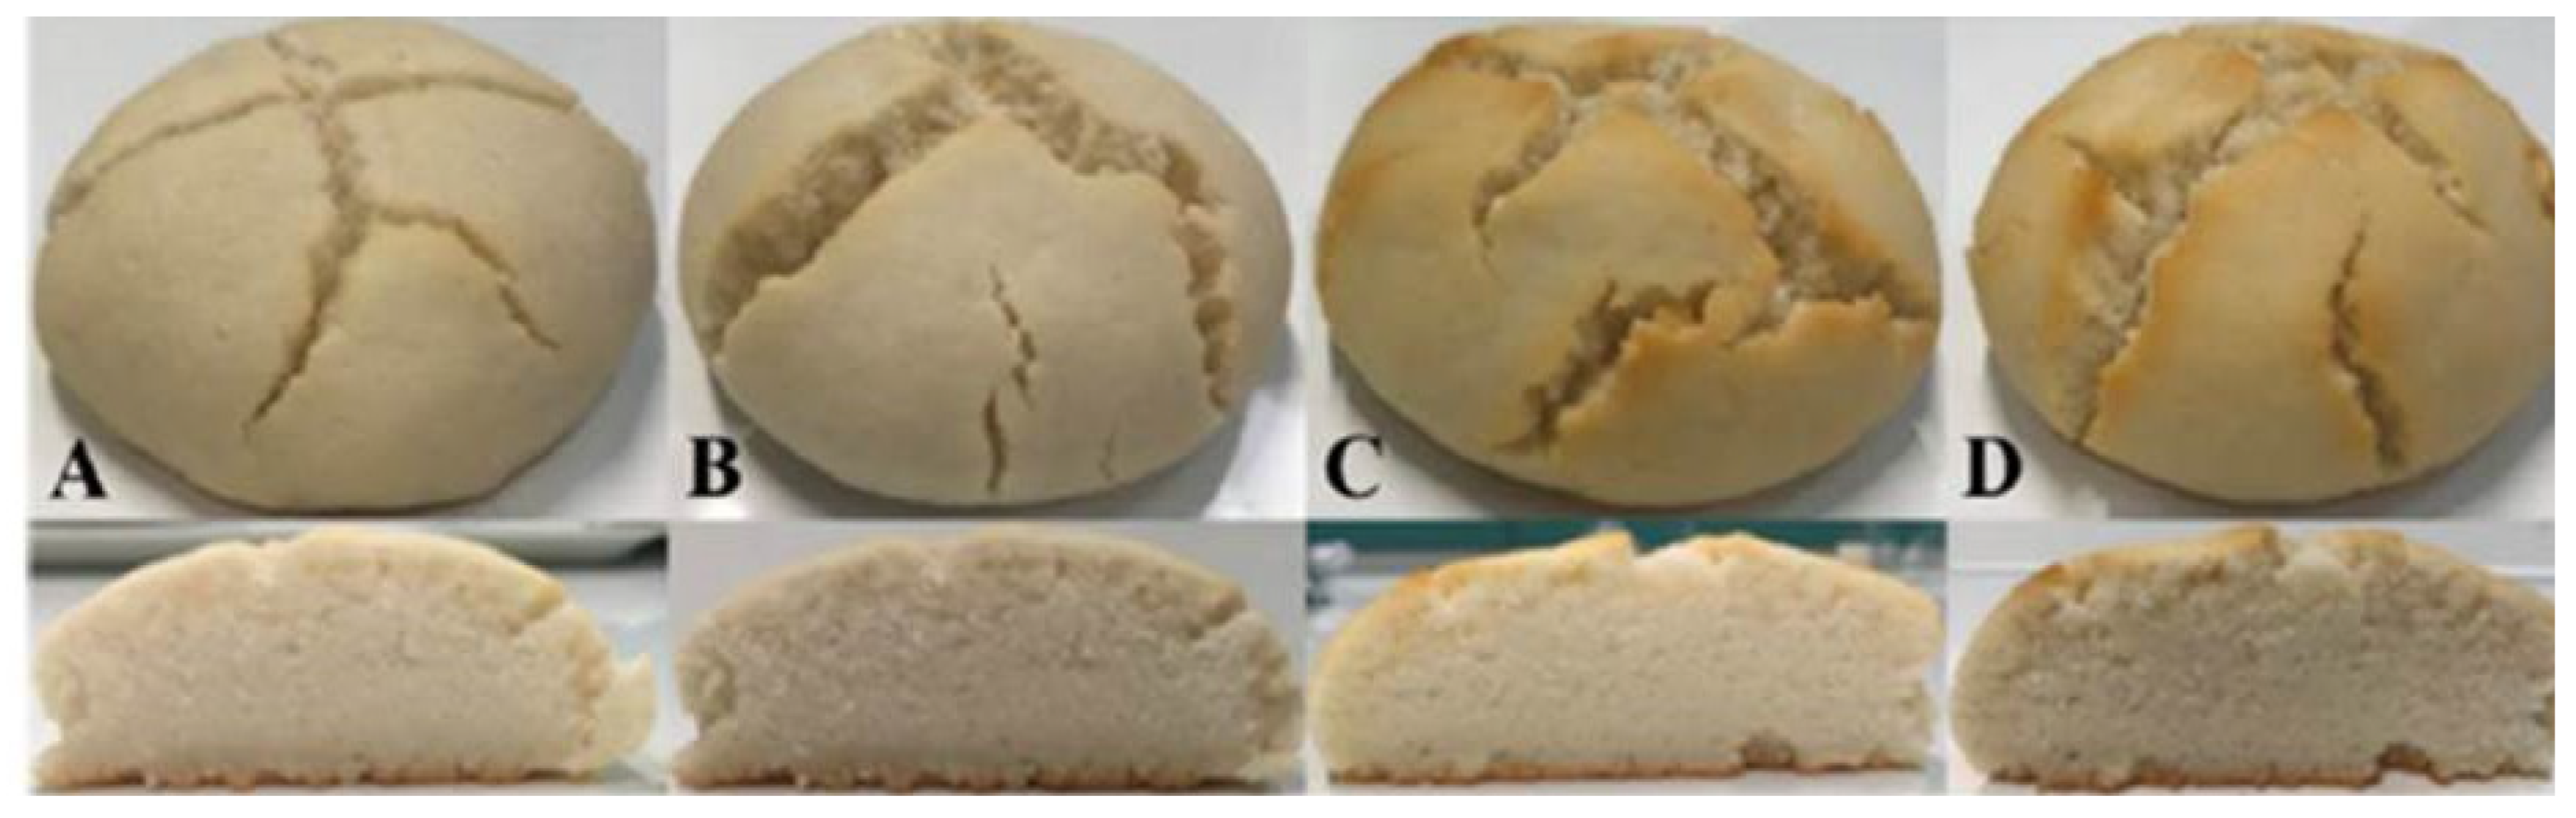
9]. In this regard, samples of gluten-free bread were prepared and labeled with the acronyms PKB50 (bread with 50 mL of kefir) and PKB150 (bread with 150 mL of kefir). A control sample (PB) was also prepared in the same conditions but in the absence of a milk-based beverage. Finally, to impart additional biological activity to the bread, a sample (PKF5) formulated by adding 150 mL of kefir fortified with CSU2 (5.0 mg g
−1) was also prepared.
Figure 2 shows the prepared gluten-free bread.
Antioxidant activities both in organic and aqueous environments of gluten-free bread were evaluated as a function of time (6 days), and the results are reported in
Table 5.
Antioxidant activity of the bread samples clearly shows that the CSU2 extract confers appreciable biological activity, both against DPPH and ABTS radical species, as well by evaluating it as the milliequivalent of Trolox g−1 of bread. The data also showed that PKF5 maintains these features over time, with no significant decrease.
3.6. Rheological Properties of Gluten-Free Bread
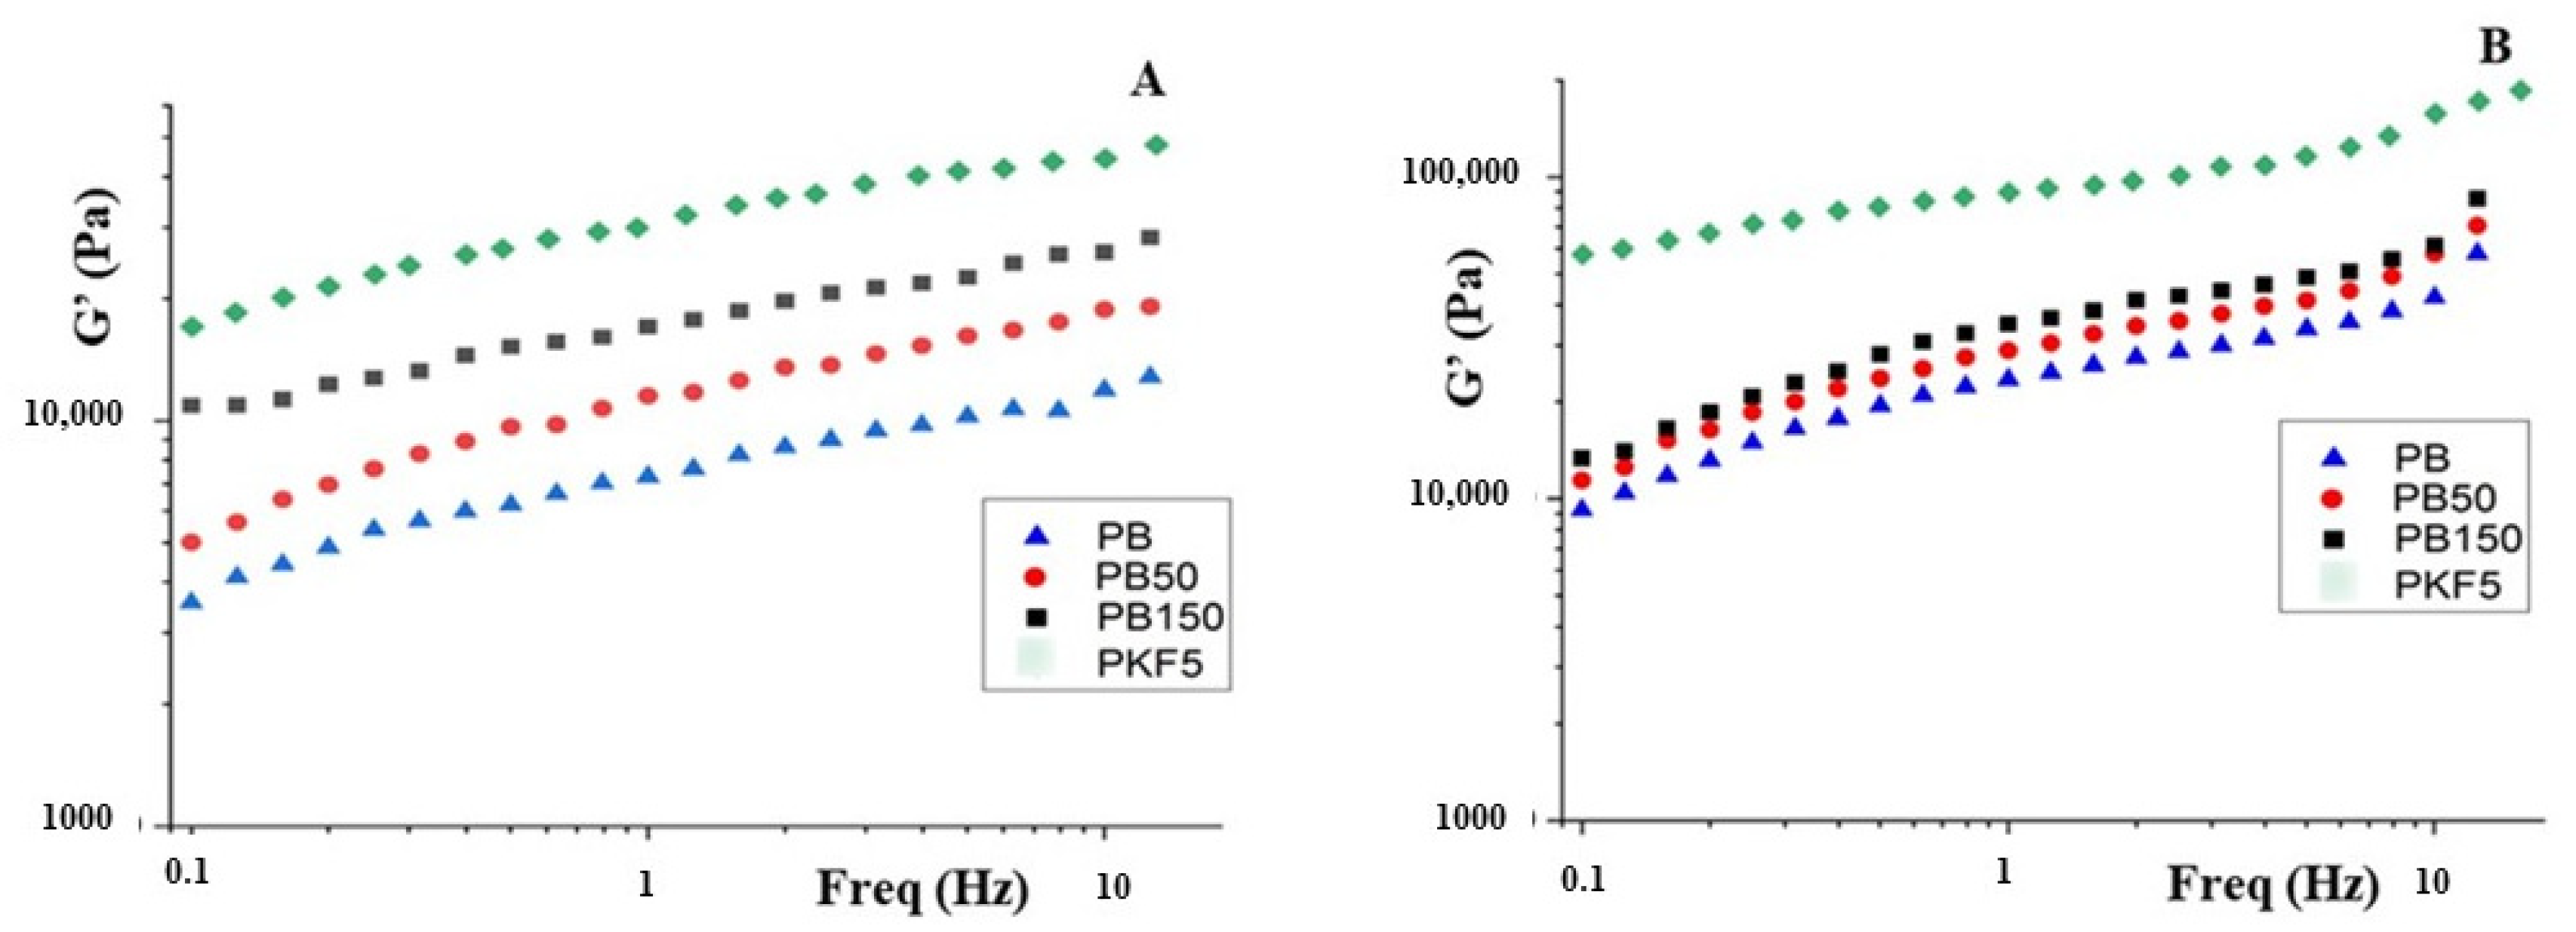
The effects of kefir incorporation on the rheological properties of dough and gluten-free bread formulations were evaluated. The results seem to confirm that the addition of kefir significantly improves the properties of the bread, increasing the volume and softness of the crumb and lowering the staleness rate. Frequency sweep tests were performed on the doughs as a function of the leaving time (t equal to 0 and 3.5 h), and the results are reported in
Figure 3.
It can be noted that the elastic modulus (G’), although maintaining the same frequency profile, increases when there is a quantity of kefir greater than 50 mL in the mixture (samples PKB50 and PKB150), reaching maximum values when the antioxidant extract was added (sample PKF5). This rheological behavior is indicative of a greater structuring of the doughs, in terms of the greater interaction strength between the links of the formed network.
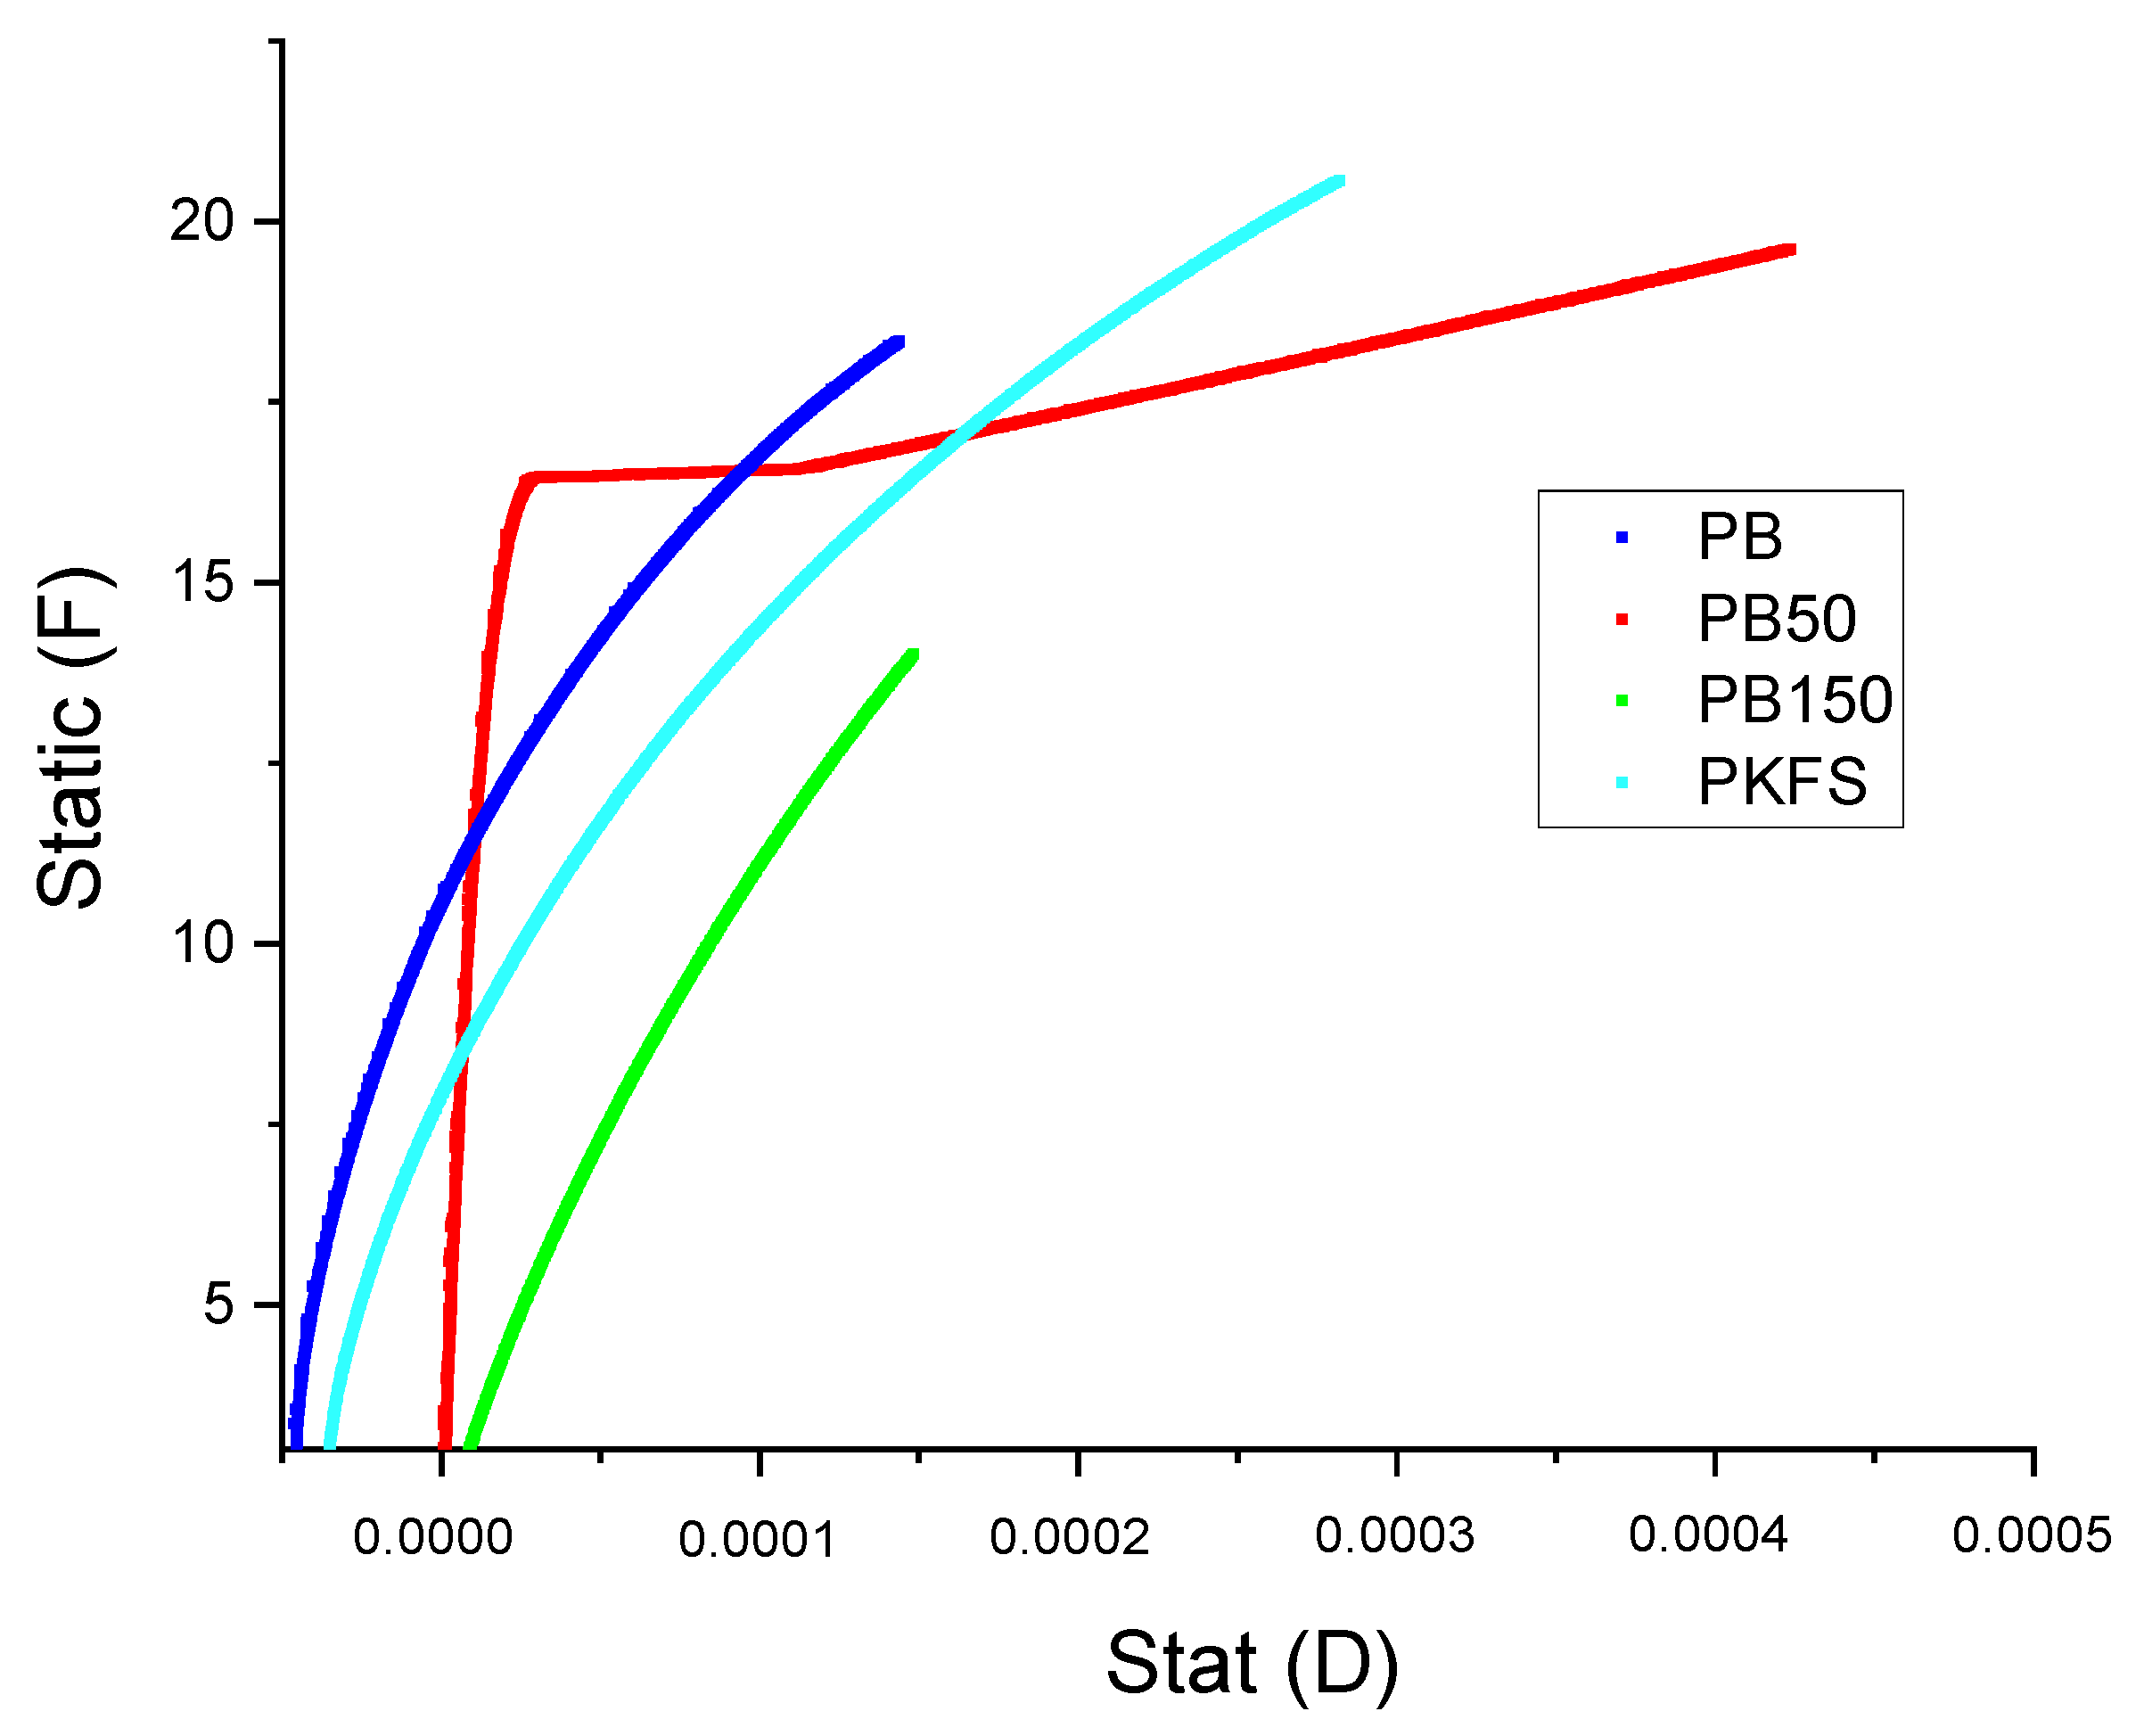
In addition, dynamic mechanical measurements were performed on the final products after cooking, in order to verify their softness retention as a function of the time. Specifically, the evaluation of the applied force as a function of the recorded deformation is depicted in
Figure 4.
Finally, the extrapolation of the angular coefficient (
Table 6) is an important parameter indicating the softness retained in the preparation.
Specifically, an increase in this parameter indicates a partial loss of softness. The dynamic mechanical measurements highlighted how the addition of kefir allowed us to retain the softness of the bread after 6 days. The graphs obtained for the bread prepared in the absence of kefir indicate an increase in hardness (increase in Young’s constant) and an inability to deform at low-stress values until the breaking structure of the texture at a specific deformation value (sudden slope change in the plot). It is interesting to note that the sample PKF5 displayed constant stiffness values over time, indicating greater resistance to hardening.
4. Conclusions
Sustainable exploitation of carob leaves represents a valuable strategy to reduce the environmental impact of the entire production process as well as a relevant starting point for increasing the economic value of this by-product. This research proposed an eco-sustainable process to enhance the industrial value of these plant residues in order to apply them in the nutraceutical and food fields. Ecofriendly extraction procedures were performed by an ultrasound-assisted methodology, employing water as an eco-compatible solvent. The phenolic fraction of the Selvatica cv carob leaves aqueous extract, mainly composed of myricitrin and 4-hydroxybenzoic acid, highlighted remarkable antioxidant activity and represented a valuable tool in the preparation of functional food. The addition of phenolic compounds of the extracts to the kefir beverage proved to be an innovative strategy for developing a product able to ensure high quality as well as the organoleptic standards required by the consumer. Specifically, enriched kefir beverage was employed in the preparation of gluten-free bread, overcoming the technological challenge related to the low nutritional and mechanical properties of the flours used (rice). However, by using new protein sources enriched with high-nutritional-value mixtures, these problems can be minimized.
Kefir represents an interesting approach as a source of proteins, polysaccharides, and minerals, able to mimic the network behavior of gluten, while carob leaf extracts (5 mg g−1 of kefir) introduced remarkable antioxidant properties. Indeed, a significant improvement in the mechanical properties of doughs and final products was registered. Furthermore, gluten-free bread enriched with carob leaf extracts displayed considerable scavenger properties against hydrophilic and lipophilic radical species, retaining these features after 6 days, conferring potential beneficial effects on human health.


 ,
, 


