Article

Hydrogen and Methane Production from Anaerobic Co-Digestion of Sorghum and Cow Manure: Effect of pH and Hydraulic Retention Time

by
Margarita A. Dareioti
1,
Konstantina Tsigkou
1,
Aikaterini I. Vavouraki
2 and
Michael Kornaros
1,*
1
Department of Chemical Engineering, University of Patras, 1 Karatheodori Str., University Campus, 26500 Patras, Greece
2
Department of Agriculture, School of Agricultural Science, Hellenic Mediterranean University, 71004 Heraklion-Crete, Greece
*
Author to whom correspondence should be addressed.
Fermentation 2022, 8(7), 304; https://doi.org/10.3390/fermentation8070304
Submission received: 31 May 2022 / Revised: 23 June 2022 / Accepted: 25 June 2022 / Published: 27 June 2022

Abstract

:
The need for alternative energy sources is constantly growing worldwide, while the focus has shifted to the valorization of biomass. The aim of the present study was to determine the optimal pH and hydraulic retention time (HRT) values for treating a mixture of sorghum biomass solution with liquid cow manure (in a ratio 95:5 v/v) through anaerobic digestion, in a two-stage system. Batch tests were initially carried out for the investigation of the pH effect on bio-hydrogen and volatile fatty acids (VFA) production. The highest hydrogen yield of 0.92 mol H2/mol carbohydratesconsumed was obtained at pH 5.0, whereas the maximum degradation of carbohydrates and VFA productivity was observed at pH 6.0. Further investigation of the effect of HRT on hydrogen and methane production was carried out. The maximum yield of 1.68 mol H2/mol carbohydratesconsumed was observed at an HRT of 5 d, with H2 productivity of 0.13 L/LR·d. On the other hand, the highest CH4 production rate of 0.44 L/LR·d was achieved at an HRT of 25 d, with a methane yield of 295.3 mL/g VSadded, whereas at a reduced HRT of 20 d the process exhibited inhibition and/or overload, as indicated by an accumulation of VFAs and decline in CH4 productivity.

1. Introduction

Renewable resources have been constantly attracting notice from the international community during the last decades, and play a crucial role in current CO2 mitigation policies. From this point of view, biomass- and/or waste-derived energy can be considered one of the most prevailing renewable energy sources, mainly due to the fact that continuous power generation obtained by such sources can be produced. Thus, organic waste materials such as energy crops and manure are of specific importance thanks to the fast growth and low cultivation cost of the former and the abundance and composition of the latter [1,2]. The various technologies available for biomass and/or waste derived power generation can be mainly subdivided into thermochemical and biochemical conversion processes, while several hybrid approaches have been presented in the literature as well [3].
Anaerobic digestion, which is categorized within the biochemical processes, is characterized as a robust, effective, and widely applied process. Several types of biomass and waste can be valorized anaerobically through co-digestion of homogeneous mixtures which are able to promote the process performance [3,4]. In particular, co-digestion is considered to be an appealing option for boosting the efficiency of the process thanks to its positive synergisms which can significantly increase the economic viability of biogas plants [5]. Furthermore, two-stage anaerobic digestion exhibits various benefits compared to the conventional one-stage process, as it enables the selection and the enrichment of microflora in the reactors, enhancing the stability of the system by (a) the acidification phase regulation in the first reactor and (b) overloading and/or preventing inhibition of the methanogenic population in the second reactor [6,7]. At the first stage of acidogenesis, generation of biological hydrogen and various soluble metabolites takes place, whereas at the second stage the methane is produced [7,8,9]. Through various manipulation techniques, optimum operational and environmental conditions can be achieved for each microbial community, resulting in significant positive changes in both the production of biogas and in the overall performance of the process. The valorization of the produced biogas (CO2, CH4 and/or H2 and trace gases such as H2S and NH3) is energy efficient and eco-friendly thanks to low hazardous pollutant emissions [6,10,11].
A group of operational parameters, including temperature [12], pH [13,14], reactor configuration [8,15], organic loading rate [15], and hydraulic retention time (HRT) [16,17] have been studied as contributory factors for biogas production. Among the aforementioned factors, pH has been recognized as an essential factor regarding the distribution of acidogenic products [13,14,18]. Although a considerable number of research studies have been conducted seeking the optimal pH range for fermentative hydrogen production, unpredictable and inconsistent results continue to arise due to the variability of the characteristics of the substrate, inoculum type, and composition, as well as of the other operating conditions adopted. According to the literature, low pH values usually result in hydrogenase activity inhibition, which is considered a key factor regarding the influence of pH on fermentative hydrogen production. However, several other metabolic pathways can take place, leading to hydrogen production in a wide pH range, specifically from pH 4.5 to 9 [19]. In addition, HRT is accounted one of the most important factors, strongly impacting the system microflora as well as the characteristics of CSTR systems; for this reason, it must be controlled. Continuous anaerobic digestion experiments are usually grinding and complicated; thus, methane productivity testing can occasionally be based on batch test findings [20]. However, batch tests are incapable of predicting full-scale system performance due to their reliance on inoculum type, the substrate/inoculum ratio, and the operational simplicity which characterizes such tests. Consequently, the monitoring of possible inhibition phenomena effects due to chemical additives (for pretreatment or pH control reasons) requires process performance evaluation in terms of biogas production or tests in CSTR systems [21].
Over the past few years, interest has increased concerning the evaluation of anaerobic co-digestion of energy crops with other wastes. For example, Giuliano et al. [22] found that the co-digestion of manure, energy crops, and agro-wastes using pilot scale CSTRs was viable at all tested operating conditions. Appels et al. [23] suggested that yields can be enhanced through co-digestion, as mixing with other residues or wastes leads to higher balance in nutrients, and subsequently to efficiency improvements. Additionally, synergistic effects regarding dairy manure co-digestion have been related to positive profits in terms of specific methane yield, in contrast to the mono-substrate digestion [24]. According to Zhong et al. [25], a mixture of energy crops, animal wastes, and other crop residues is able to promote the productivity of methane, generating a homogenous lignocellulosic feedstock amendable for the production of biofuels and/or other products in a biorefinery concept.
Manure is a waste steam in which several groups of microorganisms and significant amounts of volatile organic compounds are included. Moreover, such a substrate is characterized by high alkalinity levels [7], and for this reason is one of the most preferable substrates in cases of anaerobic co-digestion. On the other hand, the energy crops are considered low-input cultures, having low nutrients, protection, work, and water requirements [26]. According to the literature, typical energy crops are maize, sugarcane, perennial grasses, and sorghum [27,28]. In particular, sweet sorghum is characterized by a high fermentable sugars concentration, and for this reason is considered adequate for valorization through biological processes [28]. However, limited studies on the anaerobic digestion (and co-digestion) of sweet sorghum as substrate can be found in the extant literature [28,29,30,31,32], particularly in two-stage systems for both hydrogen and methane production.
Hence, this study aims to investigate two significantly important parameters for the anaerobic digestion process, namely, the effect of pH and the effect of various HRTs in a two-stage continuous anaerobic process co-digesting sweet sorghum with liquid cow manure, targeting the maximization of the respective yields. Additionally, two types of sorghum, namely, fresh and ensiled, were evaluated during acidogenesis in terms of their hydrogen and intermediate product accumulation efficiency.

2. Materials and Methods

2.1. Substrates

The substrates which were valorized in the present study corresponded to two types of sorghum (FS, fresh sorghum and ES, ensiled sorghum) and liquid cow manure (LCM). A mixture of sorghum solution (FS or ES) and LCM in a ratio of 95:5 (v/v) was tested. This mixture composition was selected by the authors in a previous study [33]. However, in the current experimental work, sorghum was exploited in order to replace the cheese whey in the previous tested mixture due to its seasonal availability. In order to run wet anaerobic digestion systems, and more specifically for the reduction of solids content below 15% [34], sorghum (FS or ES) was valorized as a solution with a solid concentration of 8%, as described in detail in Section 2.1.1 and Section 2.2.

2.1.1. Types and Solutions of Sorghum

Among energy crops, sorghum is a C4, heat- and drought-tolerant, and highly productive crop with low water requirements, high photosynthetic efficiency, and high diversity. Its lignocellulosic biomass is composed mainly of cellulose, hemicelluloses, and lignin in different proportions, while its soluble sugars content is rich in glucose and sucrose [35].
In the present study we used two varieties of sorghum, namely, FS (Sweet Sorghum bicolor L. Moench var. Keller) and ES (Sorghum Sudangrass hybrid—HoneyGraze BMR), which were cultivated through biological farming techniques according to European Regulation EC 2092/91 [36]. FS was harvested at the University of Patras facilities (the geo-coordinates of the fields were 38°17′51.14″ N 21°48′2.28″ E), whereas ES was gathered from a farm close to the city of Patras in the west of Greece (the geo-coordinates of the fields were 38°06′42.27″ N 21°38′26.37″ E). After collection, the particle size of both sorghum varieties was reduced (1–3 cm). Finally, FS was kept in a freezer at −18 °C prior to use, whereas the chopped sorghum (ES variety) was stored for 60 days at ambient temperature for the ensiling procedure. Before use in experiments, sorghum was dried at 55 °C, milled to 1 mm particle size with a basic analytical mill (A11, IKA), and sieved to a powder (<315 μm diameter). The physicochemical characterization of FS and ES sorghum after drying and milling is presented in Table 1.
Regarding the solutions of FS or ES tested in the current study, a solid:liquid ratio of 8% (w/v) was used, as described in Section 2.2. This ratio was used for both FS and ES; however, for ES, the additional step of alkaline pretreatment was applied (Section 2.2) due to its lower content of soluble sugars. On the other hand, only water was used for FS solution. After the preparation of the sorghum solutions, their respective contents did not exhibit any significant differences arising from the physicochemical characteristics of the substrates (Table 1). However, the composition changed dramatically due to the ensiling procedure and alkaline pretreatment. All such changes were evaluated during the experimentation period in terms of hydrogen and intermediate products accumulation.

2.1.2. Liquid Cow Manure

Liquid cow manure (LCM) is known as one of the most polluting agro-industrial wastewaters. The LCM batch for the current study was gathered fresh from a dairy farm located in the area of Patras (Western Greece) with 230 breeding cows. After collection, it was kept in the freezer at −18 °C until use. Table 1 shows the average values from the physicochemical characterization of the LCM.

2.2. Alkaline Pretreatment

ES was characterized by a low soluble sugars content compared to FS due to the ensiling procedure, during which they were converted to other metabolic products. For this reason, ES was chemically pretreated using a mixture of 0.5% NaOH and 0.5% KOH (w/w) at 80 °C for 2 h [33], whereas the solid:liquid ratio was 8% (w/v). The alkaline solution concentration was selected, taking into consideration that the Na and K amounts in the final mixture should remain less than 5.5 g Na+/L and 0.15 M K+, respectively, in order to ensure the avoidance of unretrievable methanogens inhibition [37]. After the alkaline pretreatment, the pH of the ES ranged between 12 and 13, and thus was followed by pH neutralization pH 7.0 with HCl (37%) prior to anaerobic digestion.

2.3. Reactor Configuration

2.3.1. Effect of pH

Batch experiments were conducted in a double-walled digester with an operating volume of 900 mL. Both the temperature (37 ± 0.2 °C) and stirring rate in the digester were controlled, as described in detail in [13]. The pH of the mixed liquor was kept constant throughout the experimental procedure, with a standard deviation of ±0.1, via automatic control using a Hach PID-controller by adding drops of NaOH or HCl (6 N) solution. Anaerobic conditions were imposed on the culture by sparging with N2 gas at the beginning of each experiment.

2.3.2. Effect of HRT

Experiments were conducted in CSTR reactors with a double wall and a working volume of 500 mL. First, the acidogenesis step was conducted, followed by methanogenesis. Agitation and temperature control (37 ± 0.2 °C) were performed as described in Section 2.3.1. The feedstock was kept in a tank placed in a refrigerator for low temperature maintenance (4 °C), and the reactor was fed via a precise peristaltic pump (Watson Marlow Bredel 323). In this study, the pH in the acidogenic reactor was kept constant throughout the experimentation phase via automatic control using a Hach PID-controller by the addition of a solution mixture of NaOH (1.5 N) and KOH (1.5 N).

2.4. Reactor Startup and Operation

2.4.1. Effect of pH

Anaerobic acidogenesis batch tests were conducted with a substrate mixture of FS and LCM (95:5 v/v) and were performed at different constant pH values, namely, 4.5, 5.0, 5.5, and 6.0, with a standard deviation of 0.15 due to the pH controller and experiment evolution. The acclimatized anaerobic culture seed sludge used as inoculum originated from a lab-scale anaerobic acidogenic CSTR reactor located in the Biochemical Engineering and Environmental Technology laboratory at the Department of Chemical Engineering, University of Patras, Greece, using a mixture of 55% olive mill wastewater, 40% cheese whey, and 5% LCM. Prior to batch experiments, centrifugation (4000 rpm) of the acclimatized anaerobic seed sludge used as inoculum was performed in order to eliminate the soluble part of the culture medium. The amount of inoculum used was 20% of the working volume (180 mL), while the rest consisted of the FS:LCM mixture (720 mL). Additional batch experiments using pretreated ES instead of FS in the mixture and at the optimum pH value were conducted in order to evaluate the contribution of different sorghum varieties to hydrogen production.

2.4.2. Effect of HRT

Separate operation of a two-stage process was carried out using a mixture of pretreated ES and LCM (ratio of 95:5 v/v) in order to assess the HRT impact on hydrogen and methane productivity. In this case, we considered that it was more practical to use ES instead of FS because of seasonal availability after the ensiling procedure. For start-up, an acclimated anaerobic sludge was used from a two-stage system fed with a waste mixture of pretreated ES, cheese whey, and LCM in a ratio 55:40:5 (v/v/v). The inoculum originated especially from the second stage of the reactors’ configuration, while the system was located in the laboratory of Biochemical Engineering and Environmental Technology (Department of Chemical Engineering, University of Patras).
Anaerobic conditions in the reactors were guaranteed by sparging with N2 gas prior to each experiment. Aliquots of mixed liquor (effluent) samples were withdrawn and analysed at least in duplicate for monitoring of reactor operation.
Experiments were conducted to determine of the optimal HRT in terms of maximum hydrogen and methane production. The acidogenic reactor operated at three different HRTs (3, 5, and 8 d) while the effluent from the acidogenic reactor was homogenized and preserved at −18 °C until subsequent use in methanogenesis, which was operated at HRTs of 20 and 25 d, leading to respective OLRs of 2.23 and 1.78 kg COD/m3·day. The aforementioned HRTs for both the acidogenic and methanogenic reactor were selected according to our experience with two-stage CSTR systems for agro-industrial waste valorization, as described in the published studies [33,38], respectively. The experimental conditions of the two-stage anaerobic digestion system can be seen in detail in Table 2.

2.5. Analytical Methods

Determination of the off-line pH values was performed by an electrode (Orion 3-Star), while the total solids (TS), volatile solids (VS), total and soluble COD, TKN, and alkalinity contents were measured according to the Standard methods [39]. Proteins concentration was calculated by multiplying TKN*6.25. Total organic carbon (TOC) was determined by a Carbon TOC-V module (Shimadzu). For the measurement of soluble compounds (lactic acid, volatile fatty acids (VFAs) etc.), the separation of the insoluble residue from the supernatant proceeded through Whatman® glass microfiber filters, Grade GF/F.
Regarding the analysis of carbohydrates, VFAs, lactic acid, alcohols, produced biogas composition, cellulose, hemicellulose, and lignin content, the respective methods followed were all reported in our previous studies [28,40].
Biogas volume production was determined as described by Tsigkou et al. [8] using automated tailor-made devices constituting a combination of an engine oil-filled U-tube, an electron-valve, and a counter. Biogas measurement was based on counting the number of displacements of constant oil volume as biogas (H2 and CO2 or CH4 and CO2) was continuously produced by the acidogenic or methanogenic reactor. The biogas volume derived from each experiment was then converted to standard temperature (0 °C) and pressure (760 mm Hg) (STP) conditions.

2.6. Bacterial Growth Model

The modified Gompertz bacterial growth model (Equation 1) was exploited for the description and fitting of the cumulative biohydrogen production profile from each batch experiment (OriginPro version 8). The specific equation has been broadly applied for biogas production data modelling [41].
H = P   e x p { e x p [ R m   e P ( λ t ) + 1 ] }
where H is the cumulative hydrogen production (mL), P is the maximum hydrogen production potential (mL), Rm is the maximum hydrogen production rate (mL/h), λ is the lag-phase duration (h), t is time (h), and e: exp(1) = 2.71828.

3. Results and Discussion

3.1. Chemical Composition of Each Substrate

The FS and ES composition analysis is presented in Table 1. The whole characterization, apart from moisture and total solids (TS), was obtained after drying and milling of the sorghum. The sorghum mainly consisted of a high percentage of polysaccharides and lignin. The ash content of fresh sorghum stalks was relatively low. Fresh sorghum was characterized by a higher percentage of carbohydrates compared with ensiled sorghum. During the ensiling procedure, the fermentative bacteria consume the soluble carbohydrates to produce VFAs, lactic acid, and ethanol, depending on the metabolic reactions. Subsequently, soluble carbohydrates of ES decreased while lactic acid concentration was observed. Furthermore, Table 1 summarizes the chemical composition of LCM. High nitrogen content is an important attribute of manure wastes, while the specific substrate contributes to the buffering capacity of the final mixture as a consequence of its neutral pH and high alkalinity levels. It is noteworthy to mention that it is necessary to increase alkalinity in order to avoid the potential failure of the system due to the possible accumulation of VFAs. Prior to its use as feeding material, ES was subjected to alkaline pretreatment at 80 °C for 2 h by adding an alkaline solution consisting of 0.5% NaOH and 0.5% KOH (w/w dry matter). The chemical composition of all substrates was in accordance with other studies found in the literature [7,28,42].

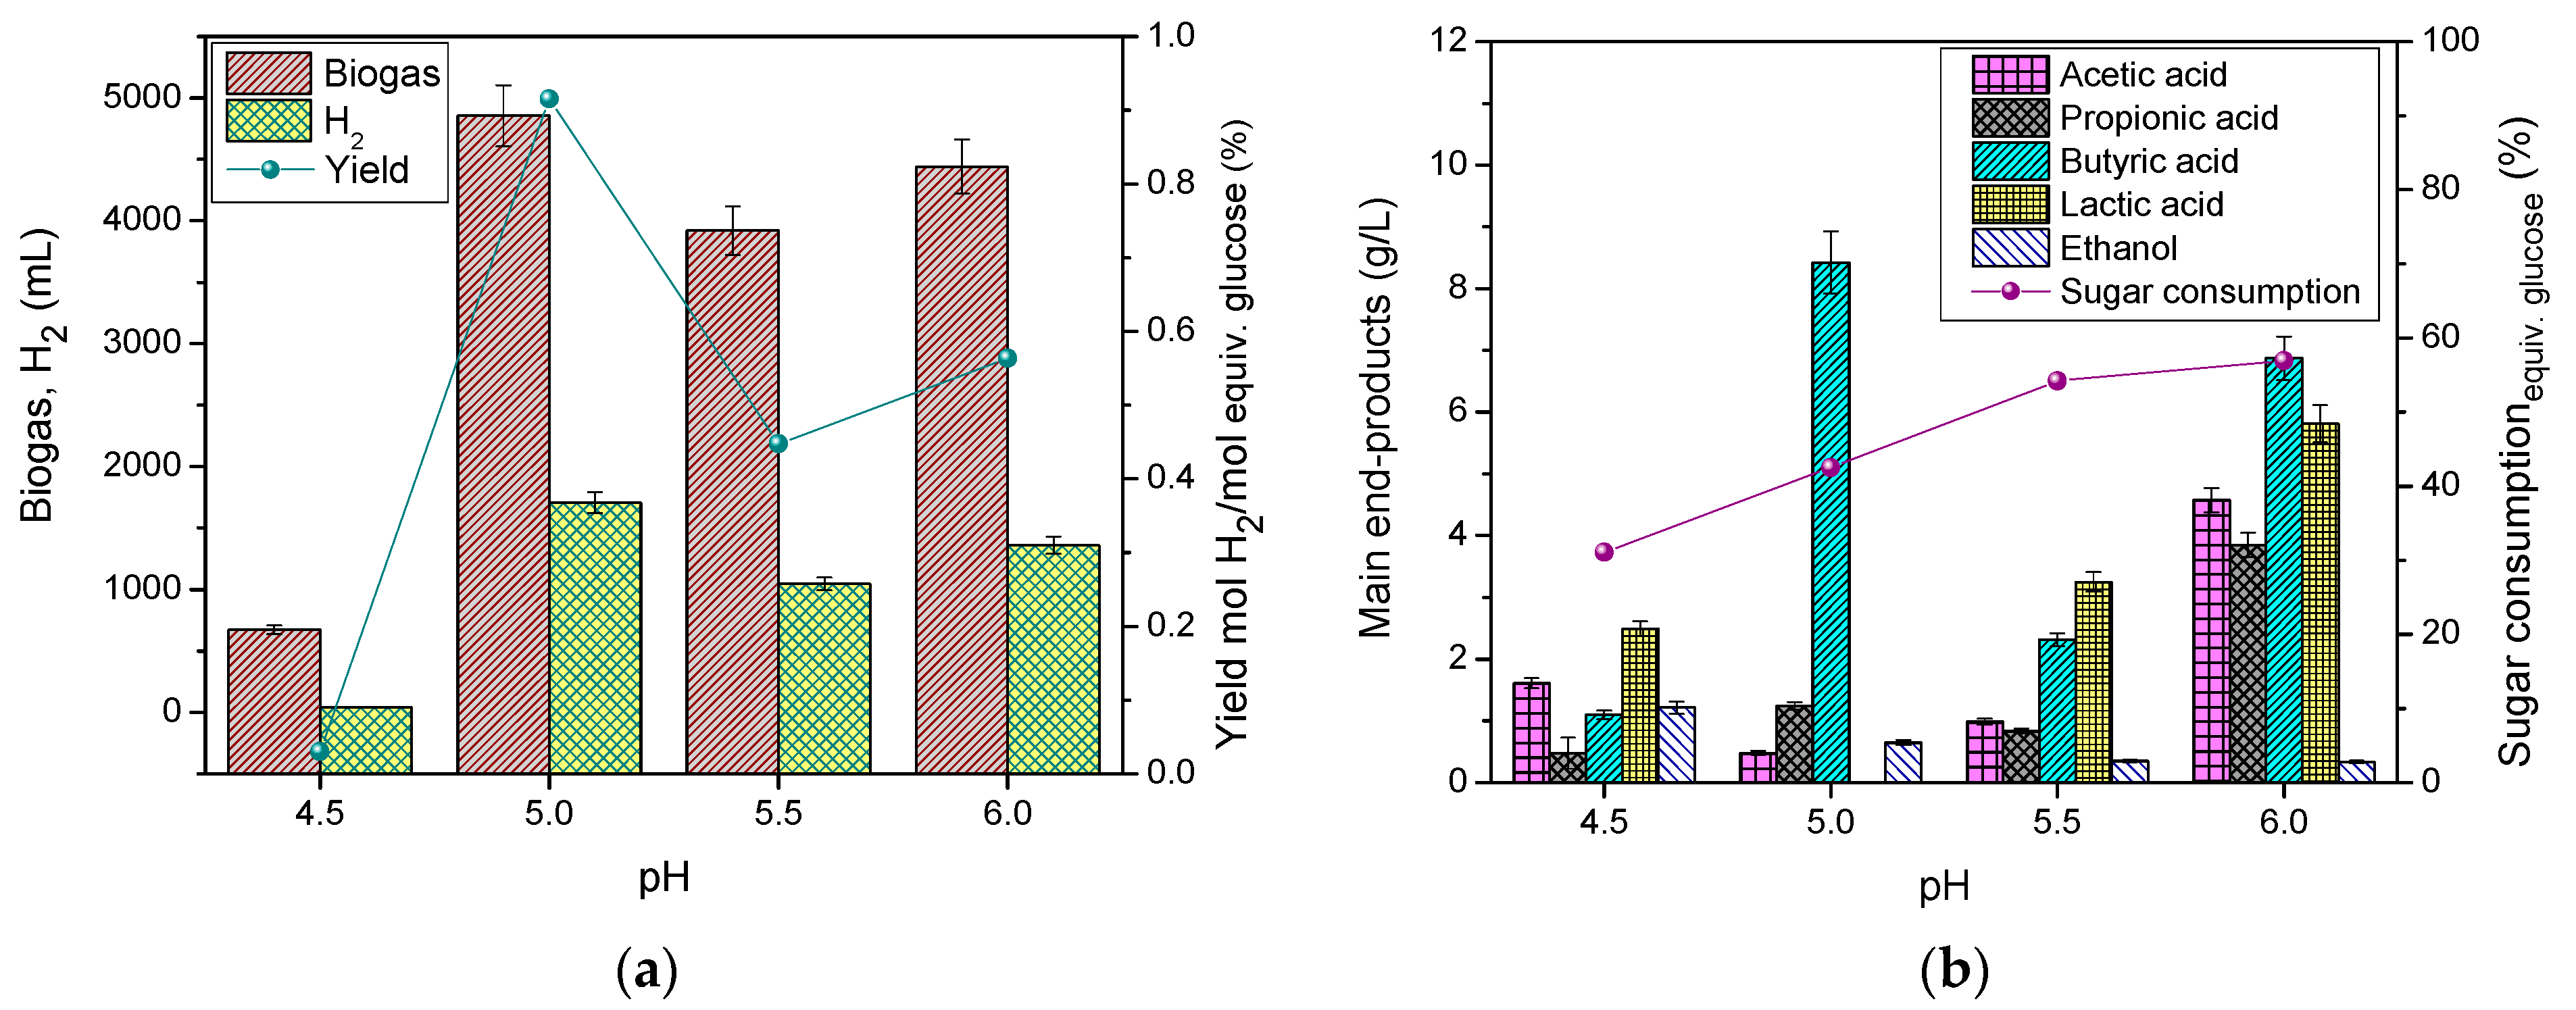
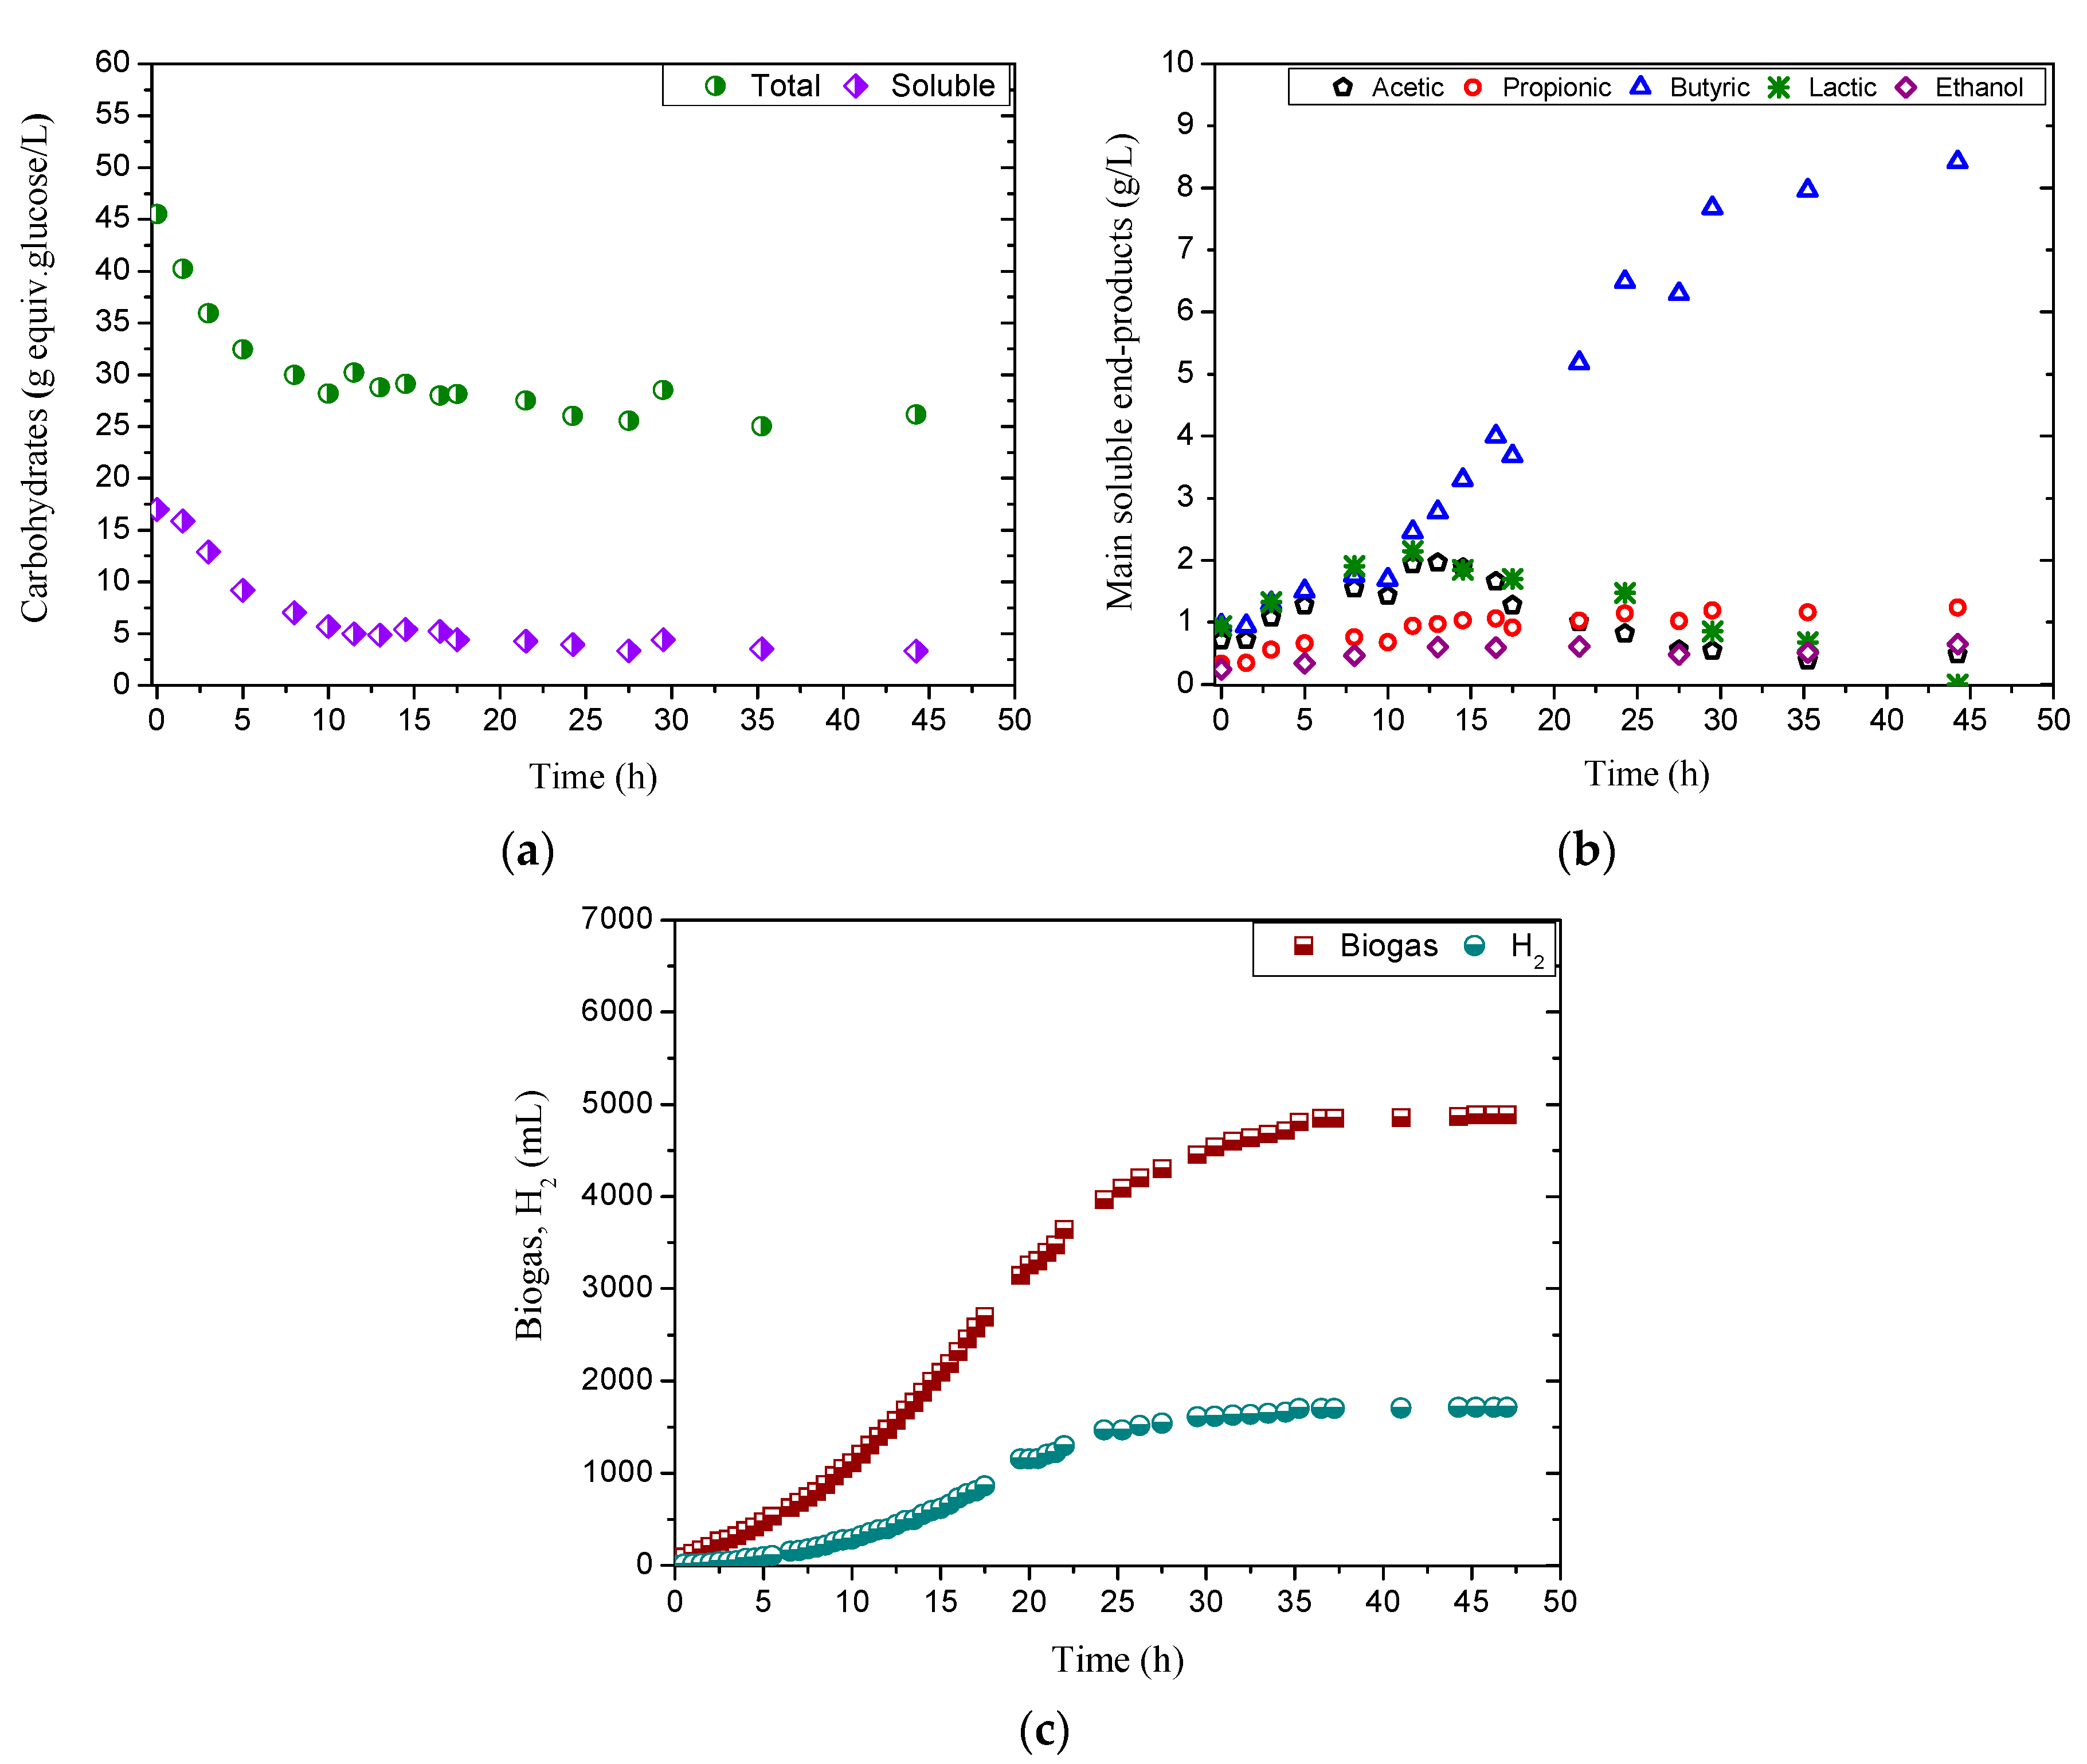
3.2. Effect of pH in Acidogenic Reactor

Batch experiments were conducted, treating a mixture of FS and LCM at a ratio of 95:5 (v/v) for the evaluation of the pH effect on hydrogen yield and the distribution of end-products. The tested pH values were 4.5, 5.0, 5.5, and 6.0. Figure 1a displays the net biogas and hydrogen production in the batch reactor at the different pH values tested. As can be seen, the hydrogen productivity at a low pH value of 4.5 was almost minimum, and equal to 40.75 mL. According to the literature, while hydrogen can be found at such a pH value, the yield is usually limited due to inhibitory effects on the metabolic activity of hydrogen producers [43]. Khanal et al. [44] reported that both the lag phase and the production rate are affected negatively at pH 4.5, as the enzyme which catalyzes the hydrogen production, namely, hydrogenase, is inhibited at pH values below 5.2. In our study, the maximum production was obtained at pH 5.0 (1706.69 mL), whereas increasing the pH value to 5.5 and 6.0 led to 1045.53 and 1358.83 mL hydrogen, respectively. Methane was absent during the tests, pointing out that only acidogenesis was effective. The pH of the growth medium is a significant parameter in many fermentation processes, while the search for the best pH value is usually important in the design stage, especially for fermentation involving acid products.
The consumption of total carbohydrates (equivalent glucose) was increased when switching to higher pH values, with the maximum degradation (56.9%) at pH 6.0 (Figure 1b); it should be noted that exactly the same pattern in terms of carbohydrate consumption was reported by Tsigkou et al. [14] for the mesophilic dark fermentation of food wastes in the pH range of 4.5–6.0. The relatively low degradation in the current study can be explained as due to the nature of sorghum, which is a lignocellulosic material. However, soluble carbohydrate consumption was independent of different pH values, with the highest percentage of 91.96% at pH 5.5, despite simultaneous production due to total carbohydrate hydrolysis. The consumption of carbohydrates during anaerobic conditions accompanies production of hydrogen and metabolic soluble end products, which are usually VFAs (i.e., acetic, propionic, and butyric acids), lactic acid, and alcohols (ethanol). The amount and variation of such products are strongly dependent on both the abundance of the relevant microbial species and the prevailing conditions. Useful information can be derived from the analysis of the aforementioned products regarding the evolution of the process. Figure 1b shows the most abundant end products, namely, acetic, propionic, butyric, and lactic acid and ethanol, at the tested pH conditions. However, lower amounts of i-butyric acid (<900 mg/L) and limited amounts (<300 mg/L) of other VFAs (i.e., valeric, i-valeric and caproic acid) were found in all pH cases. Additionally, as seen in Figure 1b, the variation of pH value exerted a remarkable effect on the distribution of metabolic products. Ethanol production was maximized (1200 mg/L) at the lowest value, pH 4.5, which is in agreement with previous studies [45,46] suggesting a pH value around 4.0–4.5 as optimal for maximizing ethanol production. Lactic acid, as an intermediate fermentation product, was first produced and subsequently metabolized. This metabolic change was influenced by the pH value, while accumulation of lactic acid was noticed apart from a pH value of 5.0. The conversion of lactic acid into propionic and acetic acid occurs without hydrogen production, while its conversion into butyric acid is accompanied by hydrogen production [14,40].
Hence, at pH 5.0 we obtained the highest amount of butyric acid with simultaneous hydrogen production as a result of negligible kinetic limitation in the metabolic reactions. This clearly suggests that the acute hydrogen production phase was mostly related to the accumulation of butyric acid. Regarding VFAs, the highest total amount was measured at pH 6.0 (16.79 g/L) as acetic and propionic acid were increased with increasing pH, indicating that the greatest VFA production occurred at pH 6.0, which is similar to other studies [47,48]. The acetic acid concentration at pH 6.0 was 9.54-fold higher than at pH 5.0, whereas the propionic acid concentration was 3.1-fold higher. Figure 1a depicts the hydrogen yield for the tested pH range. The maximum hydrogen yield, as can be seen, was calculated at pH 5.0, and was equal to 0.92 mol H2/mol equivalent glucose consumed. In the current study, high hydrogen yields are linked with butyric acid production, whereas low yields are linked to the production of end products such as propionic acid, ethanol, and lactic acid, which are accompanied by negative or zero hydrogen production. The estimated hydrogen yield was higher than other yields obtained by our previous studies. Dareioti et al. [40] found an optimal pH value of 6.0 accompanied by a hydrogen yield of 0.64 mol H2/mol equivalent glucose consumed when using a mixture of olive mill waste, cheese whey, and LCM in a ratio 55:40:5, while in the case of FS, cheese whey and LCM in a ratio 55:40:5 yielded a maximum of 0.52 mol H2/mol equivalent glucose at pH 5.5 [28].
Figure 2 shows the experimental evolution at pH 5.0, namely, the experiment with the maximum hydrogen yield. In particular, the consumption of both total and soluble carbohydrates is linked to the production rate of major products during the whole experimentation period. Carbohydrate consumption (Figure 2a) led to an increase of VFAs, lactic acid, and ethanol (Figure 2b). The most abundant metabolic end product was butyric acid (approximately at 8.4 g/L), mainly following the decreasing amounts of acetic and lactic acid. The increasing concentration curve for butyric acid was synchronized with the increasing curve for hydrogen production (Figure 2c), indicating a butyrate-type pathway.

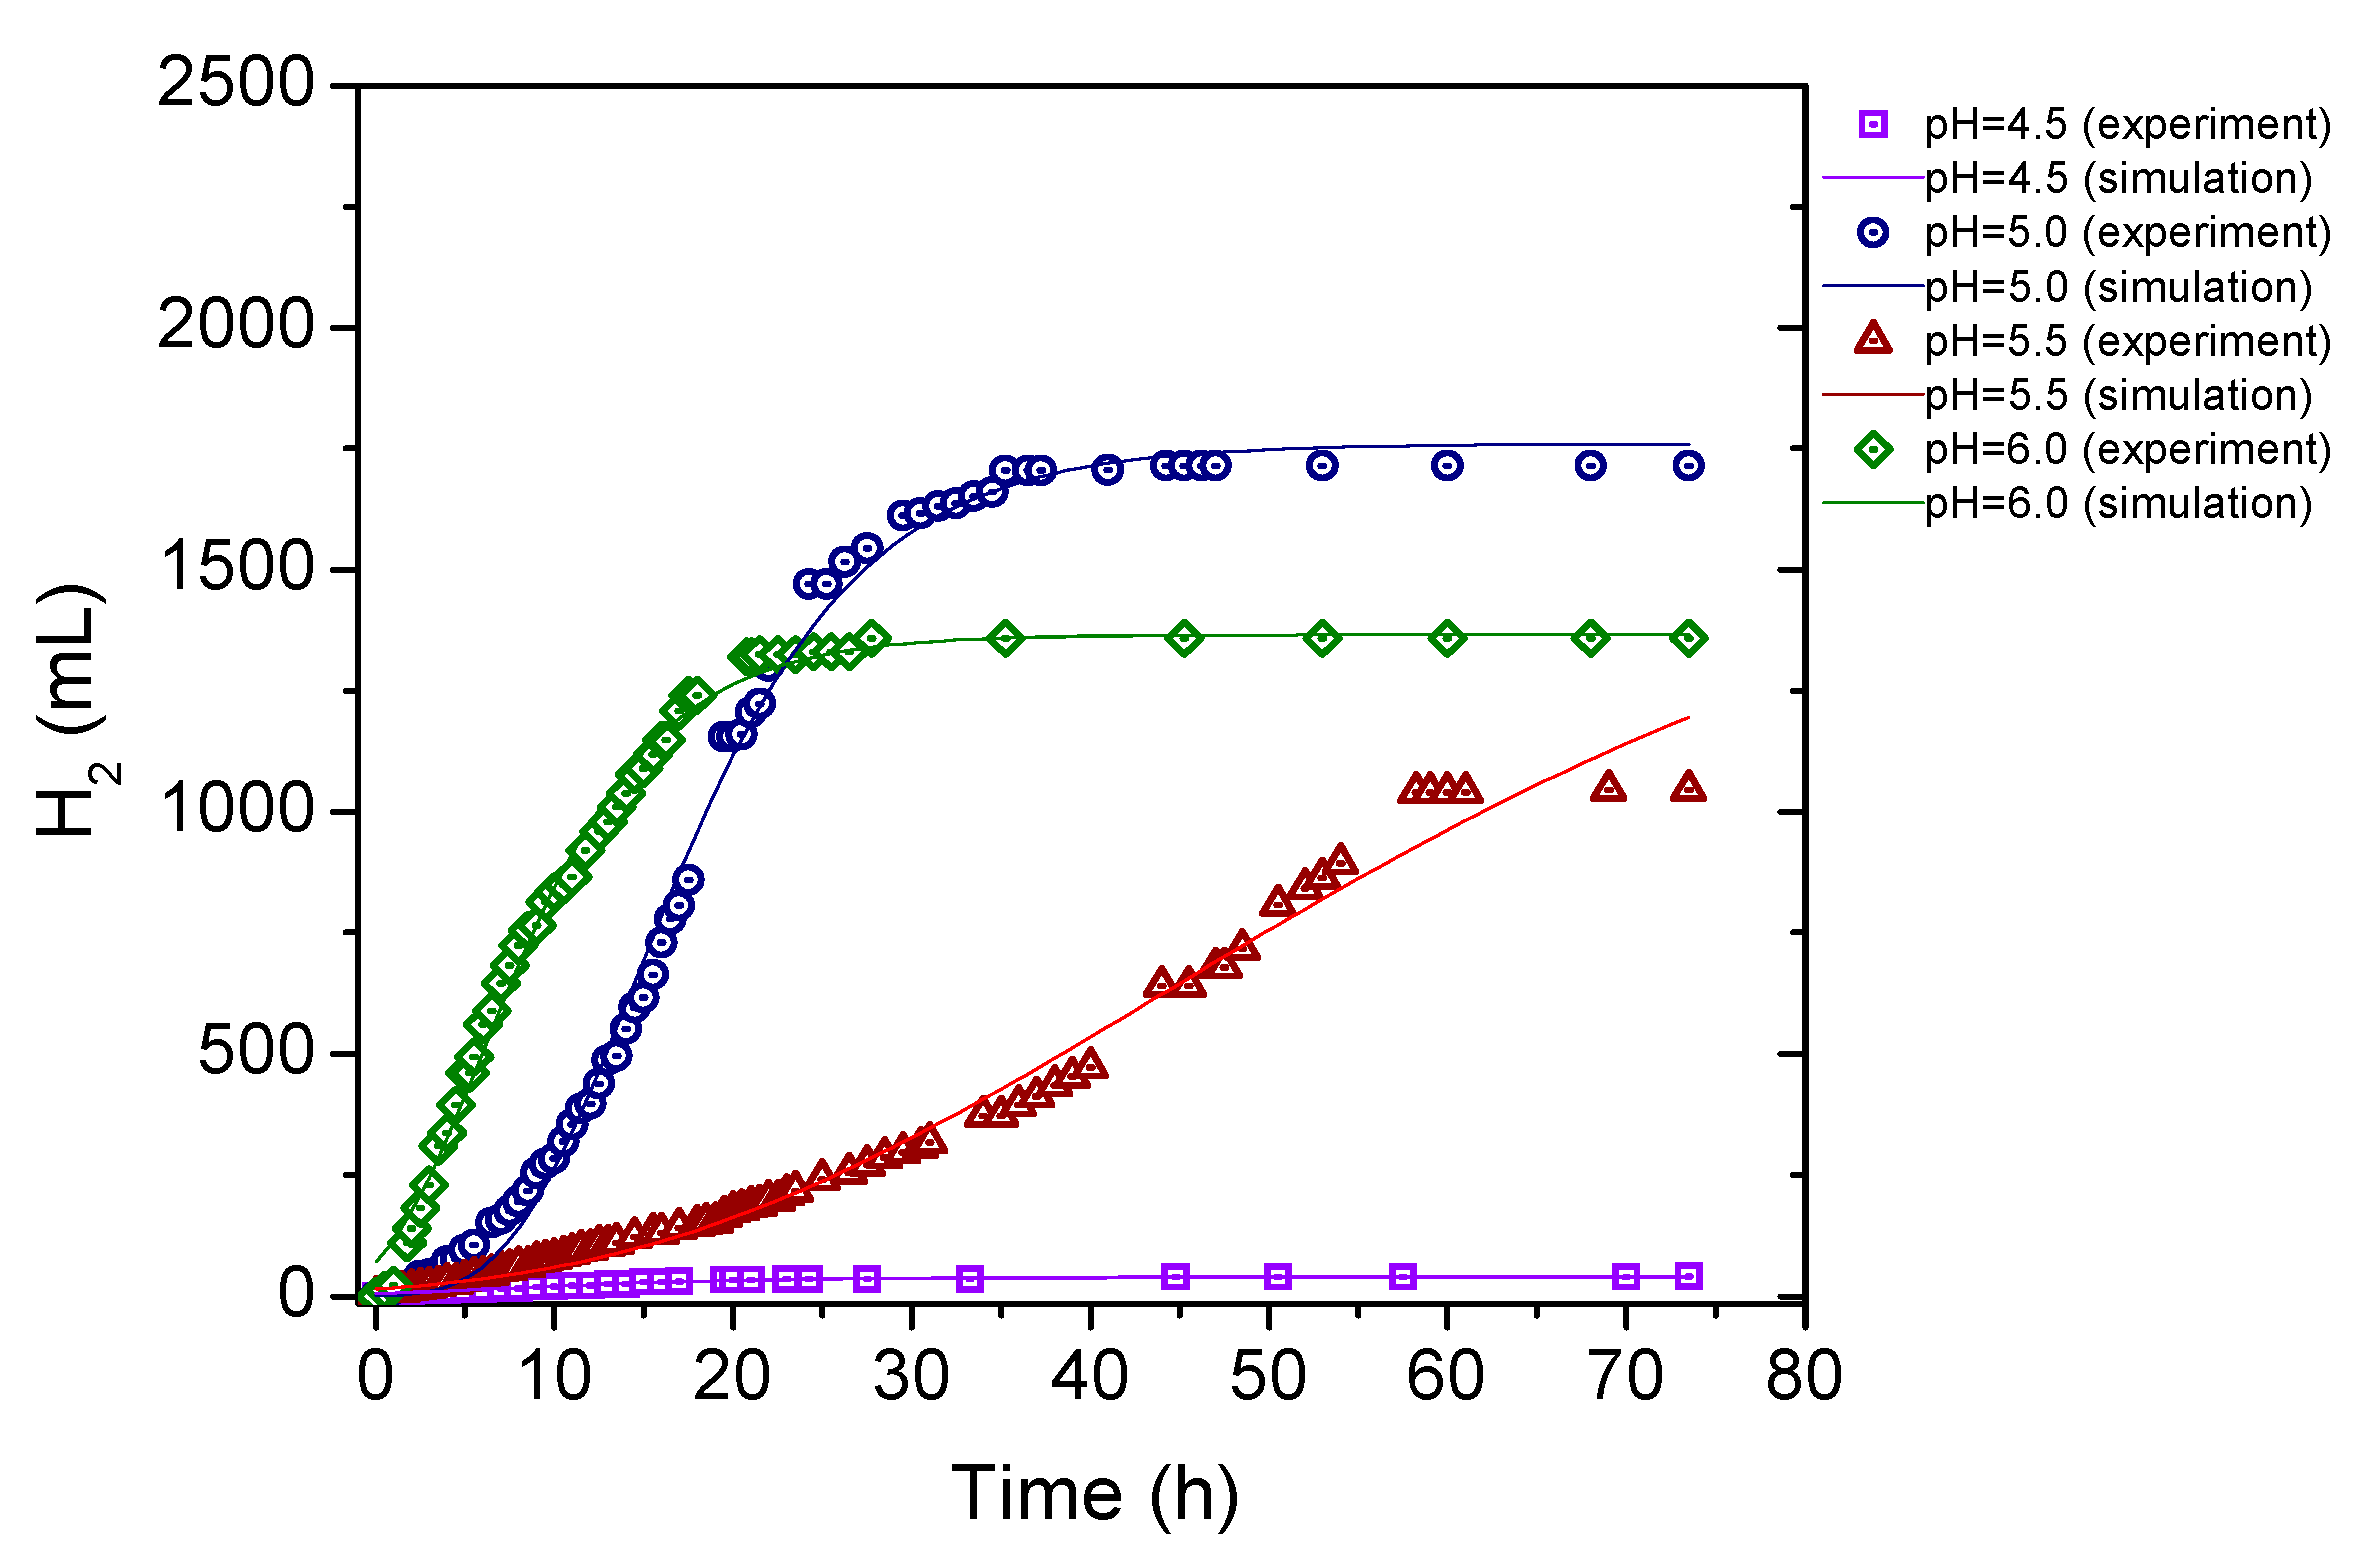
3.3. Kinetic Analysis

The modified Gompertz equation was exploited for the description of hydrogen formation during acidogenesis. Figure 3 presents hydrogen production for the experimental data as well as the modified Gompertz model fitting at four different controlled pH conditions. The correlation coefficient (r2) range was 0.983–0.996. Regarding the experimental data comparison to the model simulation, the parameters P, Rm, and λ were determined. The parameters of the fitted equation for the hydrogen are summarized in Table 3. The maximum P and Rm peaks were obtained at pH 5.0, and were equal to 1759.29 mL and 92.53 mL H2/h, respectively. When the acidogenic reactor was operated at pH 5.5, the most extended λ of 15.89 h was estimated, whereas at pH 4.5 the λ parameter was not measurable due to the limited hydrogen production.

3.4. Effect of ES on Hydrogen Production

Furthermore, a batch experiment at pH 5.0 with the pretreated ES in the mixture was conducted in order to assess the impact of ES, as opposed to FS, on hydrogen and VFAs production. The efficiency of the process using pretreated ES instead of FS was lower, as can be seen in Figure 4. The carbohydrate degradation was lower (16.06%, data not shown), which may be explained by the fact that the ES was characterized by a lower soluble sugar concentration compared to FS (Table 1). As a result, the distribution of the main metabolites was different; an accumulation of lactic acid was observed, with simultaneous lower butyric acid production (Figure 4a) and lower hydrogen productivity (586.30 mL), respectively (Figure 4b).

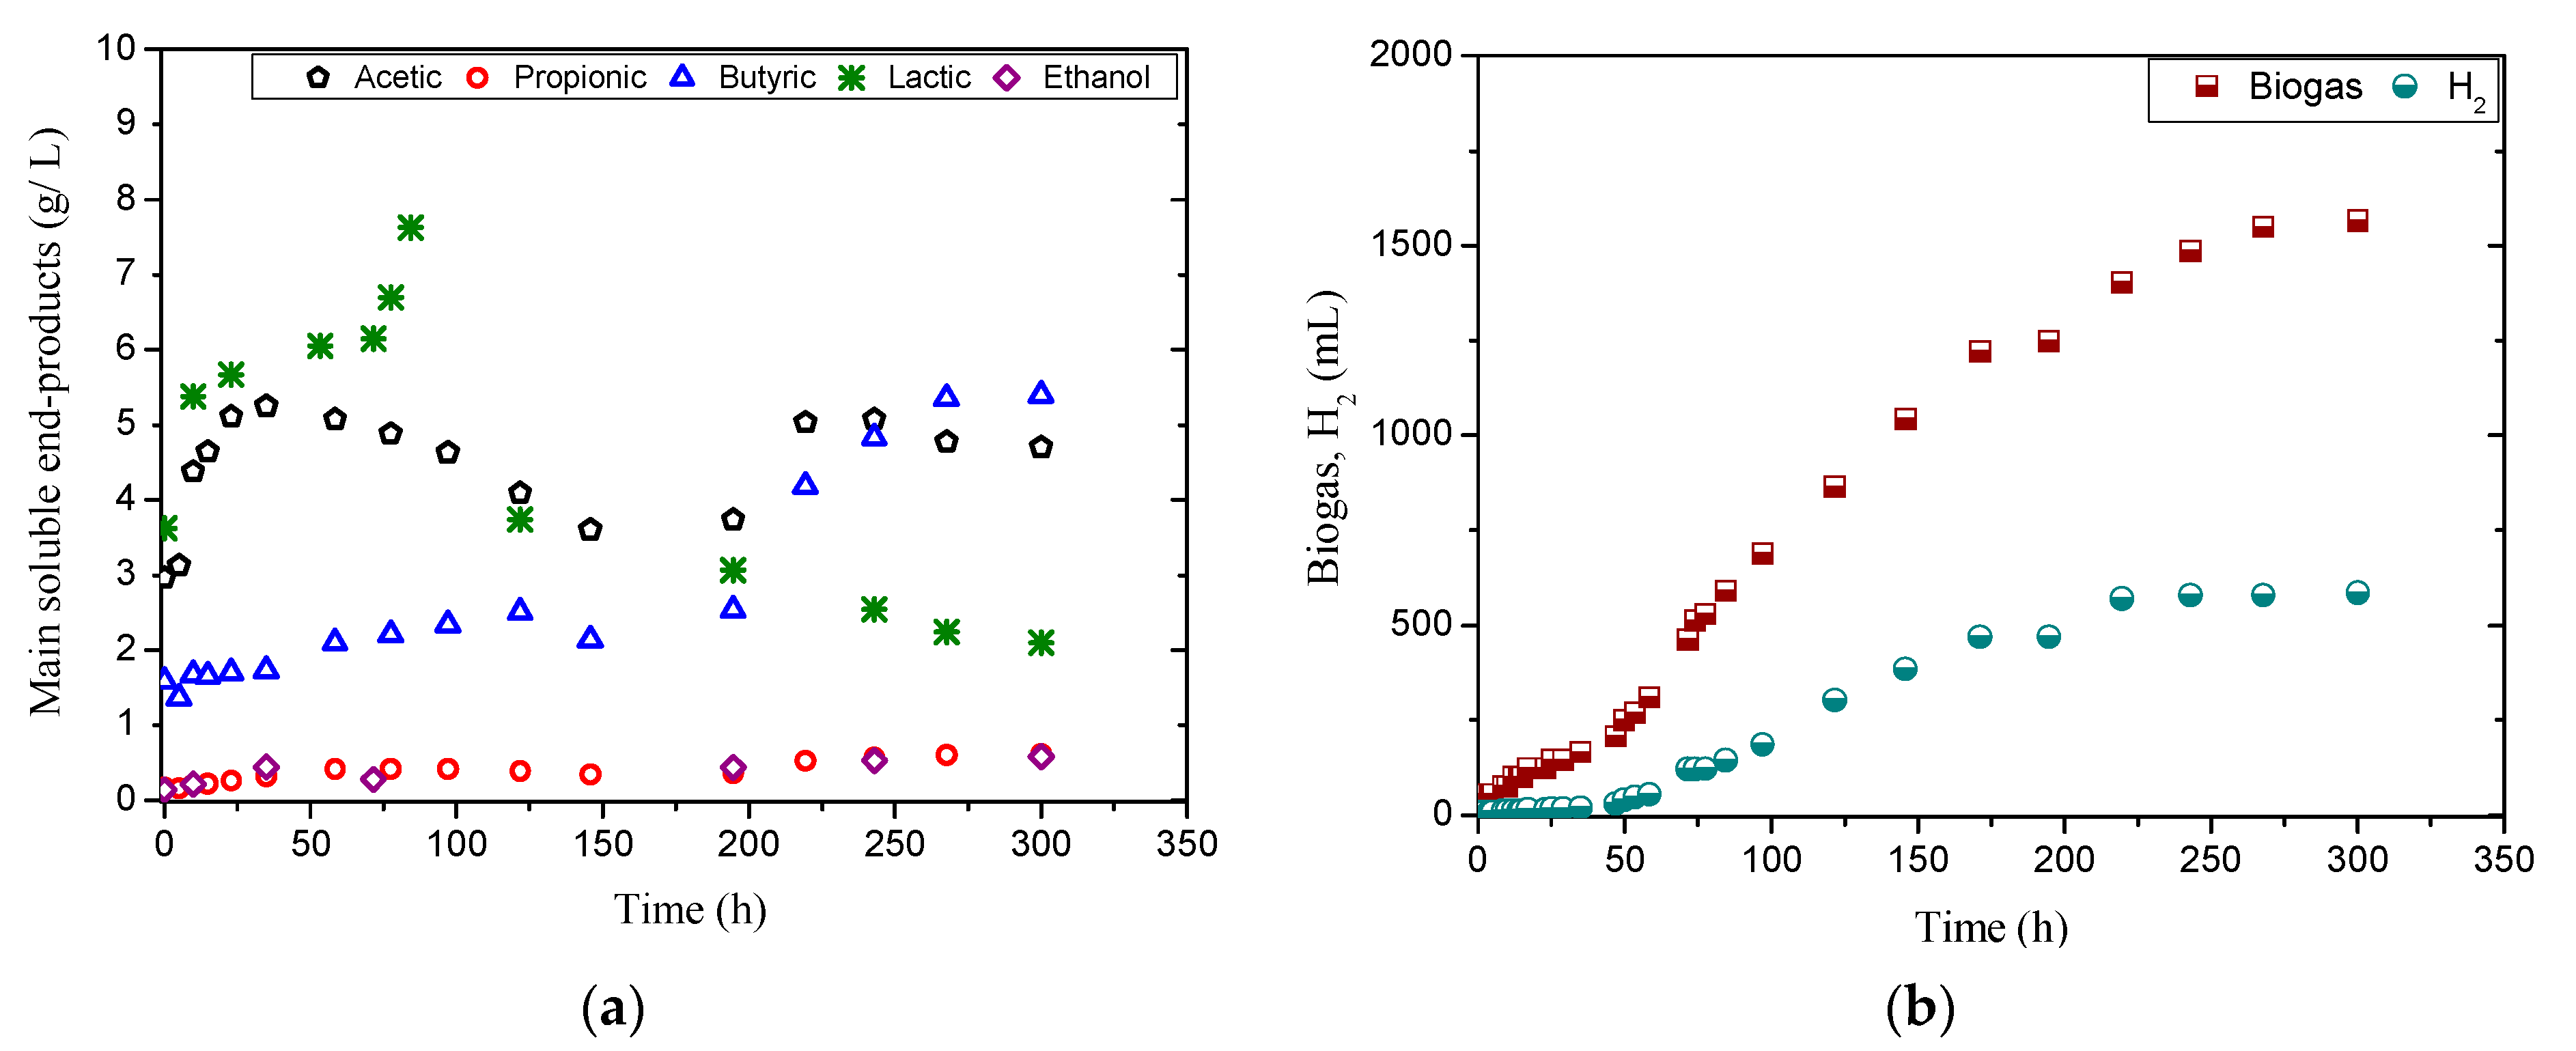
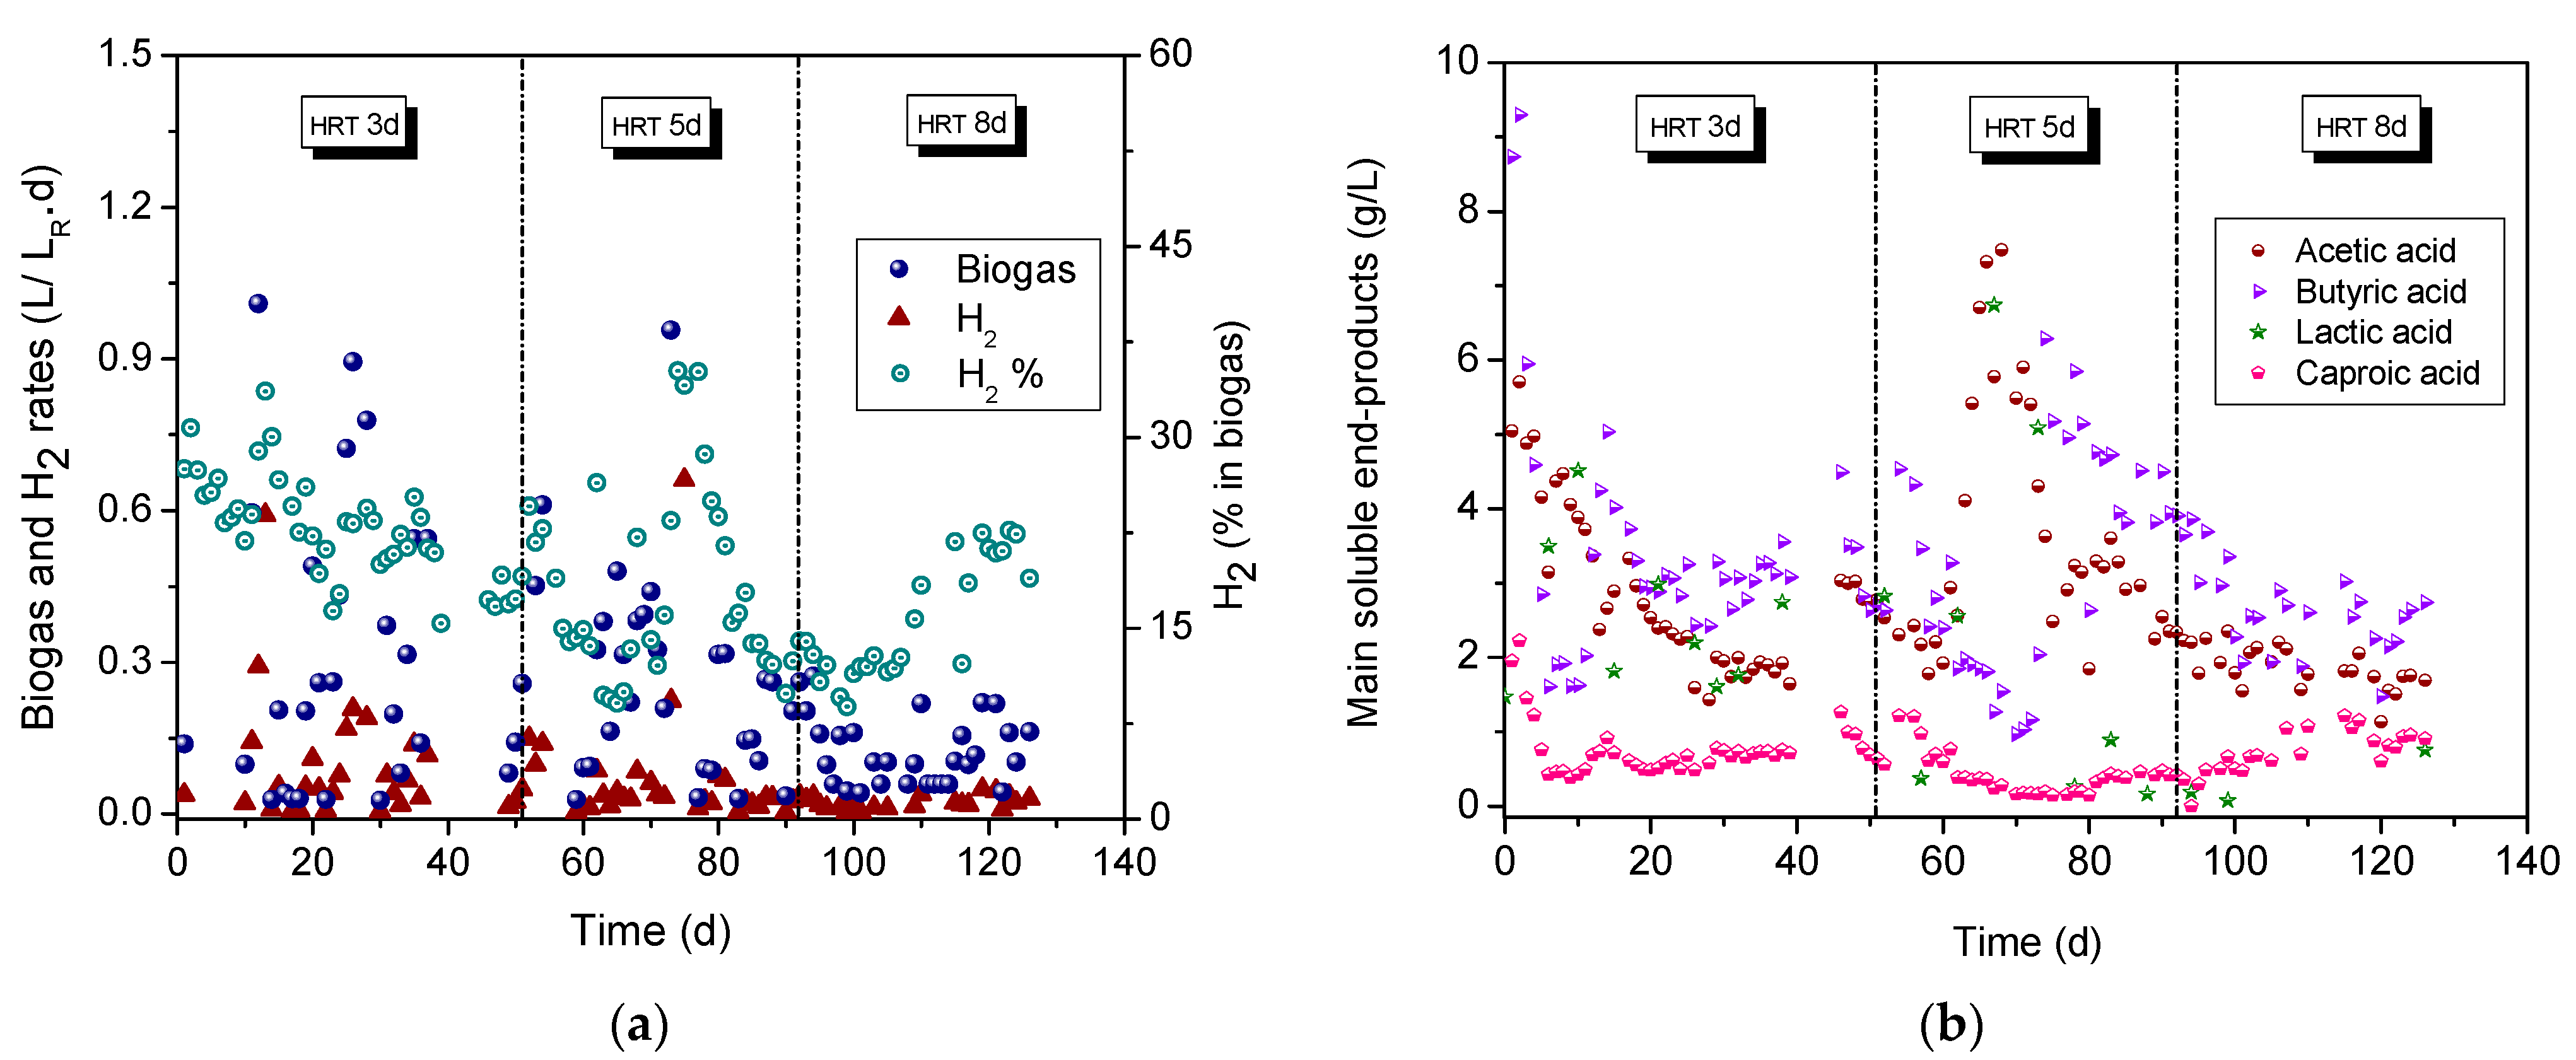
3.5. CSTR Acidogenic Reactor: Effect of HRT

The acidogenic reactor was operated under CSTR mode with different HRTs (3, 5, and 8 d) at a constant pH of 5.0 using a mixture of pretreated ES and LCM (95:5, v/v). Following reactor startup, the primary HRT was adjusted at 3 d, running for 51 days. Afterwards, the HRT was increased to 5 d and 8 d for 41 and 34 days, respectively. The composition of the produced biogas was characterized only by hydrogen and carbon dioxide, without traces of methane during the whole period of our investigation, confirming that such conditions completely suppress the growth of methanogens. Figure 5a presents the net biogas and hydrogen production rate as a function of experimental time. As shown in Figure 5a, the reactor’s performance was characterized by fluctuating biogas and hydrogen production rates, perhaps due to the complexity of the feedstock. The initial biogas production rate for the HRT of 3 d exhibited fluctuations, resulting in a mean value of 0.36 L/LR·d, an average of 22% of which was hydrogen (Figure 5a) at the steady state. The highest hydrogen production rate of 0.13 L/LR·d, corresponding to a yield of 1.68 mol H2/mol carbohydrate consumed (209 mL H2/g carbohydrate), was achieved at the HRT of 5 d. We observed a considerably elevated hydrogen yield and a lower hydrogen production rate compared to the results in our previous experiment [33] using a feedstock with 55% pretreated ES, 40% cheese whey, and 5% LCM.
Referring to soluble end products concentration, important amounts of lactic acid and VFAs (namely, acetic, butyric, and caproic acid) were the most prominent at all tested HRTs (Figure 5b). Propionic, isobutyric, and valeric acid and ethanol were likewise detected, however, in amounts less than 400 mg/L, while isovaleric acid was detected in trace amounts. It is noticeable that the highest amount of total VFAs under steady-state conditions was found at the HRT of 5 d (approximately 7.9 g/L) with minimum lactic acid concentration. A system malfunction at the 60th d led to a temporary accumulation of lactic and acetic acid with no production of butyric acid; however, the system returned to stability after a few days. However, lactic acid remained low, reaching a concentration of zero after increasing the HRT from 5 d to 8 d, whereas at the lower HRT of 3 d lactic acid was not fully degraded, confirming that lactic acid can be degraded by enriched microorganisms which demand a retention time longer than 3 d.
The soluble end products resulted from the degradation of carbohydrates. For all tested HRTs, carbohydrate consumption efficiency was insignificantly influenced by HRT variation, and was over 11.26 ± 1.3% and 40.30 ± 6.9% for total and soluble, respectively. Table 4 presents the performance of the acidogenic reactor considering the main parameters at each HRT.

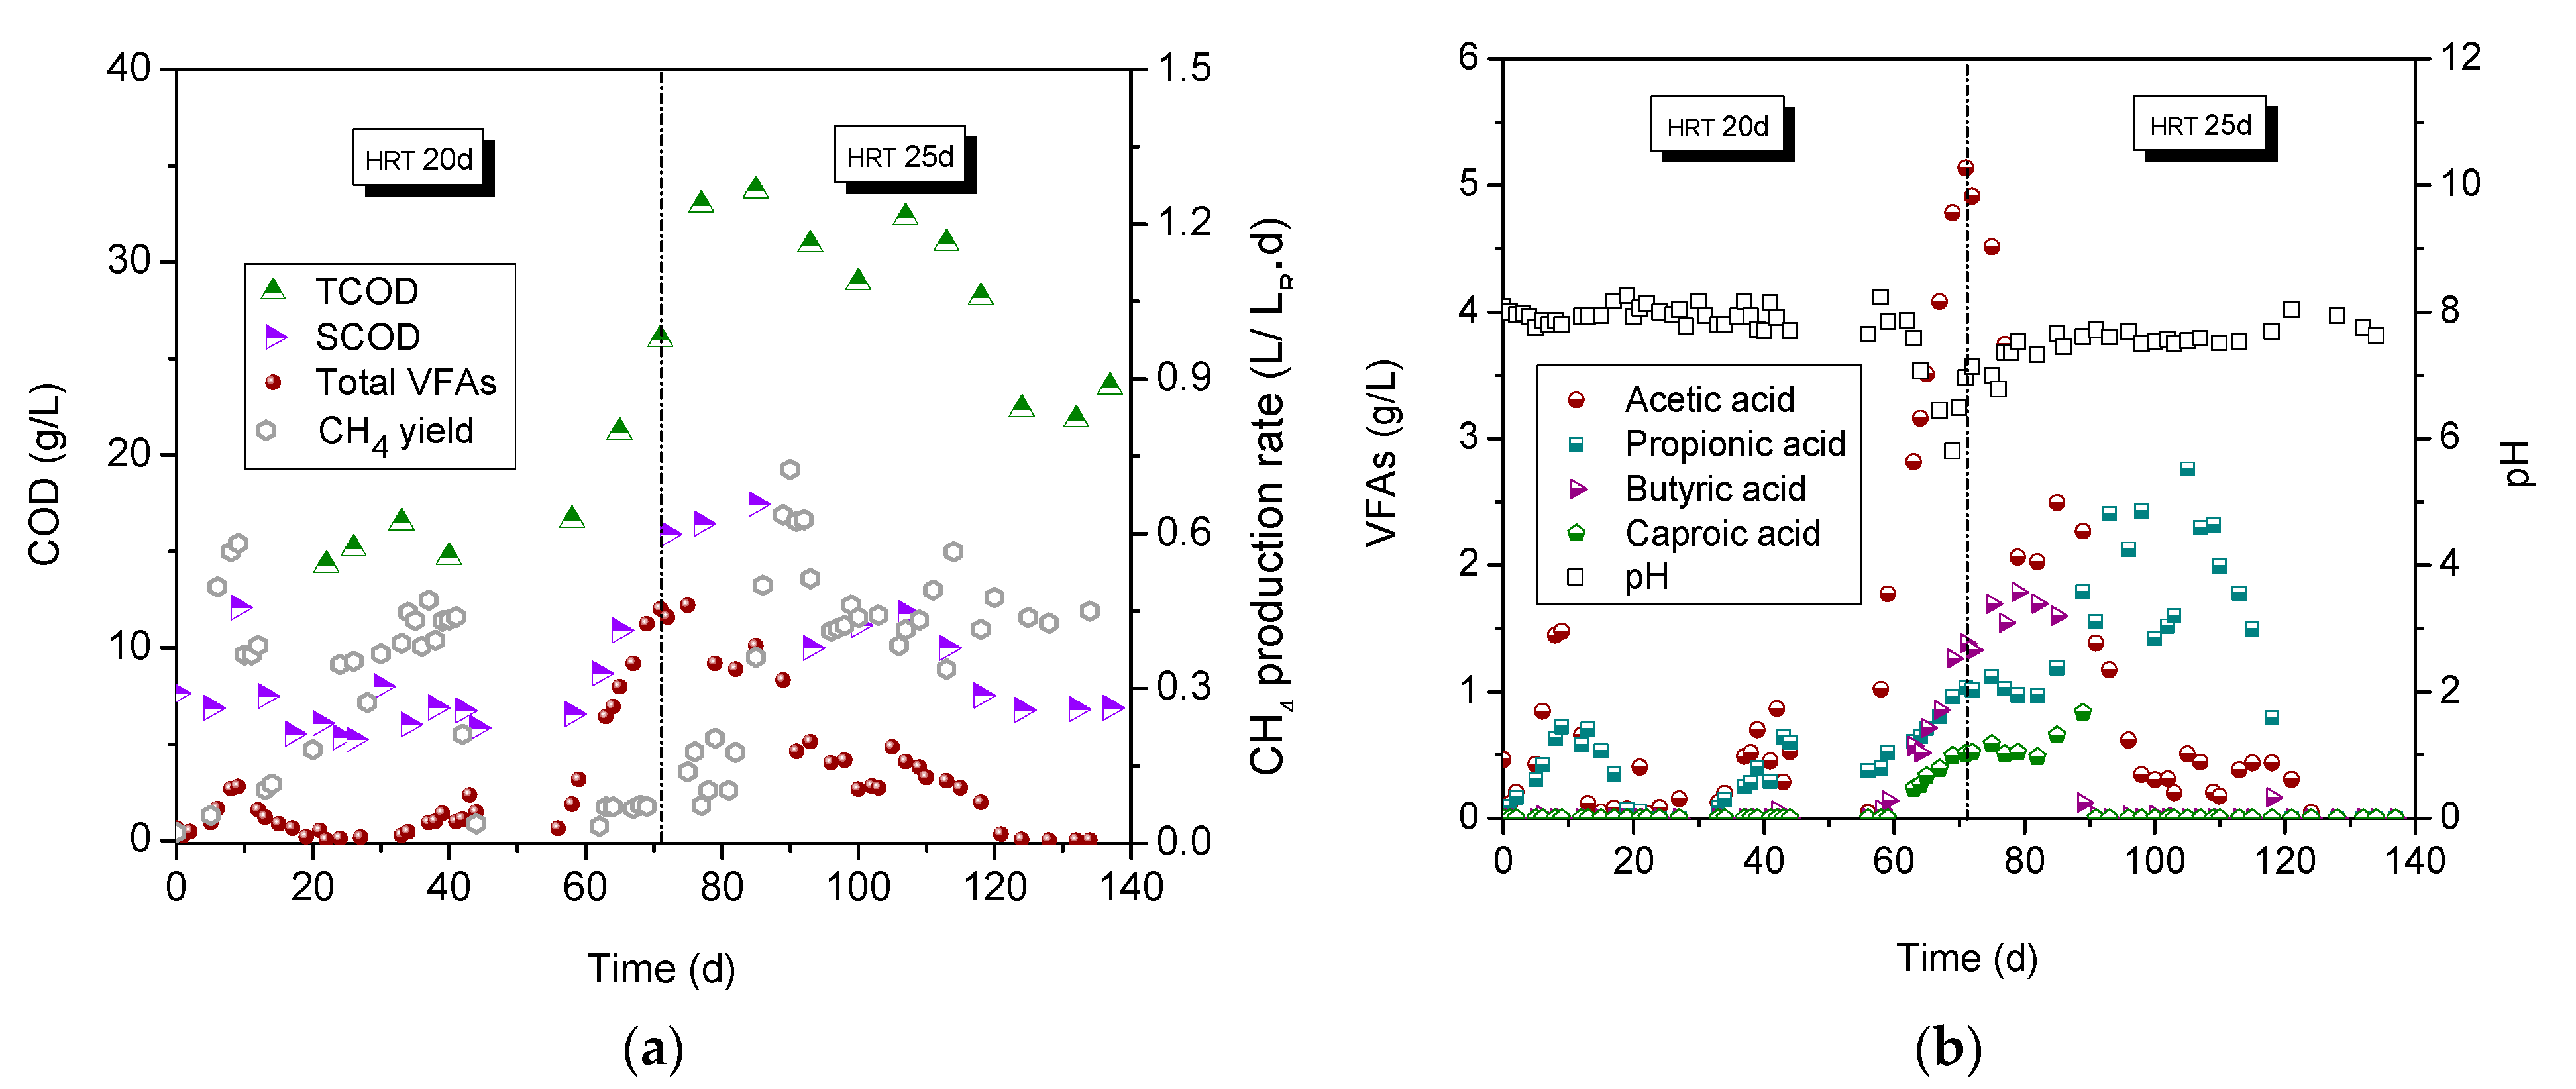
3.6. CSTR Methanogenic Reactor: Effect of HRT

The homogenized acidogenic effluent was fed into the methanogenic reactor for methane production for HRTs of 20 and 25 d. The influent of the methanogenic reactor was rich in VFAs, as anticipated, contributing about 73.5% of COD compared to the soluble COD concentration. Methane production and pH variation at two different HRTs are shown in Figure 6. At the initial HRT of 20 d, a methane production rate of 0.43 L/LR·d and a yield of 230.9 mL CH4/g vsadded was reported until the 40th day of the experimental period, whereas the biogas contained an average of 55% of methane. However, further operation led to a significant decrease in methane production with simultaneous accumulation of VFAs (up to 6.76 g/L), indicating organic overloading (Figure 6b). When increasing the HRT to 25 d methane production was increased, and subsequently reached optimal conditions with 57% methane. An average methane production rate of 0.44 L/LR·d, corresponding to an average yield of 295.3 mL CH4/g VSadded, was obtained. According to Sambusiti et al. [49], similar methane yields of 237 and 297 mL CH4/g VSadded were noticed in anaerobic digestion of untreated and pre-treated ES, respectively, in two semi-continuous CSTRs. Moreover, the co-digestion of LCM with different shares of maize was investigated using continuous reactors, and the greatest specific methane yield (259 mL CH4/g VSadded) was obtained when the maize amount in the feedstock was equal to 40% [50].
The pH fluctuated within a stable range of 7.5–8.1, apart from the period of reactor instability, in which the pH decreased, leading to inhibition of the methanogenic biomass. The effluent pH was significantly higher than the influent pH, as a direct consequence of the degradation of VFAs [51]. The concentration of VFAs was significantly lower in methanogenic effluent than influent, especially at an HRT of 25 d, when complete degradation was observed (Figure 6). Therefore, accumulation after the 40th day of operation at an HRT of 20 d implies that the methanogens were not functioning as expected, with a reduction in the methane production rate. The commonly applied HRTs in mesophilic systems usually range from 10 to 40 d, while at shorter HRTs methane production tends to decrease [52].
The total VFA/alkalinity ratio reflects the buffering capacity, and can be utilized as a parameter for evaluating process stability. A maximum threshold of 0.6 is adequate for favorable operation without acidification risk [53]. When VFA accumulation was detected at the HRT of 20 d, the total VFA/alkalinity ratio was estimated at 1.17, higher than the maximum threshold value. Such value indicates destabilization and deterioration of the process as a result of microorganism inhibition at an HRT of 20 d. When increasing the HRT to 25 d, the ratio decreased to 0.88 after fifteen days, and eventually to zero after a long period of operation. The evolution of total and soluble COD as a function of the methanogenic reactor experimental time is exhibited in Figure 6a. The removal of COD in combination with gas production in the anaerobic digester provided evidence of effective microbial activity from methanogenic bacteria. The total and soluble COD removal efficiencies were 49.40% and 68.80%, respectively, for an HRT of 25 d. In the literature [54], a similar production rate of 0.45 L CH4/LR·d was found in the case of dairy manure anaerobic digestion, exhibiting a total COD removal equal to 50%. Figure 6a presents the evolution of VFAs expressed in units of COD. Total VFAs concentration followed the same general trend as the value of soluble COD. Moreover, the average removal efficiencies are estimated in terms of TS, VS, and total carbohydrates at an HRT of 25 d. The TS and VS removal values were equal to 27.95% and 52.72%, respectively, whereas the consumption of total carbohydrates in glucose equivalents was measured at 87.5% for the methanogenic reactor. It is well known that alkaline pretreatment eliminates lignin and a portion of hemicellulose, effectively increasing the accessibility of microorganisms to the cellulose [20].

4. Conclusions

The anaerobic co-digestion of sorghum biomass and LCM (95:5, v/v) in a two-stage system is a sustainable and environmentally attractive method for the treatment of such wastes. In our batch tests, regarding acidogenesis, the optimal pH value of 5.0 was acquired with a highest hydrogen yield of 0.92 mol H2/mol carbohydrates consumed, while pH 6.0 favoured VFAs accumulation and higher carbohydrate consumption. A two-stage CSTR system indicated that an HRT of 5 d (at pH 5.0) led to the highest hydrogen production rate at 0.13 L/LR·d and hydrogen yield of 1.68 mol H2/mol carbohydrates consumed. In methanogenesis, the greatest yield was achieved at an HRT of 25 d (295.3 mL CH4/g VSadded). Regarding the comparison of fresh and ensiled sorghum, fresh sorghum proved more efficient in terms of hydrogen production; however, ensiled sorghum biomass is more attractive for long-term storage prior to use.

Author Contributions

Conceptualization, M.A.D. and M.K.; methodology, M.A.D. and K.T.; software, M.A.D., K.T. and A.I.V.; validation, M.A.D. and A.I.V.; formal analysis, M.A.D. and A.I.V.; investigation, M.K.; resources, M.K.; data curation, M.A.D., K.T. and A.I.V.; writing—original draft preparation, M.A.D.; writing—review and editing, K.T. and A.I.V.; visualization, K.T.; supervision, M.K.; project administration, M.K.; funding acquisition, M.K. All authors have read and agreed to the published version of the manuscript.

Funding

This research has been co-financed by the European Union and Greek national funds through the Operational Program Competitiveness, Entrepreneurship and Innovation, under the call RESEARCH—CREATE—INNOVATE through the project “Development of an innovative integrated system for estimating the biochemical methane potential (BMP) of different biomass sources-Green.BMP” (project code: T1EDK-03148).

Institutional Review Board Statement

Not applicable.

Informed Consent Statement

Not applicable.

Data Availability Statement

Not applicable.

Conflicts of Interest

The authors declare no conflict of interest.

References

  1. Roy, S.; Dikshit, P.K.; Sherpa, K.C.; Singh, A.; Jacob, S.; Rajak, R.C. Recent nanobiotechnological advancements in lignocellulosic biomass valorization: A review. J. Environ. Manag. 2021, 297, 113422. [Google Scholar] [CrossRef]
  2. Aravani, V.P.; Sun, H.; Yang, Z.; Liu, G.; Wang, W.; Anagnostopoulos, G.; Syriopoulos, G.; Charisiou, N.D.; Goula, M.A.; Kornaros, M.; et al. Agricultural and livestock sector’s residues in Greece & China: Comparative qualitative and quantitative characterization for assessing their potential for biogas production. Renew. Sustain. Energy Rev. 2022, 154, 111821. [Google Scholar] [CrossRef]
  3. Okolie, J.A.; Epelle, E.I.; Tabat, M.E.; Orivri, U.; Amenaghawon, A.N.; Okoye, P.U.; Gunes, B. Waste biomass valorization for the production of biofuels and value-added products: A comprehensive review of thermochemical, biological and integrated processes. Process Saf. Environ. Prot. 2022, 159, 323–344. [Google Scholar] [CrossRef]
  4. Aravani, V.P.; Tsigkou, K.; Papadakis, V.G.; Kornaros, M. Biochemical Μethane potential of most promising agricultural residues in Northern and Southern Greece. Chemosphere 2022, 296, 133985. [Google Scholar] [CrossRef]
  5. Piñas, J.A.V.; Venturini, O.J.; Lora, E.E.S.; del Olmo, O.A.; Roalcaba, O.D.C. An economic holistic feasibility assessment of centralized and decentralized biogas plants with mono-digestion and co-digestion systems. Renew. Energy 2019, 139, 40–51. [Google Scholar] [CrossRef]
  6. Schievano, A.; Tenca, A.; Lonati, S.; Manzini, E.; Adani, F. Can two-stage instead of one-stage anaerobic digestion really increase energy recovery from biomass? Appl. Energy 2014, 124, 335–342. [Google Scholar]
  7. Dareioti, M.A.; Vavouraki, A.I.; Tsigkou, K.; Kornaros, M. Assessment of Single- vs. Two-Stage Process for the Anaerobic Digestion of Liquid Cow Manure and Cheese Whey. Energies 2021, 14, 5423. [Google Scholar] [CrossRef]
  8. Tsigkou, K.; Tsafrakidou, P.; Kopsahelis, A.; Zagklis, D.; Zafiri, C.; Kornaros, M. Used disposable nappies and expired food products valorisation through one- & two-stage anaerobic co-digestion. Renew. Energy 2020, 147, 610–619. [Google Scholar] [CrossRef]
  9. Srisowmeya, G.; Chakravarthy, M.; Devi, G.N. Critical considerations in two-stage anaerobic digestion of food waste—A review. Renew. Sustain. Energy Rev. 2019, 119, 109587. [Google Scholar] [CrossRef]
  10. Cremonez, P.A.; Teleken, J.G.; Meier, T.R.W.; Alves, H.J. Two-Stage anaerobic digestion in agroindustrial waste treatment: A review. J. Environ. Manag. 2021, 281, 111854. [Google Scholar] [CrossRef]
  11. Hans, M.; Kumar, S. Biohythane production in two-stage anaerobic digestion system. Int. J. Hydrog. Energy 2019, 44, 17363–17380. [Google Scholar] [CrossRef]
  12. Tsigkou, K.; Sakarika, M.; Kornaros, M. Inoculum origin and waste solid content influence the biochemical methane potential of olive mill wastewater under mesophilic and thermophilic conditions. Biochem. Eng. J. 2019, 151, 107301. [Google Scholar] [CrossRef]
  13. Tsigkou, K.; Sivolapenko, N.; Kornaros, M. Thermophilic Dark Fermentation of Olive Mill Wastewater in Batch Reactors: Effect of pH and Organic Loading. Appl. Sci. 2022, 12, 2881. [Google Scholar] [CrossRef]
  14. Tsigkou, K.; Tsafrakidou, P.; Athanasopoulou, S.; Zafiri, C.; Kornaros, M. Effect of pH on the Anaerobic Fermentation of Fruit/Vegetables and Disposable Nappies Hydrolysate for Bio-hydrogen Production. Waste Biomass Valorization 2020, 11, 539–551. [Google Scholar] [CrossRef]
  15. Zakoura, M.; Kopsahelis, A.; Tsigkou, K.; Ntougias, S.; Ali, S.S.; Kornaros, M. Performance evaluation of three mesophilic upflow anaerobic sludge blanket bioreactors treating olive mill wastewater: Flocculent and granular inocula tests, organic loading rate effect and anaerobic consortia structure. Fuel 2022, 313, 122951. [Google Scholar] [CrossRef]
  16. Tsigkou, K.; Kornaros, M. Development of a high-rate anaerobic thermophilic upflow packed bed reactor for efficient bioconversion of diluted three-phase olive mill wastewater into methane. Fuel 2022, 310, 122263. [Google Scholar] [CrossRef]
  17. Tsigkou, K.; Zagklis, D.; Tsafrakidou, P.; Zapanti, P.; Manthos, G.; Karamitou, K.; Zafiri, C.; Kornaros, M. Expired food products and used disposable adult nappies mesophilic anaerobic co-digestion: Biochemical methane potential, feedstock pretreatment and two-stage system performance. Renew. Energy 2021, 168, 309–318. [Google Scholar] [CrossRef]
  18. Zagklis, D.; Papadionysiou, M.; Tsigkou, K.; Tsafrakidou, P.; Zafiri, C.; Kornaros, M. Effect of pH on the Economic Potential of Dark Fermentation Products from Used Disposable Nappies and Expired Food Products. Appl. Sci. 2021, 11, 4099. [Google Scholar] [CrossRef]
  19. Ghimire, A.; Frunzo, L.; Pirozzi, F.; Trably, E.; Escudie, R.; Lens, P.N.L.; Esposito, G. A review on dark fermentative biohydrogen production from organic biomass: Process parameters and use of by-products. Appl. Energy 2015, 144, 73–95. [Google Scholar] [CrossRef]
  20. Antonopoulou, G.; Lyberatos, G. Effect of Pretreatment of Sweet Sorghum Biomass on Methane Generation. Waste Biomass Valorization 2013, 4, 583–591. [Google Scholar] [CrossRef]
  21. Carrère, H.; Dumas, C.; Battimelli, A.; Batstone, D.J.; Delgenès, J.P.; Steyer, J.-P.; Ferrer, I. Pretreatment methods to improve sludge anaerobic degradability: A review. J. Hazard. Mater. 2010, 183, 1–15. [Google Scholar] [CrossRef]
  22. Giuliano, A.; Bolzonella, D.; Pavan, P.; Cavinato, C.; Cecchi, F. Co-digestion of livestock effluents, energy crops and agro-waste: Feeding and process optimization in mesophilic and thermophilic conditions. Bioresour. Technol. 2013, 128, 612–618. [Google Scholar] [CrossRef]
  23. Appels, L.; Lauwers, J.; Degrève, J.; Helsen, L.; Lievens, B.; Willems, K.; Van Impe, J.; Dewil, R. Anaerobic digestion in global bio-energy production: Potential and research challenges. Renew. Sustain. Energy Rev. 2011, 15, 4295–4301. [Google Scholar] [CrossRef]
  24. Atandi, E.; Rahman, S. Prospect of anaerobic co-digestion of dairy manure: A review. Environ. Technol. Rev. 2012, 1, 127–135. [Google Scholar] [CrossRef] [Green Version]
  25. Zhong, Y.; Chen, R.; Rojas-Sossa, J.P.; Isaguirre, C.; Mashburn, A.; Marsh, T.; Liu, Y.; Liao, W. Anaerobic co-digestion of energy crop and agricultural wastes to prepare uniform-format cellulosic feedstock for biorefining. Renew. Energy 2020, 147, 1358–1370. [Google Scholar] [CrossRef]
  26. Schmidt, A.; Lemaigre, S.; Delfosse, P.; von Francken-Welz, H.; Emmerling, C. Biochemical methane potential (BMP) of six perennial energy crops cultivated at three different locations in W-Germany. Biomass Convers. Biorefin. 2018, 8, 873–888. [Google Scholar] [CrossRef]
  27. Koçar, G.; Civaş, N. An overview of biofuels from energy crops: Current status and future prospects. Renew. Sustain. Energy Rev. 2013, 28, 900–916. [Google Scholar] [CrossRef]
  28. Dareioti, M.A.; Vavouraki, A.I.; Tsigkou, K.; Zafiri, C.; Kornaros, M. Dark Fermentation of Sweet Sorghum Stalks, Cheese Whey and Cow Manure Mixture: Effect of pH, Pretreatment and Organic Load. Processes 2021, 9, 1017. [Google Scholar] [CrossRef]
  29. Antonopoulou, G.; Gavala, H.N.; Skiadas, I.V.; Angelopoulos, K.; Lyberatos, G. Biofuels generation from sweet sorghum: Fermentative hydrogen production and anaerobic digestion of the remaining biomass. Bioresour. Technol. 2008, 99, 110–119. [Google Scholar] [CrossRef]
  30. Matsakas, L.; Rova, U.; Christakopoulos, P. Evaluation of Dried Sweet Sorghum Stalks as Raw Material for Methane Production. BioMed Res. Int. 2014, 2014, 1–7. [Google Scholar] [CrossRef] [Green Version]
  31. Ma, H.; Hu, Y.; Kobayashi, T.; Xu, K.-Q. The role of rice husk biochar addition in anaerobic digestion for sweet sorghum under high loading condition. Biotechnol. Rep. 2020, 27, e00515. [Google Scholar] [CrossRef]
  32. Nozari, B.; Mirmohamadsadeghi, S.; Karimi, K. Bioenergy production from sweet sorghum stalks via a biorefinery perspective. Appl. Microbiol. Biotechnol. 2018, 102, 3425–3438. [Google Scholar] [CrossRef]
  33. Dareioti, M.A.; Kornaros, M. Anaerobic mesophilic co-digestion of ensiled sorghum, cheese whey and liquid cow manure in a two-stage CSTR system: Effect of hydraulic retention time. Bioresour. Technol. 2015, 175, 553–562. [Google Scholar] [CrossRef]
  34. Sarker, S.; Lamb, J.J.; Hjelme, D.R.; Lien, K.M. A Review of the Role of Critical Parameters in the Design and Operation of Biogas Production Plants. Appl. Sci. 2019, 9, 1915. [Google Scholar] [CrossRef] [Green Version]
  35. Mullet, J.; Morishige, D.; McCormick, R.; Truong, S.; Hilley, J.; Mckinley, B.; Anderson, R.; Olson, S.N.; Rooney, W. Energy Sorghum—A genetic model for the design of C4 grass bioenergy crops. J. Exp. Bot. 2014, 65, 3479–3489. [Google Scholar] [CrossRef] [Green Version]
  36. Padel, S.; Röcklinsberg, H.; Schmid, O. The implementation of organic principles and values in the European Regulation for organic food. Food Policy 2009, 34, 245–251. [Google Scholar] [CrossRef] [Green Version]
  37. Chen, Y.; Cheng, J.J.; Creamer, K.S. Inhibition of anaerobic digestion process: A review. Bioresour. Technol. 2008, 99, 4044–4064. [Google Scholar] [CrossRef]
  38. Dareioti, M.A.; Kornaros, M. Effect of hydraulic retention time (HRT) on the anaerobic co-digestion of agro-industrial wastes in a two-stage CSTR system. Bioresour. Technol. 2014, 167, 407–415. [Google Scholar] [CrossRef]
  39. Eaton, A.D.; Clesceri, L.S.; Greenberg, A.E.; Franson, M.A.H. Standard Methods for the Examination of Water and Wastewater, 22nd ed.; APHA: Washington, DC, USA, 2012. [Google Scholar]
  40. Dareioti, M.A.; Vavouraki, A.I.; Kornaros, M. Effect of pH on the anaerobic acidogenesis of agroindustrial wastewaters for maximization of bio-hydrogen production: A lab-scale evaluation using batch tests. Bioresour. Technol. 2014, 162, 218–227. [Google Scholar] [CrossRef]
  41. Yasin, N.H.M.; Rahman, N.A.; Man, H.C.; Yusoff, M.Z.M.; Hassan, M.A. Microbial characterization of hydrogen-producing bacteria in fermented food waste at different pH values. Int. J. Hydrogen Energy 2011, 36, 9571–9580. [Google Scholar] [CrossRef]
  42. Xu, Y.; Li, J.; Moore, C.; Xin, Z.; Wang, D. Physico-chemical characterization of pedigreed sorghum mutant stalks for biofuel production. Ind. Crop. Prod. 2018, 124, 806–811. [Google Scholar] [CrossRef]
  43. Usman, M.; Kavitha, S.; Kannah, Y.; Yogalakshmi, K.N.; Sivashanmugam, P.; Bhatnagar, A.; Kumar, G. A critical review on limitations and enhancement strategies associated with biohydrogen production. Int. J. Hydrogen Energy 2021, 46, 16565–16590. [Google Scholar]
  44. Khanal, S.K.; Chen, W.H.; Li, L.; Sung, S. Biological hydrogen production: Effects of pH and intermediate products. Int. J. Hydrogen Energy 2004, 29, 1123–1131. [Google Scholar] [CrossRef]
  45. Hwang, M.H.; Jang, N.J.; Hyun, S.H.; Kim, I.S. Anaerobic bio-hydrogen production from ethanol fermentation: The role of pH. J. Biotechnol. 2004, 111, 297–309. [Google Scholar] [CrossRef]
  46. Sivagurunathan, P.; Kumar, G.; Bakonyi, P.; Kim, S.-H.; Kobayashi, T.; Xu, K.Q.; Lakner, G.; Tóth, G.; Nemestothy, N.; Bélafi-Bakó, K. A critical review on issues and overcoming strategies for the enhancement of dark fermentative hydrogen production in continuous systems. Int. J. Hydrogen Energy 2016, 41, 3820–3836. [Google Scholar] [CrossRef]
  47. Pandey, A.K.; Pilli, S.; Bhunia, P.; Tyagi, R.; Surampalli, R.Y.; Zhang, T.C.; Kim, S.-H.; Pandey, A. Dark fermentation: Production and utilization of volatile fatty acid from different wastes—A review. Chemosphere 2022, 288, 132444. [Google Scholar] [CrossRef]
  48. Sekoai, P.T.; Ghimire, A.; Ezeokoli, O.T.; Rao, S.; Ngan, W.Y.; Habimana, O.; Yao, Y.; Yang, P.; Fung, A.H.Y.; Yoro, K.O.; et al. Valorization of volatile fatty acids from the dark fermentation waste Streams-A promising pathway for a biorefinery concept. Renew. Sustain. Energy Rev. 2021, 143, 110971. [Google Scholar] [CrossRef]
  49. Sambusiti, C.; Ficara, E.; Malpei, F.; Steyer, J.-P.; Carrere, H. Benefit of sodium hydroxide pretreatment of ensiled sorghum forage on the anaerobic reactor stability and methane production. Bioresour. Technol. 2013, 144, 149–155. [Google Scholar] [CrossRef]
  50. Seppälä, M.; Pyykkönen, V.; Väisänen, A.; Rintala, J. Biomethane production from maize and liquid cow manure–effect of share of maize, post-methanation potential and digestate characteristics. Fuel 2013, 107, 209–216. [Google Scholar]
  51. Molaey, R.; Yesil, H.; Calli, B.; Tugtas, A.E. Influence of volatile fatty acids in anaerobic bioleaching of potentially toxic metals. J. Environ. Manag. 2021, 285, 112118. [Google Scholar] [CrossRef]
  52. Náthia-Neves, G.; Berni, M.; Dragone, G.; Mussatto, S.I.; Forster-Carneiro, T. Anaerobic digestion process: Technological aspects and recent developments. Int. J. Environ. Sci. Technol. 2018, 15, 2033–2046. [Google Scholar] [CrossRef]
  53. Zhang, J.; Luo, W.; Wang, Y.; Li, G.; Liu, Y.; Gong, X. Anaerobic cultivation of waste activated sludge to inoculate solid state anaerobic co-digestion of agricultural wastes: Effects of different cultivated periods. Bioresour. Technol. 2019, 294, 122078. [Google Scholar] [CrossRef]
  54. Karim, K.; Klasson, K.T.; Hoffmann, R.; Drescher, S.R.; DePaoli, D.W.; Al-Dahhan, M.H. Anaerobic digestion of animal waste: Effect of mixing. Bioresour. Technol. 2005, 96, 1607–1612. [Google Scholar] [CrossRef]
Figure 1. Effect of pH on (a) biogas and hydrogen production and hydrogen yield and (b) main soluble end products and carbohydrate consumption. The values correspond to mean ± standard deviation of batch tests conducted in duplicate.
Fermentation 08 00304 g001
Figure 2. (a) Consumption of carbohydrates, (b) evolution of VFAs, lactic acid and ethanol, and (c) gaseous products (biogas and hydrogen) during batch acidogenesis of mixture (95% FS and 5%LCM), at pH 5.0.
Fermentation 08 00304 g002
Figure 3. Cumulative hydrogen production (experimental data and modified Gompertz model simulation) at different pH values tested.
Fermentation 08 00304 g003
Figure 4. (a) Evolution of main VFAs, lactic acid, and ethanol and (b) gaseous products (biogas and hydrogen) during batch acidogenesis of mixture (95% ES and 5% LCM), at pH 5.0.
Fermentation 08 00304 g004
Figure 5. Evolution of (a) biogas and hydrogen production rates and content and (b) the main soluble end products during acidogenesis for each HRT tested.
Fermentation 08 00304 g005
Figure 6. Evolution of (a) total concentration of soluble COD and total VFA (in COD units) and methane production rate; (b) concentration of main VFAs and pH during methanogenesis for each HRT tested.
Fermentation 08 00304 g006
Table 1. Physicochemical characterization of FS, ES, and LCM. The values correspond to mean ± standard deviation of measurement analysed in duplicate. The parameter units are presented on the top of the table next to each substrate, with exceptions in the footnotes below the table.
ParametersFS (%TS)ES (%TS)LCM (g/L)
pH 15.40 ± 0.014.10 ± 0.007.24 ± 0.18
Moisture 274.00 ± 0.1276.32 ± 0.1096.69 ± 0.72
TS 326.00 ± 0.0323.73 ± 0.1733.15 ± 1.98
VS96.20 ± 0.5194.08 ± 3.1522.50 ± 0.98
Ash 43.80 ± 0.095.93 ± 3.1532.13 ± 1.50
TOC57.00 ± 0.0546.18 ± 0.0016.72 ± 0.24
Total Carbohydrates 558.00 ± 0.9138.82 ± 1.296.99 ± 0.45
Soluble Carbohydrates 528.04 ± 0.303.50 ± 0.850.45 ± 0.05
Cellulose22.10 ± 1.3137.60 ± 5.37N.A 6
Hemicelluloses12.03 ± 1.5525.51 ± 3.66N.A 6
Lignin9.02 ± 2.0117.28 ± 4.93N.A 6
Alkalinity 7N.A 6N.A 612.38 ± 0.32
Total Nitrogen (TKN)0.20 ± 0.010.96 ± 0.452.78 ± 0.00
Proteins1.25 ± 0.066.00 ± 2.8117.38 ± 0.00
Lactic AcidN.D84.28 ± 0.00N.D 8
1 no units; 2 % wet weight; 3 % wet weight; 4 % TS; 5 equivalent glucose; 6 not applicable; 7 g CaCO3/L; 8 not detected.
Table 2. Operating conditions of CSTRs for the HRT effect tests.
Operating ConditionsAcidogenic Reactor
HRT (d)358
Flow rate (mL/d)16710062.5
OLR (kg VS/m3·d)12.837.704.81
OLR (kg COD/m3·d)23.0313.828.64
Methanogenic Reactor
HRT (d)2025
Flow rate (mL/d)2520
OLR (kg VS/m3·d)1.861.49
OLR (kg COD/m3·d)2.231.78
Table 3. Kinetic parameters of hydrogen production estimated using the modified Gompertz equation.
pHP (mL)Rm (mL/h)λ (h)r2
4.539.38 ± 0.621.71 ± 0.08-0.983
5.01759.29 ± 13.7792.53 ± 2.247.49 ± 0.200.996
5.51701.10 ± 115.4422.19 ± 0.4615.89 ± 0.690.986
6.01365.80 ± 11.4791.38 ± 2.340.48 ± 0.190.993
Table 4. CSTR acidogenic reactor performance under steady-state conditions for each HRT.
ParameterHRT (d)
358
Biogas (L/LR·d)0.36 ± 0.100.46 ± 0.080.11 ± 0.02
H2 (L/LR·d)0.09 ± 0.020.13 ± 0.020.02 ± 0.01
H2 (%)22.0 ± 1.817.6 ± 2.220.9 ± 1.1
Yield (mol H2/mol carbohydratesconsumed)0.63 ± 0.051.68 ± 0.080.48 ± 0.07
Yield (mL H2/g carbohydratesconsumed)78.6 ± 7.7209.2 ± 11.860.1 ± 5.4
Publisher’s Note: MDPI stays neutral with regard to jurisdictional claims in published maps and institutional affiliations.

